Skip to content
Essencial

Collection · 3 plates

The relief of São Paulo

The Mantiqueira range, the Serra do Mar and the cuestas, in hypsometric tints and hillshade.

3 of 3 published

In reading order, from the first to the latest. All collections

The route

Read in order: each plate adds a layer to the one before.

Start with the first plate
  1. Plate 1/3 · No. 039 The Mantiqueira range The wall above the Paraíba valley
  2. Plate 2/3 · No. 040 The Serra do Mar Eight hundred metres between port and plateau
  3. Plate 3/3 · No. 041 The cuestas of São Paulo The basalt step
Every plate, in full

No. 039 Elevation · relief The relief of São Paulo 1/3

The Mantiqueira range

The wall above the Paraíba valley

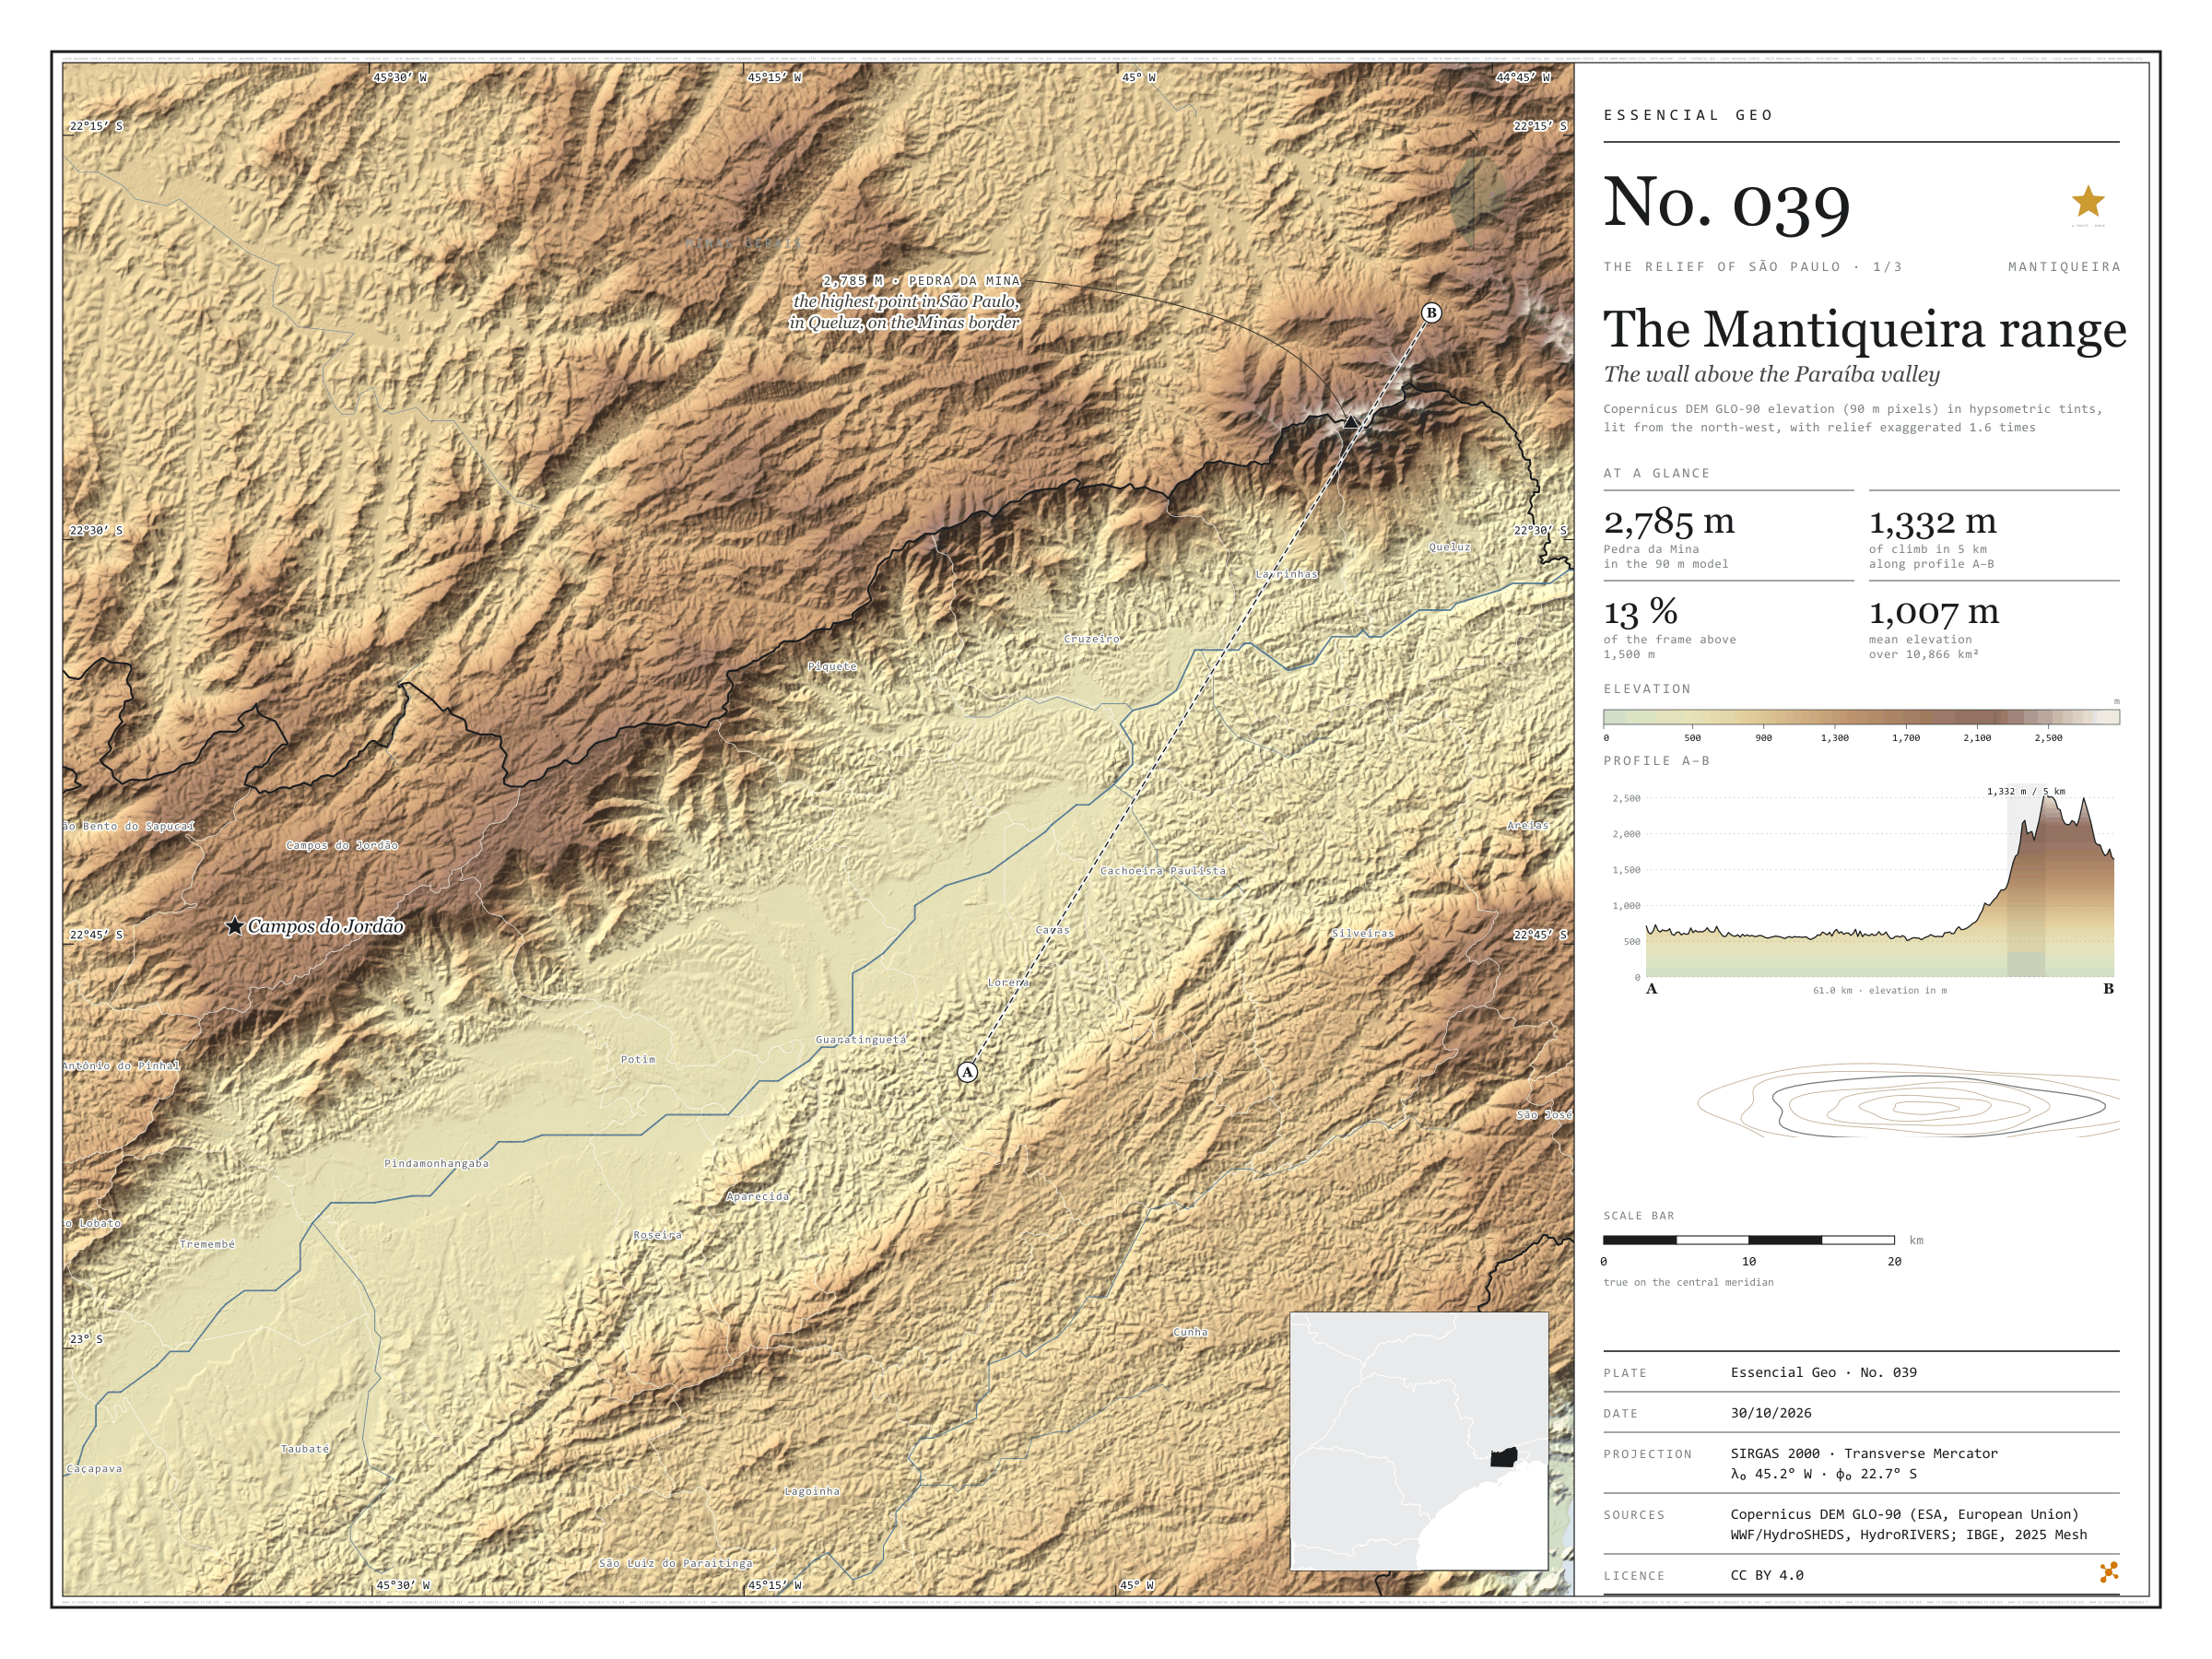
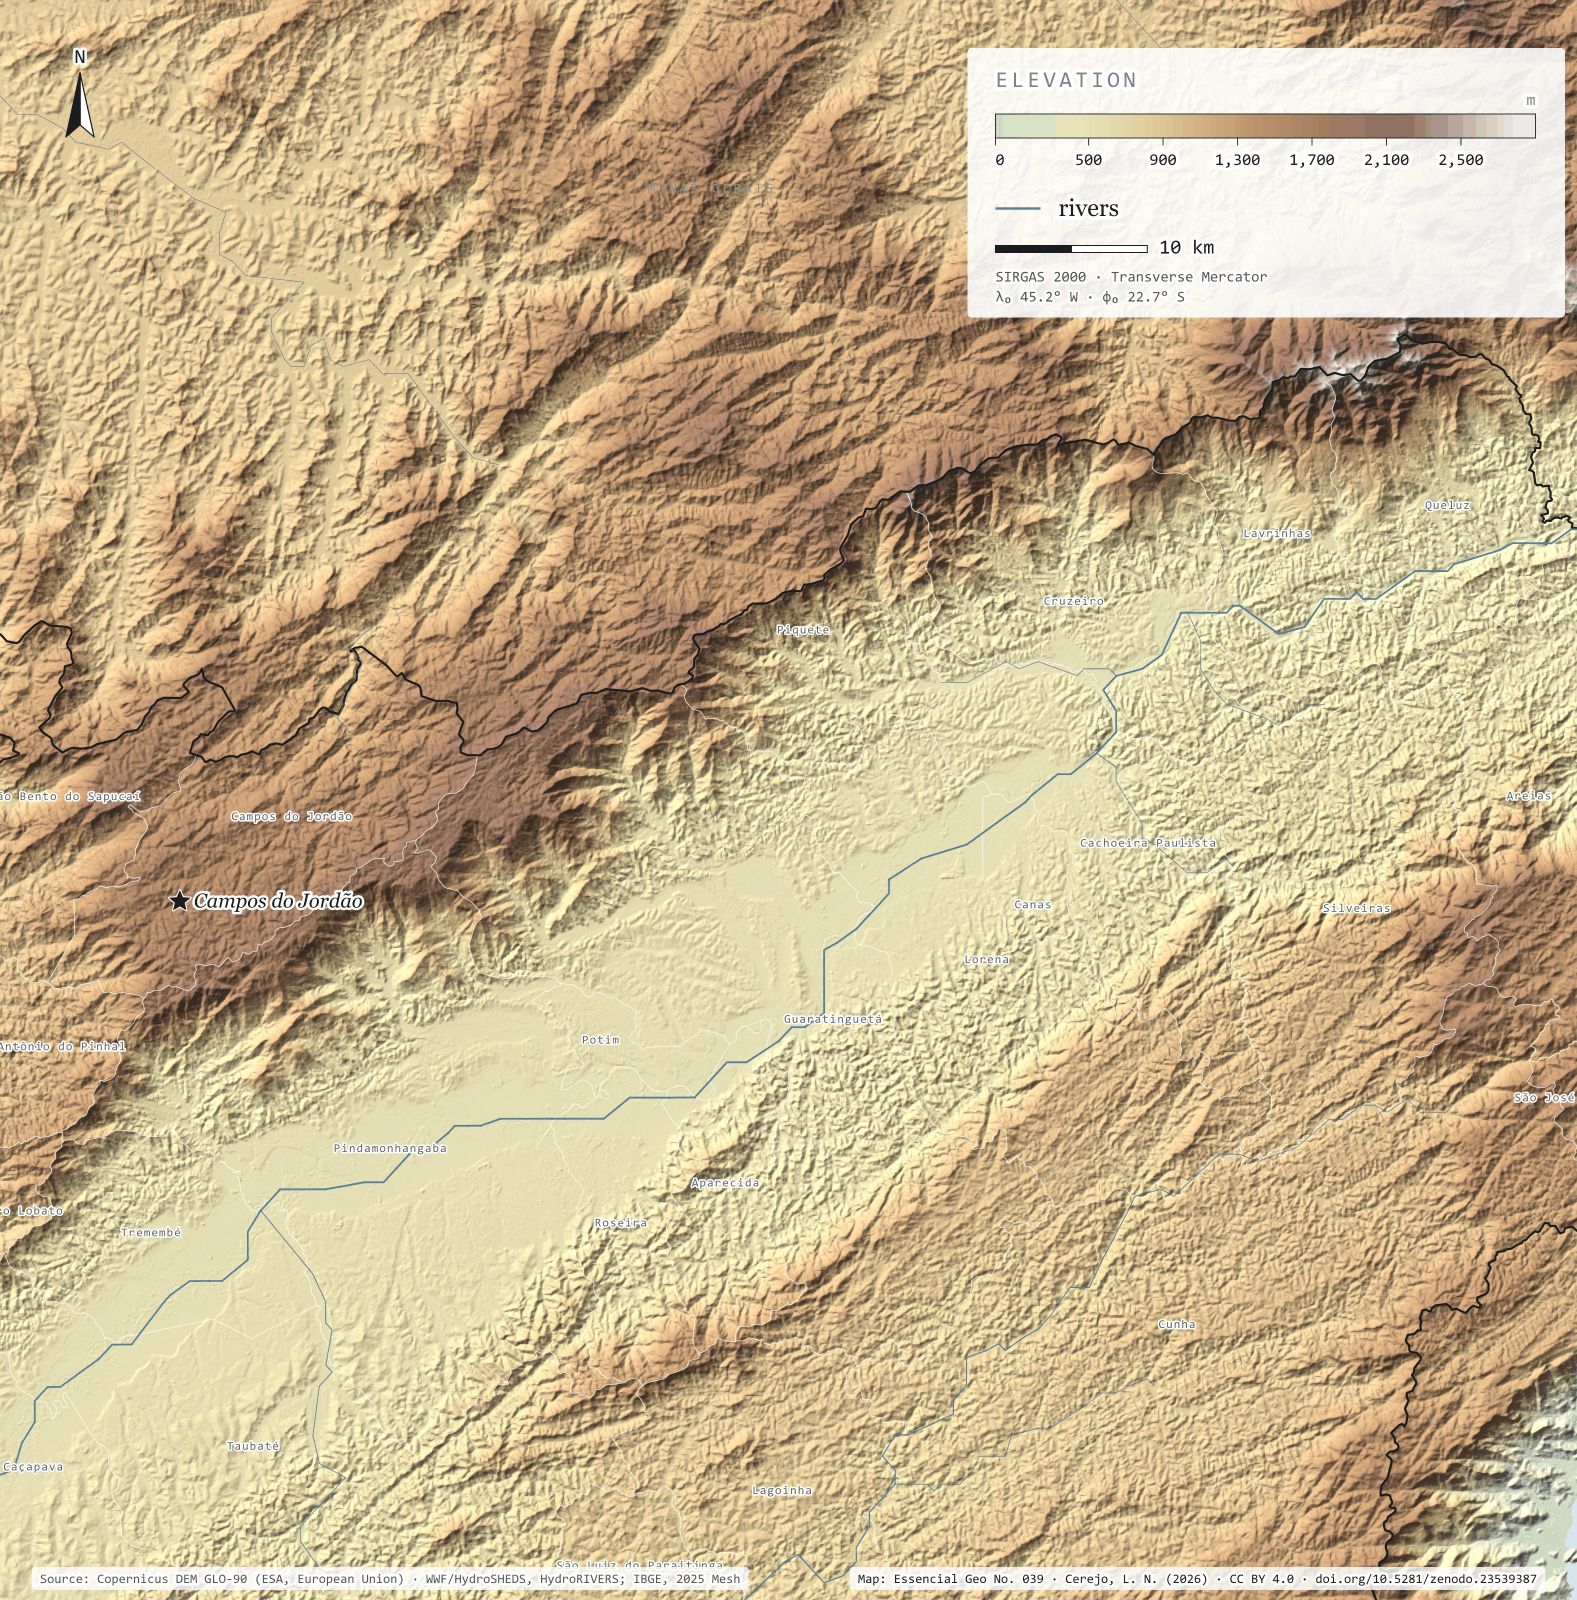
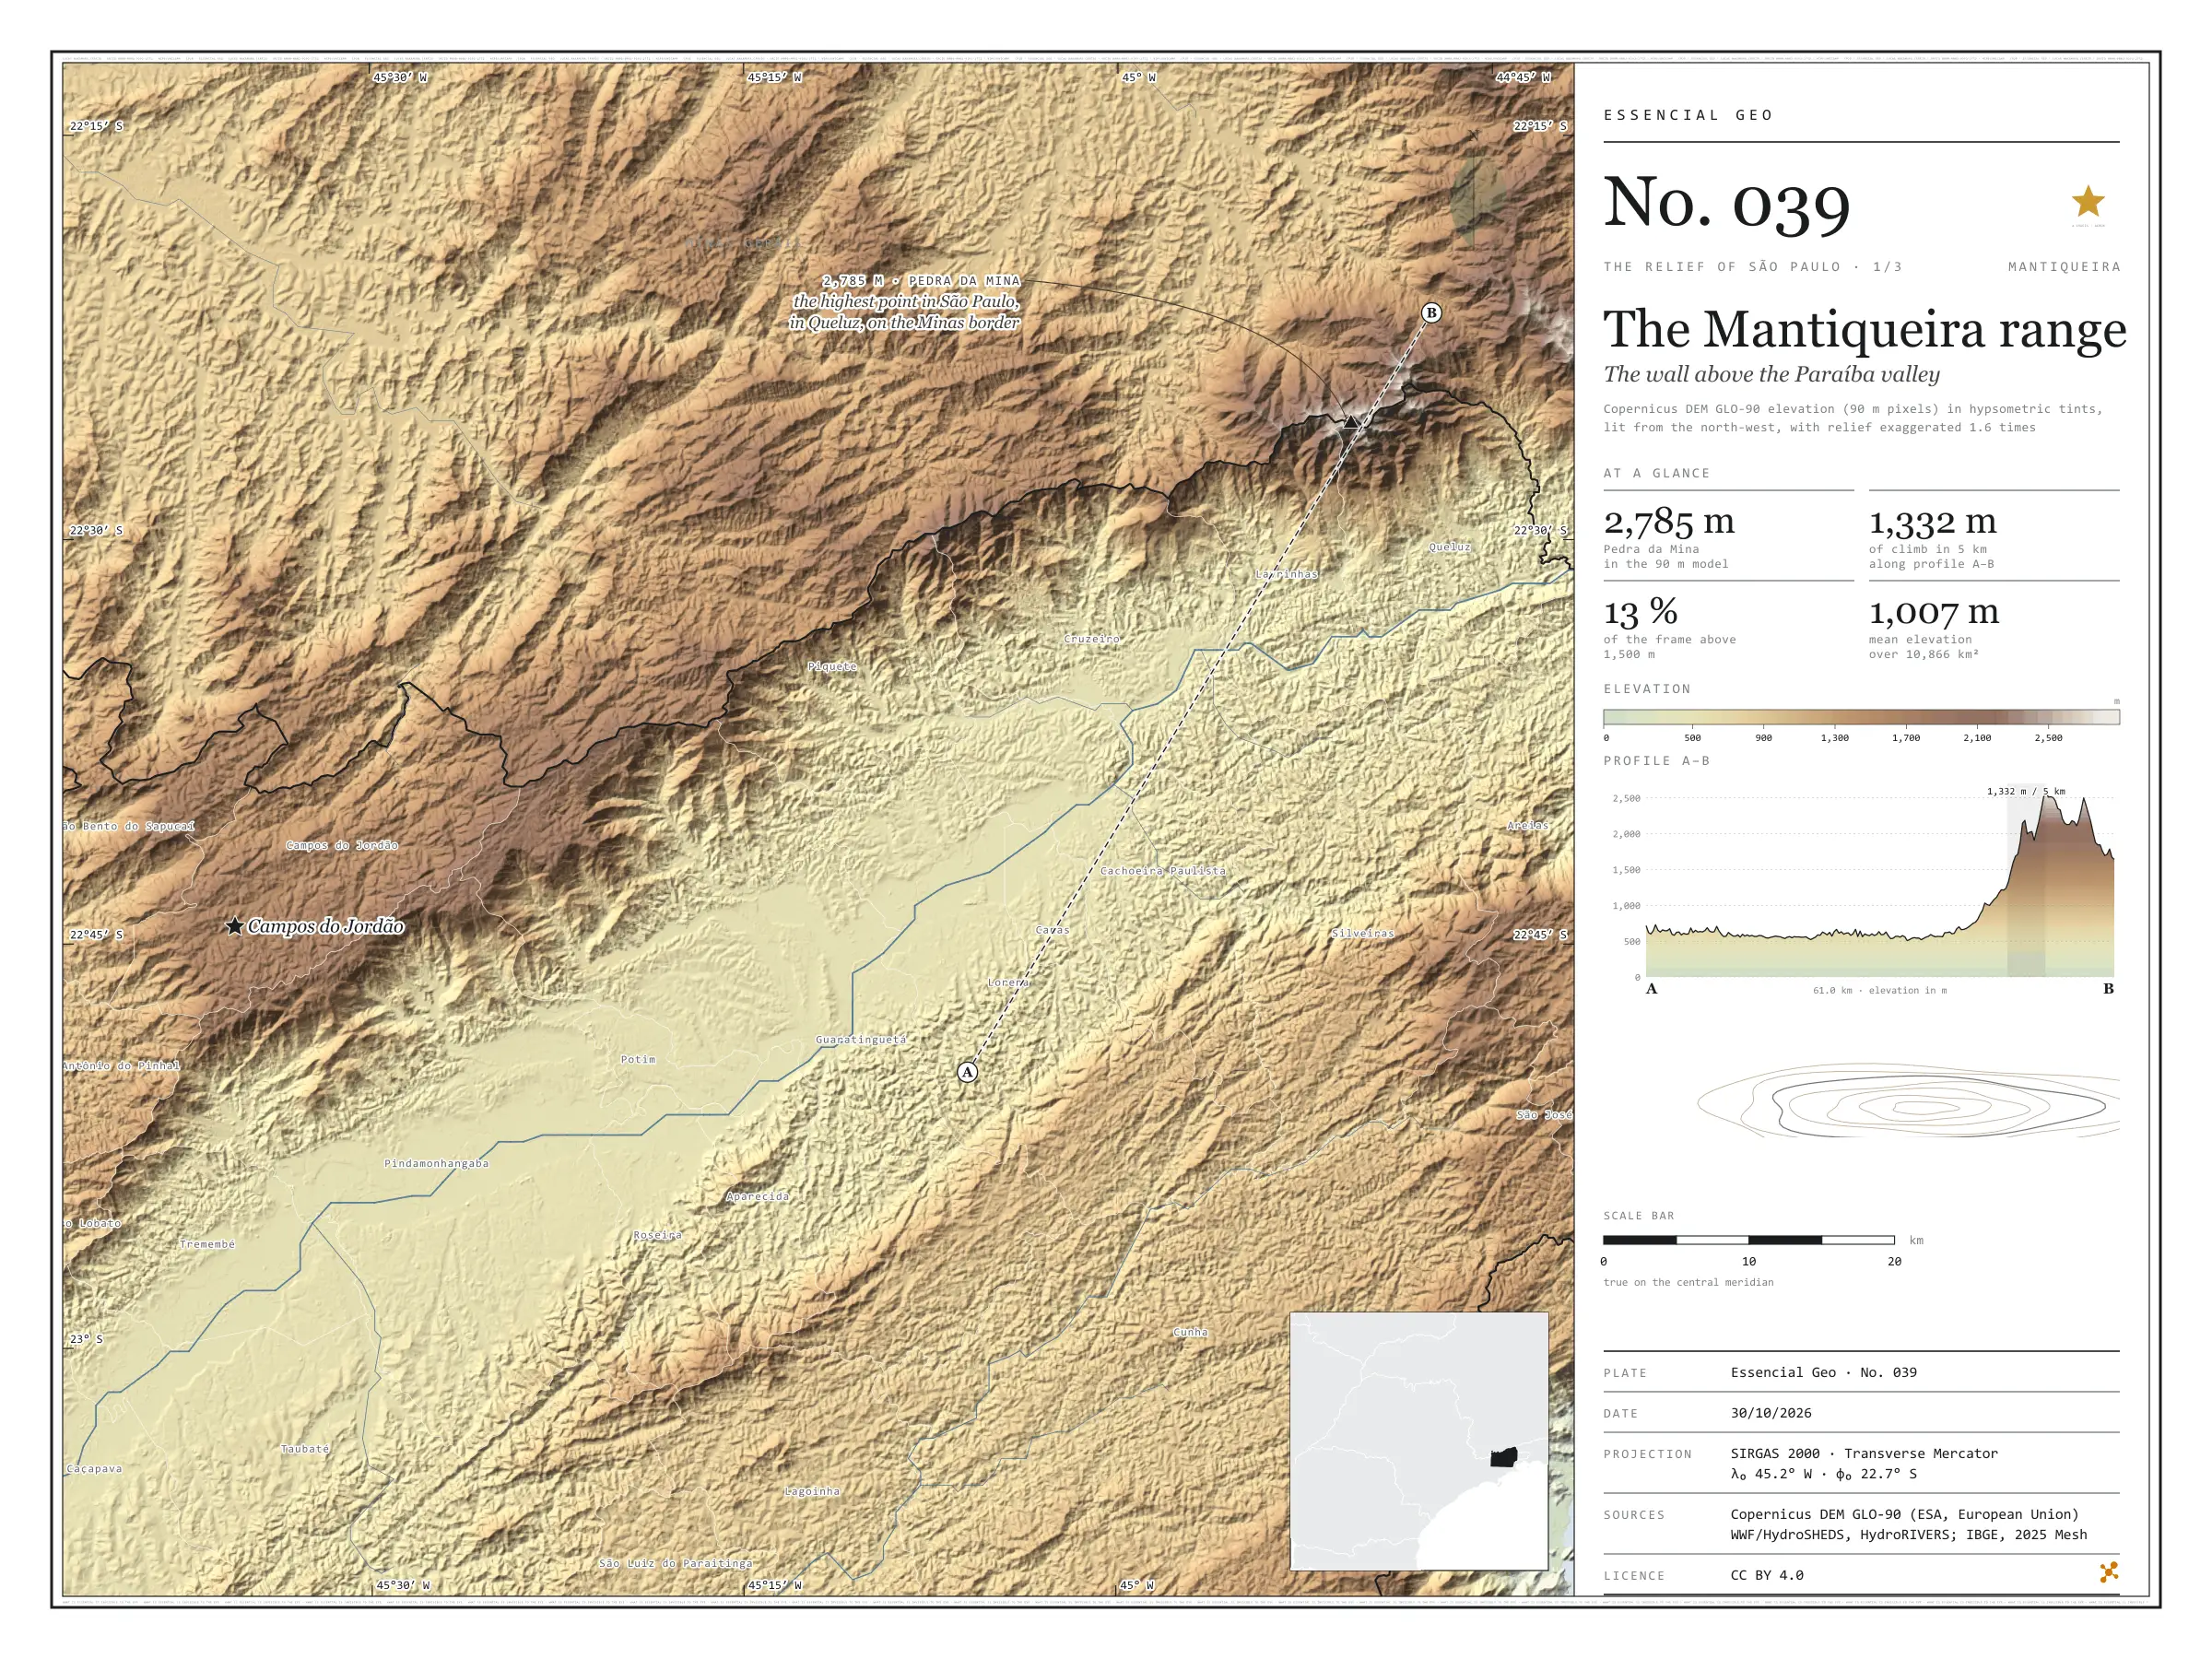
Fig. 039 Paraíba valley and Mantiqueira range, between Taubaté and Queluz (SP), with parts of Minas Gerais and Rio de Janeiro EPSG:4674 Source: Copernicus DEM GLO-90 (ESA, European Union), digital surface model, 90 m pixels, WWF / HydroSHEDS, IBGE

Profile A–B runs 61 km from the south side of the Paraíba valley to the crest of the Mantiqueira. For almost 40 km the ground barely changes, and the Paraíba do Sul river passes at the lowest point, 501 m. Then the range rises all at once: on the steepest stretch the ground climbs 1,332 m in 5 km, up to 2,581 m on the crest. At the top stands Pedra da Mina, in Queluz, on the Minas Gerais border, the highest point in São Paulo: 2,785 m in the 90 m model. Across the valley, the Serra do Mar closes the corridor through which the river, the Via Dutra motorway and the towns run. In the 10,866 km² frame, mean elevation is 1,007 m and 12.9% of the ground lies above 1,500 m. First plate of the collection “The relief of São Paulo”.

Technical record · downloads · citation

At a glance

Highest point in São Paulo, Pedra da Mina

2,785 m

In the 90 m model, in Queluz, on the Minas Gerais border

Largest climb in 5 km along profile A–B

1,332 m

Area of the frame by elevation band (km²)
  • < 500 m 83
  • 500–700 2,842
  • 700–900 1,797
  • 900–1.100 2,510
  • 1.100–1.300 1,188
  • 1.300–1.500 1,050
  • 1.500–1.700 775
  • 1.700–1.900 441
  • 1.900–2.100 113
  • > 2.100 m 68

Layers

  • relevo raster GeoTIFF of elevation in metres (90 m pixels) clipped to the frame, with the plate’s hypsometric ramp in a .qml style
  • faixas_altitude polygon 13 elevation bands, every 200 m, with the area of each
  • perfil line The A–B profile line, 61.0 km
  • ponto_mais_alto point Pedra da Mina, 2,785 m in the model
  • municipios polygon The 25 São Paulo municipalities in the frame

Metadata

Extent
Paraíba valley and Mantiqueira range, between Taubaté and Queluz (SP), with parts of Minas Gerais and Rio de Janeiro
CRS / Projection
SIRGAS 2000 (EPSG:4674)
EPSG:4674
Software
Python · rasterio · GeoPandas · SciPy · GDAL · QGIS · Node.js · d3-geo
Method
Copernicus DEM GLO-90 tiles mosaicked, lit from the north-west with relief exaggerated 1.6 times and coloured by elevation band; profile A–B sampled at 600 points.
Version
v1.0.0
Licence
CC BY 4.0

Downloads

Figure to reuse

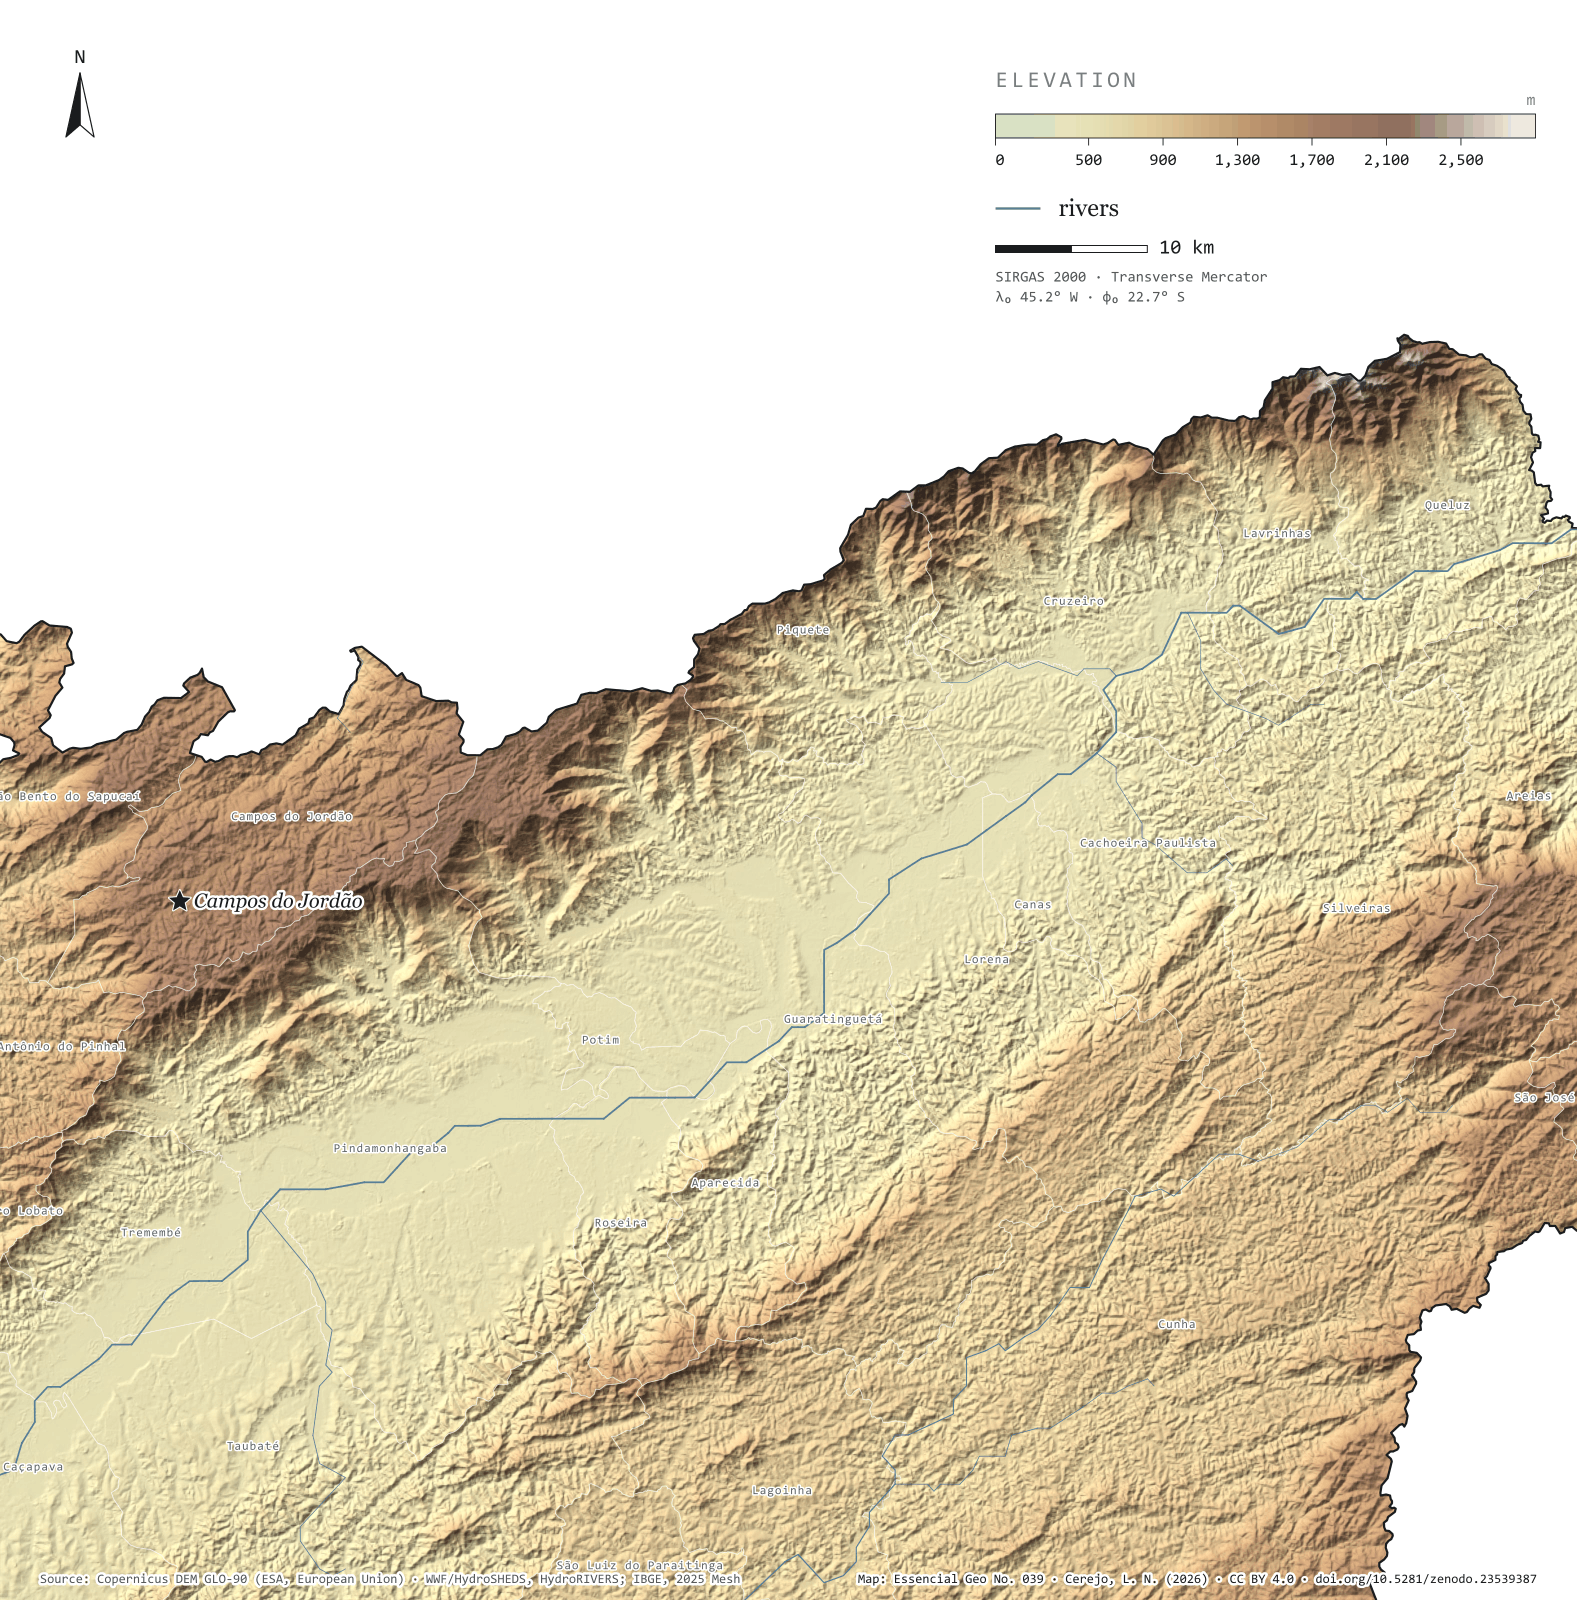
The map without a frame, with legend, scale, reference system and credit written on it: ready for papers, lectures and slides. In two versions: with the basemap (neighbours and sea) or only the mapped area, on white.

Point a camera at it to open this page.

How to cite

Cerejo, L. N. (2026). Serra da Mantiqueira: a muralha sobre o vale do Paraíba [The Mantiqueira range: The wall above the Paraíba valley] (Version 1.0.0) [Data set]. Zenodo. https://doi.org/10.5281/zenodo.23539387

No. 040 Elevation · relief The relief of São Paulo 2/3

The Serra do Mar

Eight hundred metres between port and plateau

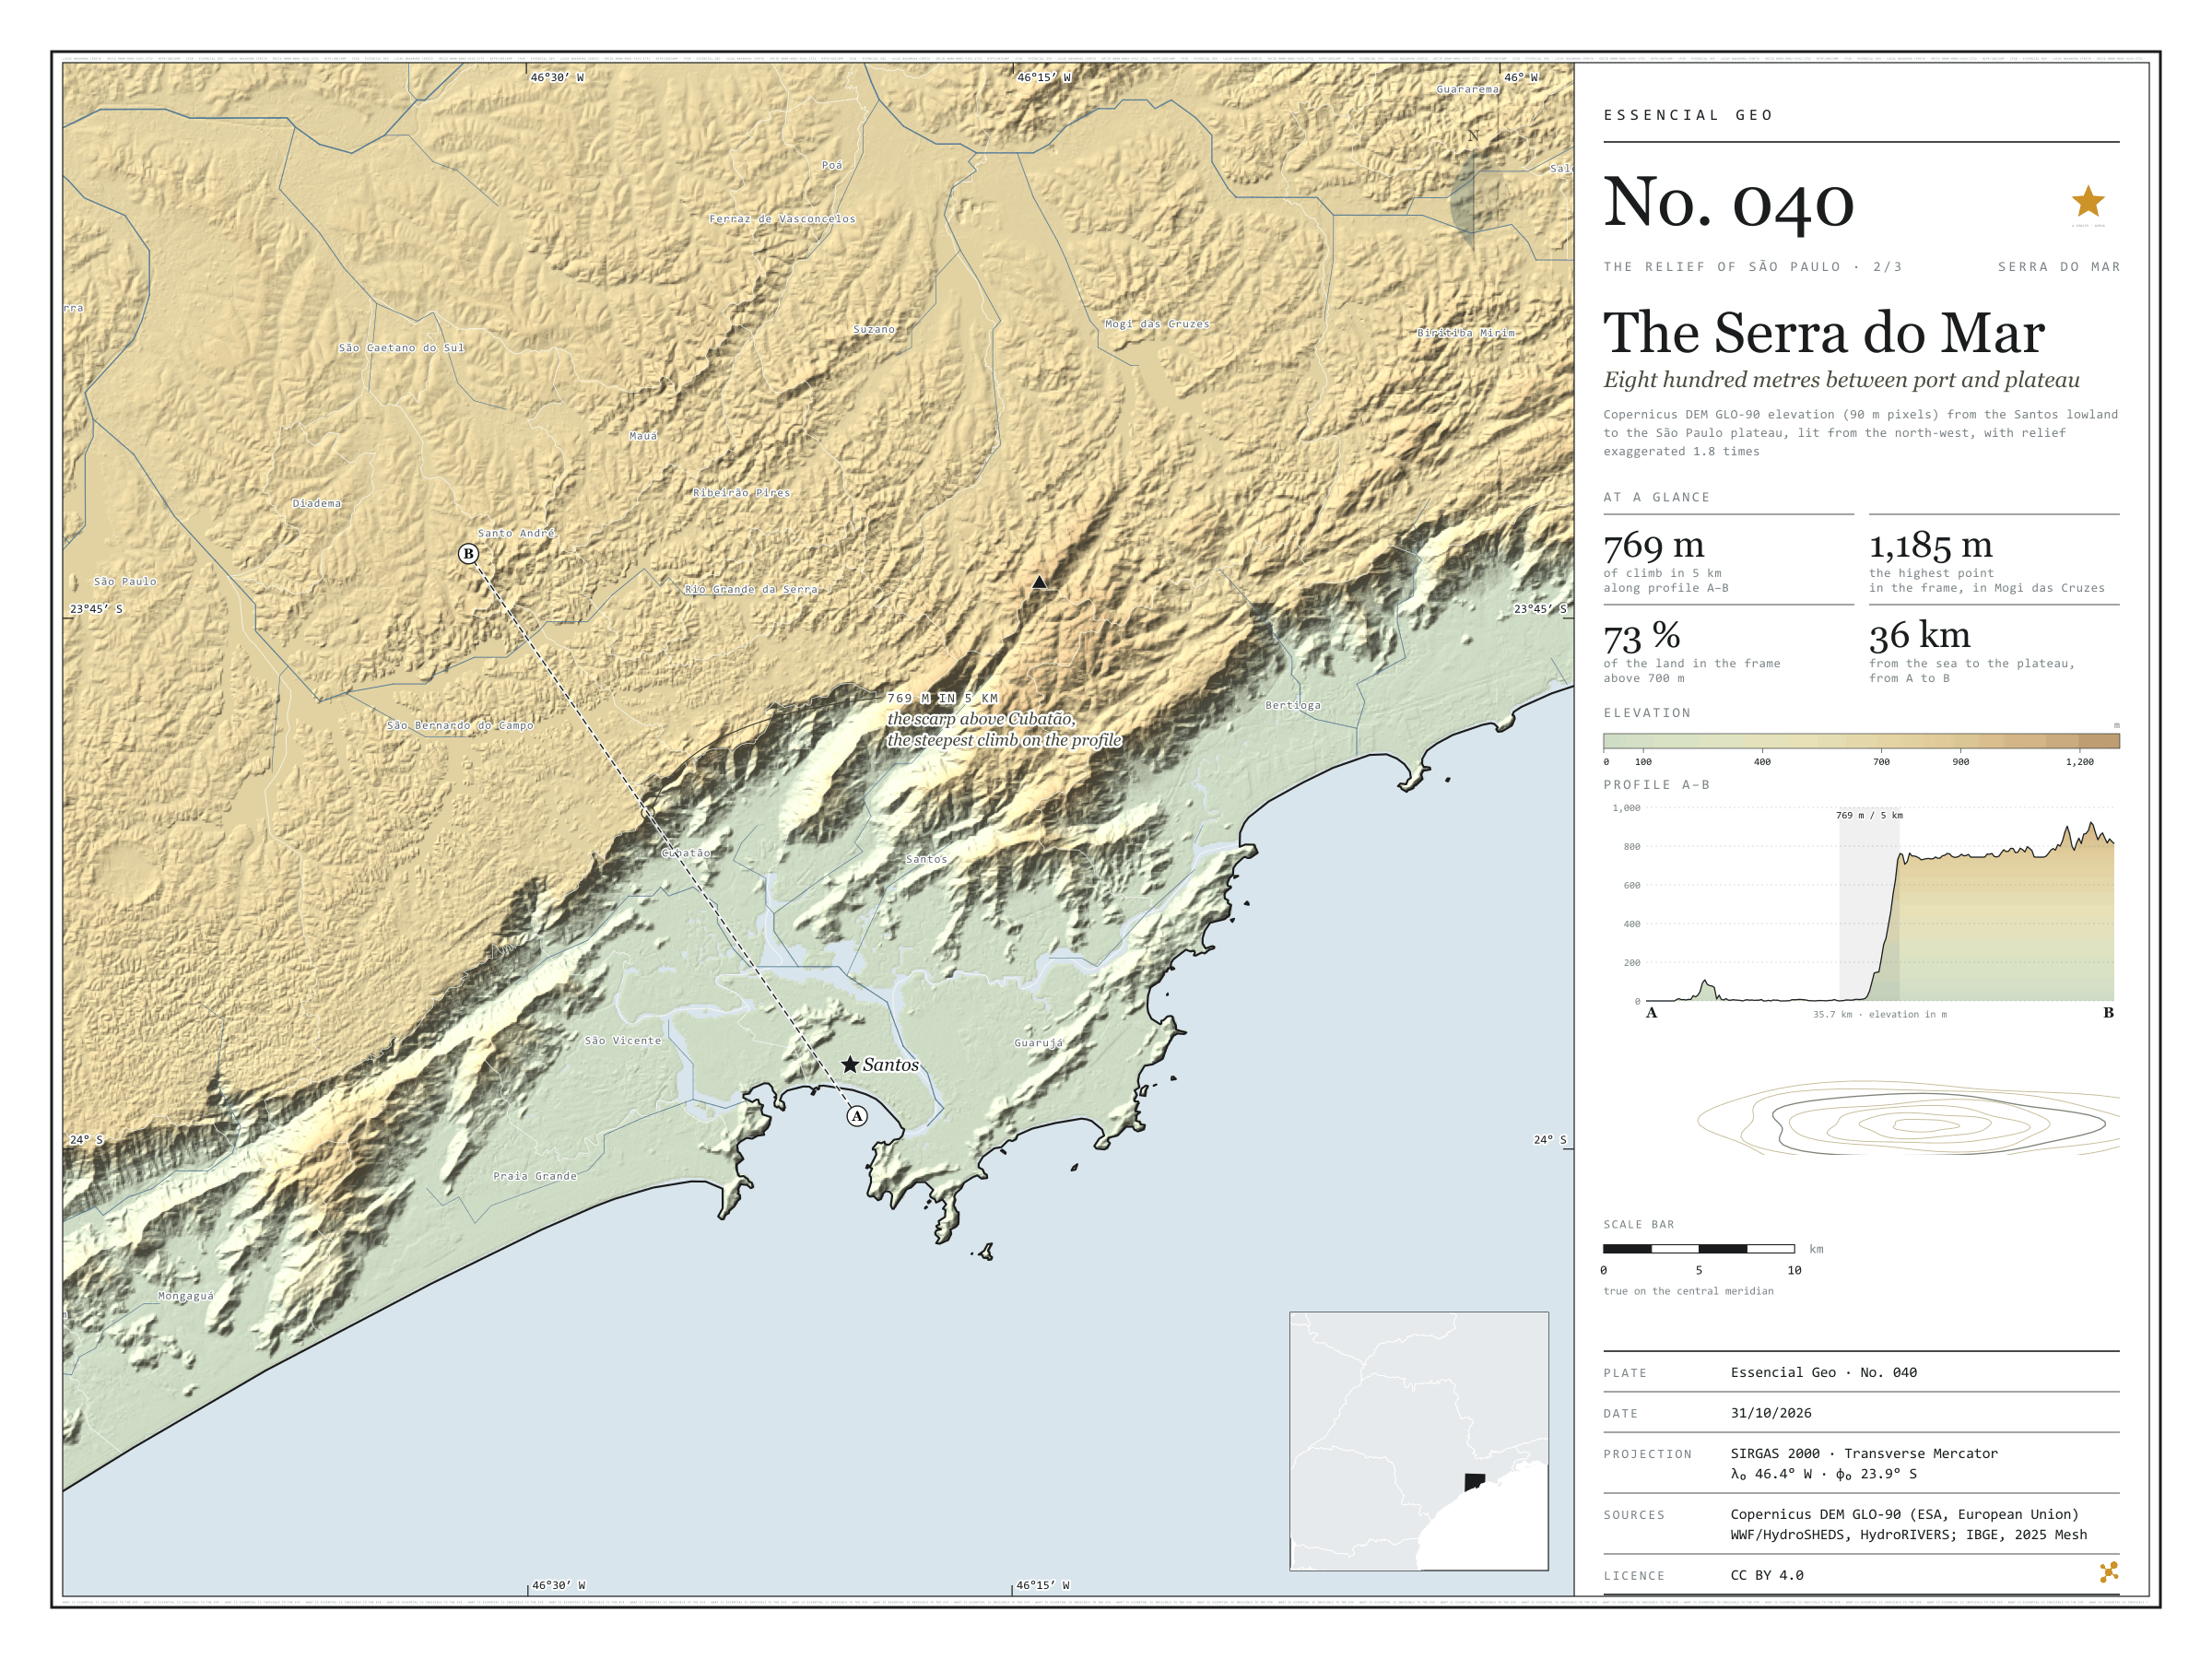
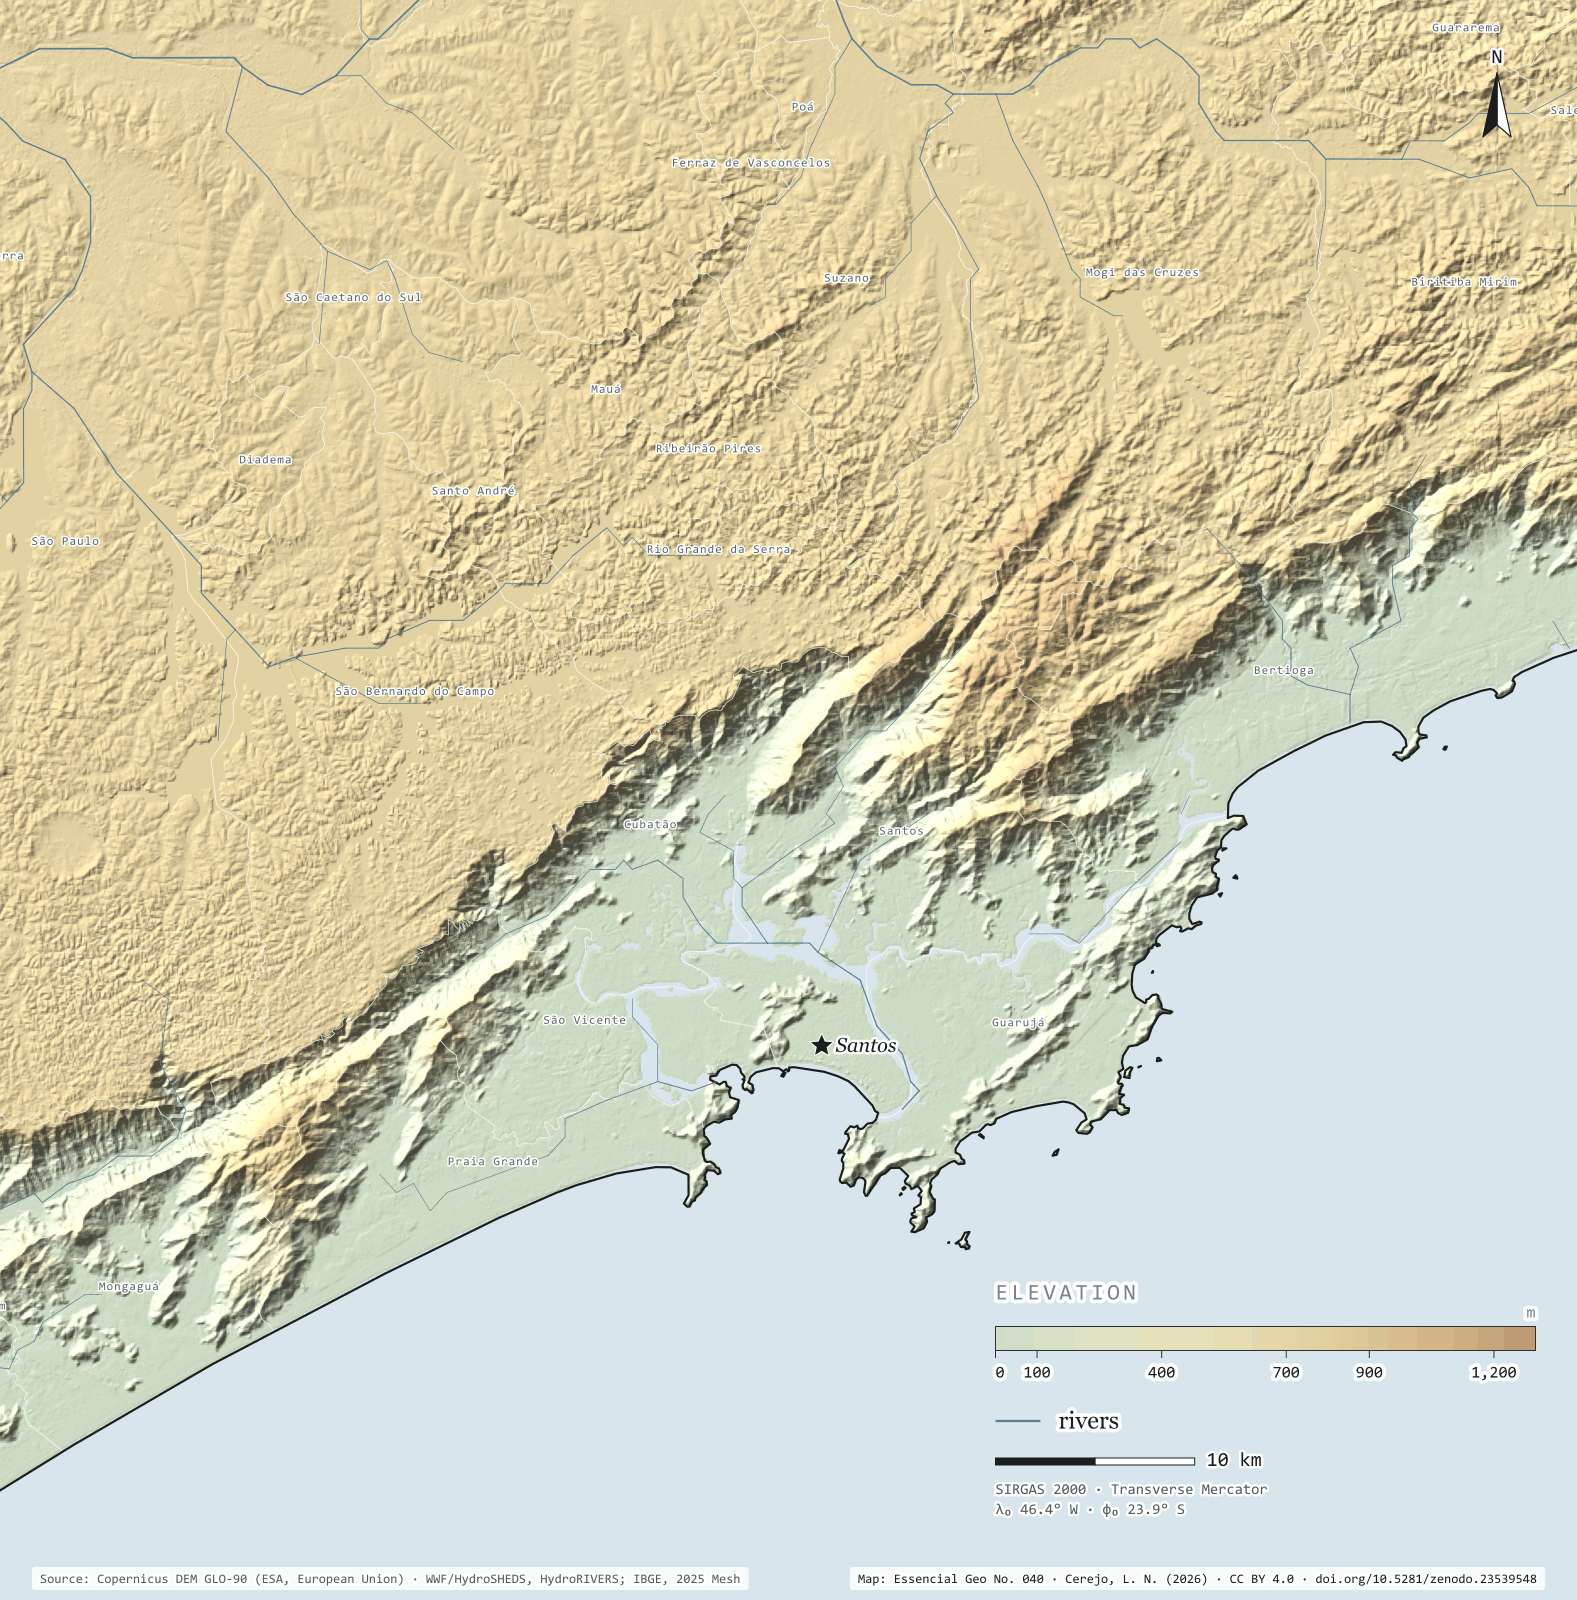
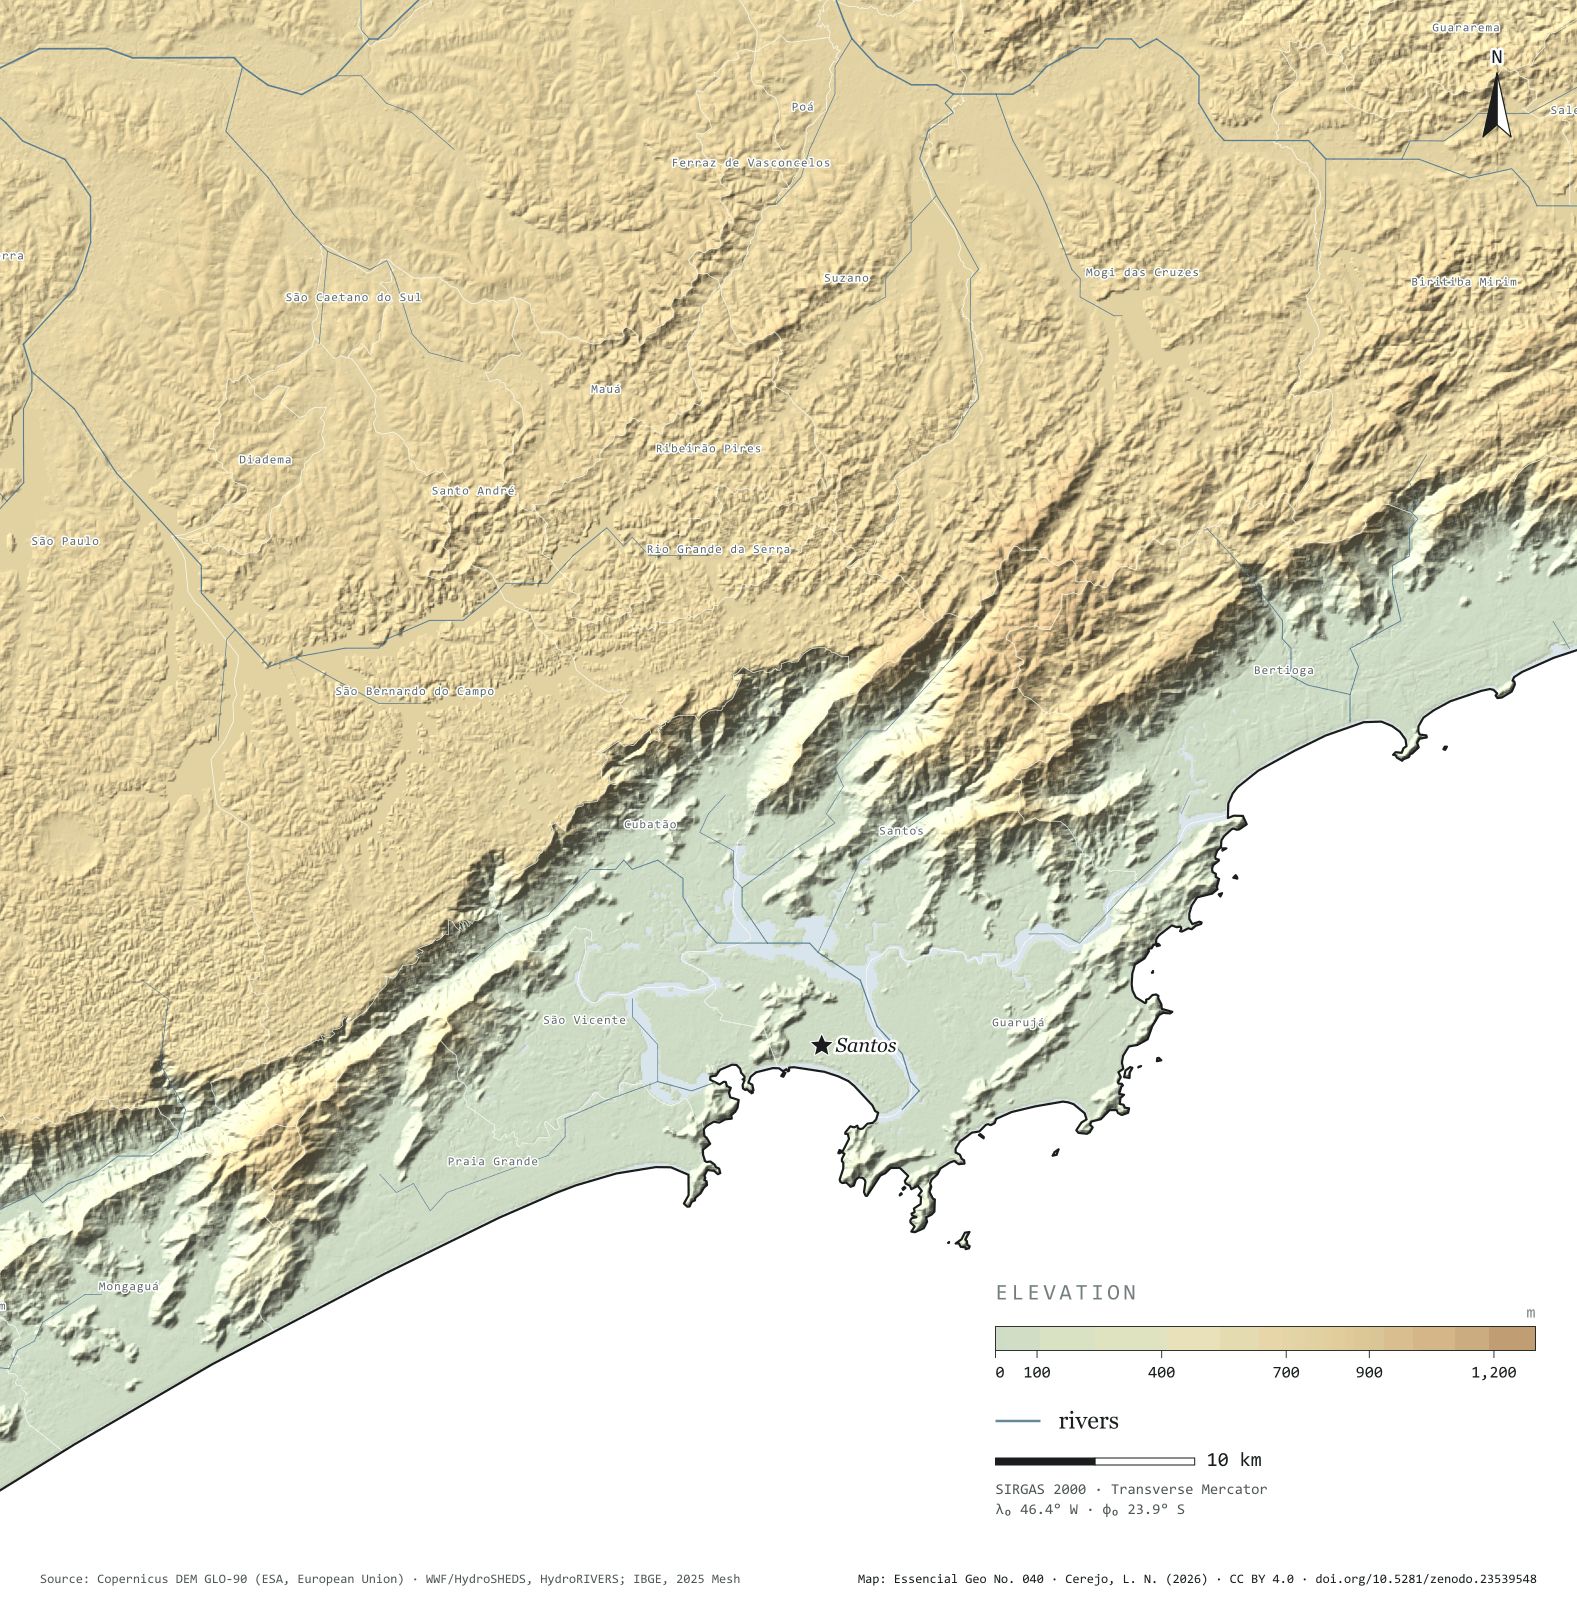
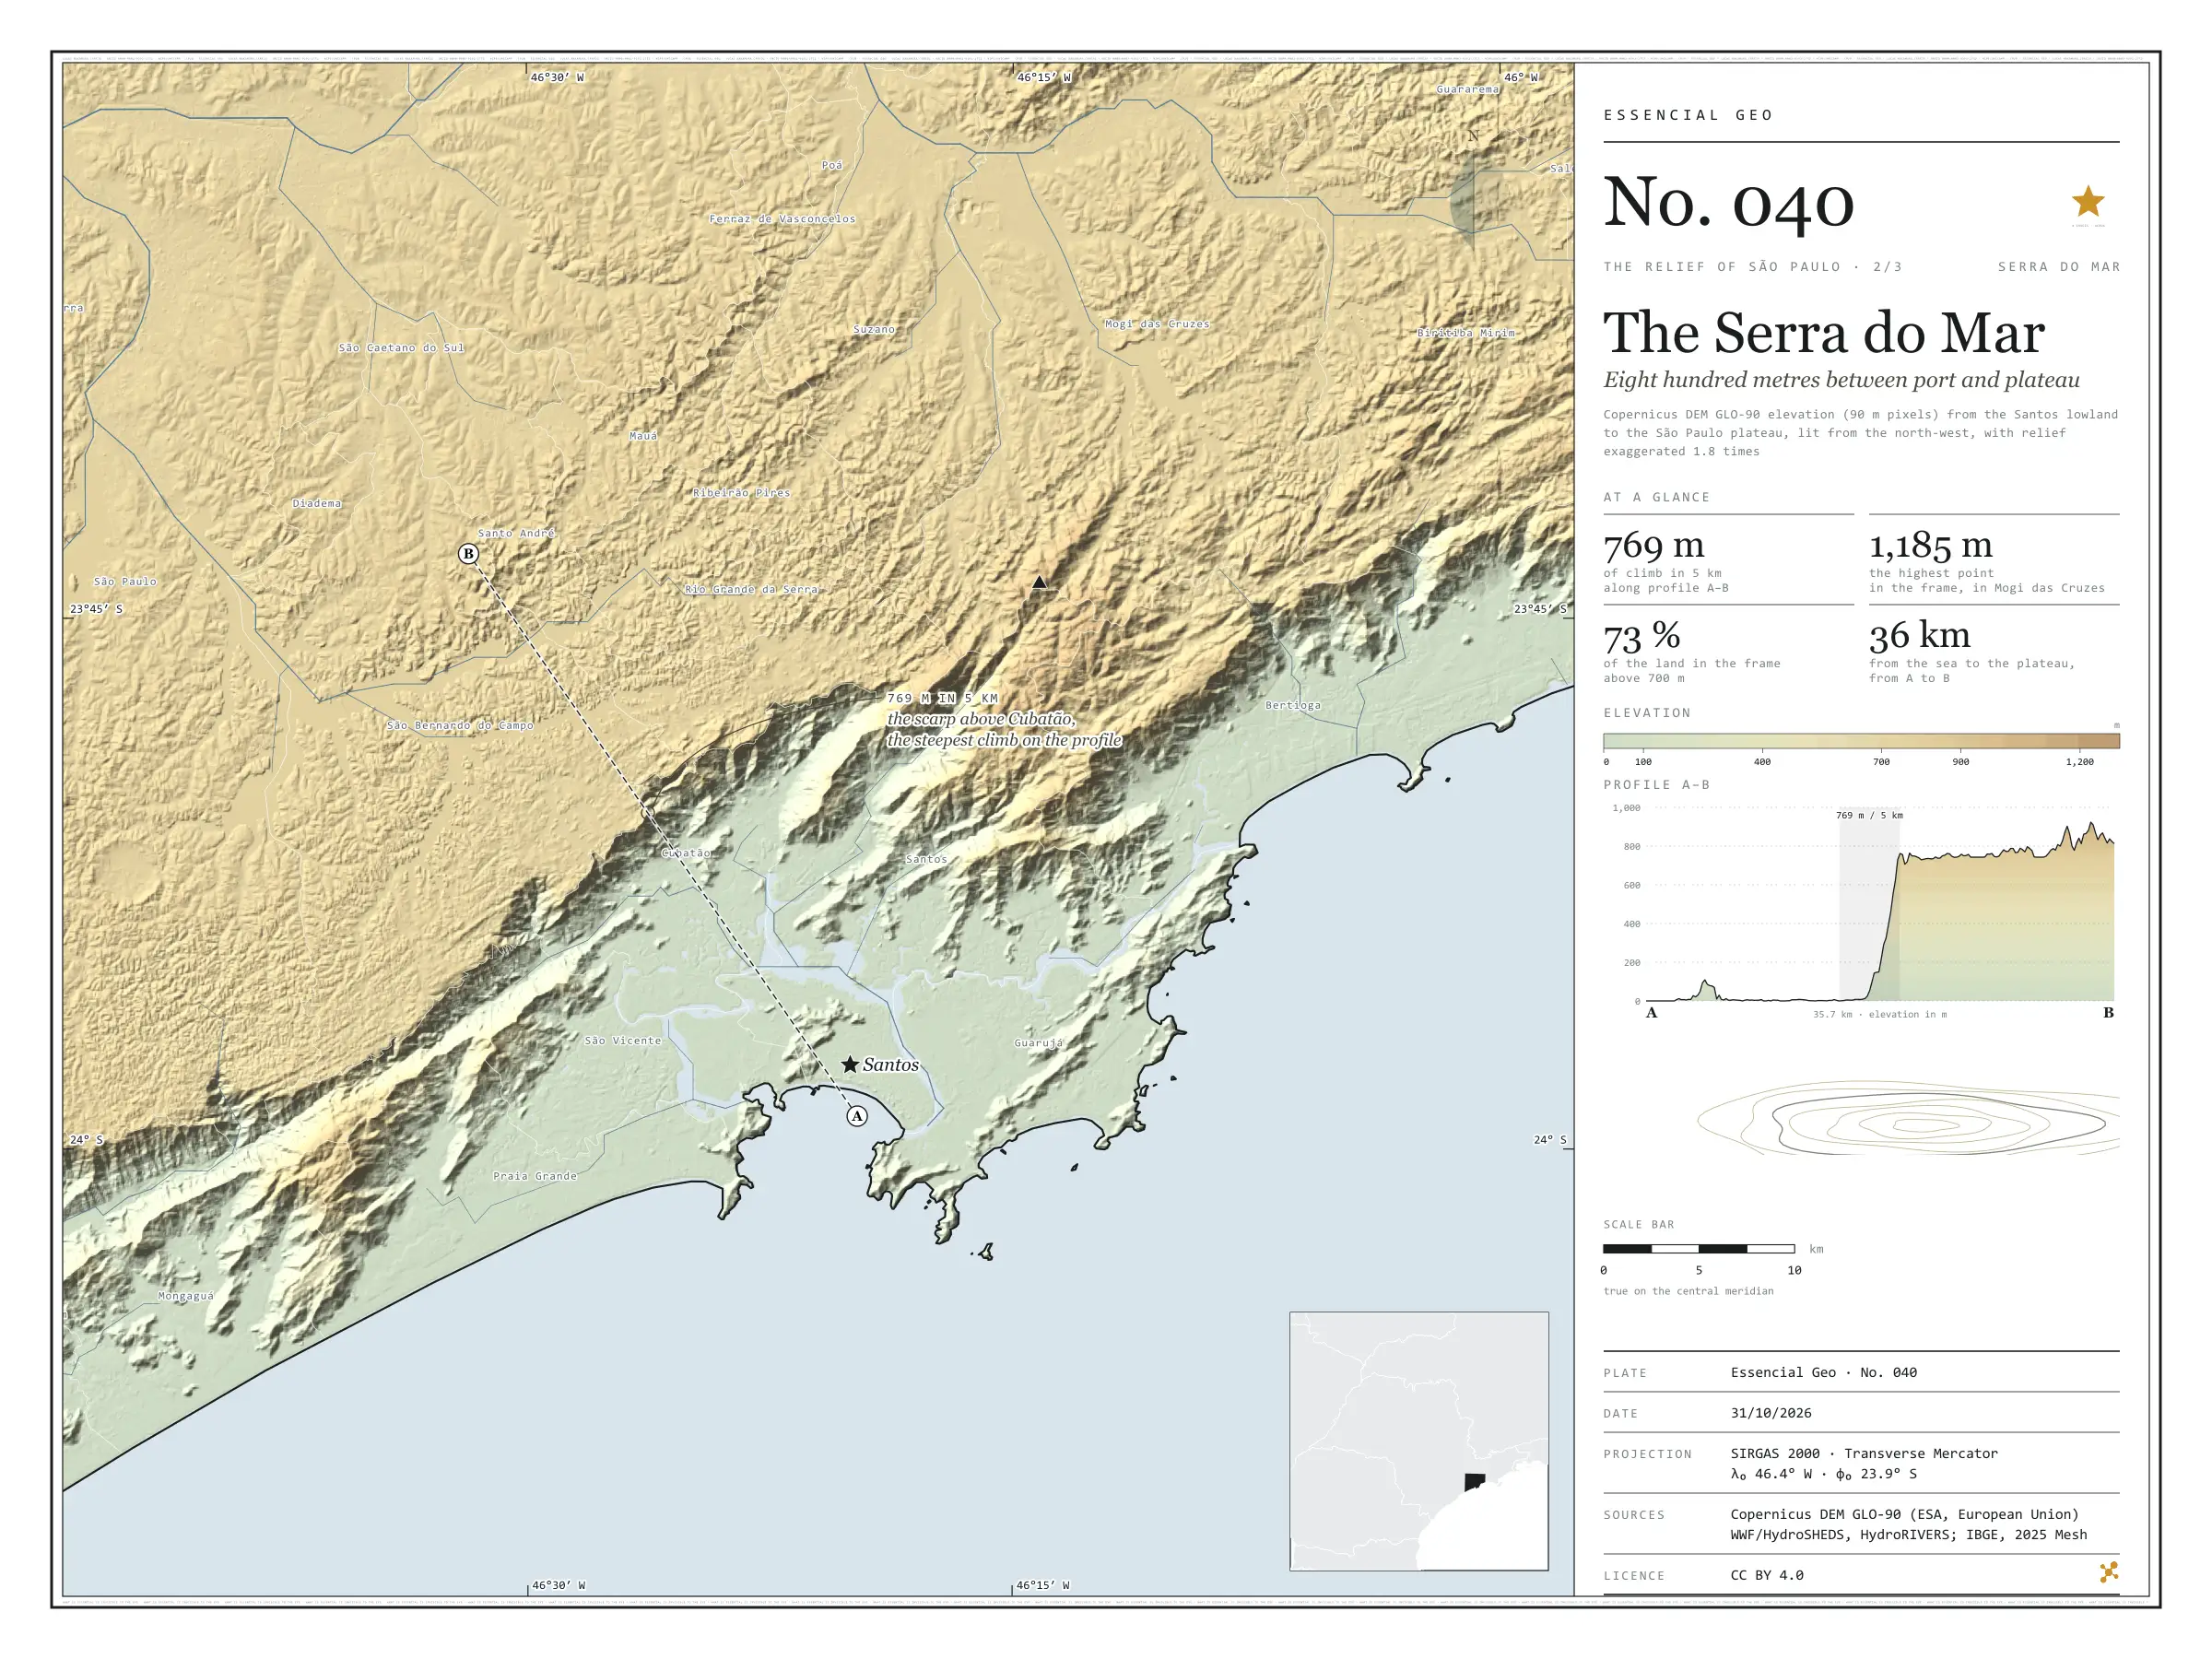
Fig. 040 Santos lowland, Serra do Mar and São Paulo plateau, between Mongaguá, Bertioga and São Paulo (SP) EPSG:4674 Source: Copernicus DEM GLO-90 (ESA, European Union), digital surface model, 90 m pixels, WWF / HydroSHEDS, IBGE

Profile A–B leaves the beach at Santos and runs 15 km across the lowland, between the mangroves and the port; apart from a 109 m hill right at the start, it stays a few metres above sea level. Then the Serra do Mar rises over Cubatão: 769 m of climb in 5 km, and at the top begins the plateau, which rolls on at around 760 m to São Bernardo do Campo and São Paulo. The whole slope, from 20 to 700 m, takes up only 596 km² in the frame’s elevation bands, 14% of the land; 72.5% of the ground lies above 700 m. The Anchieta and Imigrantes motorways and the railway climb this wall, and the Billings reservoir’s water is pumped down it to Cubatão. The highest point in the frame, 1,185 m, is in Mogi das Cruzes. Second plate of the collection “The relief of São Paulo”.

Technical record · downloads · citation

At a glance

Largest climb in 5 km along profile A–B

769 m

On the scarp above Cubatão, inside São Bernardo do Campo

Land in the frame above 700 m

73 %

Land area of the frame by elevation band (km²)
  • 0–20 m 598
  • 20–100 154
  • 100–200 133
  • 200–400 152
  • 400–600 107
  • 600–700 50
  • 700–800 2,310
  • 800–900 662
  • 900–1.000 87
  • 1.000–1.200 32

Layers

  • relevo raster GeoTIFF of elevation in metres (90 m pixels) clipped to the frame, with the plate’s hypsometric ramp in a .qml style
  • faixas_altitude polygon 10 elevation bands, finer near the sea, with the area of each
  • perfil line The A–B profile line, 35.7 km
  • ponto_mais_alto point Highest point in the frame, 1,185 m, in Mogi das Cruzes
  • municipios polygon The 25 São Paulo municipalities in the frame

Metadata

Extent
Santos lowland, Serra do Mar and São Paulo plateau, between Mongaguá, Bertioga and São Paulo (SP)
CRS / Projection
SIRGAS 2000 (EPSG:4674)
EPSG:4674
Software
Python · rasterio · GeoPandas · SciPy · GDAL · QGIS · Node.js · d3-geo
Method
Copernicus DEM GLO-90 tiles mosaicked, lit from the north-west with relief exaggerated 1.8 times and coloured by elevation band; profile A–B sampled at 600 points.
Version
v1.0.0
Licence
CC BY 4.0

Downloads

Figure to reuse

The map without a frame, with legend, scale, reference system and credit written on it: ready for papers, lectures and slides. In two versions: with the basemap (neighbours and sea) or only the mapped area, on white.

Point a camera at it to open this page.

How to cite

Cerejo, L. N. (2026). Serra do Mar: oitocentos metros entre o porto e o planalto [The Serra do Mar: Eight hundred metres between port and plateau] (Version 1.0.0) [Data set]. Zenodo. https://doi.org/10.5281/zenodo.23539548

No. 041 Elevation · relief The relief of São Paulo 3/3

The cuestas of São Paulo

The basalt step

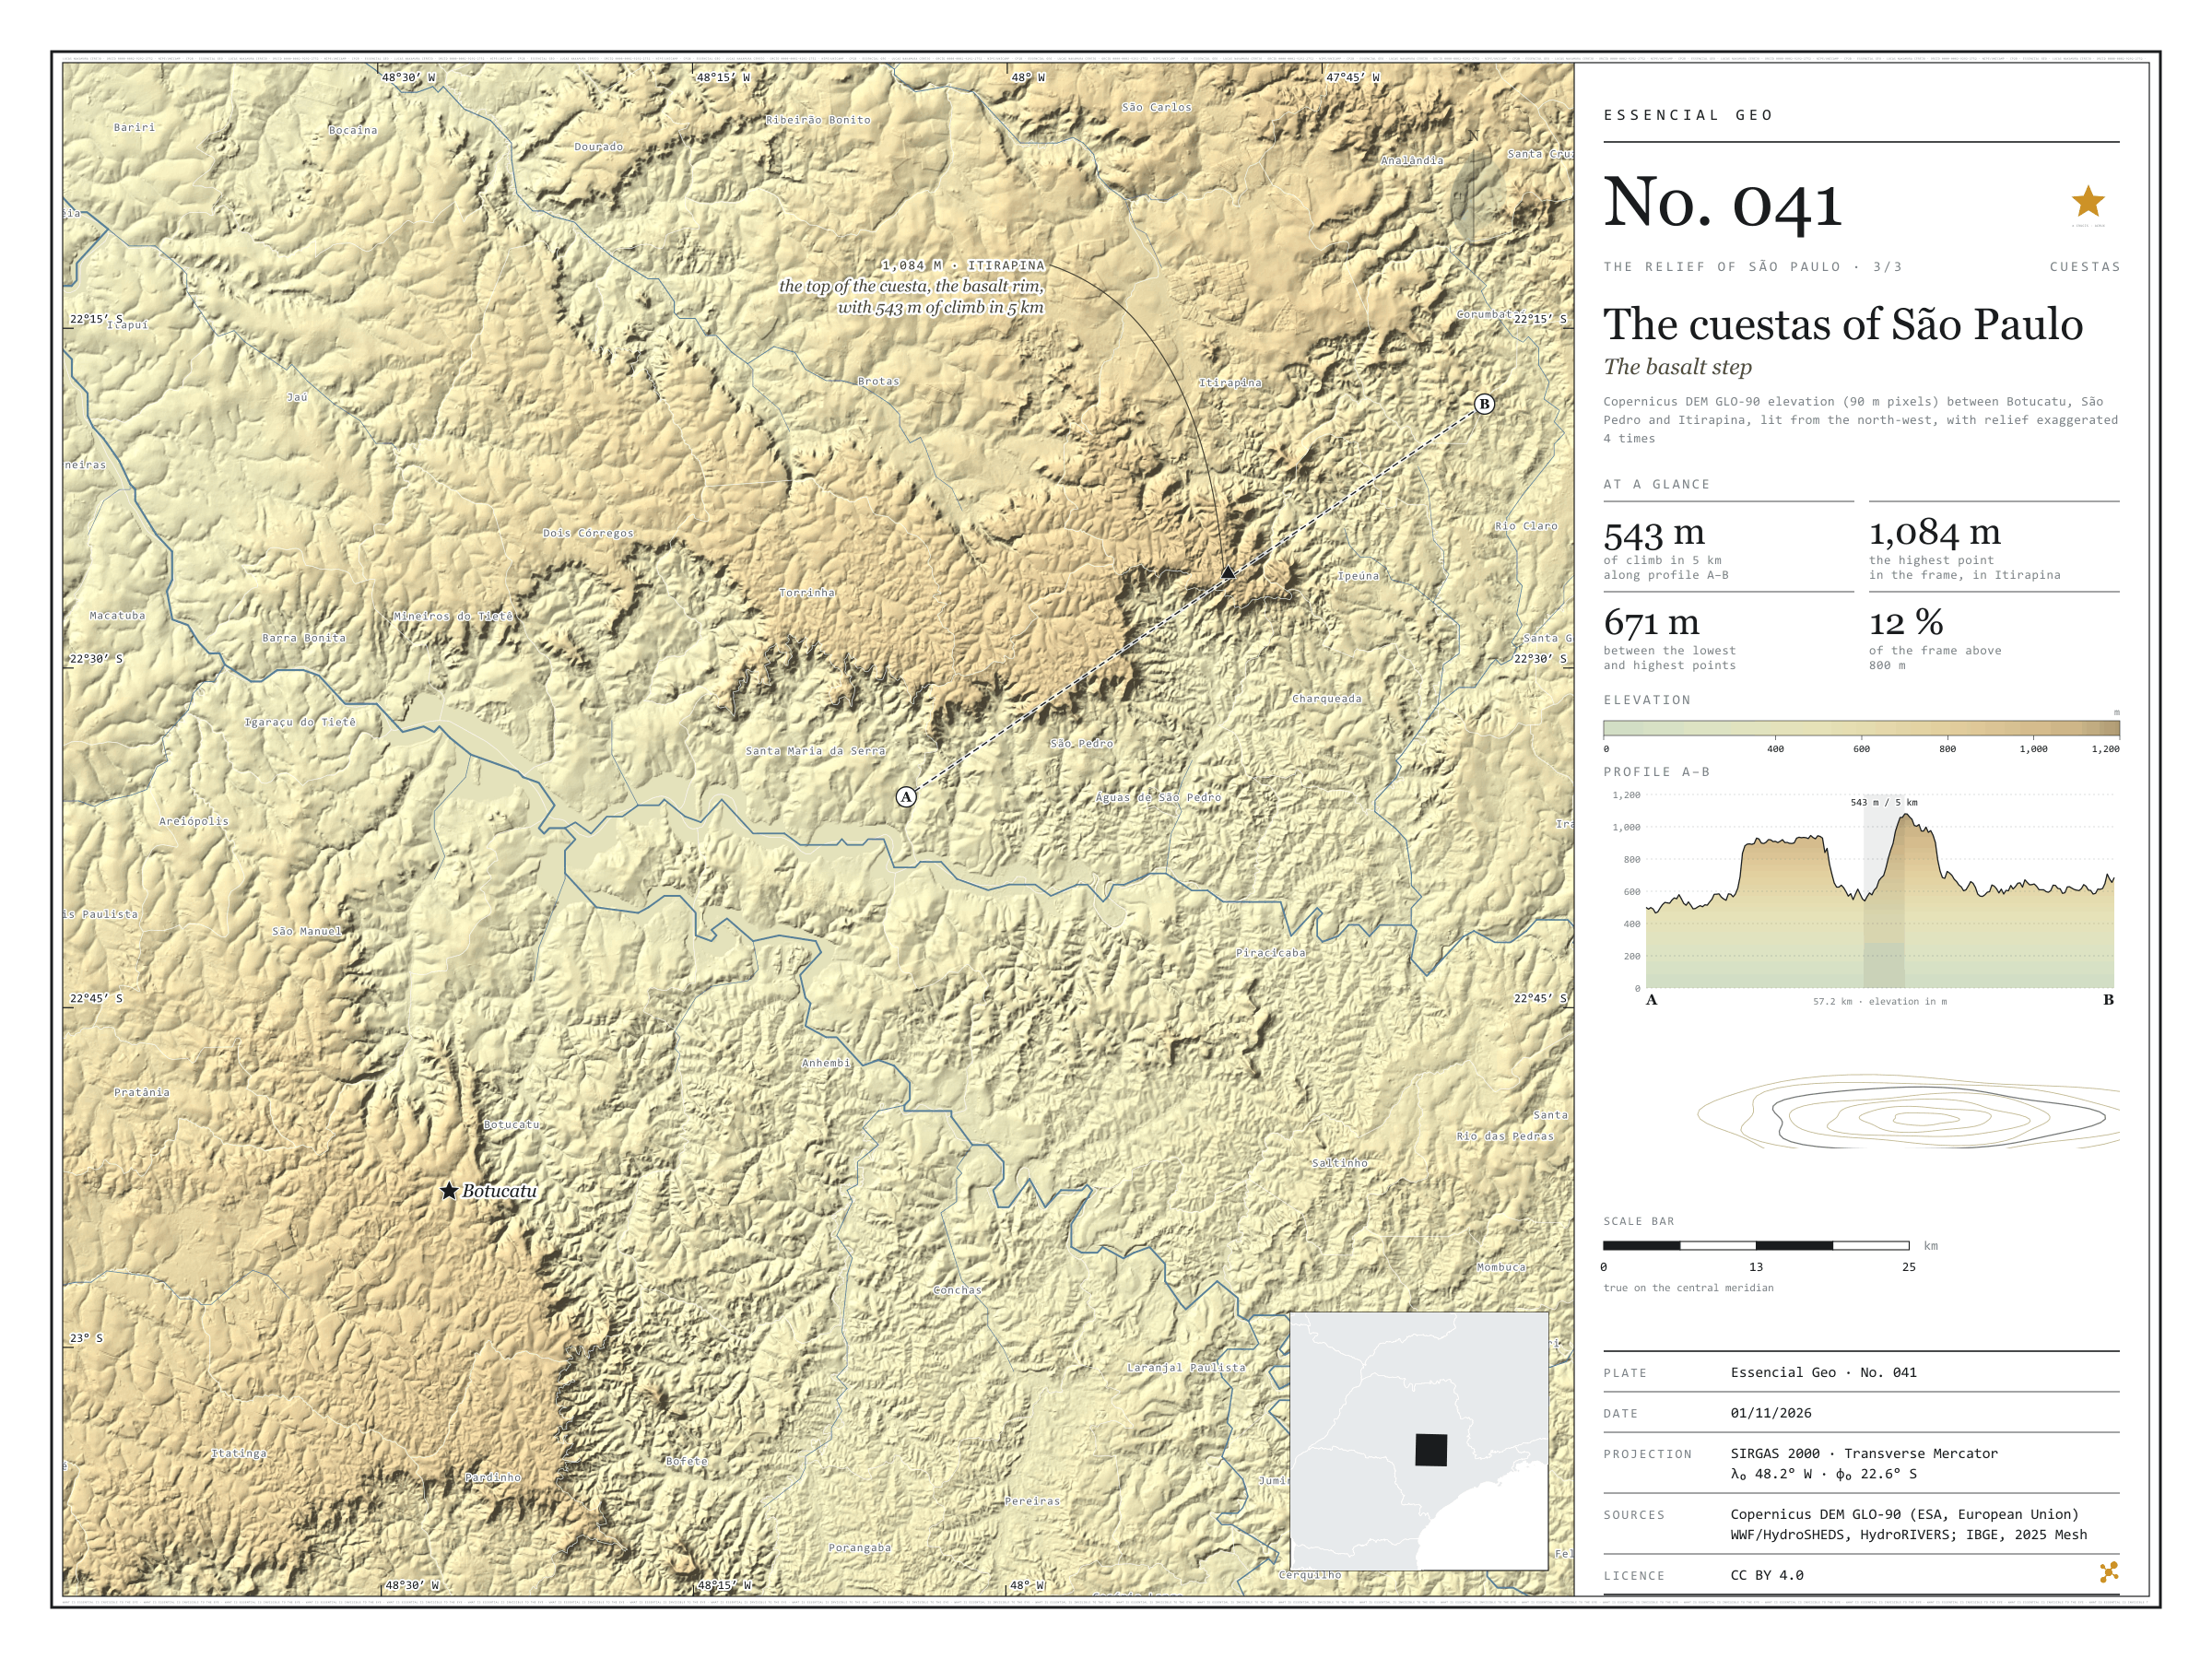
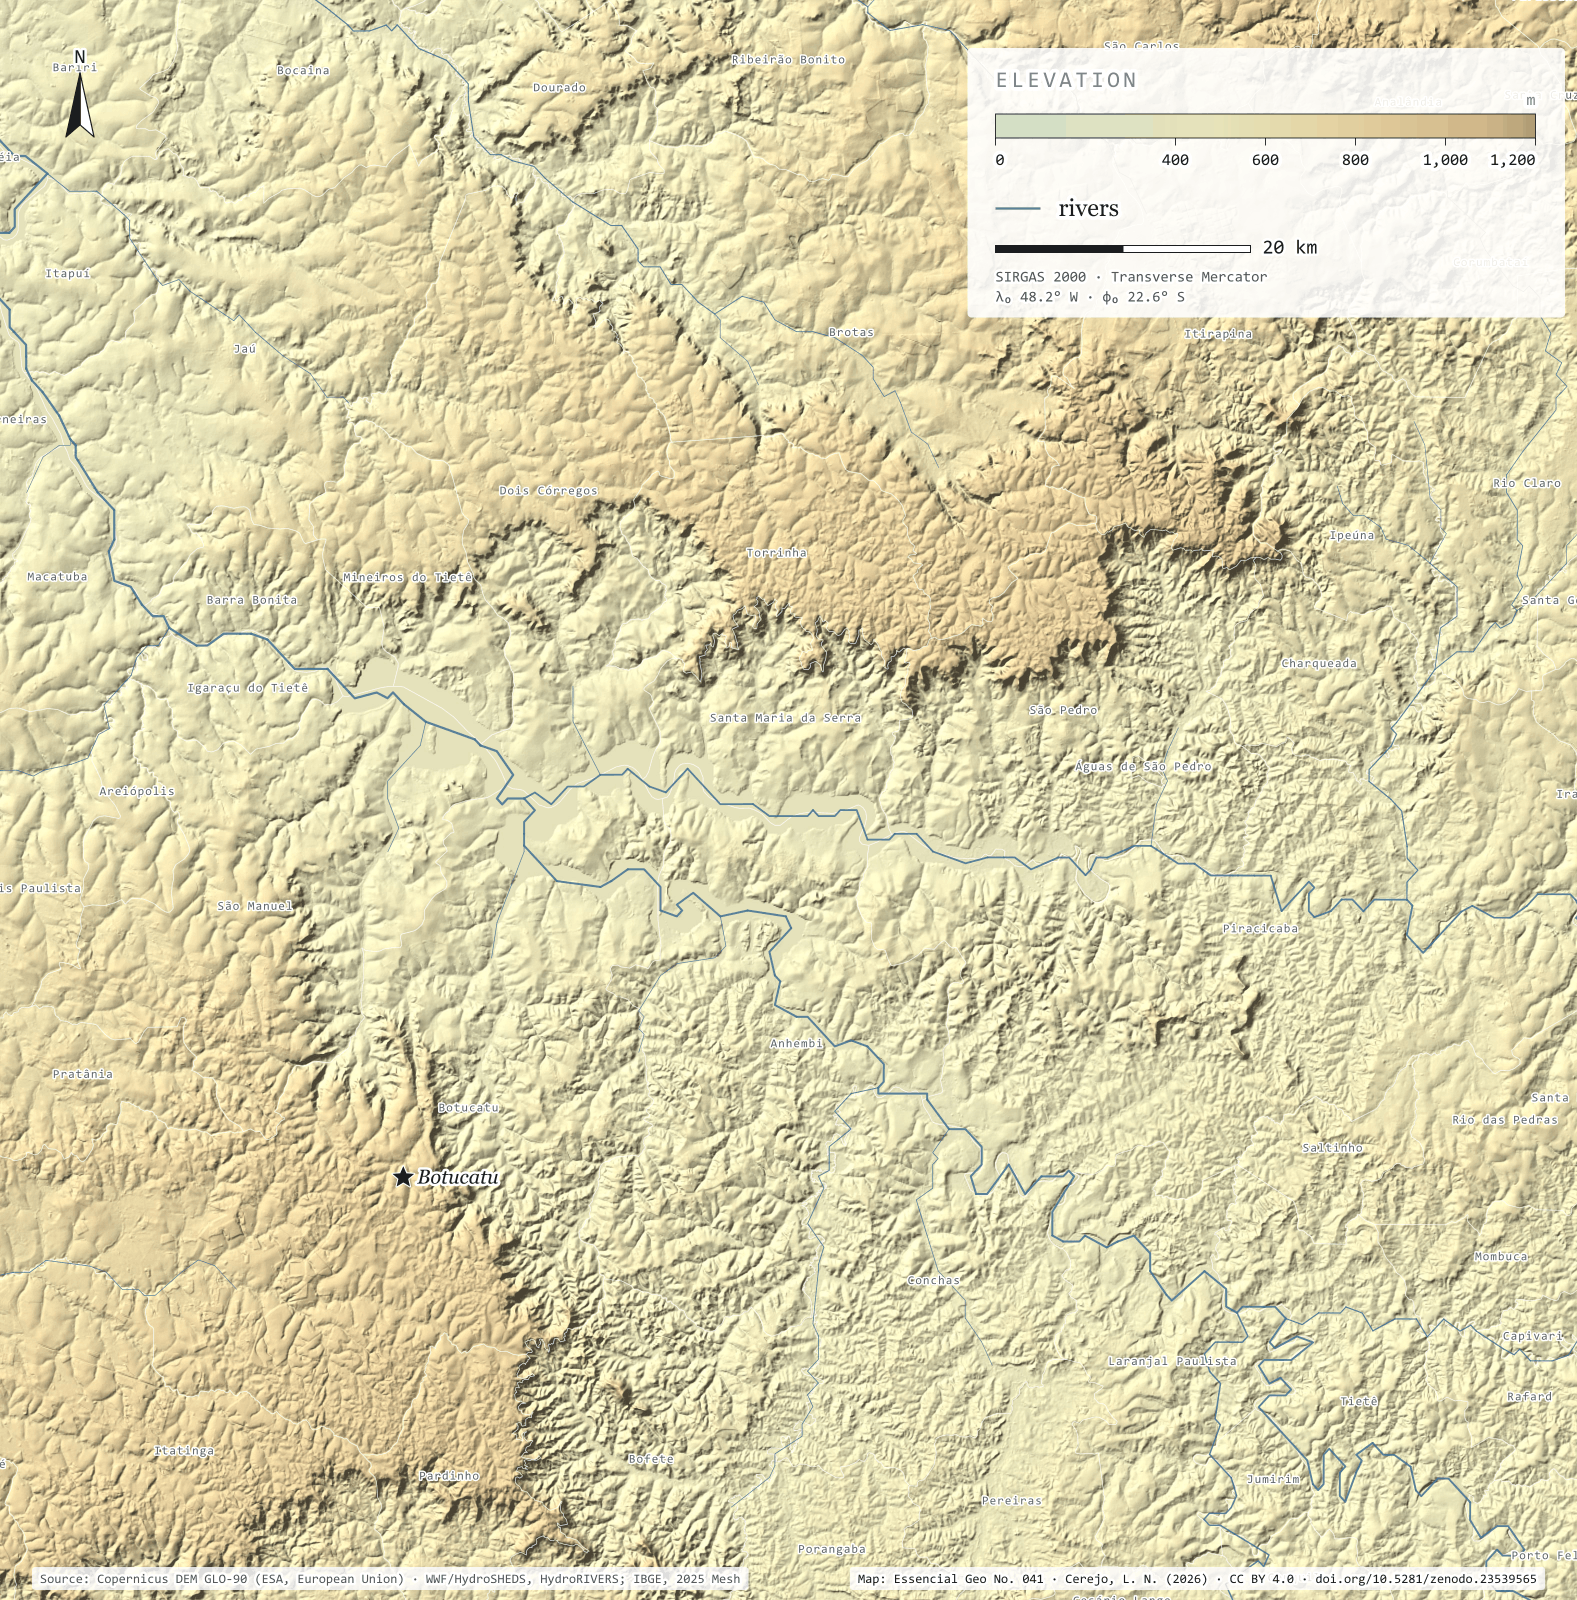
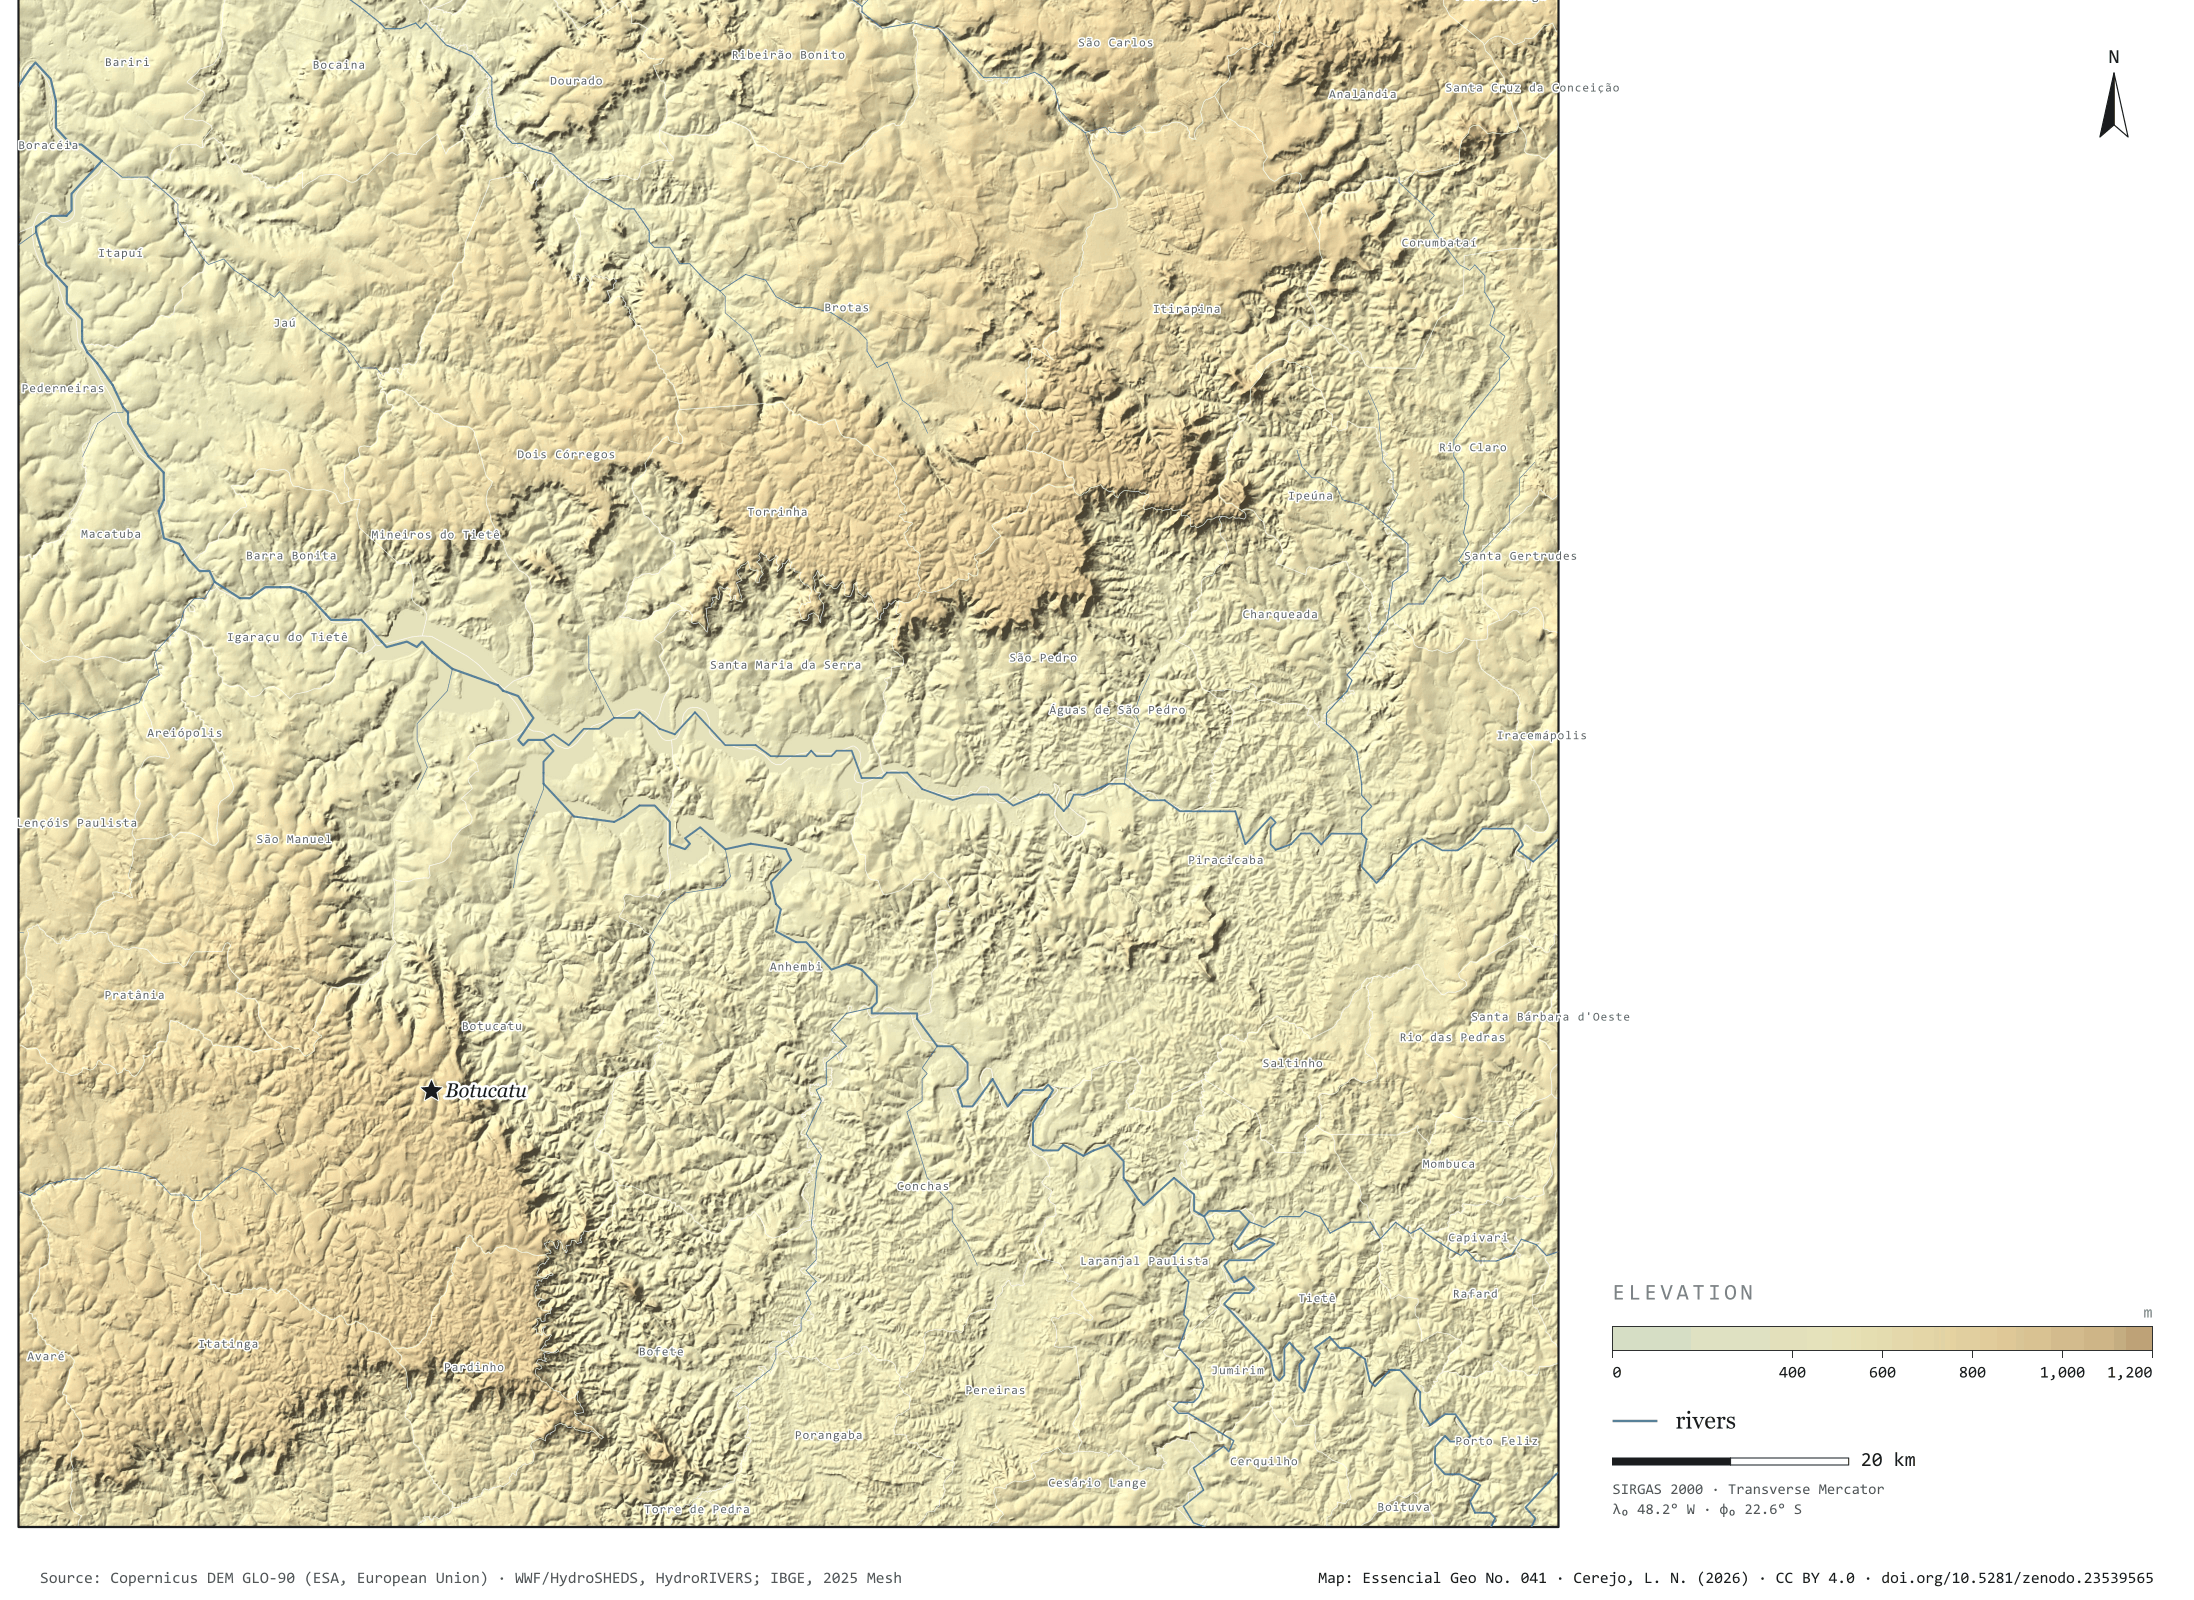
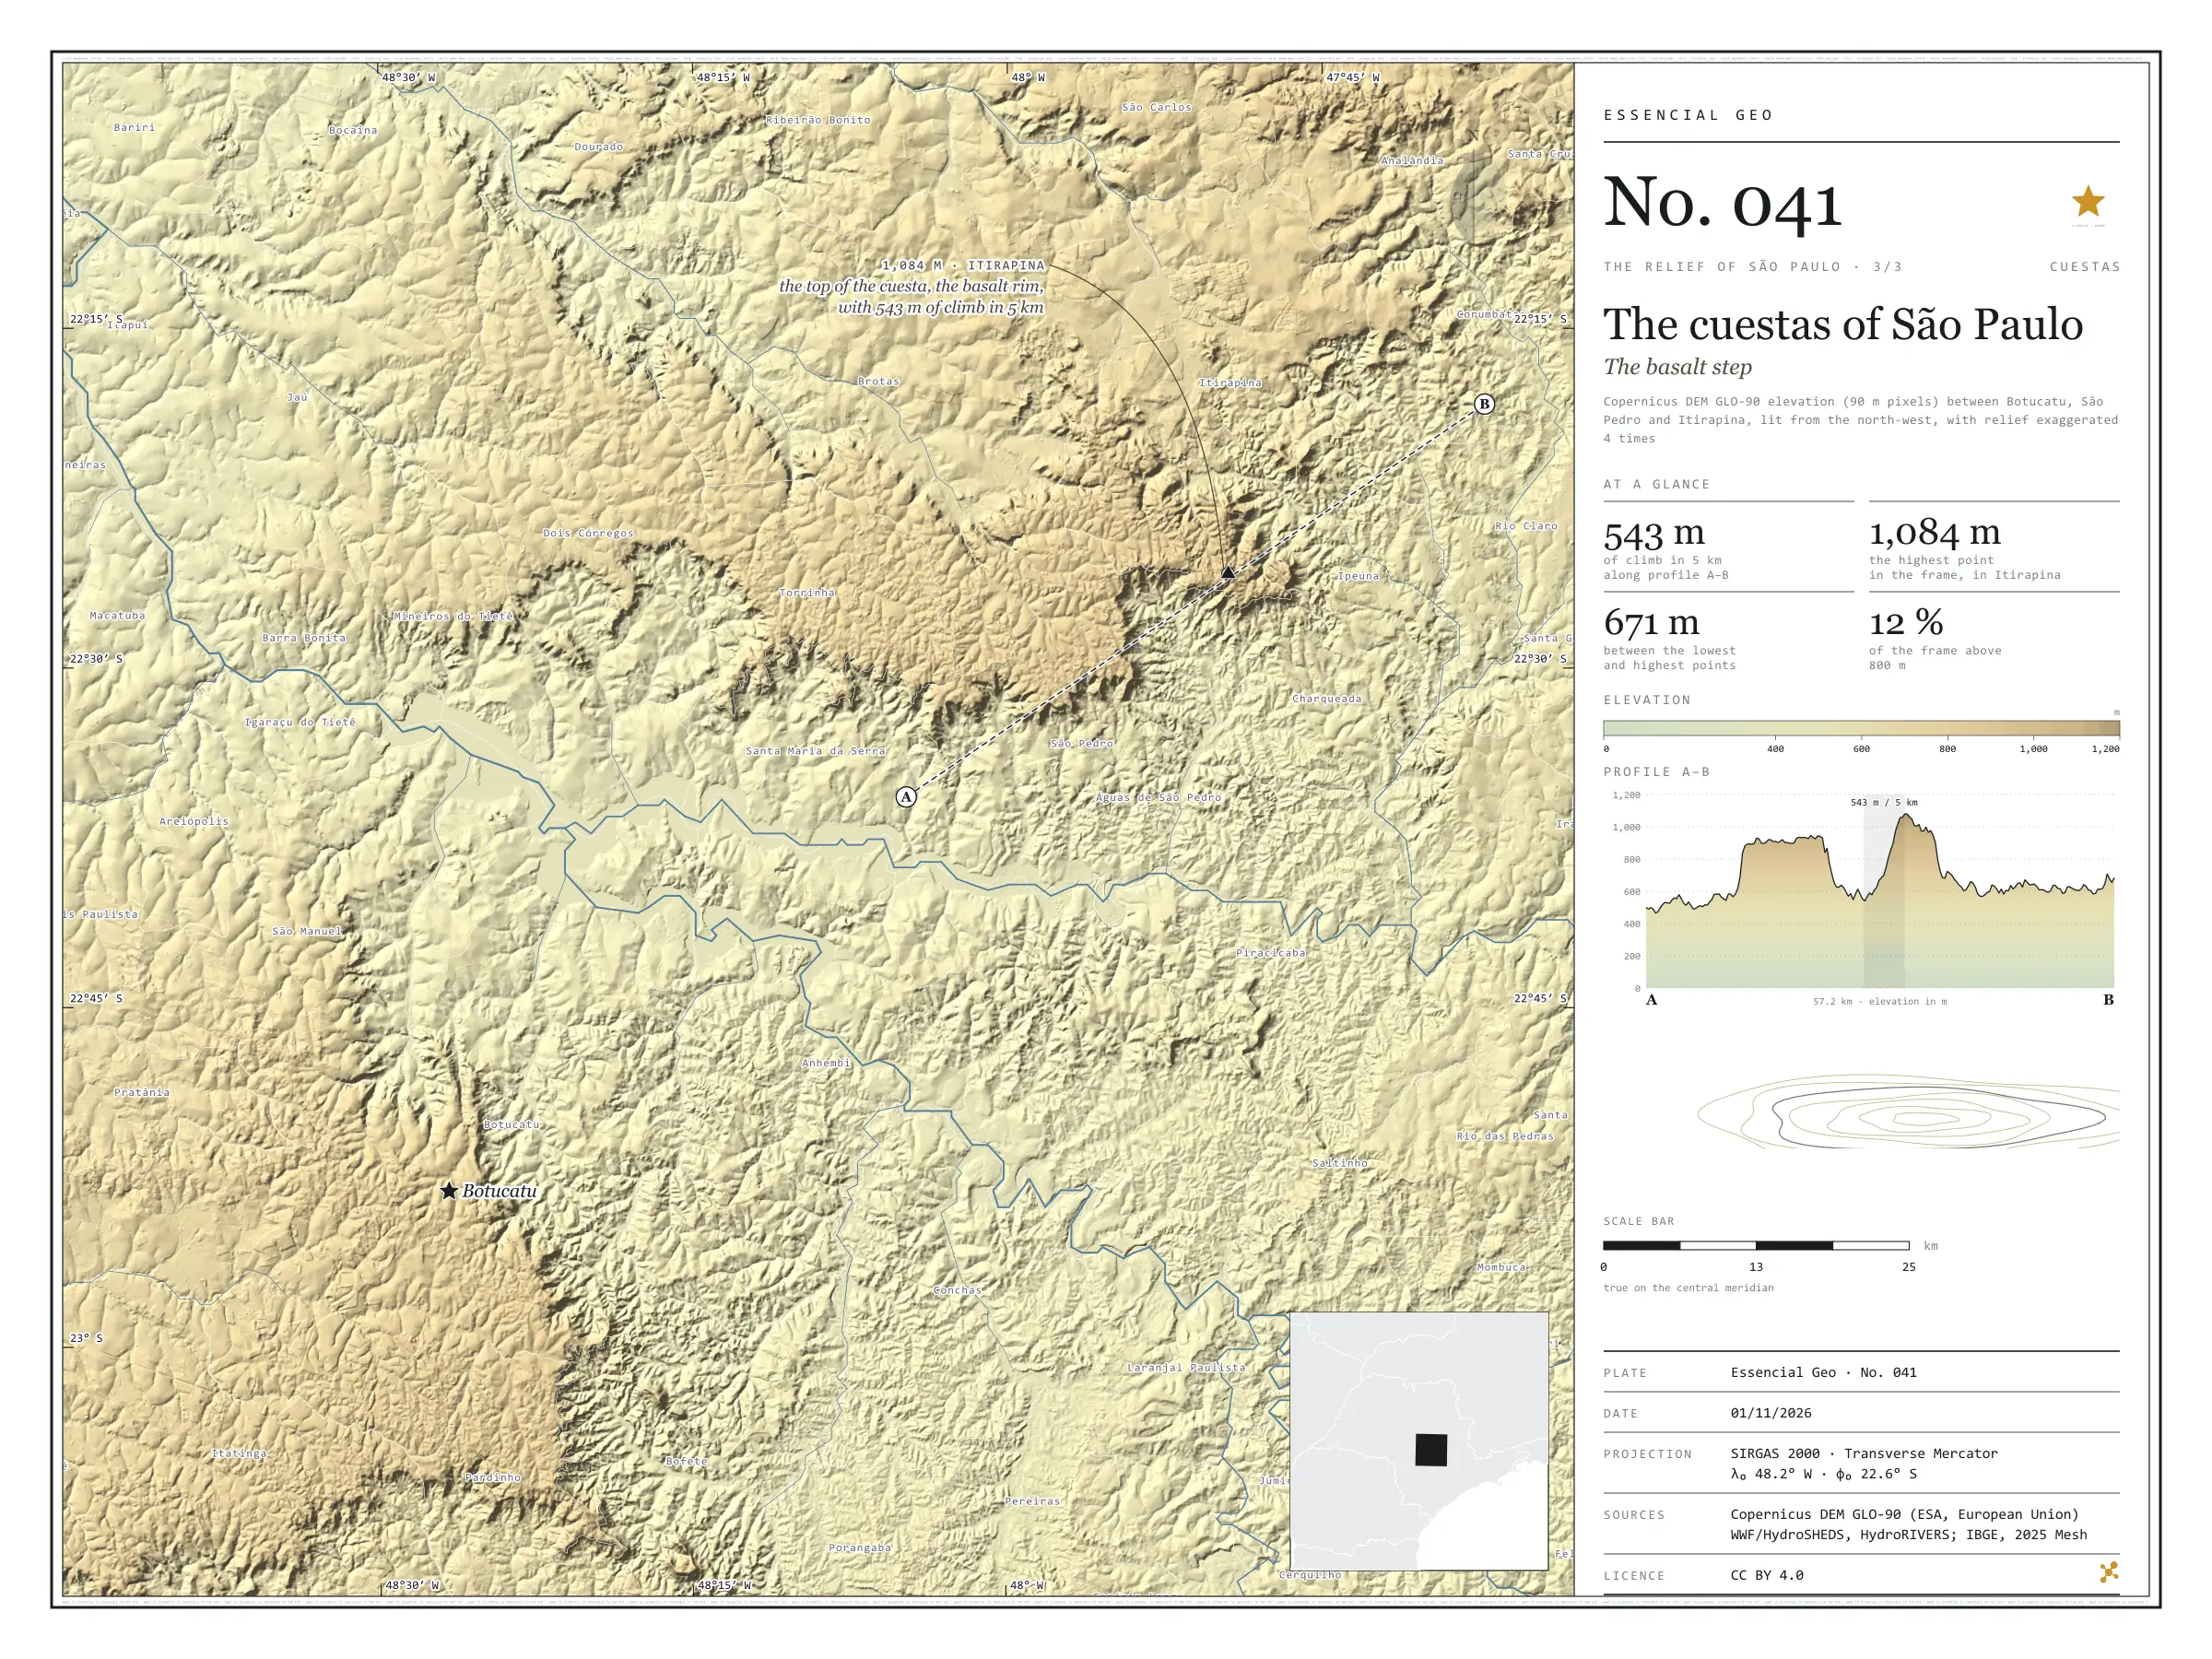
Fig. 041 Central São Paulo state, between Jaú, São Carlos, Piracicaba and Botucatu (SP) EPSG:4674 Source: Copernicus DEM GLO-90 (ESA, European Union), digital surface model, 90 m pixels, WWF / HydroSHEDS, IBGE

In the middle of the state, the western São Paulo plateau ends in a step: the cuestas, scarps where the layers of basalt and sandstone break off all at once, facing the Peripheral Depression. Profile A–B leaves the depression near São Pedro, at 500 m, rises to a first plateau at 956 m, dips into a valley at 537 m and climbs the Itirapina cuesta: 543 m of climb in 5 km, up to 1,081 m. On the far side, the ground falls to the Corumbataí valley, at around 640 m. The highest point in the frame, 1,084 m, is right there, in Itirapina; between it and the lowest point lie 671 m. In the south-west, the Botucatu cuesta draws the same step. In the 15,399 km² frame, only 12.3% of the ground lies above 800 m. Third plate of the collection “The relief of São Paulo”.

Technical record · downloads · citation

At a glance

Largest climb in 5 km along profile A–B

543 m

On the Itirapina cuesta

Difference between the highest and lowest points in the frame

671 m

Area of the frame by elevation band (km²)
  • 400–500 m 2,628
  • 500–600 6,015
  • 600–700 2,643
  • 700–800 2,224
  • 800–900 1,540
  • 900–1.000 327
  • 1.000–1.100 22

Layers

  • relevo raster GeoTIFF of elevation in metres (90 m pixels) clipped to the frame, with the plate’s hypsometric ramp in a .qml style
  • faixas_altitude polygon 7 elevation bands, every 100 m, with the area of each
  • perfil line The A–B profile line, 57.2 km
  • ponto_mais_alto point Highest point in the frame, 1,084 m, in Itirapina
  • municipios polygon The 58 municipalities in the frame

Metadata

Extent
Central São Paulo state, between Jaú, São Carlos, Piracicaba and Botucatu (SP)
CRS / Projection
SIRGAS 2000 (EPSG:4674)
EPSG:4674
Software
Python · rasterio · GeoPandas · SciPy · GDAL · QGIS · Node.js · d3-geo
Method
Copernicus DEM GLO-90 tiles mosaicked, lit from the north-west with relief exaggerated 4 times and coloured by elevation band; profile A–B sampled at 600 points, drawn through the frame’s steepest local relief.
Version
v1.0.0
Licence
CC BY 4.0

Downloads

Figure to reuse

The map without a frame, with legend, scale, reference system and credit written on it: ready for papers, lectures and slides. In two versions: with the basemap (neighbours and sea) or only the mapped area, on white.

Point a camera at it to open this page.

How to cite

Cerejo, L. N. (2026). Cuestas paulistas: o degrau do basalto [The cuestas of São Paulo: The basalt step] (Version 1.0.0) [Data set]. Zenodo. https://doi.org/10.5281/zenodo.23539565

Technical record

Technical record · No. 039

The Mantiqueira range

At a glance

Highest point in São Paulo, Pedra da Mina

2,785 m

In the 90 m model, in Queluz, on the Minas Gerais border

Largest climb in 5 km along profile A–B

1,332 m

Area of the frame by elevation band (km²)
  • < 500 m 83
  • 500–700 2,842
  • 700–900 1,797
  • 900–1.100 2,510
  • 1.100–1.300 1,188
  • 1.300–1.500 1,050
  • 1.500–1.700 775
  • 1.700–1.900 441
  • 1.900–2.100 113
  • > 2.100 m 68

Layers

  • relevo raster GeoTIFF of elevation in metres (90 m pixels) clipped to the frame, with the plate’s hypsometric ramp in a .qml style
  • faixas_altitude polygon 13 elevation bands, every 200 m, with the area of each
  • perfil line The A–B profile line, 61.0 km
  • ponto_mais_alto point Pedra da Mina, 2,785 m in the model
  • municipios polygon The 25 São Paulo municipalities in the frame

Metadata

Extent
Paraíba valley and Mantiqueira range, between Taubaté and Queluz (SP), with parts of Minas Gerais and Rio de Janeiro
CRS / Projection
SIRGAS 2000 (EPSG:4674)
EPSG:4674
Software
Python · rasterio · GeoPandas · SciPy · GDAL · QGIS · Node.js · d3-geo
Method
Copernicus DEM GLO-90 tiles mosaicked, lit from the north-west with relief exaggerated 1.6 times and coloured by elevation band; profile A–B sampled at 600 points.
Version
v1.0.0
Licence
CC BY 4.0

Downloads

Figure to reuse

The map without a frame, with legend, scale, reference system and credit written on it: ready for papers, lectures and slides. In two versions: with the basemap (neighbours and sea) or only the mapped area, on white.

Point a camera at it to open this page.

How to cite

Cerejo, L. N. (2026). Serra da Mantiqueira: a muralha sobre o vale do Paraíba [The Mantiqueira range: The wall above the Paraíba valley] (Version 1.0.0) [Data set]. Zenodo. https://doi.org/10.5281/zenodo.23539387

Data and plates under CC BY 4.0: use them in commercial drawings and papers, citing the source.

100%