Skip to content
Essencial

Collection · 4 plates

Campinas Metropolitan Region

Land use, households, income and water in the region where this atlas is made.

4 of 4 published

In reading order, from the first to the latest. All collections

The route

Read in order: each plate adds a layer to the one before.

Start with the first plate
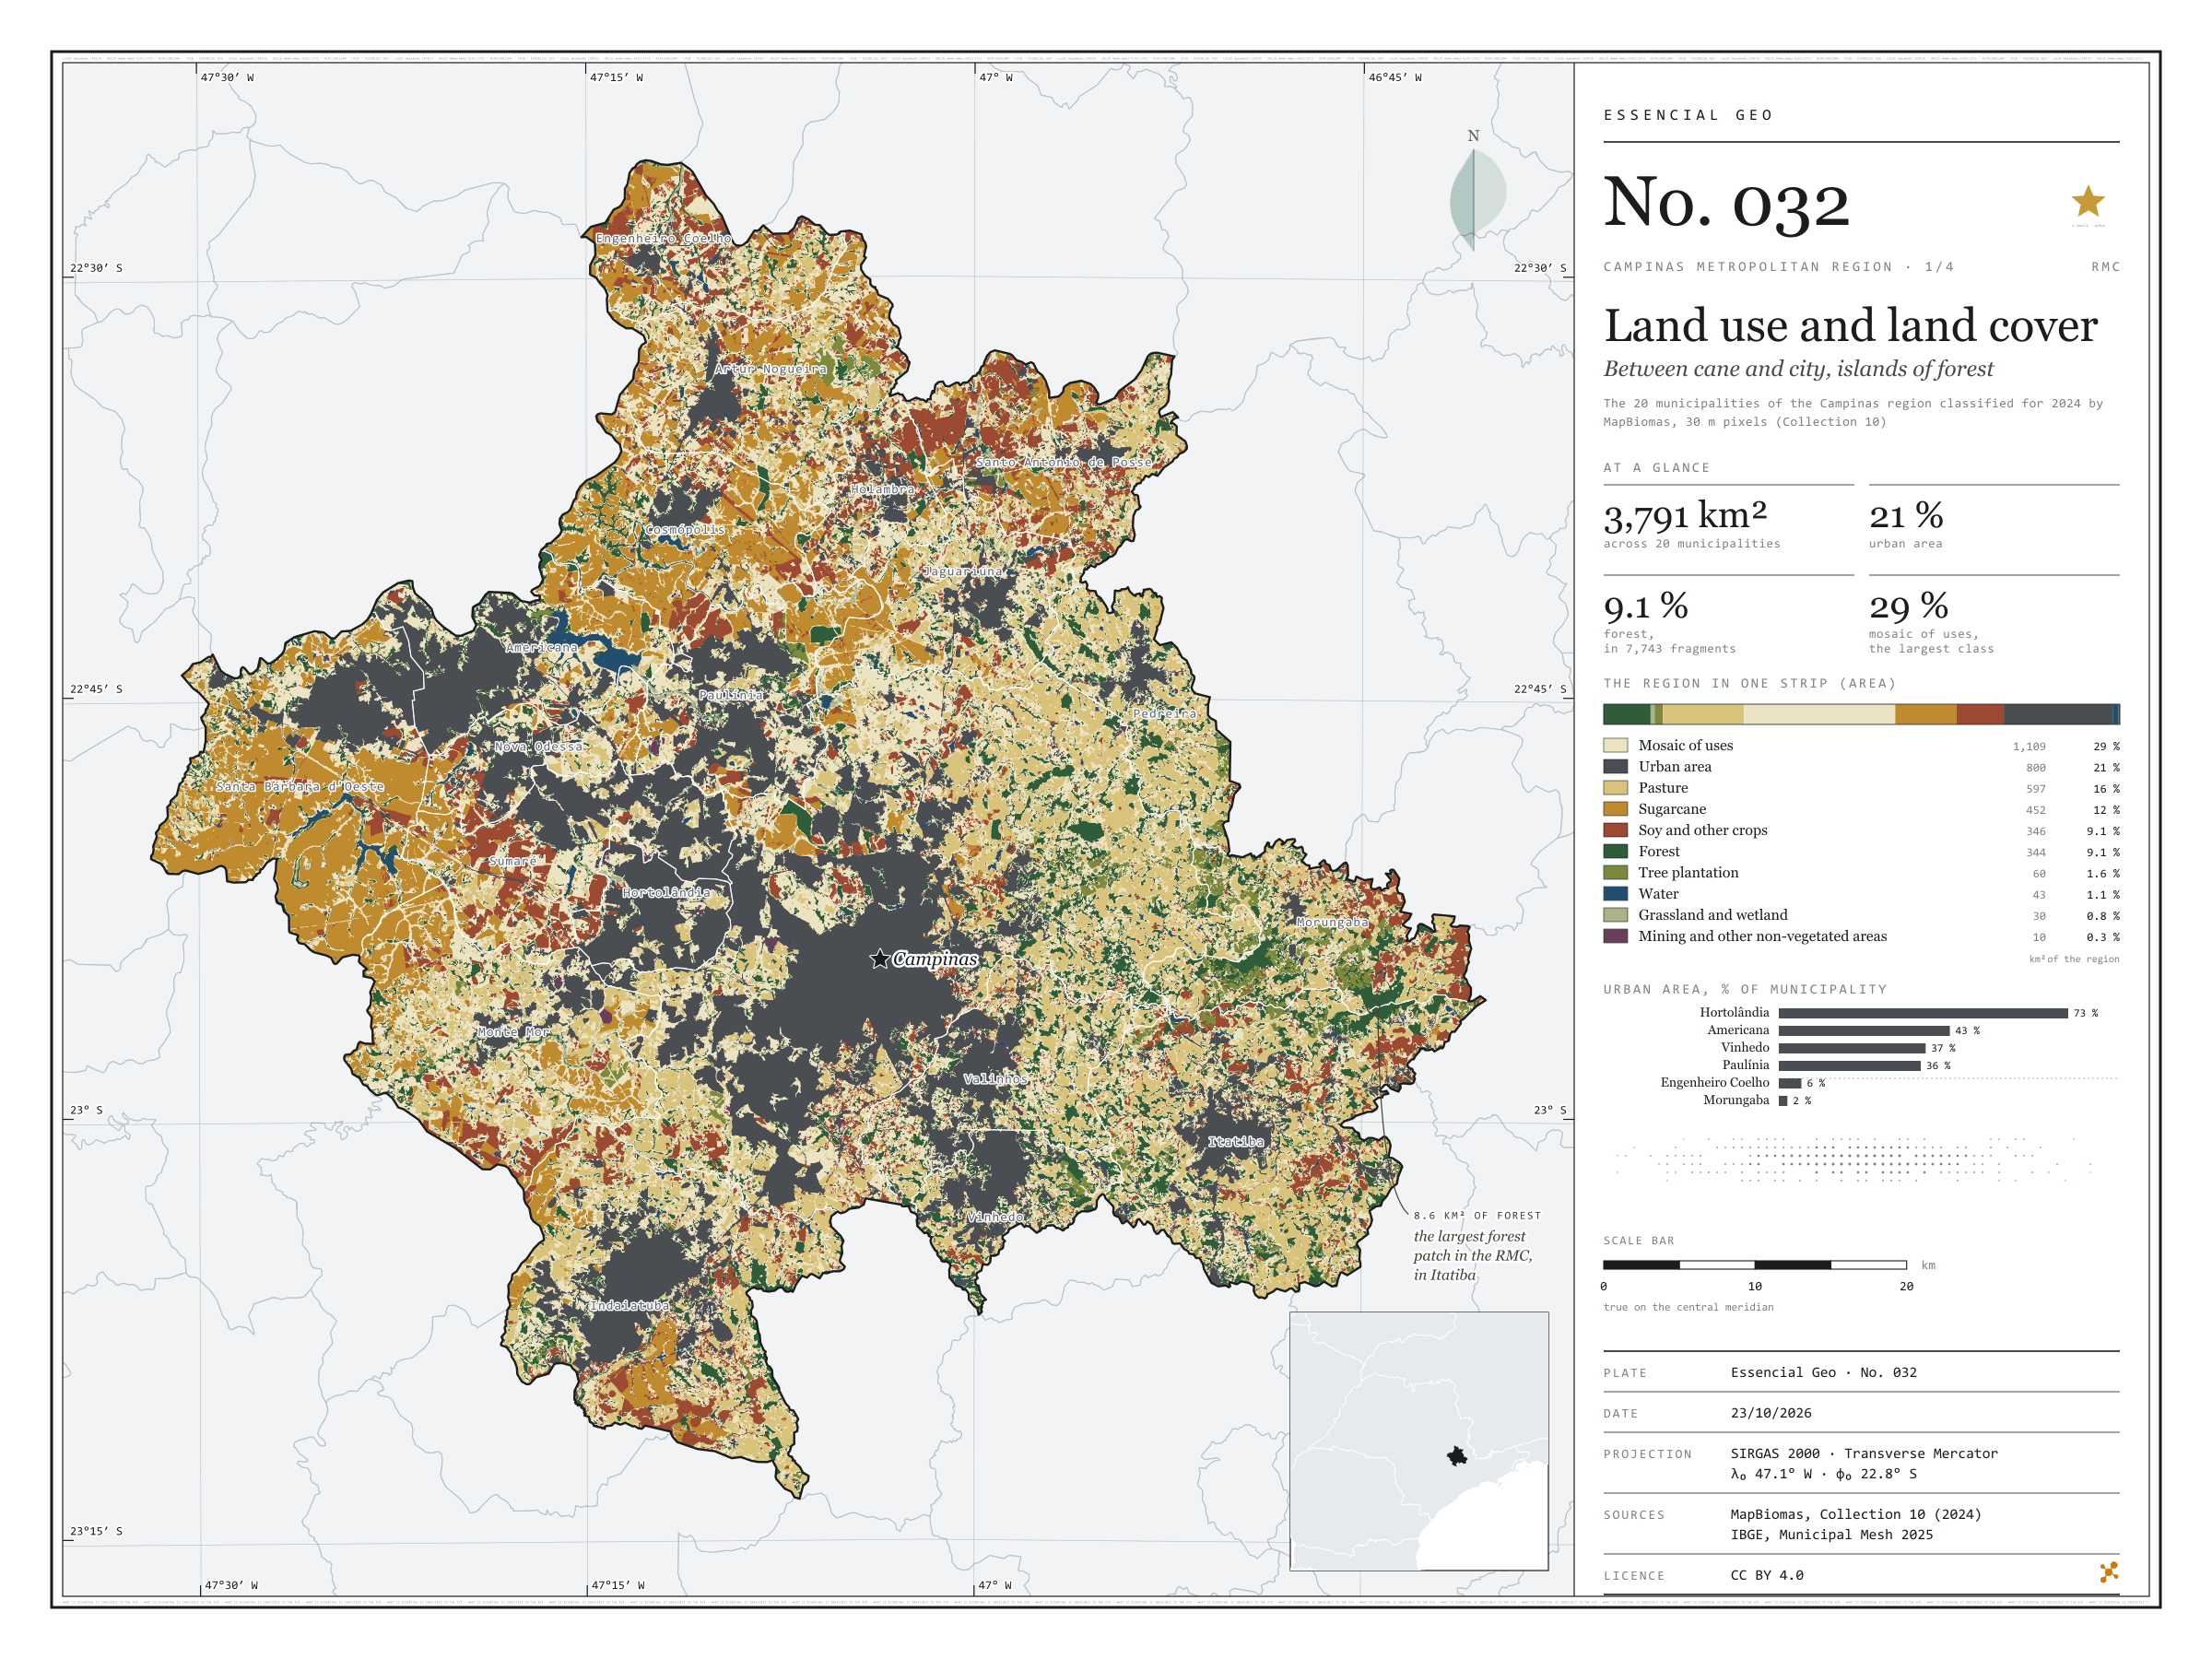
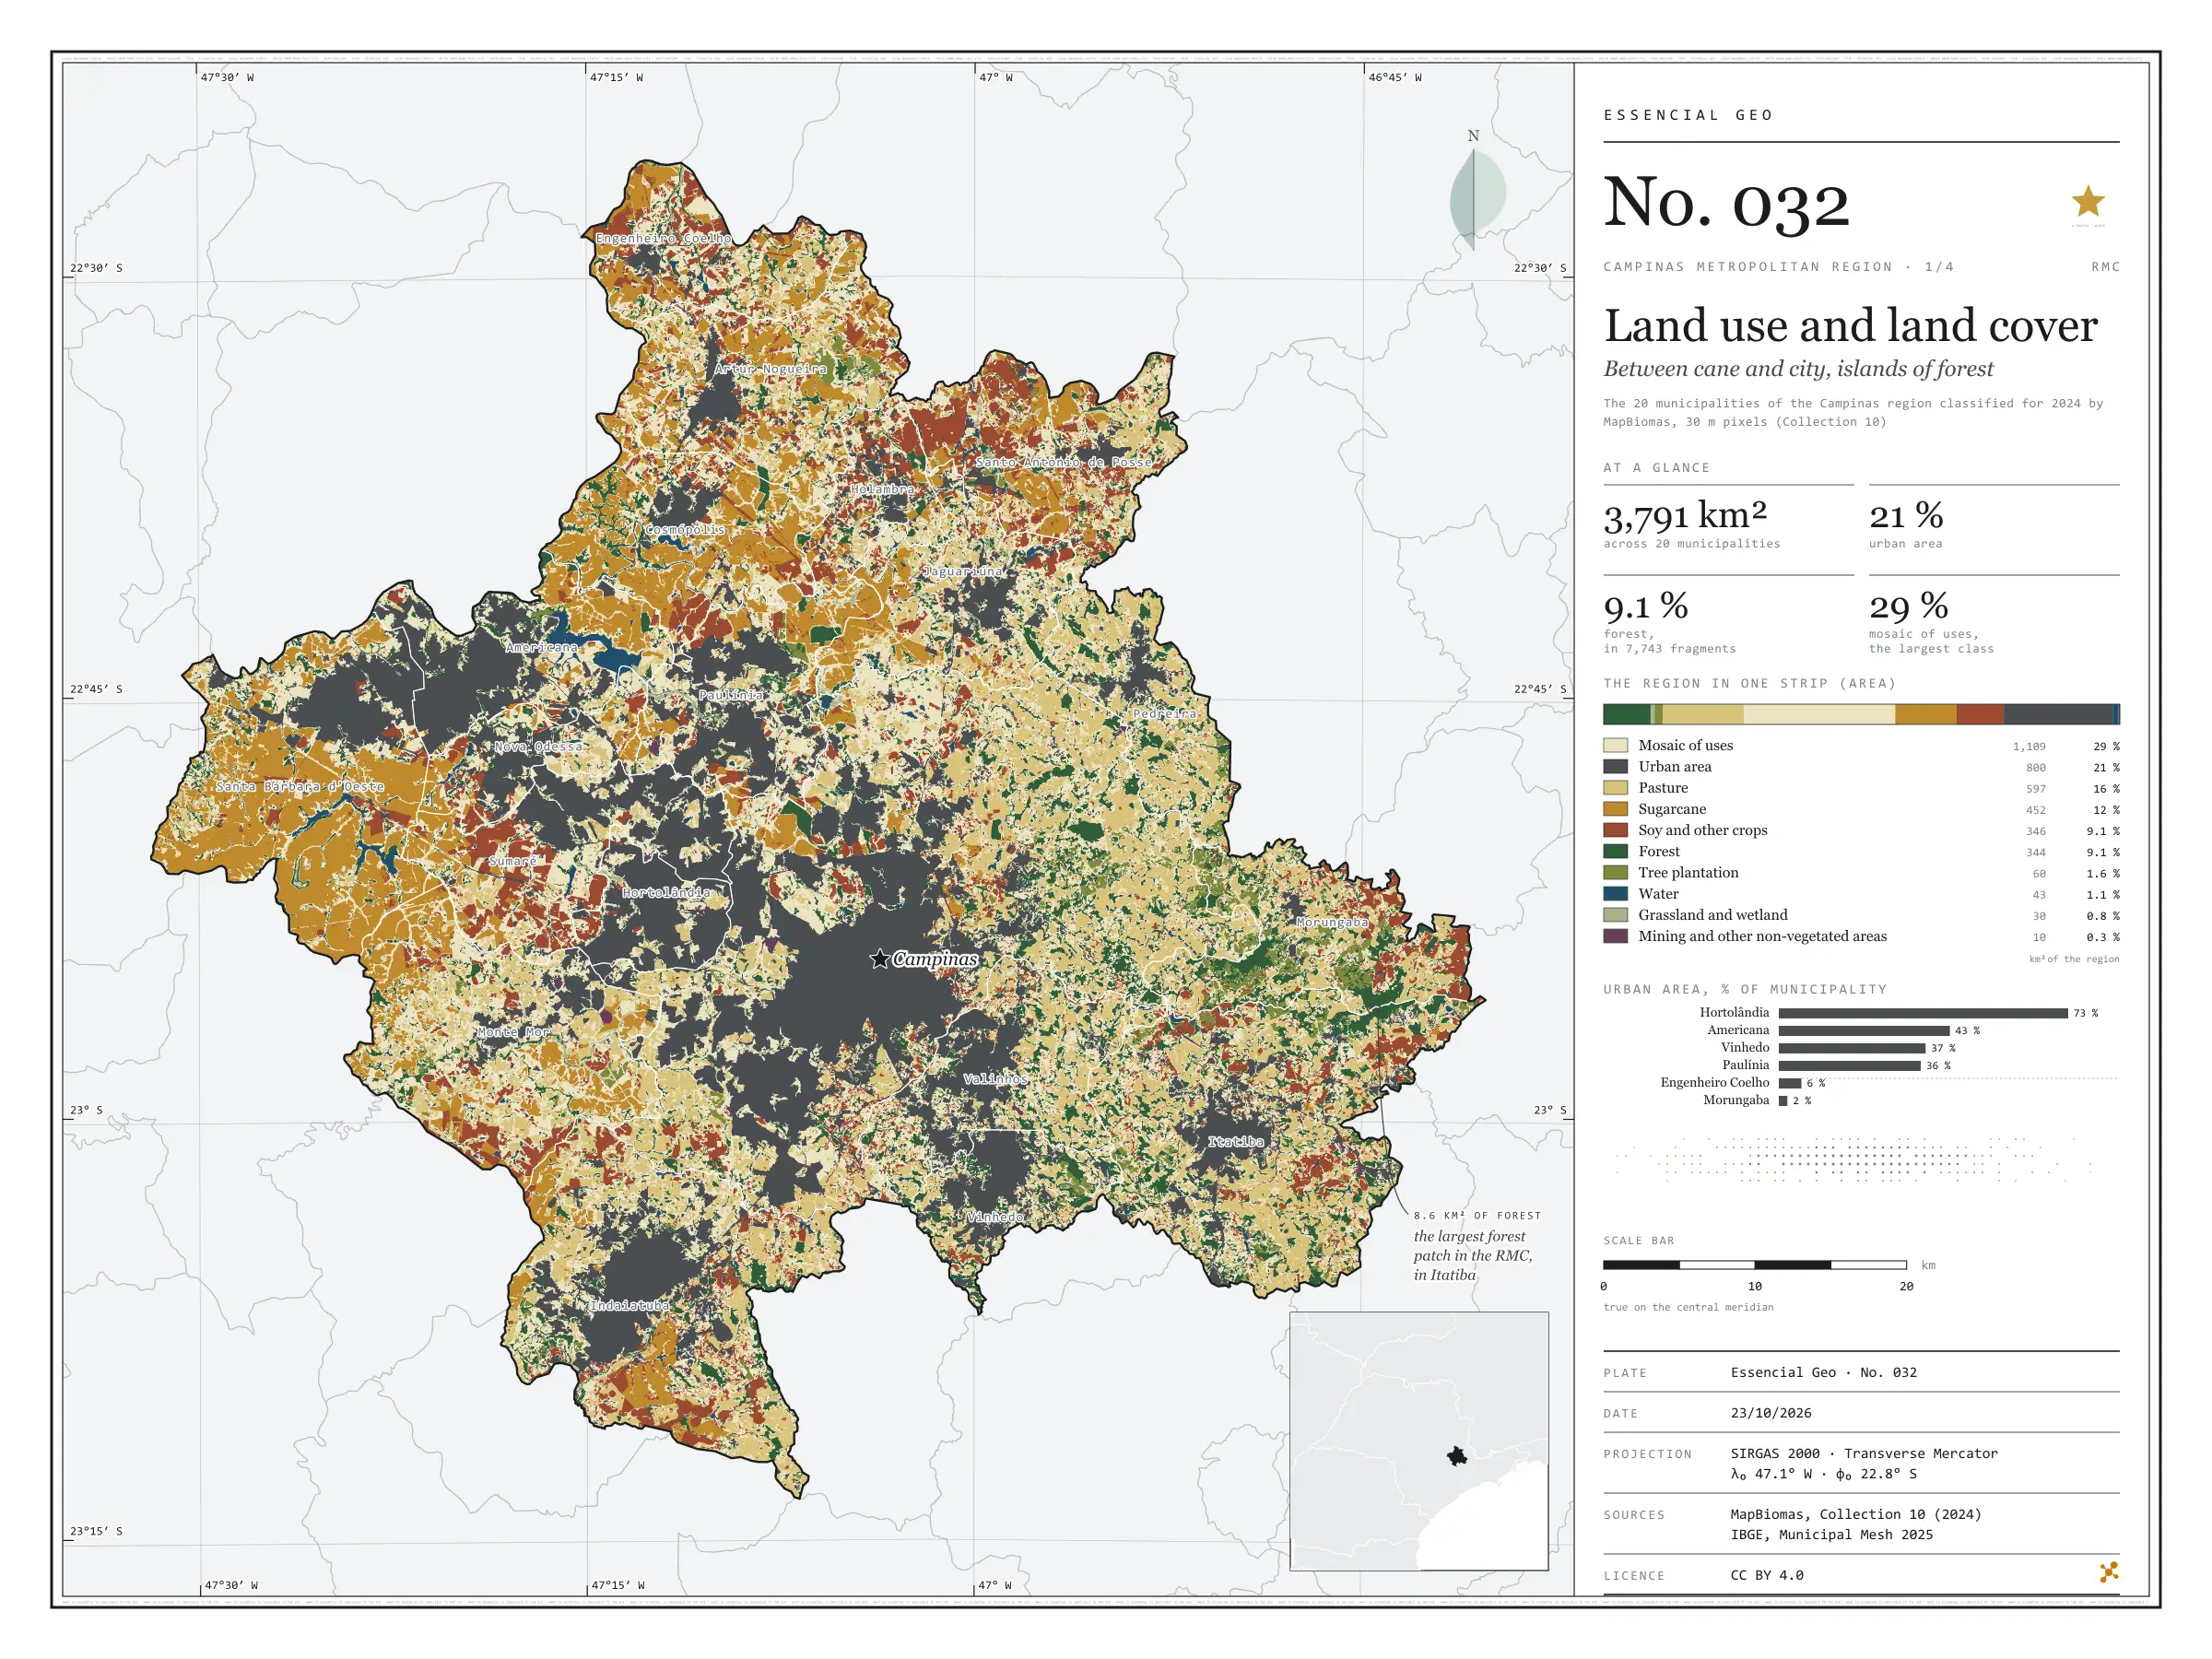
  1. Plate 1/4 · No. 032 Land use and land cover Between cane and city, islands of forest
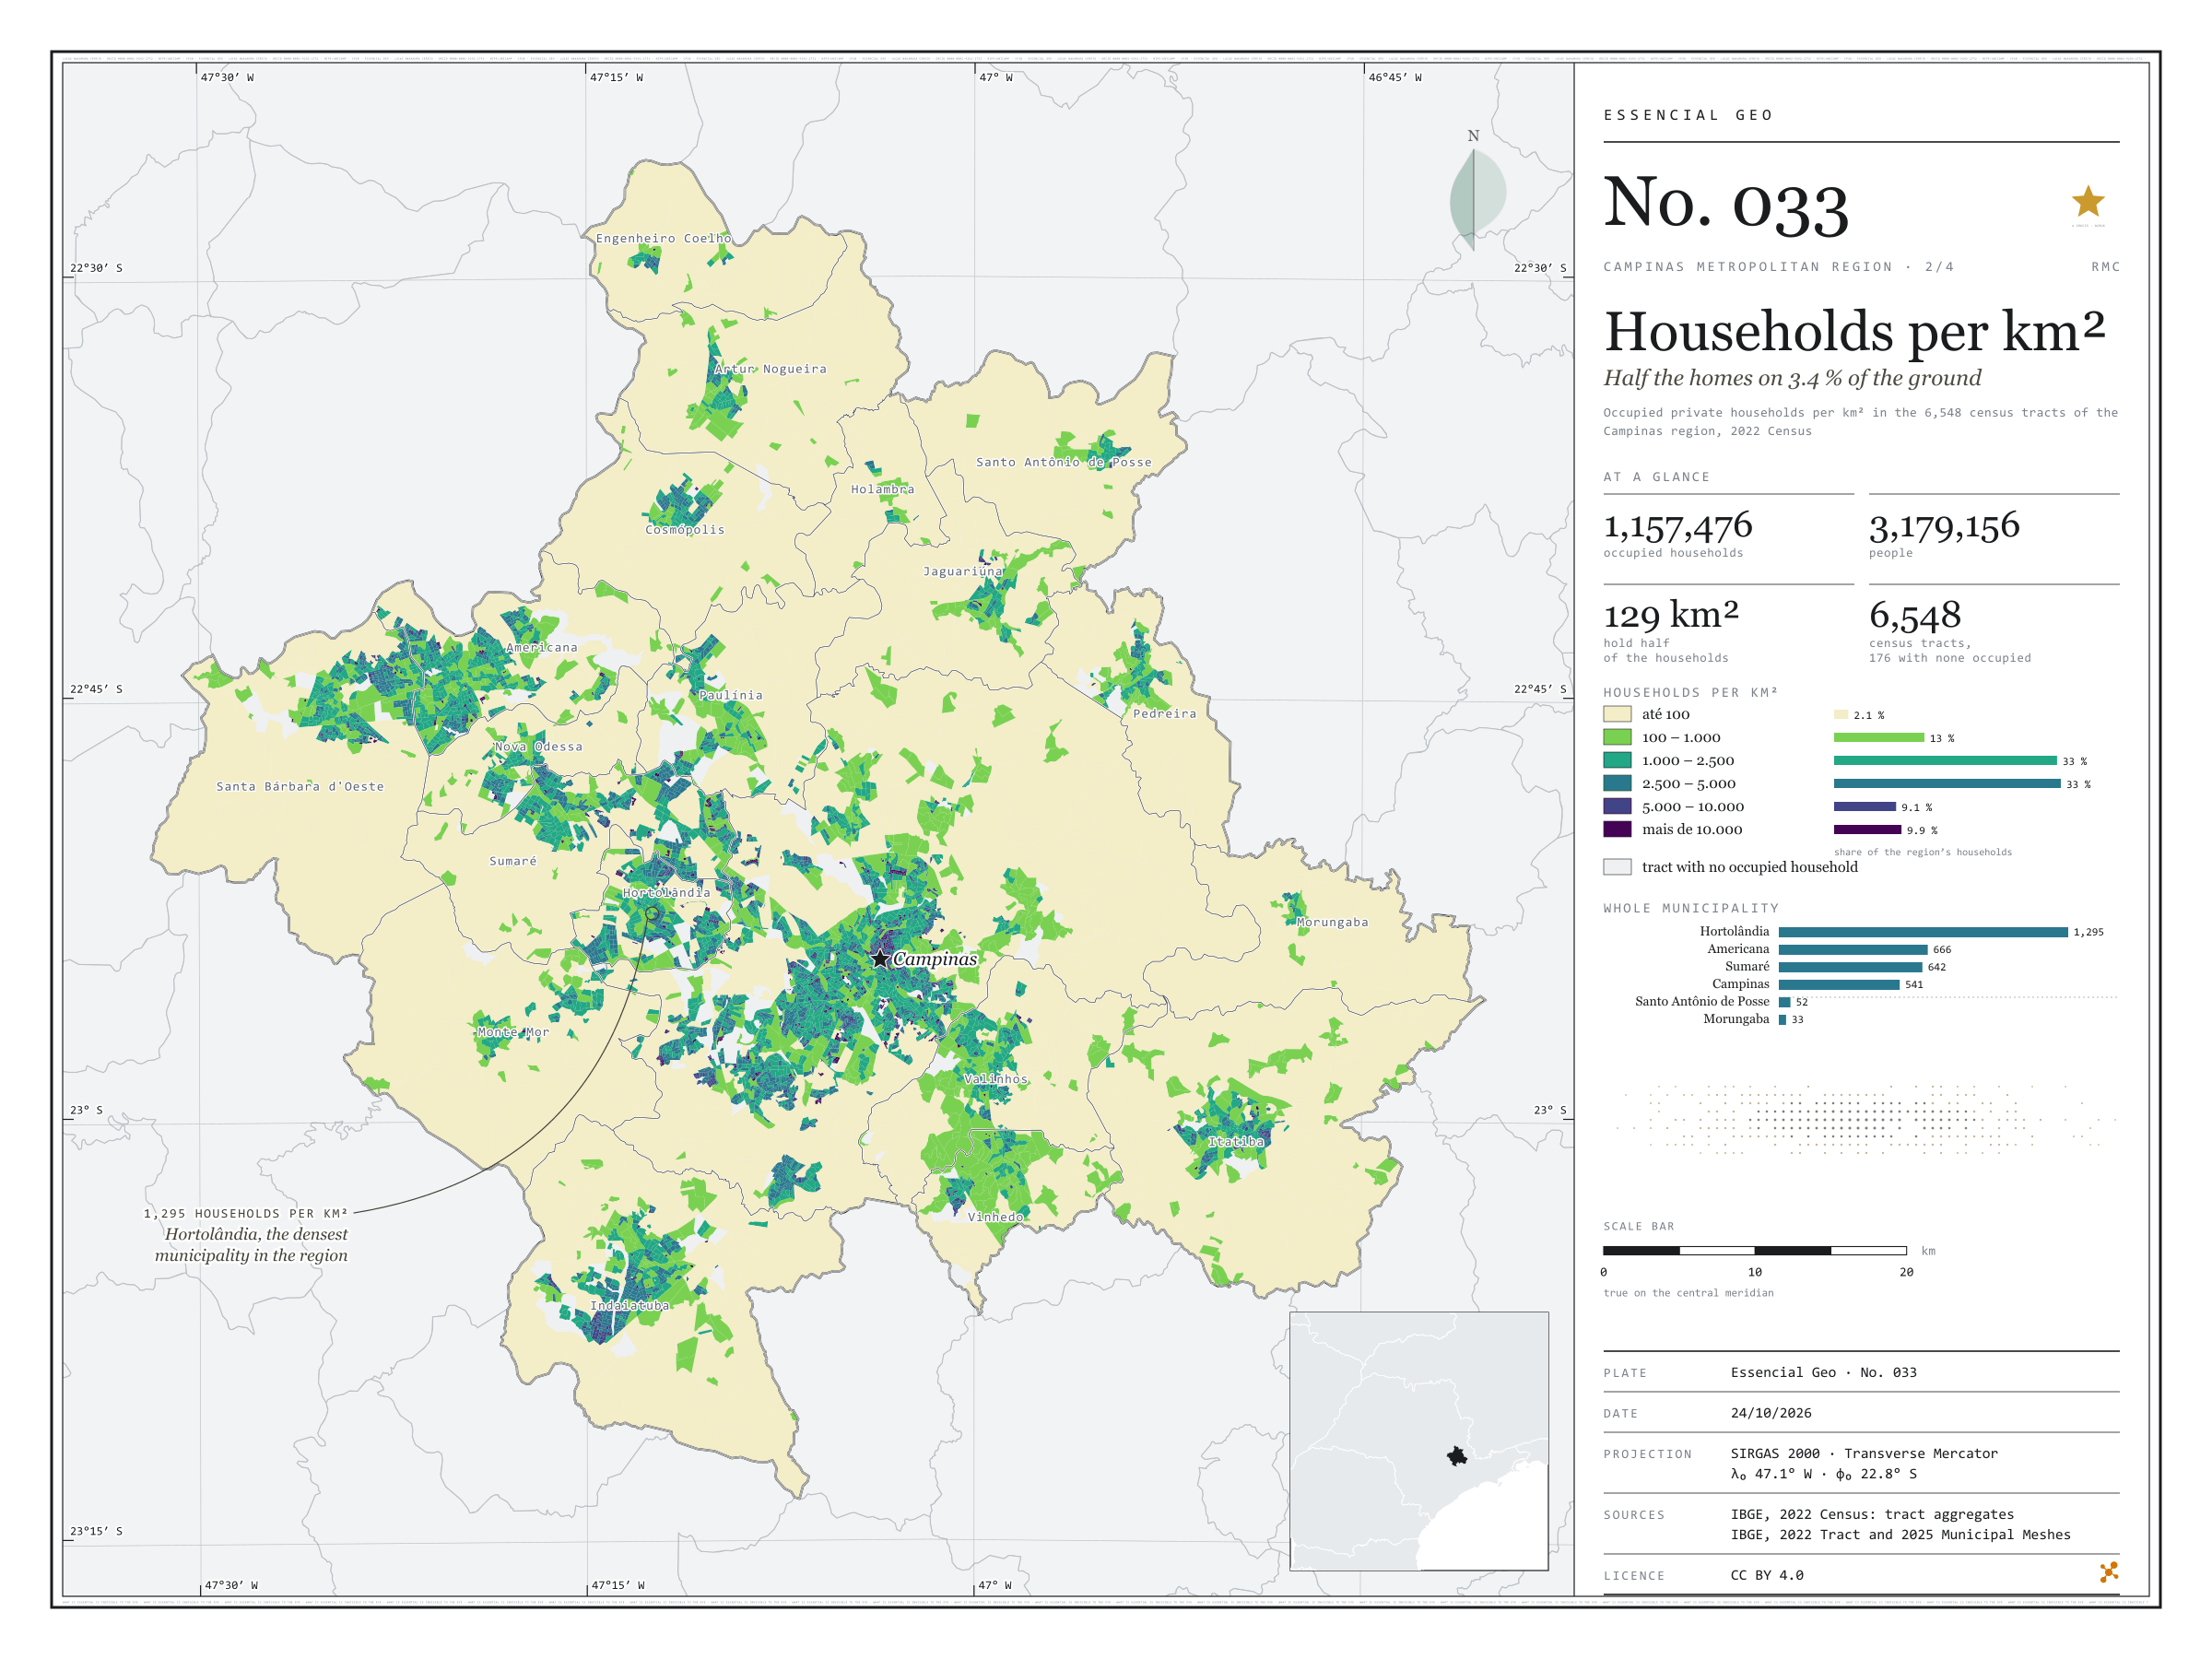
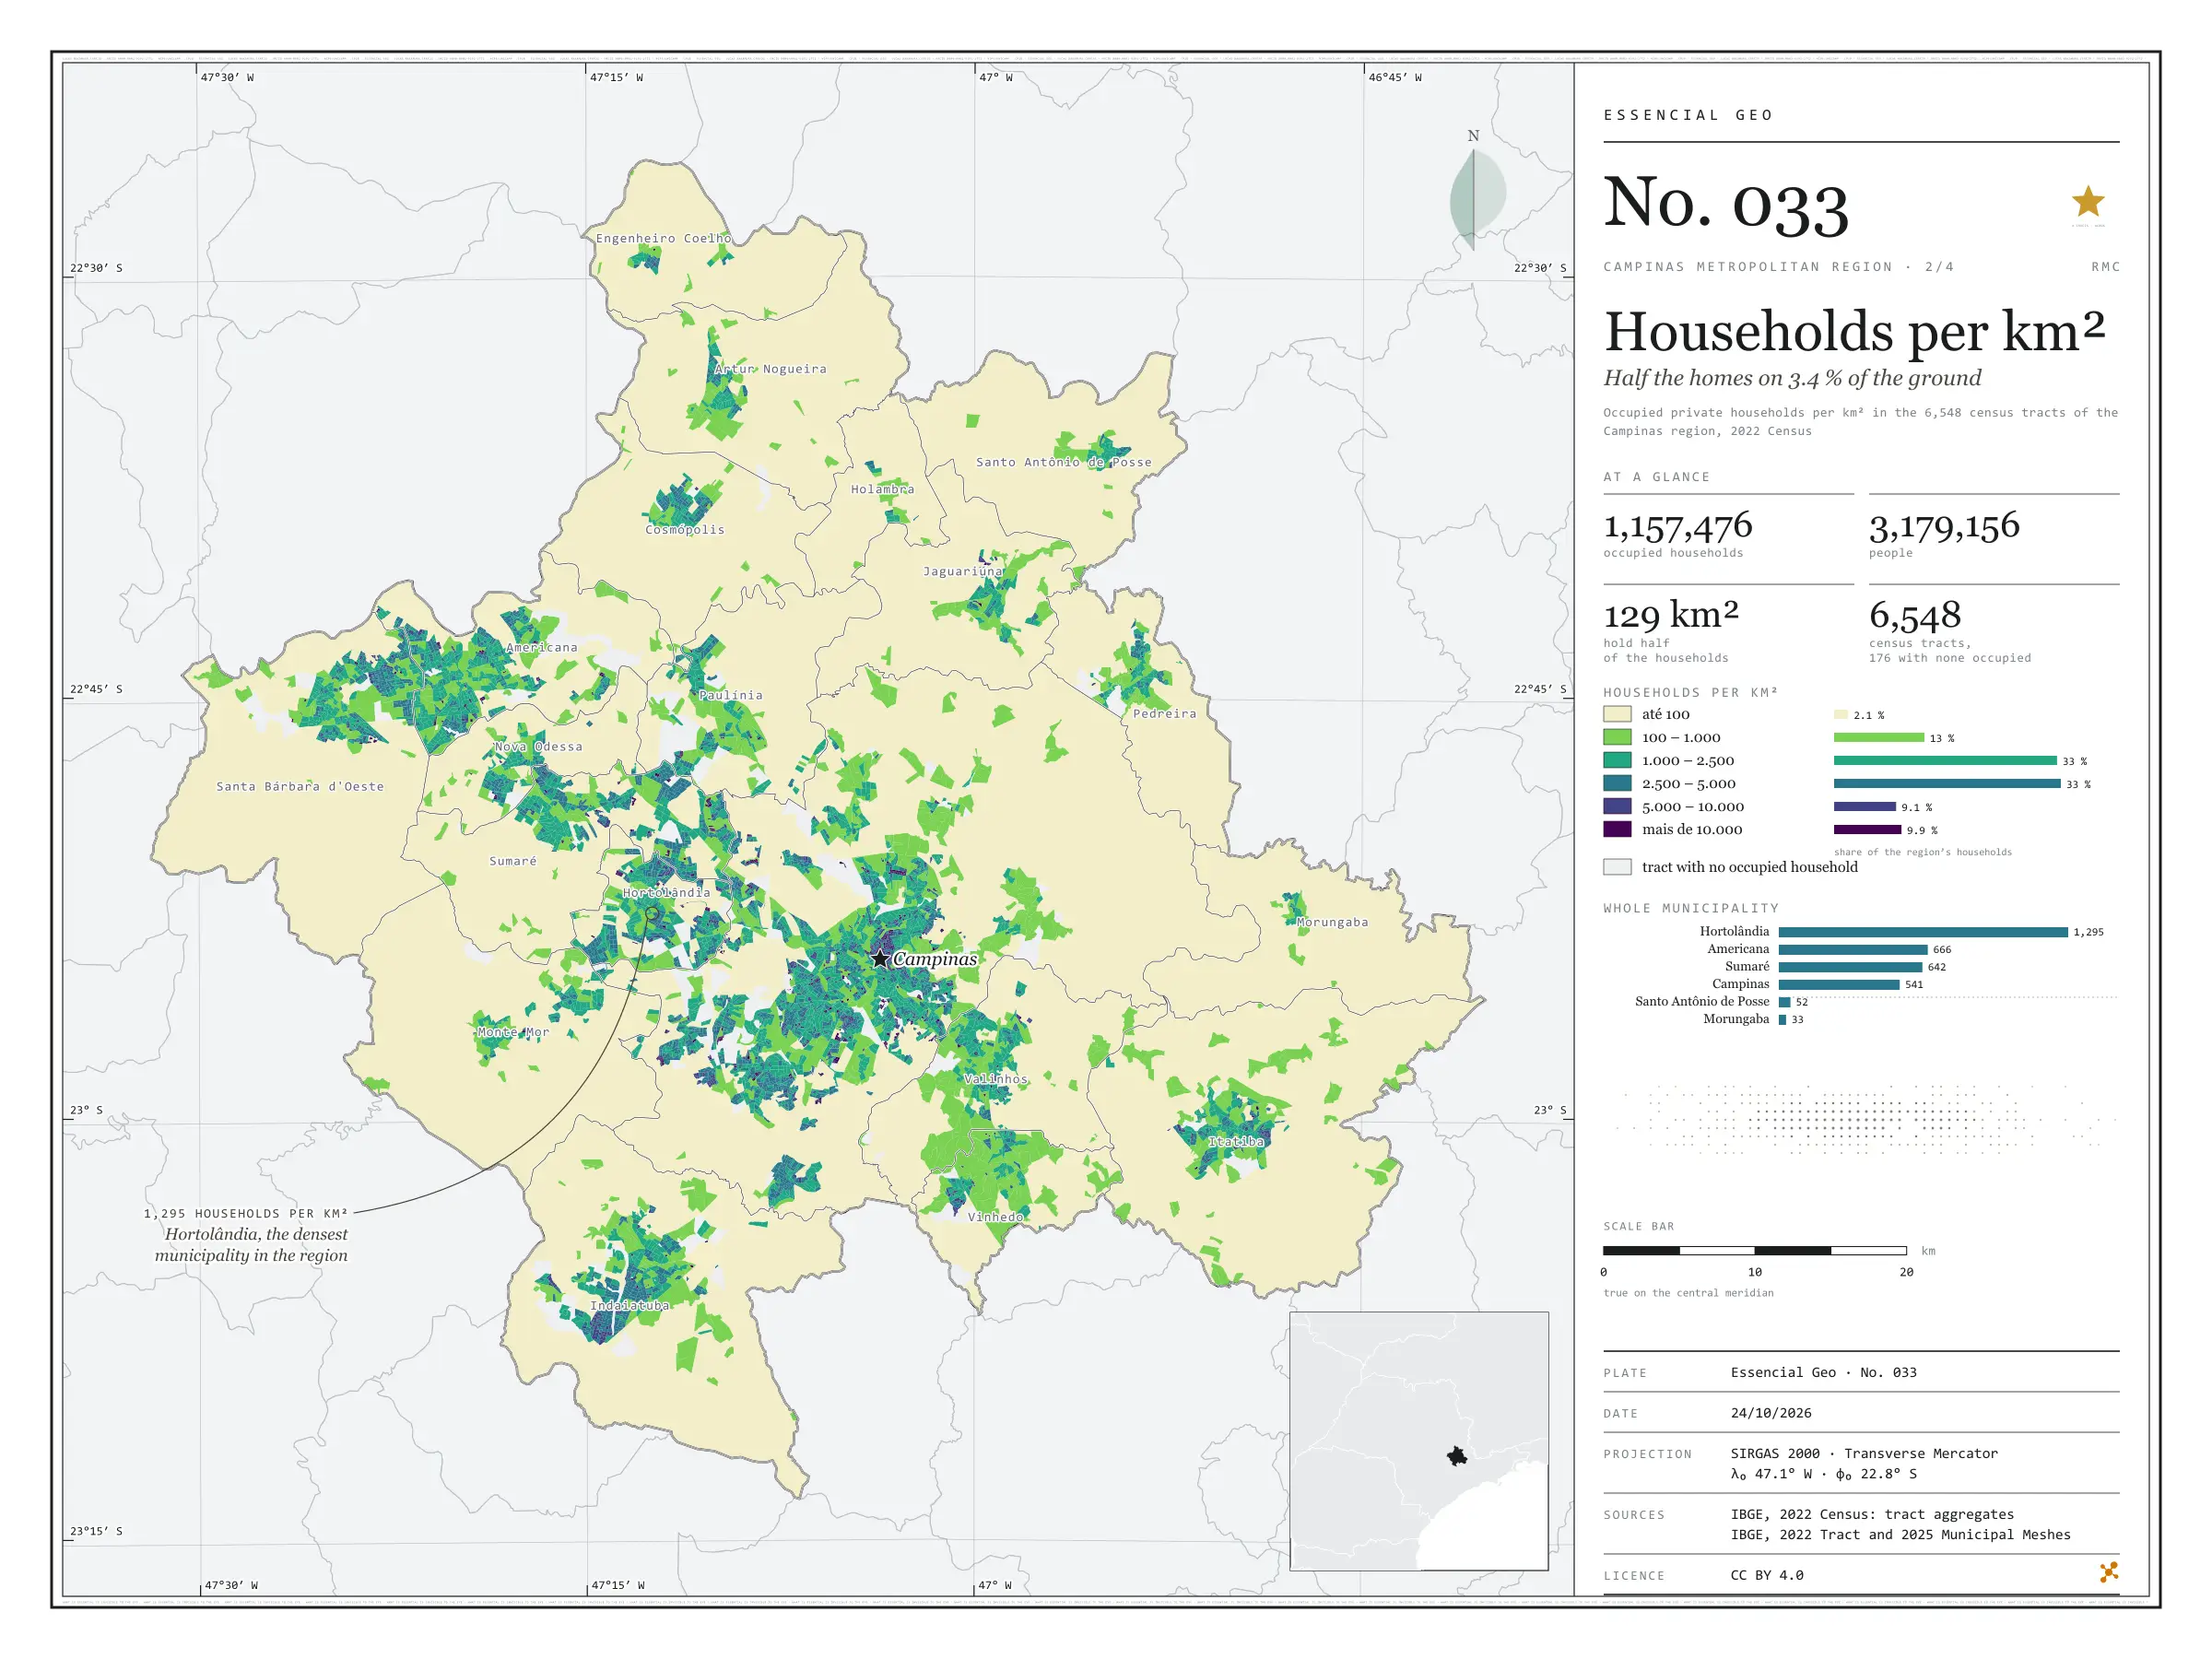
  2. Plate 2/4 · No. 033 Households per km² Half the homes on 3.4 % of the ground
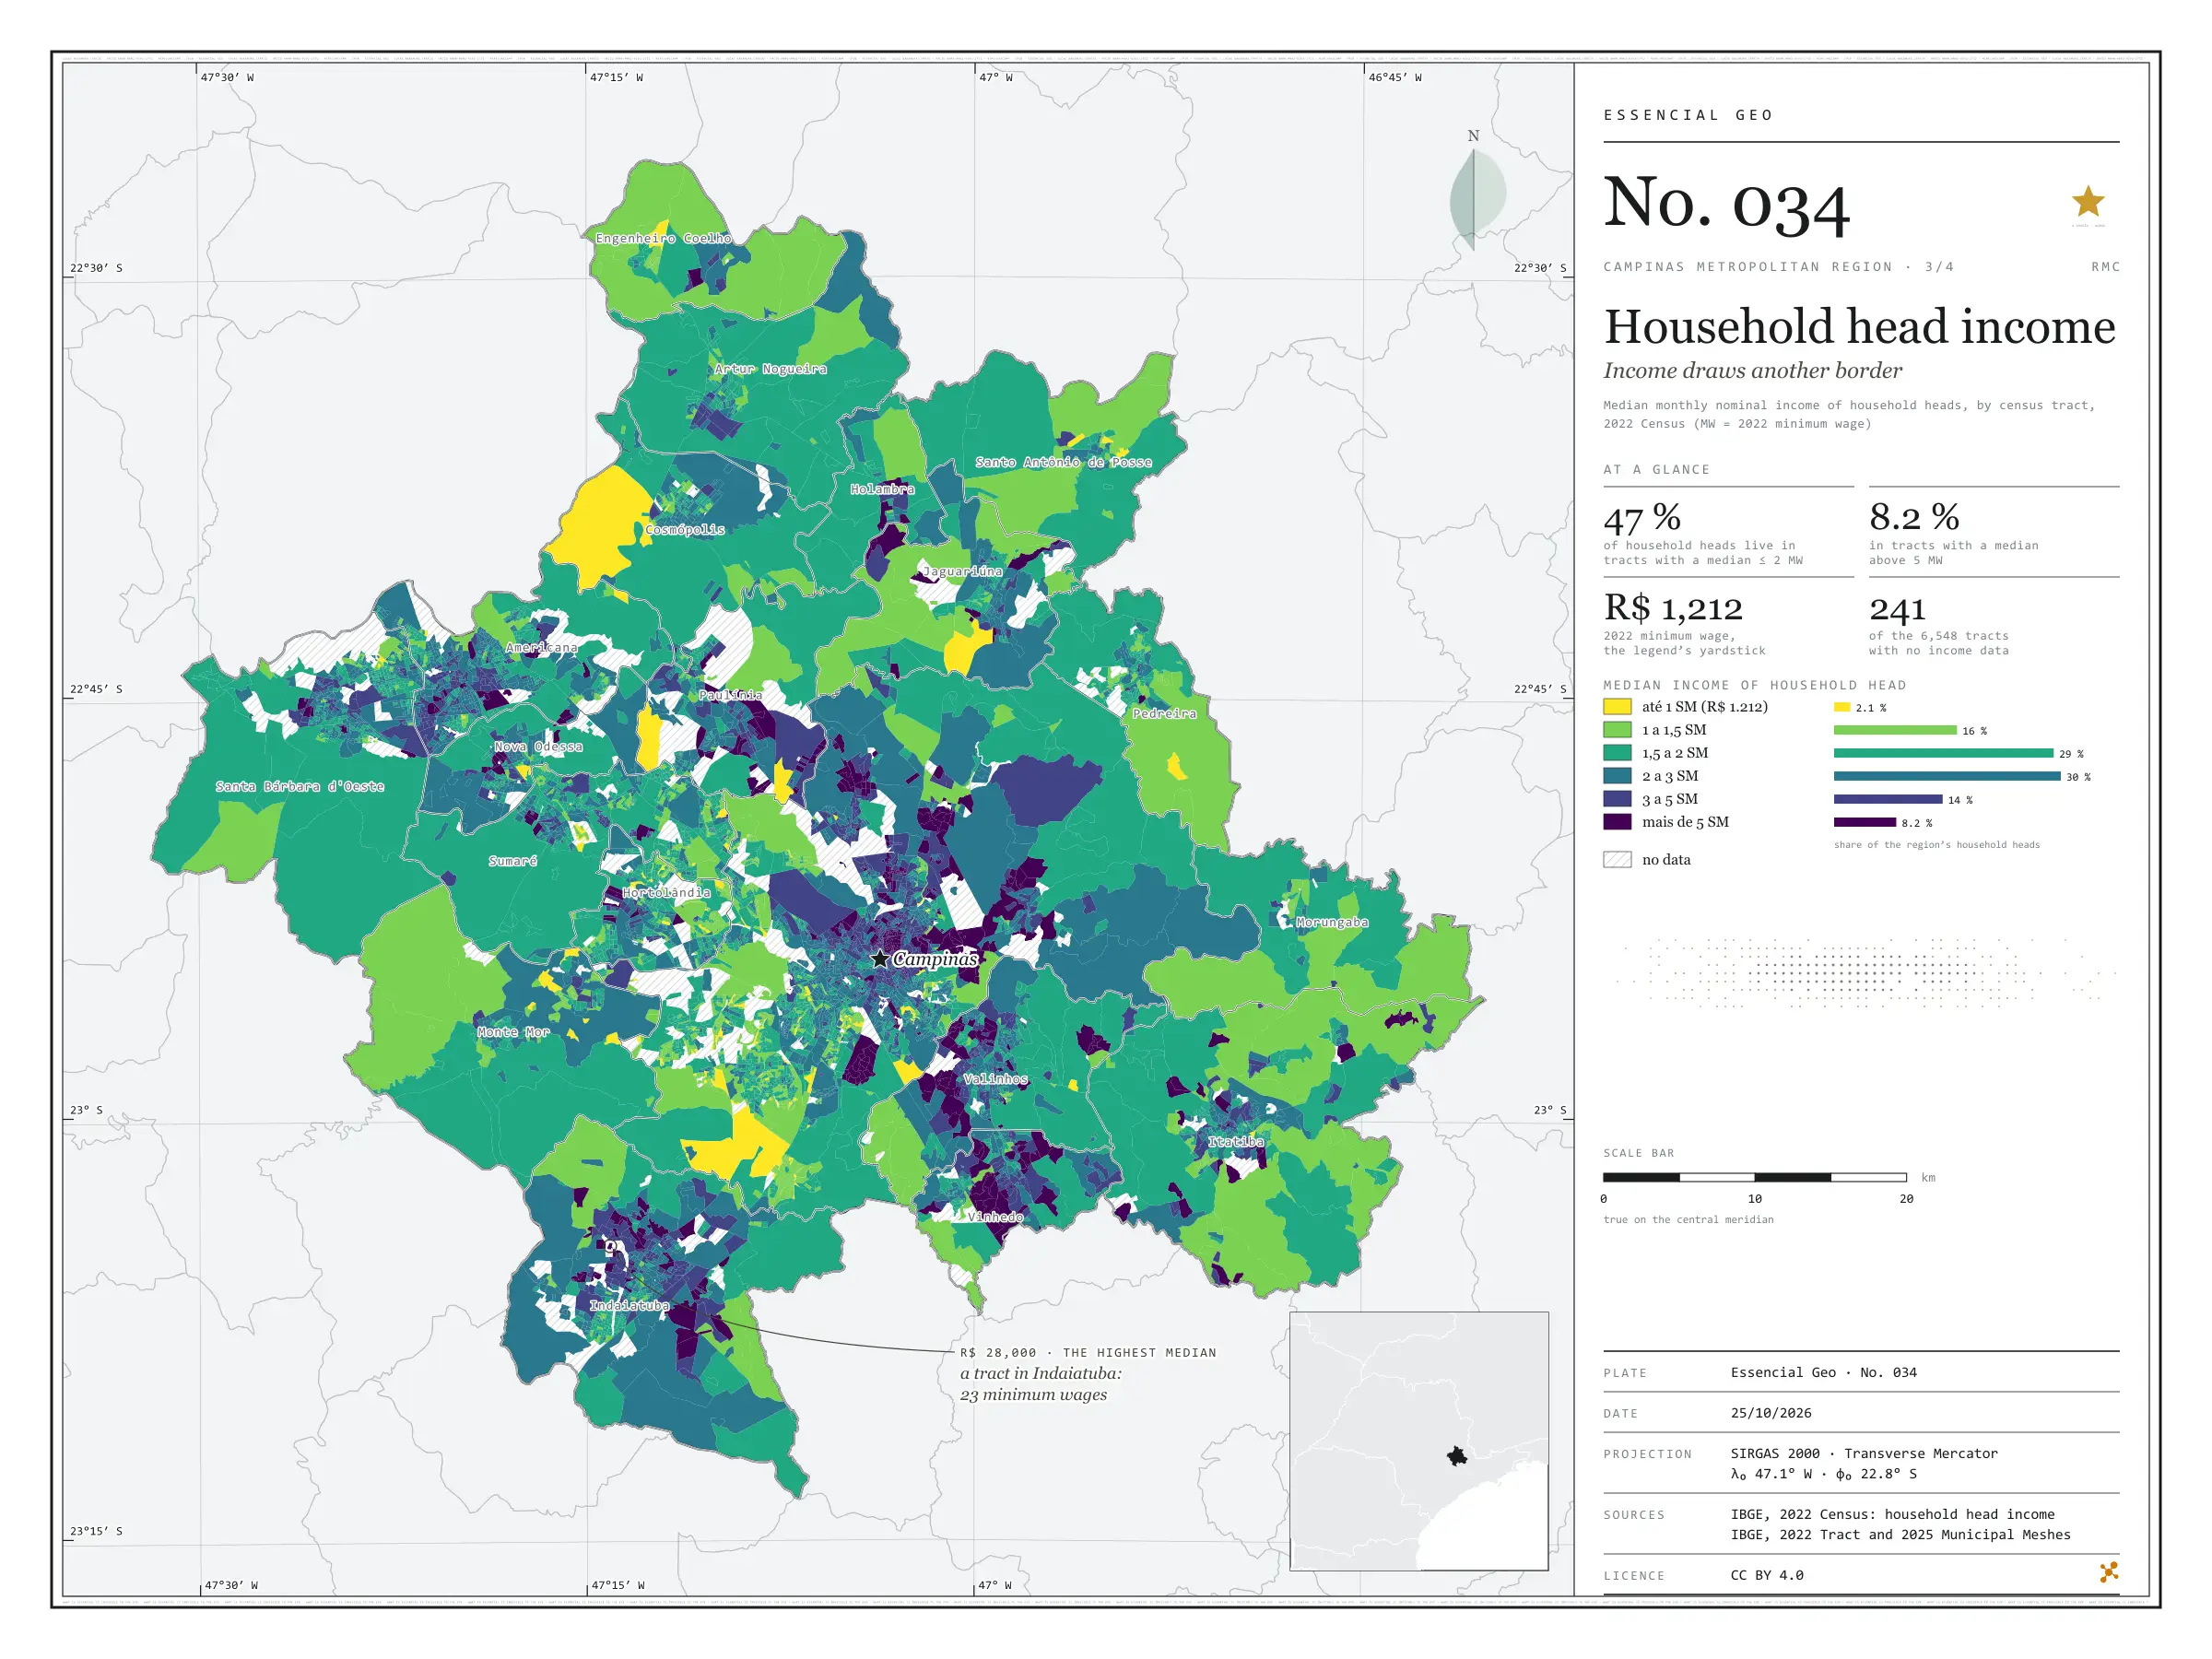
  3. Plate 3/4 · No. 034 Household head income Income draws another border
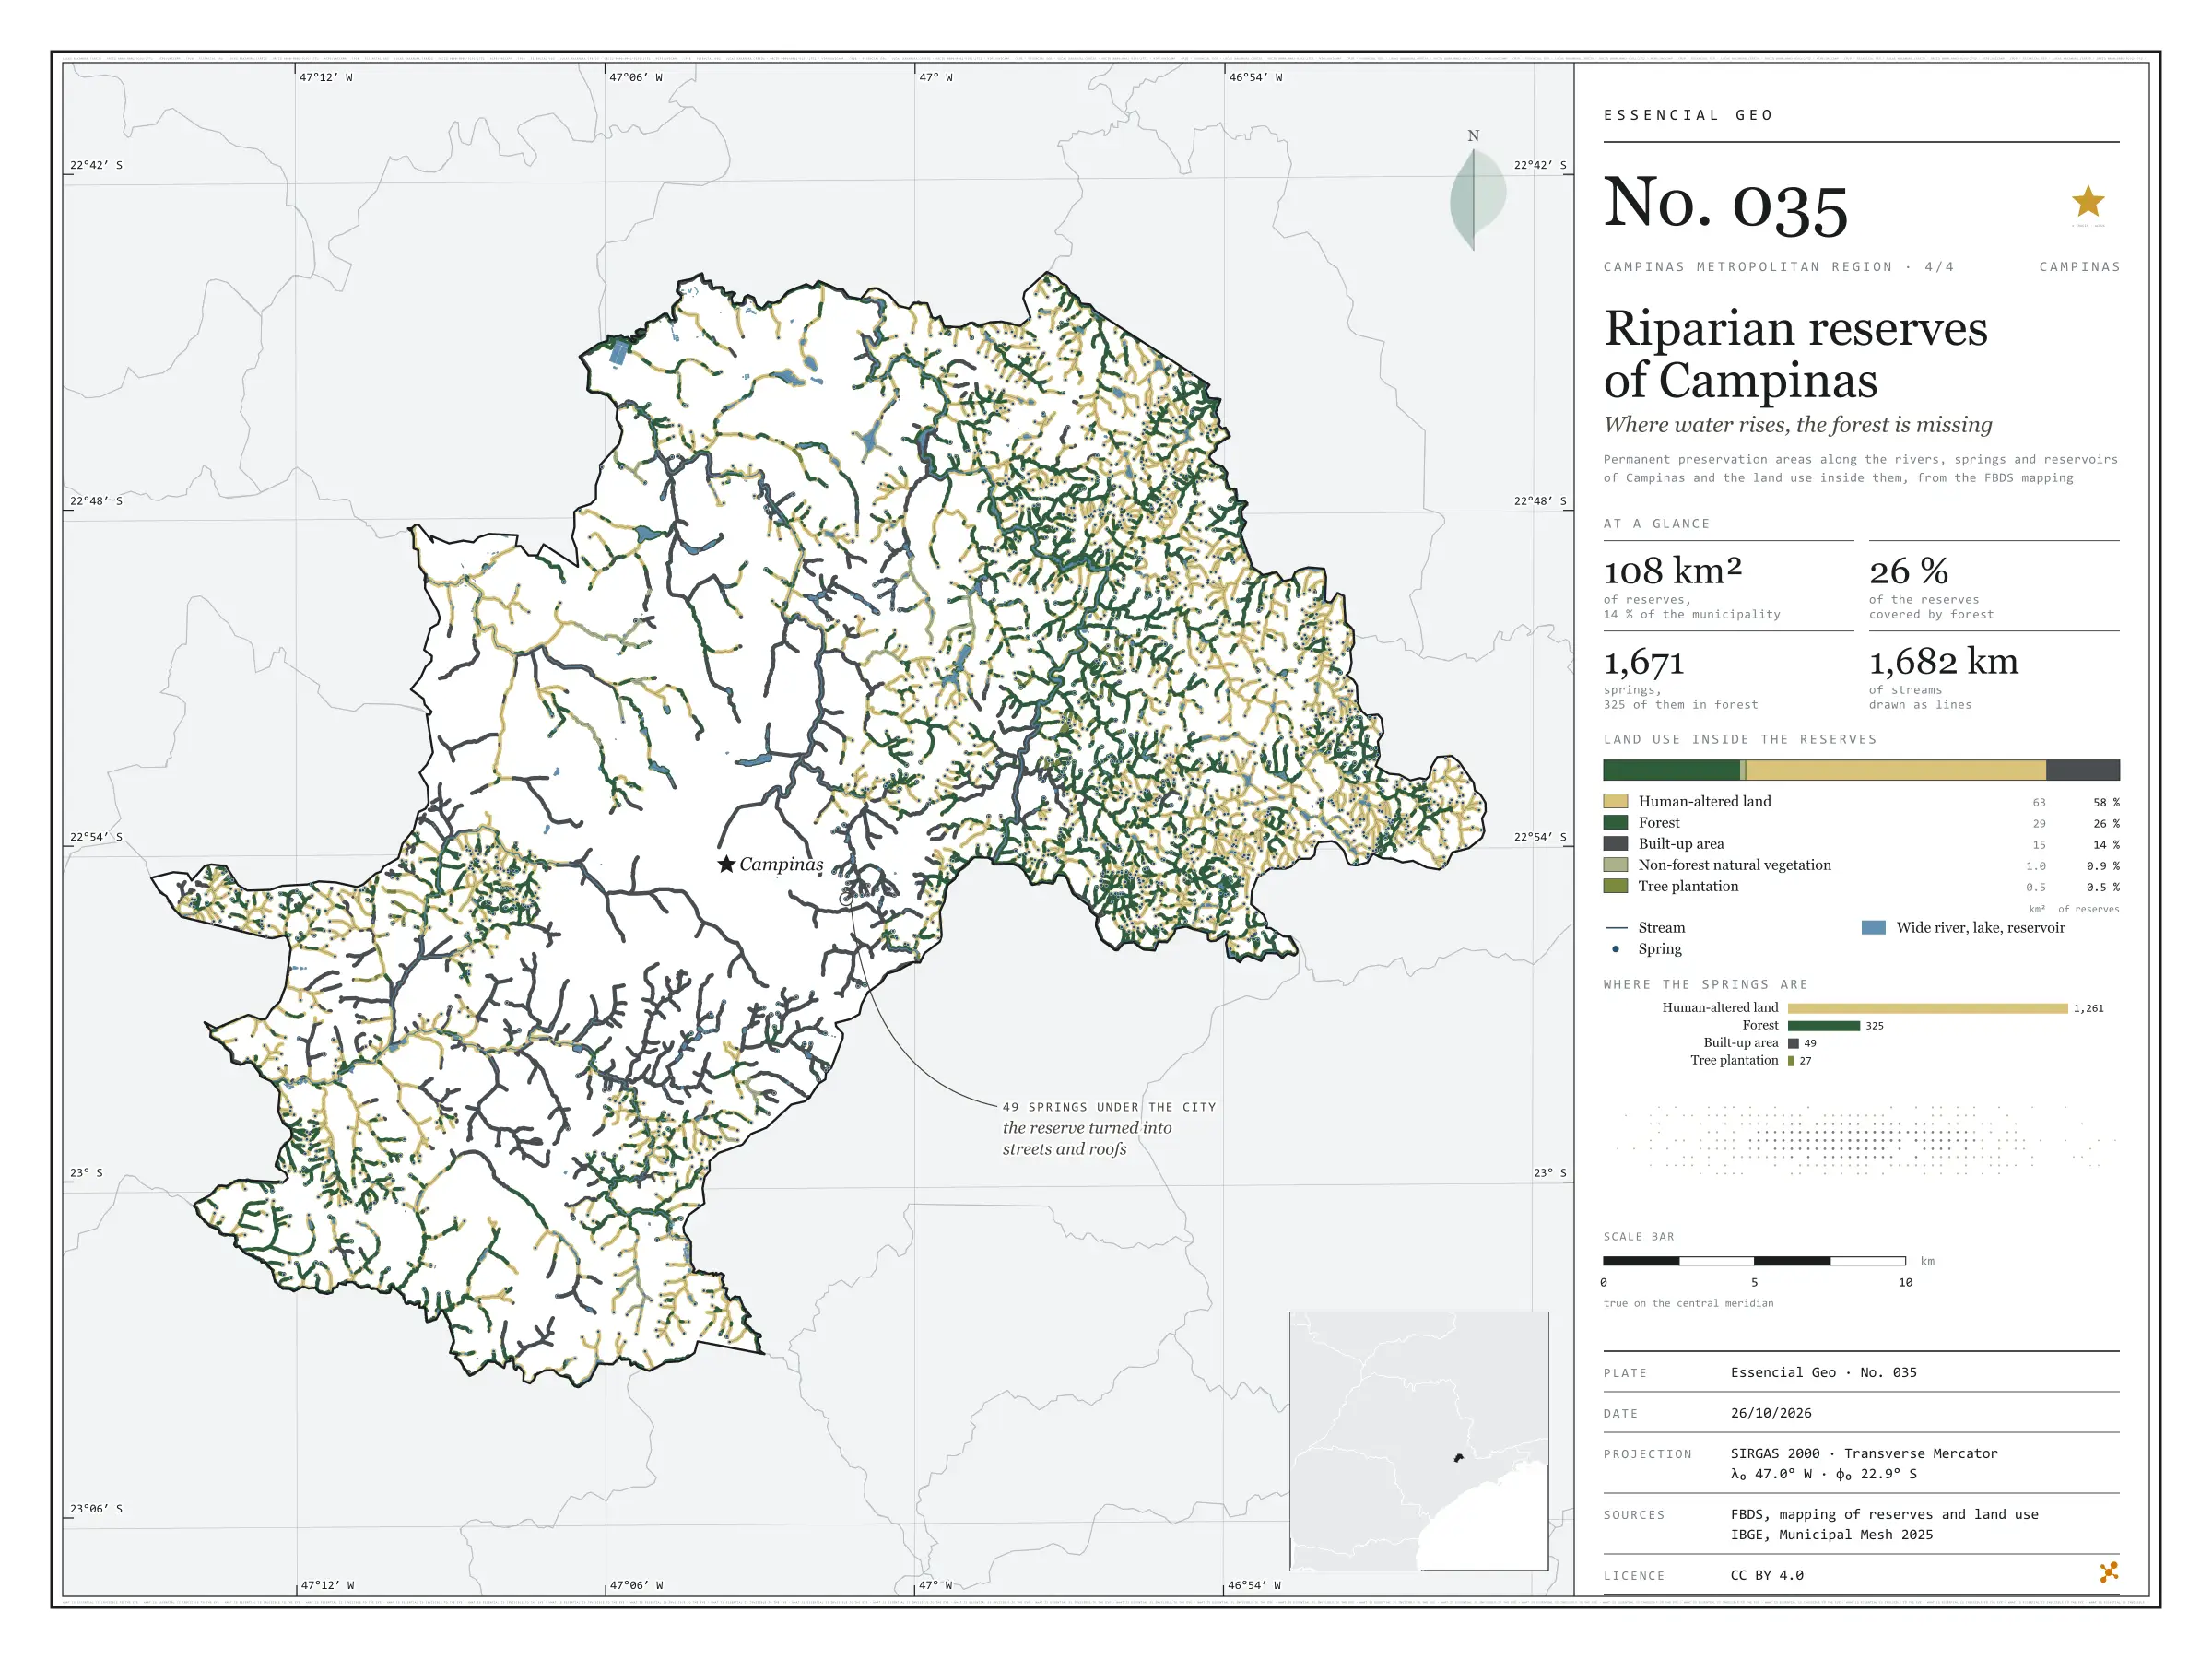
  4. Plate 4/4 · No. 035 Riparian reserves of Campinas Where water rises, the forest is missing
Every plate, in full

No. 032 Land use Campinas Metropolitan Region 1/4

Land use and land cover

Between cane and city, islands of forest

Fig. 032 Campinas Metropolitan Region (SP) EPSG:4674 Source: MapBiomas, IBGE

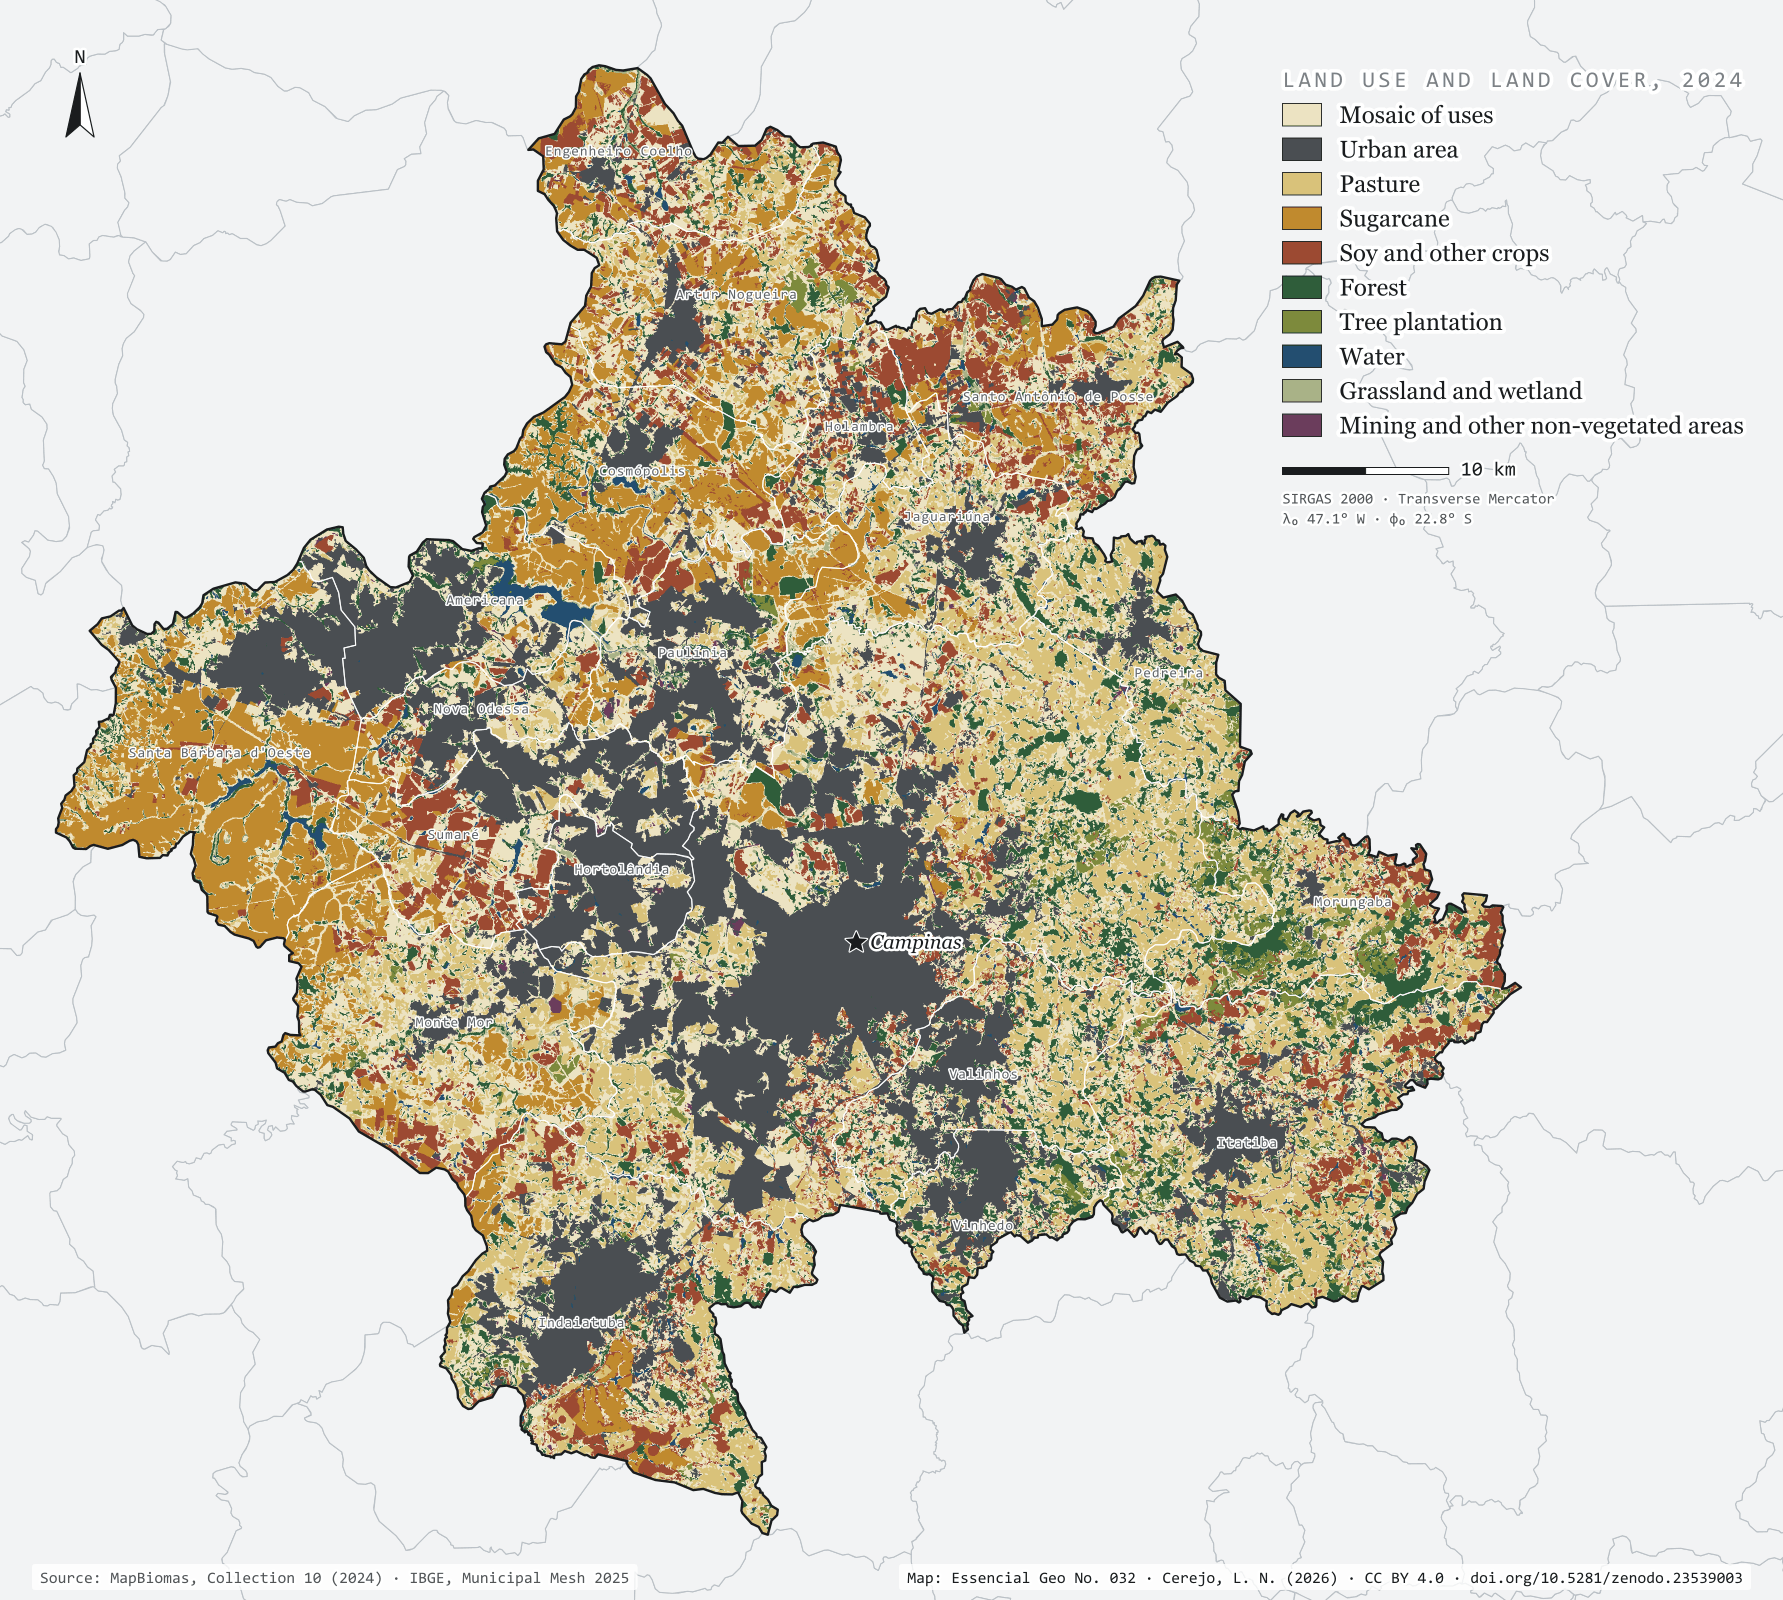
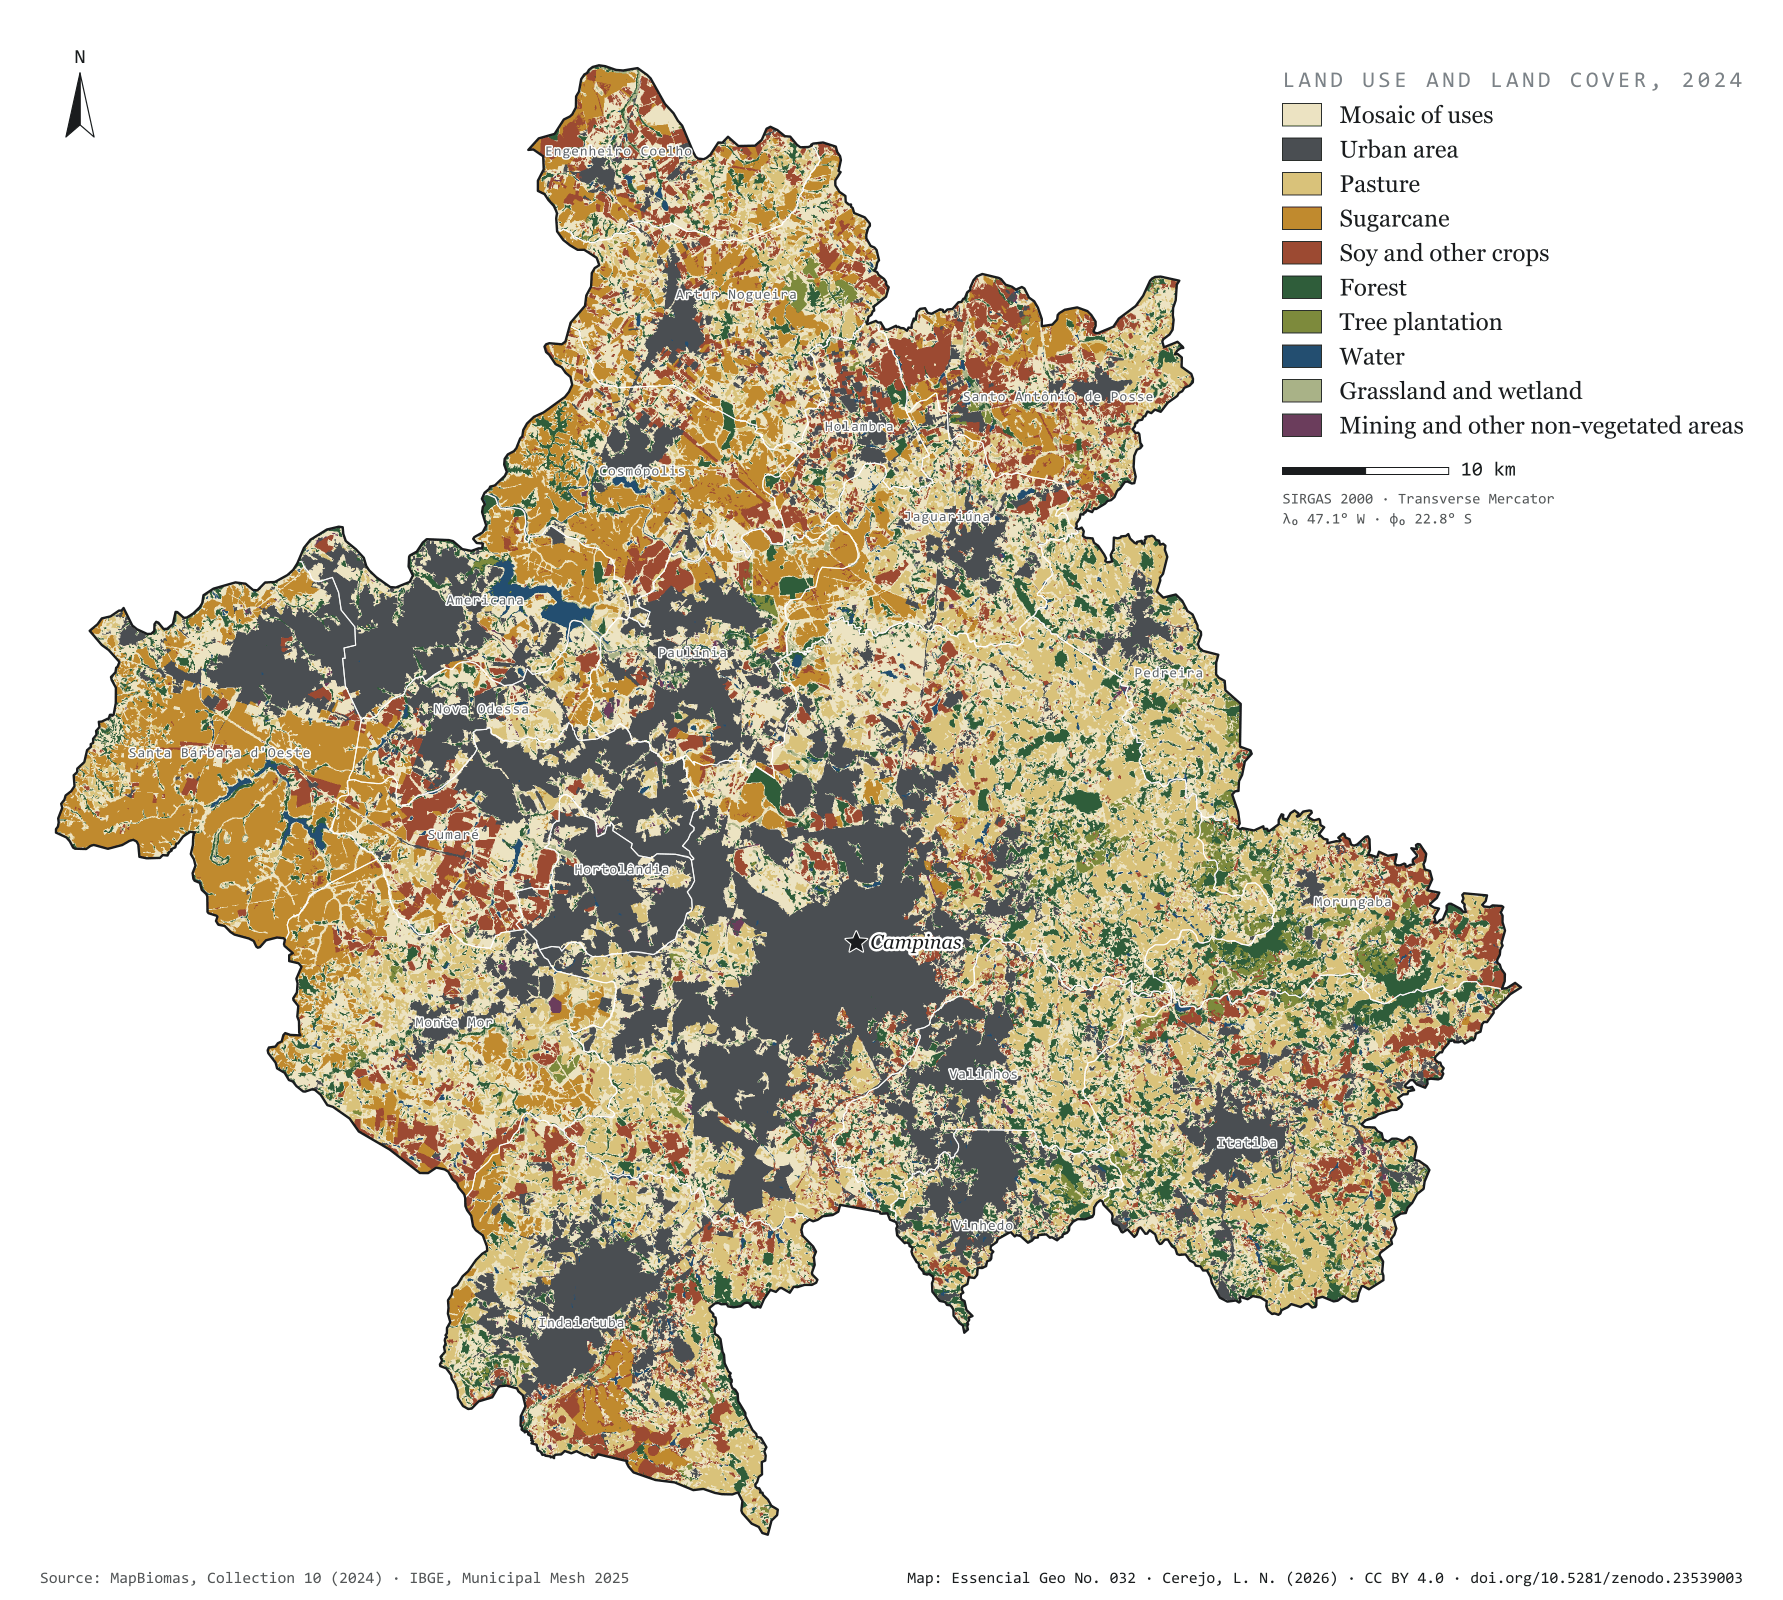
The grey patch of the city already covers 21.1% of the 3,791 km² of the Campinas Metropolitan Region, and 72.6% of Hortolândia. To the west, sugarcane takes half of Santa Bárbara d'Oeste (49.3%) and 39.7% of Cosmópolis. To the east, in the hills of Morungaba, Itatiba and Pedreira, the forest holds out in islands: 7,743 forest fragments, only 31 of them larger than 1 km². The largest, in Itatiba, covers 8.6 km². The most common class is none of these but the mosaic of uses (29.3%): pastures, small fields and country plots that the satellite cannot tell apart at 30 m. First plate of the collection “Campinas Metropolitan Region”.

Technical record · downloads · citation

At a glance

The region by land use and cover class (km²) (km²)
  • Mosaico de usos 29.3%
  • Área urbanizada 21.1%
  • Pastagem 15.7%
  • Cana 11.9%
  • Soja e outras lavouras 9.1%
  • Formação florestal 9.1%
  • Silvicultura 1.6%
  • Água 1.1%
  • Campo e área úmida 0.8%
  • Mineração e outras áreas sem vegetação 0.3%
Urban share of the municipality (top five) (%)
  • Hortolândia 73
  • Americana 43
  • Vinhedo 37
  • Paulínia 36
  • Sumaré 35
Largest forest fragment

8.6 km²

In Itatiba; there are 7,743 fragments, 31 of them over 1 km²

Layers

  • cobertura_2024 raster GeoTIFF of the 2024 classification clipped to the region, with the original MapBiomas codes and the plate’s palette in a .qml style
  • municipios polygon 20 municipalities: area and km² and % of each of the ten classes
  • limite_rmc polygon Outline of the region

Metadata

Extent
Campinas Metropolitan Region (SP)
CRS / Projection
SIRGAS 2000 (EPSG:4674)
EPSG:4674
Software
Python · rasterio · GeoPandas · SciPy · GDAL · QGIS · Node.js · d3-geo
Method
MapBiomas Collection 10 classification for 2024, 30 m pixels, grouped into ten classes; each pixel’s area measured on the ellipsoid and summed for the region and for each municipality.
Version
v1.0.0
Licence
CC BY 4.0

Downloads

Figure to reuse

The map without a frame, with legend, scale, reference system and credit written on it: ready for papers, lectures and slides. In two versions: with the basemap (neighbours and sea) or only the mapped area, on white.

Point a camera at it to open this page.

How to cite

Cerejo, L. N. (2026). Uso e cobertura da terra: entre a cana e a cidade, ilhas de mata [Land use and land cover: Between cane and city, islands of forest] (Version 1.0.0) [Data set]. Zenodo. https://doi.org/10.5281/zenodo.23539003

No. 033 Census · income Campinas Metropolitan Region 2/4

Households per km²

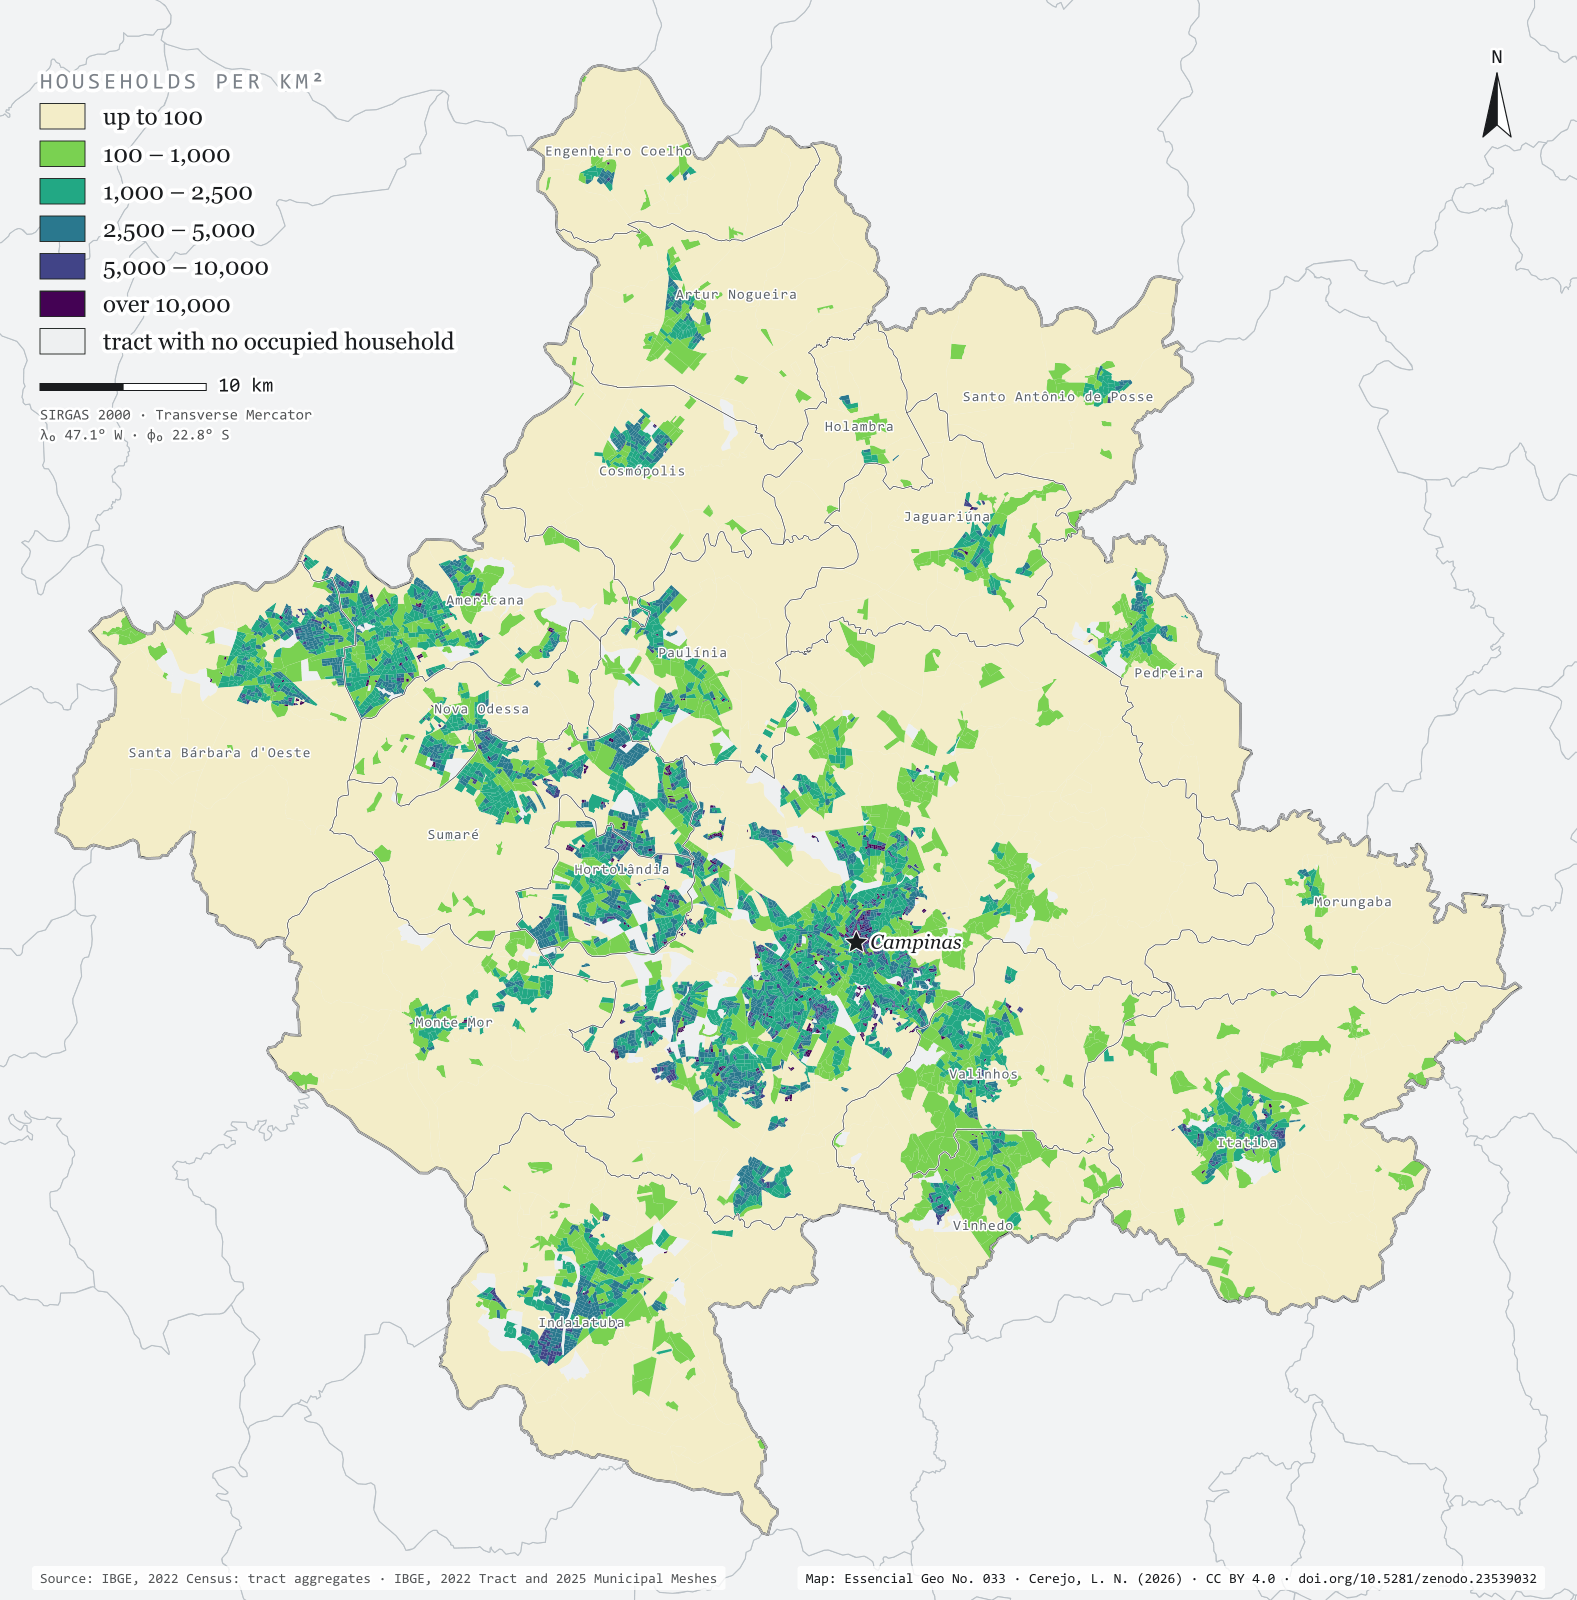
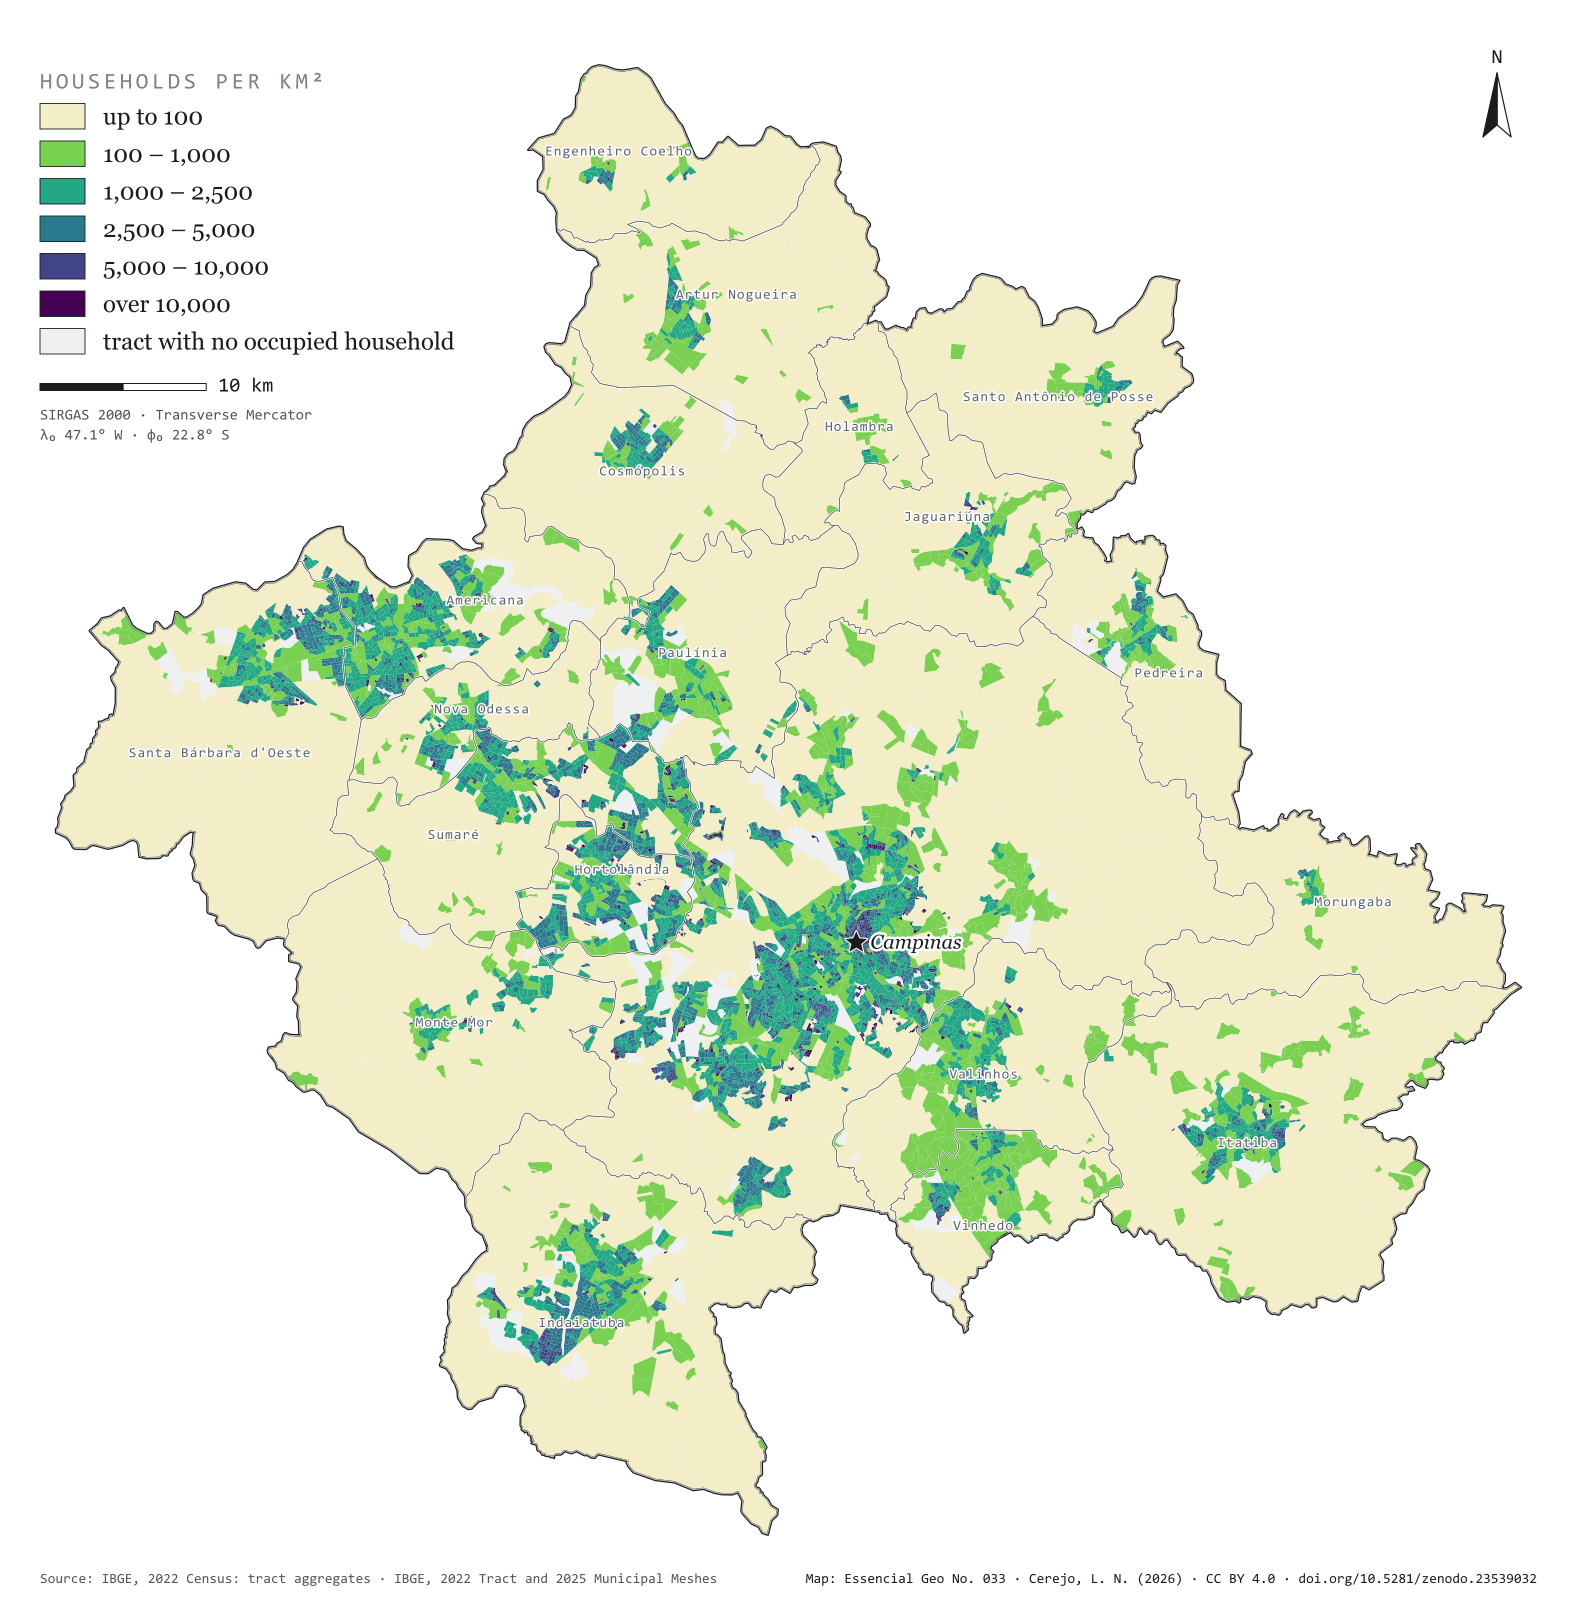
Half the homes on 3.4 % of the ground

Fig. 033 Campinas Metropolitan Region (SP) EPSG:4674 Source: IBGE

The 2022 Census counted 1,157,476 occupied households in the 20 municipalities of the Campinas Metropolitan Region, home to 3,179,156 people. Half of those homes fit into 129 km², 3.4% of the region’s area. The map colours each of the 6,548 census tracts by households per km² and shows the city in layers: central Campinas and the neighbourhoods of Sumaré, Hortolândia and Americana above 5,000, the fringe of housing estates between 1,000 and 5,000 and, all around, the countryside, below 100. Hortolândia is the densest municipality, with 1,295 households per km²; Morungaba the least dense, with 33. Second plate of the collection “Campinas Metropolitan Region”.

Technical record · downloads · citation

At a glance

The region’s households, by tract density (households per km²) (households)
  • até 100 2.1%
  • 100 – 1.000 13.2%
  • 1.000 – 2.500 32.6%
  • 2.500 – 5.000 33.2%
  • 5.000 – 10.000 9.1%
  • mais de 10.000 9.9%
Households per km², whole municipality (five densest) (households/km²)
  • Hortolândia 1,295
  • Americana 666
  • Sumaré 642
  • Campinas 541
  • Vinhedo 339
Area holding half the households

129 km²

3.4% of the region’s 3,791 km²

Layers

  • setores polygon 6,548 census tracts: urban/rural status, area, people, occupied households and households per km²
  • municipios polygon 20 municipalities: households, people, area, tracts and households per km²

Metadata

Extent
Campinas Metropolitan Region (SP)
CRS / Projection
SIRGAS 2000 (EPSG:4674)
EPSG:4674
Software
Python · GeoPandas · GDAL · QGIS · Node.js · d3-geo
Method
Occupied private households in each 2022 Census tract divided by the tract’s area, in six fixed-break classes.
Version
v1.0.0
Licence
CC BY 4.0

Downloads

Figure to reuse

The map without a frame, with legend, scale, reference system and credit written on it: ready for papers, lectures and slides. In two versions: with the basemap (neighbours and sea) or only the mapped area, on white.

Point a camera at it to open this page.

How to cite

Cerejo, L. N. (2026). Domicílios por km²: metade dos lares em 3,4 % do chão [Households per km²: Half the homes on 3.4 % of the ground] (Version 1.0.0) [Data set]. Zenodo. https://doi.org/10.5281/zenodo.23539032

No. 034 Census · income Campinas Metropolitan Region 3/4

Household head income

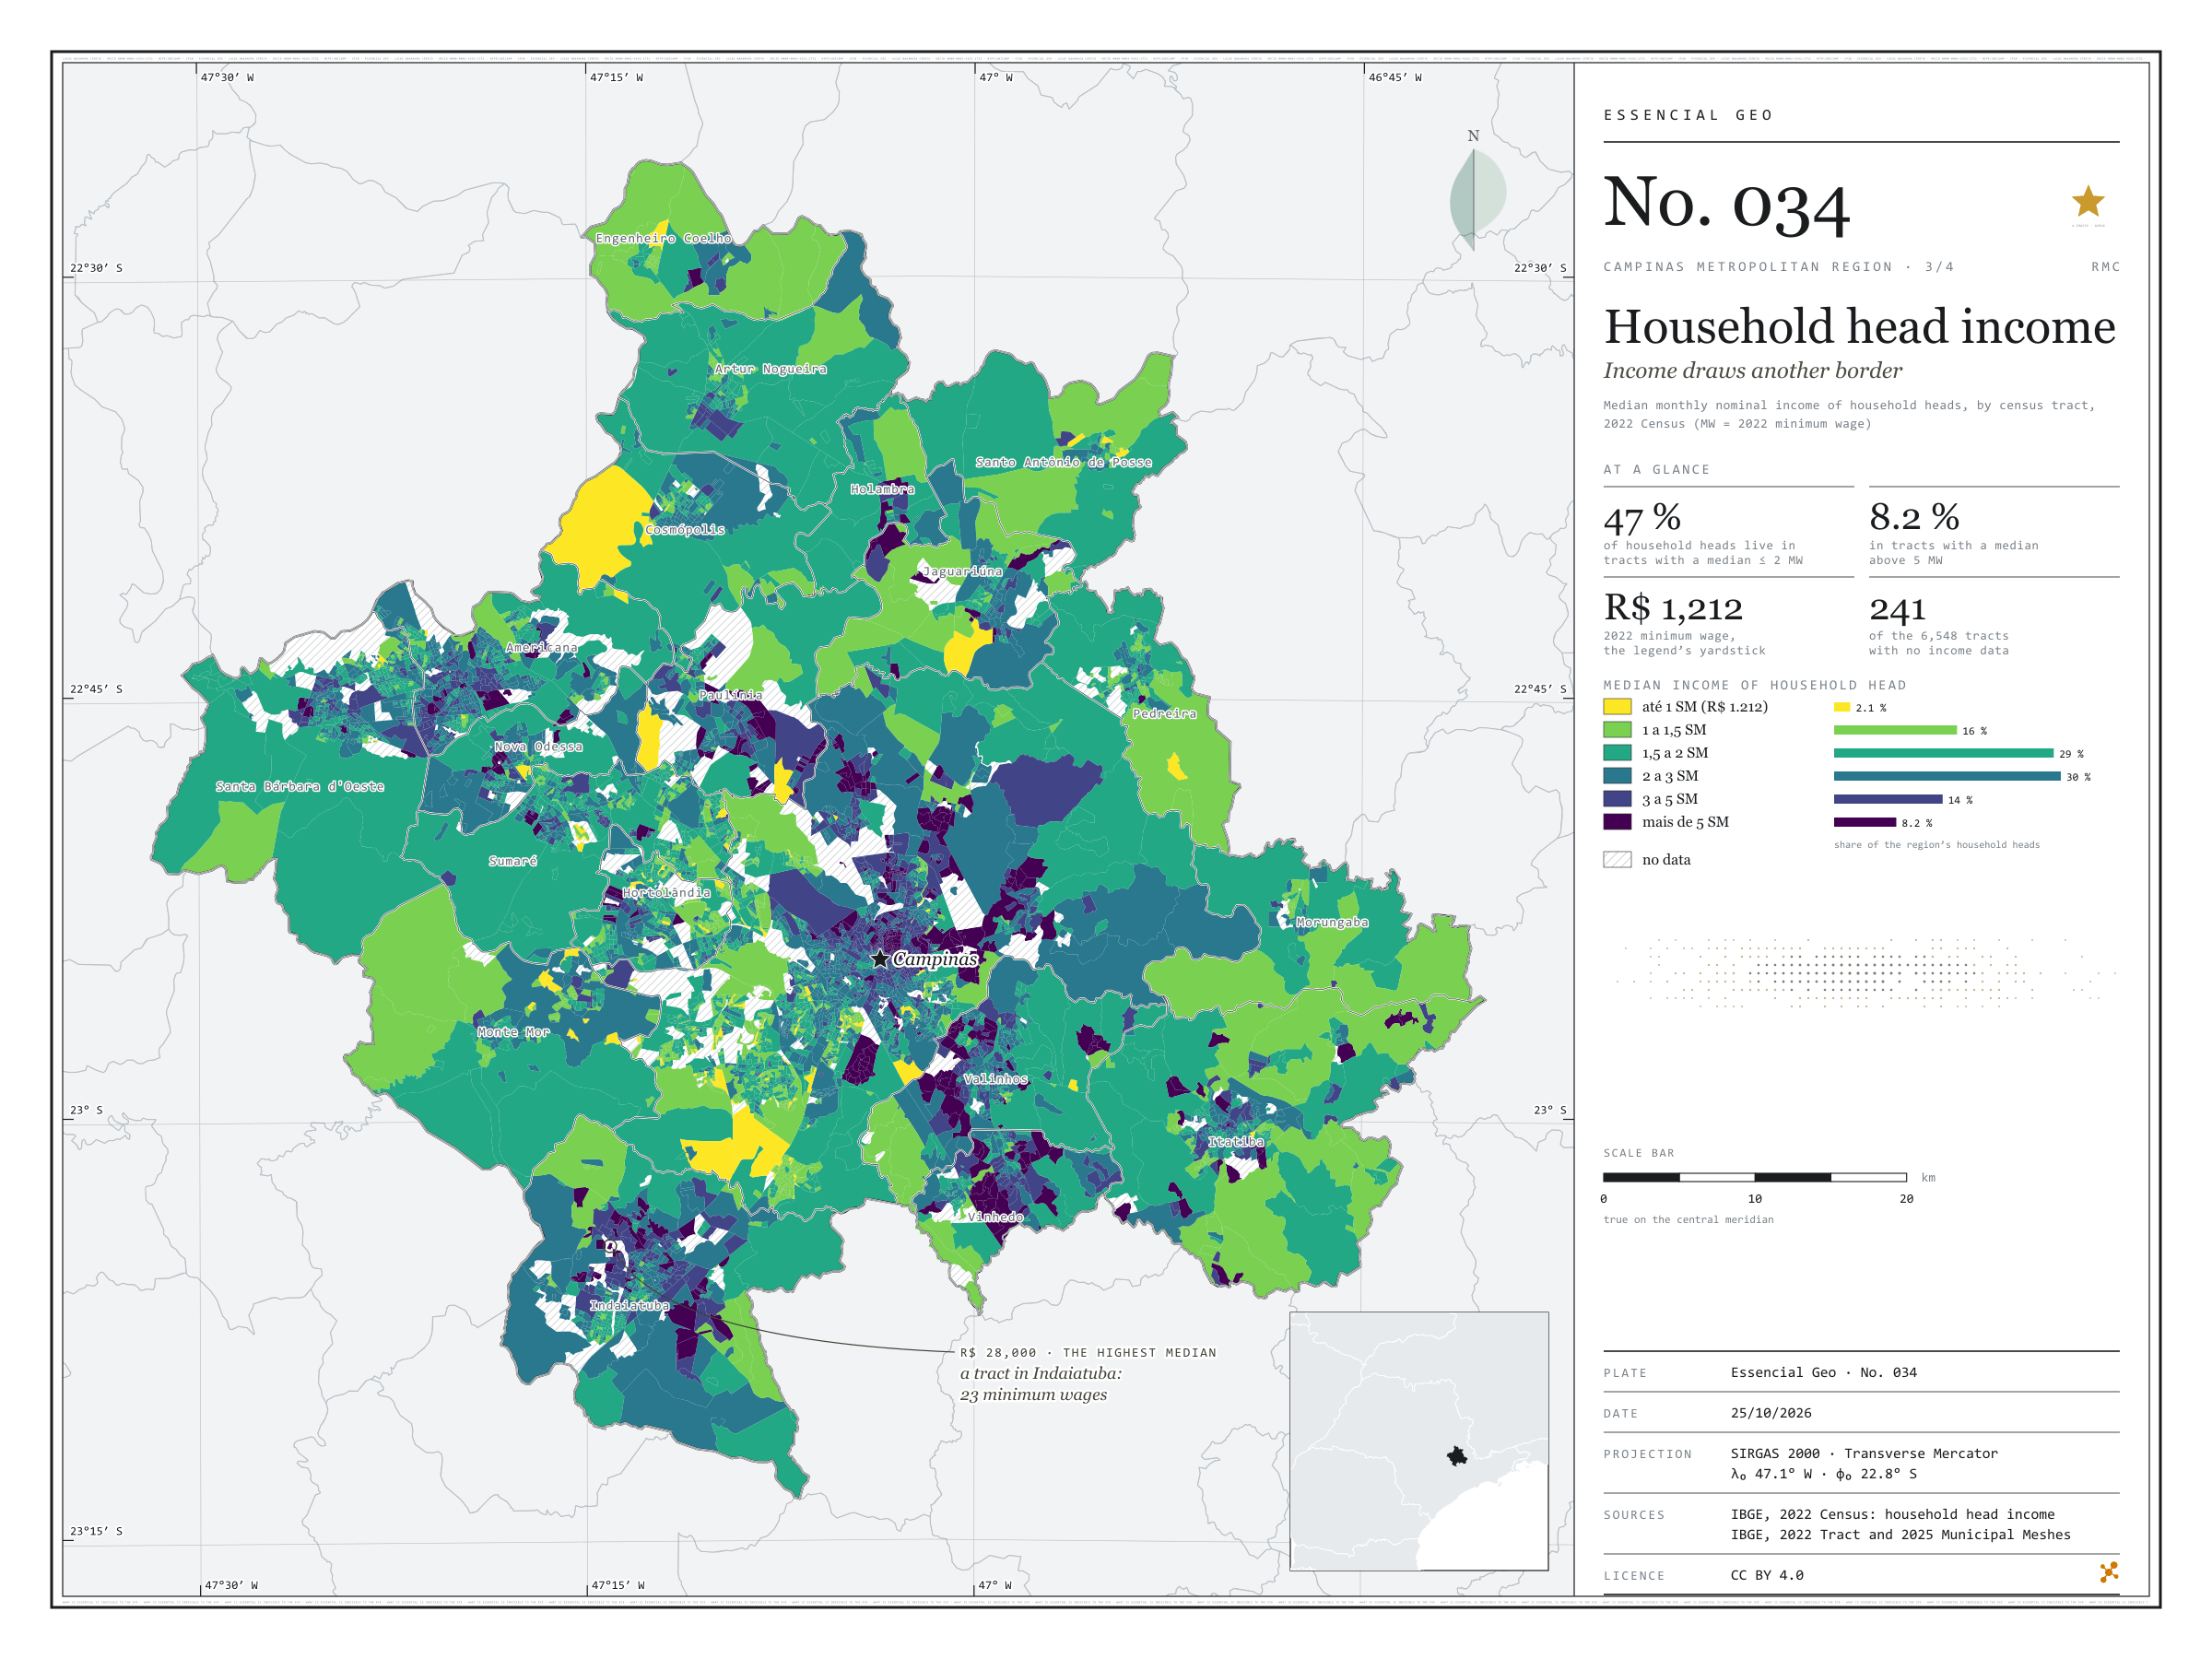
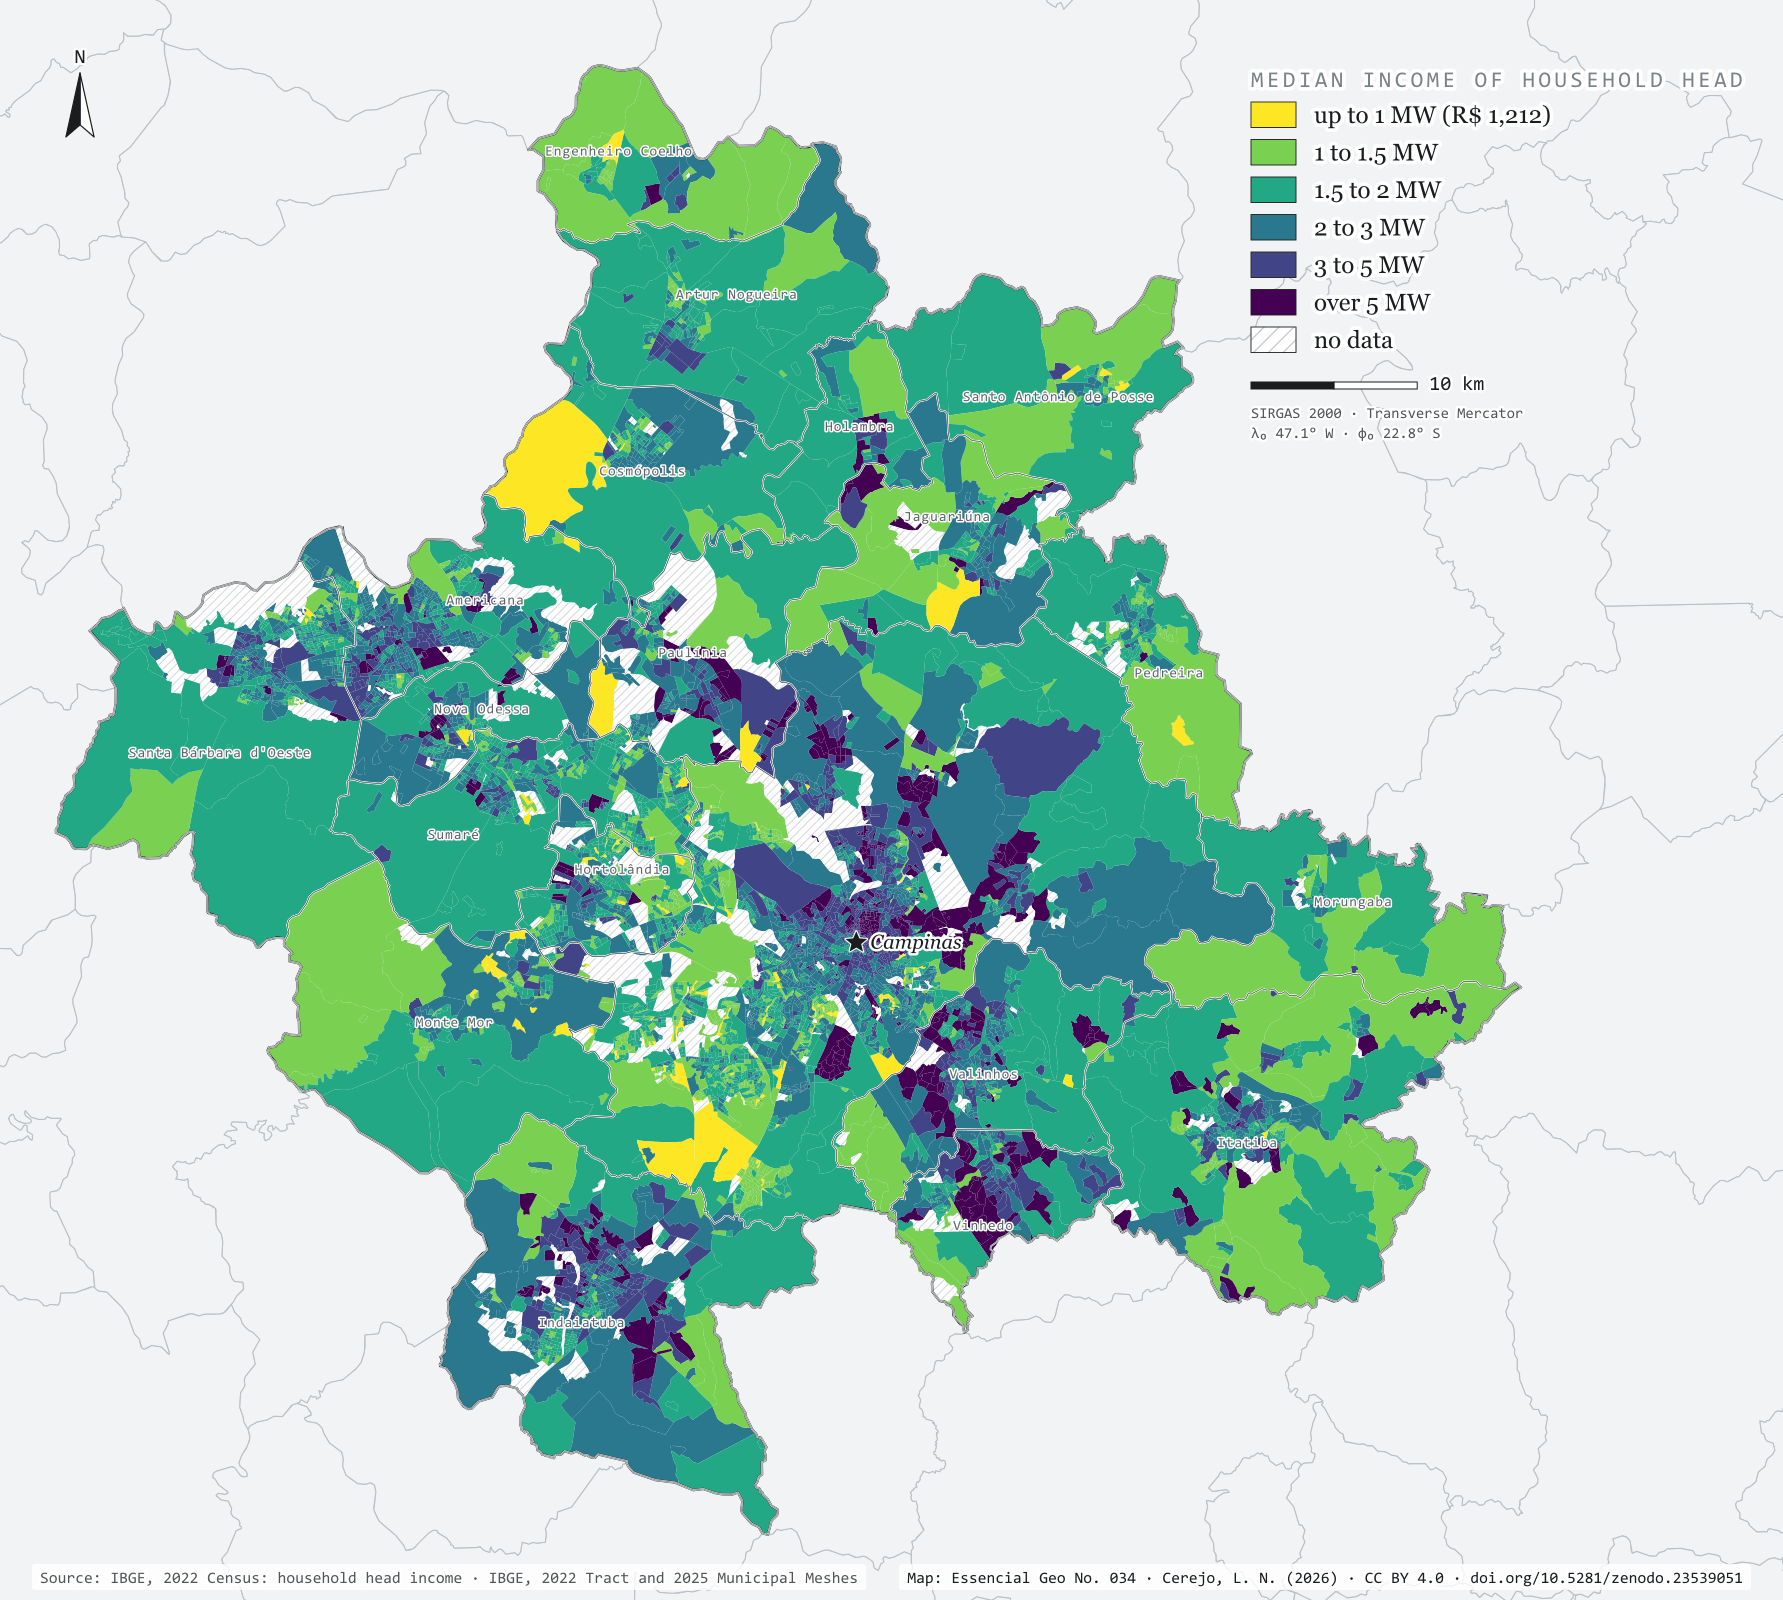
Income draws another border

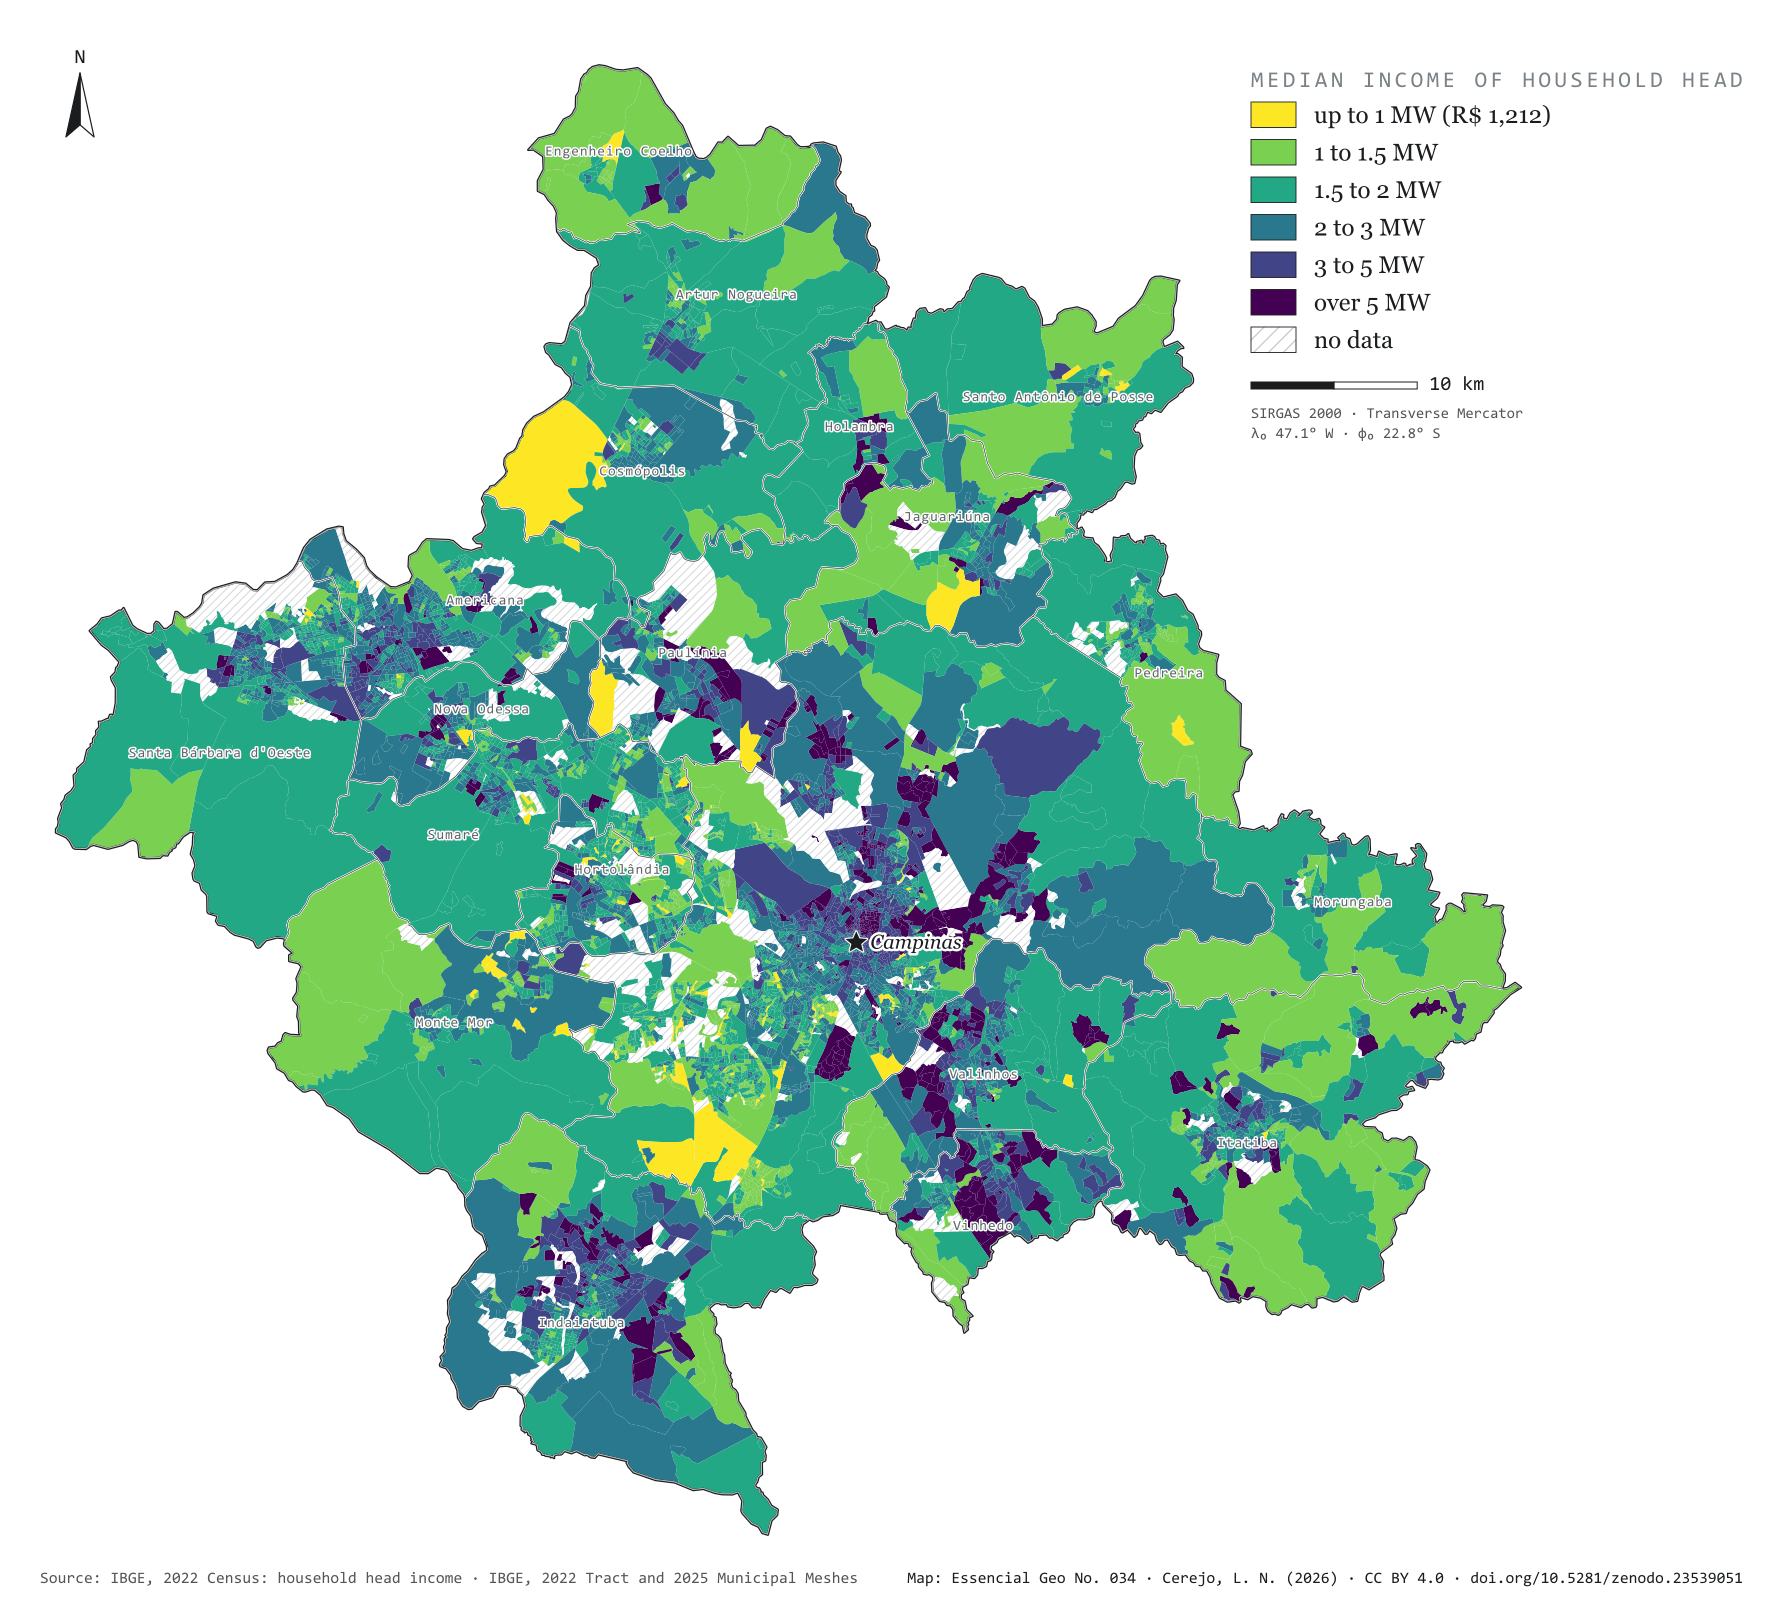
Fig. 034 Campinas Metropolitan Region (SP) EPSG:4674 Source: IBGE

In 2022, the Brazilian minimum wage was R$ 1,212 a month. In the Campinas Metropolitan Region, 47% of household heads lived in census tracts where the heads’ median income did not exceed two minimum wages; 8.2% lived in tracts above five. The map colours each tract by median income and draws a border that is not the municipal one: in Vinhedo, Valinhos and Indaiatuba, one head in three lives in tracts above three minimum wages; in Hortolândia and Sumaré, one in ten; in Monte Mor, under 3%. The highest median, R$ 28,000 (23 minimum wages), belongs to a tract in Indaiatuba. Third plate of the collection “Campinas Metropolitan Region”.

Technical record · downloads · citation

At a glance

Household heads, by the tract’s median income (minimum wages) (people)
  • até 1 SM 2.1%
  • 1 a 1,5 SM 16.3%
  • 1,5 a 2 SM 29%
  • 2 a 3 SM 30%
  • 3 a 5 SM 14.4%
  • mais de 5 SM 8.2%
Household heads in tracts with a median of up to 2 minimum wages

47 %

548,714 of the 1,156,822 heads in tracts with data

Highest tract median income

28,000 R$

In Indaiatuba: 23 minimum wages

Layers

  • setores polygon 6,548 census tracts: household heads, residents, mean and median household head income
  • municipios polygon Outline of the 20 municipalities

Metadata

Extent
Campinas Metropolitan Region (SP)
CRS / Projection
SIRGAS 2000 (EPSG:4674)
EPSG:4674
Software
Python · GeoPandas · GDAL · QGIS · Node.js · d3-geo
Method
Median monthly nominal income of household heads with income, by 2022 Census tract, in six classes measured in 2022 minimum wages (R$ 1,212).
Version
v1.0.0
Licence
CC BY 4.0

Downloads

Figure to reuse

The map without a frame, with legend, scale, reference system and credit written on it: ready for papers, lectures and slides. In two versions: with the basemap (neighbours and sea) or only the mapped area, on white.

Point a camera at it to open this page.

How to cite

Cerejo, L. N. (2026). Renda do responsável: a renda desenha outra fronteira [Household head income: Income draws another border] (Version 1.0.0) [Data set]. Zenodo. https://doi.org/10.5281/zenodo.23539051

No. 035 Hydrography Campinas Metropolitan Region 4/4

Riparian reserves of Campinas

Where water rises, the forest is missing

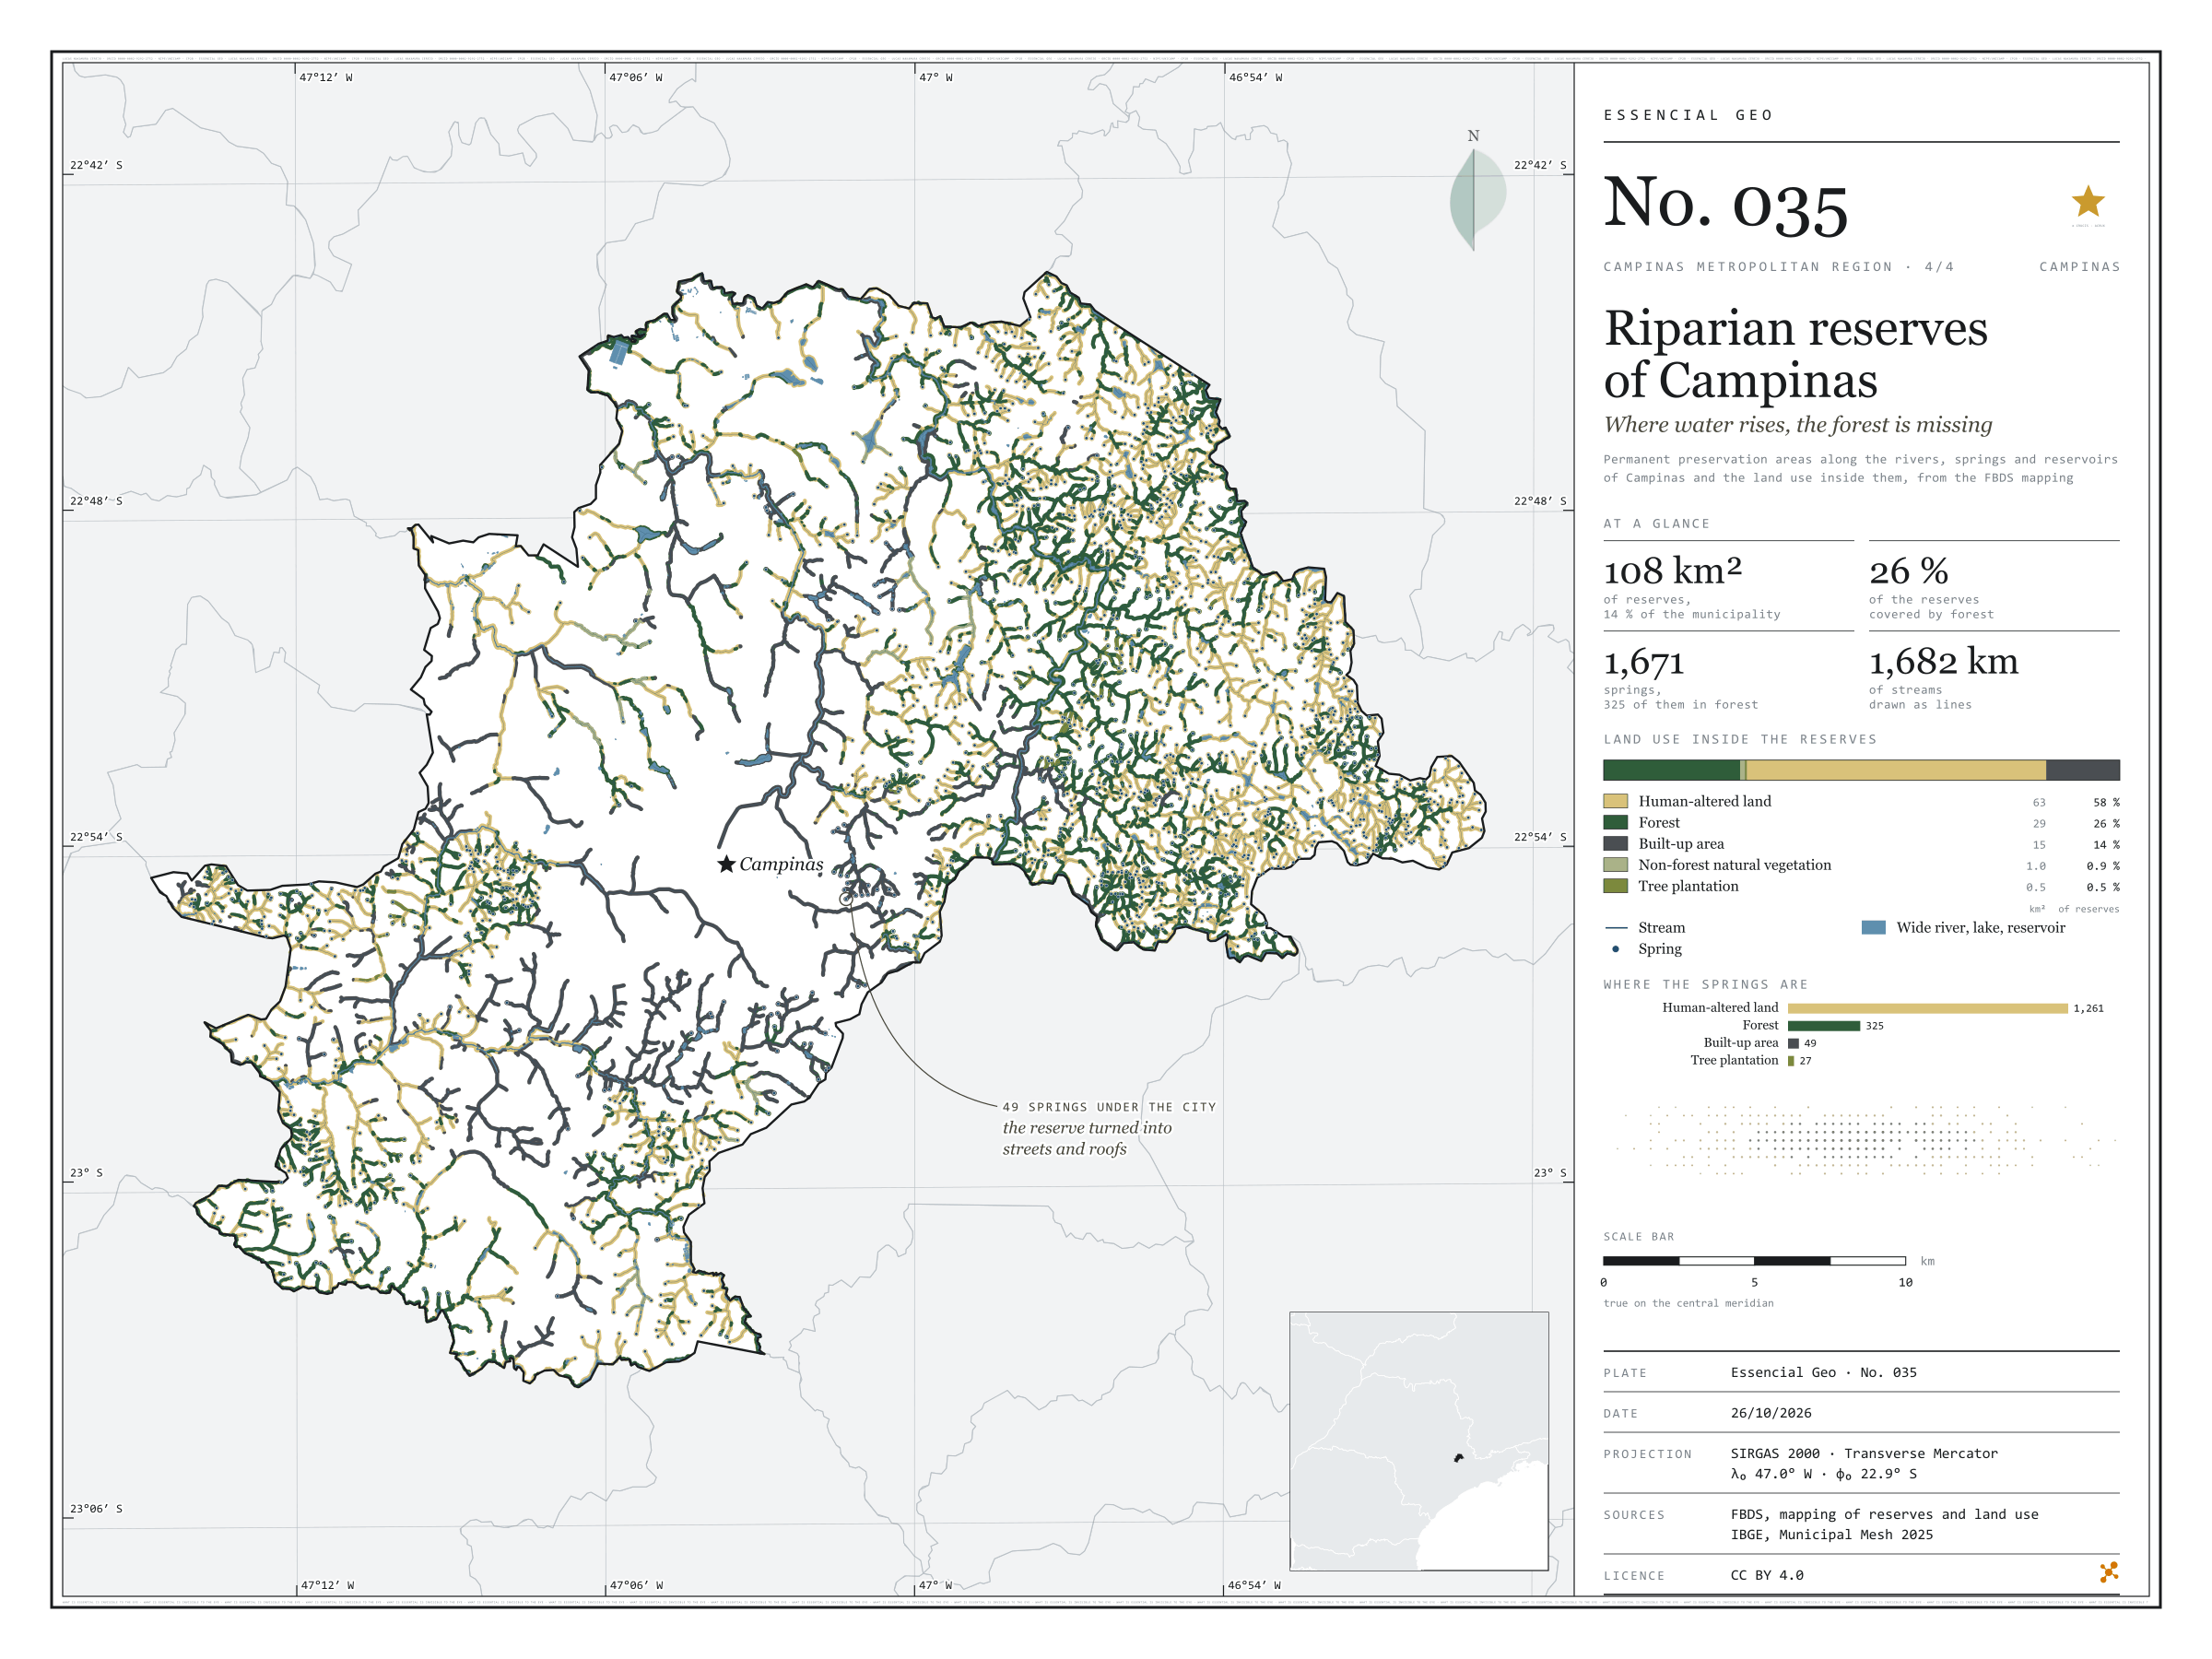
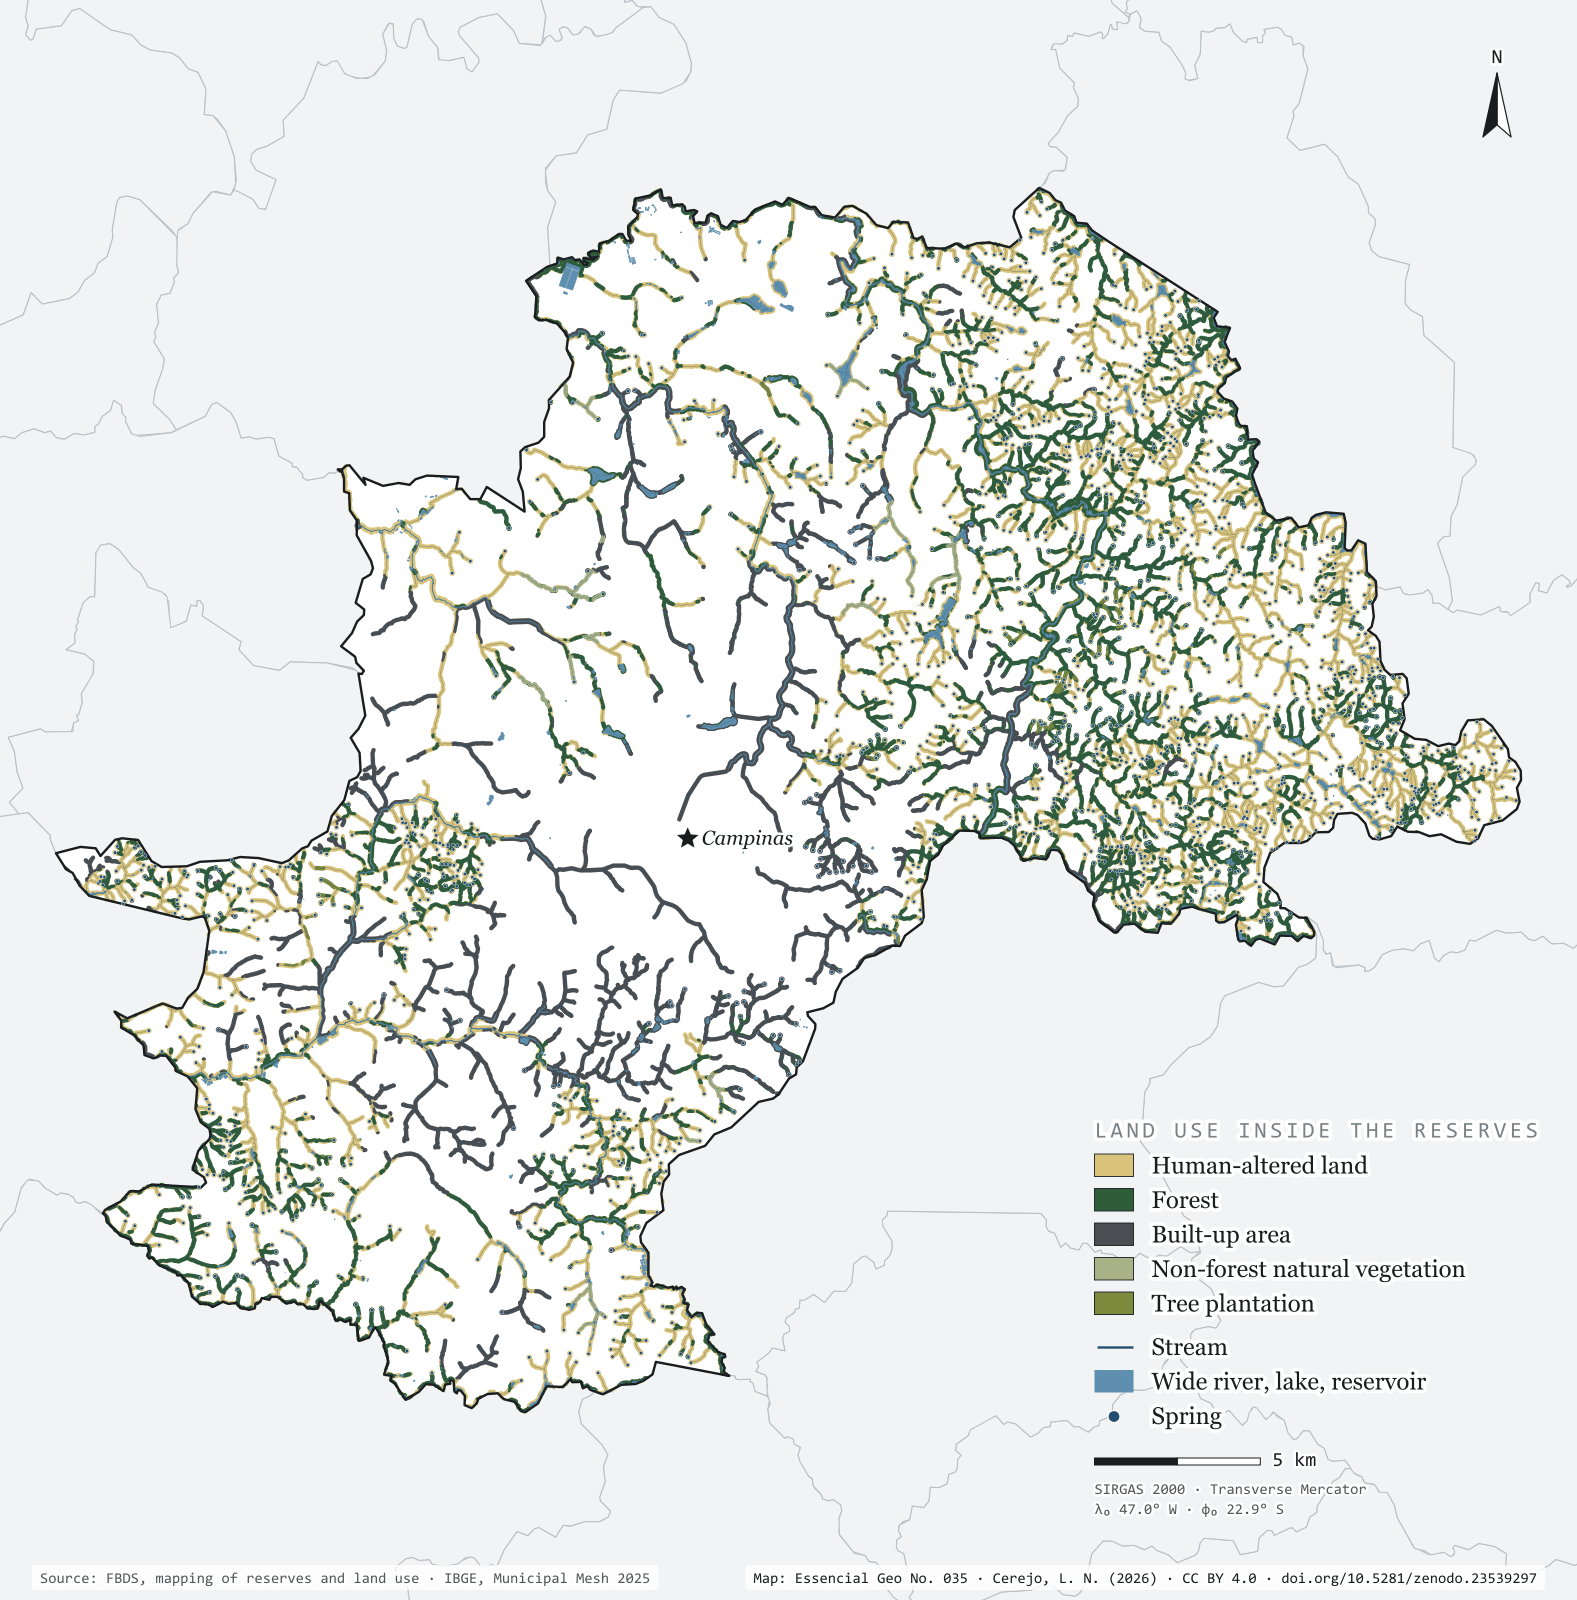
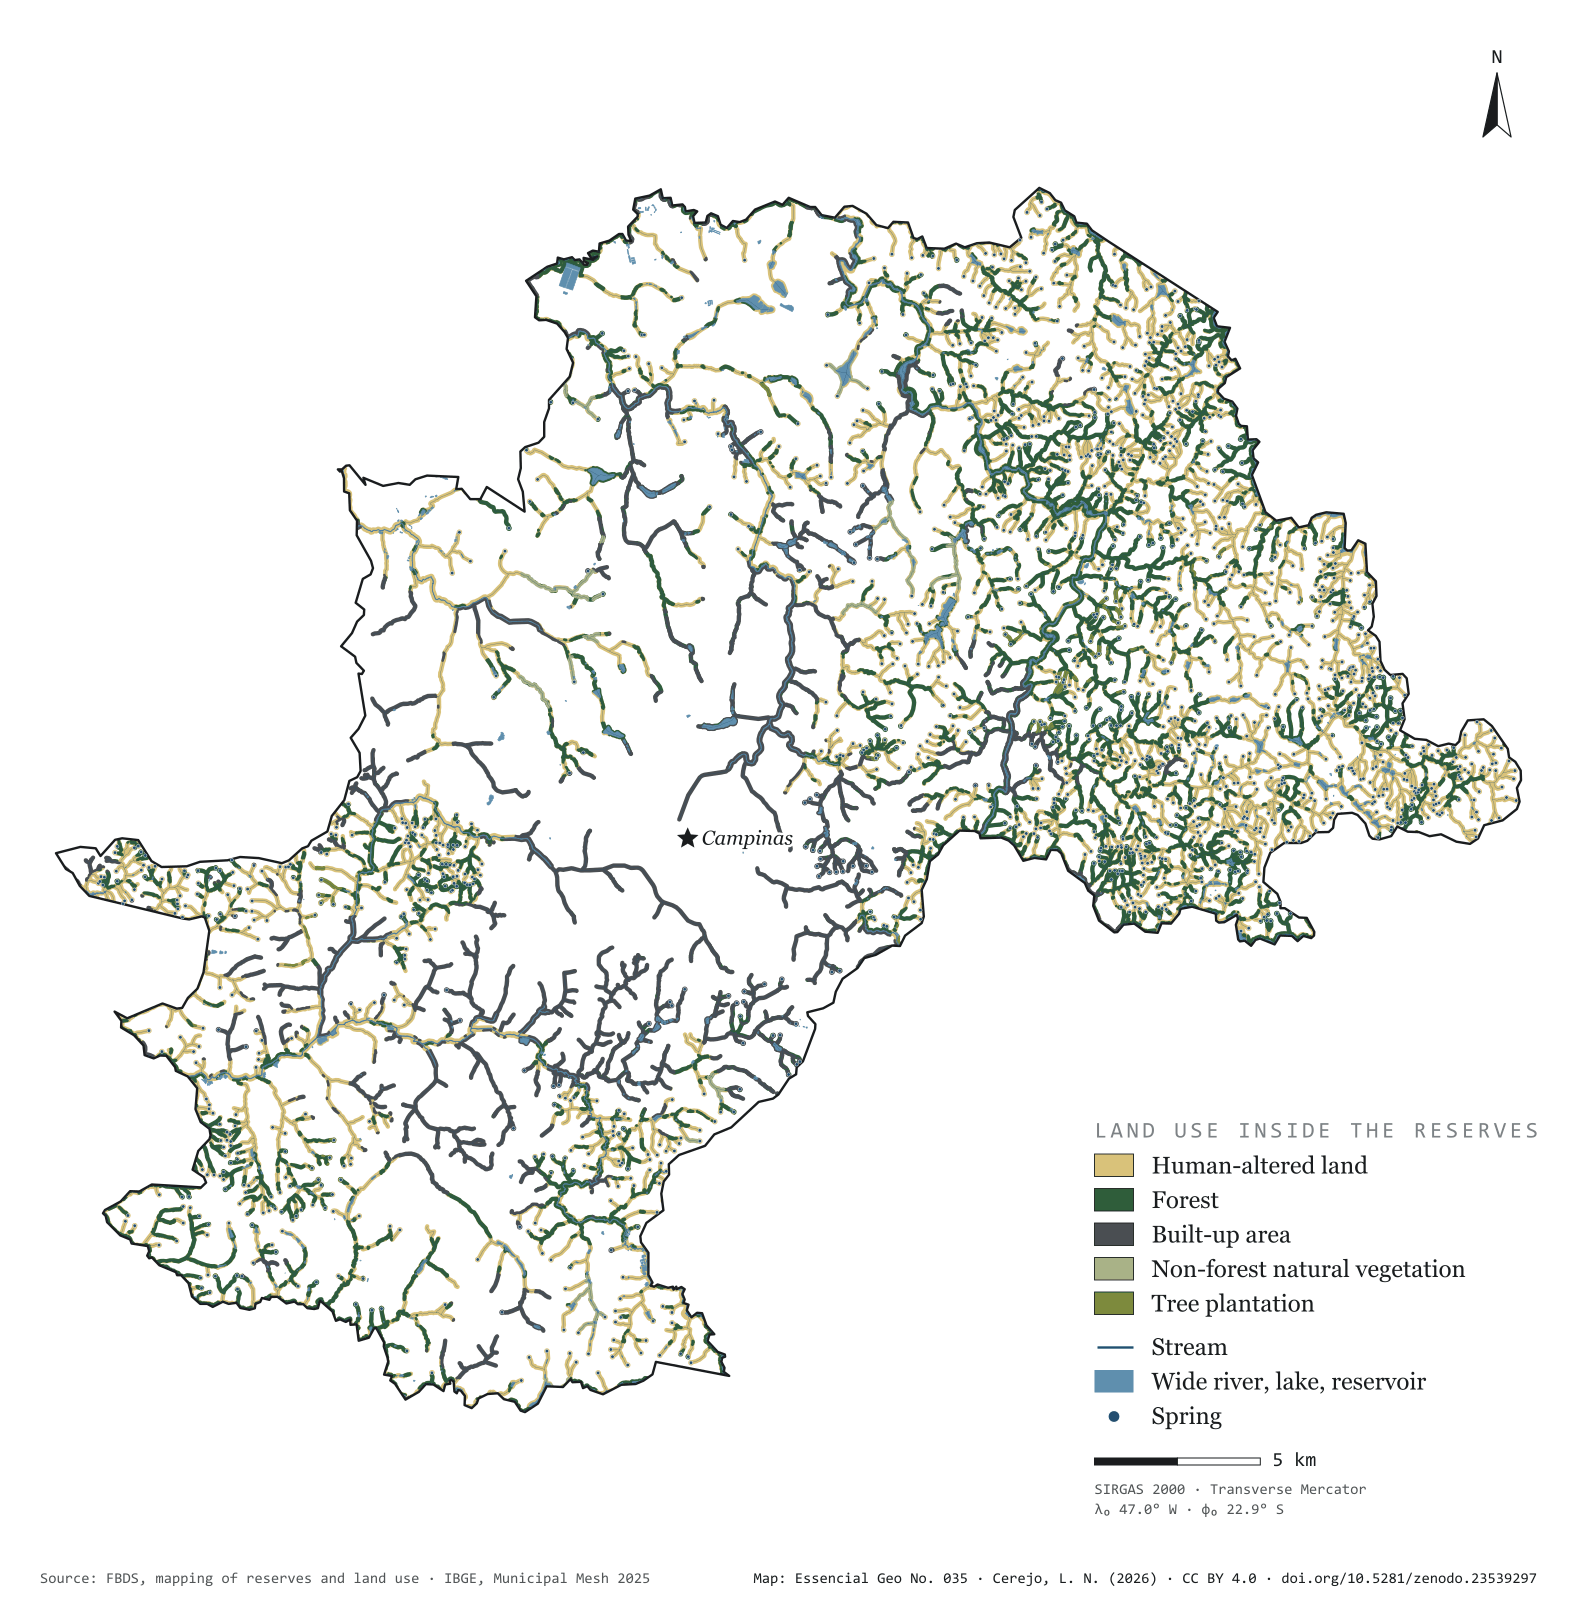
Fig. 035 Municipality of Campinas (SP) EPSG:4674 Source: FBDS, IBGE

Brazil’s Forest Code requires a strip of protected vegetation along every river, around every spring and on the shores of reservoirs: the permanent preservation areas, or APPs. In Campinas they add up to 108 km², 13.6% of the municipality, drawn over 1,682 km of streams and 1,671 springs. Only 26.4% of that strip is forest. The rest is pasture, cropland and bare soil (57.9%) or city (14.3%). Of the springs, 325 lie in forest and 1,261 in human-altered land; 49 have ended up under the streets and roofs of the urban area. On the map, green thickens in the east, in the hills of Sousas and Joaquim Egídio, and vanishes in the centre, where the streams run between houses. Fourth plate of the collection “Campinas Metropolitan Region”.

Technical record · downloads · citation

At a glance

Land use inside the reserves (km²) (km²)
  • Área antropizada 57.9%
  • Formação florestal 26.4%
  • Área edificada 14.3%
  • Formação não florestal 0.9%
  • Silvicultura 0.5%
Springs, by the land use class they fall in (springs)
  • Área antropizada 1,261
  • Formação florestal 325
  • Área edificada 49
  • Silvicultura 27
Reserve area covered by forest

26 %

28.6 of the municipality’s 108.1 km² of reserves

Layers

  • app_uso polygon Land use inside the reserves, in five classes, with area in hectares
  • app polygon 2,657 reserve strips, with their origin (stream, water body, spring) and width in metres
  • rios line 5,351 single-line stream segments, with width class and length
  • rios_duplos polygon 114 double-bank river reaches
  • massas_dagua polygon 967 lakes and reservoirs, 956 of them artificial
  • nascentes point 1,671 springs
  • limite_municipal polygon Boundary of Campinas

Metadata

Extent
Municipality of Campinas (SP)
CRS / Projection
SIRGAS 2000 (EPSG:4674)
EPSG:4674
Software
Python · GeoPandas · GDAL · QGIS · Node.js · d3-geo
Method
Reserves, stream network, springs and land use inside the reserves from the FBDS mapping of Campinas; area of each land use class summed and springs assigned to the class they fall in.
Version
v1.0.0
Licence
CC BY 4.0

Downloads

Figure to reuse

The map without a frame, with legend, scale, reference system and credit written on it: ready for papers, lectures and slides. In two versions: with the basemap (neighbours and sea) or only the mapped area, on white.

Point a camera at it to open this page.

How to cite

Cerejo, L. N. (2026). APPs de Campinas: onde a água nasce, a mata falta [Riparian reserves of Campinas: Where water rises, the forest is missing] (Version 1.0.0) [Data set]. Zenodo. https://doi.org/10.5281/zenodo.23539297

Technical record

Technical record · No. 032

Land use and land cover

At a glance

The region by land use and cover class (km²) (km²)
  • Mosaico de usos 29.3%
  • Área urbanizada 21.1%
  • Pastagem 15.7%
  • Cana 11.9%
  • Soja e outras lavouras 9.1%
  • Formação florestal 9.1%
  • Silvicultura 1.6%
  • Água 1.1%
  • Campo e área úmida 0.8%
  • Mineração e outras áreas sem vegetação 0.3%
Urban share of the municipality (top five) (%)
  • Hortolândia 73
  • Americana 43
  • Vinhedo 37
  • Paulínia 36
  • Sumaré 35
Largest forest fragment

8.6 km²

In Itatiba; there are 7,743 fragments, 31 of them over 1 km²

Layers

  • cobertura_2024 raster GeoTIFF of the 2024 classification clipped to the region, with the original MapBiomas codes and the plate’s palette in a .qml style
  • municipios polygon 20 municipalities: area and km² and % of each of the ten classes
  • limite_rmc polygon Outline of the region

Metadata

Extent
Campinas Metropolitan Region (SP)
CRS / Projection
SIRGAS 2000 (EPSG:4674)
EPSG:4674
Software
Python · rasterio · GeoPandas · SciPy · GDAL · QGIS · Node.js · d3-geo
Method
MapBiomas Collection 10 classification for 2024, 30 m pixels, grouped into ten classes; each pixel’s area measured on the ellipsoid and summed for the region and for each municipality.
Version
v1.0.0
Licence
CC BY 4.0

Downloads

Figure to reuse

The map without a frame, with legend, scale, reference system and credit written on it: ready for papers, lectures and slides. In two versions: with the basemap (neighbours and sea) or only the mapped area, on white.

Point a camera at it to open this page.

How to cite

Cerejo, L. N. (2026). Uso e cobertura da terra: entre a cana e a cidade, ilhas de mata [Land use and land cover: Between cane and city, islands of forest] (Version 1.0.0) [Data set]. Zenodo. https://doi.org/10.5281/zenodo.23539003

Data and plates under CC BY 4.0: use them in commercial drawings and papers, citing the source.

100%