São Paulo’s biomethane potential on the ground: per km² and per person, the leading source outside sugarcane, the distance to gas pipelines and the power grid, and what already operates.
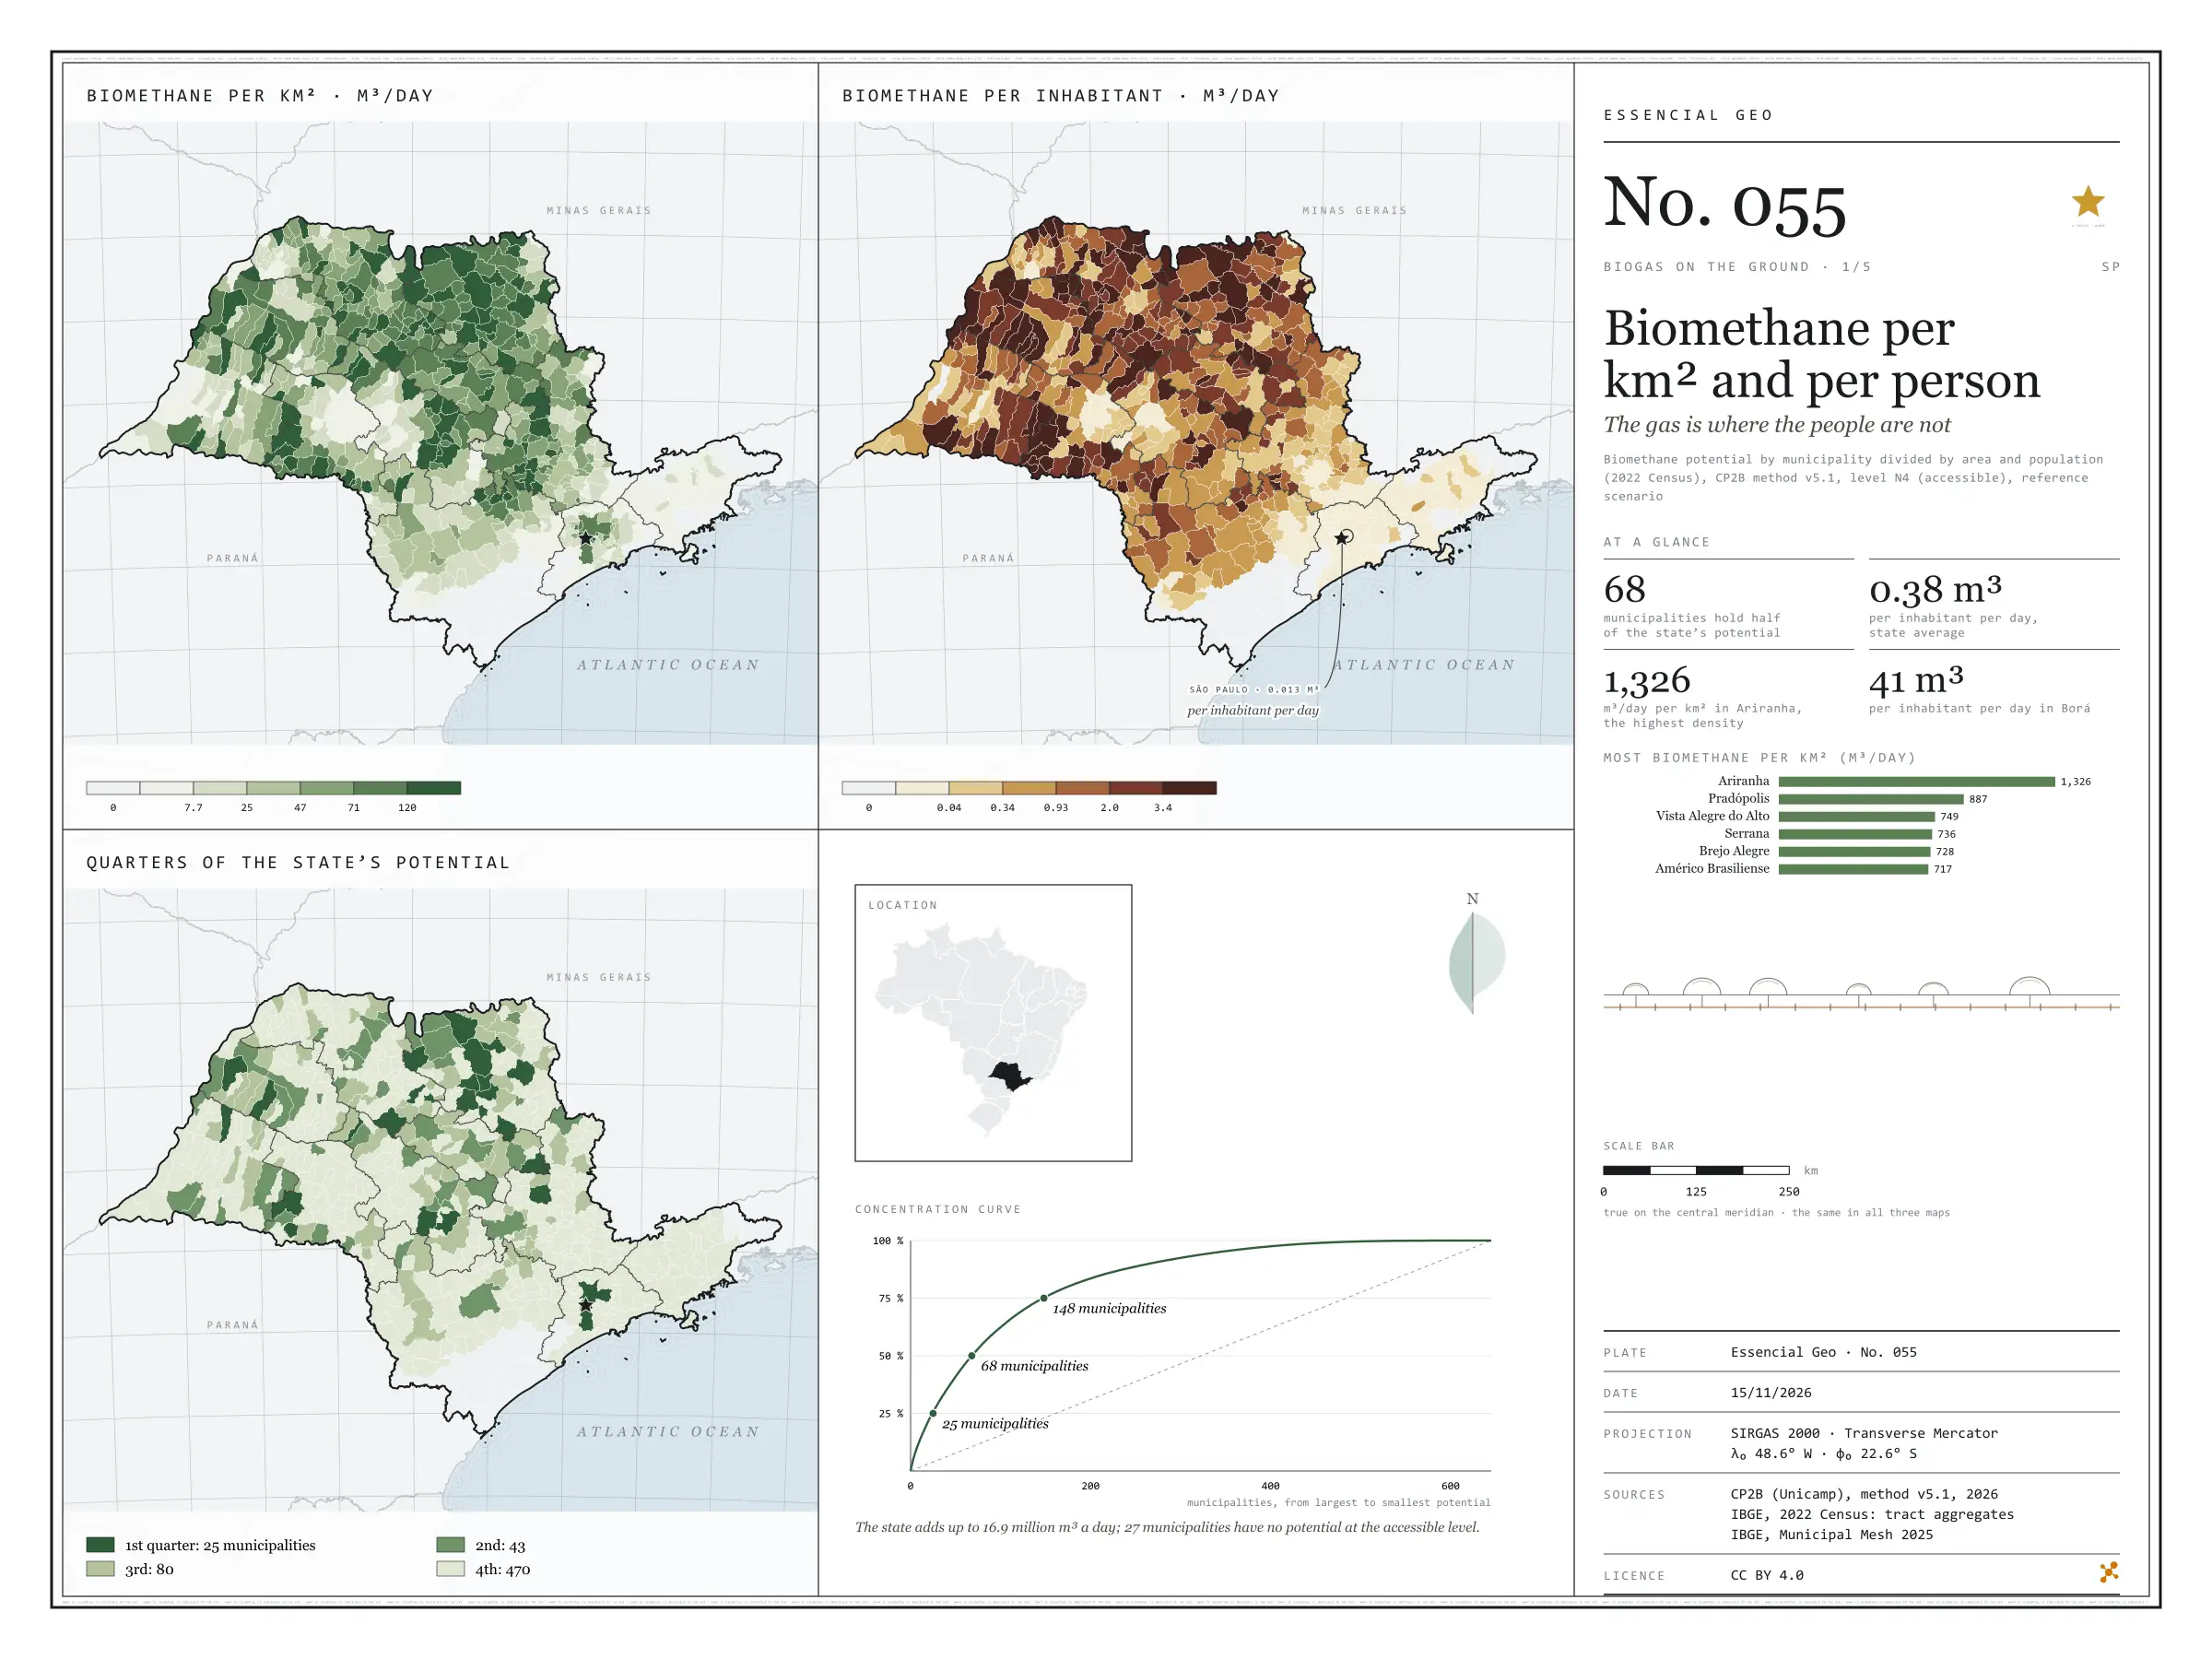
Fig. 055São Paulo State (SP)EPSG:4674Source: CP2B (Unicamp), IBGE
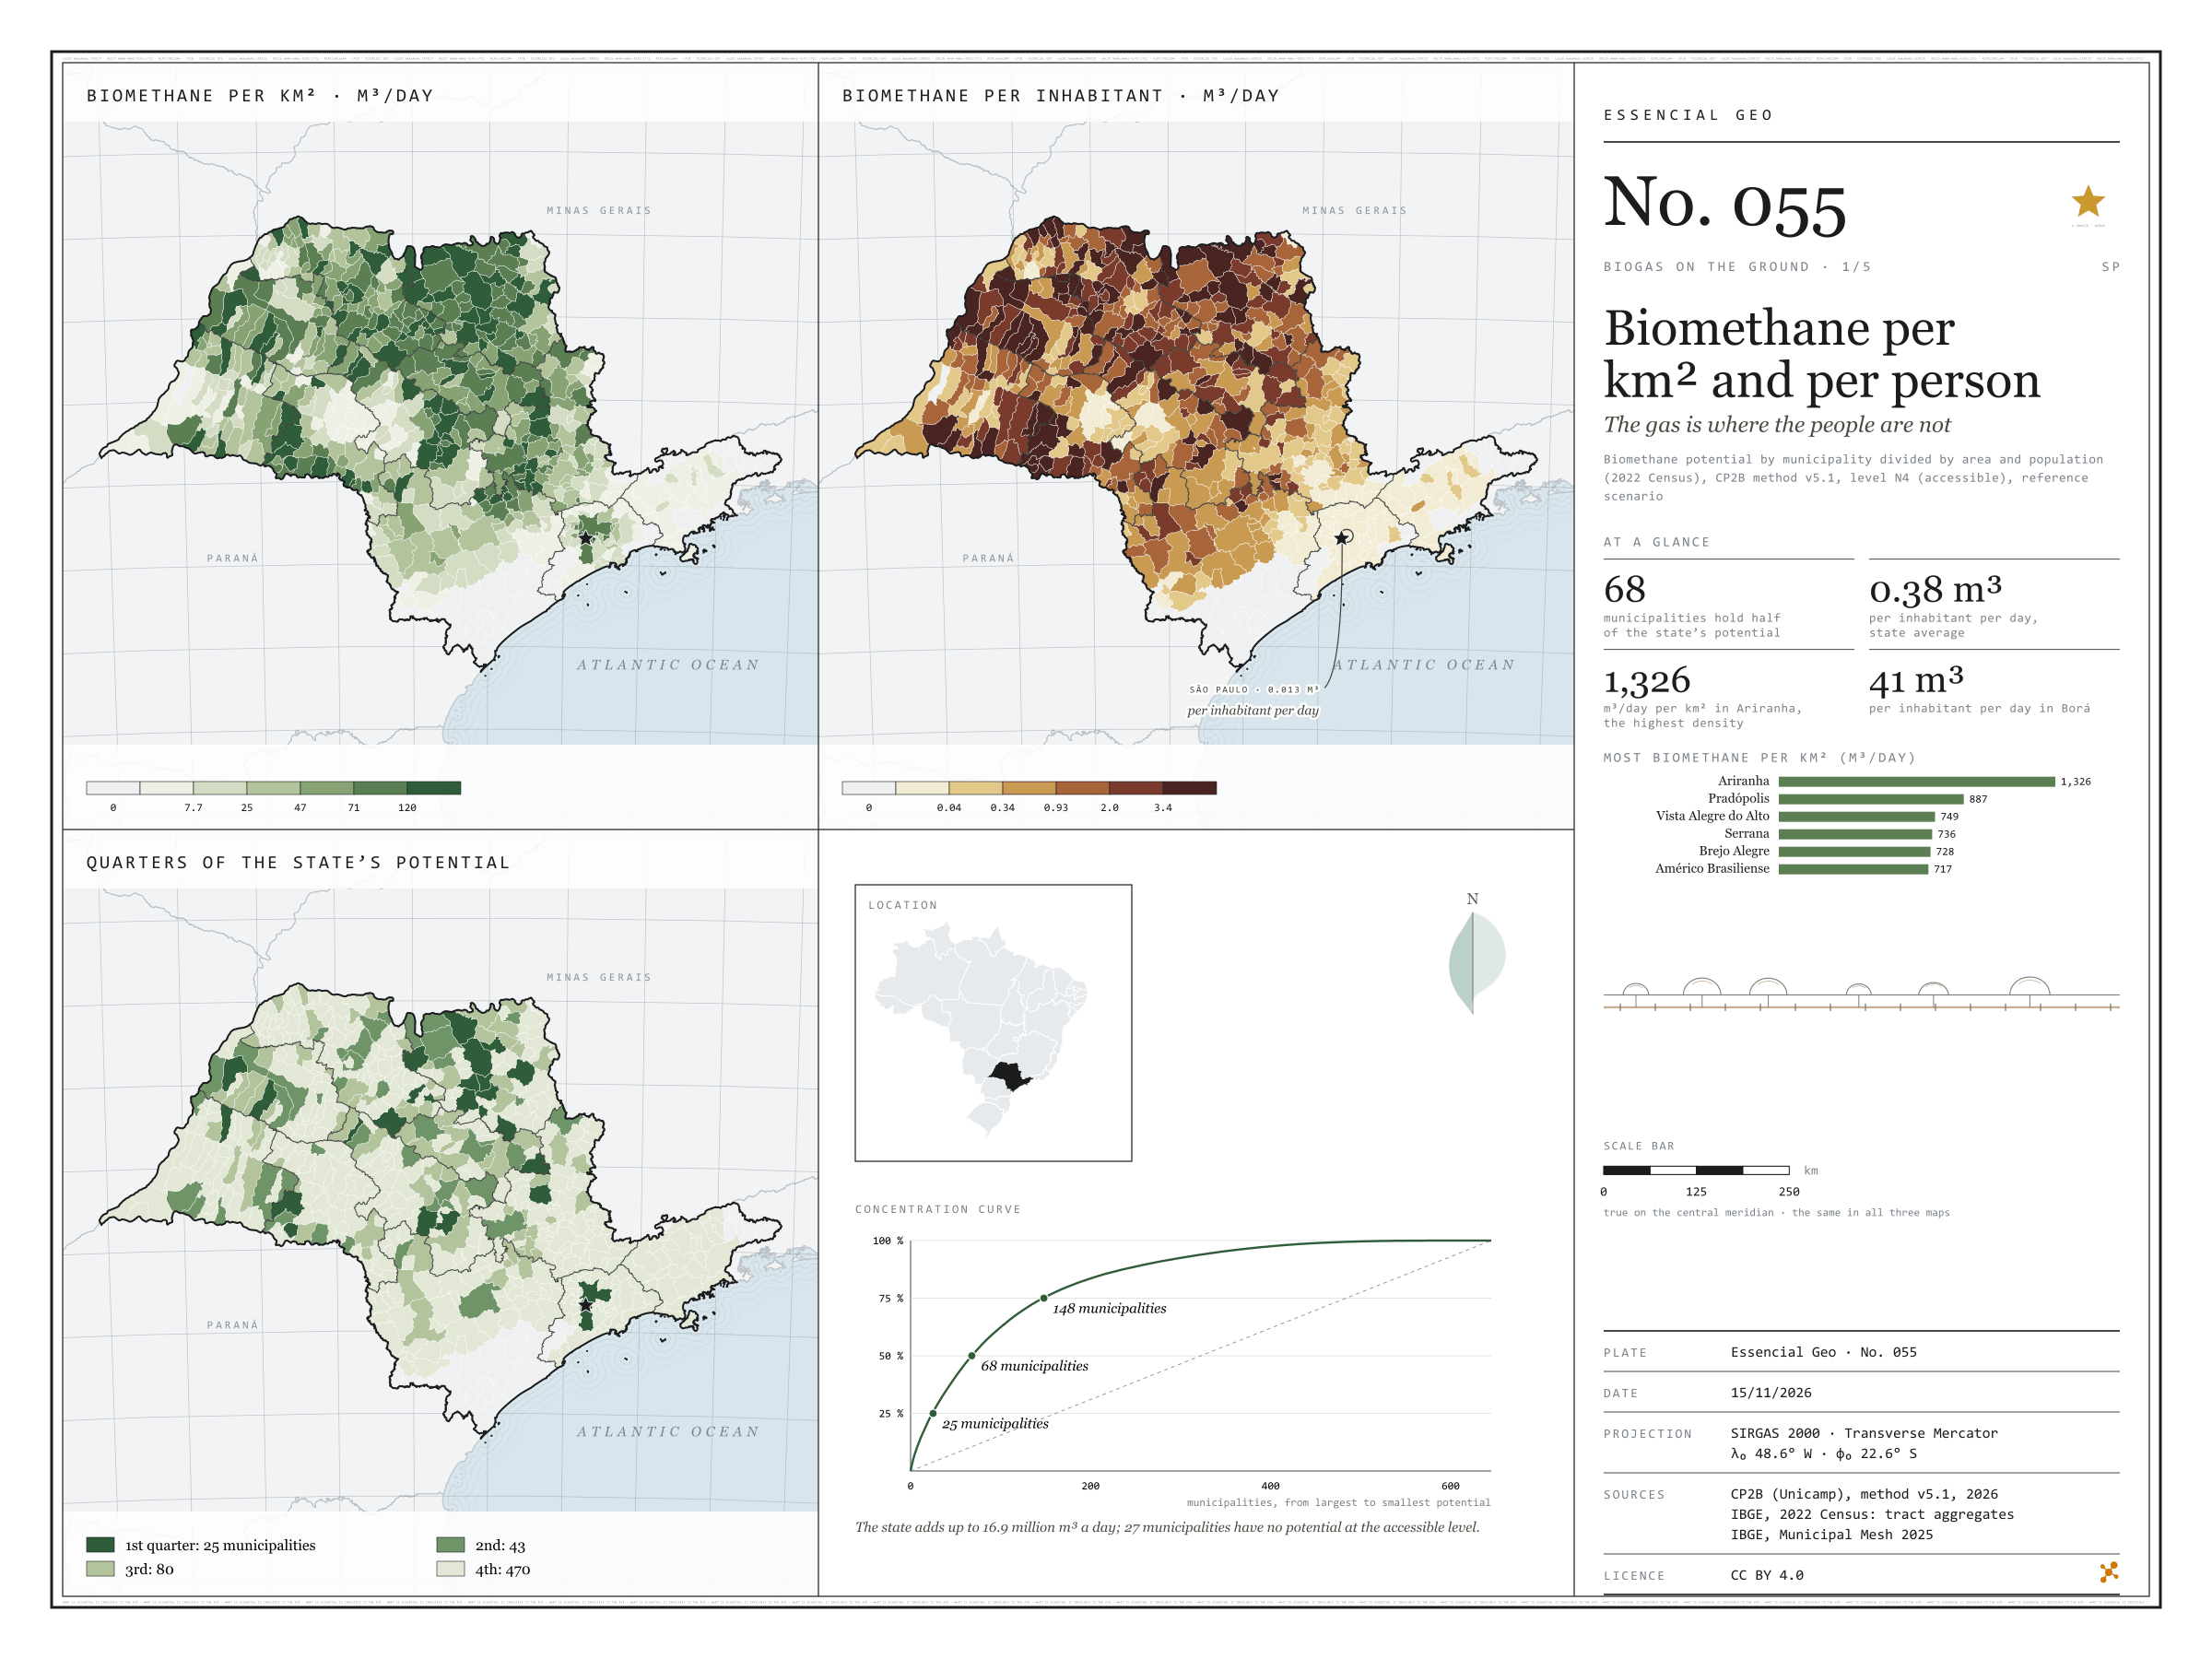
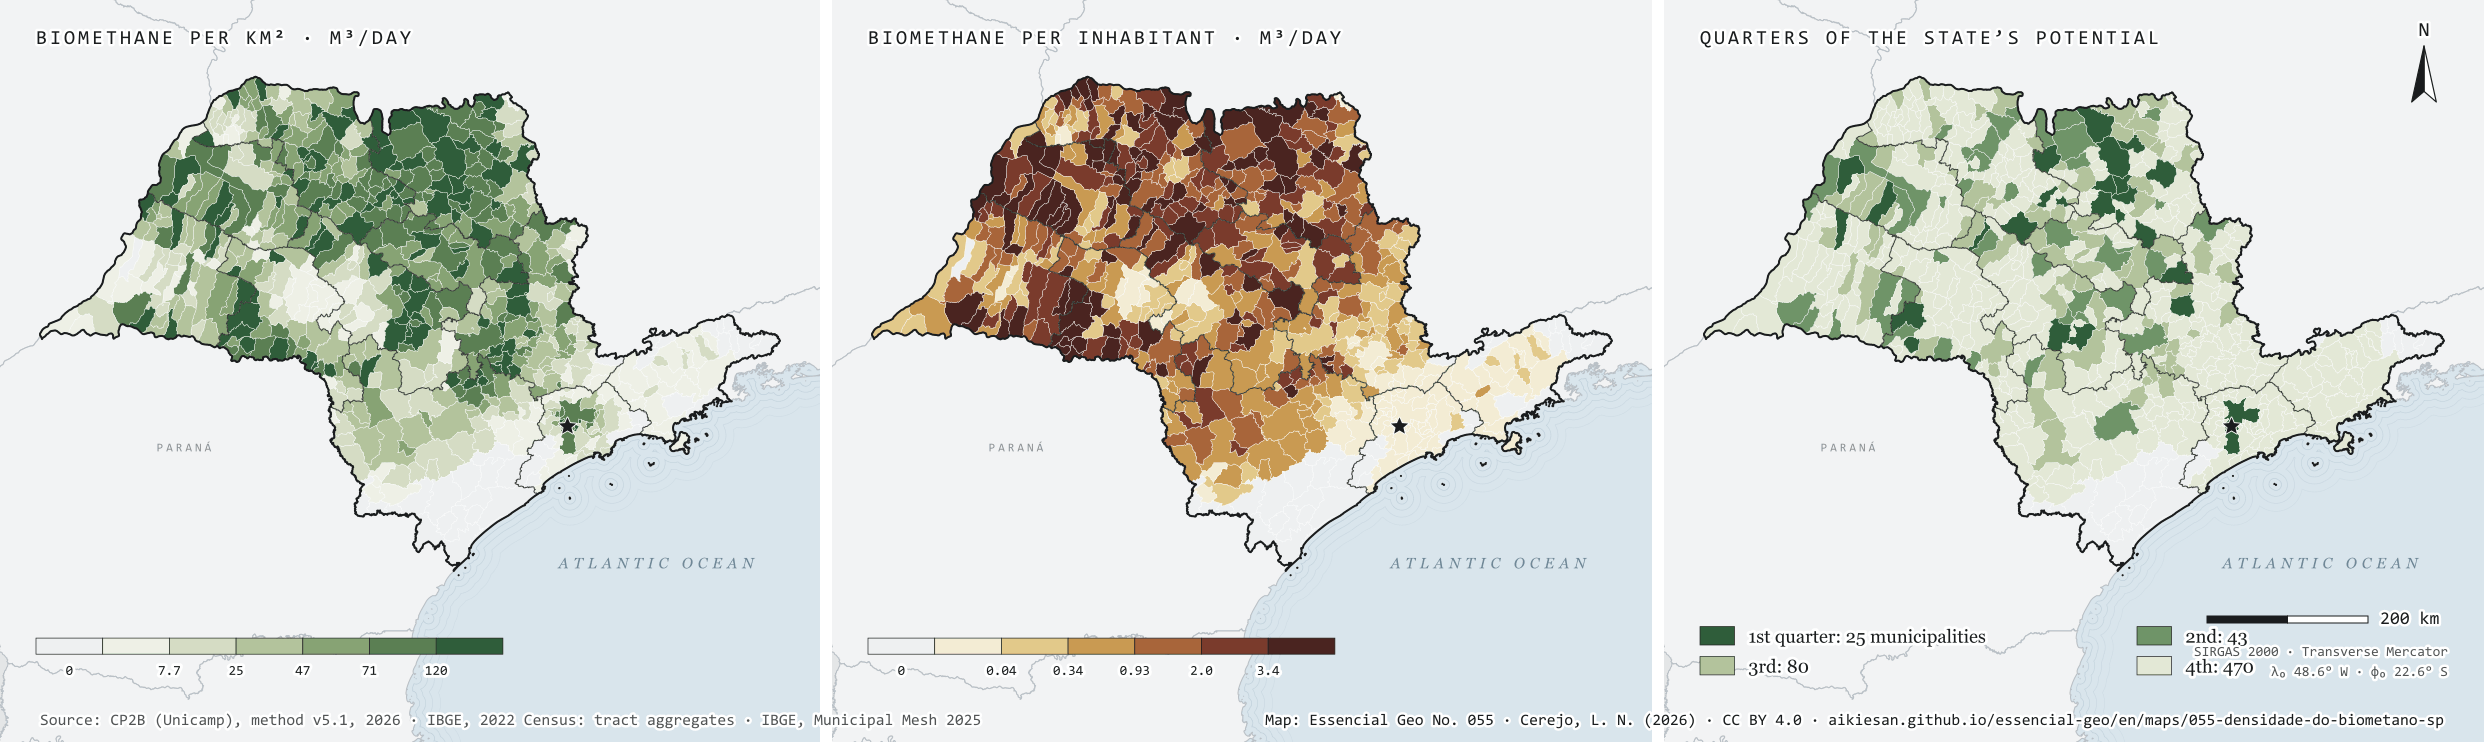
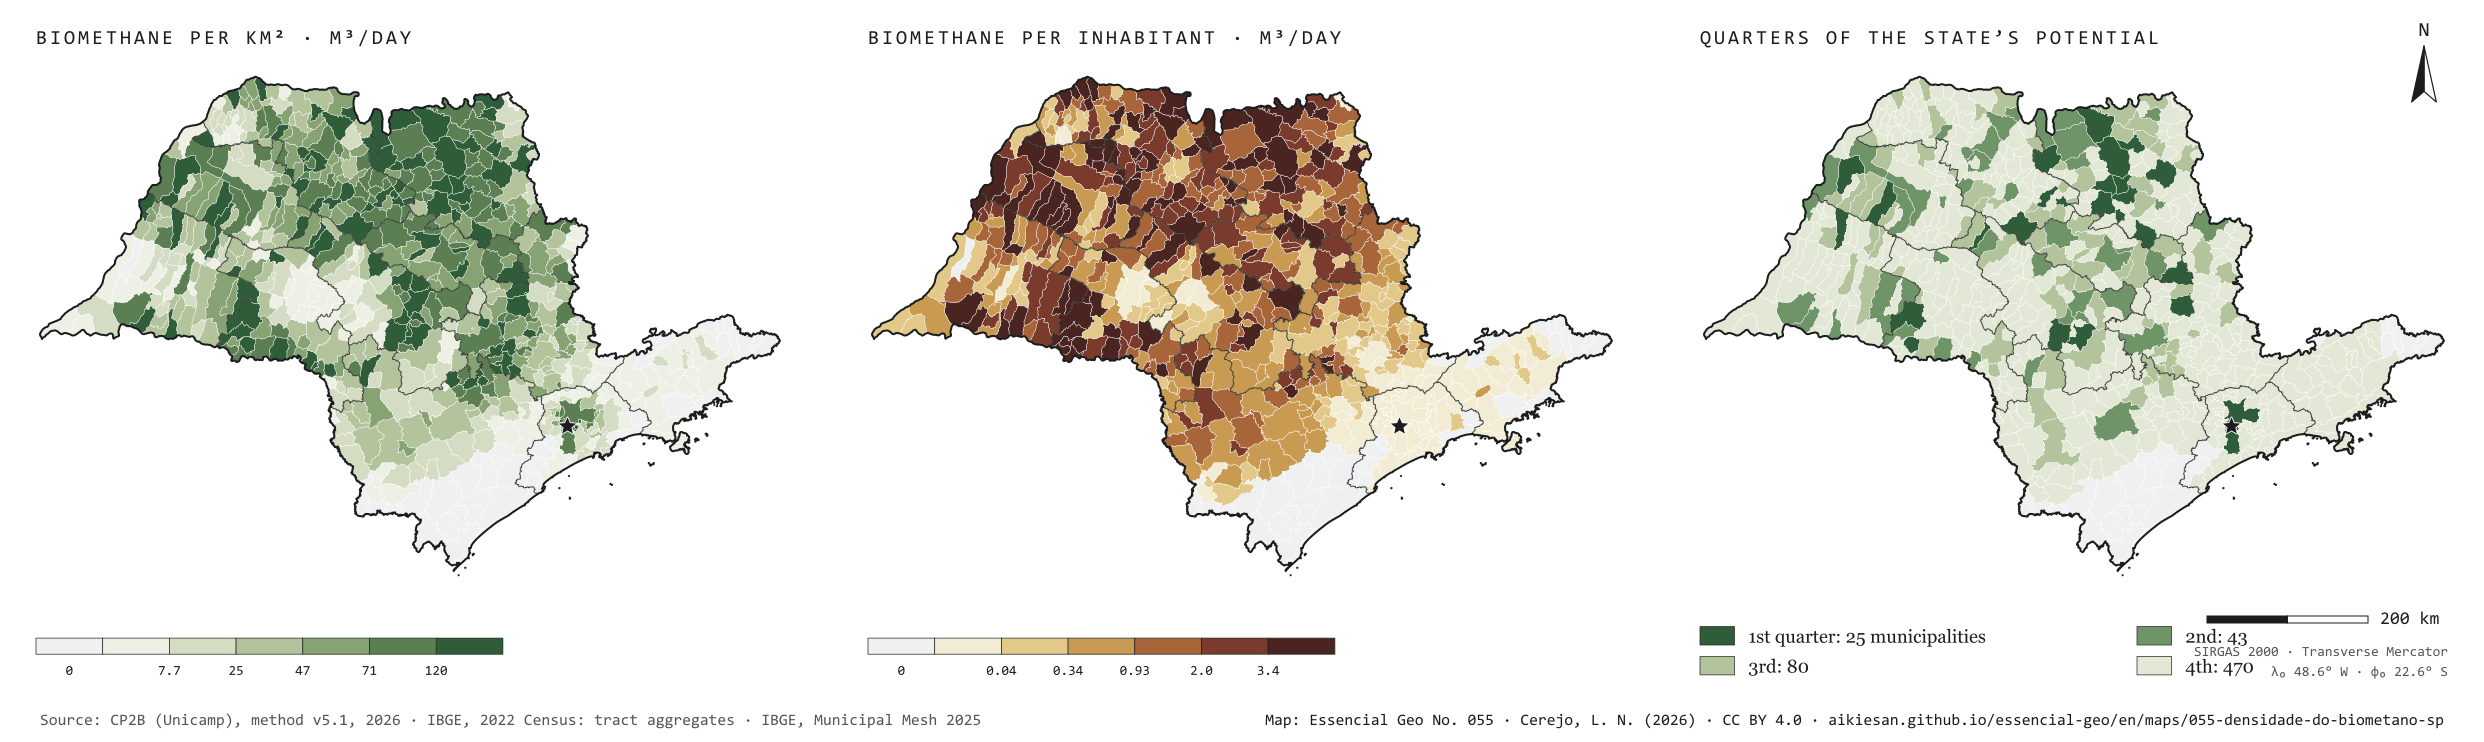
São Paulo’s residues could yield 16.9 million m³ of biomethane a day at the accessible level of the CP2B method. Divided by the population, that is 0.38 m³ per person per day. But the gas does not live where people live. Per km², the potential is densest in the sugarcane north: Ariranha reaches 1,326 m³ a day for each km². Per inhabitant, the leaders are small municipalities full of cane, such as Borá, with 41 m³ per person per day, while the capital, with the largest urban potential, stands at 0.013. The potential is also concentrated: 25 municipalities hold a quarter of the total, 68 hold half and 148 three quarters. Plate 050 shows how much each municipality has; this one shows how much that weighs on the ground and per person. First plate of the collection “Biogas on the ground”.
Technical record · downloads · citation
At a glance
Municipalities by quarter of the state’s potential (municipalities)
1st quarter3.9%
2nd quarter6.7%
3rd quarter12.4%
4th quarter72.9%
no potential4.2%
Biomethane per inhabitant, state average
0.4m³/day
Highest density (Ariranha)
1,326m³/day per km²
Layers
municipiospolygon645 municipalities: potential by group and source, per km² and per inhabitant, quarter of the potential, largest non-cane source and distances to infrastructure
gasodutos_transporteline13 existing transmission gas pipelines in and around SP
gasodutos_distribuicaolineNetworks of 8 gas distributors in and around SP
pontos_entregapoint62 existing gas delivery points
linhas_transmissaoline493 basic-grid transmission lines (230 kV or more)
subestacoespoint185 basic-grid substations
plantas_biometanopoint9 ANP biomethane plants, at the municipality
gd_biogaspointANEEL biogas distributed generation summed by municipality (24)
regioes_intermediariaspolygon11 intermediate geographic regions
Biomethane potential from 17 residues by municipality (CP2B method v5.1, level N4, reference scenario), divided by the 2025 Municipal Mesh area and the 2022 Census population; municipalities ranked by potential and grouped by the quarter of the state total they belong to.
The map without a frame, with legend, scale, reference system and credit written on it: ready for papers, lectures and slides. In two versions: with the basemap (neighbours and sea) or only the mapped area, on white.
CEREJO, Lucas Nakamura. Biometano por km² e por pessoa: o gás está onde a gente não está. Versão 1.0.0. [S. l.]: Essencial, 2026. Conjunto de dados. Disponível em: https://aikiesan.github.io/essencial-geo/en/maps/055-densidade-do-biometano-sp/. Acesso em: 10 nov. 2026.
Cerejo, L. N. (2026). Biometano por km² e por pessoa: o gás está onde a gente não está [Biomethane per km² and per person: The gas is where the people are not] (Version 1.0.0) [Data set]. Essencial. https://aikiesan.github.io/essencial-geo/en/maps/055-densidade-do-biometano-sp/
@dataset{cerejo2026_densidade_do_biometano_sp,
  author    = {Cerejo, Lucas Nakamura},
  title     = {Biometano por km² e por pessoa: O gás está onde a gente não está},
  year      = {2026},
  publisher = {Essencial},
  version   = {1.0.0},
  url       = {https://aikiesan.github.io/essencial-geo/en/maps/055-densidade-do-biometano-sp/},
  language  = {portuguese},
  note      = {English title: Biomethane per km² and per person: The gas is where the people are not. Licence CC BY 4.0}
}
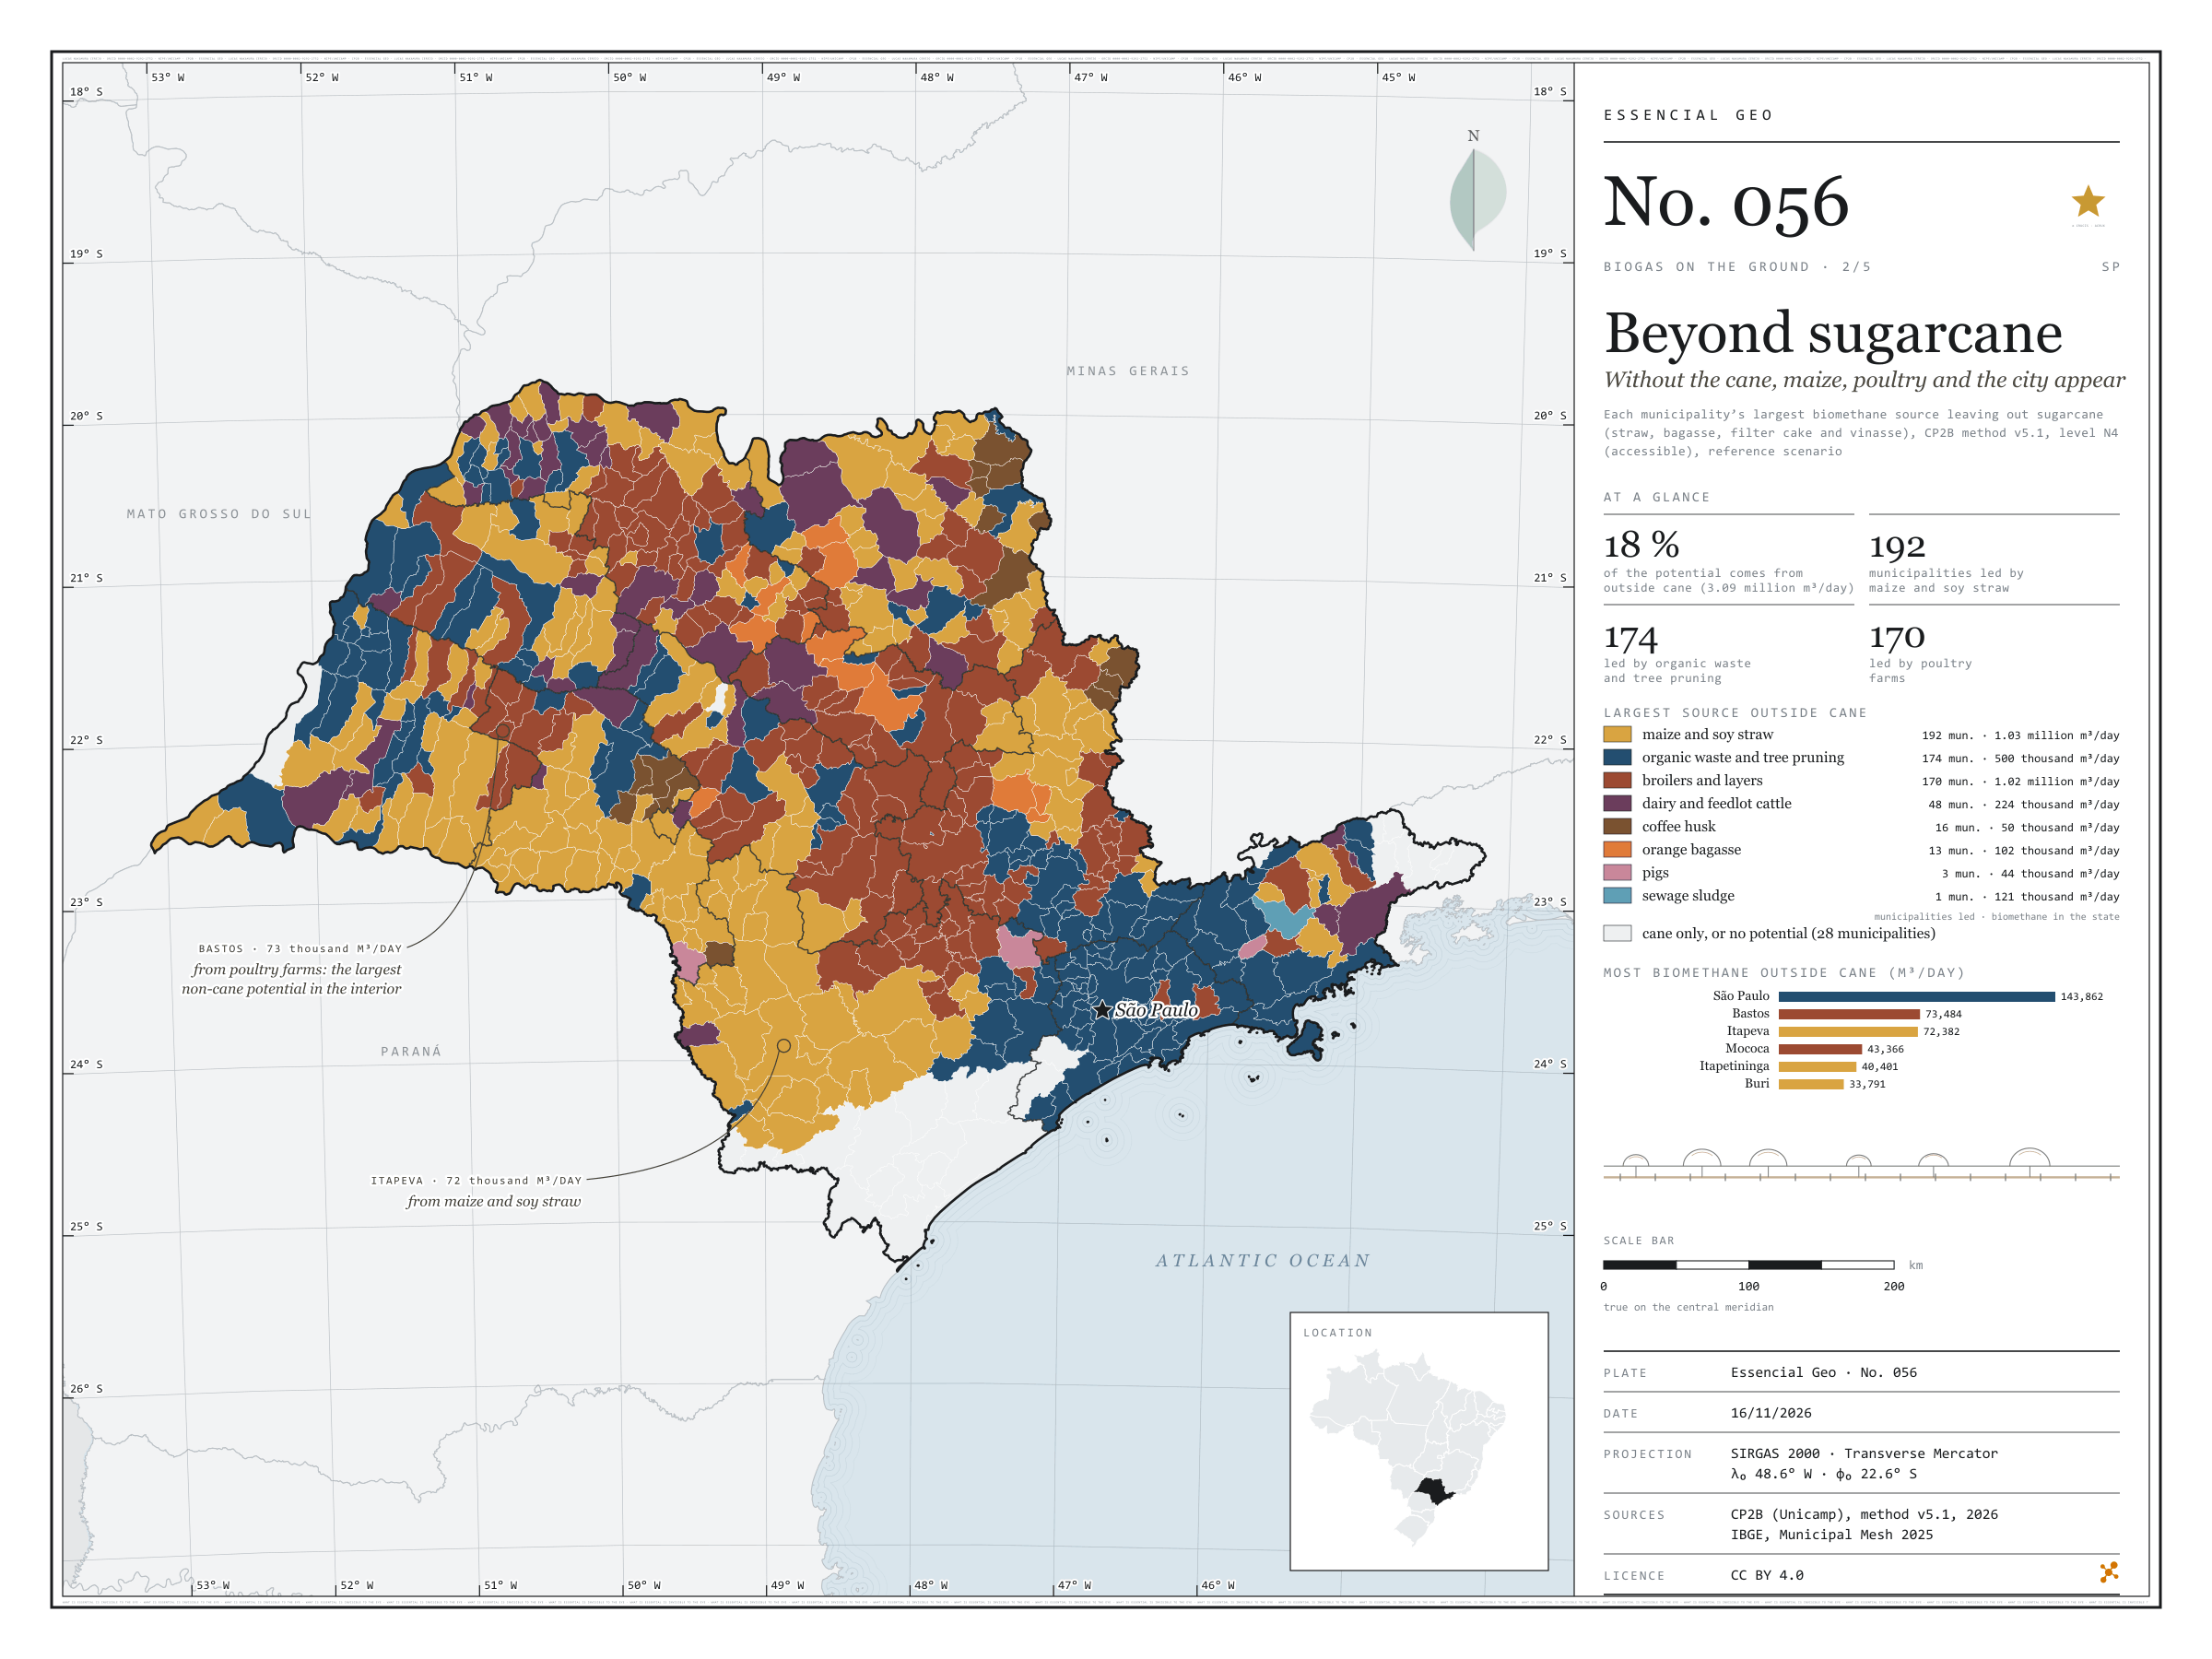
Without the cane, maize, poultry and the city appear
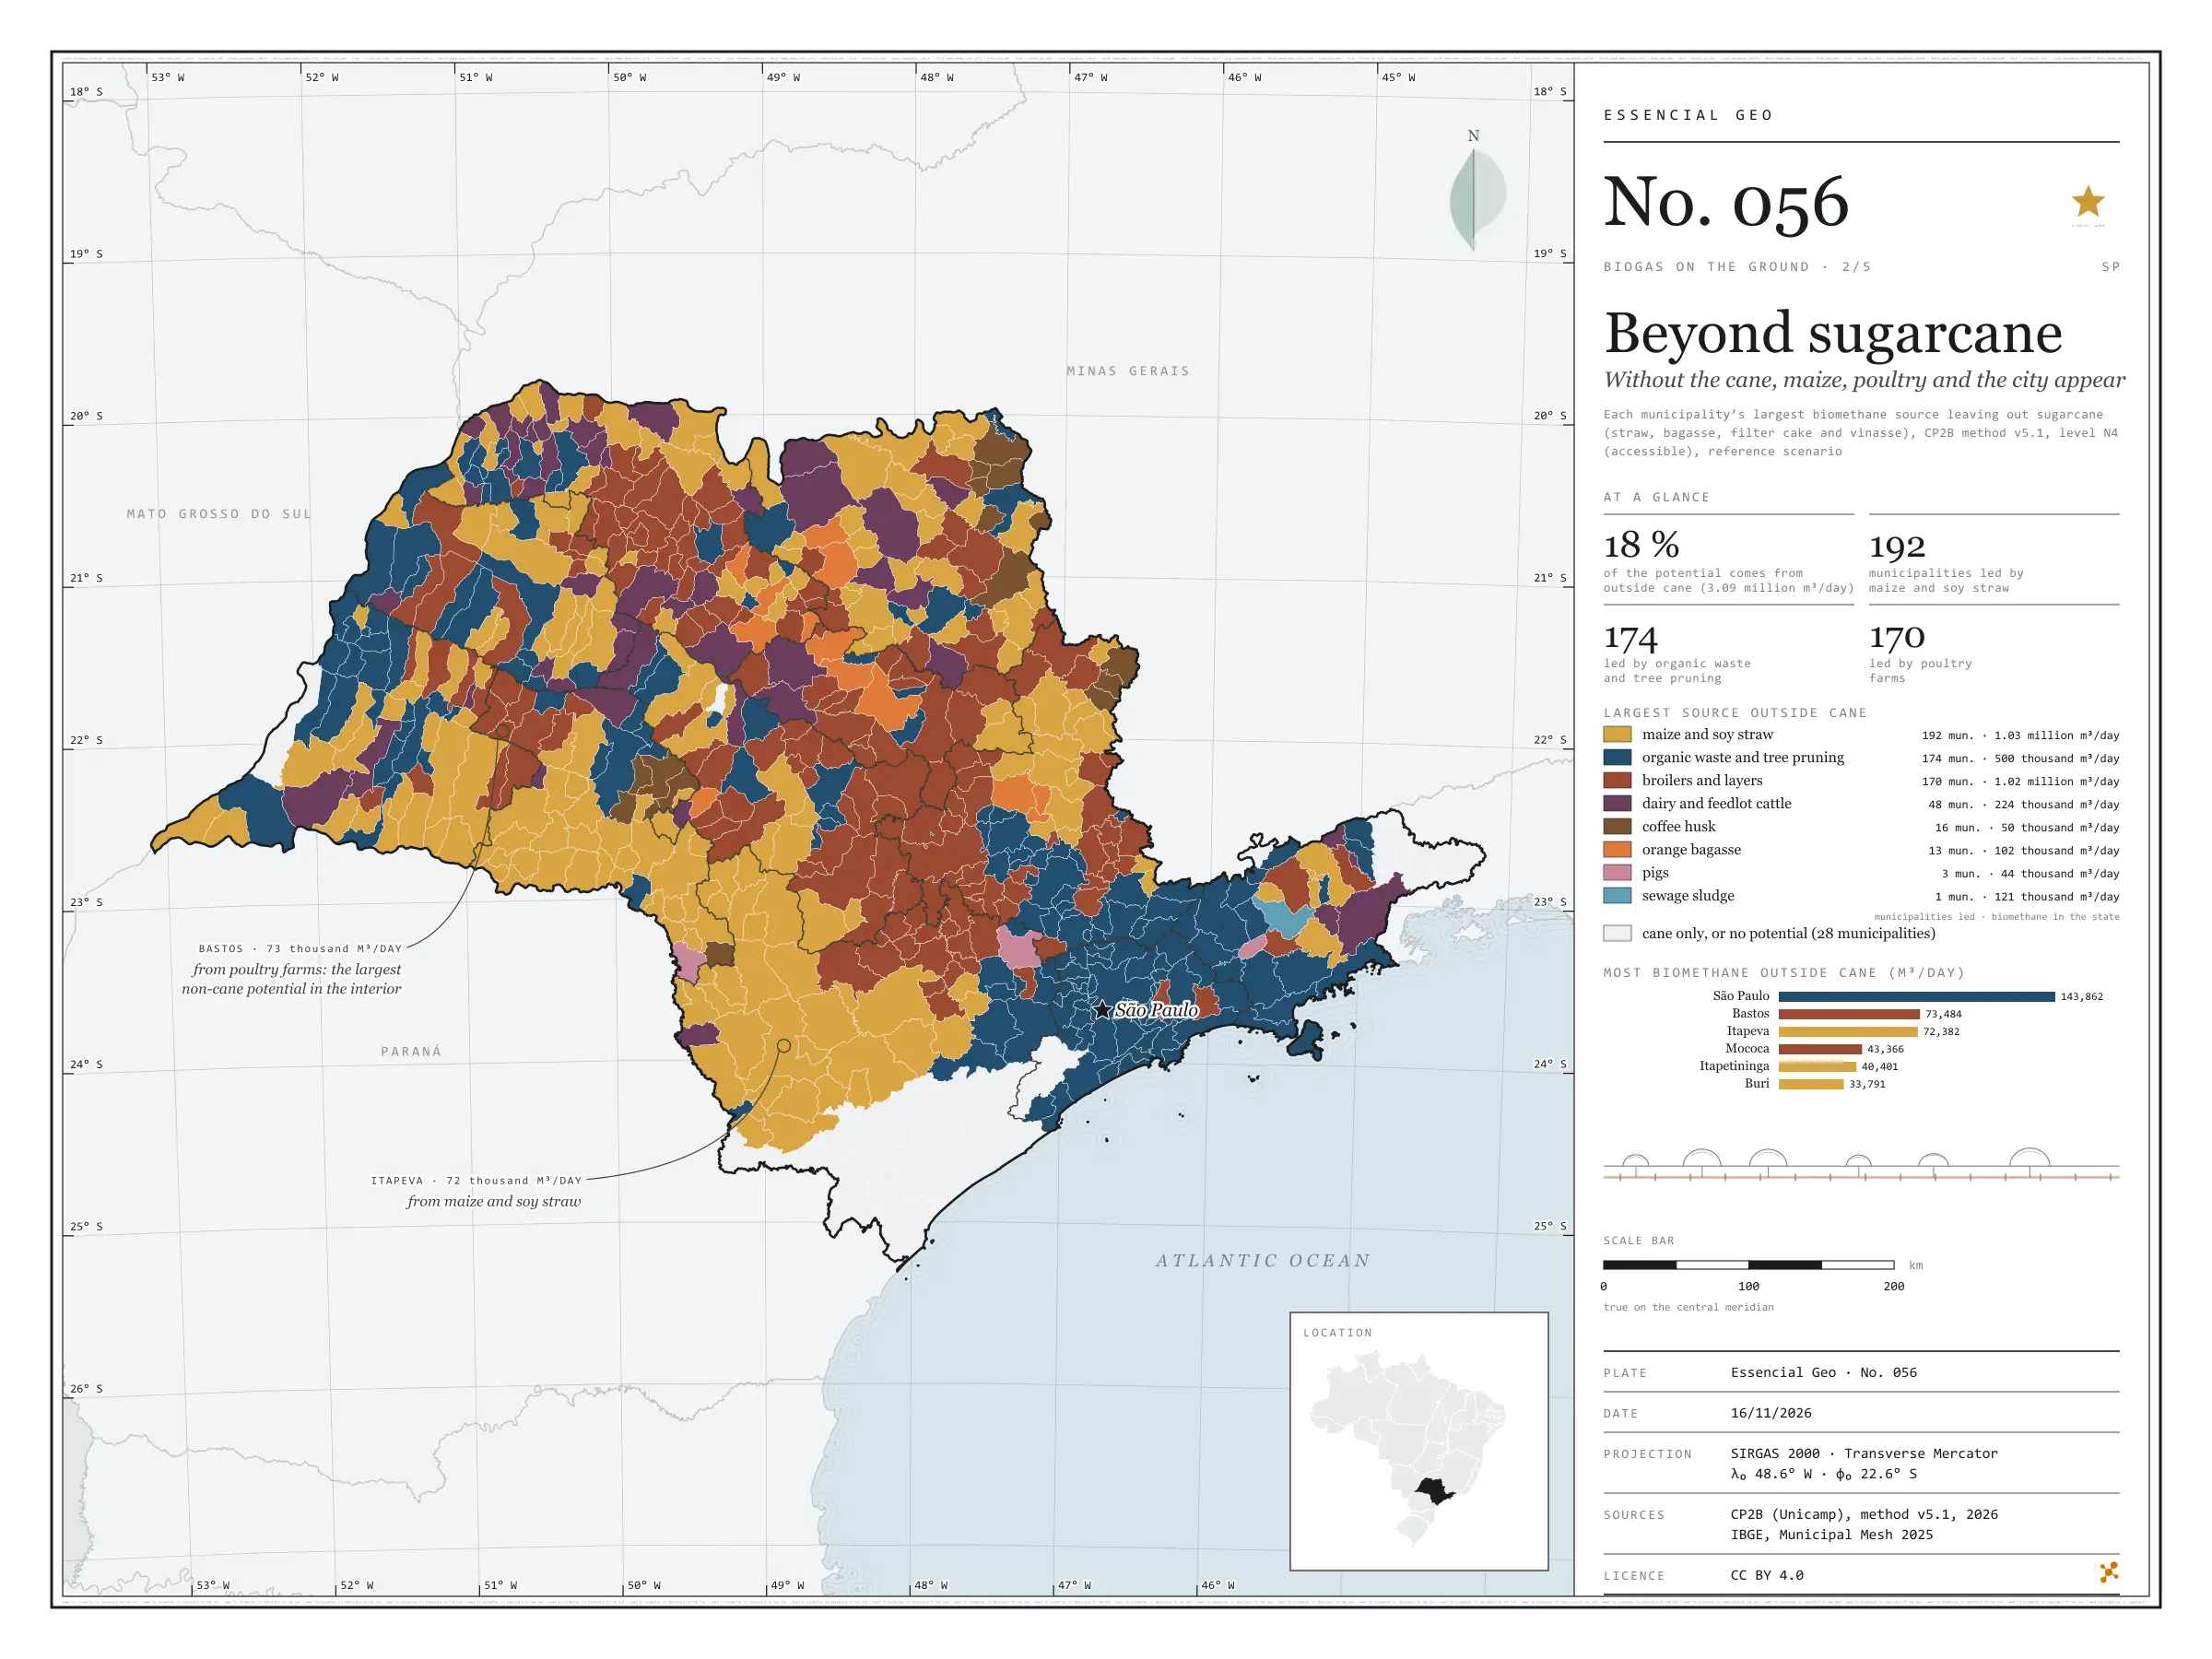
Fig. 056São Paulo State (SP)EPSG:4674Source: CP2B (Unicamp), IBGE
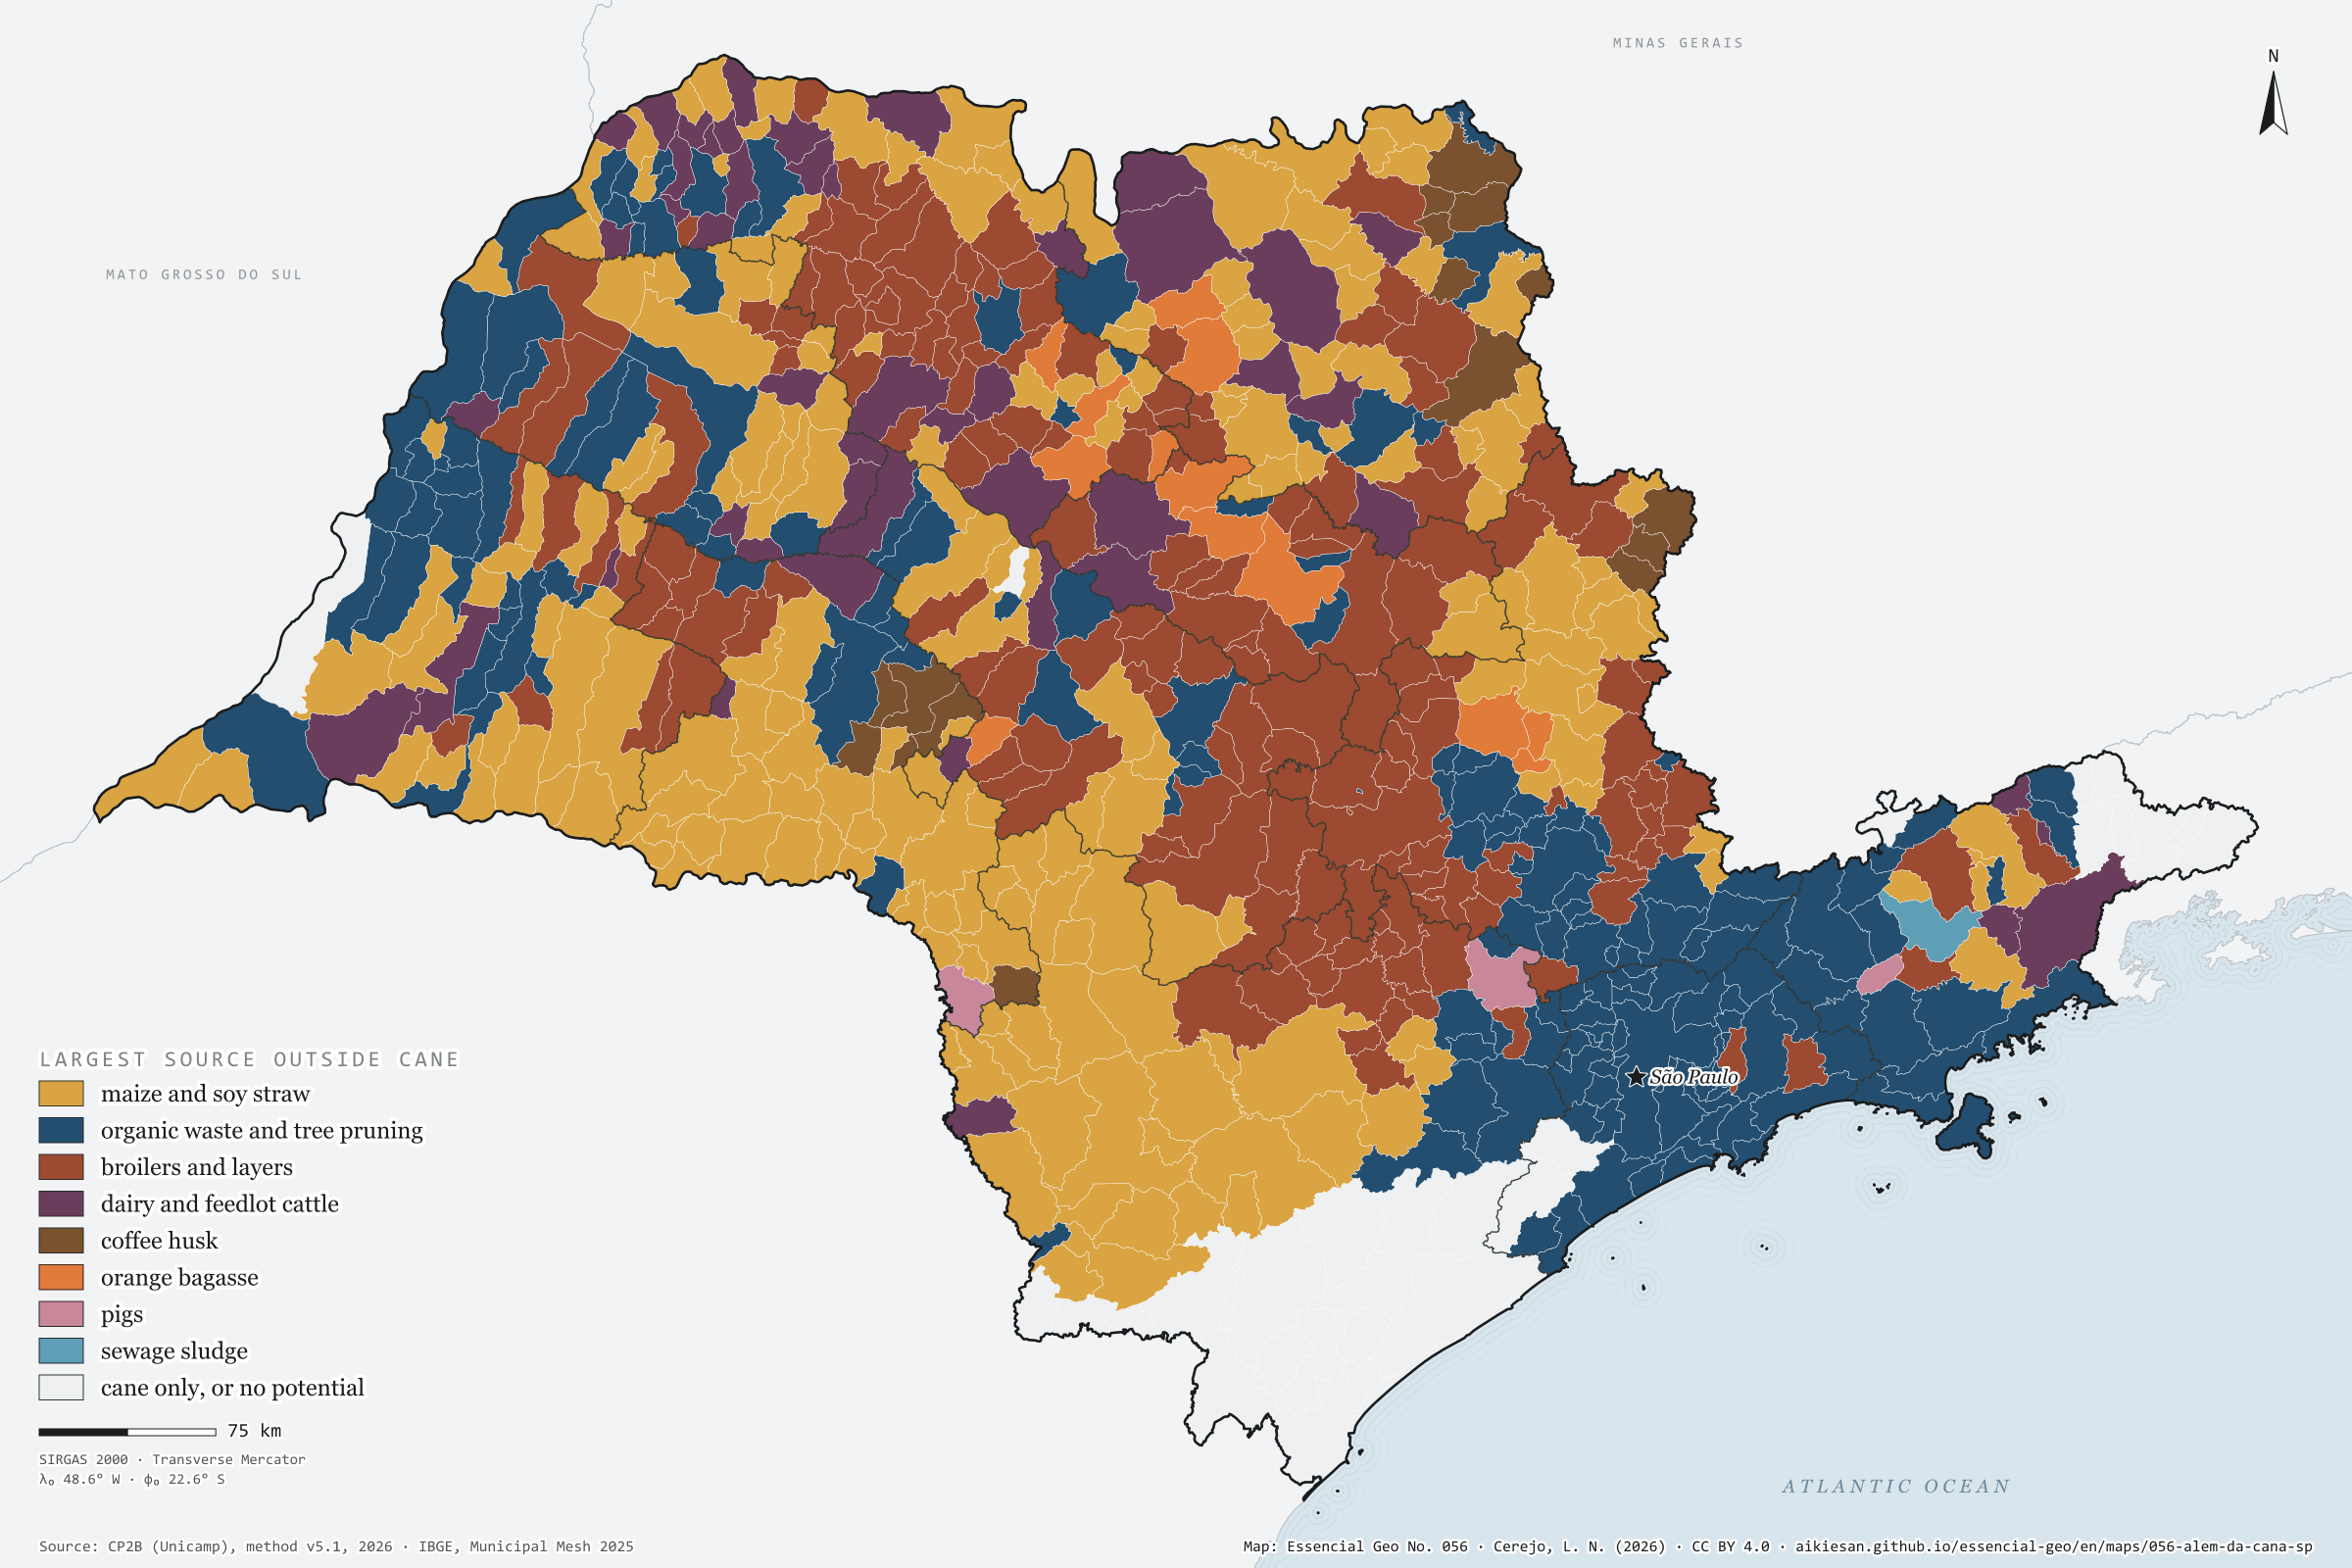
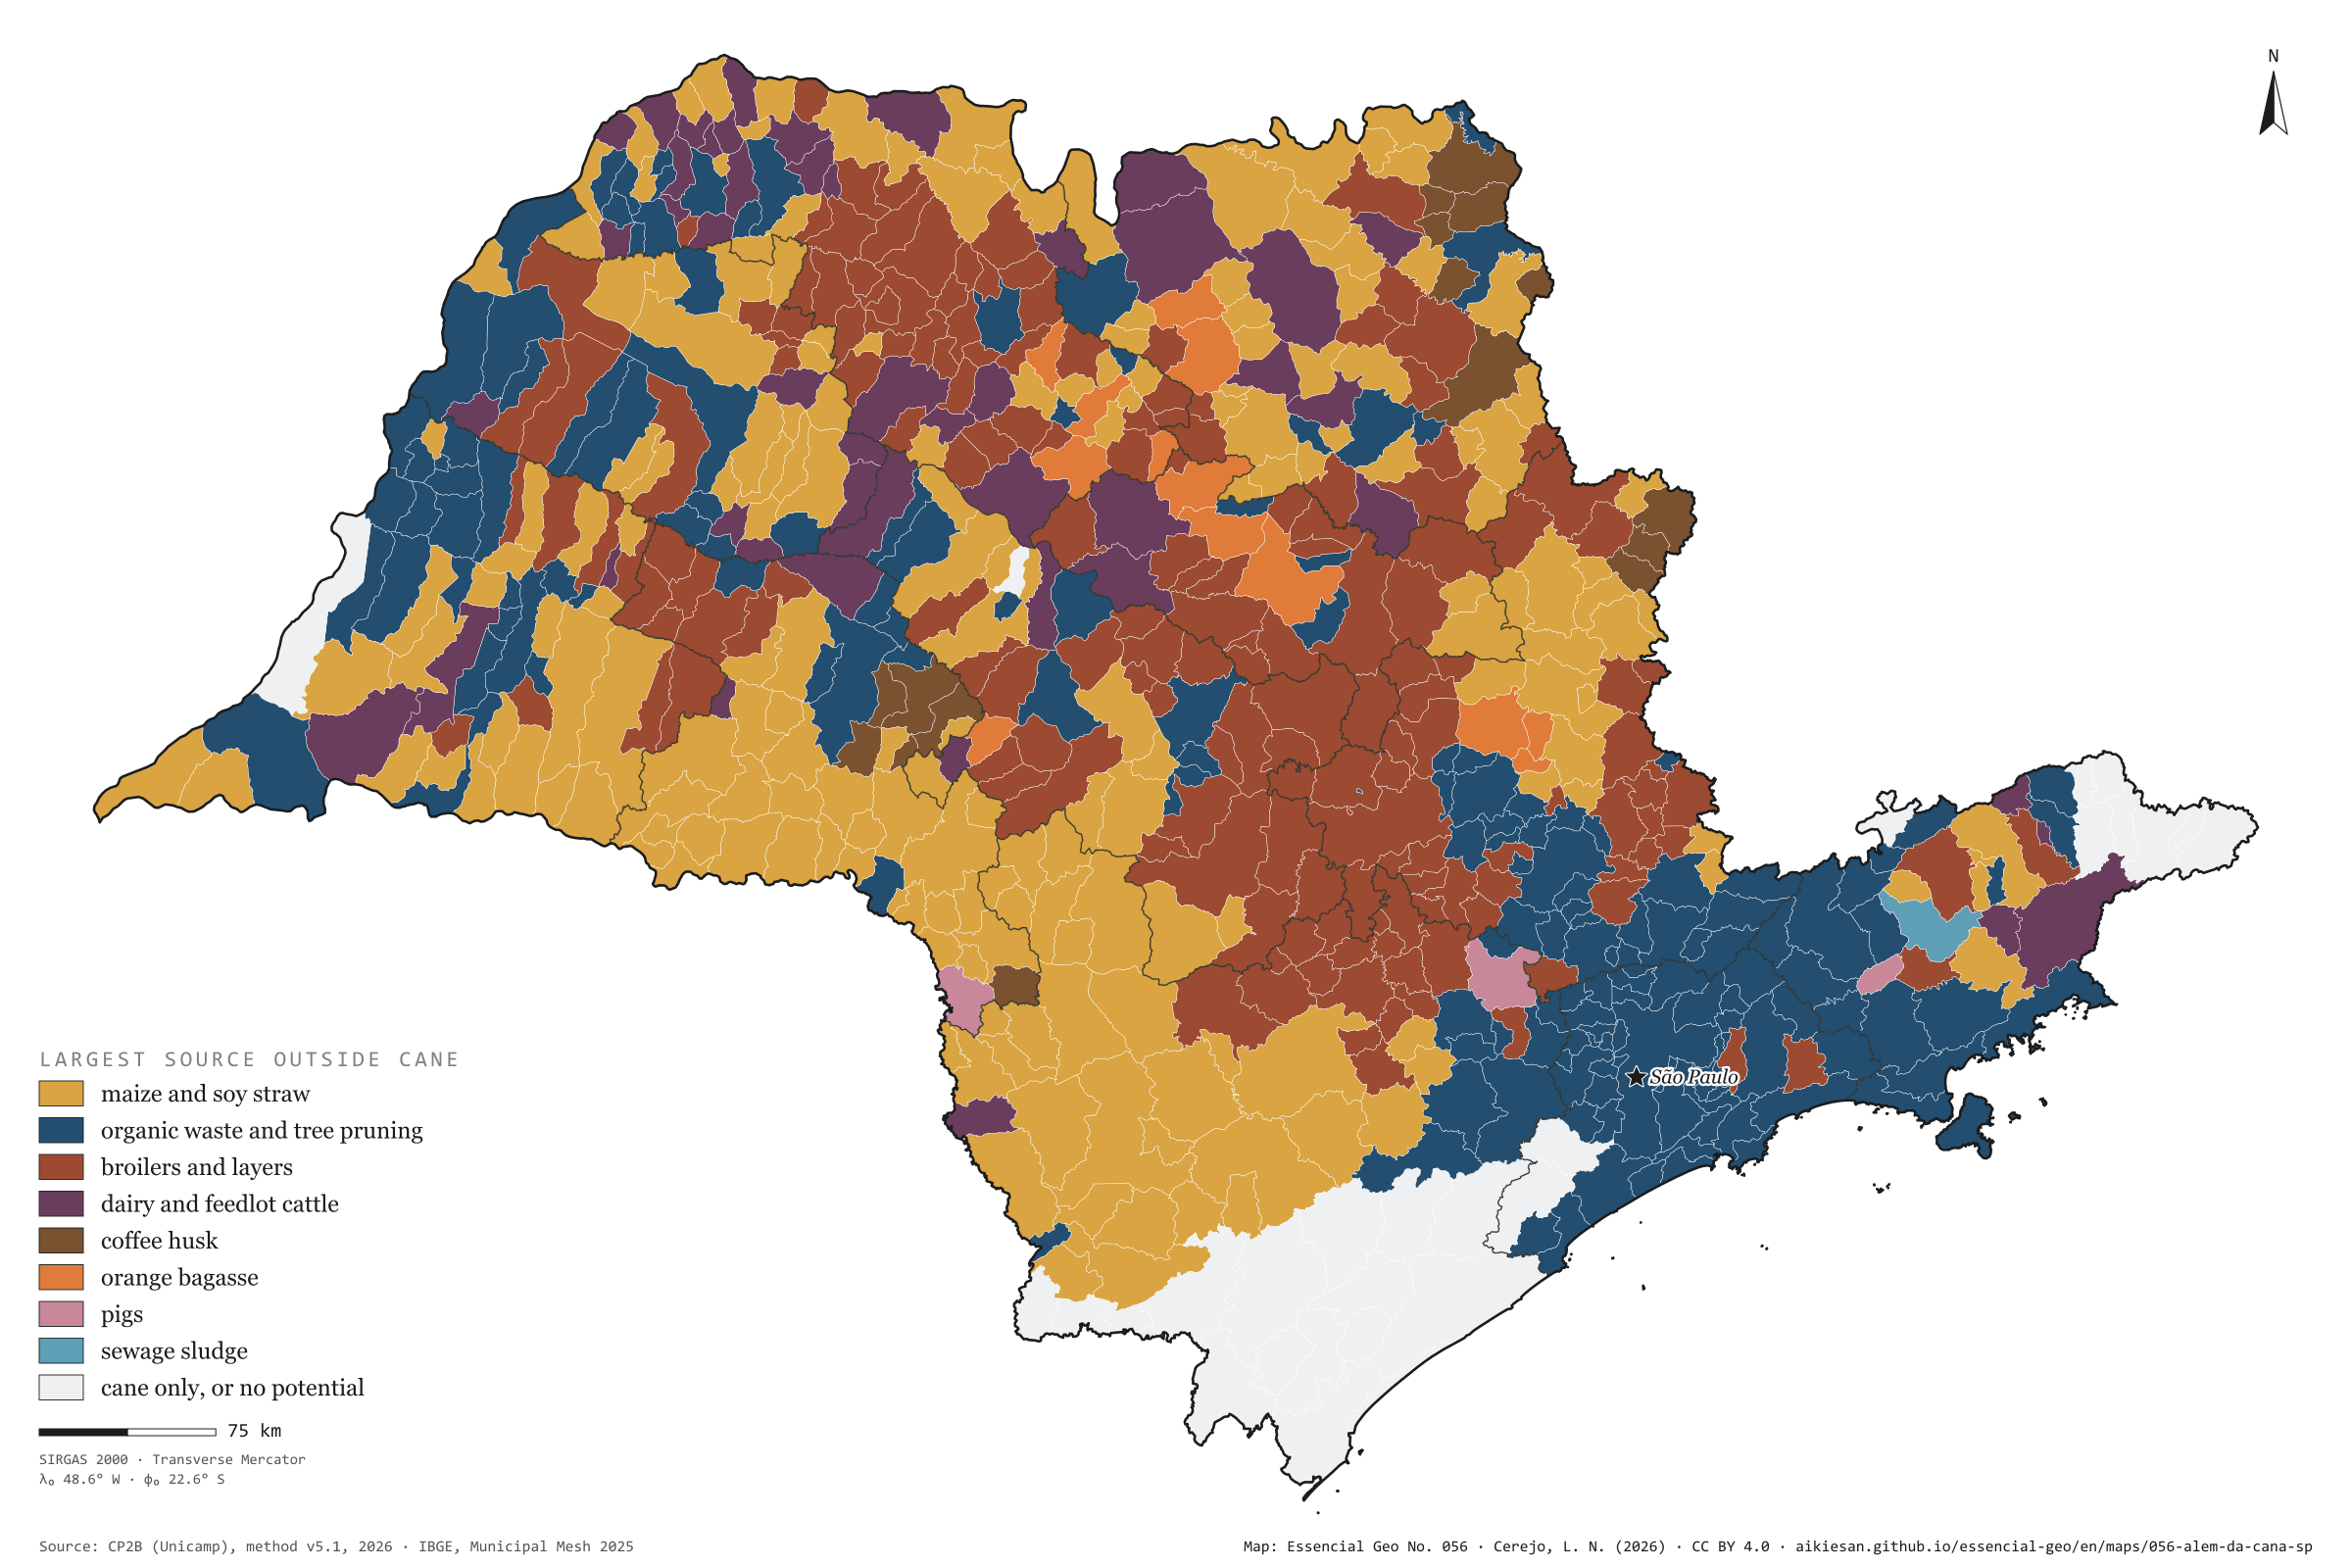
Sugarcane is the largest biomethane source in 370 of São Paulo’s municipalities and accounts for 82% of the state’s potential. The other 18%, 3.09 million m³ a day, draw a different map. With cane removed, maize and soy straw leads in 192 municipalities, scattered across the west and unbroken in the south and south-west, from Itapeva to Itapetininga; organic waste and tree pruning lead in 174, from Greater São Paulo to the Paraíba Valley and the interior’s mid-sized towns; poultry farms lead in 170, mostly in the centre and north of the state, from Bastos to Mococa. Dairy and feedlot cattle lead in 48 municipalities, coffee in 16, oranges in 13. The capital has the largest non-cane potential, 144,000 m³ a day, from waste and sewage; in the interior, the largest is Bastos, with 73,000, from its poultry farms. Second plate of the collection “Biogas on the ground”.
Technical record · downloads · citation
At a glance
Municipalities by largest source outside sugarcane (municipalities)
maize and soy straw29.8%
organic waste and tree pruning27%
broilers and layers26.4%
dairy and feedlot cattle7.4%
coffee husk2.5%
orange bagasse2%
pigs0.5%
sewage sludge0.2%
cane only, or no potential4.3%
Biomethane potential outside sugarcane
3,089,988m³/day
18% of the state’s 16.9 million m³/day
Layers
municipiospolygon645 municipalities: potential by non-cane source and largest source (same GPKG as plate 055)
regioes_intermediariaspolygon11 intermediate geographic regions
limite_estadualpolygonState boundary
Metadata
Sources
CP2B (Unicamp) — biogas and biomethane potential by municipality, method v5.1 (2026) IBGE — Municipal Mesh 2025 (2025)
Biomethane potential by municipality and residue (CP2B method v5.1, level N4, reference scenario), without the four sugarcane residues, summed into eight sources; each municipality gets its largest source.
The map without a frame, with legend, scale, reference system and credit written on it: ready for papers, lectures and slides. In two versions: with the basemap (neighbours and sea) or only the mapped area, on white.
CEREJO, Lucas Nakamura. Além da cana: sem a cana, aparecem o milho, a granja e a cidade. Versão 1.0.0. [S. l.]: Essencial, 2026. Conjunto de dados. Disponível em: https://aikiesan.github.io/essencial-geo/en/maps/056-alem-da-cana-sp/. Acesso em: 10 nov. 2026.
Cerejo, L. N. (2026). Além da cana: sem a cana, aparecem o milho, a granja e a cidade [Beyond sugarcane: Without the cane, maize, poultry and the city appear] (Version 1.0.0) [Data set]. Essencial. https://aikiesan.github.io/essencial-geo/en/maps/056-alem-da-cana-sp/
@dataset{cerejo2026_alem_da_cana_sp,
  author    = {Cerejo, Lucas Nakamura},
  title     = {Além da cana: Sem a cana, aparecem o milho, a granja e a cidade},
  year      = {2026},
  publisher = {Essencial},
  version   = {1.0.0},
  url       = {https://aikiesan.github.io/essencial-geo/en/maps/056-alem-da-cana-sp/},
  language  = {portuguese},
  note      = {English title: Beyond sugarcane: Without the cane, maize, poultry and the city appear. Licence CC BY 4.0}
}
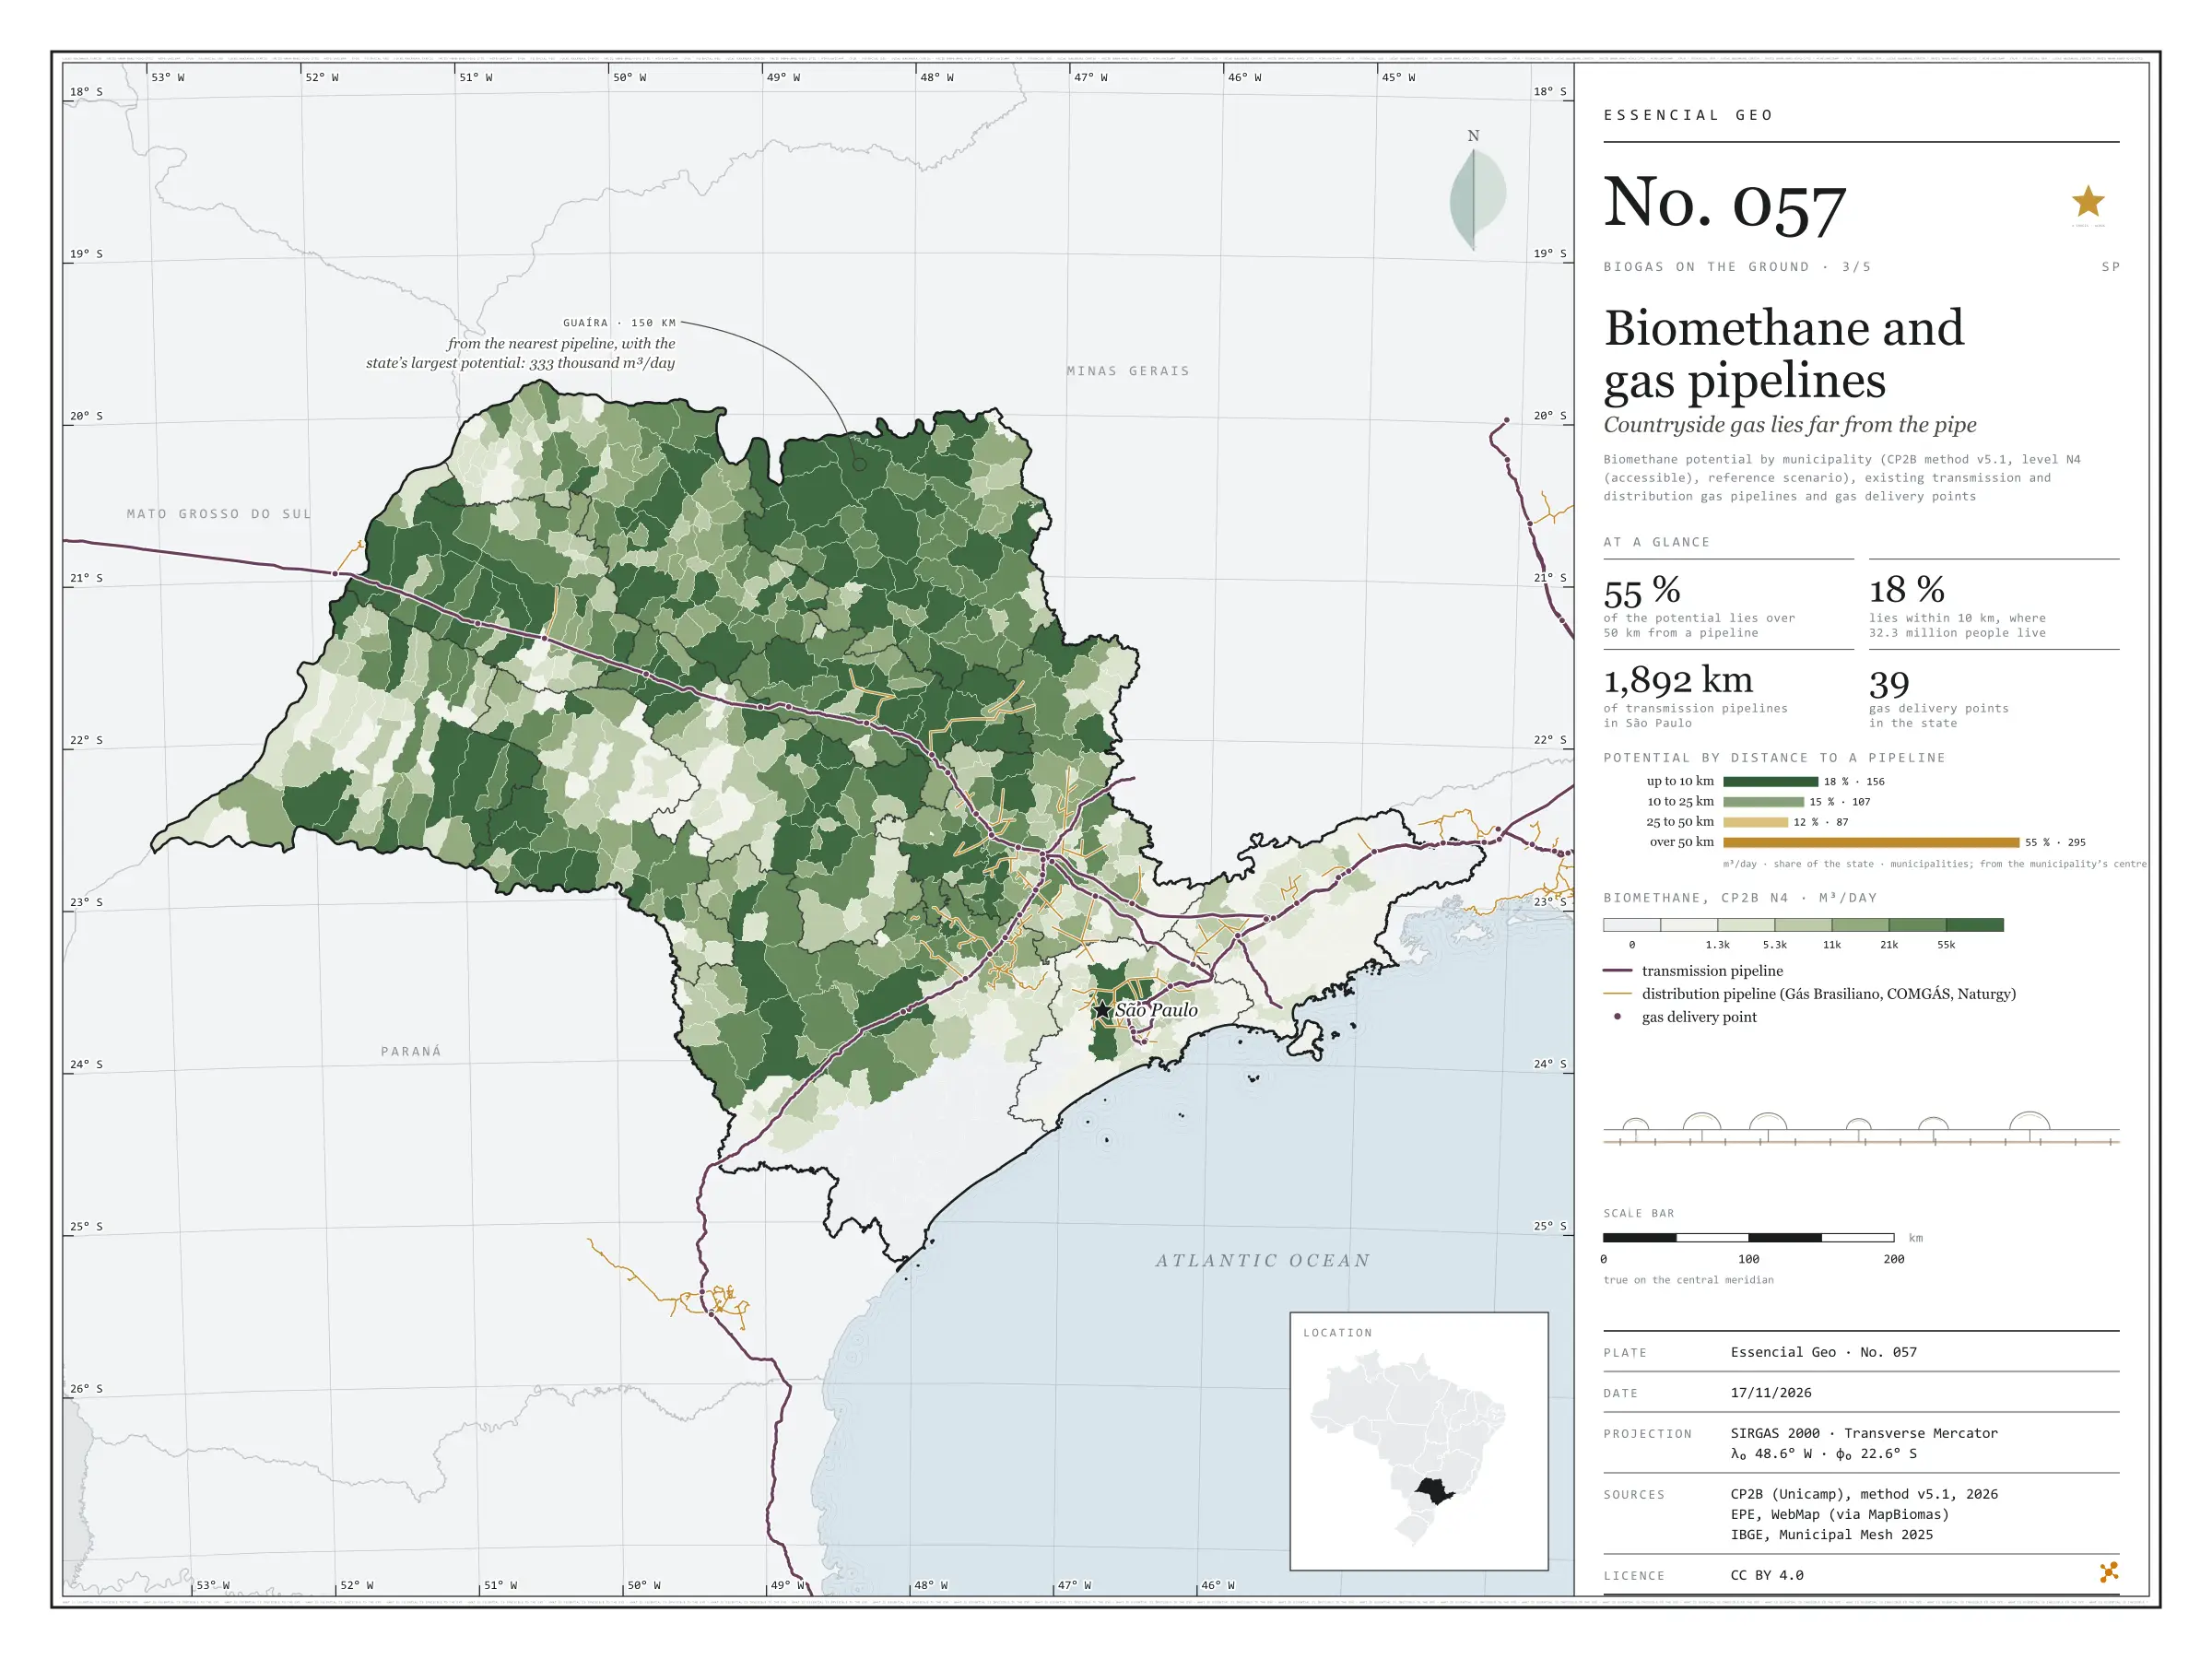
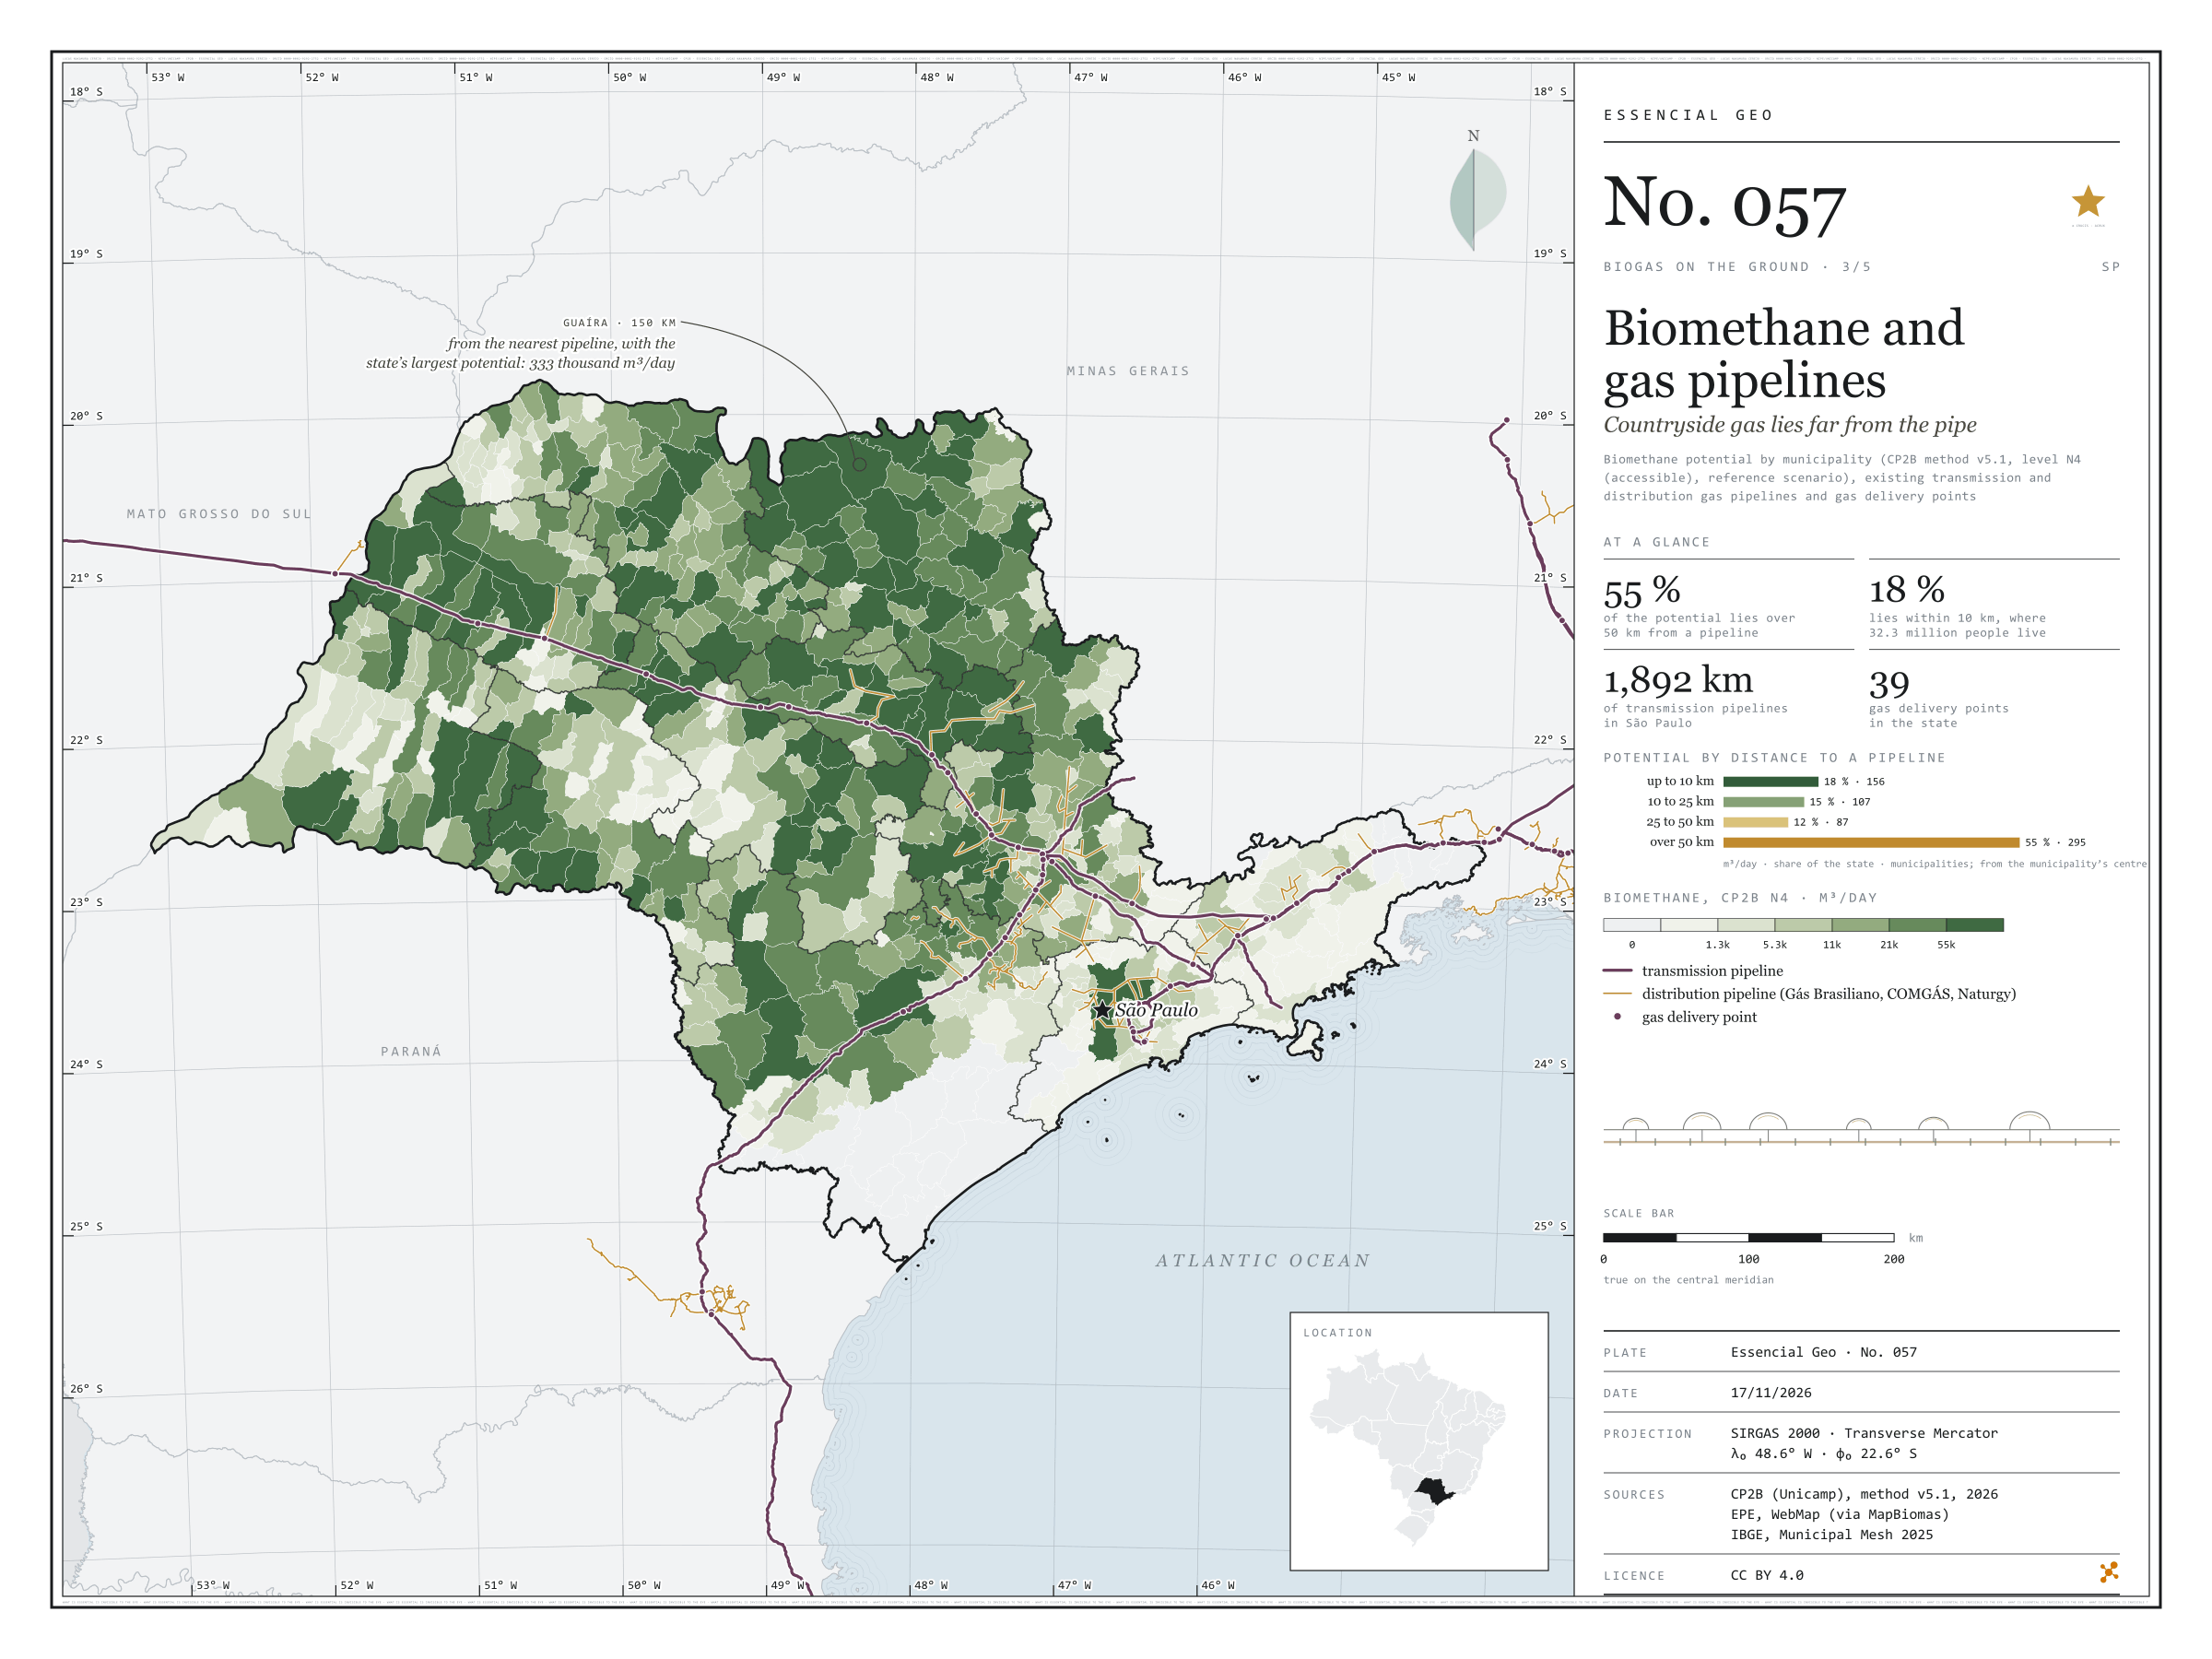
Fig. 057São Paulo State (SP)EPSG:4674Source: CP2B (Unicamp), EPE, IBGE
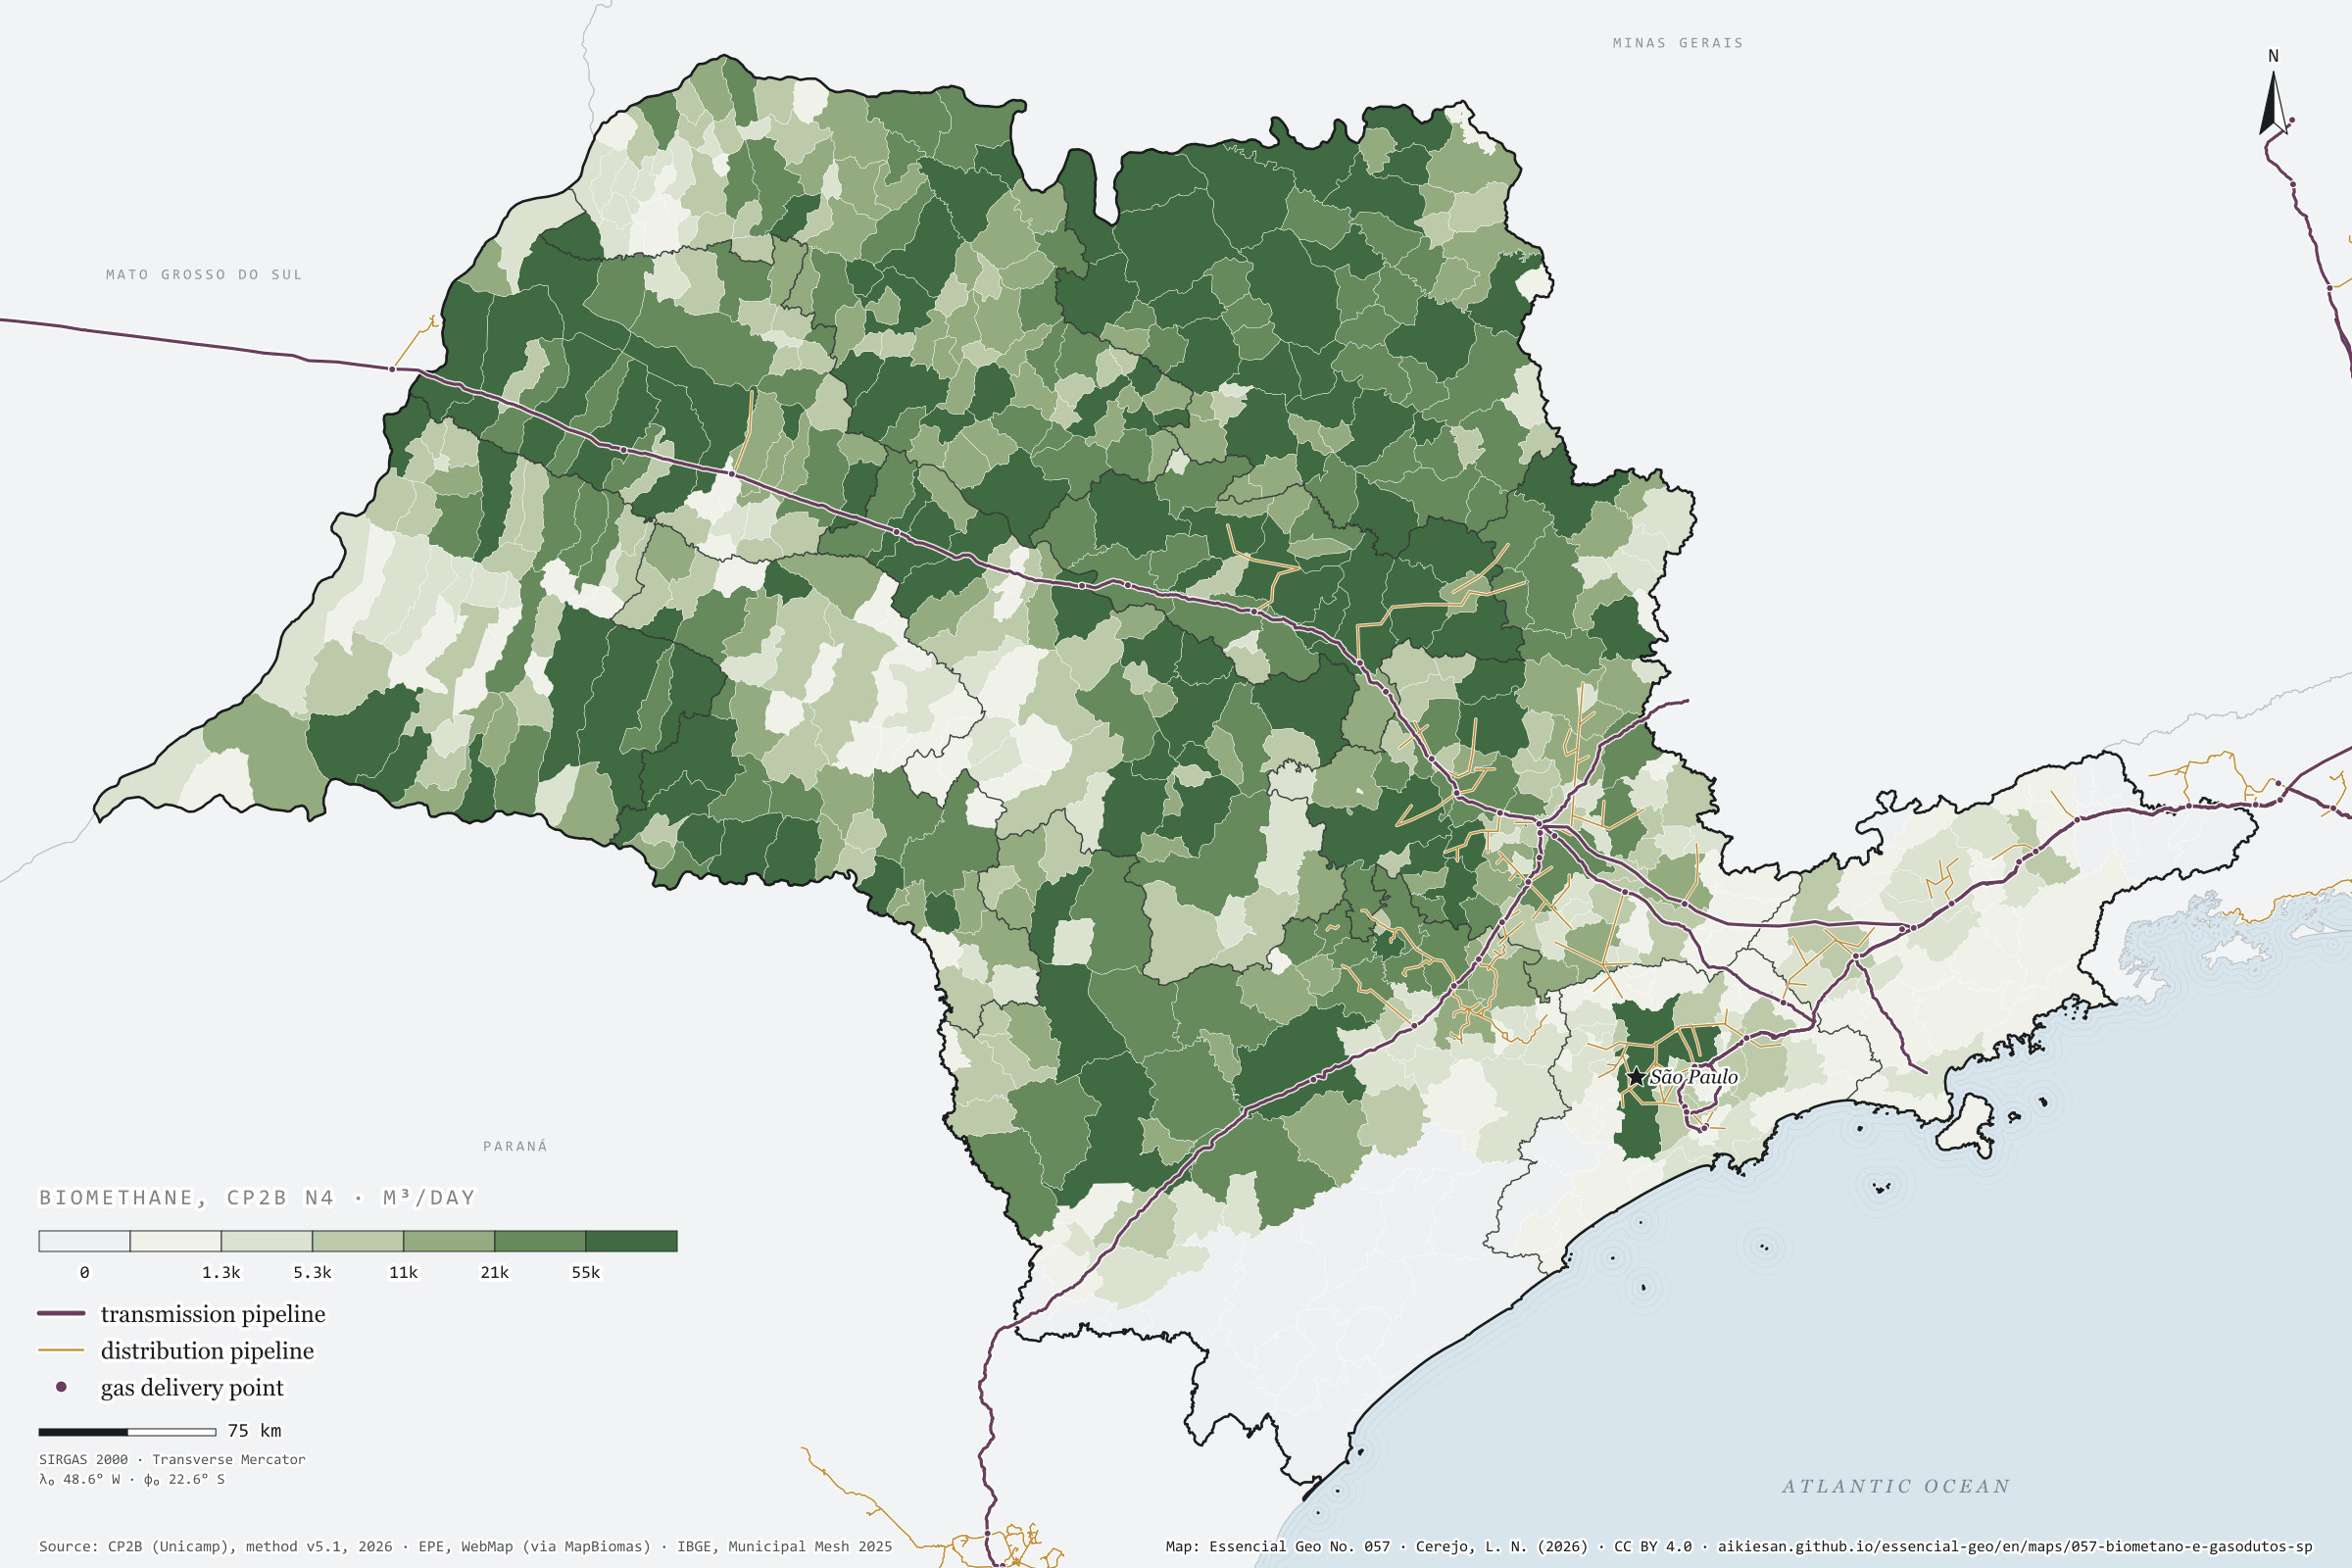
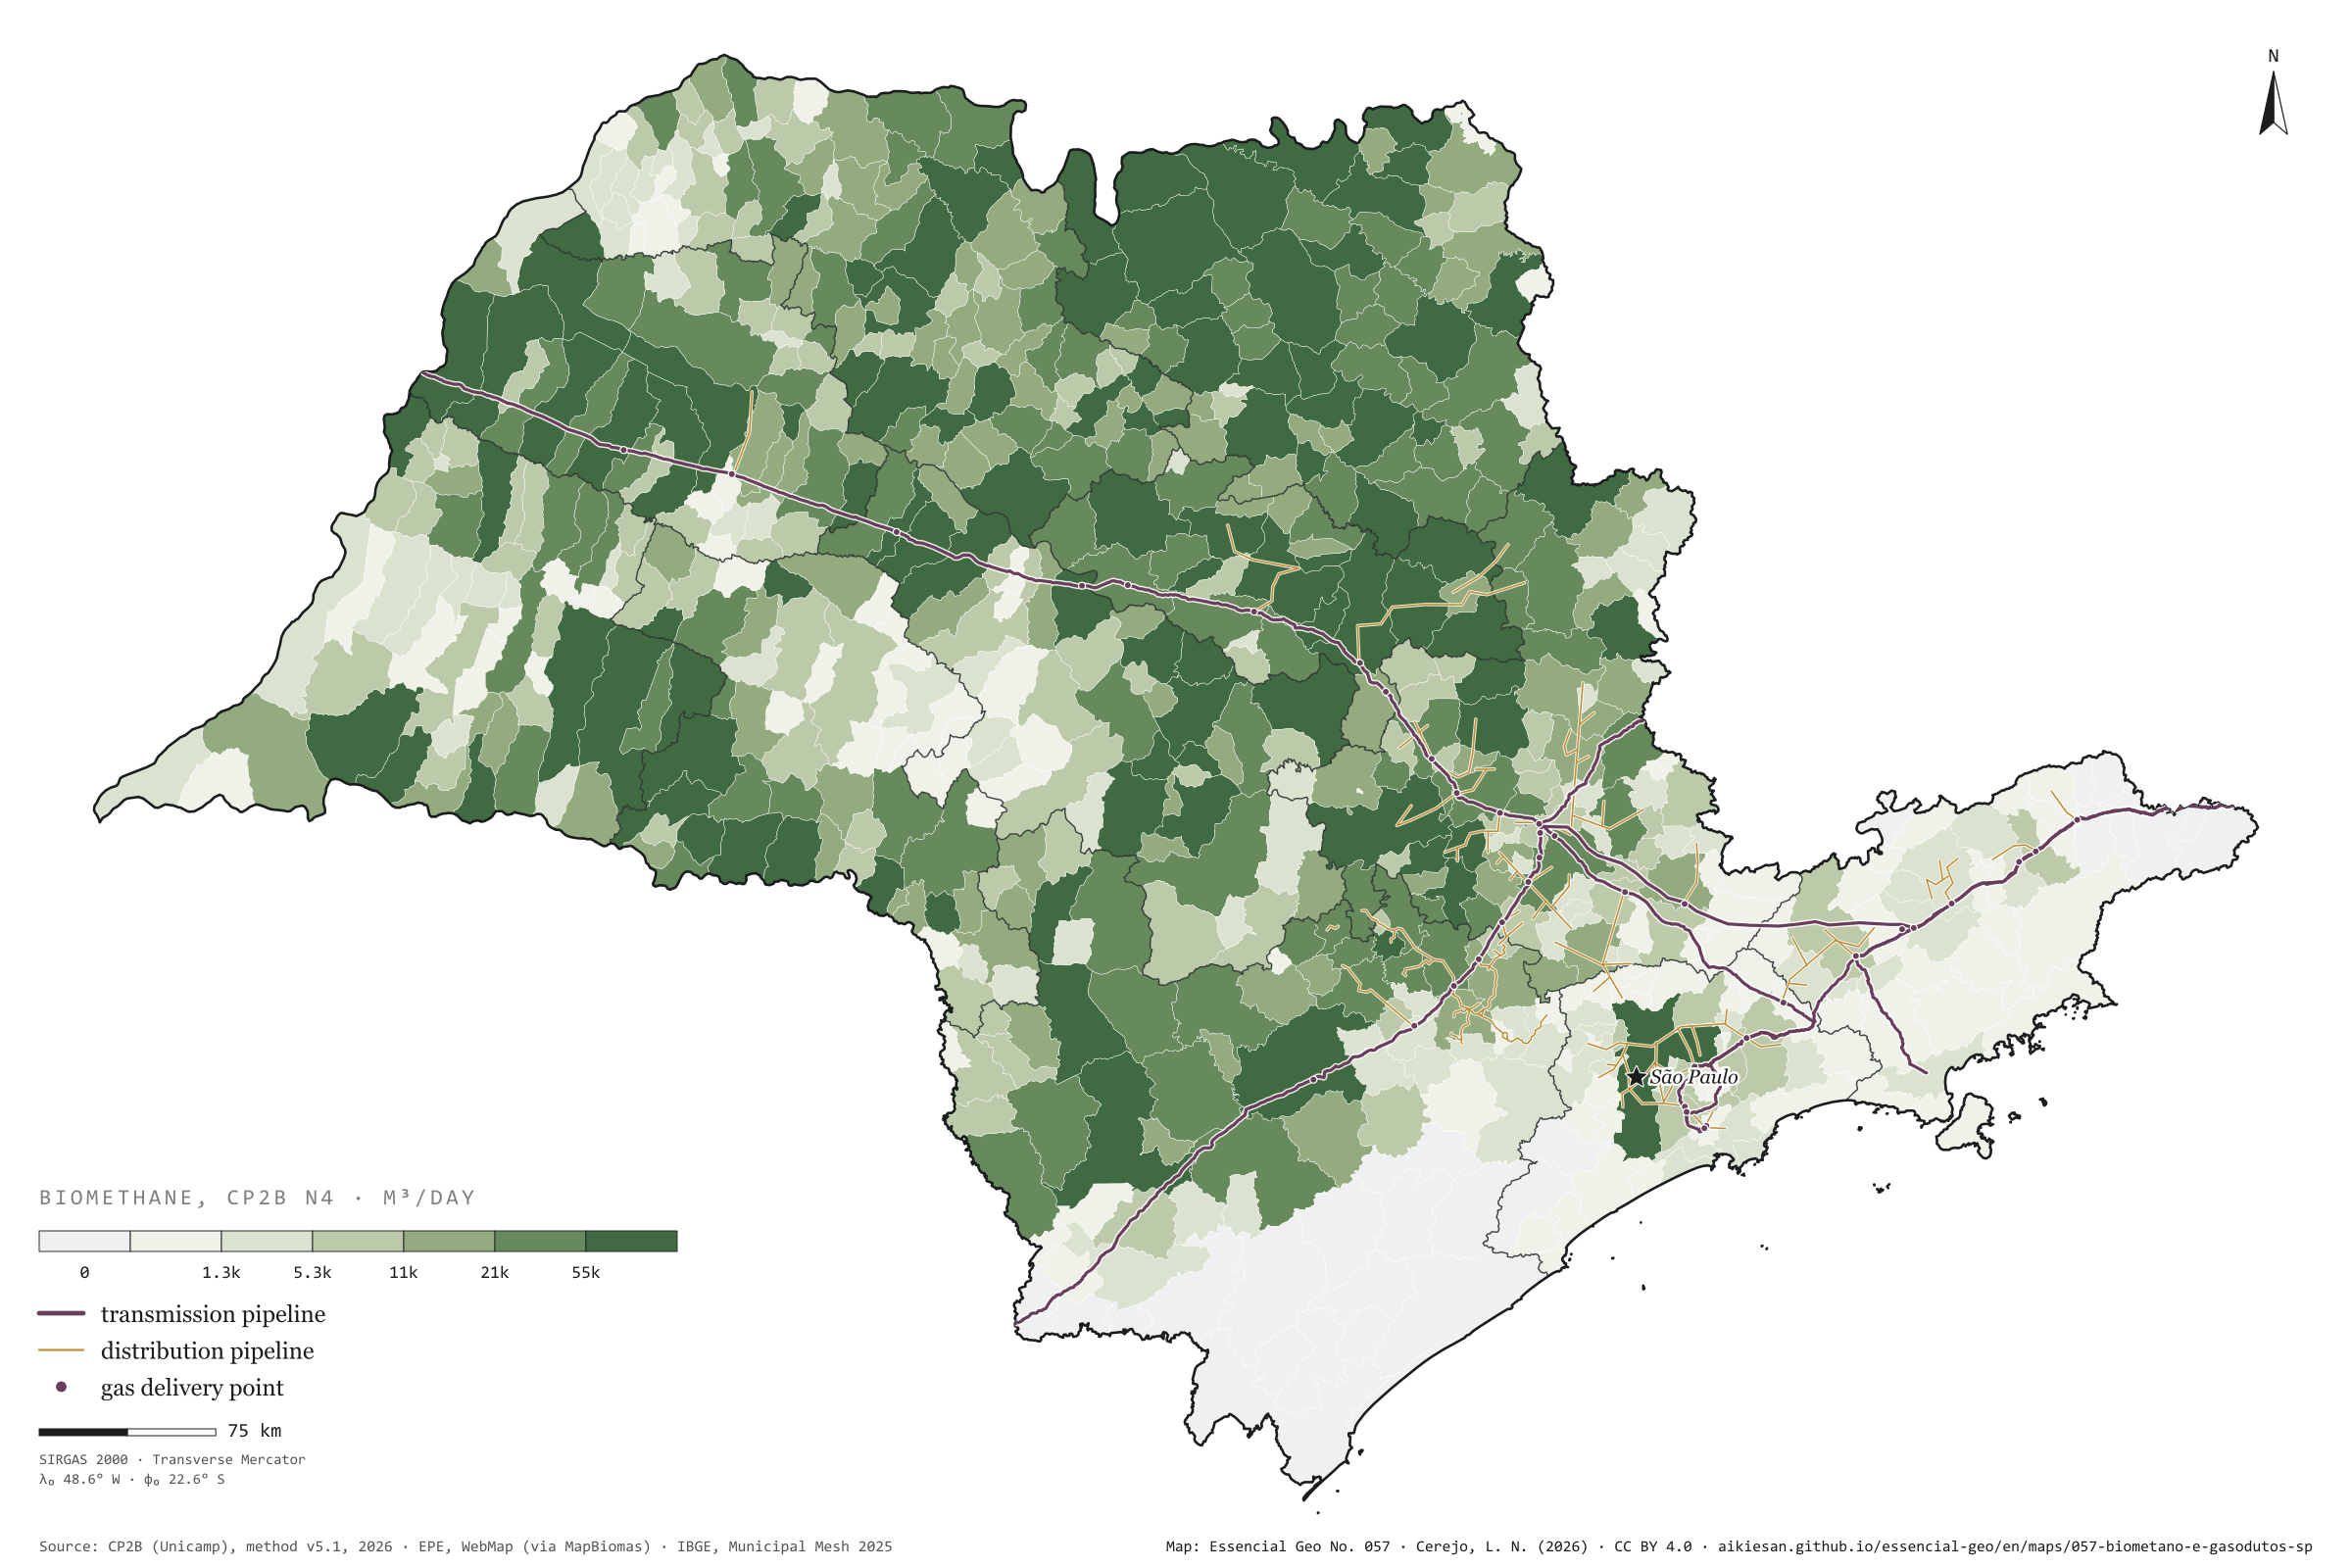
Biomethane is renewable natural gas: to reach its users it needs a pipeline, or a lorry. In São Paulo, transmission pipelines add up to 1,892 km, along an axis that comes from Mato Grosso do Sul on the Gasbol, passes Campinas and runs down to the capital and the Paraíba Valley; the distribution networks of Comgás, Gás Brasiliano and Naturgy cluster around it. The potential does not. Measured from the centre of each municipality to the nearest pipeline, 55% of the state’s possible biomethane lies over 50 km from a pipe; only 18% lies within 10 km, in 156 municipalities home to 32 million people. Guaíra, the state’s largest potential at 333,000 m³ a day, is 150 km from the nearest pipeline; Morro Agudo, the second, 103 km. The sugarcane north is a gas field without a pipe. Third plate of the collection “Biogas on the ground”.
Technical record · downloads · citation
At a glance
Biomethane by distance to the nearest pipeline (m³/day)
up to 10 km17.7%
10 to 25 km15%
25 to 50 km12.1%
over 50 km55.2%
Distance from Guaíra, the largest potential, to the nearest pipeline
150km
Layers
municipiospolygon645 municipalities: potential and distances to pipelines and delivery points (same GPKG as plate 055)
gasodutos_transporteline13 existing transmission pipelines, 1,892 km inside SP
gasodutos_distribuicaolineDistribution networks (Comgás, Gás Brasiliano, Naturgy and neighbours)
pontos_entregapoint62 existing delivery points, 39 in SP
Straight-line distance from each municipality’s interior point to the nearest existing transmission or distribution gas pipeline, in four bands, crossed with the biomethane potential (CP2B method v5.1, level N4, reference scenario).
The map without a frame, with legend, scale, reference system and credit written on it: ready for papers, lectures and slides. In two versions: with the basemap (neighbours and sea) or only the mapped area, on white.
CEREJO, Lucas Nakamura. Biometano e gasodutos: o gás do campo fica longe do cano. Versão 1.0.0. [S. l.]: Essencial, 2026. Conjunto de dados. Disponível em: https://aikiesan.github.io/essencial-geo/en/maps/057-biometano-e-gasodutos-sp/. Acesso em: 10 nov. 2026.
Cerejo, L. N. (2026). Biometano e gasodutos: o gás do campo fica longe do cano [Biomethane and gas pipelines: Countryside gas lies far from the pipe] (Version 1.0.0) [Data set]. Essencial. https://aikiesan.github.io/essencial-geo/en/maps/057-biometano-e-gasodutos-sp/
@dataset{cerejo2026_biometano_e_gasodutos_sp,
  author    = {Cerejo, Lucas Nakamura},
  title     = {Biometano e gasodutos: O gás do campo fica longe do cano},
  year      = {2026},
  publisher = {Essencial},
  version   = {1.0.0},
  url       = {https://aikiesan.github.io/essencial-geo/en/maps/057-biometano-e-gasodutos-sp/},
  language  = {portuguese},
  note      = {English title: Biomethane and gas pipelines: Countryside gas lies far from the pipe. Licence CC BY 4.0}
}
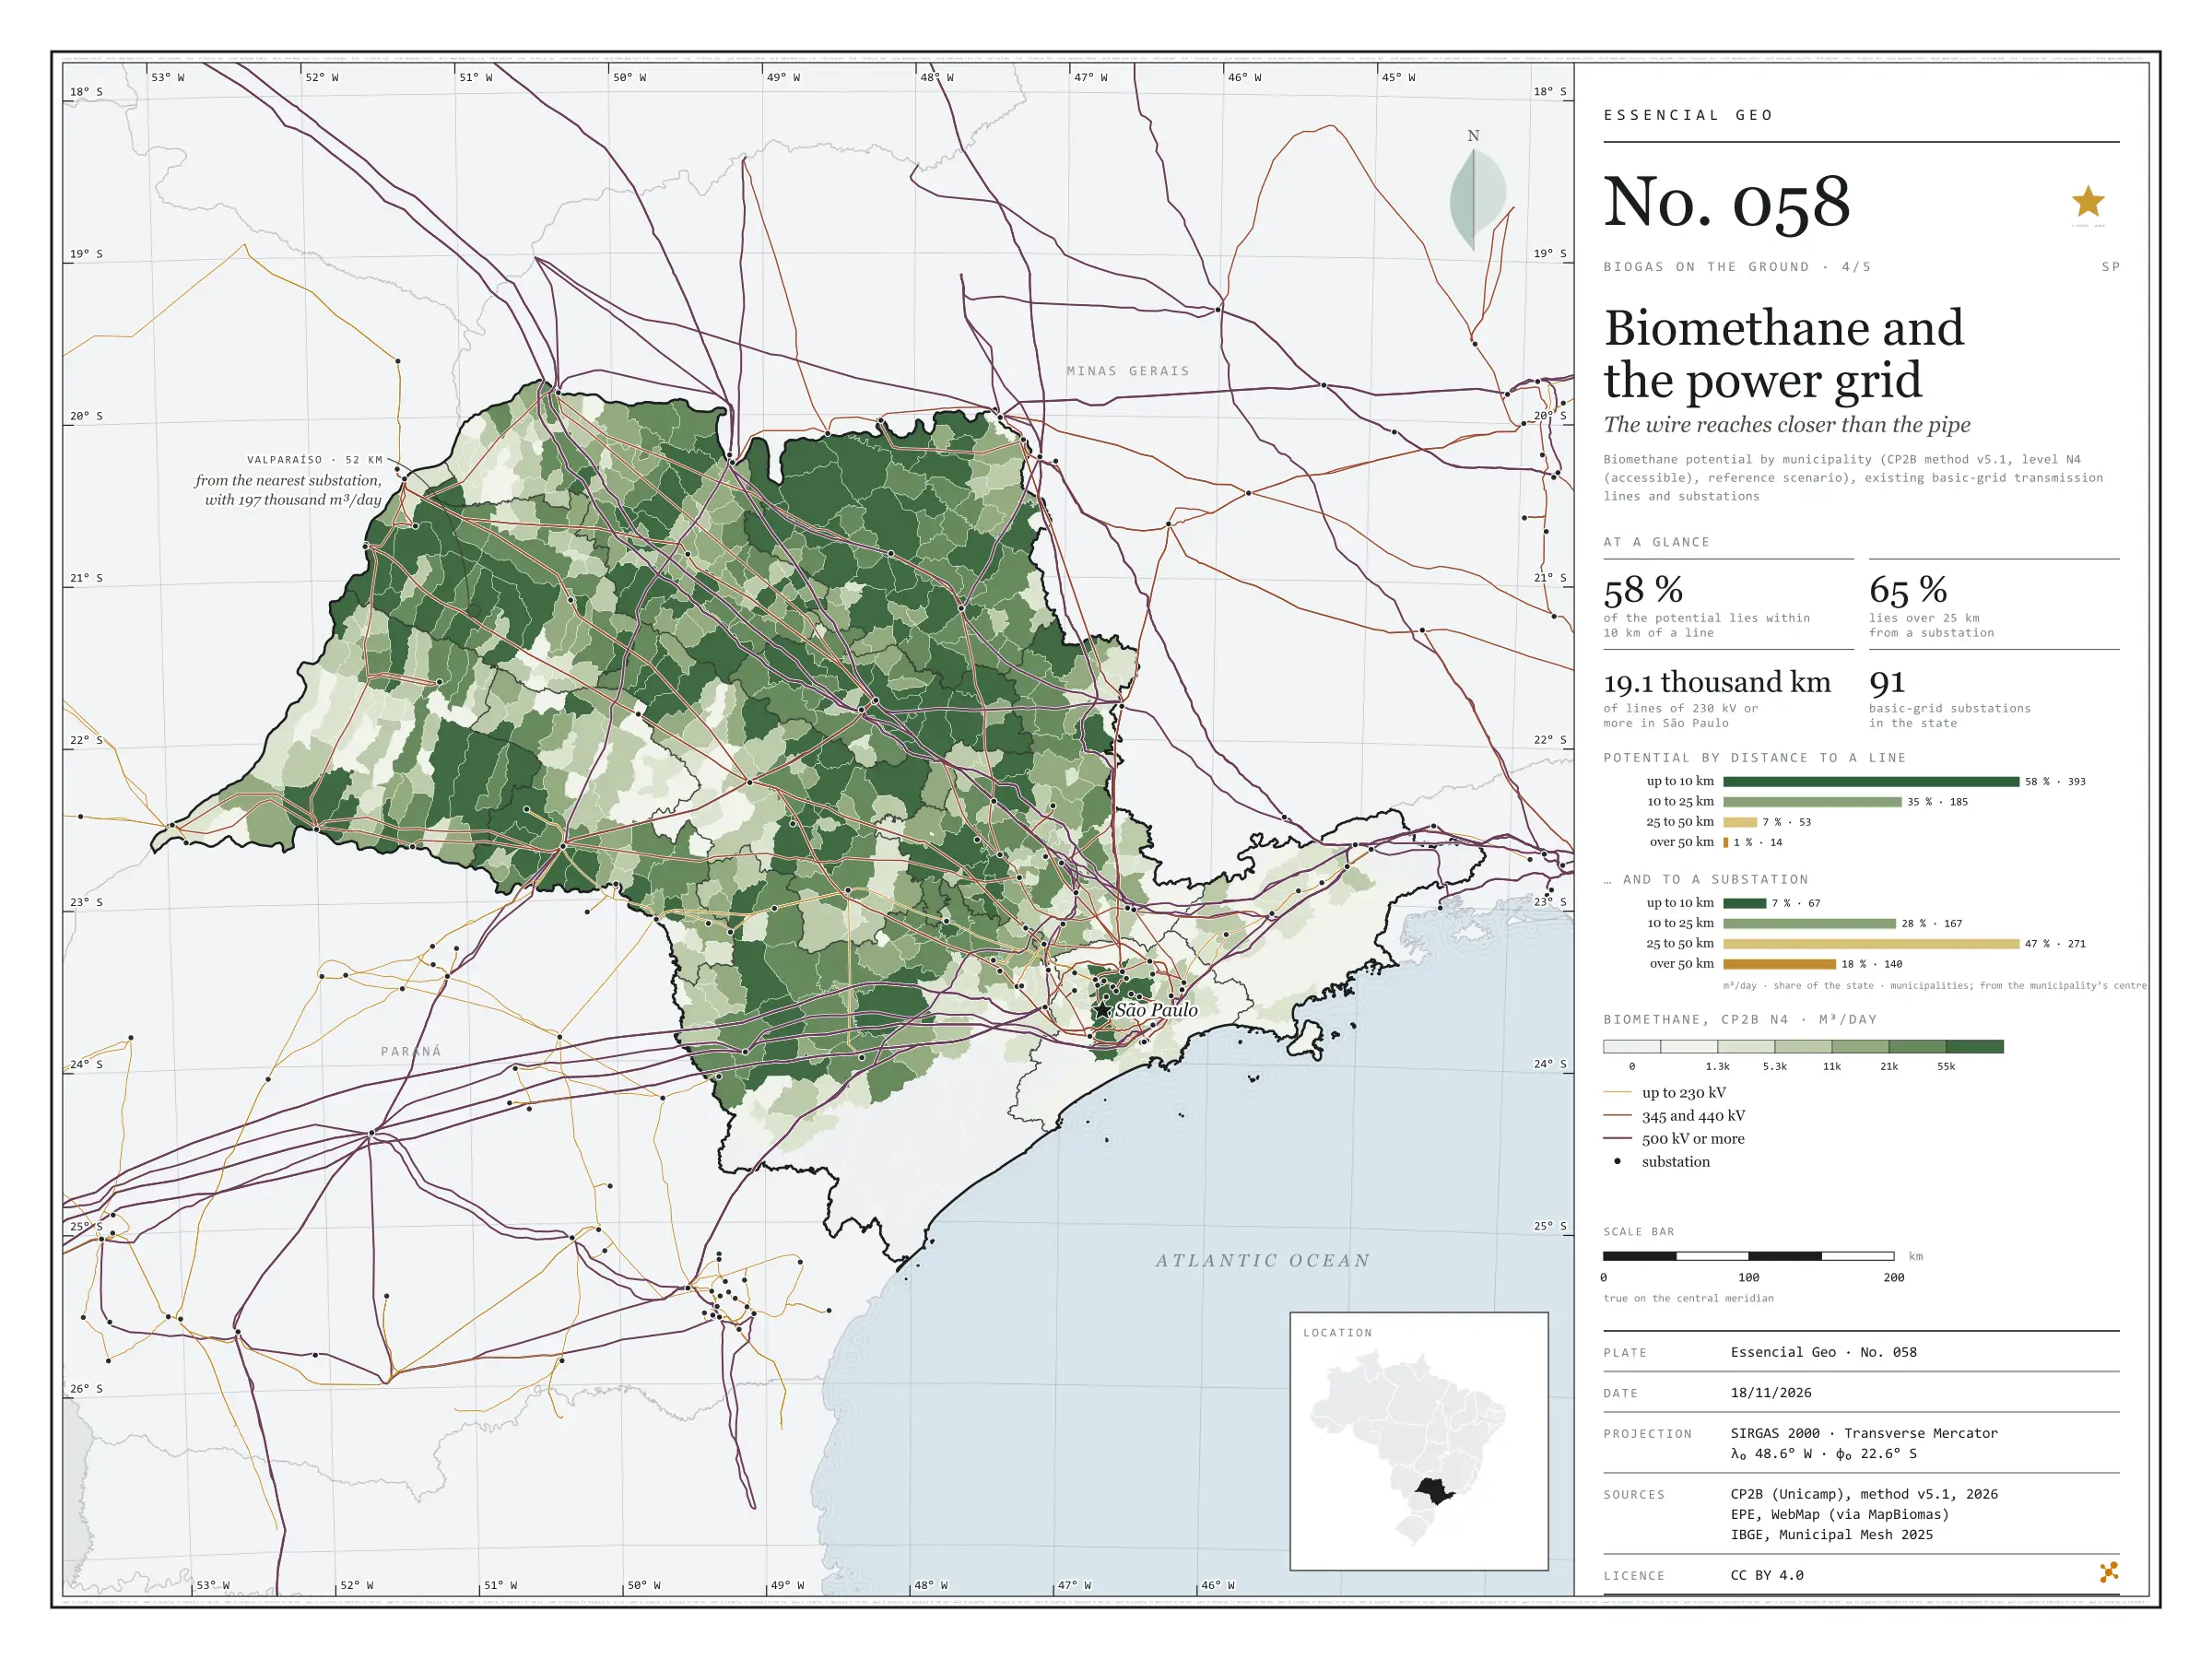
Fig. 058São Paulo State (SP)EPSG:4674Source: CP2B (Unicamp), EPE, IBGE
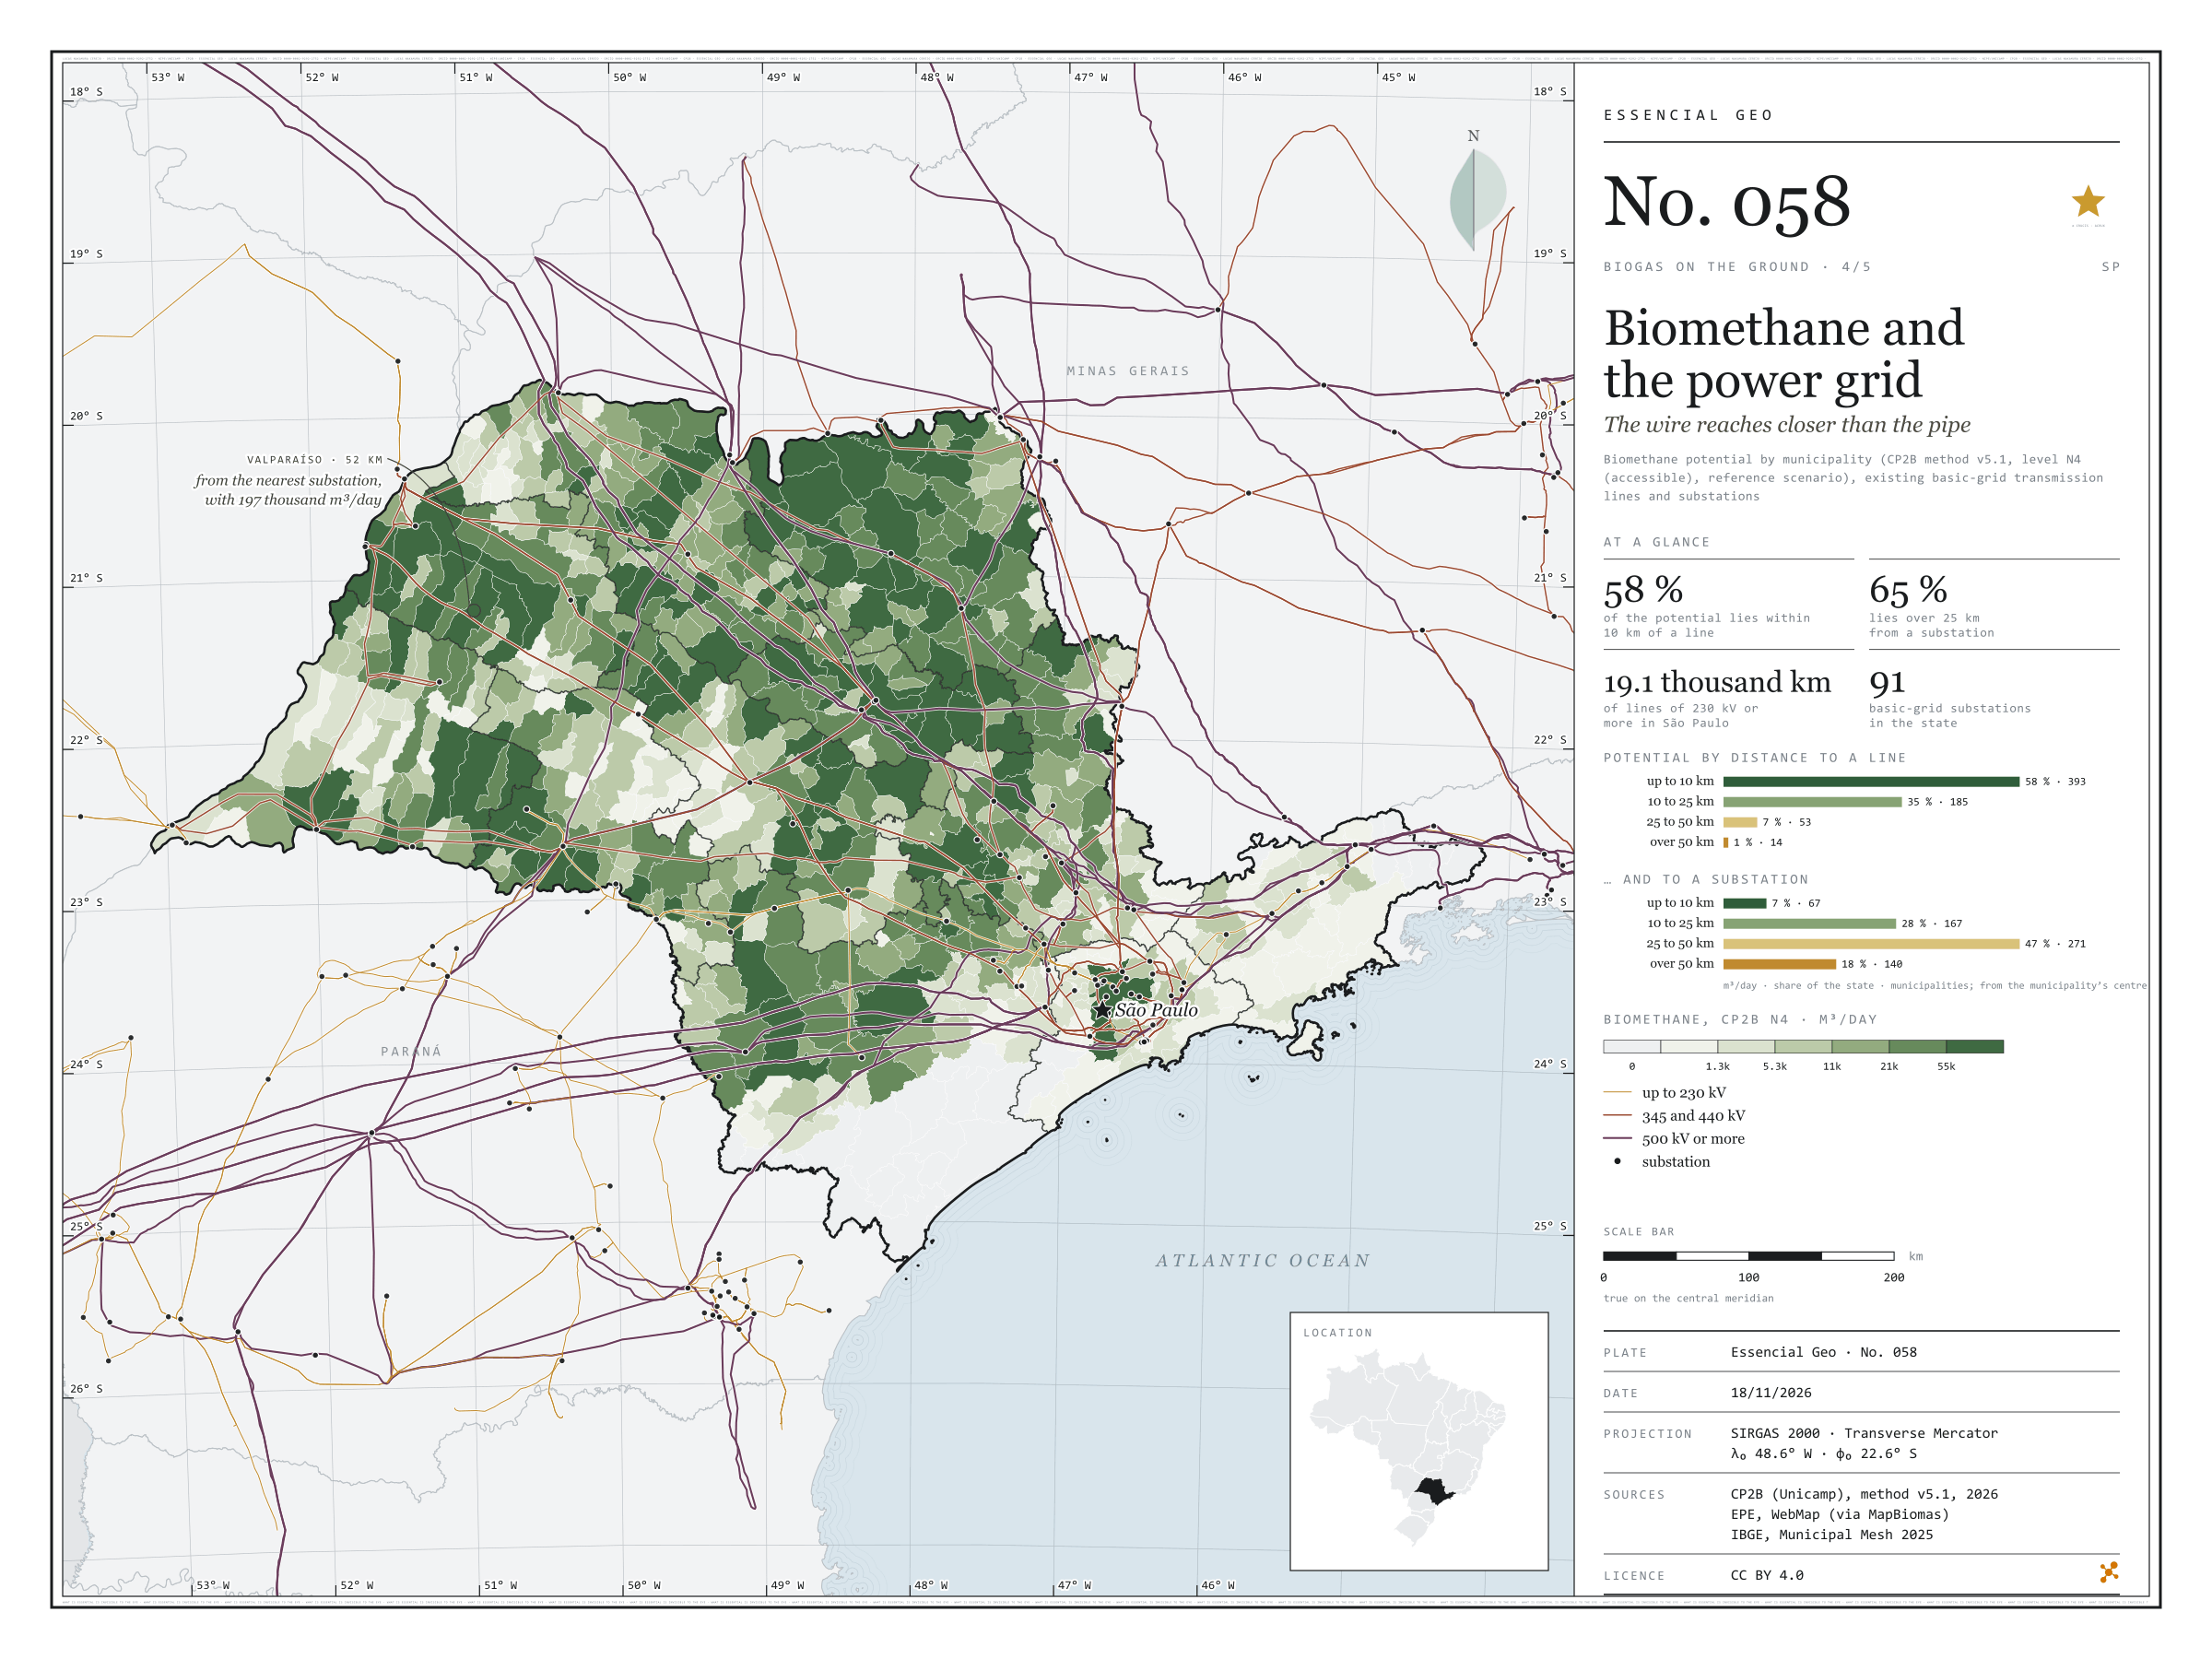
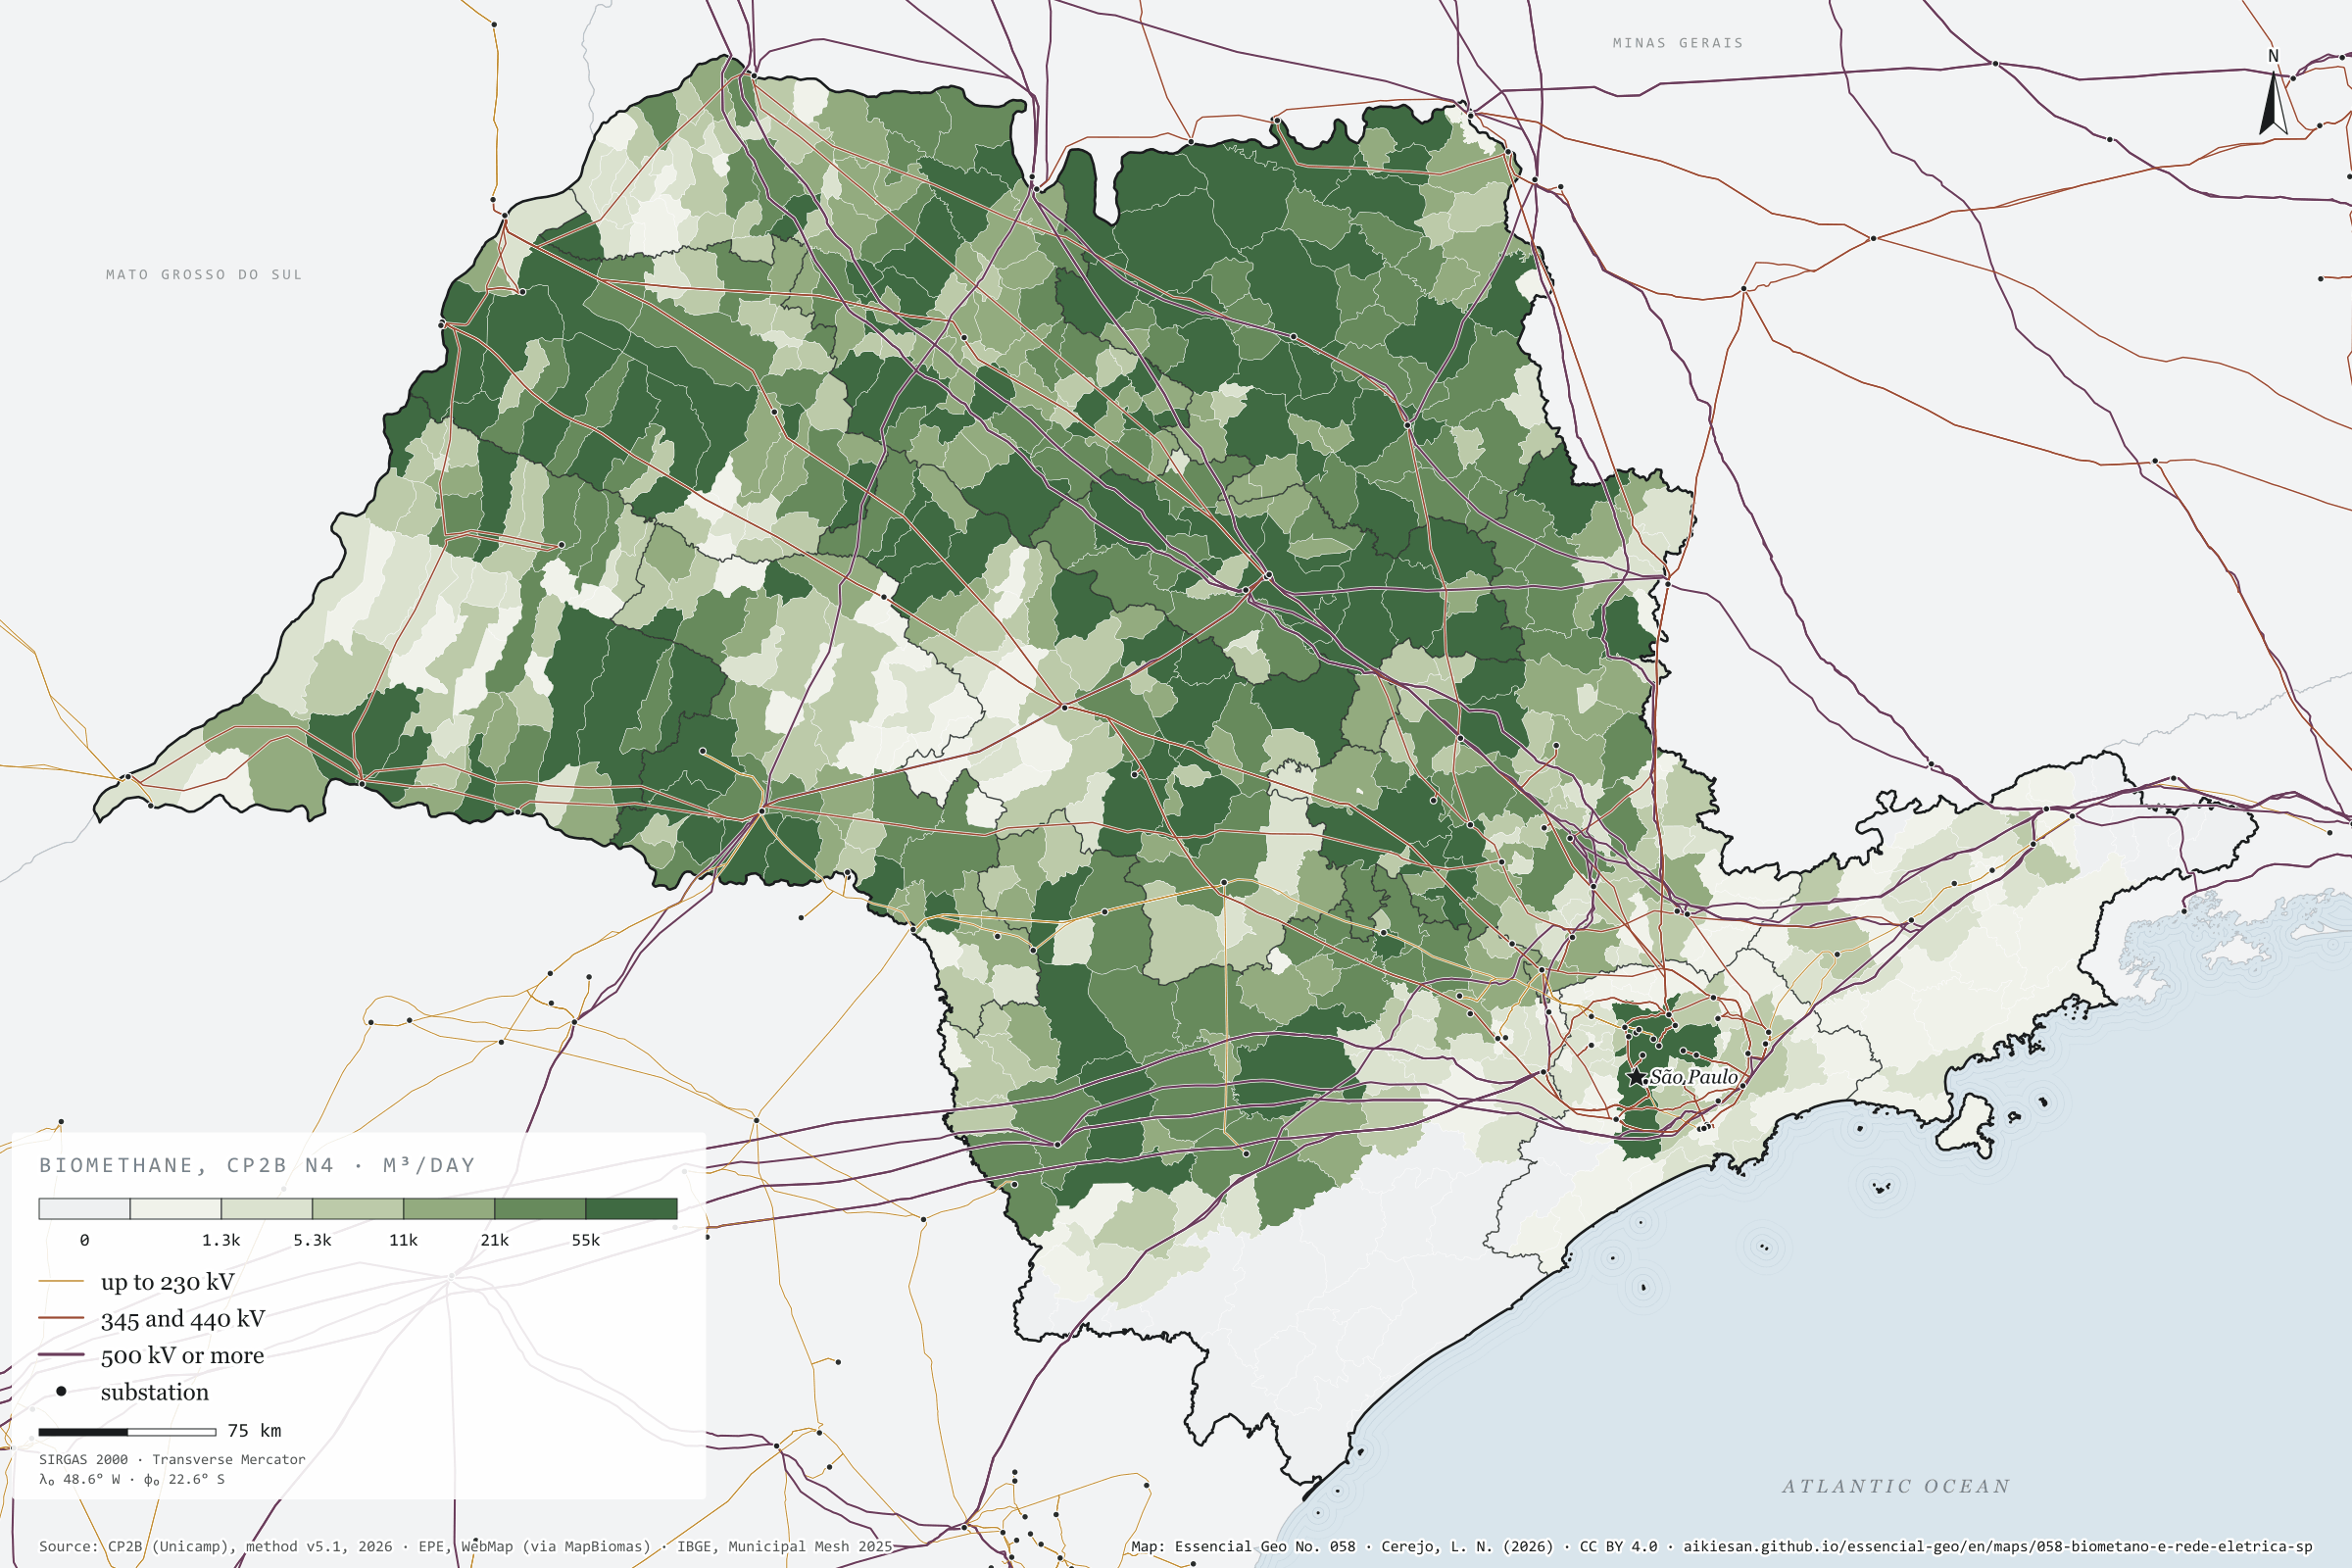
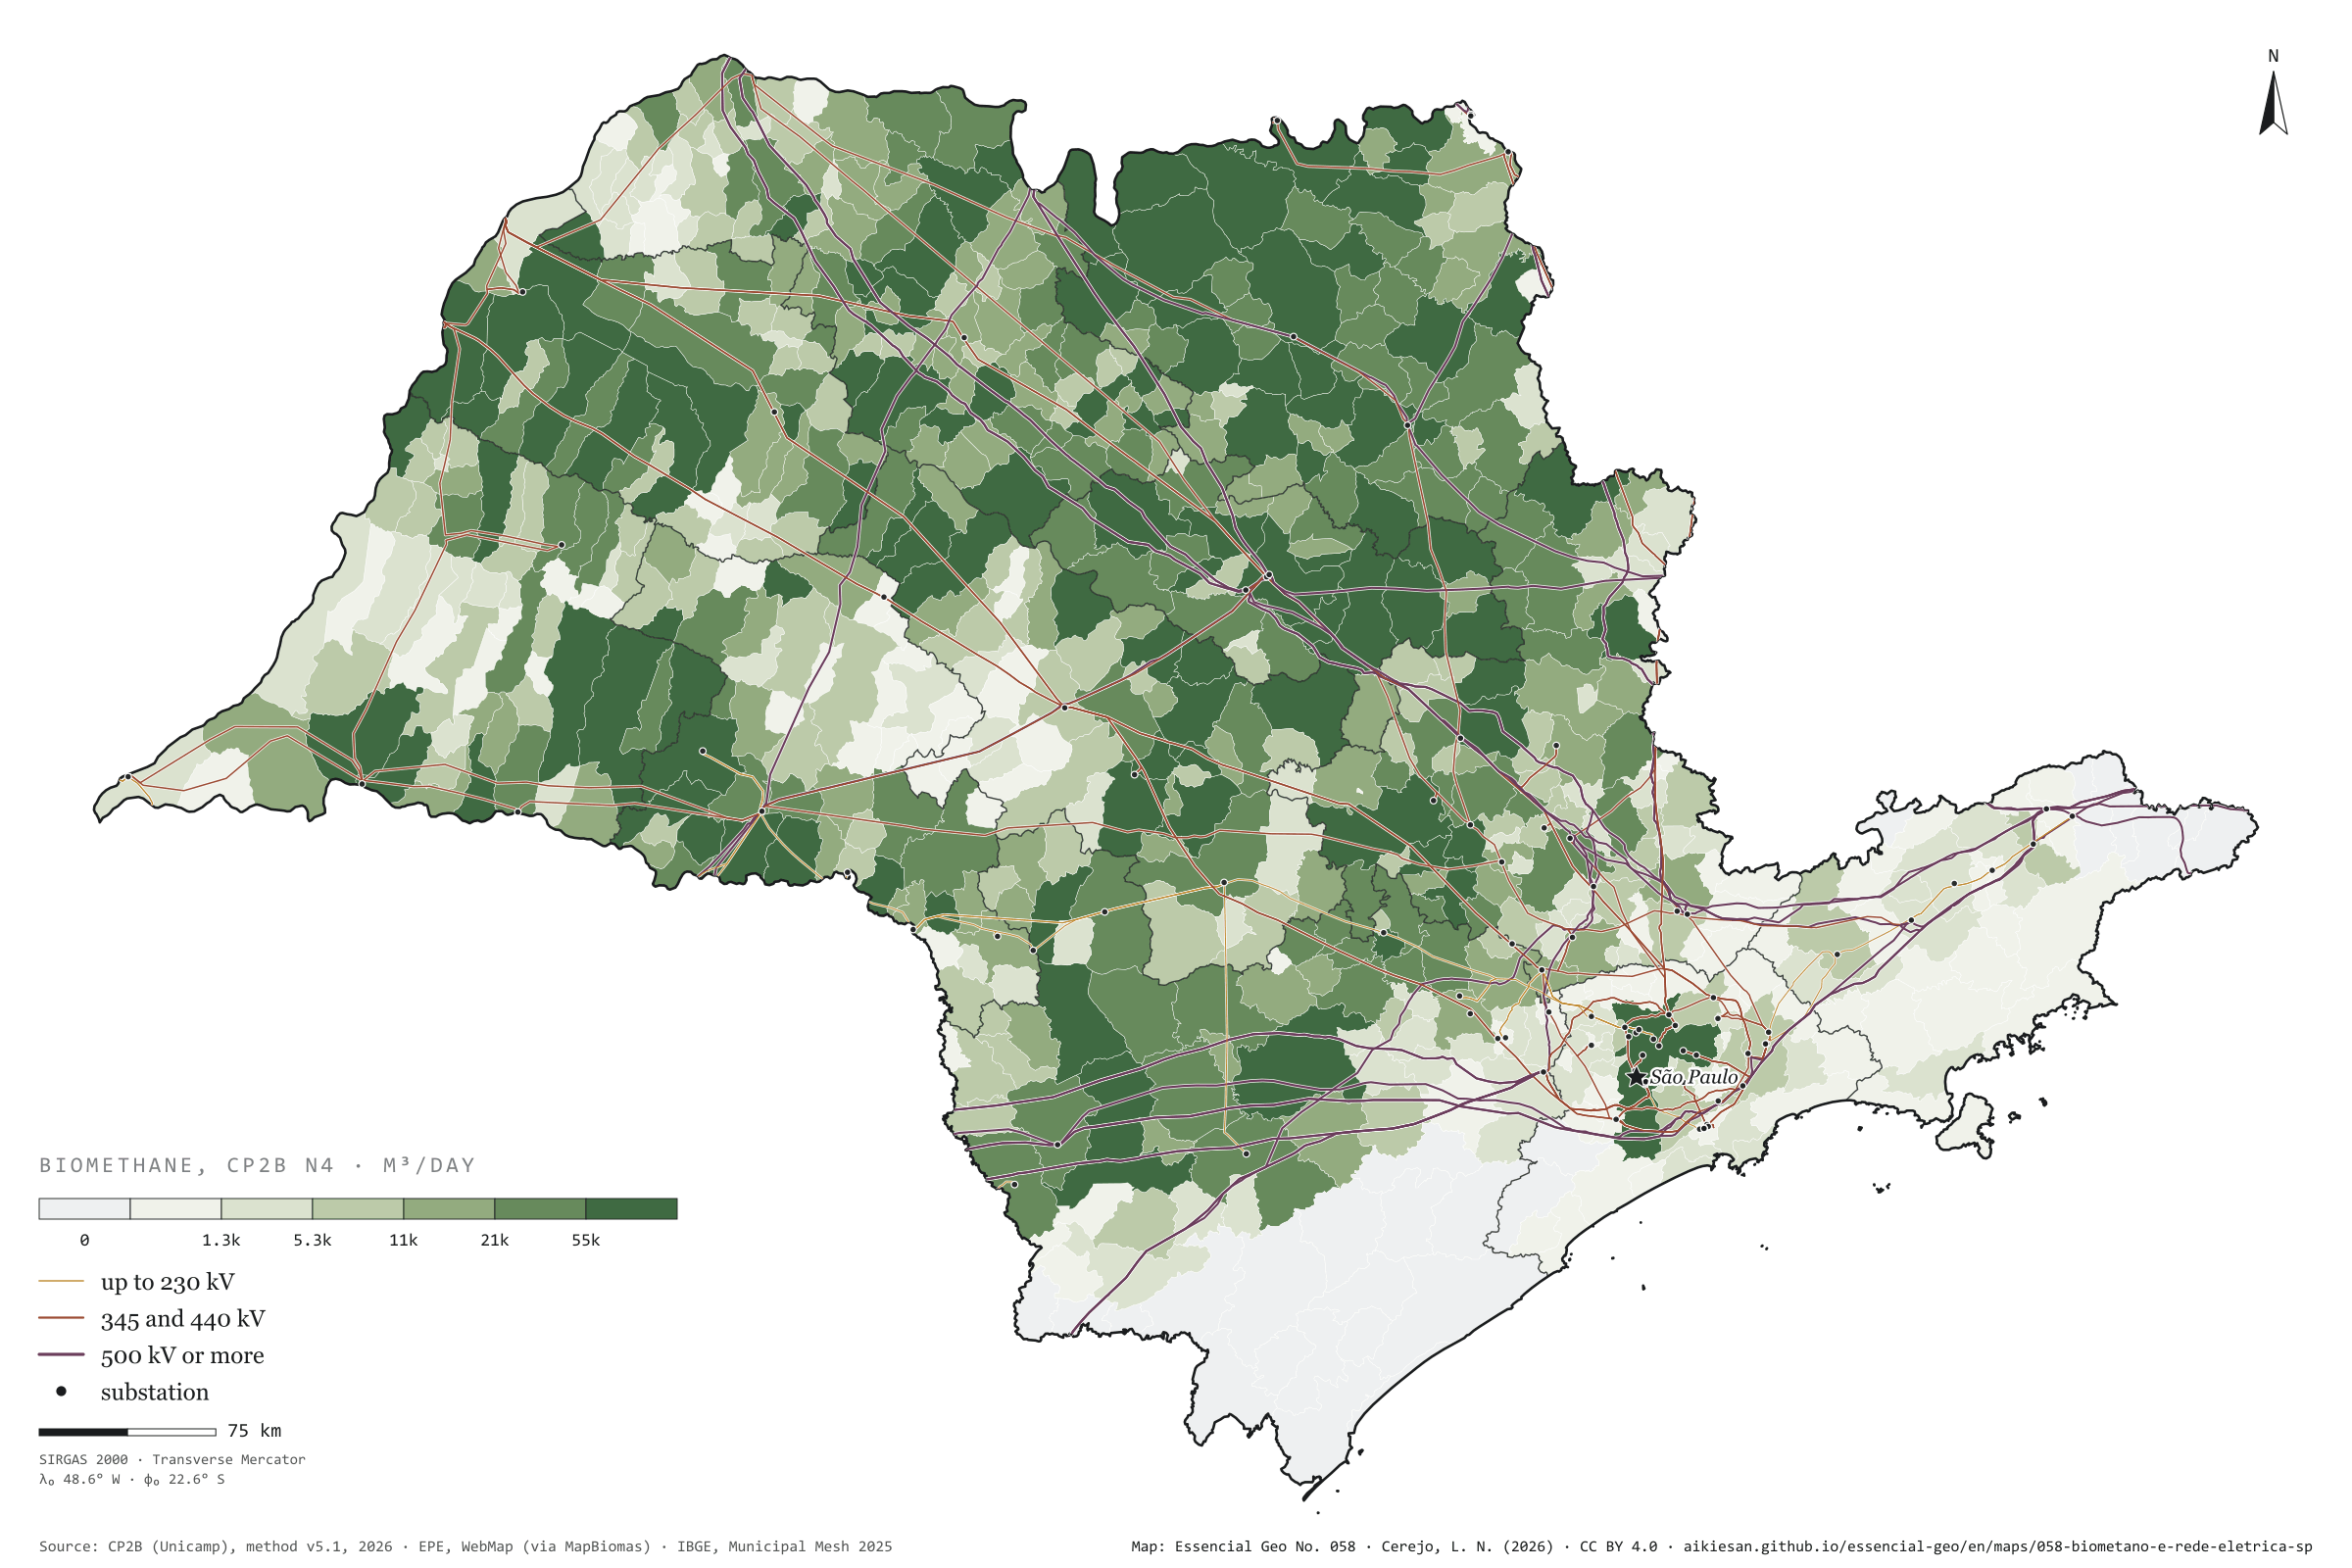
Where there is no pipeline, biogas can become electricity on the spot and leave by wire. In São Paulo, the basic grid, from 230 kV up, adds up to 19,100 km of lines and 91 substations, and covers the state far better than gas pipelines: 58% of the biomethane potential lies within 10 km of a transmission line, and only 1% over 50 km. The bottleneck is the substation, where power enters the grid: 65% of the potential lies over 25 km from one, measured from the municipality’s centre. Valparaíso, in the west, has 197,000 m³ of possible biomethane a day 2.6 km from a line, but 52 km from the nearest substation. On the previous plate, gas from the sugarcane north lay far from the pipe; here, the wire runs right over it. Fourth plate of the collection “Biogas on the ground”.
Technical record · downloads · citation
At a glance
Biomethane by distance to the nearest transmission line (m³/day)
up to 10 km57.7%
10 to 25 km34.8%
25 to 50 km6.6%
over 50 km0.9%
Biomethane by distance to the nearest substation (m³/day)
up to 10 km6.9%
10 to 25 km27.6%
25 to 50 km47.4%
over 50 km18.1%
Layers
municipiospolygon645 municipalities: potential and distances to lines and substations (same GPKG as plate 055)
linhas_transmissaoline493 lines of 230 kV or more, 19,100 km inside SP
subestacoespoint185 basic-grid substations, 91 in SP
Straight-line distance from each municipality’s interior point to the nearest basic-grid transmission line and substation, in four bands, crossed with the biomethane potential (CP2B method v5.1, level N4, reference scenario).
The map without a frame, with legend, scale, reference system and credit written on it: ready for papers, lectures and slides. In two versions: with the basemap (neighbours and sea) or only the mapped area, on white.
CEREJO, Lucas Nakamura. Biometano e rede elétrica: o fio chega mais perto do que o cano. Versão 1.0.0. [S. l.]: Essencial, 2026. Conjunto de dados. Disponível em: https://aikiesan.github.io/essencial-geo/en/maps/058-biometano-e-rede-eletrica-sp/. Acesso em: 10 nov. 2026.
Cerejo, L. N. (2026). Biometano e rede elétrica: o fio chega mais perto do que o cano [Biomethane and the power grid: The wire reaches closer than the pipe] (Version 1.0.0) [Data set]. Essencial. https://aikiesan.github.io/essencial-geo/en/maps/058-biometano-e-rede-eletrica-sp/
@dataset{cerejo2026_biometano_e_rede_eletrica_sp,
  author    = {Cerejo, Lucas Nakamura},
  title     = {Biometano e rede elétrica: O fio chega mais perto do que o cano},
  year      = {2026},
  publisher = {Essencial},
  version   = {1.0.0},
  url       = {https://aikiesan.github.io/essencial-geo/en/maps/058-biometano-e-rede-eletrica-sp/},
  language  = {portuguese},
  note      = {English title: Biomethane and the power grid: The wire reaches closer than the pipe. Licence CC BY 4.0}
}
Fig. 059São Paulo State (SP)EPSG:4674Source: ANP, ANEEL, CP2B (Unicamp), IBGE
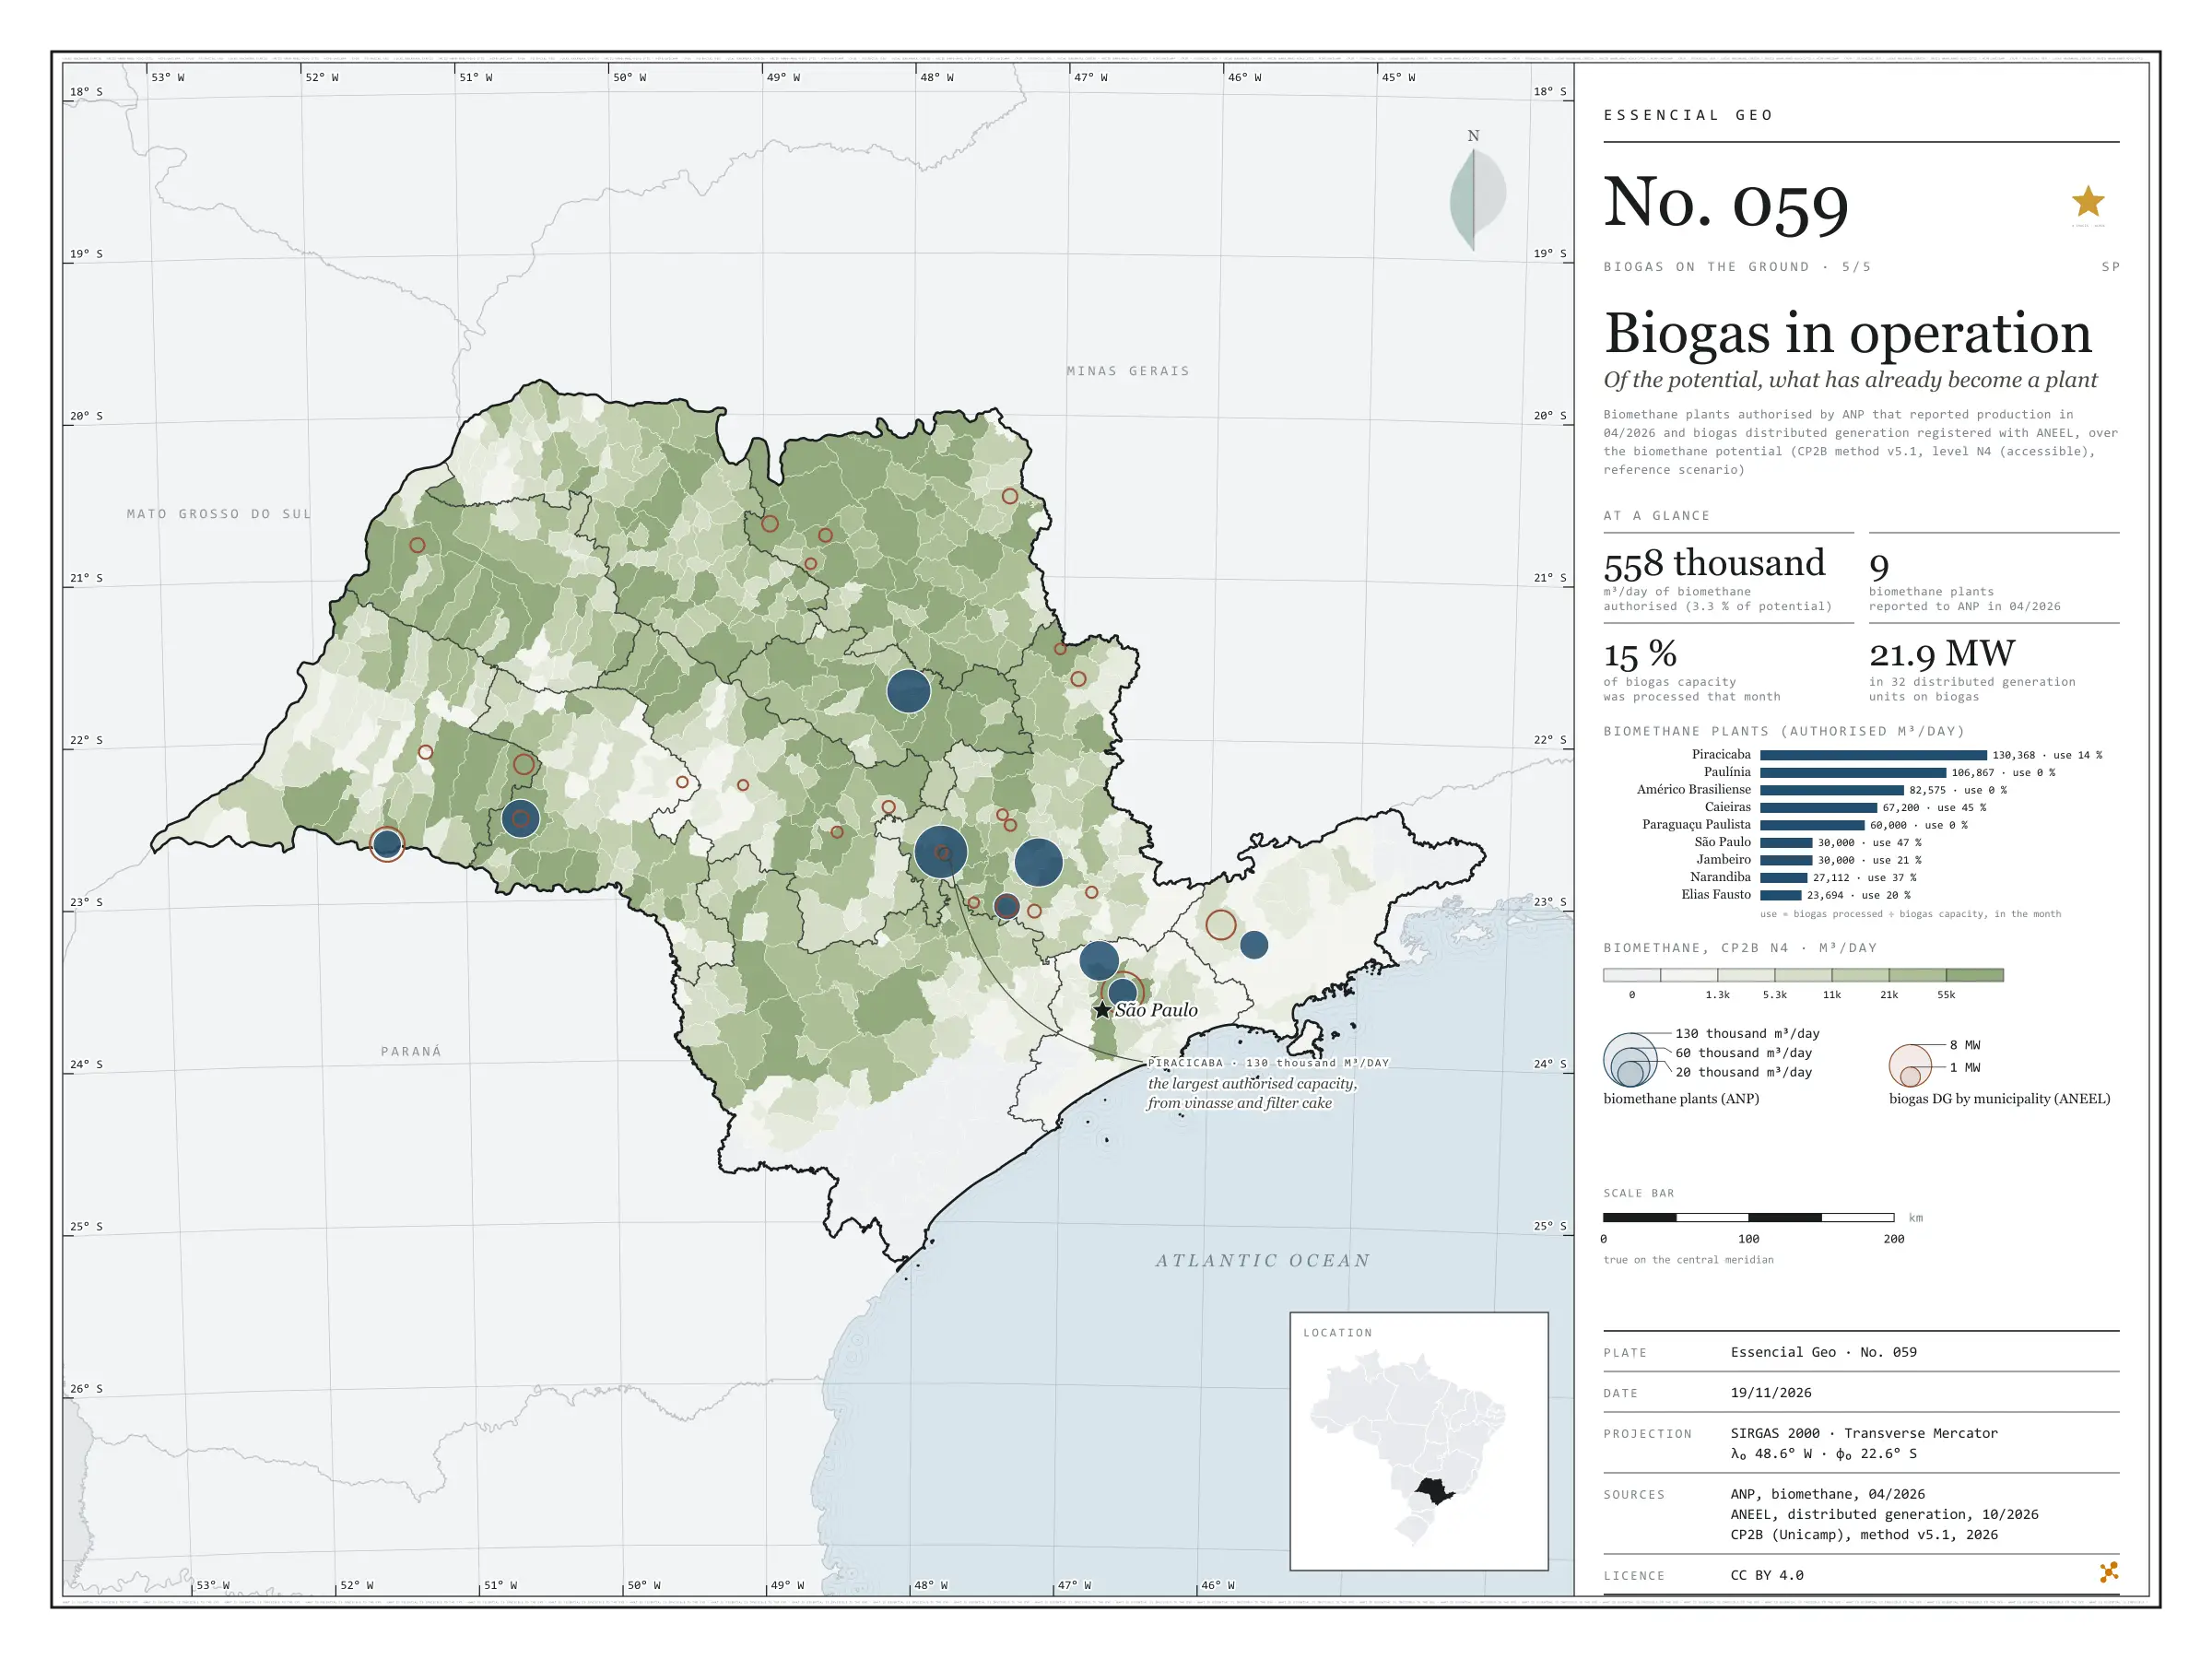
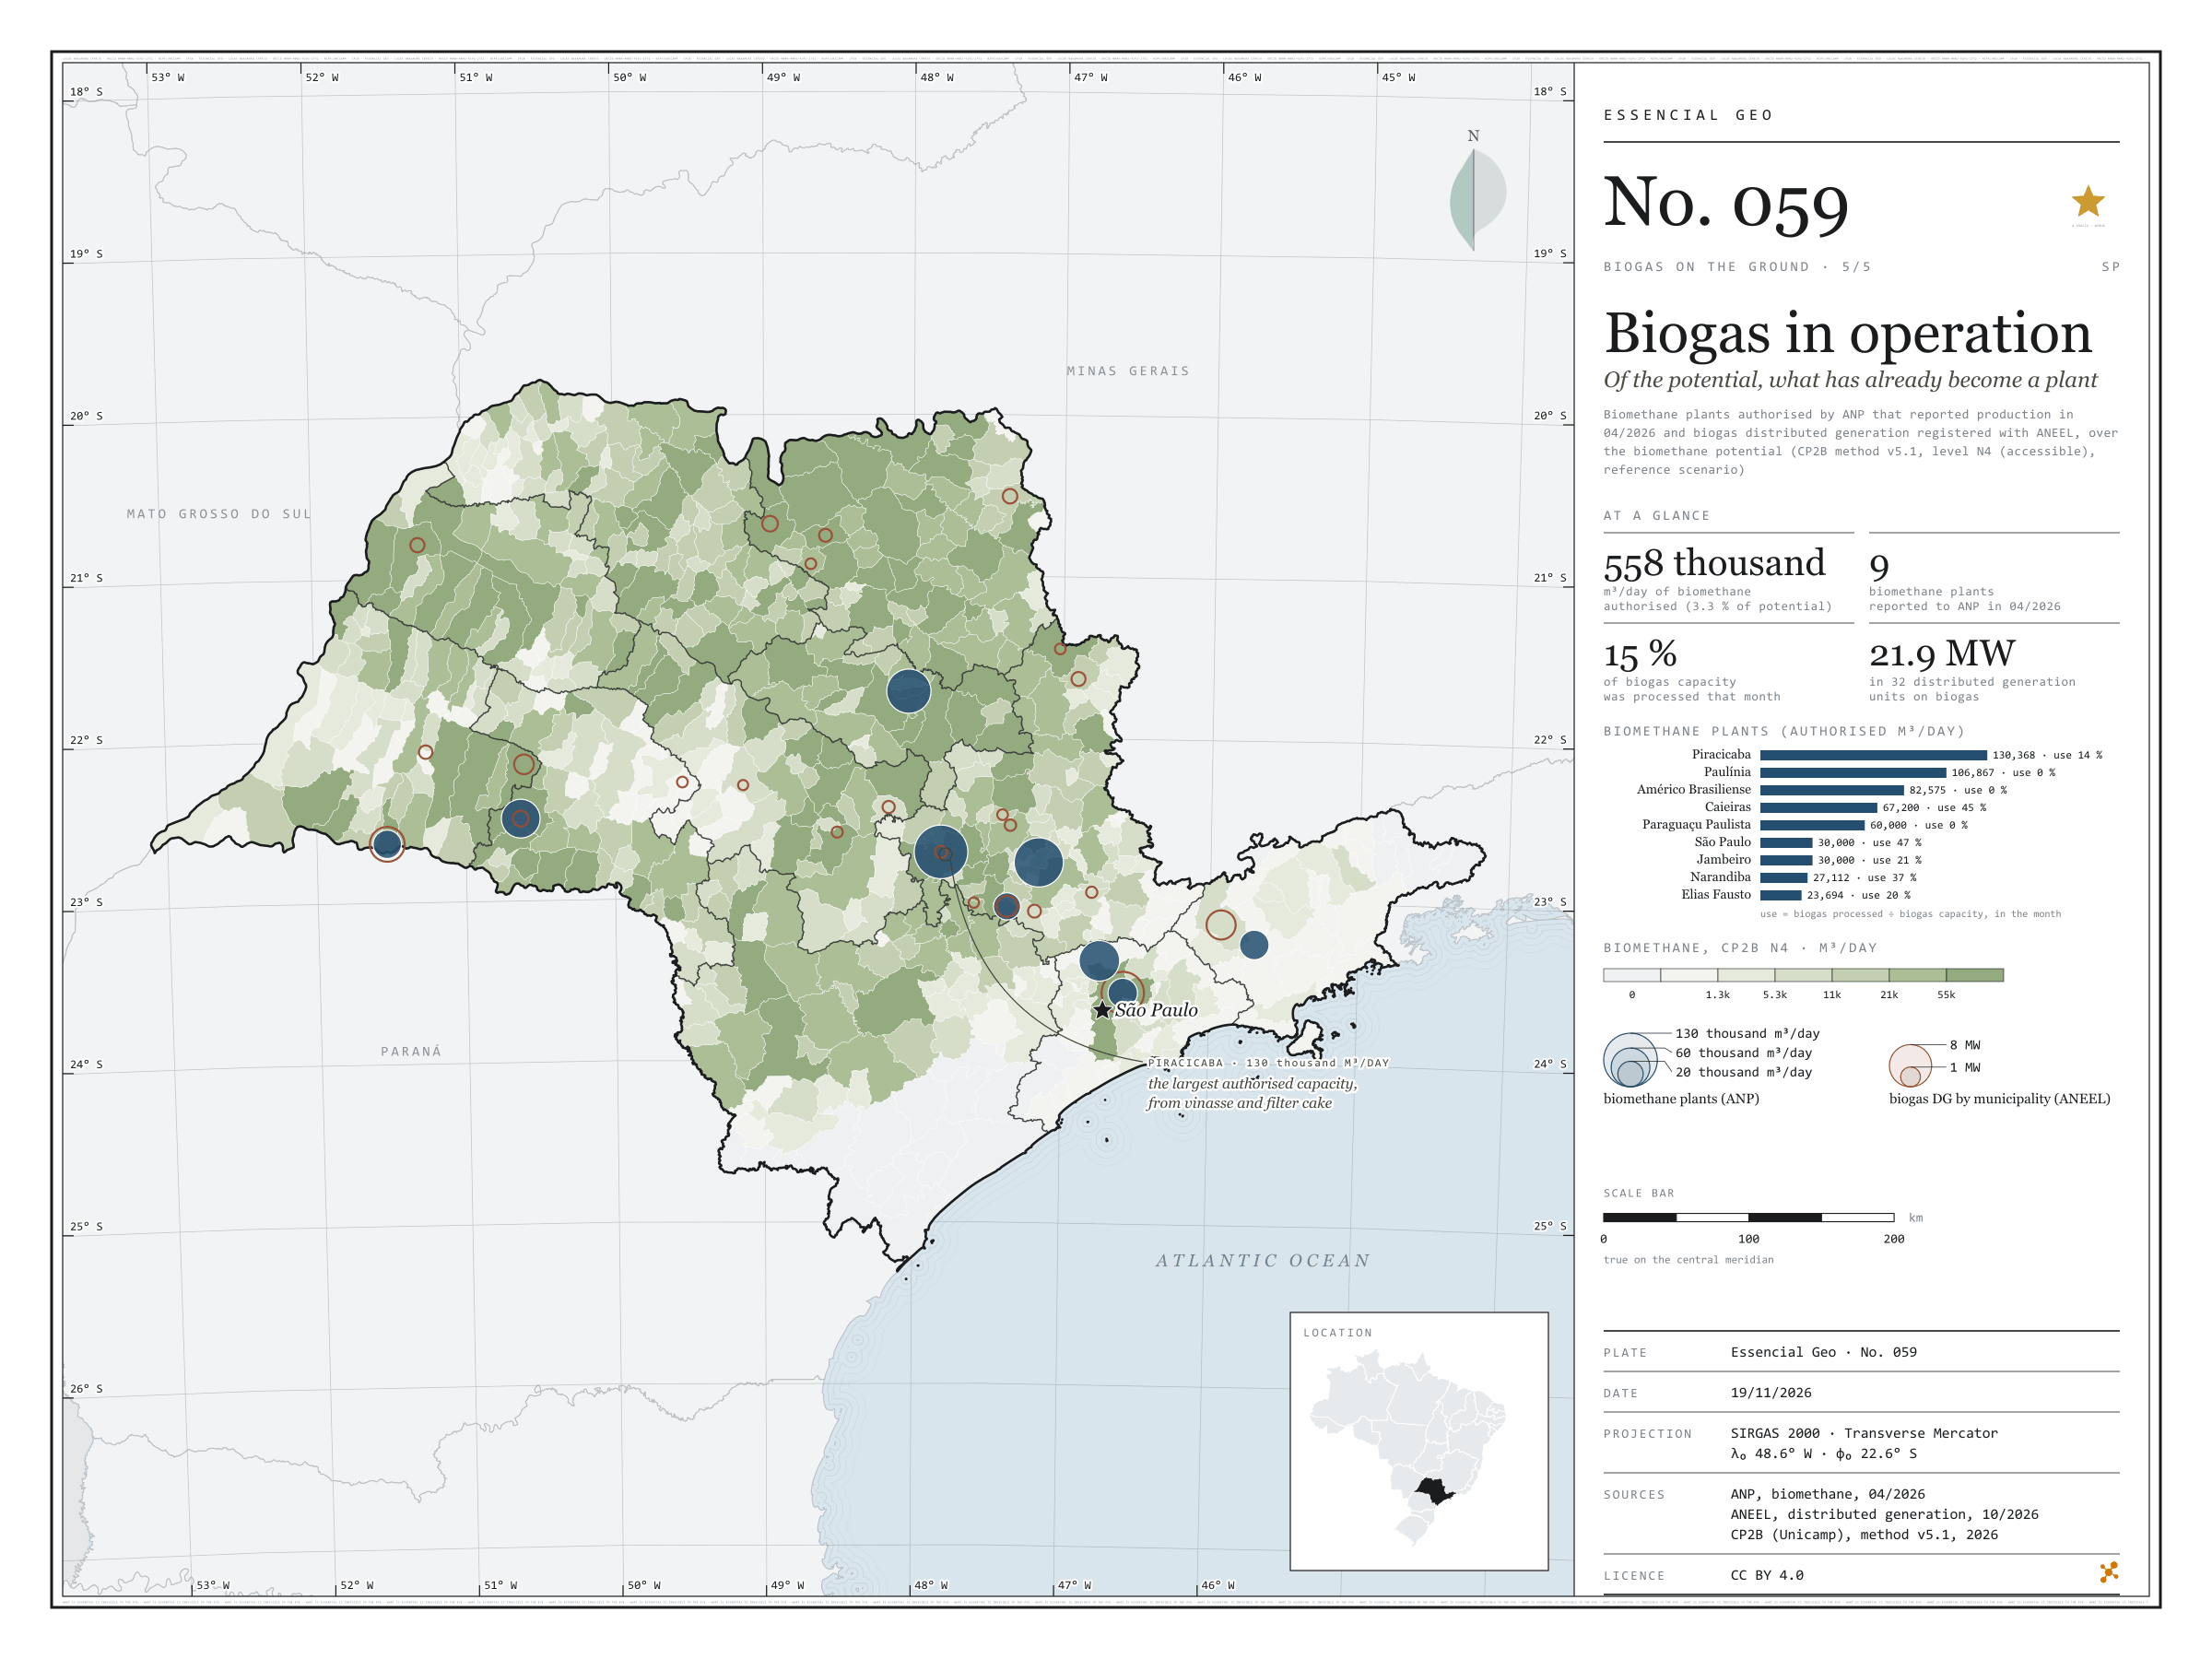
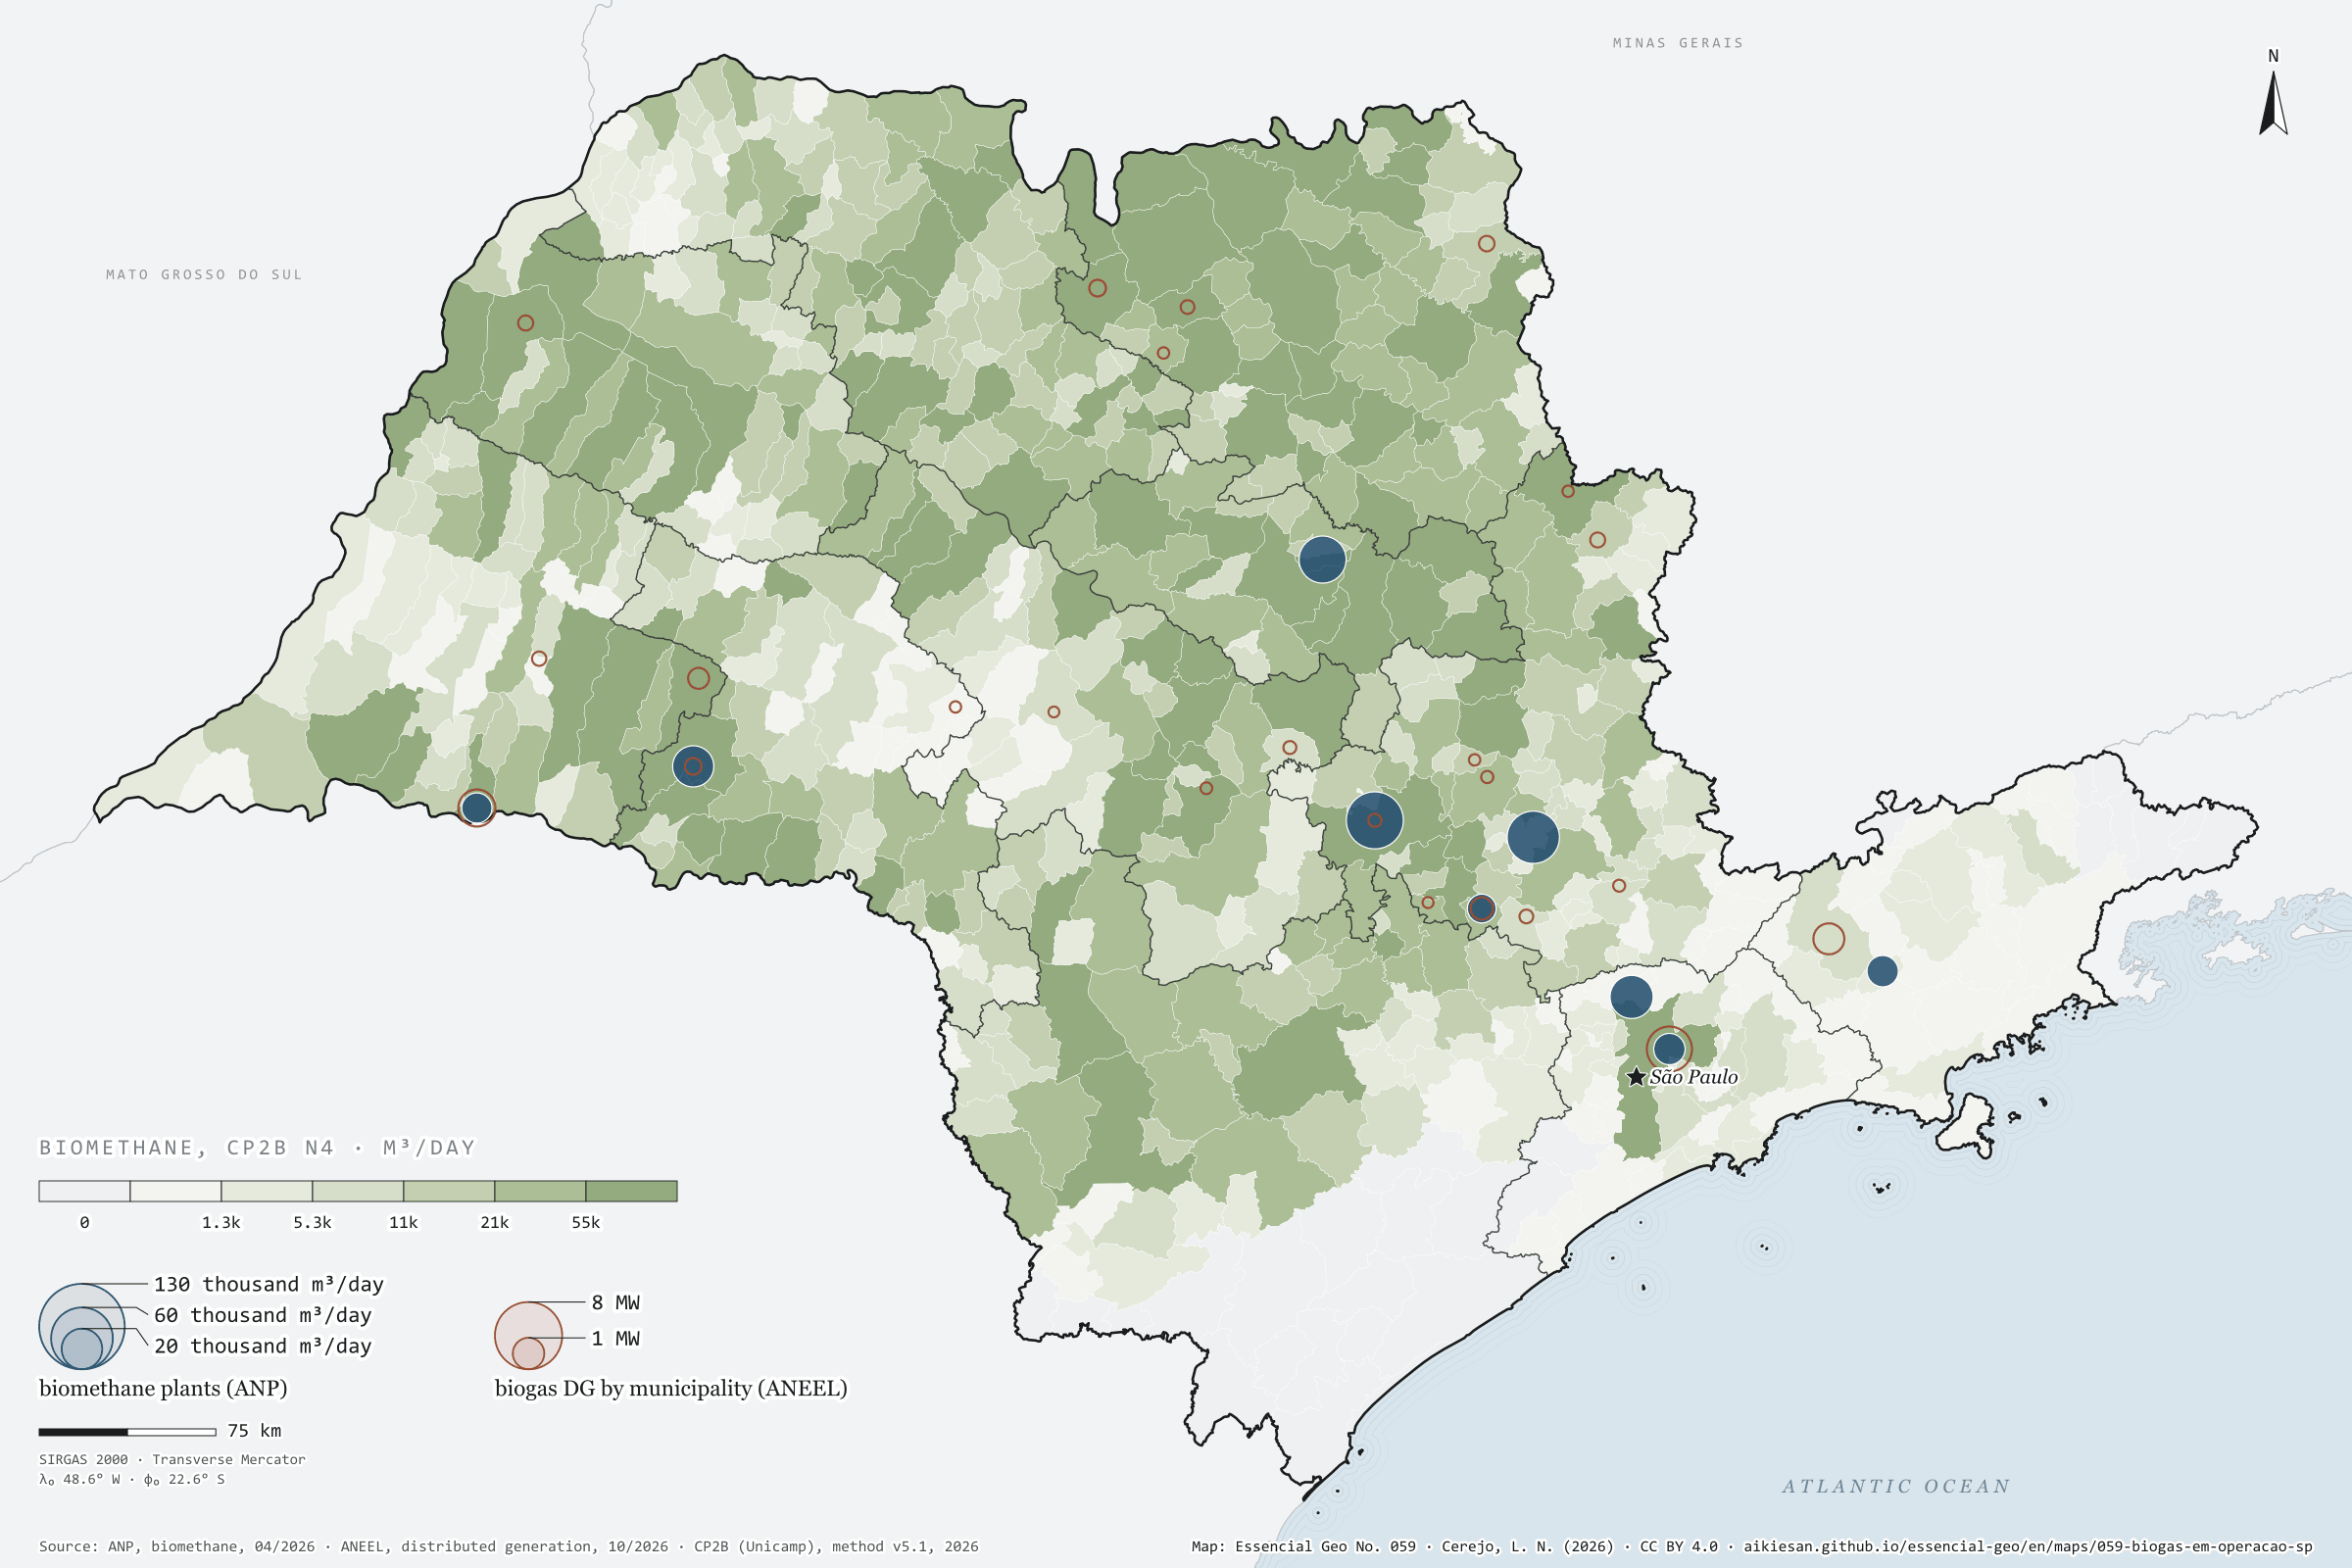
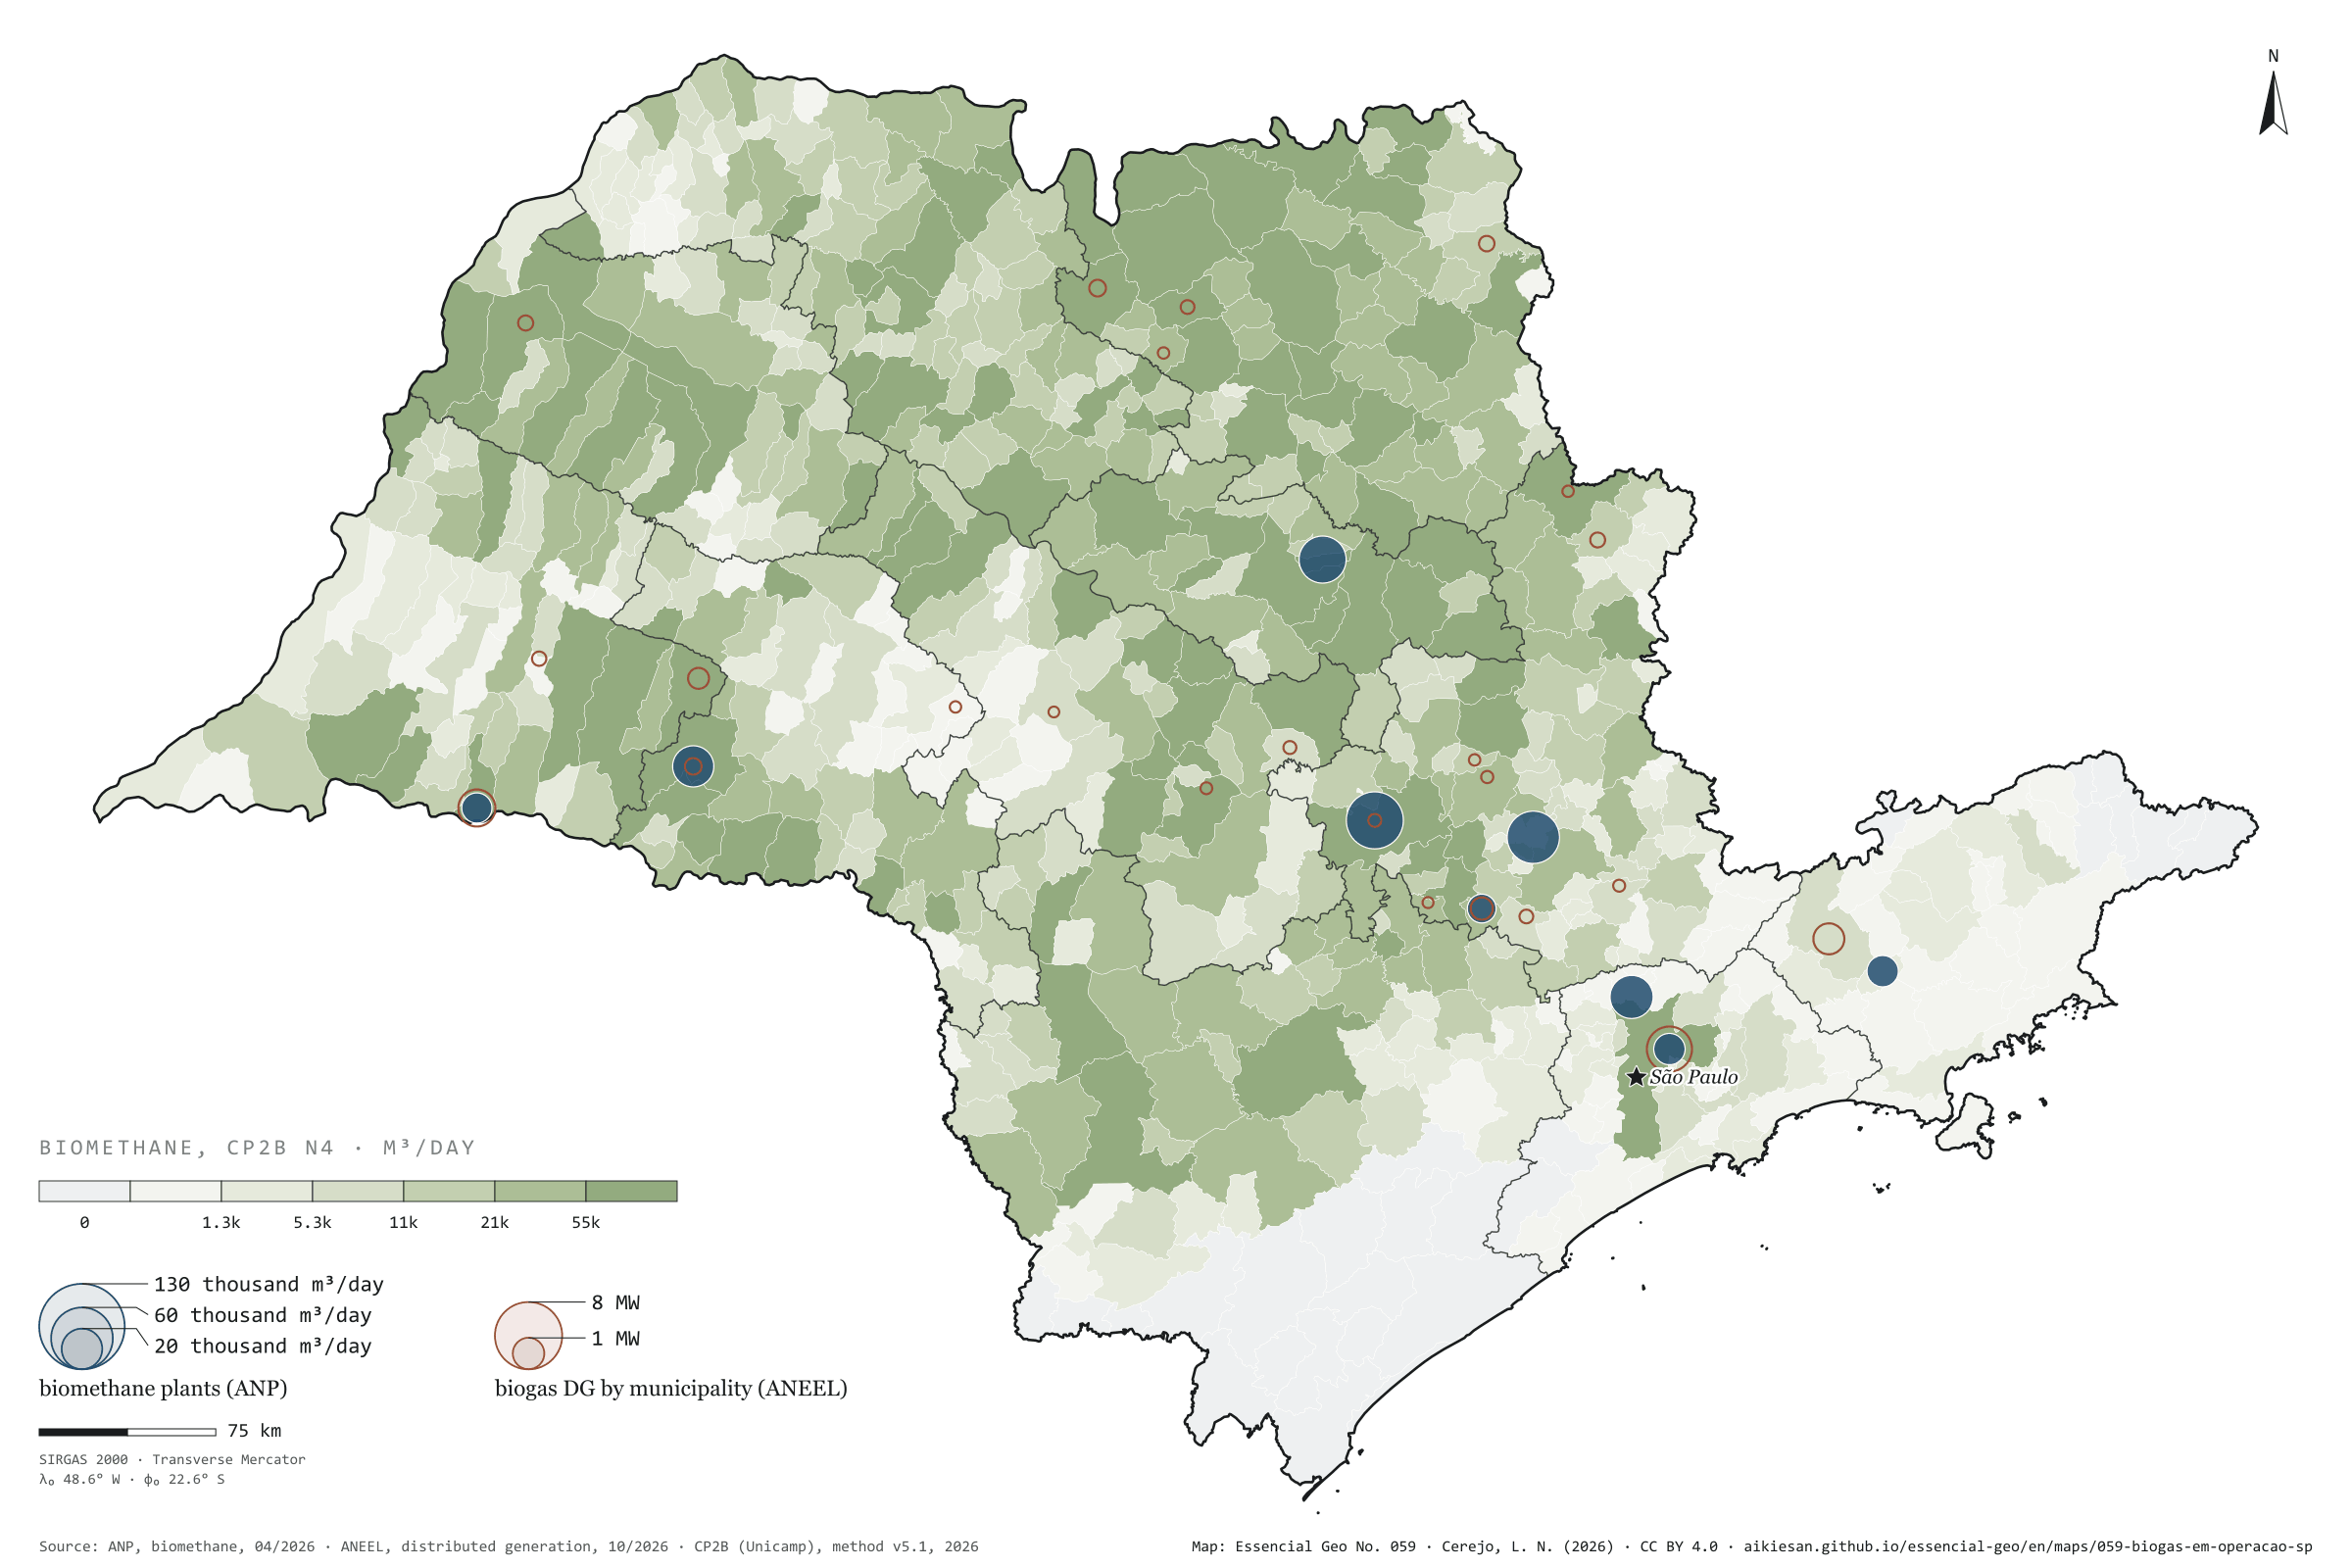
Of a potential of 16.9 million m³ of biomethane a day, how much has already become a plant? In April 2026, nine biomethane plants in São Paulo reported output to ANP. Together they hold 558,000 m³ a day of authorised capacity, 3.3% of the potential, and that month processed only 15% of the biogas they could treat: three of them stood near zero. The largest, Raízen and Geo’s plant in Piracicaba, has 130,000 m³ a day authorised, from vinasse and filter cake; the Caieiras landfill plant runs the most, at 45% use. In electricity, ANEEL lists 32 biogas distributed generation units in the state, with 21.9 MW, in 24 municipalities: most of it at landfills in the capital and São José dos Campos and at a mill in Narandiba; the rest, smaller, mostly from farm manure. The larger biogas power stations are on plate 028. Last plate of the collection “Biogas on the ground”.
Technical record · downloads · citation
At a glance
Authorised capacity of biomethane plants (m³/day)
Piracicaba23.4%
Paulínia19.2%
Américo Brasiliense14.8%
Caieiras12%
Paraguaçu Paulista10.8%
other four19.9%
Authorised capacity over the state’s potential
3.3%
557,816 of 16.9 million m³/day
Biogas distributed generation
22MW
32 units in 24 municipalities
Layers
plantas_biometanopoint9 biomethane plants: company name, CNPJ, biomethane and biogas capacity, biogas processed and use in the month
gd_biogaspoint24 municipalities with biogas distributed generation: units and capacity (kW) by residue type
municipiospolygon645 municipalities: potential, ANP capacity and DG capacity (same GPKG as plate 055)
SP biomethane plants that reported output to ANP in April 2026, with authorised capacity and biogas processed, and ANEEL biogas distributed generation units summed by municipality, over the biomethane potential (CP2B method v5.1, level N4, reference scenario).
The map without a frame, with legend, scale, reference system and credit written on it: ready for papers, lectures and slides. In two versions: with the basemap (neighbours and sea) or only the mapped area, on white.
CEREJO, Lucas Nakamura. Biogás em operação: do potencial, o que já virou planta. Versão 1.0.0. [S. l.]: Essencial, 2026. Conjunto de dados. Disponível em: https://aikiesan.github.io/essencial-geo/en/maps/059-biogas-em-operacao-sp/. Acesso em: 10 nov. 2026.
Cerejo, L. N. (2026). Biogás em operação: do potencial, o que já virou planta [Biogas in operation: Of the potential, what has already become a plant] (Version 1.0.0) [Data set]. Essencial. https://aikiesan.github.io/essencial-geo/en/maps/059-biogas-em-operacao-sp/
@dataset{cerejo2026_biogas_em_operacao_sp,
  author    = {Cerejo, Lucas Nakamura},
  title     = {Biogás em operação: Do potencial, o que já virou planta},
  year      = {2026},
  publisher = {Essencial},
  version   = {1.0.0},
  url       = {https://aikiesan.github.io/essencial-geo/en/maps/059-biogas-em-operacao-sp/},
  language  = {portuguese},
  note      = {English title: Biogas in operation: Of the potential, what has already become a plant. Licence CC BY 4.0}
}