Skip to content
Essencial

Collection · 3 plates

Income and rooftop solar

What the head of household earns, tract by tract and in the metropolis, and whether rooftop solar follows income: it does not.

3 of 3 published

In reading order, from the first to the latest. All collections

The route

Read in order: each plate adds a layer to the one before.

Start with the first plate
  1. Plate 1/3 · No. 060 What the head of household earns The minimum wage is the yardstick for a third of the state
  2. Plate 2/3 · No. 061 Income in the metropolis From Itaim Bibi to Jardim Ângela, eleven times over
  3. Plate 3/3 · No. 062 Income and rooftop solar Rooftop sun does not follow the money
Every plate, in full

No. 060 Census · income Income and rooftop solar 1/3

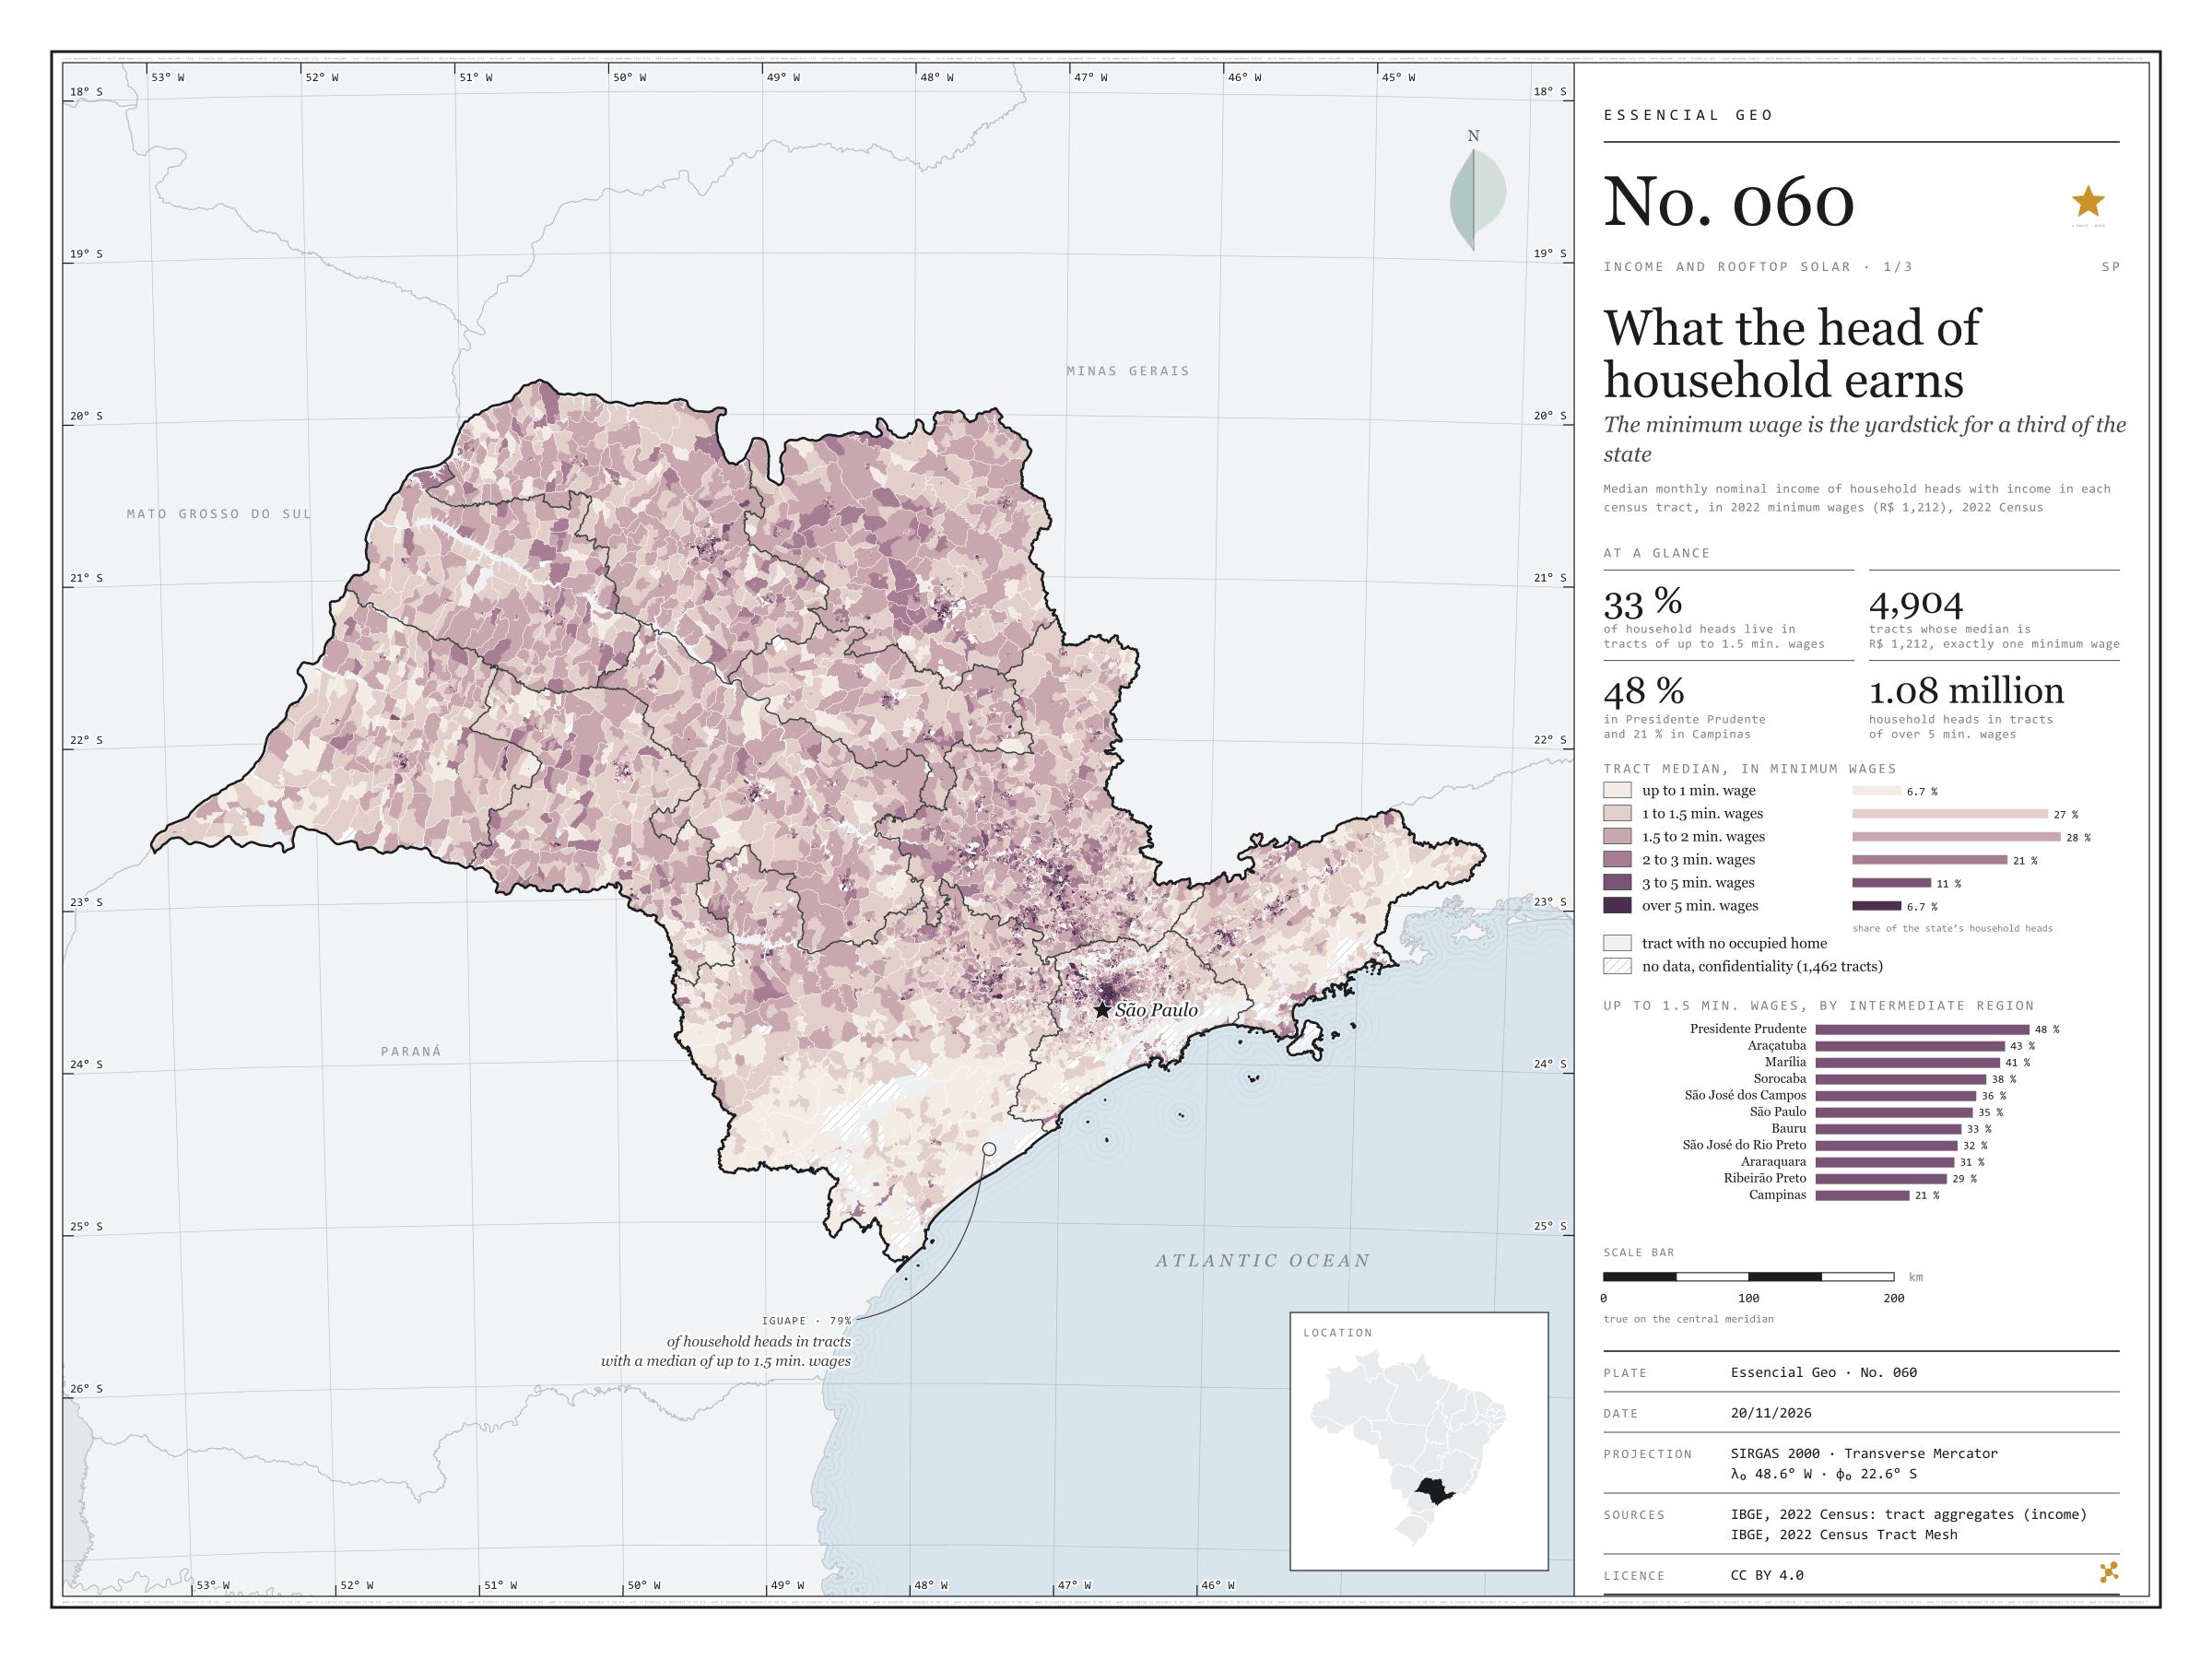
What the head of household earns

The minimum wage is the yardstick for a third of the state

Fig. 060 São Paulo State (SP) EPSG:4674 Source: IBGE

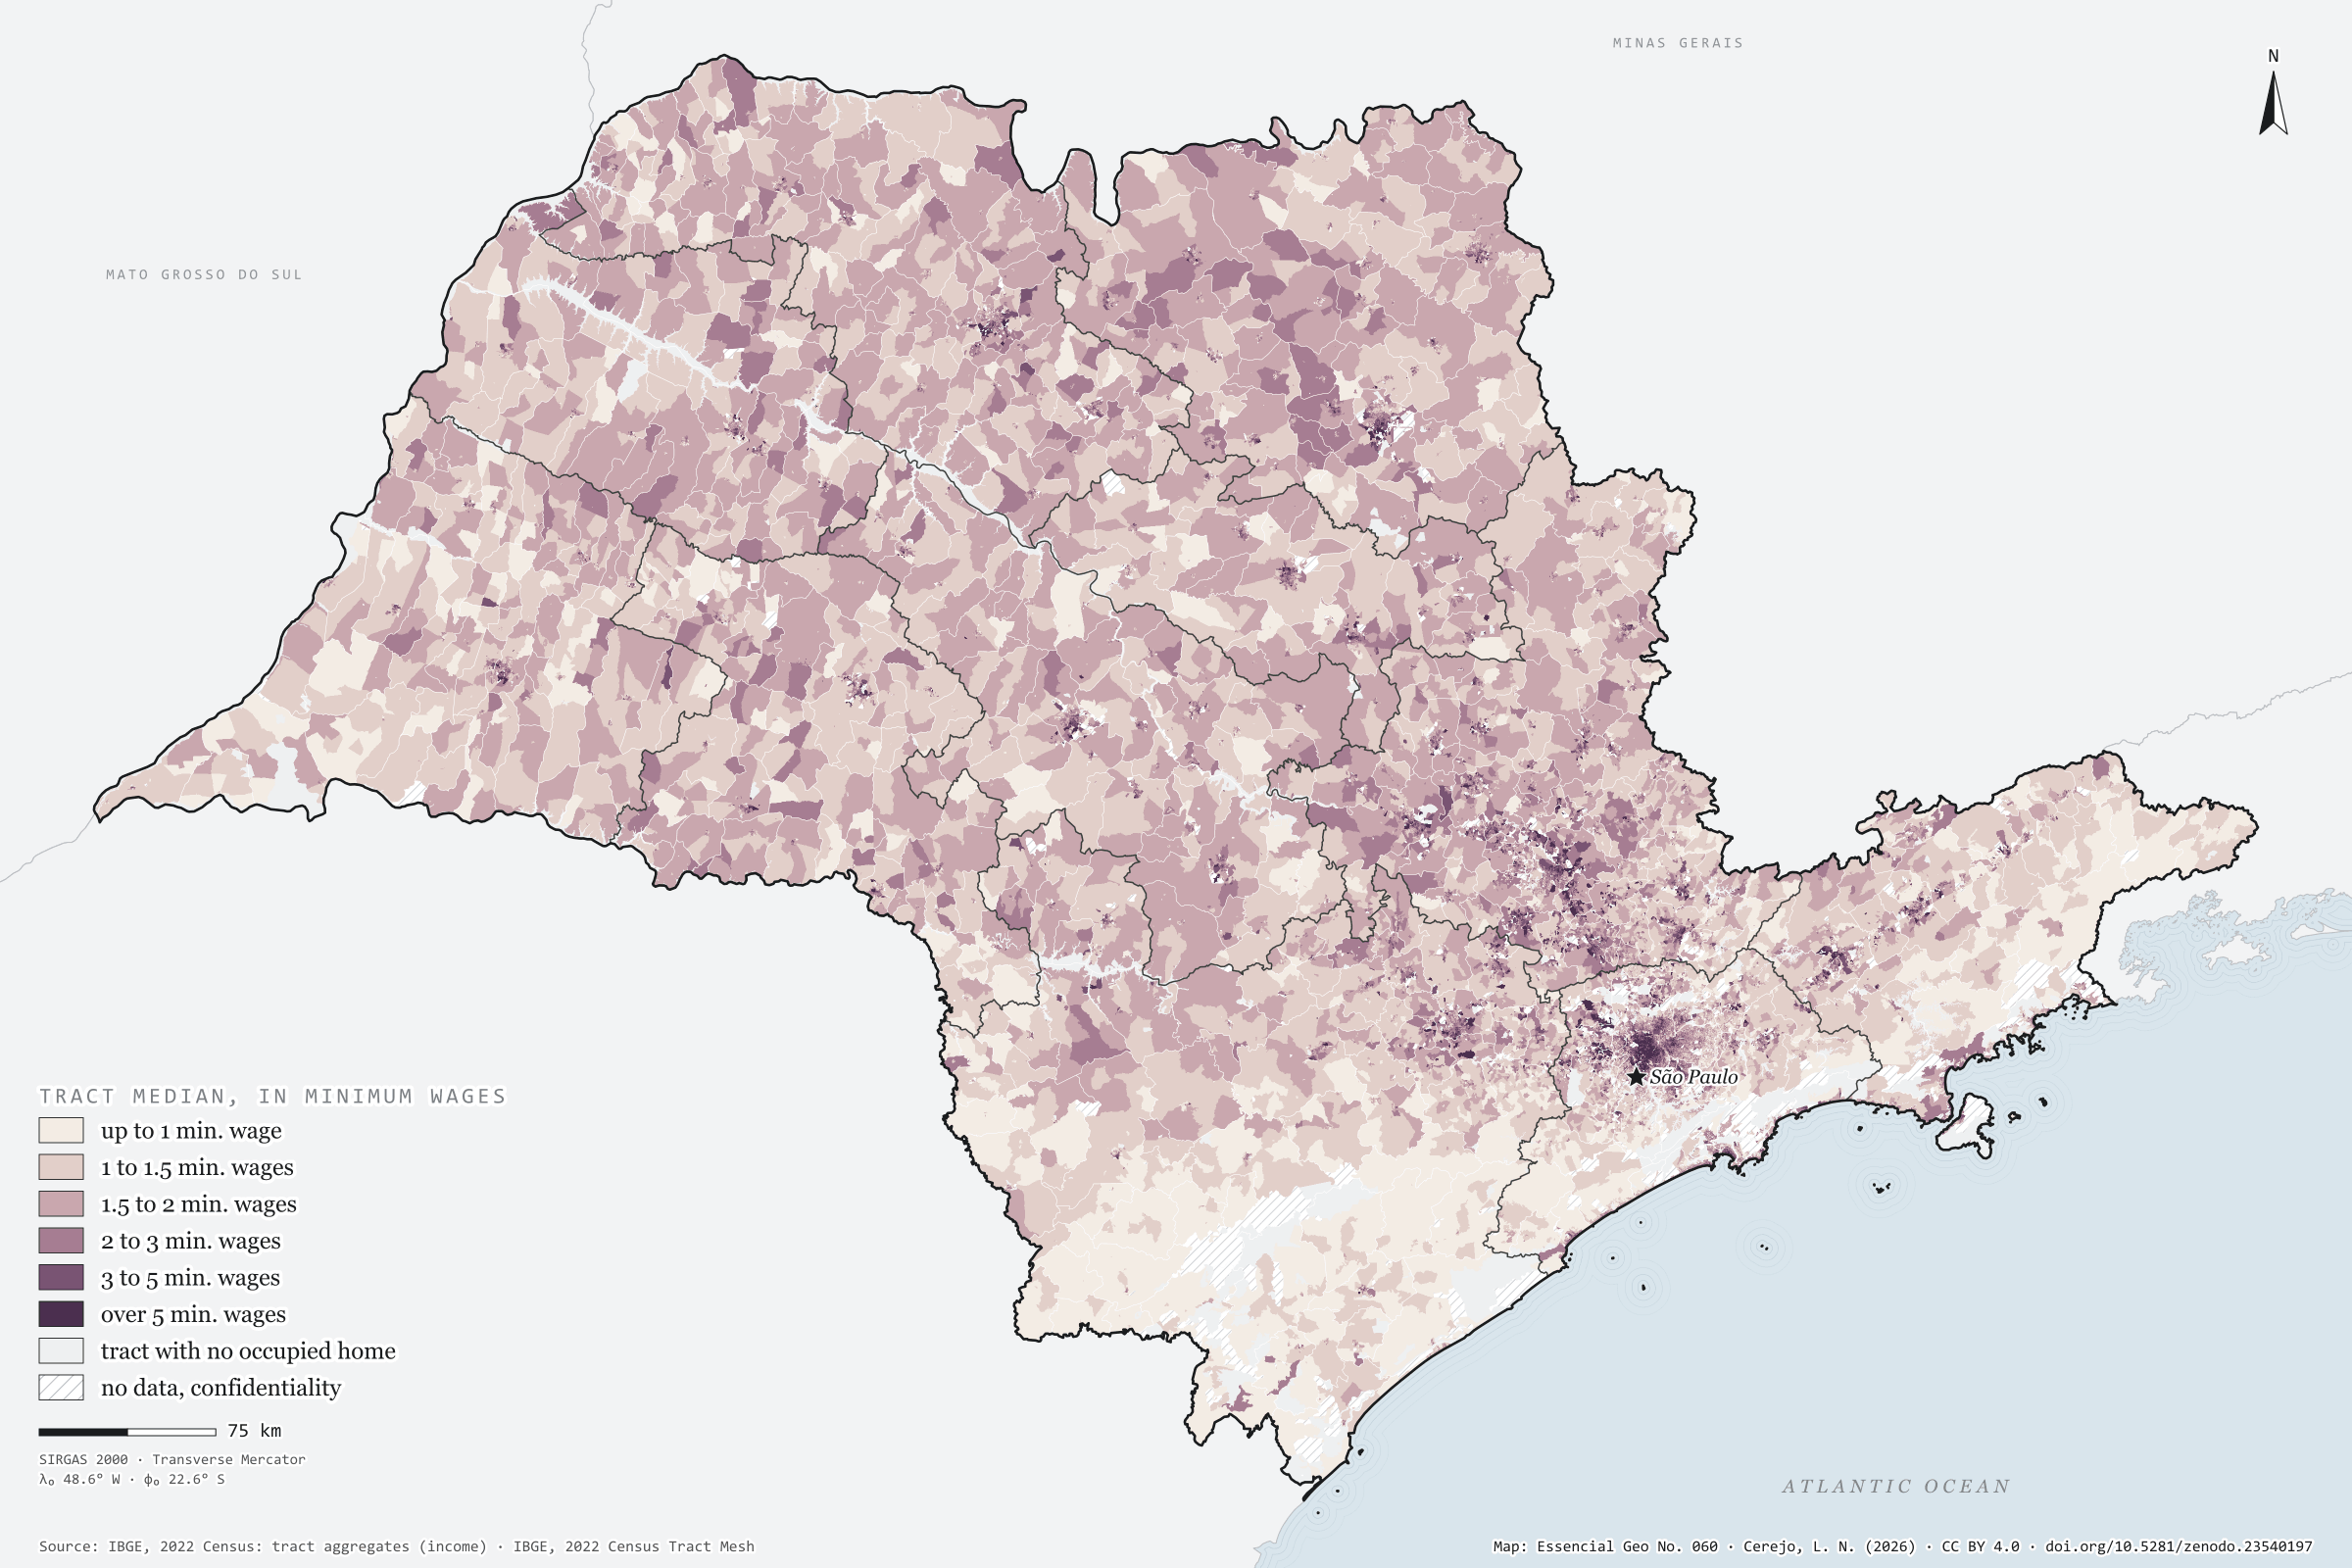
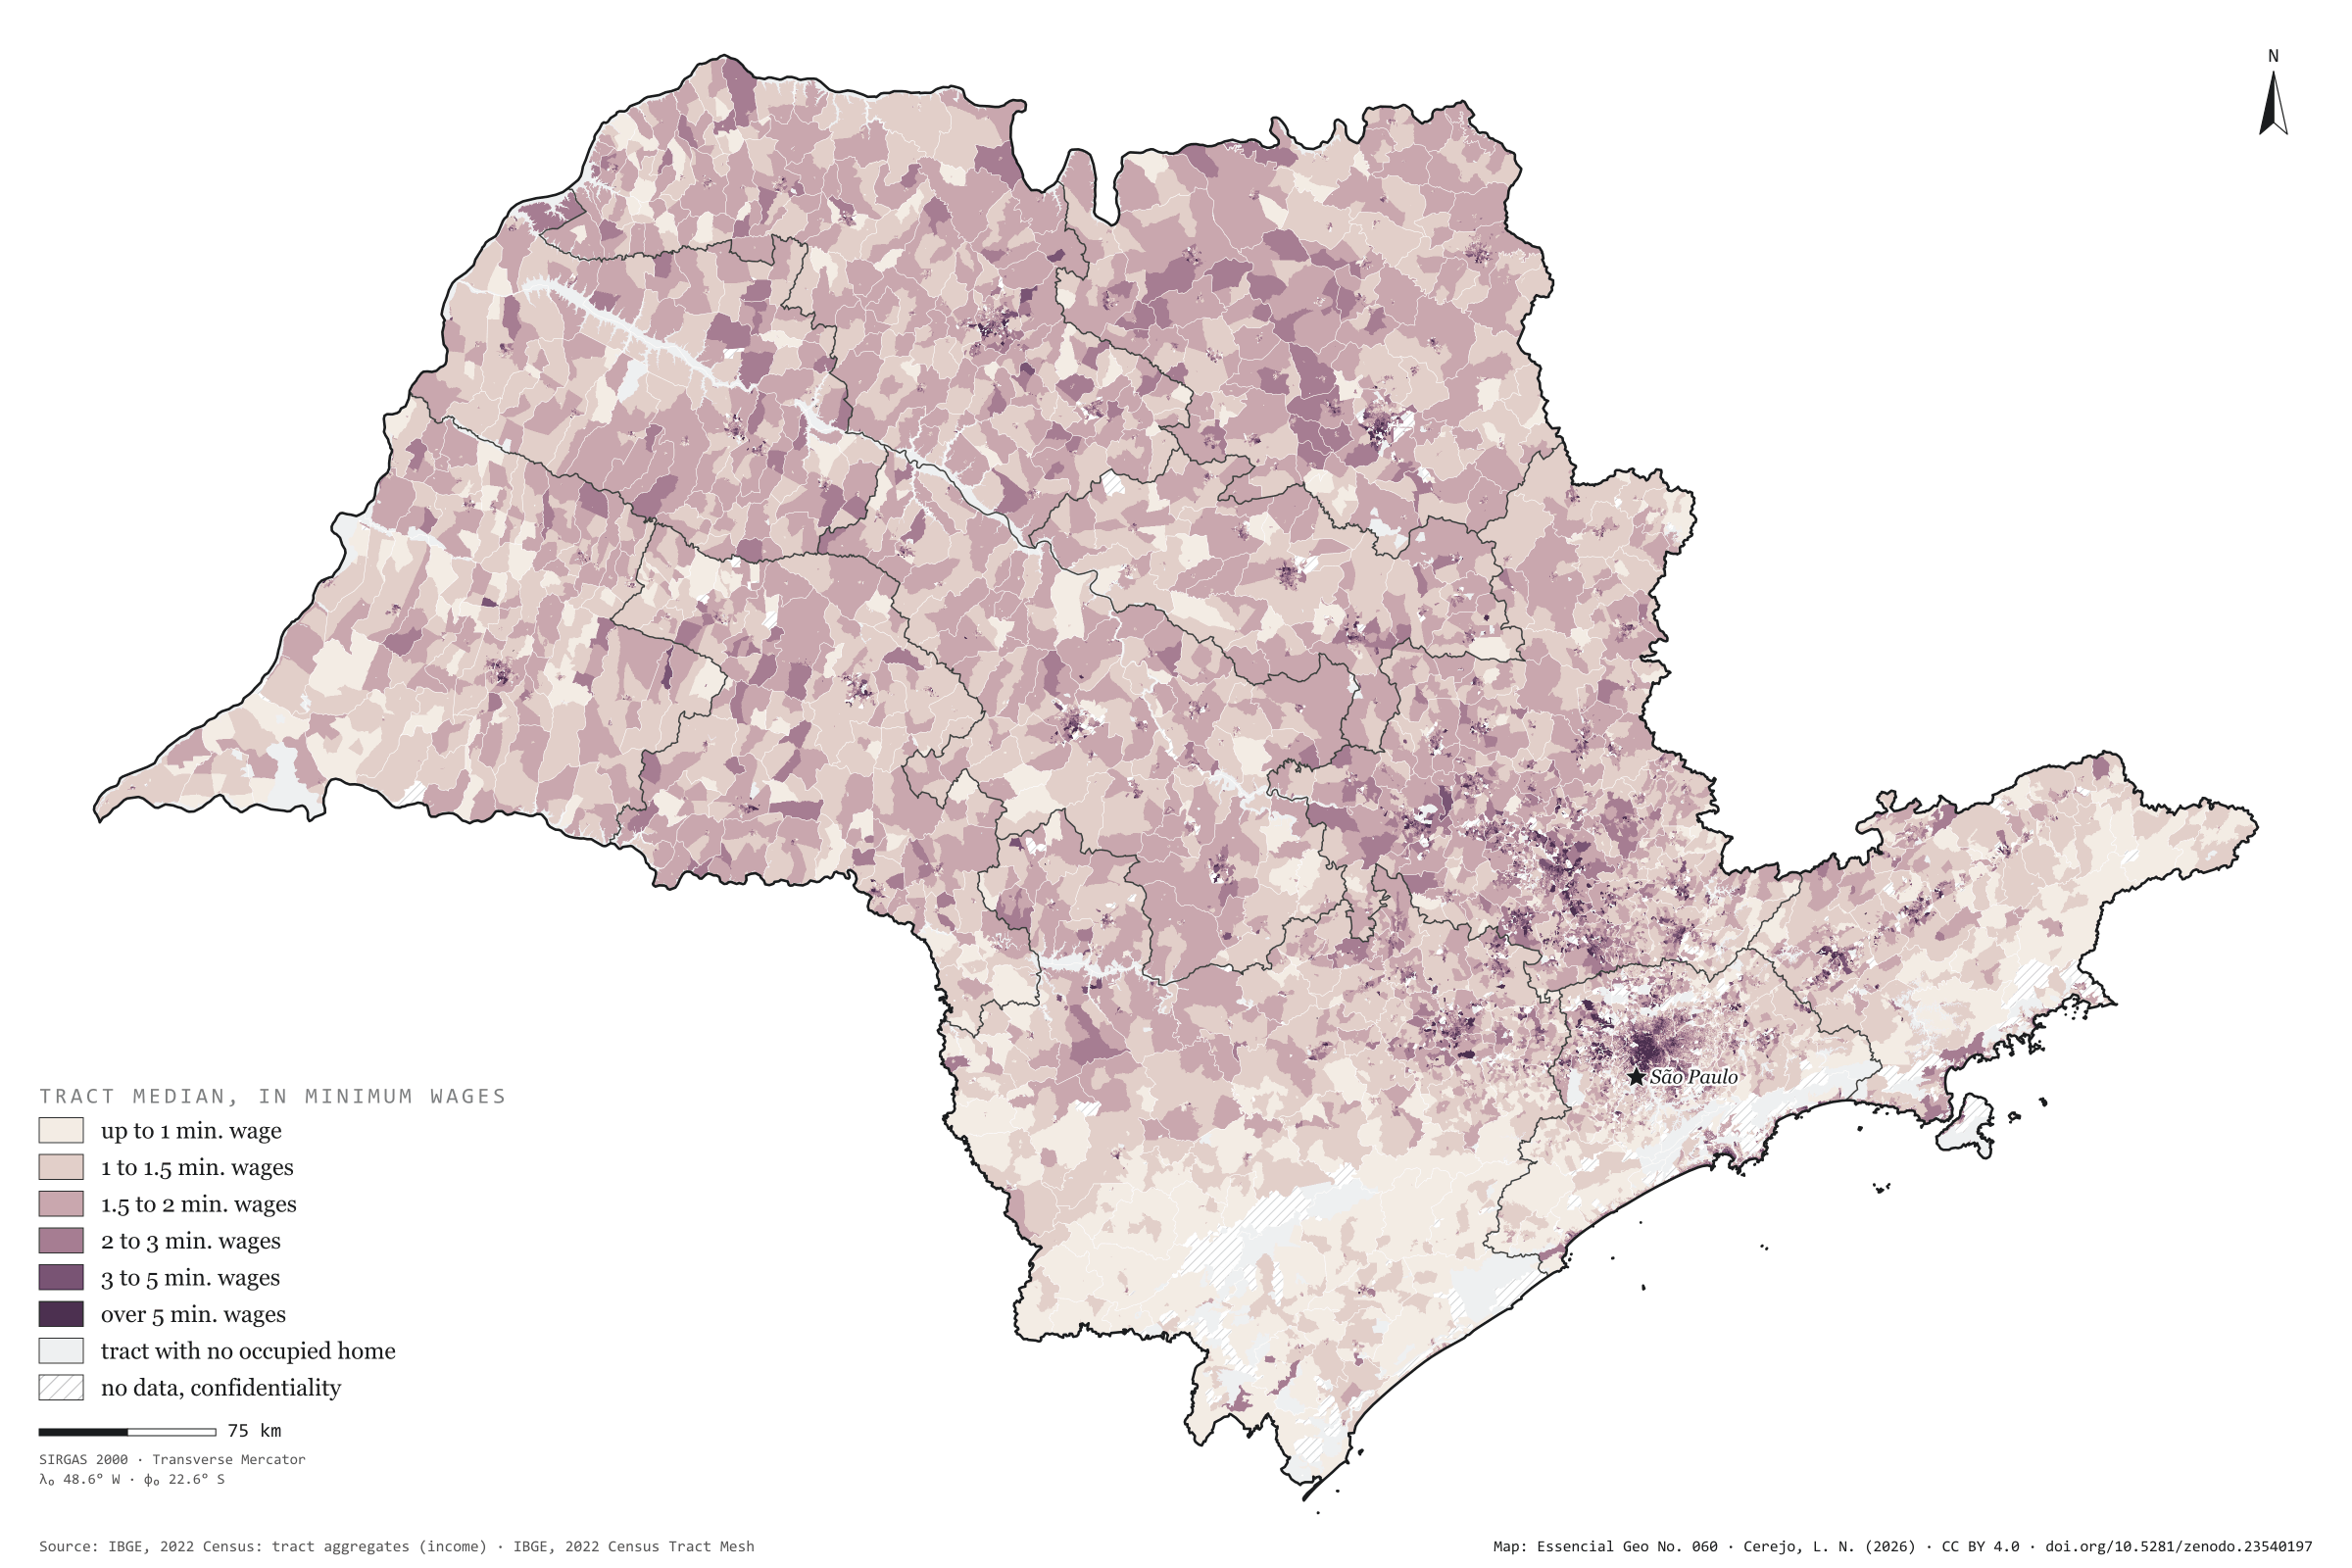
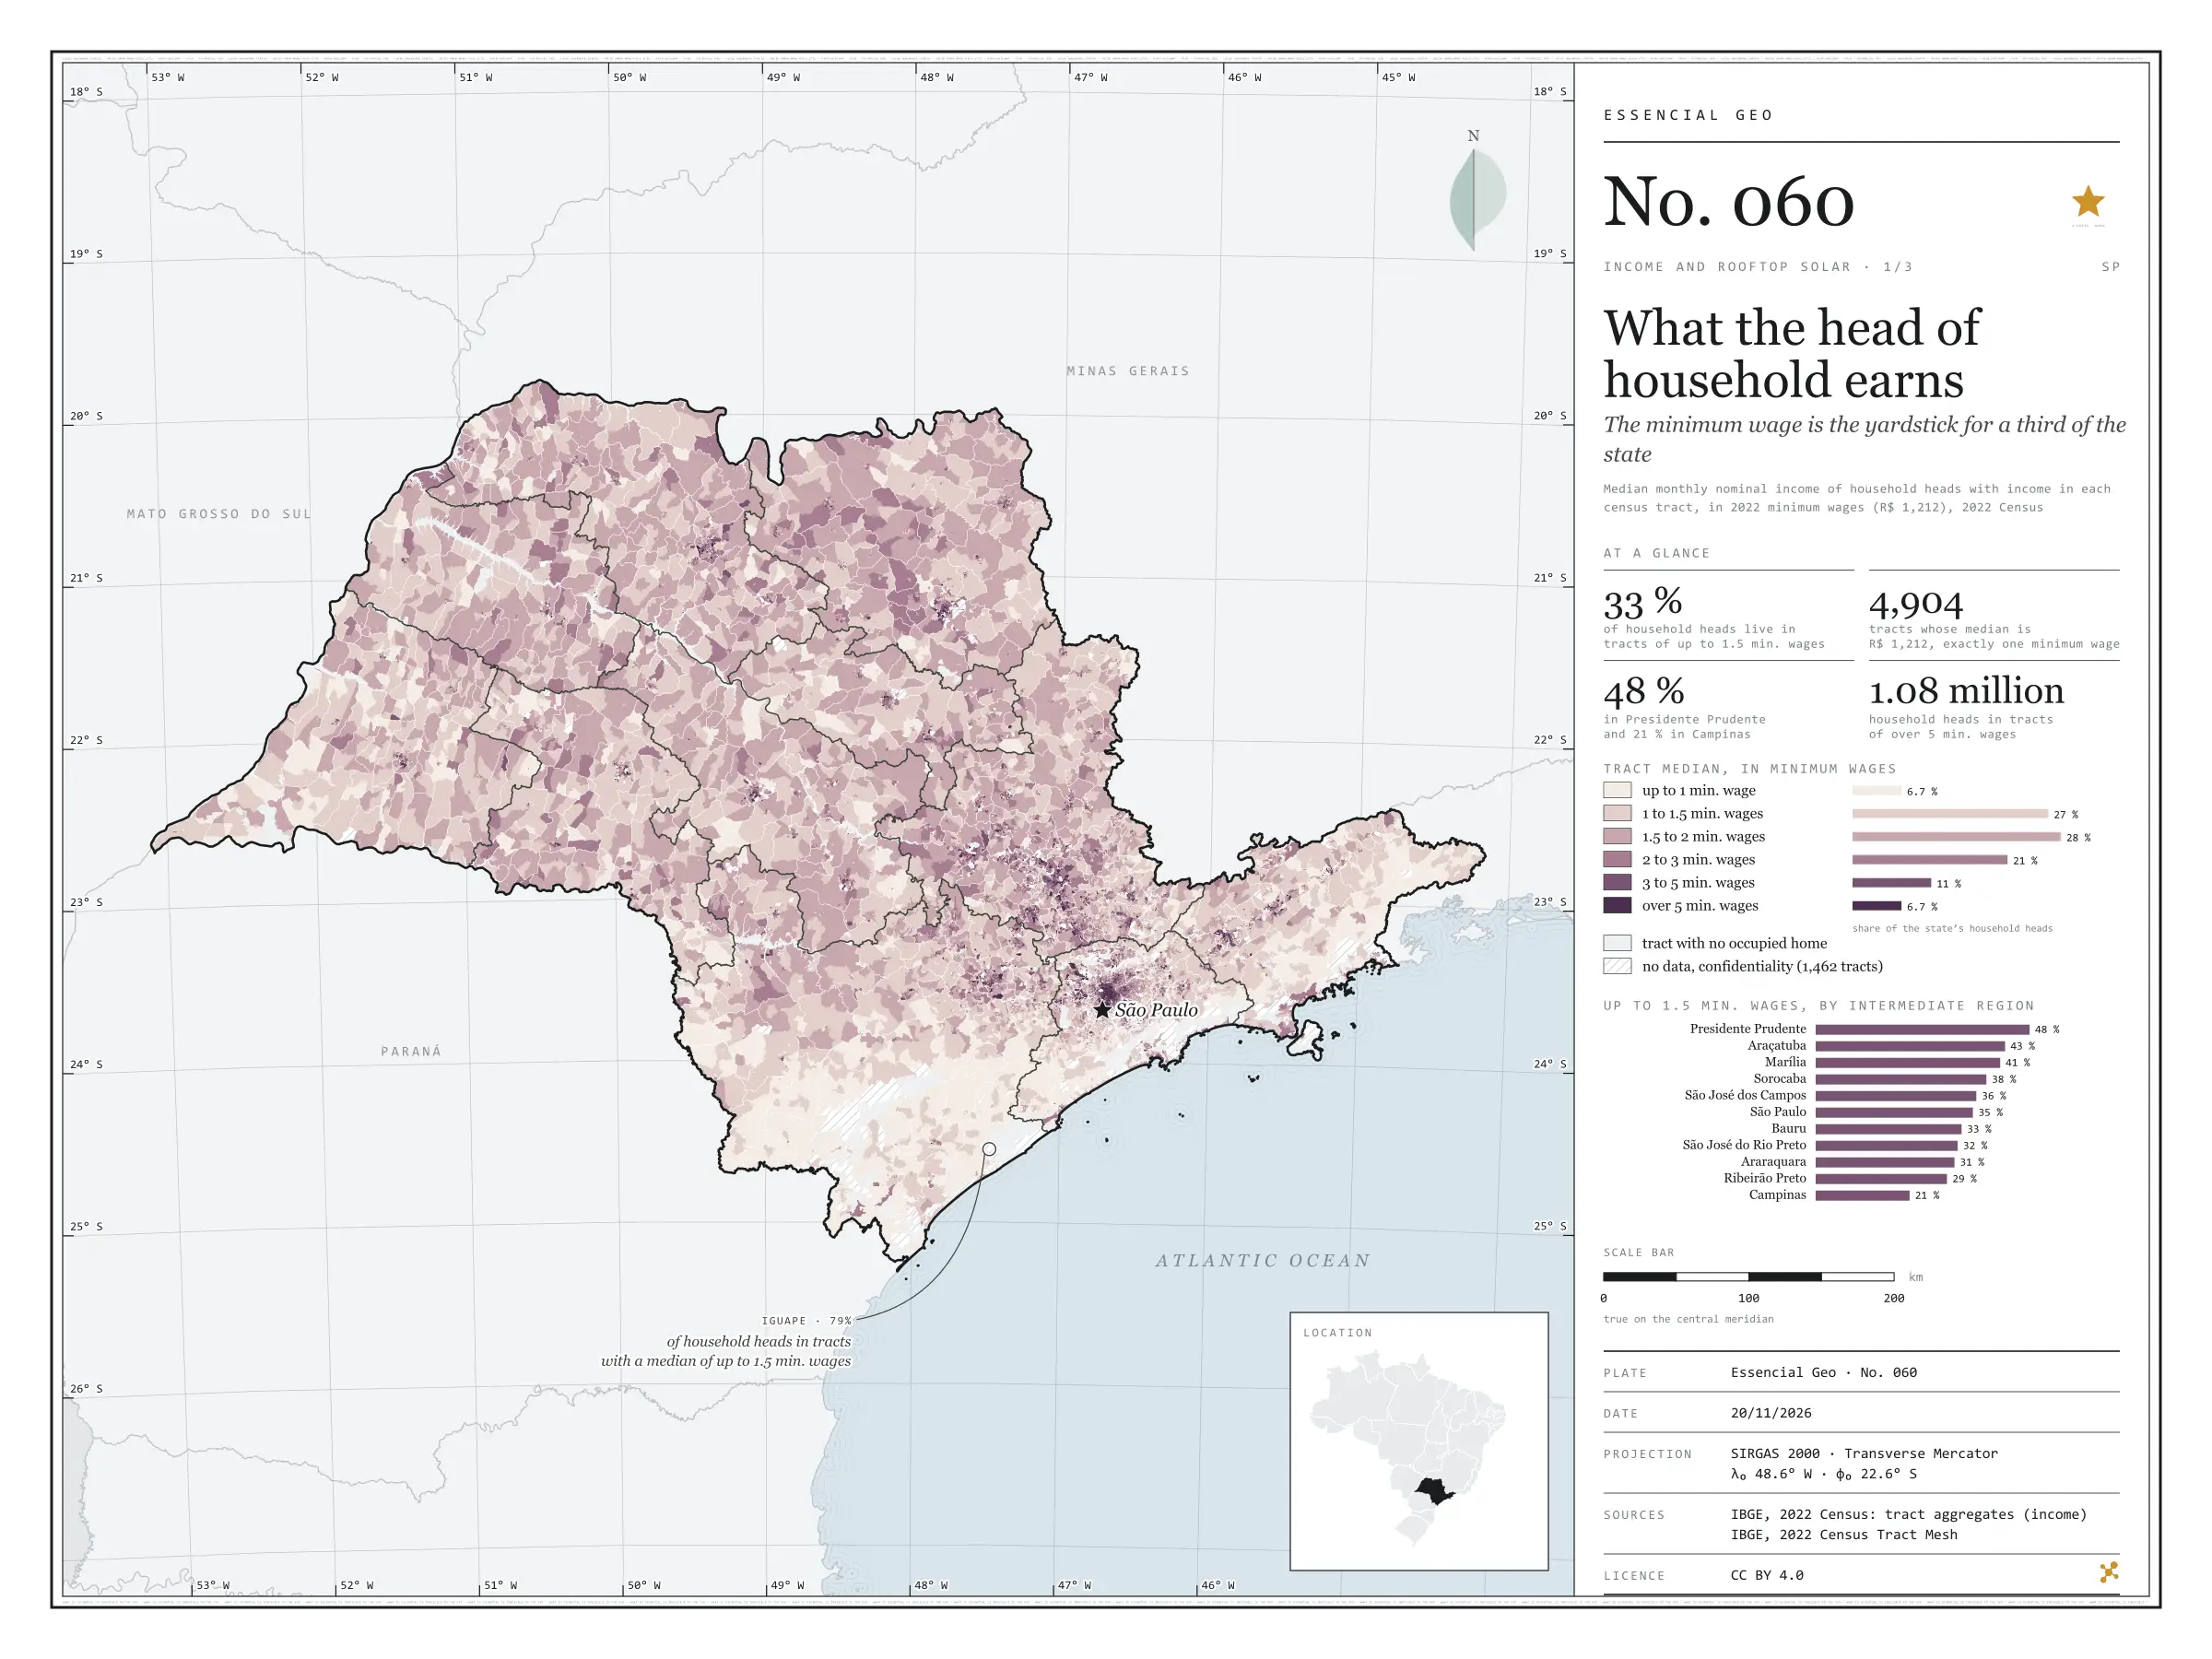
In each census tract of São Paulo, what does the person responsible for the household earn? The 2022 Census gives the median income of household heads with income, and the minimum wage of the time, R$ 1,212, works as a yardstick: in 4,904 tracts the median is exactly one minimum wage. A third of the state’s 16.2 million household heads live in tracts with a median of up to 1.5 minimum wages. The map pales in the Ribeira Valley and the west; in the Presidente Prudente region, 48% of household heads live in such tracts; in the Campinas region, 21%. In Iguape it is 79%; in Francisco Morato, in Greater São Paulo, 78%. At the other end, 1.08 million household heads live in tracts of over 5 minimum wages; the largest shares are in São Caetano do Sul (23%), Santana de Parnaíba and Vinhedo. Plate 034 zooms in on the Campinas region. First plate of the collection “Income and rooftop solar”.

Technical record · downloads · citation

At a glance

Household heads by tract median (household heads)
  • up to 1 min. wage 6.7%
  • 1 to 1.5 min. wages 26.6%
  • 1.5 to 2 min. wages 28.3%
  • 2 to 3 min. wages 21.1%
  • 3 to 5 min. wages 10.7%
  • over 5 min. wages 6.7%
Household heads in tracts of up to 1.5 minimum wages

33 %

5.40 million of 16.2 million

Tracts with a median of exactly one minimum wage

4,904 tracts

Layers

  • setores polygon 103,319 tracts: household heads, mean and median income in reais and in minimum wages, class
  • regioes_intermediarias polygon 11 intermediate geographic regions
  • limite_estadual polygon State boundary

Metadata

Extent
São Paulo State (SP)
CRS / Projection
SIRGAS 2000 (EPSG:4674)
EPSG:4674
Software
Node.js · d3-geo · QGIS
Method
Median monthly nominal income of household heads with income, by 2022 Census tract, in six classes measured in 2022 minimum wages (R$ 1,212); tracts with confidential values are left as no data.
Version
v1.0.0
Licence
CC BY 4.0

Downloads

Figure to reuse

The map without a frame, with legend, scale, reference system and credit written on it: ready for papers, lectures and slides. In two versions: with the basemap (neighbours and sea) or only the mapped area, on white.

Point a camera at it to open this page.

How to cite

Cerejo, L. N. (2026). Quanto ganha quem responde pela casa: o salário mínimo é a régua de um terço do estado [What the head of household earns: The minimum wage is the yardstick for a third of the state] (Version 1.0.0) [Data set]. Zenodo. https://doi.org/10.5281/zenodo.23540197

No. 061 Census · income Income and rooftop solar 2/3

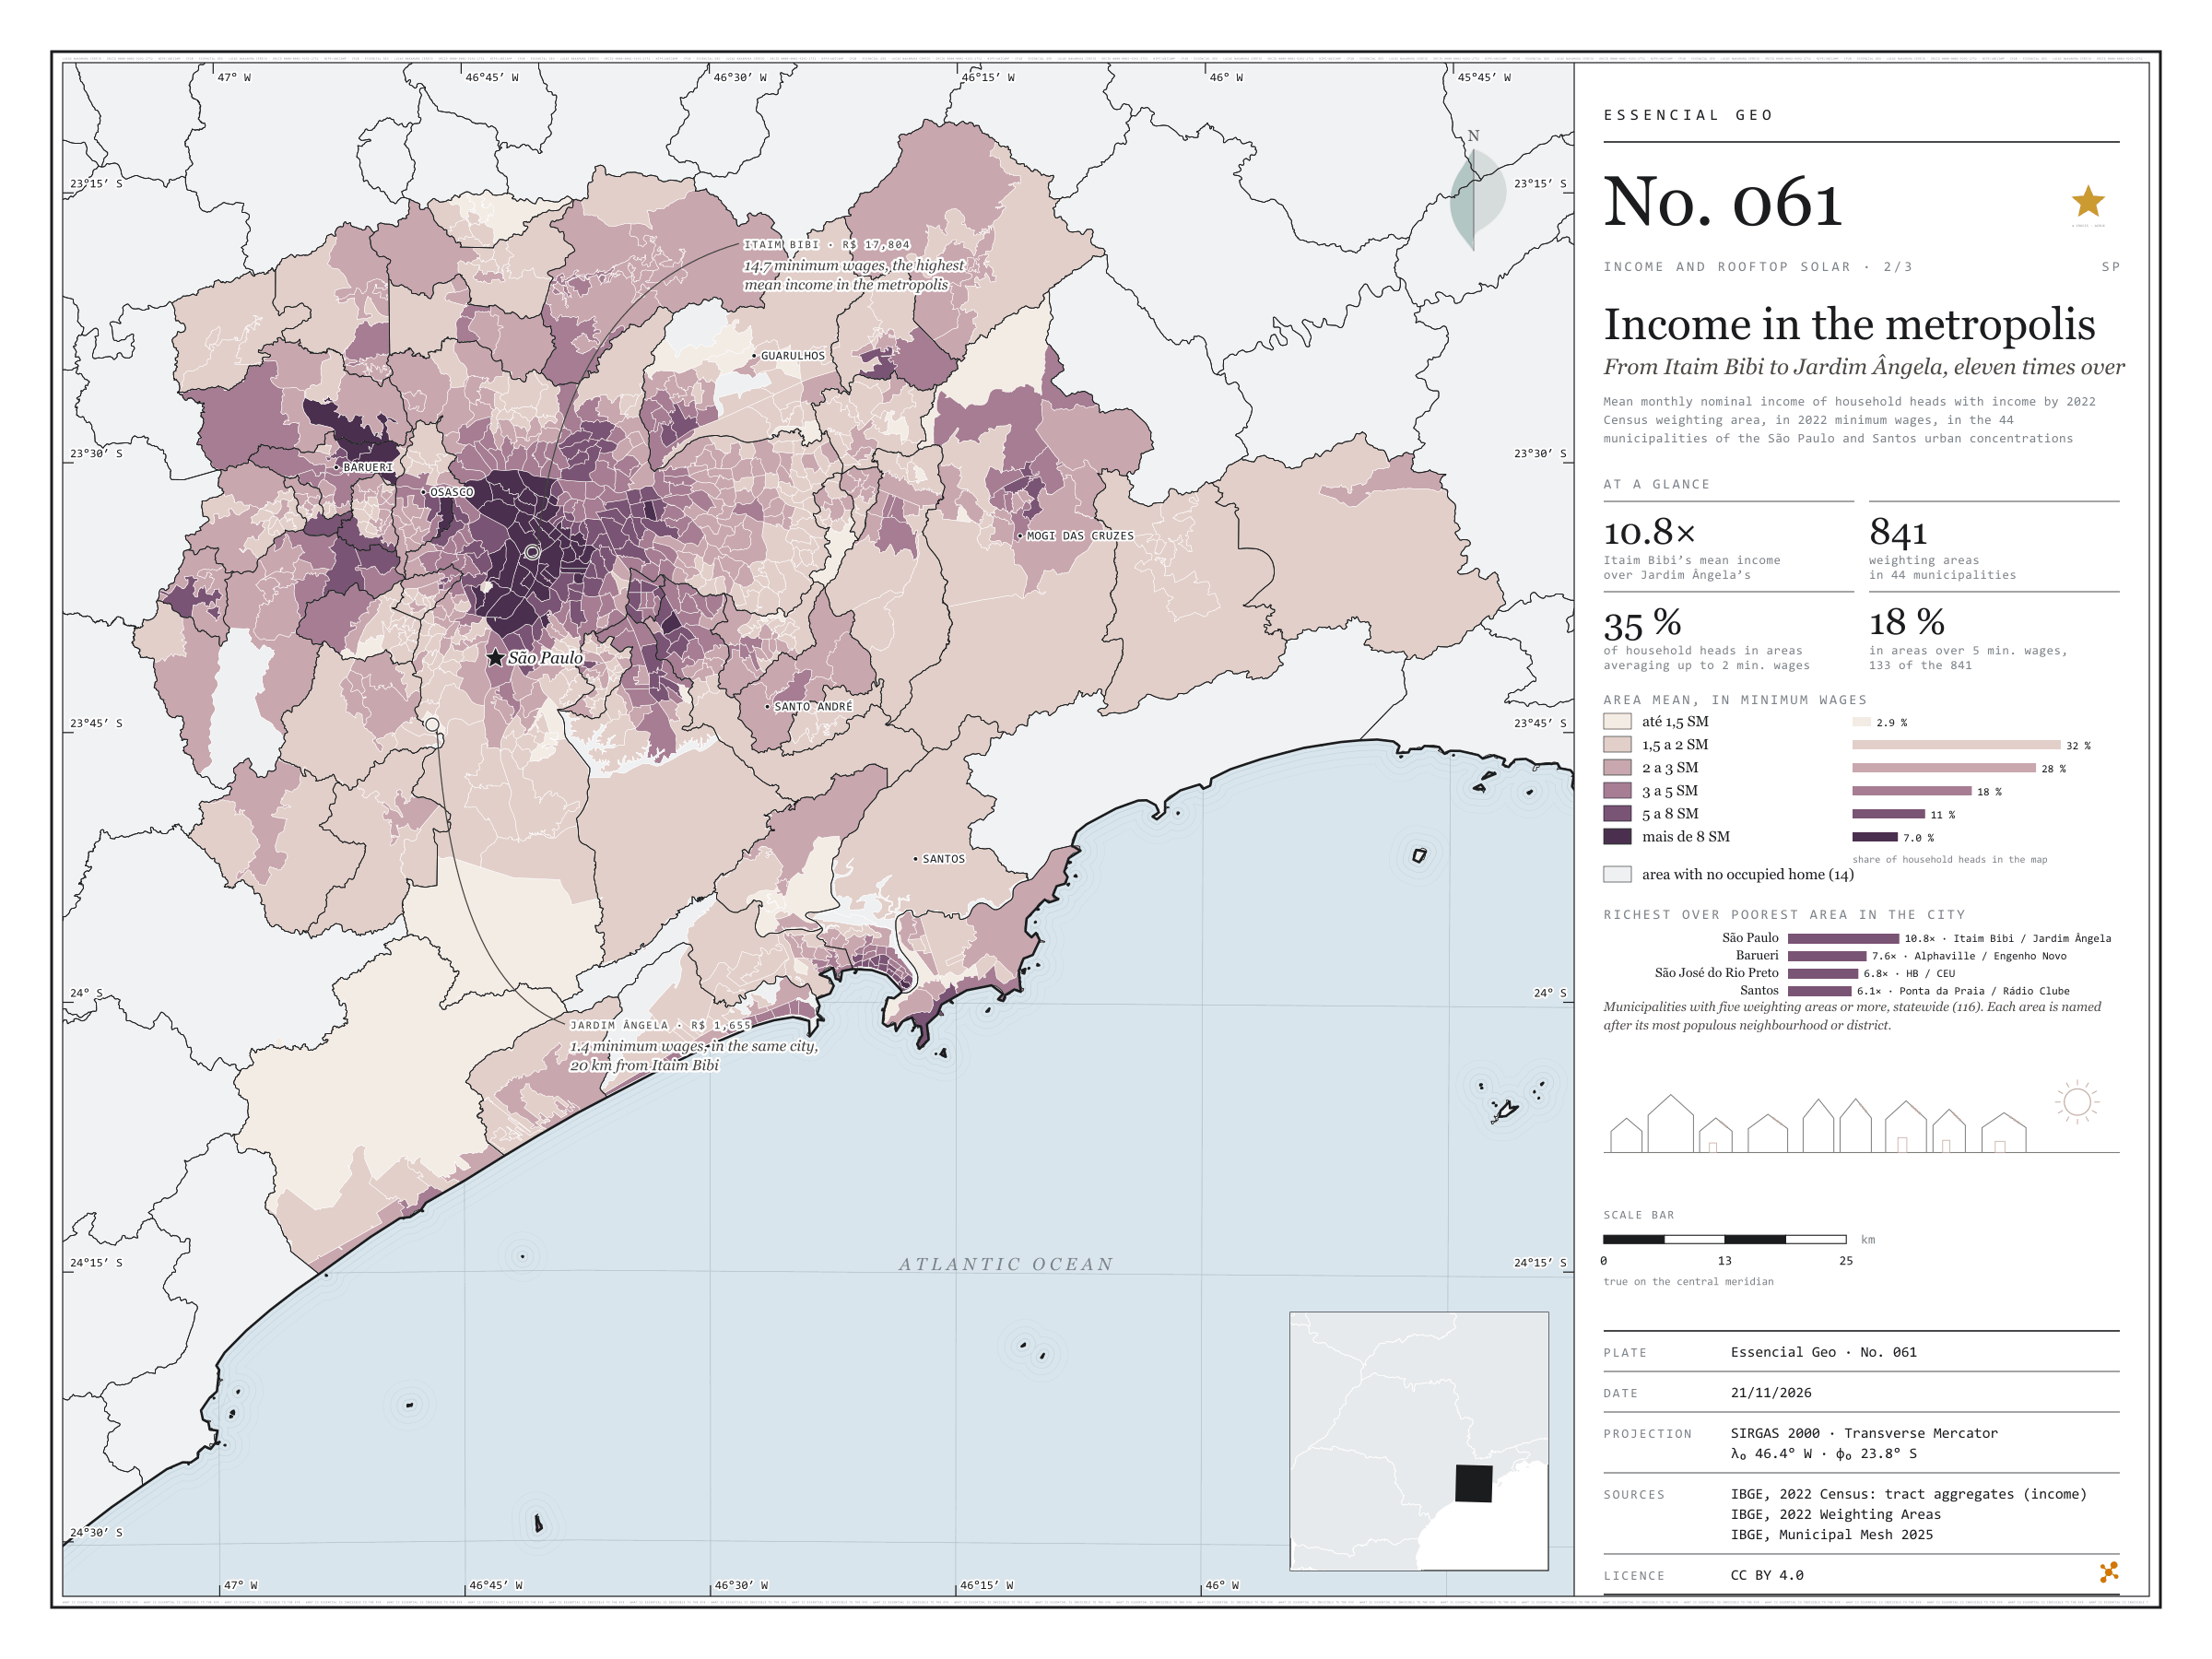
Income in the metropolis

From Itaim Bibi to Jardim Ângela, eleven times over

Fig. 061 São Paulo and Santos urban concentrations (SP) EPSG:4674 Source: IBGE

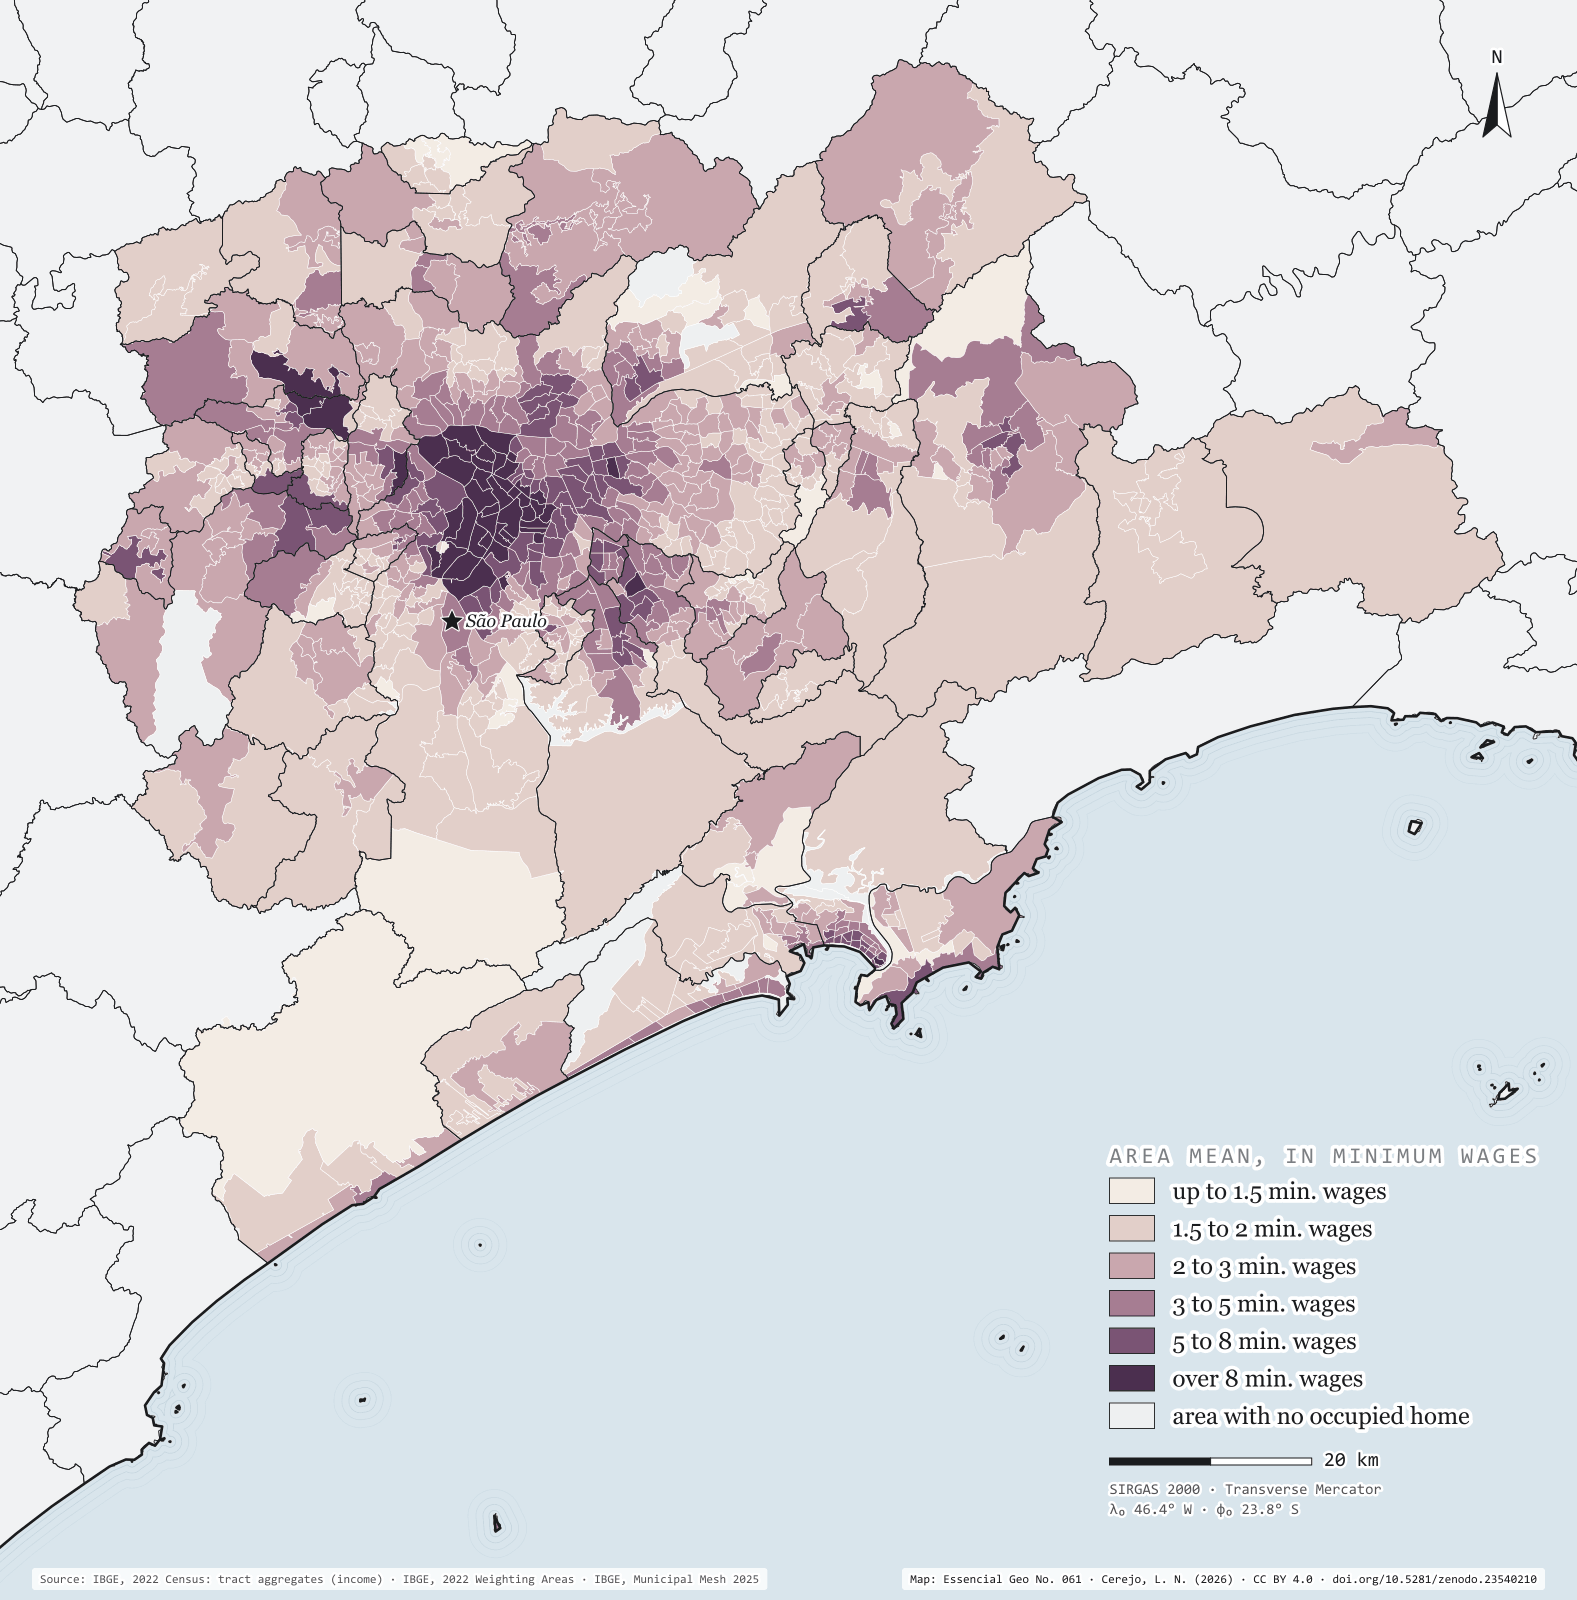
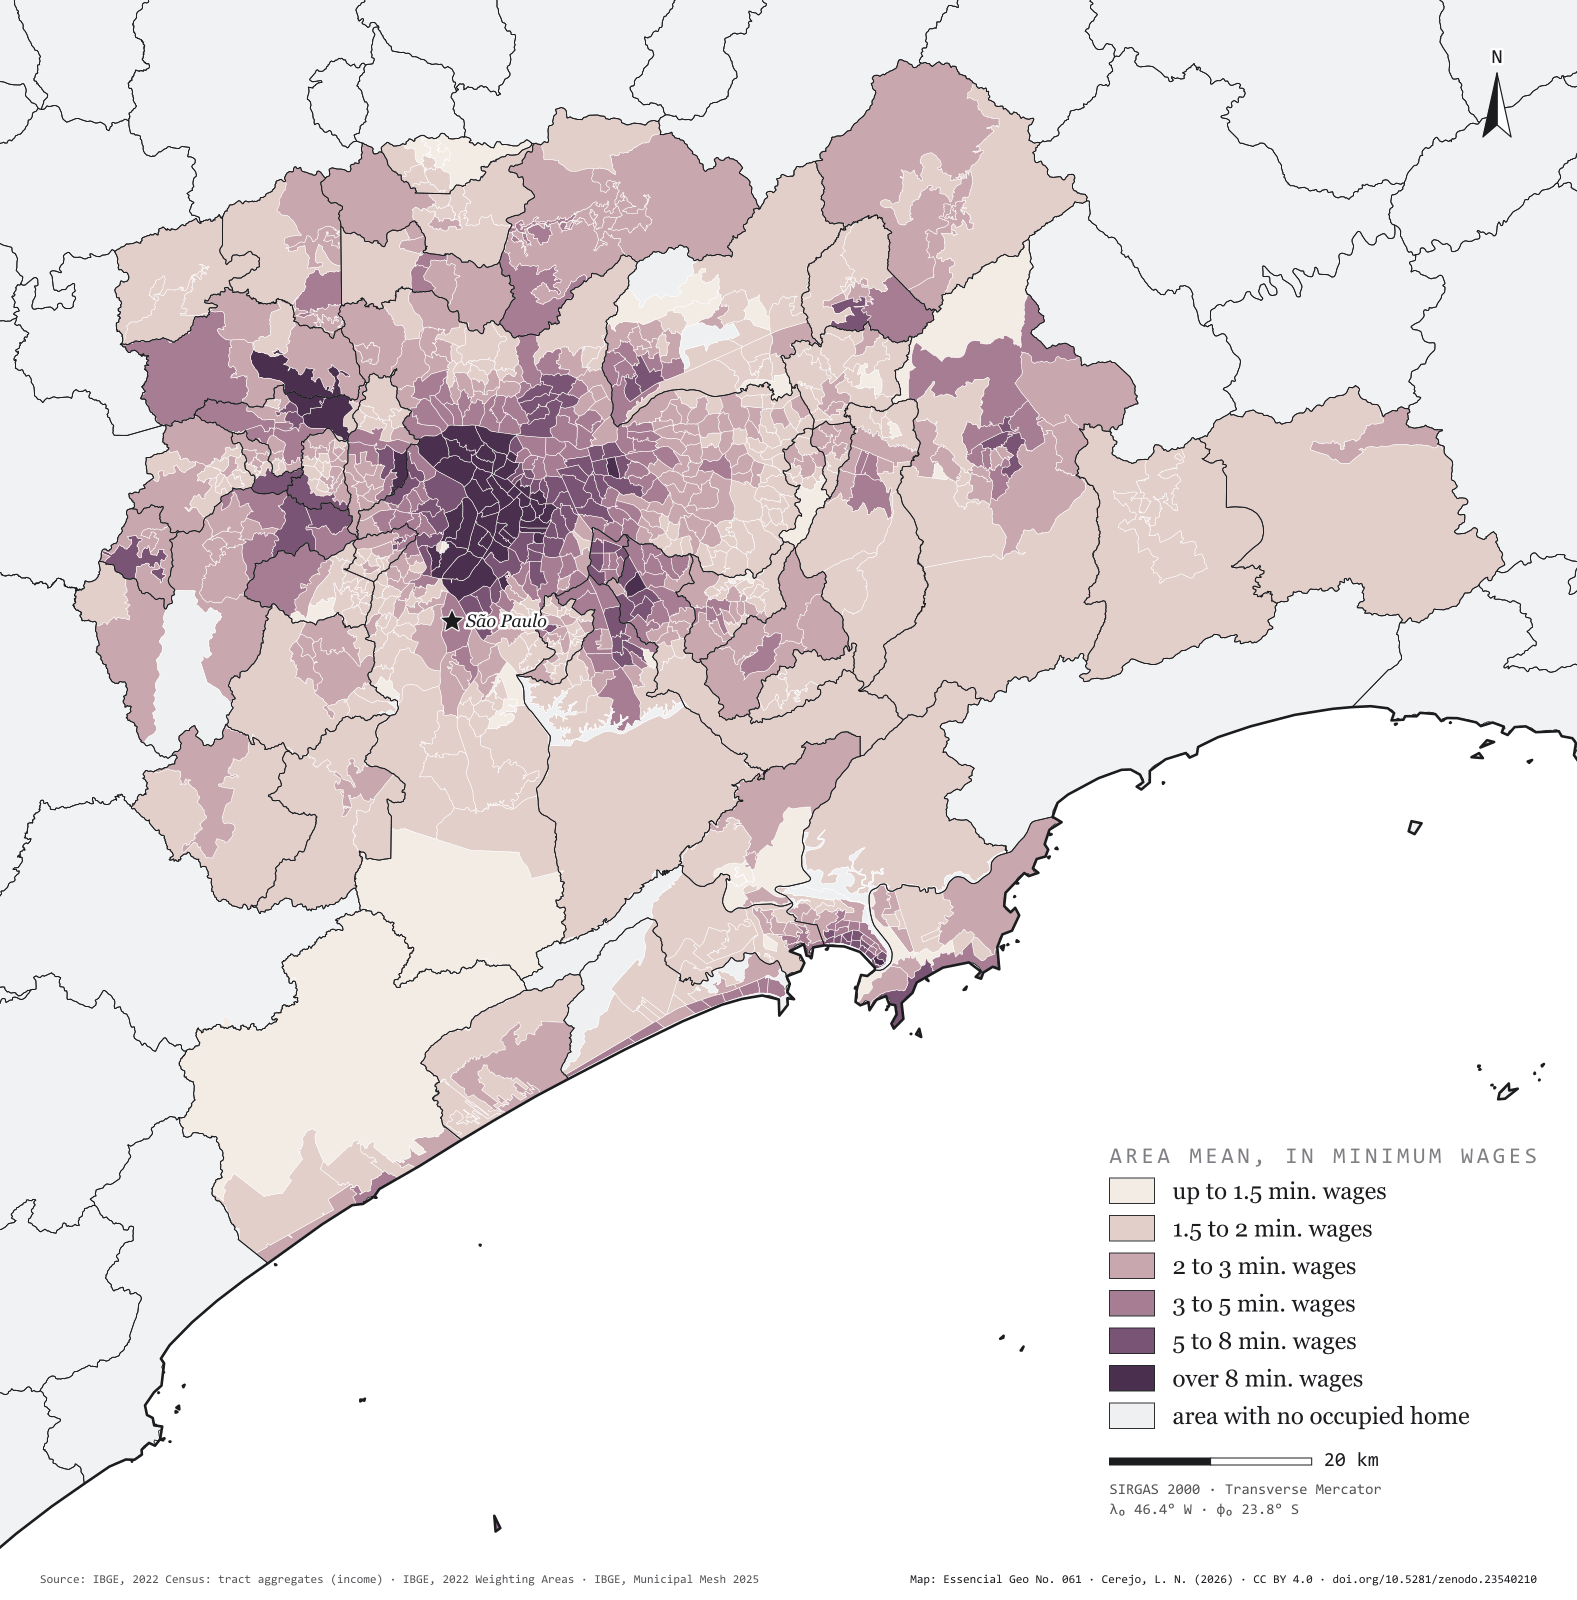
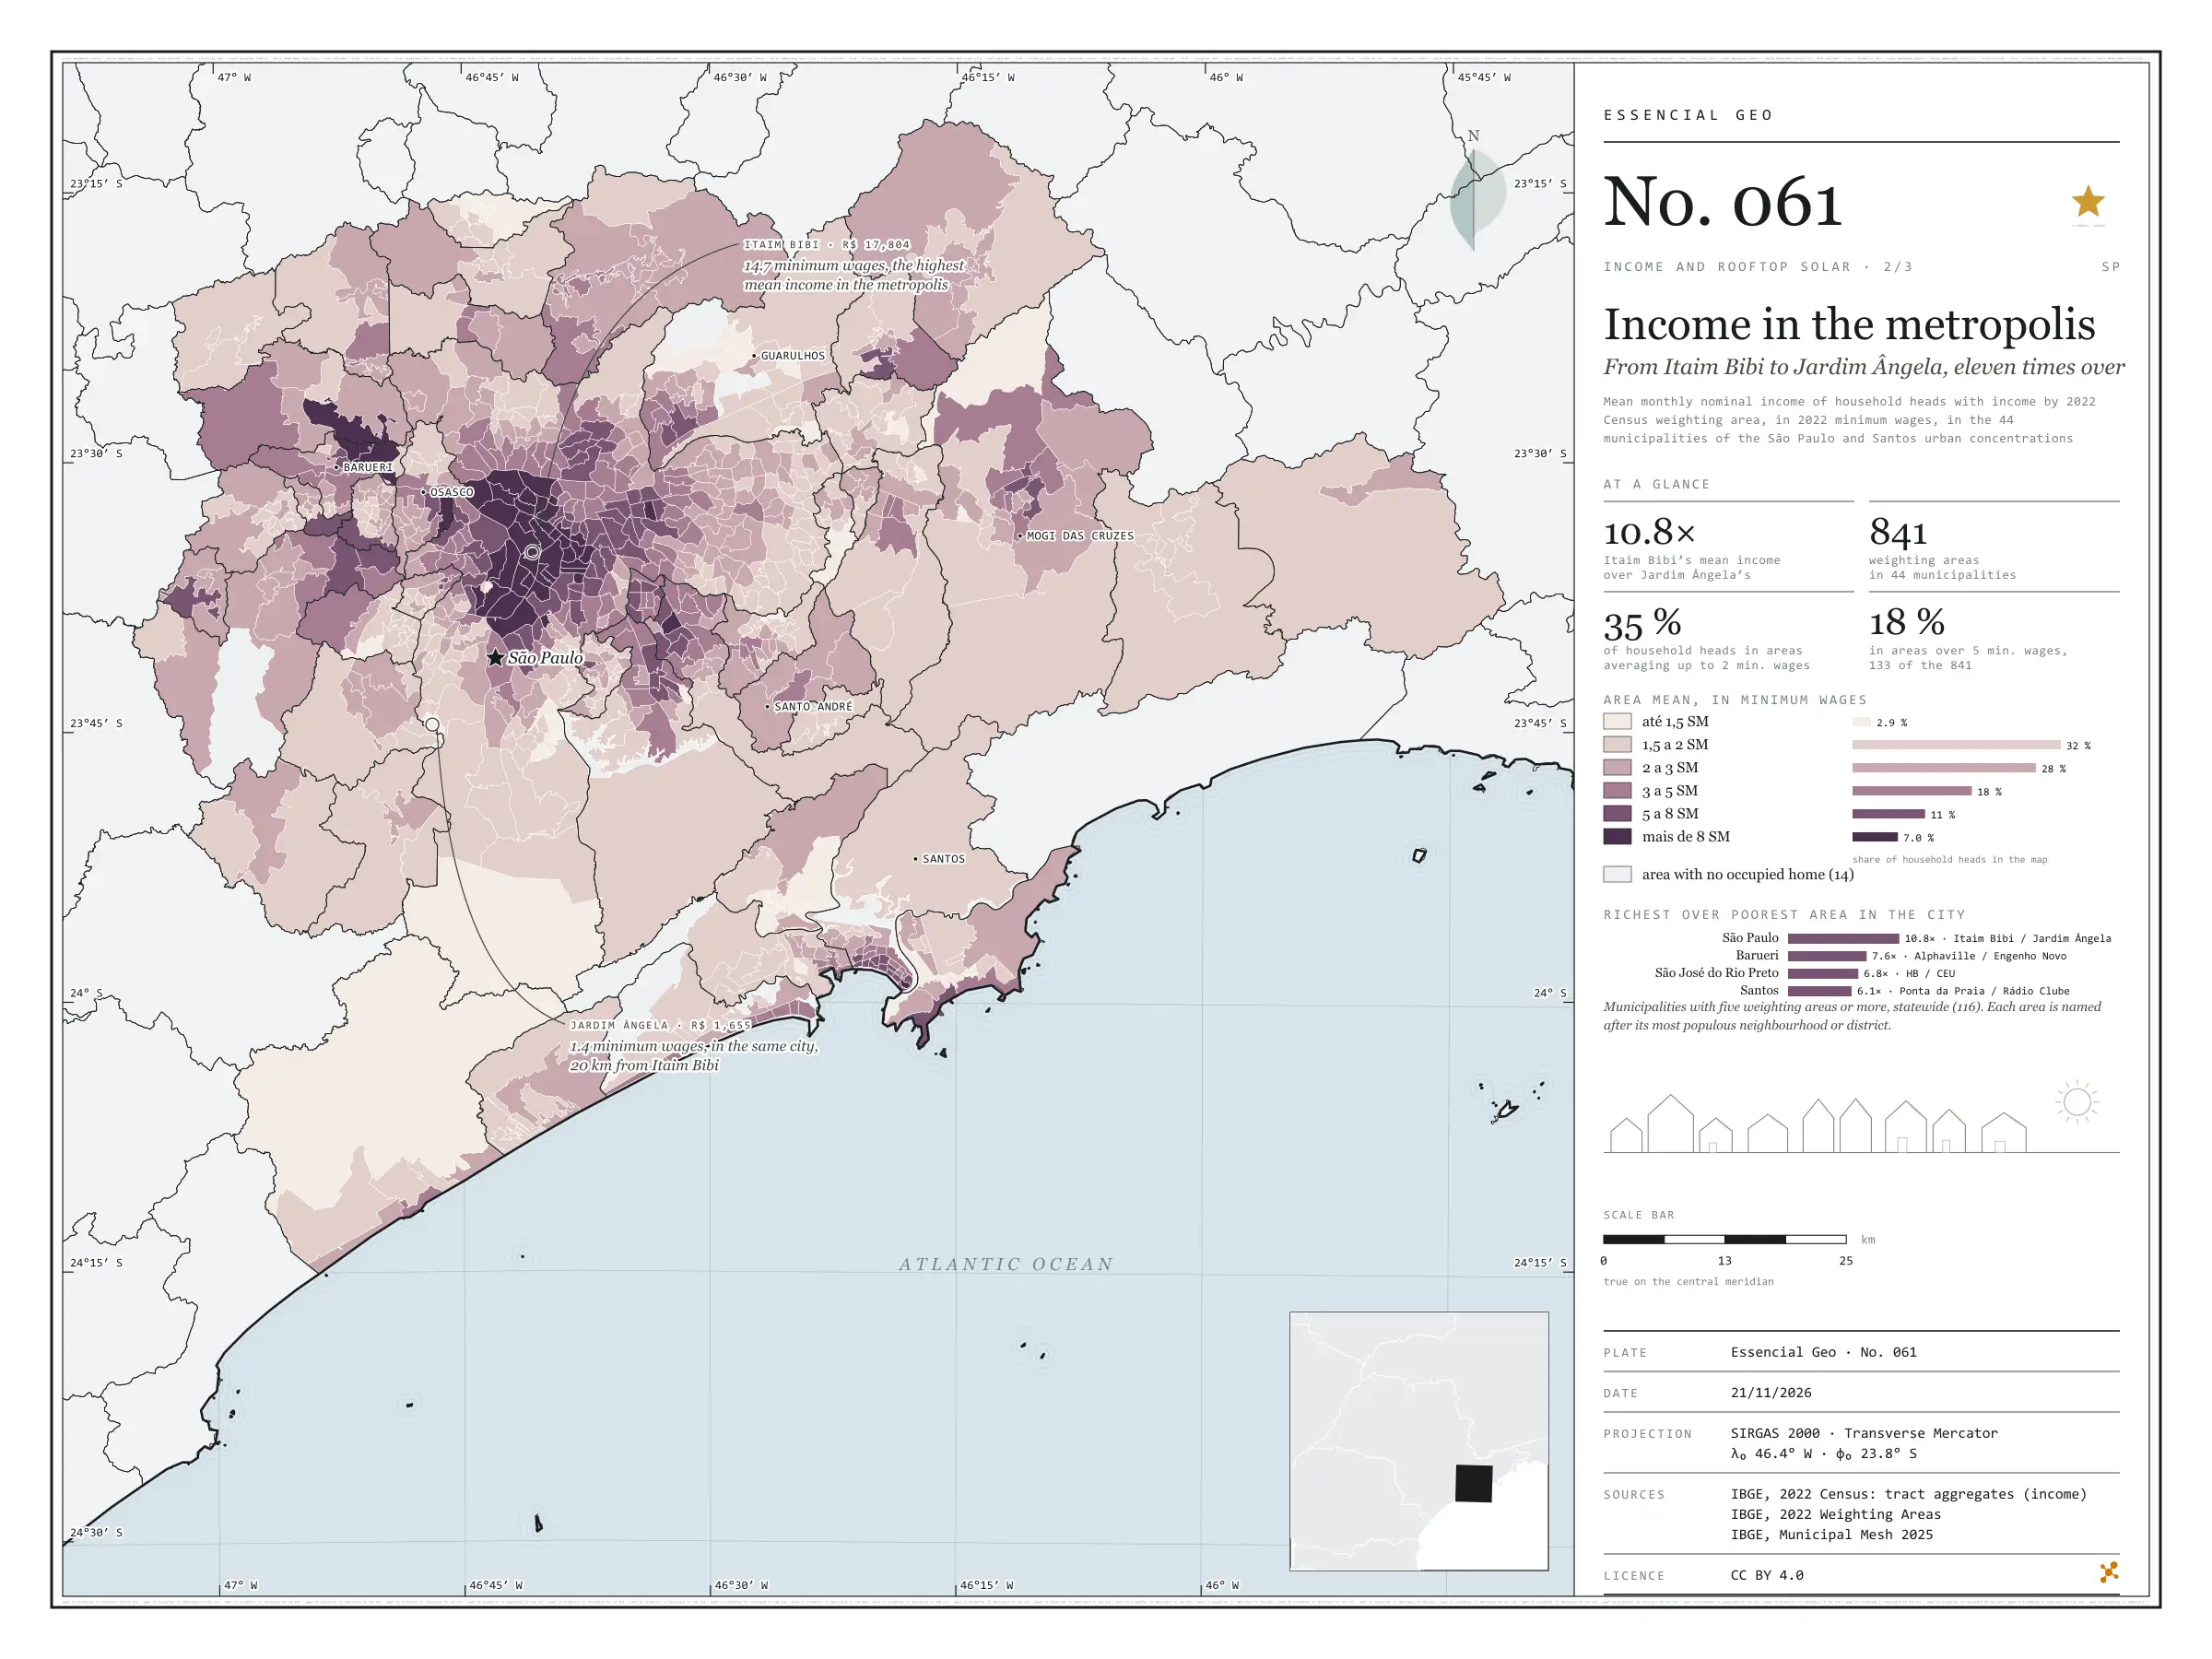
Greater São Paulo and the Santos lowlands add up to 44 municipalities and 22.3 million people. IBGE divides them into 841 inhabited weighting areas, and in each one the mean income of household heads can be worked out. The richest is Itaim Bibi, in the capital: R$ 17,804 a month, 14.7 minimum wages of 2022. Twenty kilometres away, in the same city, the Jardim Ângela area has R$ 1,655, 1.4 minimum wages: a gap of 10.8 times, the largest among São Paulo municipalities with five areas or more. Barueri comes next, from Alphaville to Engenho Novo (7.6 times), and Santos, from Ponta da Praia to Rádio Clube (6.1). The map shows the capital’s rich centre, stretching south-west to Alphaville, ringed by a pale belt that runs from Francisco Morato to Itaquaquecetuba and down the escarpment to the coast. Second plate of the collection “Income and rooftop solar”.

Technical record · downloads · citation

At a glance

Household heads by the weighting area’s mean income (household heads)
  • up to 1.5 min. wages 2.9%
  • 1.5 to 2 min. wages 32.2%
  • 2 to 3 min. wages 28.3%
  • 3 to 5 min. wages 18.4%
  • 5 to 8 min. wages 11.2%
  • over 8 min. wages 7%
Itaim Bibi over Jardim Ângela, mean income

11 times

R$ 17,804 and R$ 1,655 a month

Layers

  • areas_de_ponderacao polygon 2,535 weighting areas statewide: main neighbourhood or district, people, household heads, mean income in reais and in minimum wages
  • regioes_intermediarias polygon 11 intermediate geographic regions
  • limite_estadual polygon State boundary

Metadata

Extent
São Paulo and Santos urban concentrations (SP)
CRS / Projection
SIRGAS 2000 (EPSG:4674)
EPSG:4674
Software
Node.js · d3-geo · QGIS
Method
Mean income of household heads with income by 2022 Census weighting area: mean of tracts with data, weighted by the number of household heads, in 2022 minimum wages (R$ 1,212), in the 44 municipalities of the São Paulo and Santos urban concentrations.
Version
v1.0.0
Licence
CC BY 4.0

Downloads

Figure to reuse

The map without a frame, with legend, scale, reference system and credit written on it: ready for papers, lectures and slides. In two versions: with the basemap (neighbours and sea) or only the mapped area, on white.

Point a camera at it to open this page.

How to cite

Cerejo, L. N. (2026). A renda na metrópole: do Itaim Bibi ao Jardim Ângela, onze vezes [Income in the metropolis: From Itaim Bibi to Jardim Ângela, eleven times over] (Version 1.0.0) [Data set]. Zenodo. https://doi.org/10.5281/zenodo.23540210

No. 062 Energy · biomass Income and rooftop solar 3/3

Income and rooftop solar

Rooftop sun does not follow the money

Fig. 062 São Paulo State (SP) EPSG:4674 Source: ANEEL, IBGE

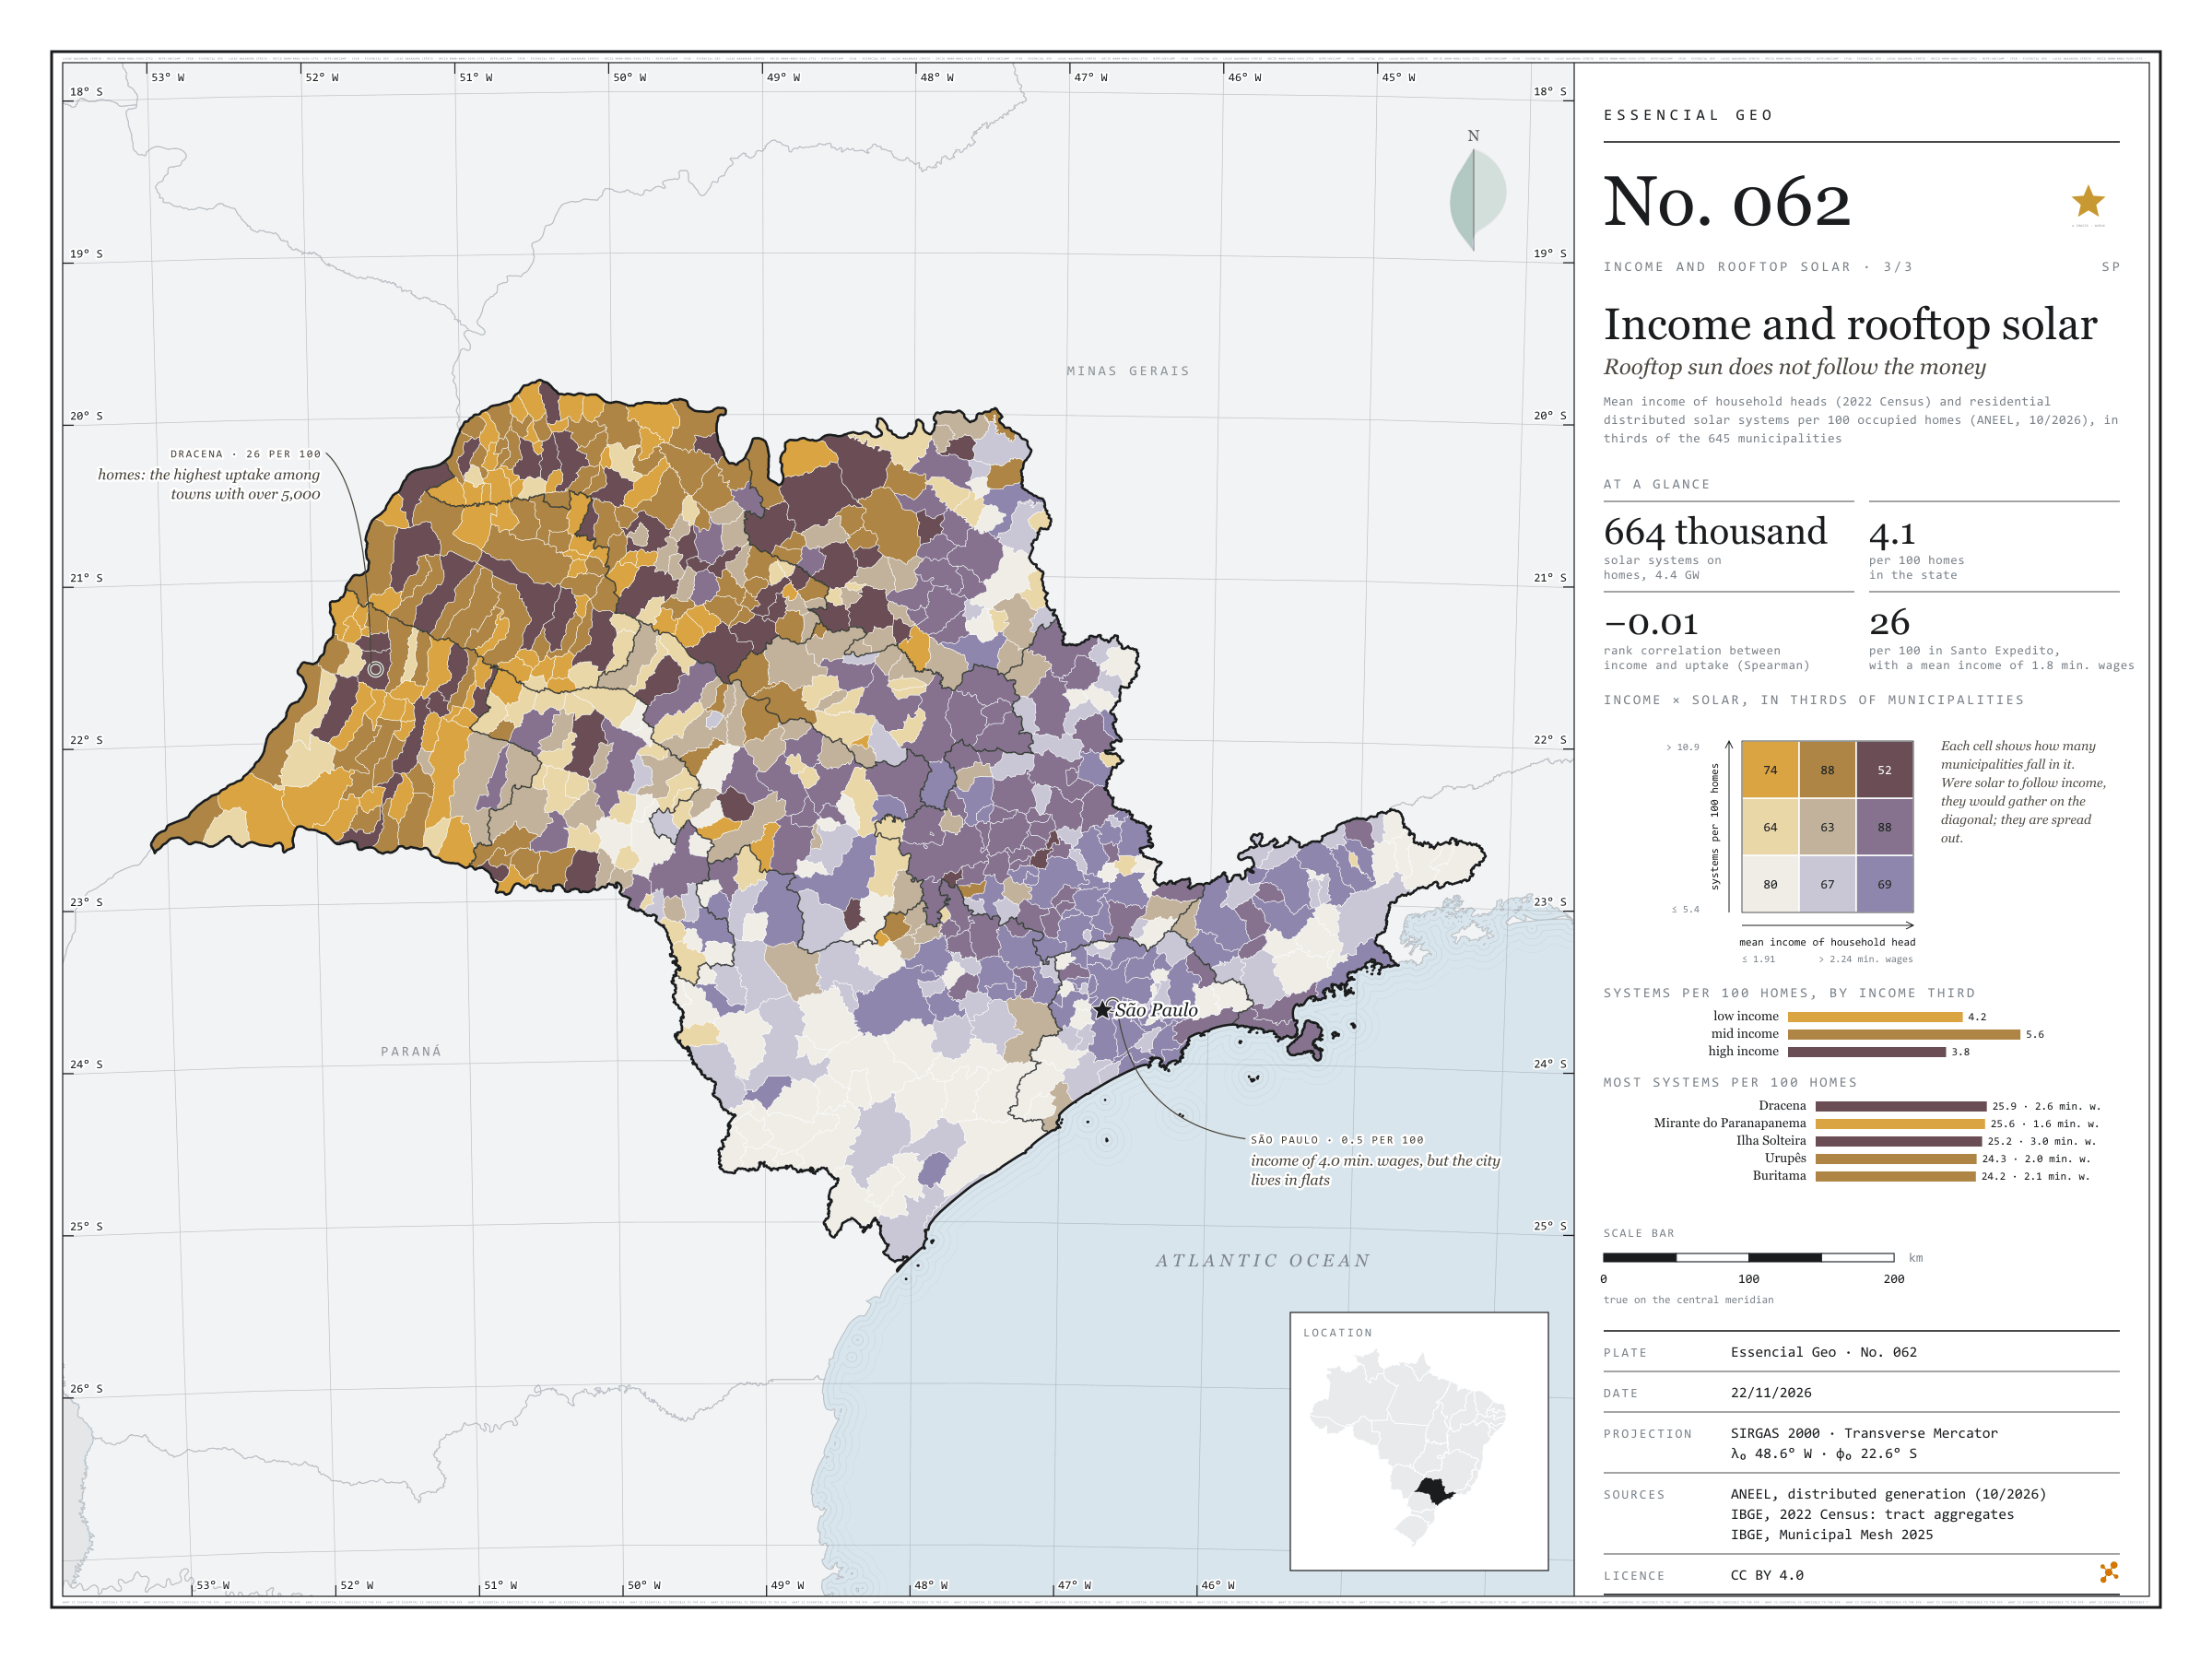
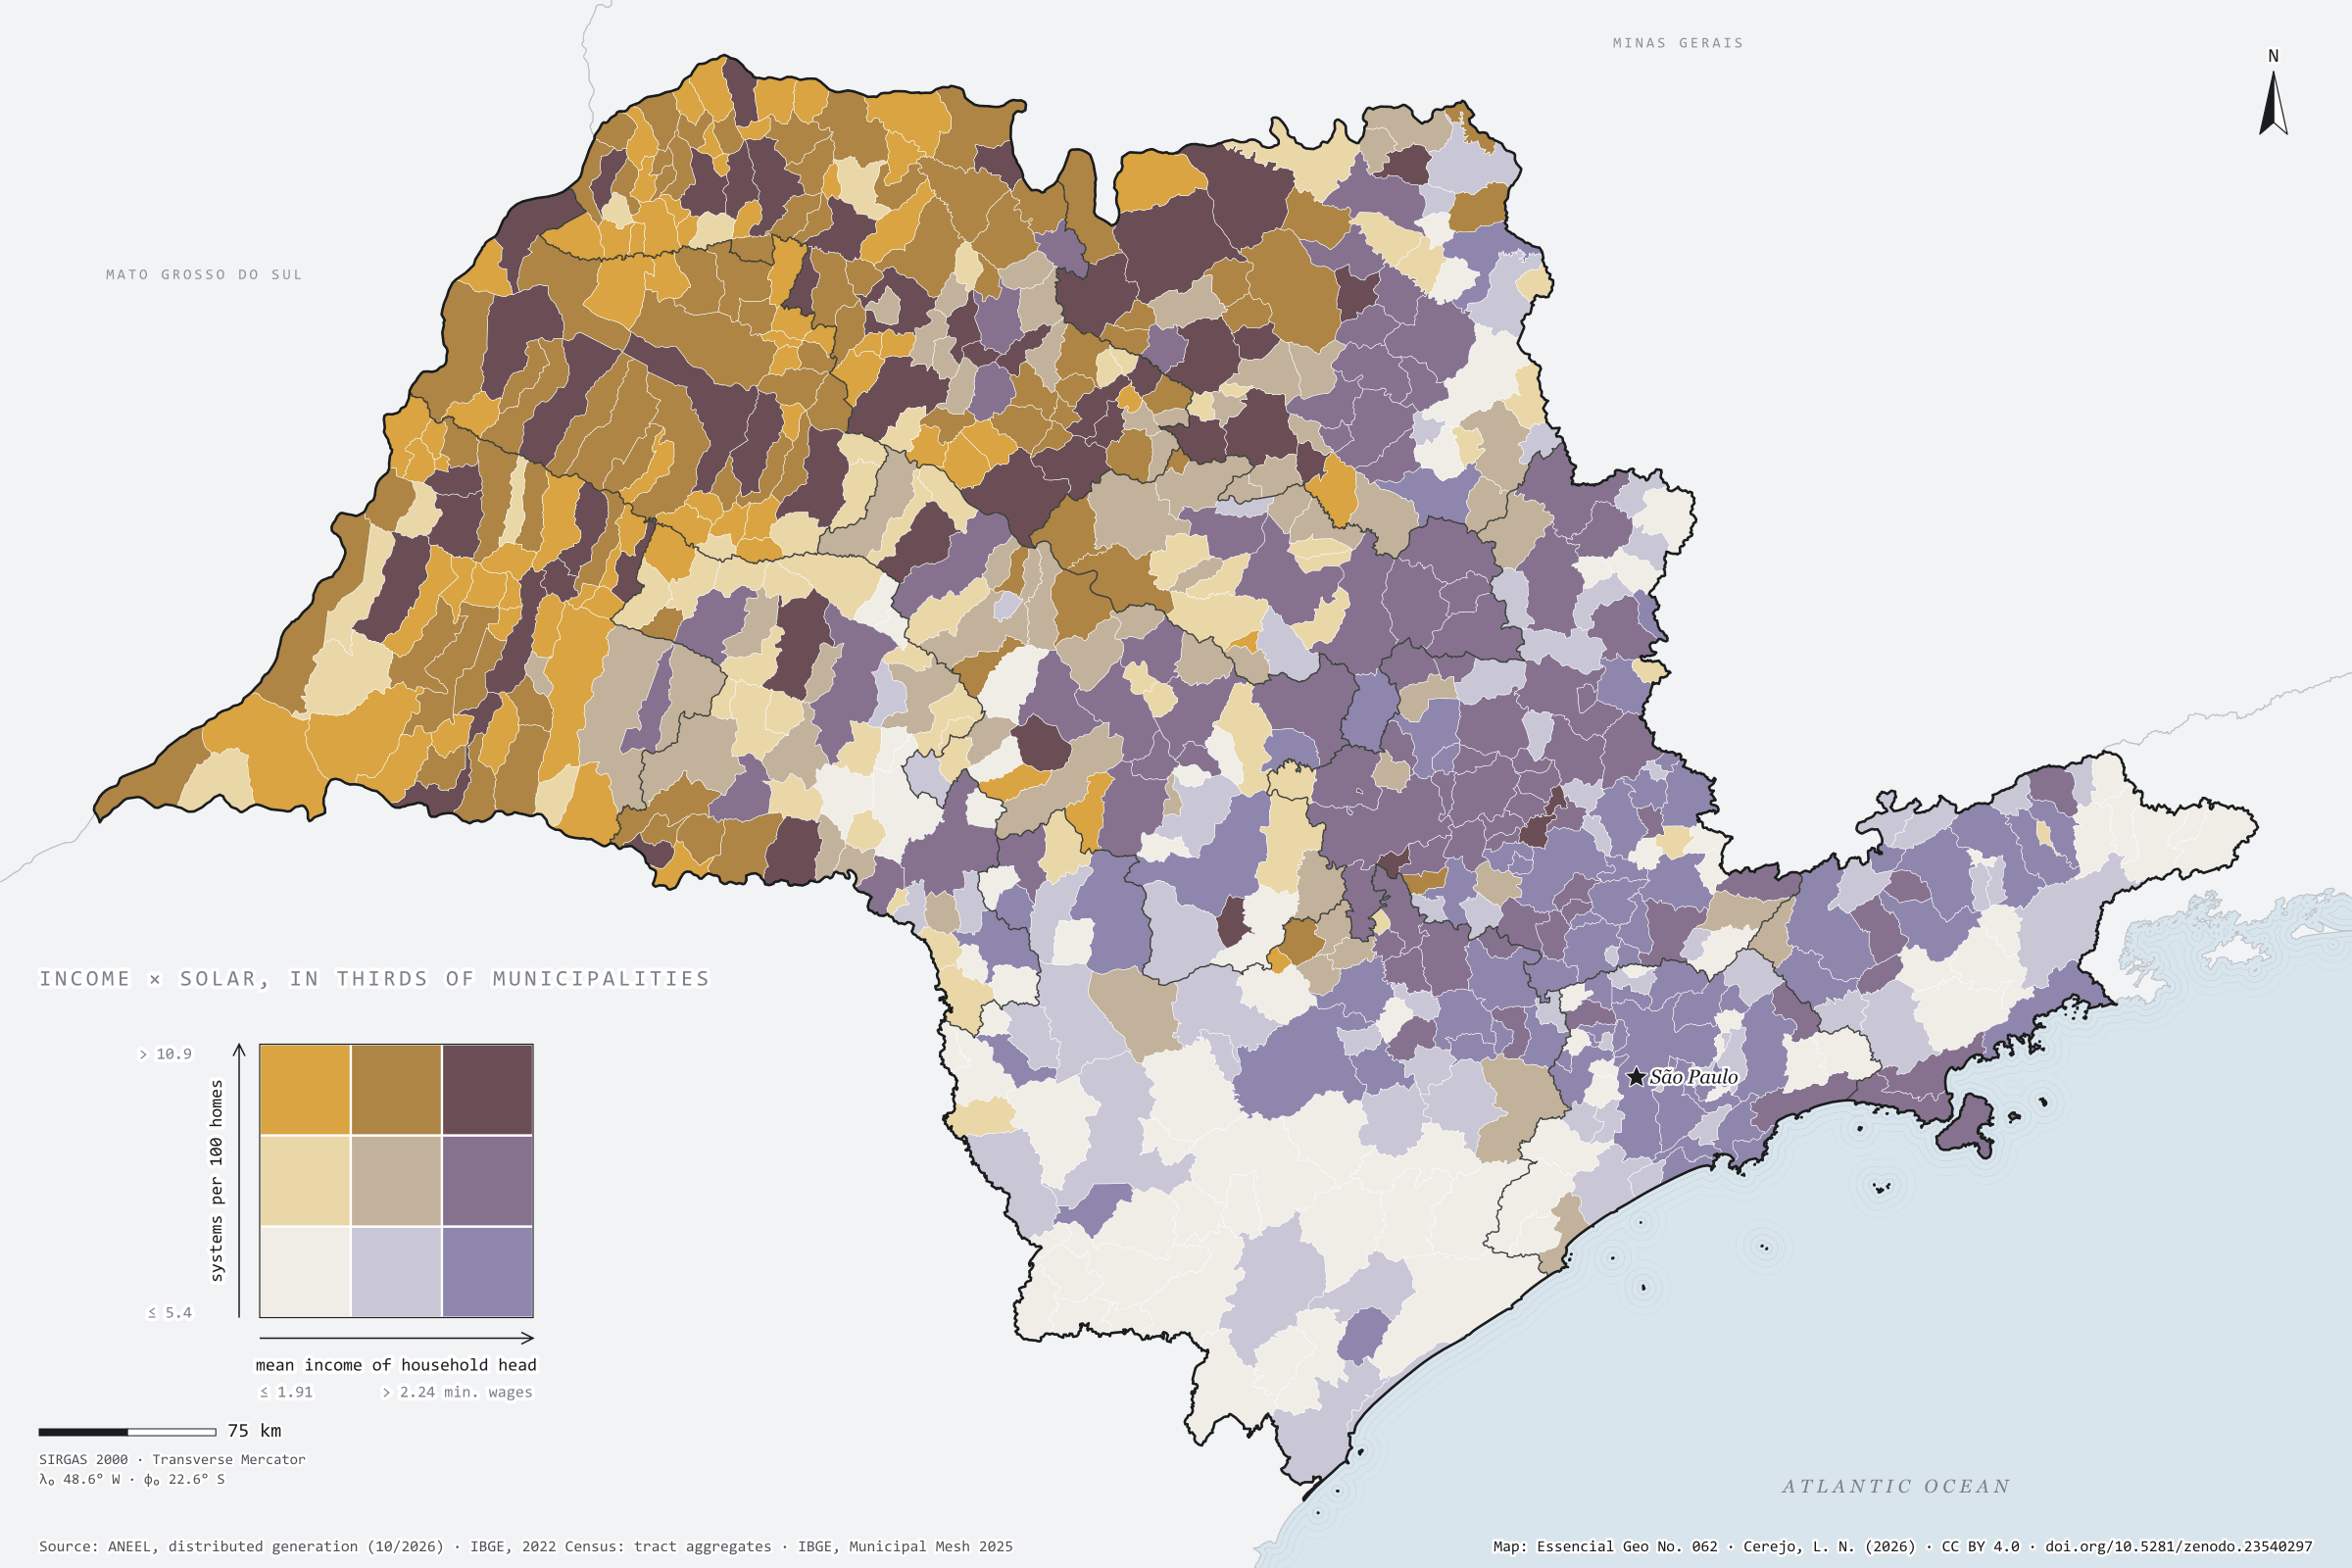
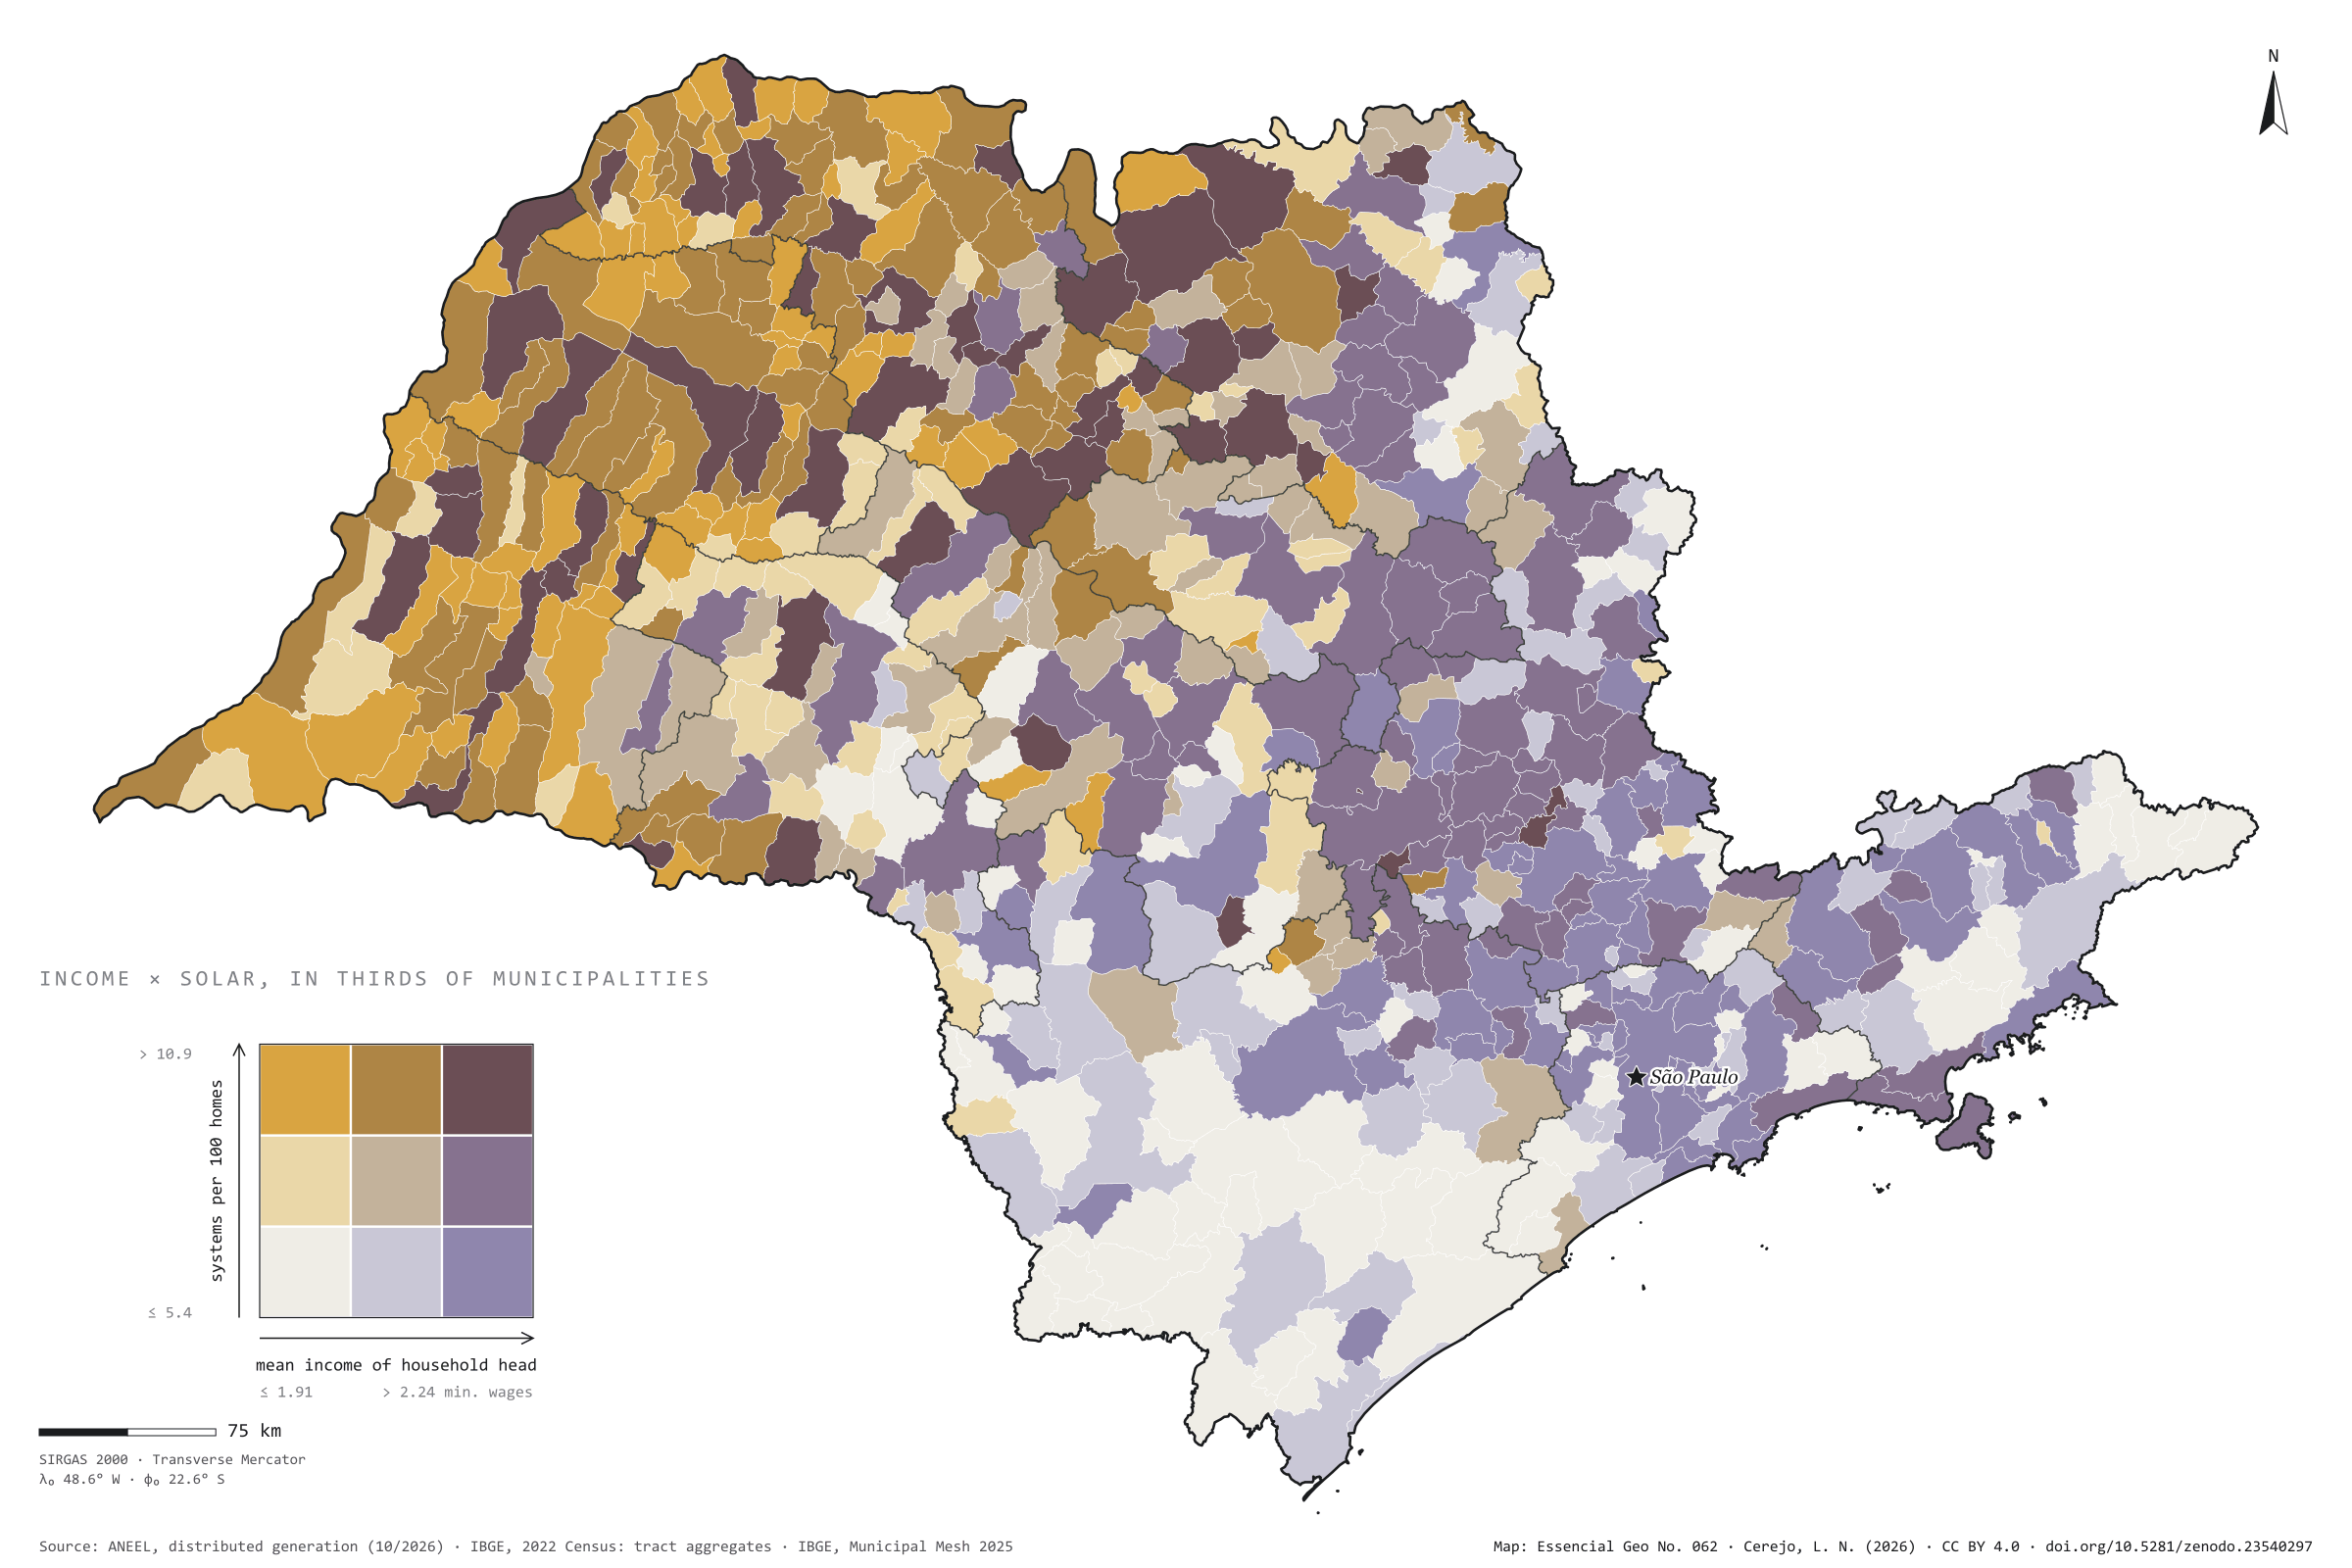
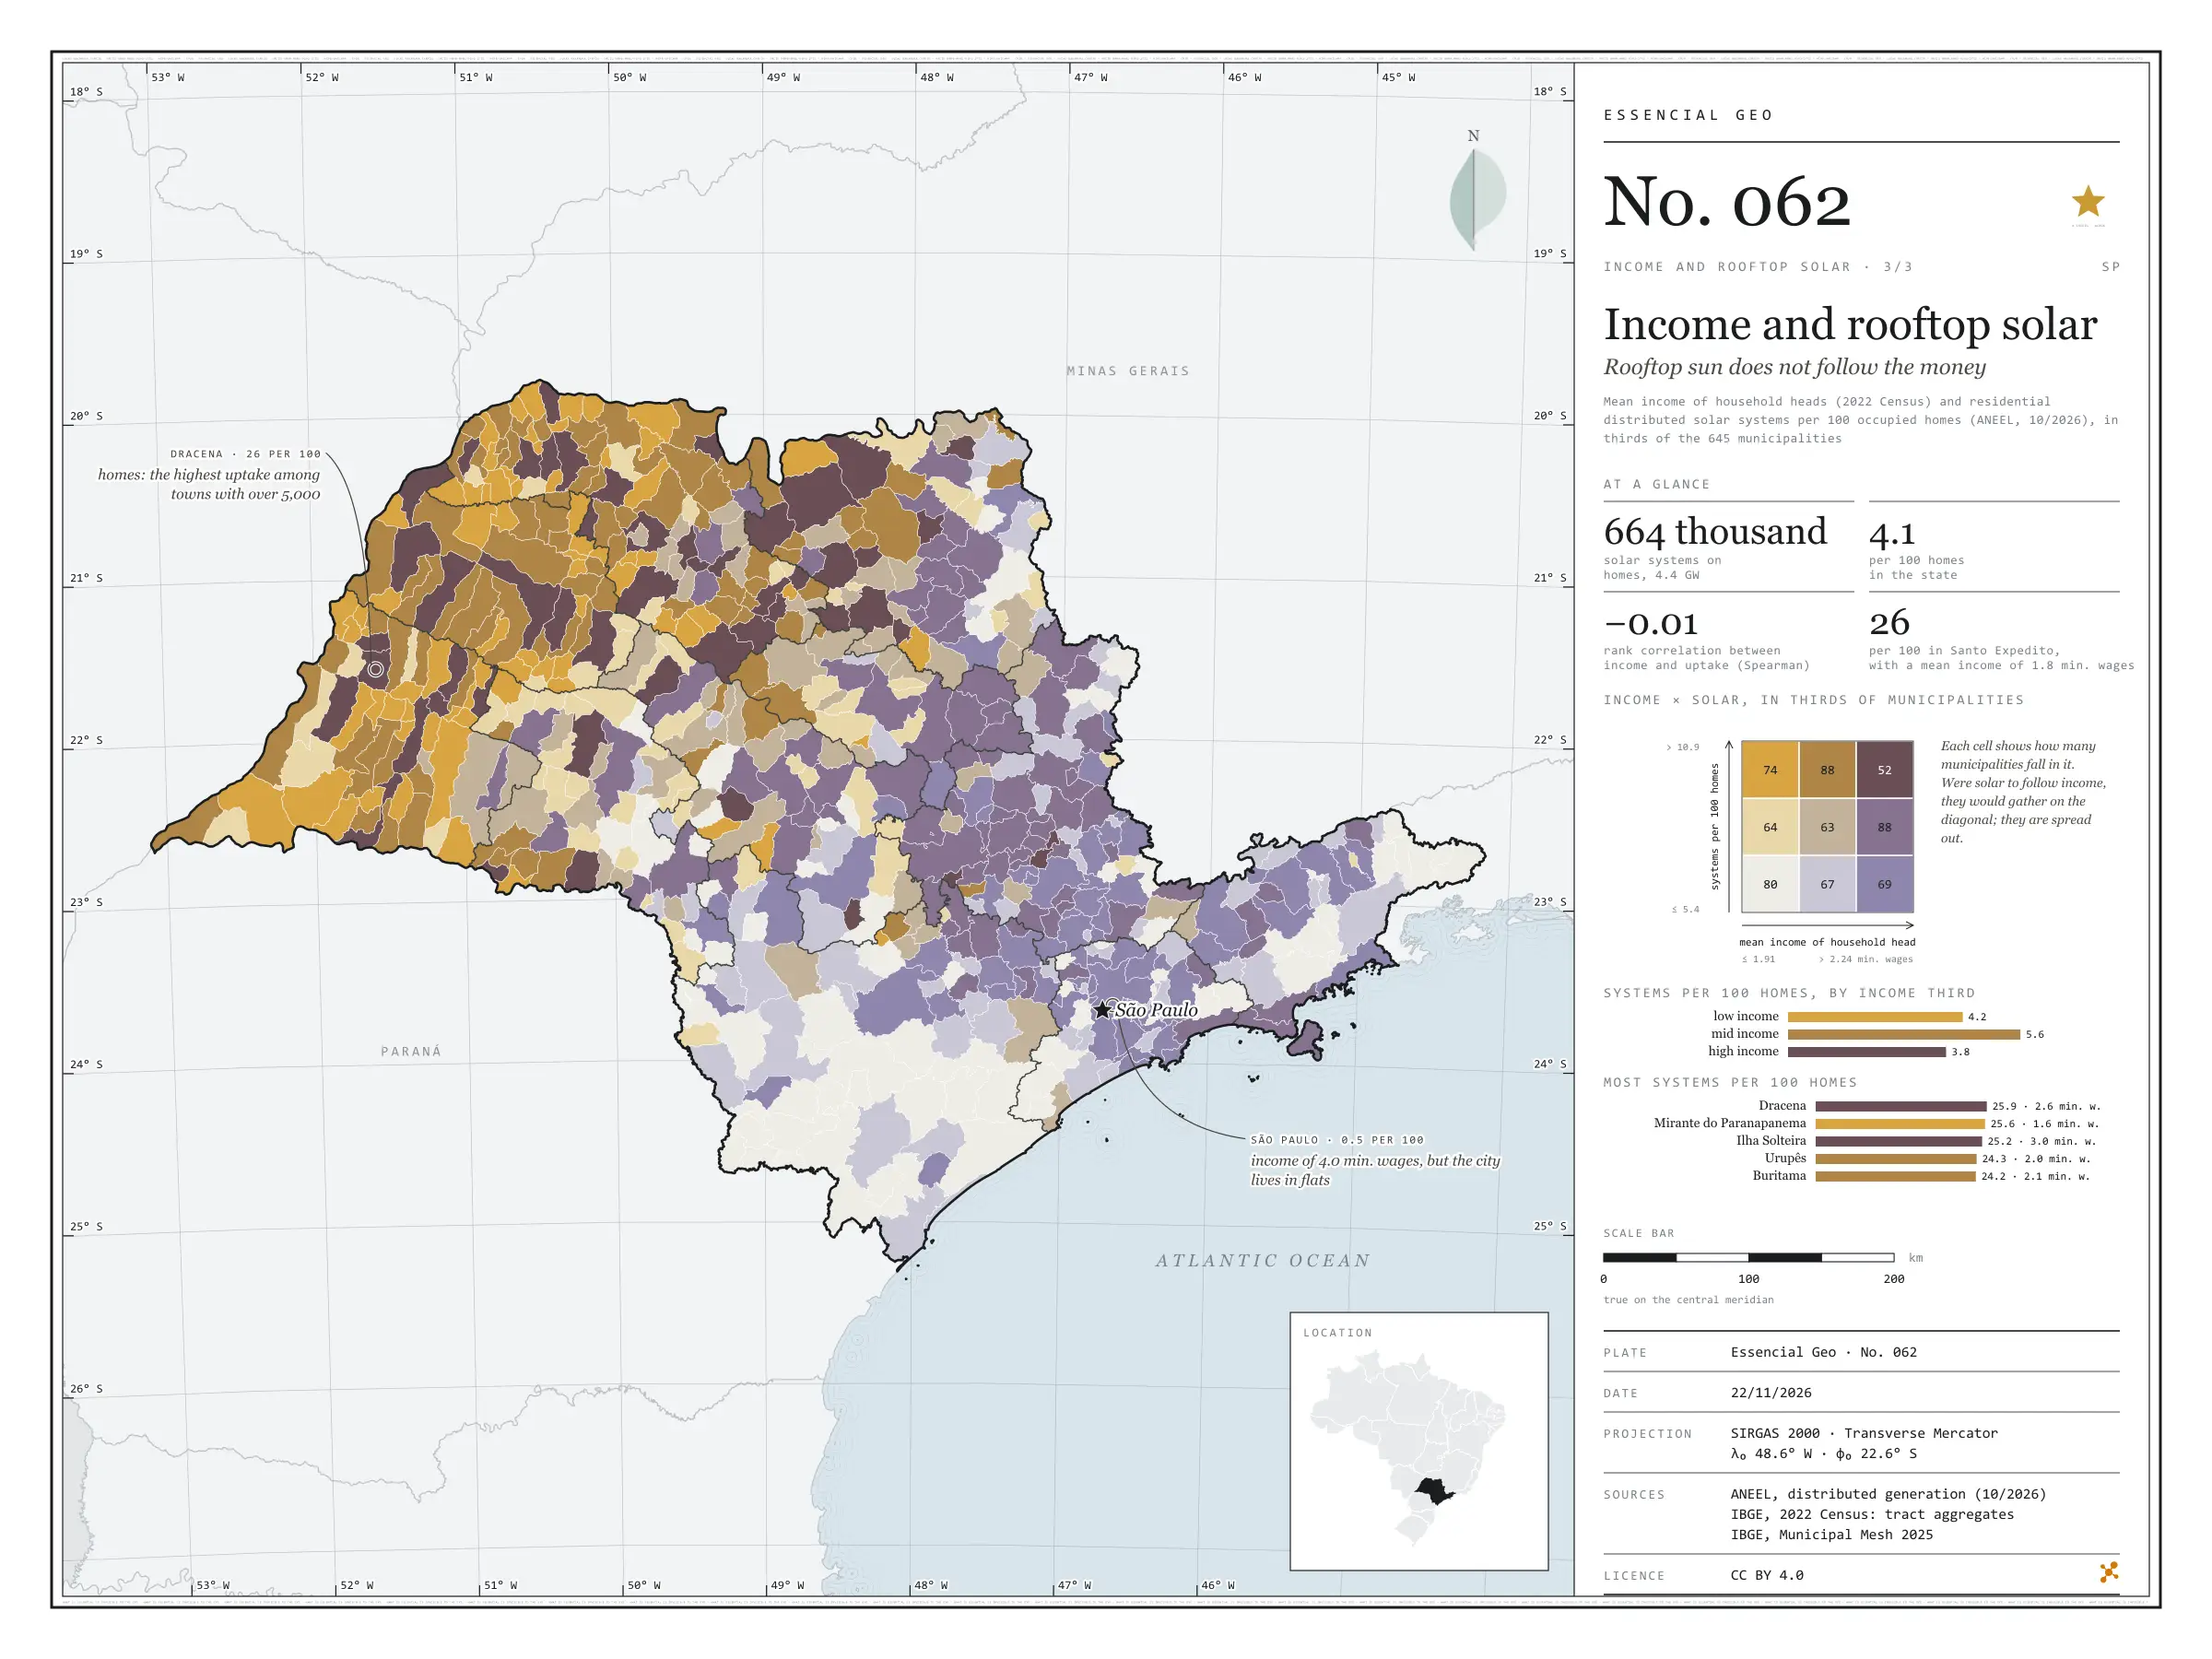
São Paulo has 664,000 residential solar systems registered with ANEEL, with 4.4 GW: 4.1 for every 100 occupied homes. One would expect them in the richest towns. They are not there. Across the 645 municipalities, the rank correlation between household heads’ mean income and systems per home is −0.01, that is, none. In the highest income third there are 3.8 systems per 100 homes; in the lowest, 4.2. The map lights up in ochre and brown in the west and north-west, where Dracena reaches 26 per 100, and so does Santo Expedito, with a mean income of 1.8 minimum wages. The capital, with a mean income of 4 minimum wages and more systems than any other city (22,000), has only 0.5 per 100 homes, like Santos: where people live in flats, there is no roof. Plate 044 shows distributed solar generation across Brazil. Last plate of the collection “Income and rooftop solar”.

Technical record · downloads · citation

At a glance

Residential solar systems by municipal income third (systems)
  • low income 6.9%
  • mid income 17.4%
  • high income 75.7%
Residential solar systems per 100 homes

4.1 systems

664,205 systems and 16.2 million homes

Rank correlation between income and uptake

-0 Spearman’s ρ

Layers

  • municipios polygon 645 municipalities: households, mean income, residential solar systems, kW, systems per 100 homes, W per home, thirds and group
  • regioes_intermediarias polygon 11 intermediate geographic regions
  • limite_estadual polygon State boundary

Metadata

Extent
São Paulo State (SP)
CRS / Projection
SIRGAS 2000 (EPSG:4674)
EPSG:4674
Software
Node.js · d3-geo · QGIS
Method
ANEEL residential distributed photovoltaic systems per 100 occupied permanent private homes of the 2022 Census, and mean income of household heads with income, each in thirds of the 645 municipalities, crossed in a nine-class bivariate map; Spearman rank correlation.
Version
v1.0.0
Licence
CC BY 4.0

Downloads

Figure to reuse

The map without a frame, with legend, scale, reference system and credit written on it: ready for papers, lectures and slides. In two versions: with the basemap (neighbours and sea) or only the mapped area, on white.

Point a camera at it to open this page.

How to cite

Cerejo, L. N. (2026). Renda e telhado solar: o sol dos telhados não segue o dinheiro [Income and rooftop solar: Rooftop sun does not follow the money] (Version 1.0.0) [Data set]. Zenodo. https://doi.org/10.5281/zenodo.23540297

Technical record

Technical record · No. 060

What the head of household earns

At a glance

Household heads by tract median (household heads)
  • up to 1 min. wage 6.7%
  • 1 to 1.5 min. wages 26.6%
  • 1.5 to 2 min. wages 28.3%
  • 2 to 3 min. wages 21.1%
  • 3 to 5 min. wages 10.7%
  • over 5 min. wages 6.7%
Household heads in tracts of up to 1.5 minimum wages

33 %

5.40 million of 16.2 million

Tracts with a median of exactly one minimum wage

4,904 tracts

Layers

  • setores polygon 103,319 tracts: household heads, mean and median income in reais and in minimum wages, class
  • regioes_intermediarias polygon 11 intermediate geographic regions
  • limite_estadual polygon State boundary

Metadata

Extent
São Paulo State (SP)
CRS / Projection
SIRGAS 2000 (EPSG:4674)
EPSG:4674
Software
Node.js · d3-geo · QGIS
Method
Median monthly nominal income of household heads with income, by 2022 Census tract, in six classes measured in 2022 minimum wages (R$ 1,212); tracts with confidential values are left as no data.
Version
v1.0.0
Licence
CC BY 4.0

Downloads

Figure to reuse

The map without a frame, with legend, scale, reference system and credit written on it: ready for papers, lectures and slides. In two versions: with the basemap (neighbours and sea) or only the mapped area, on white.

Point a camera at it to open this page.

How to cite

Cerejo, L. N. (2026). Quanto ganha quem responde pela casa: o salário mínimo é a régua de um terço do estado [What the head of household earns: The minimum wage is the yardstick for a third of the state] (Version 1.0.0) [Data set]. Zenodo. https://doi.org/10.5281/zenodo.23540197

Data and plates under CC BY 4.0: use them in commercial drawings and papers, citing the source.

100%