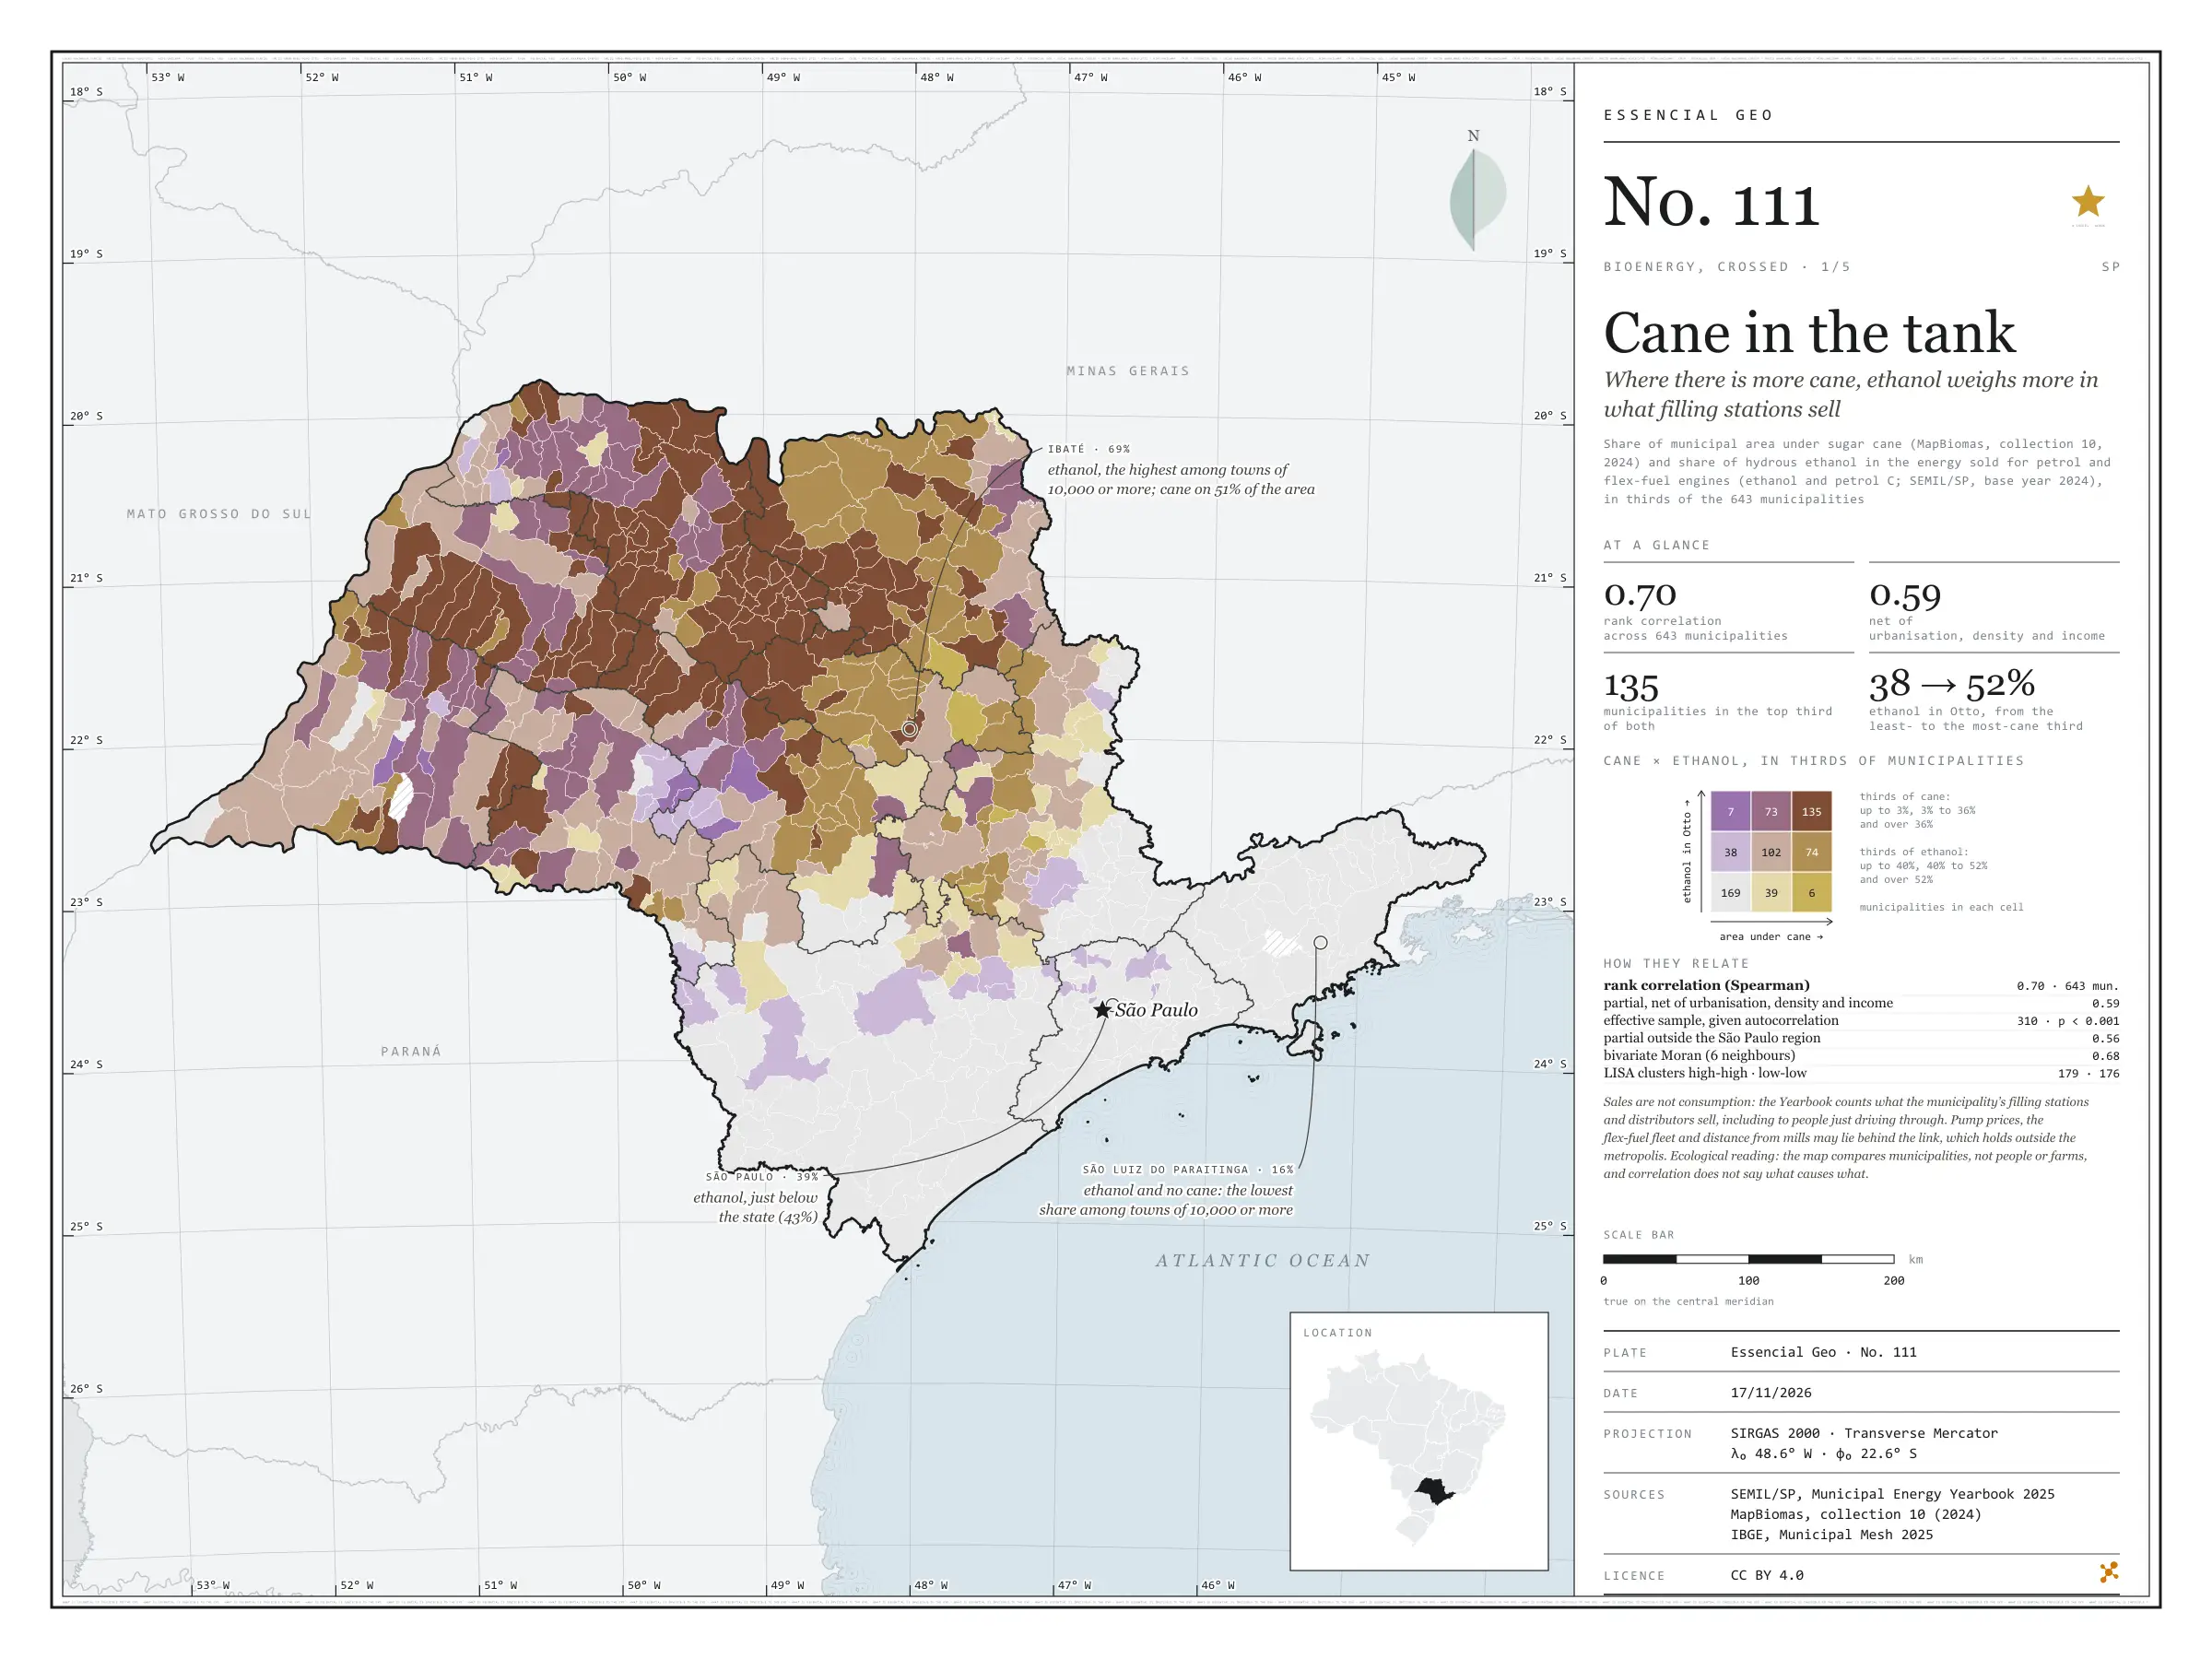
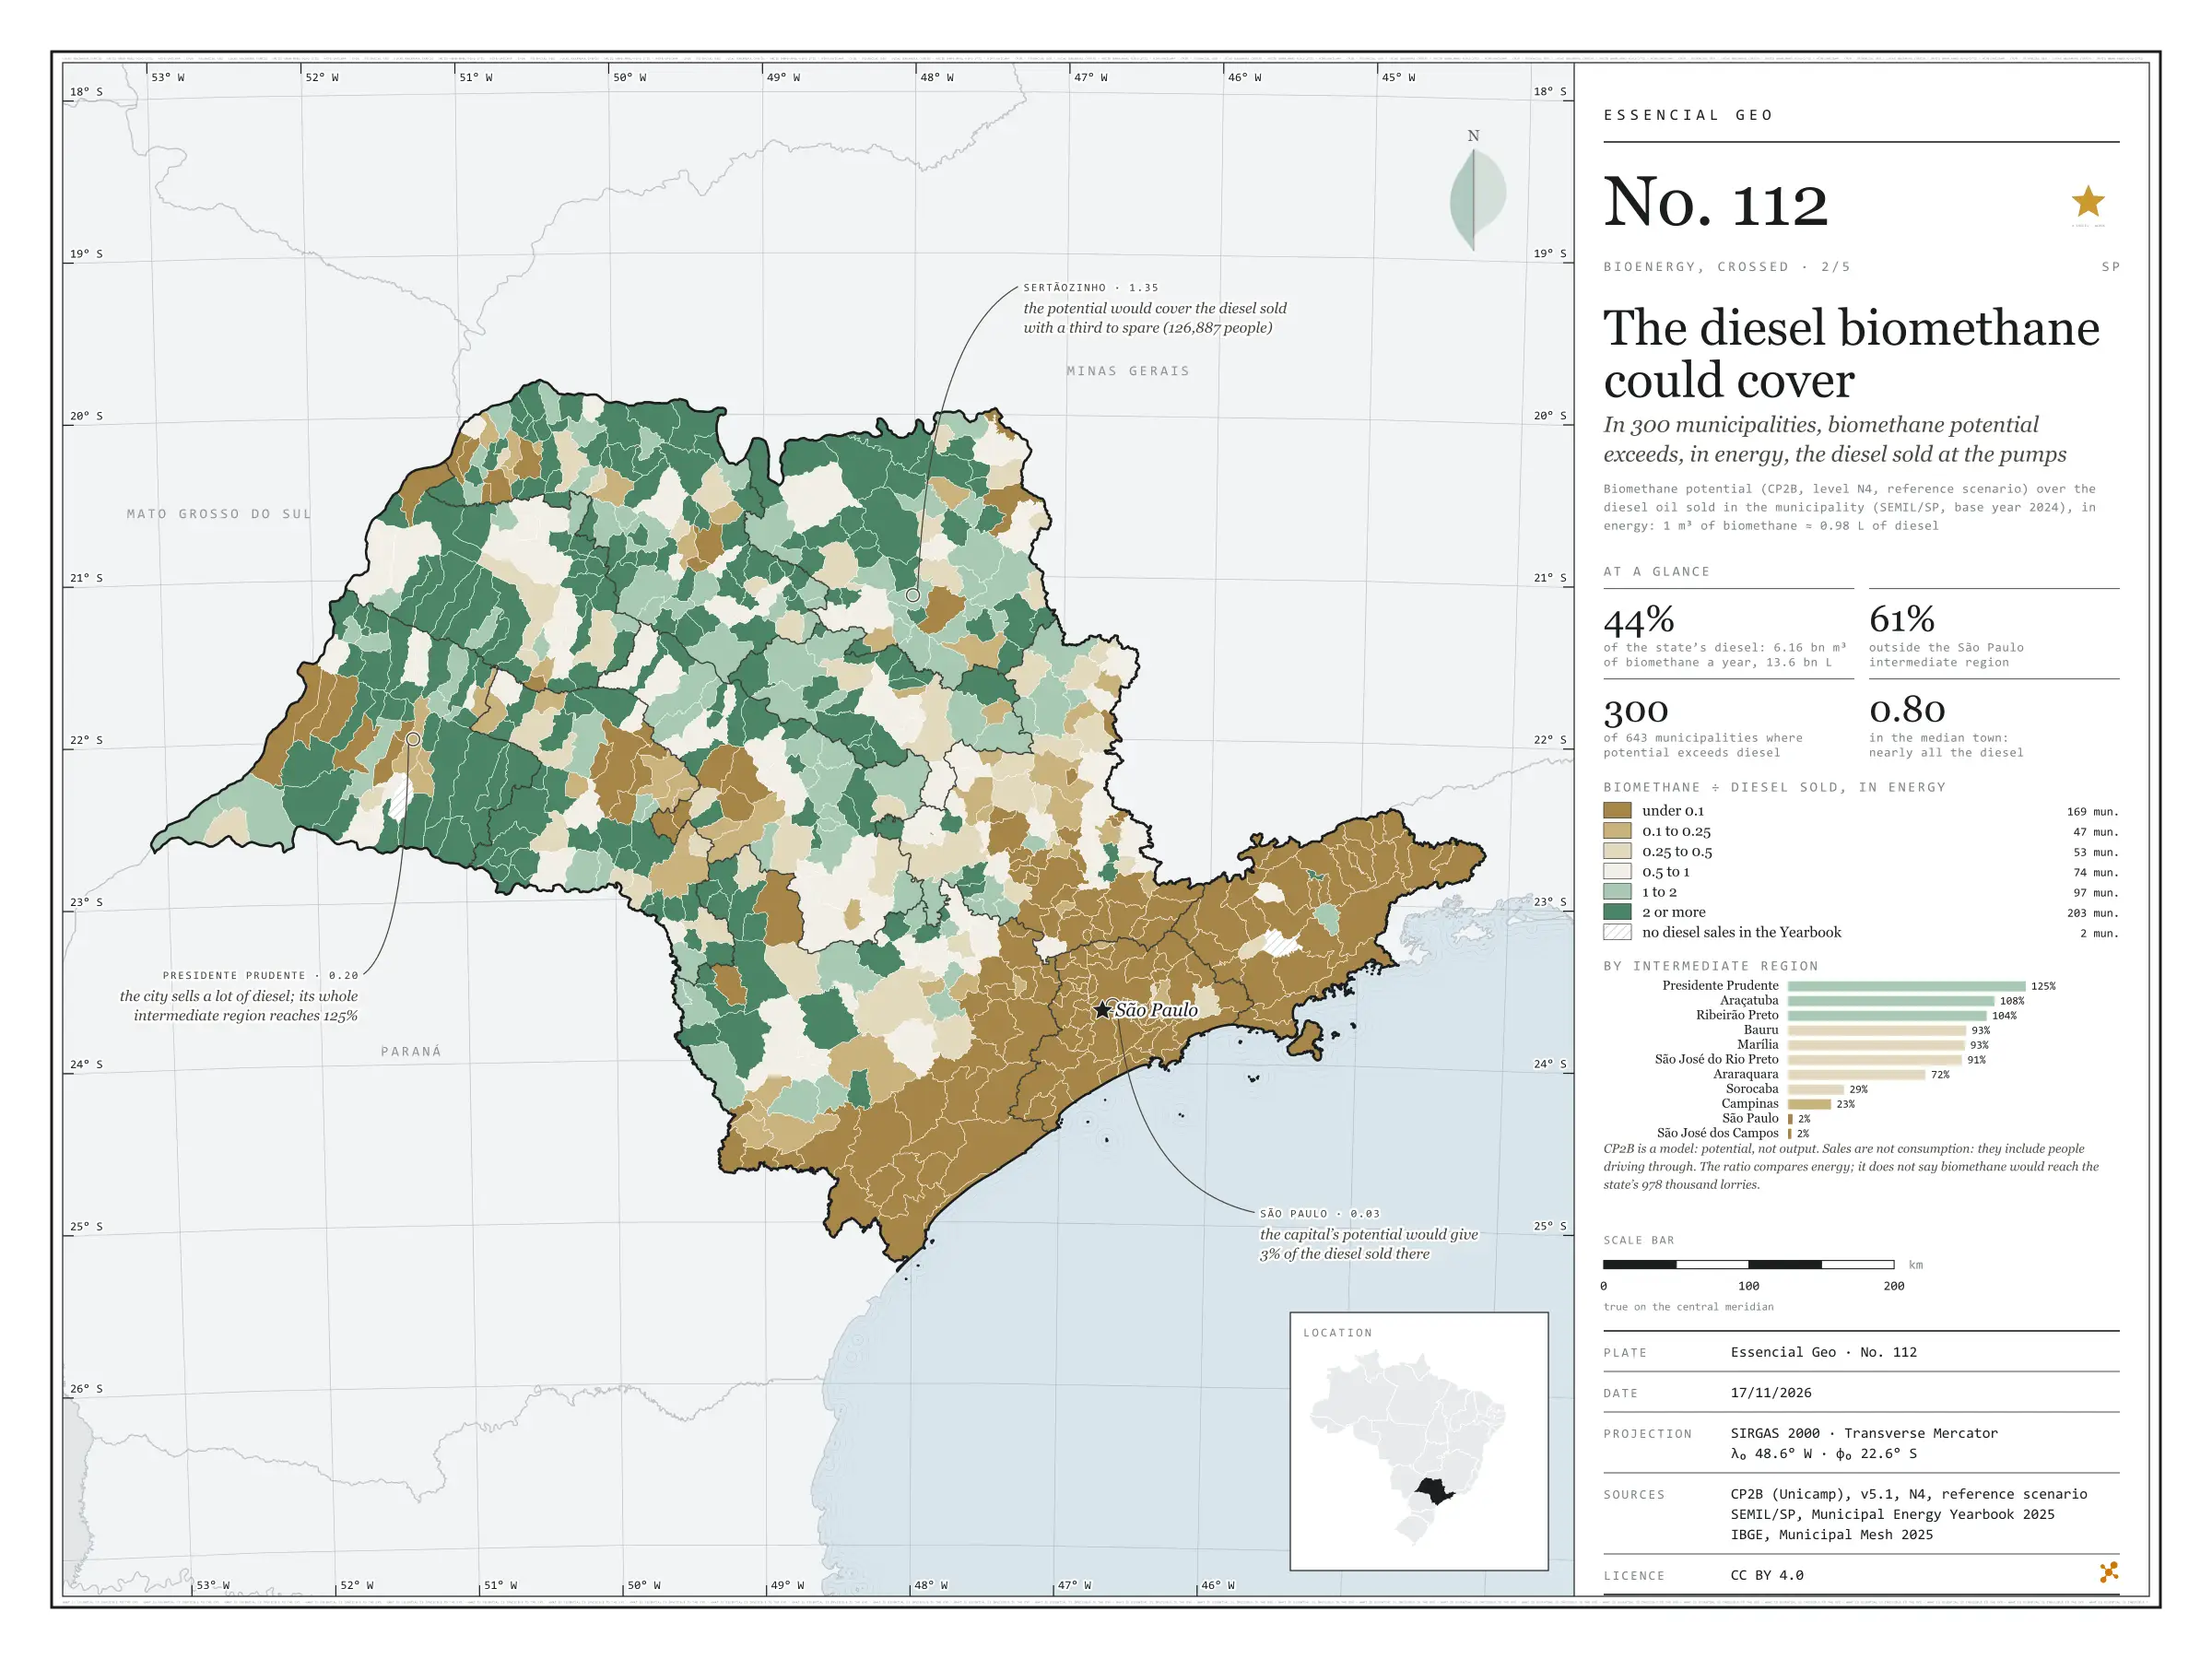
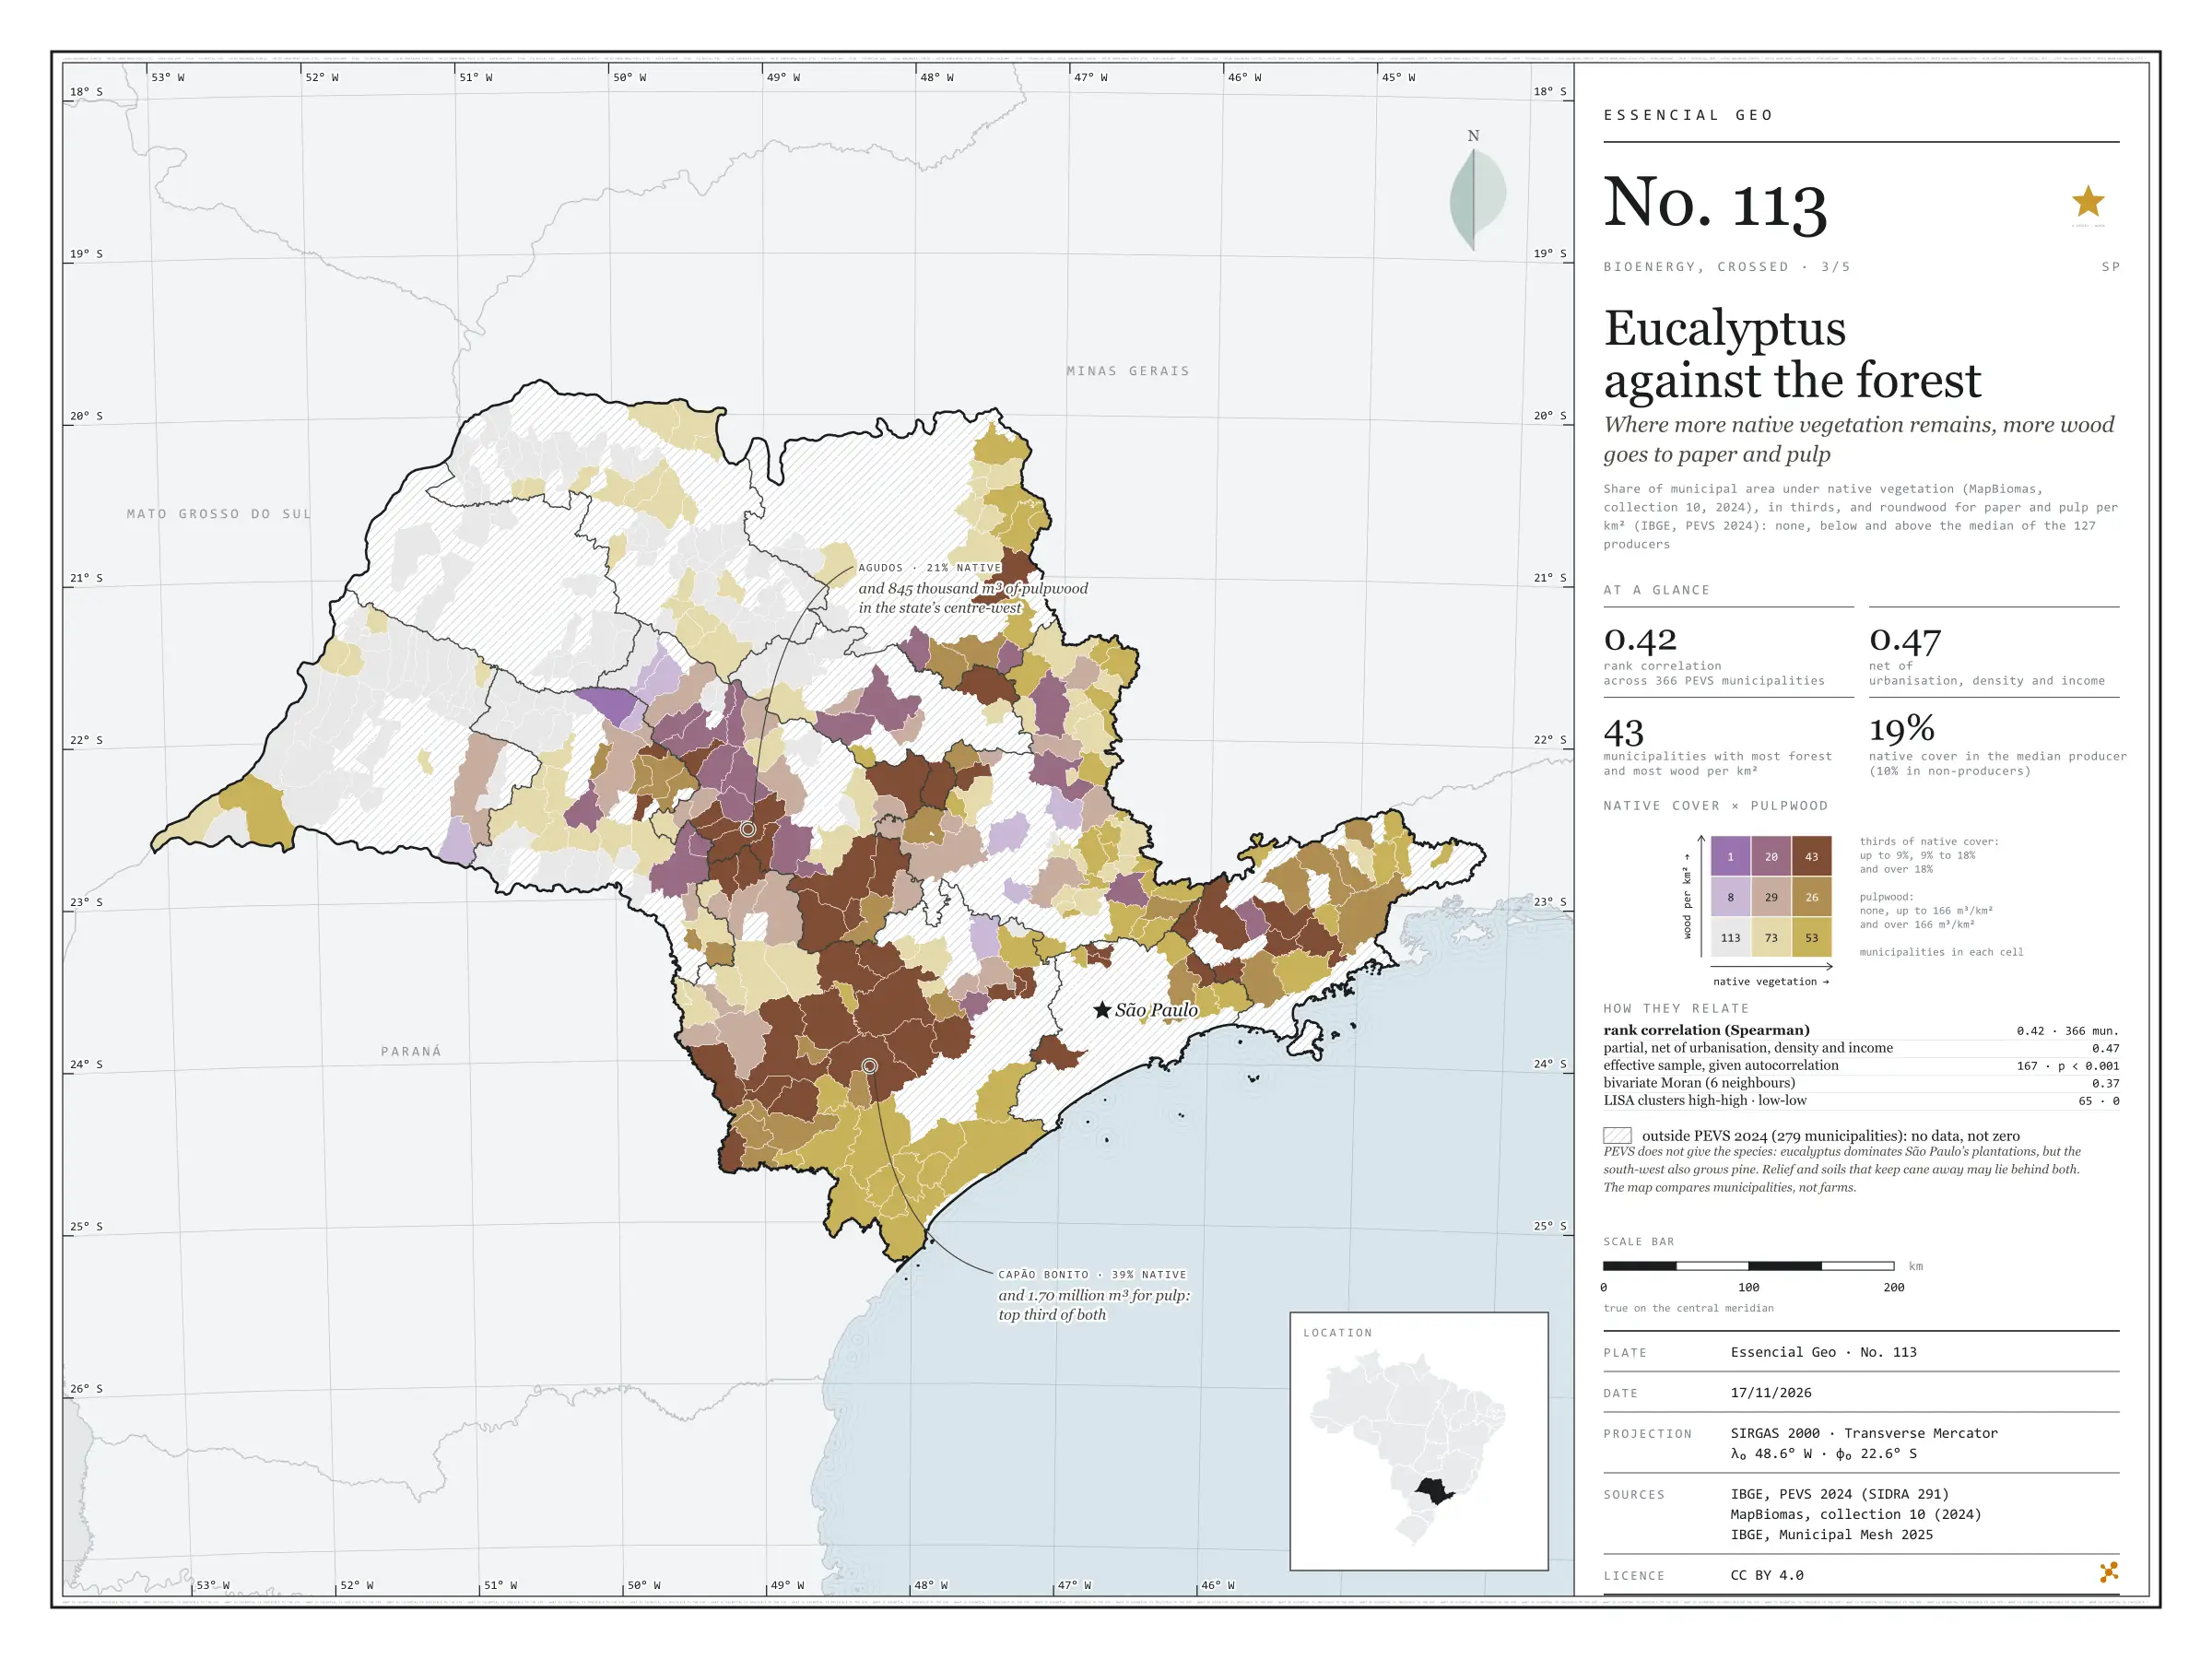
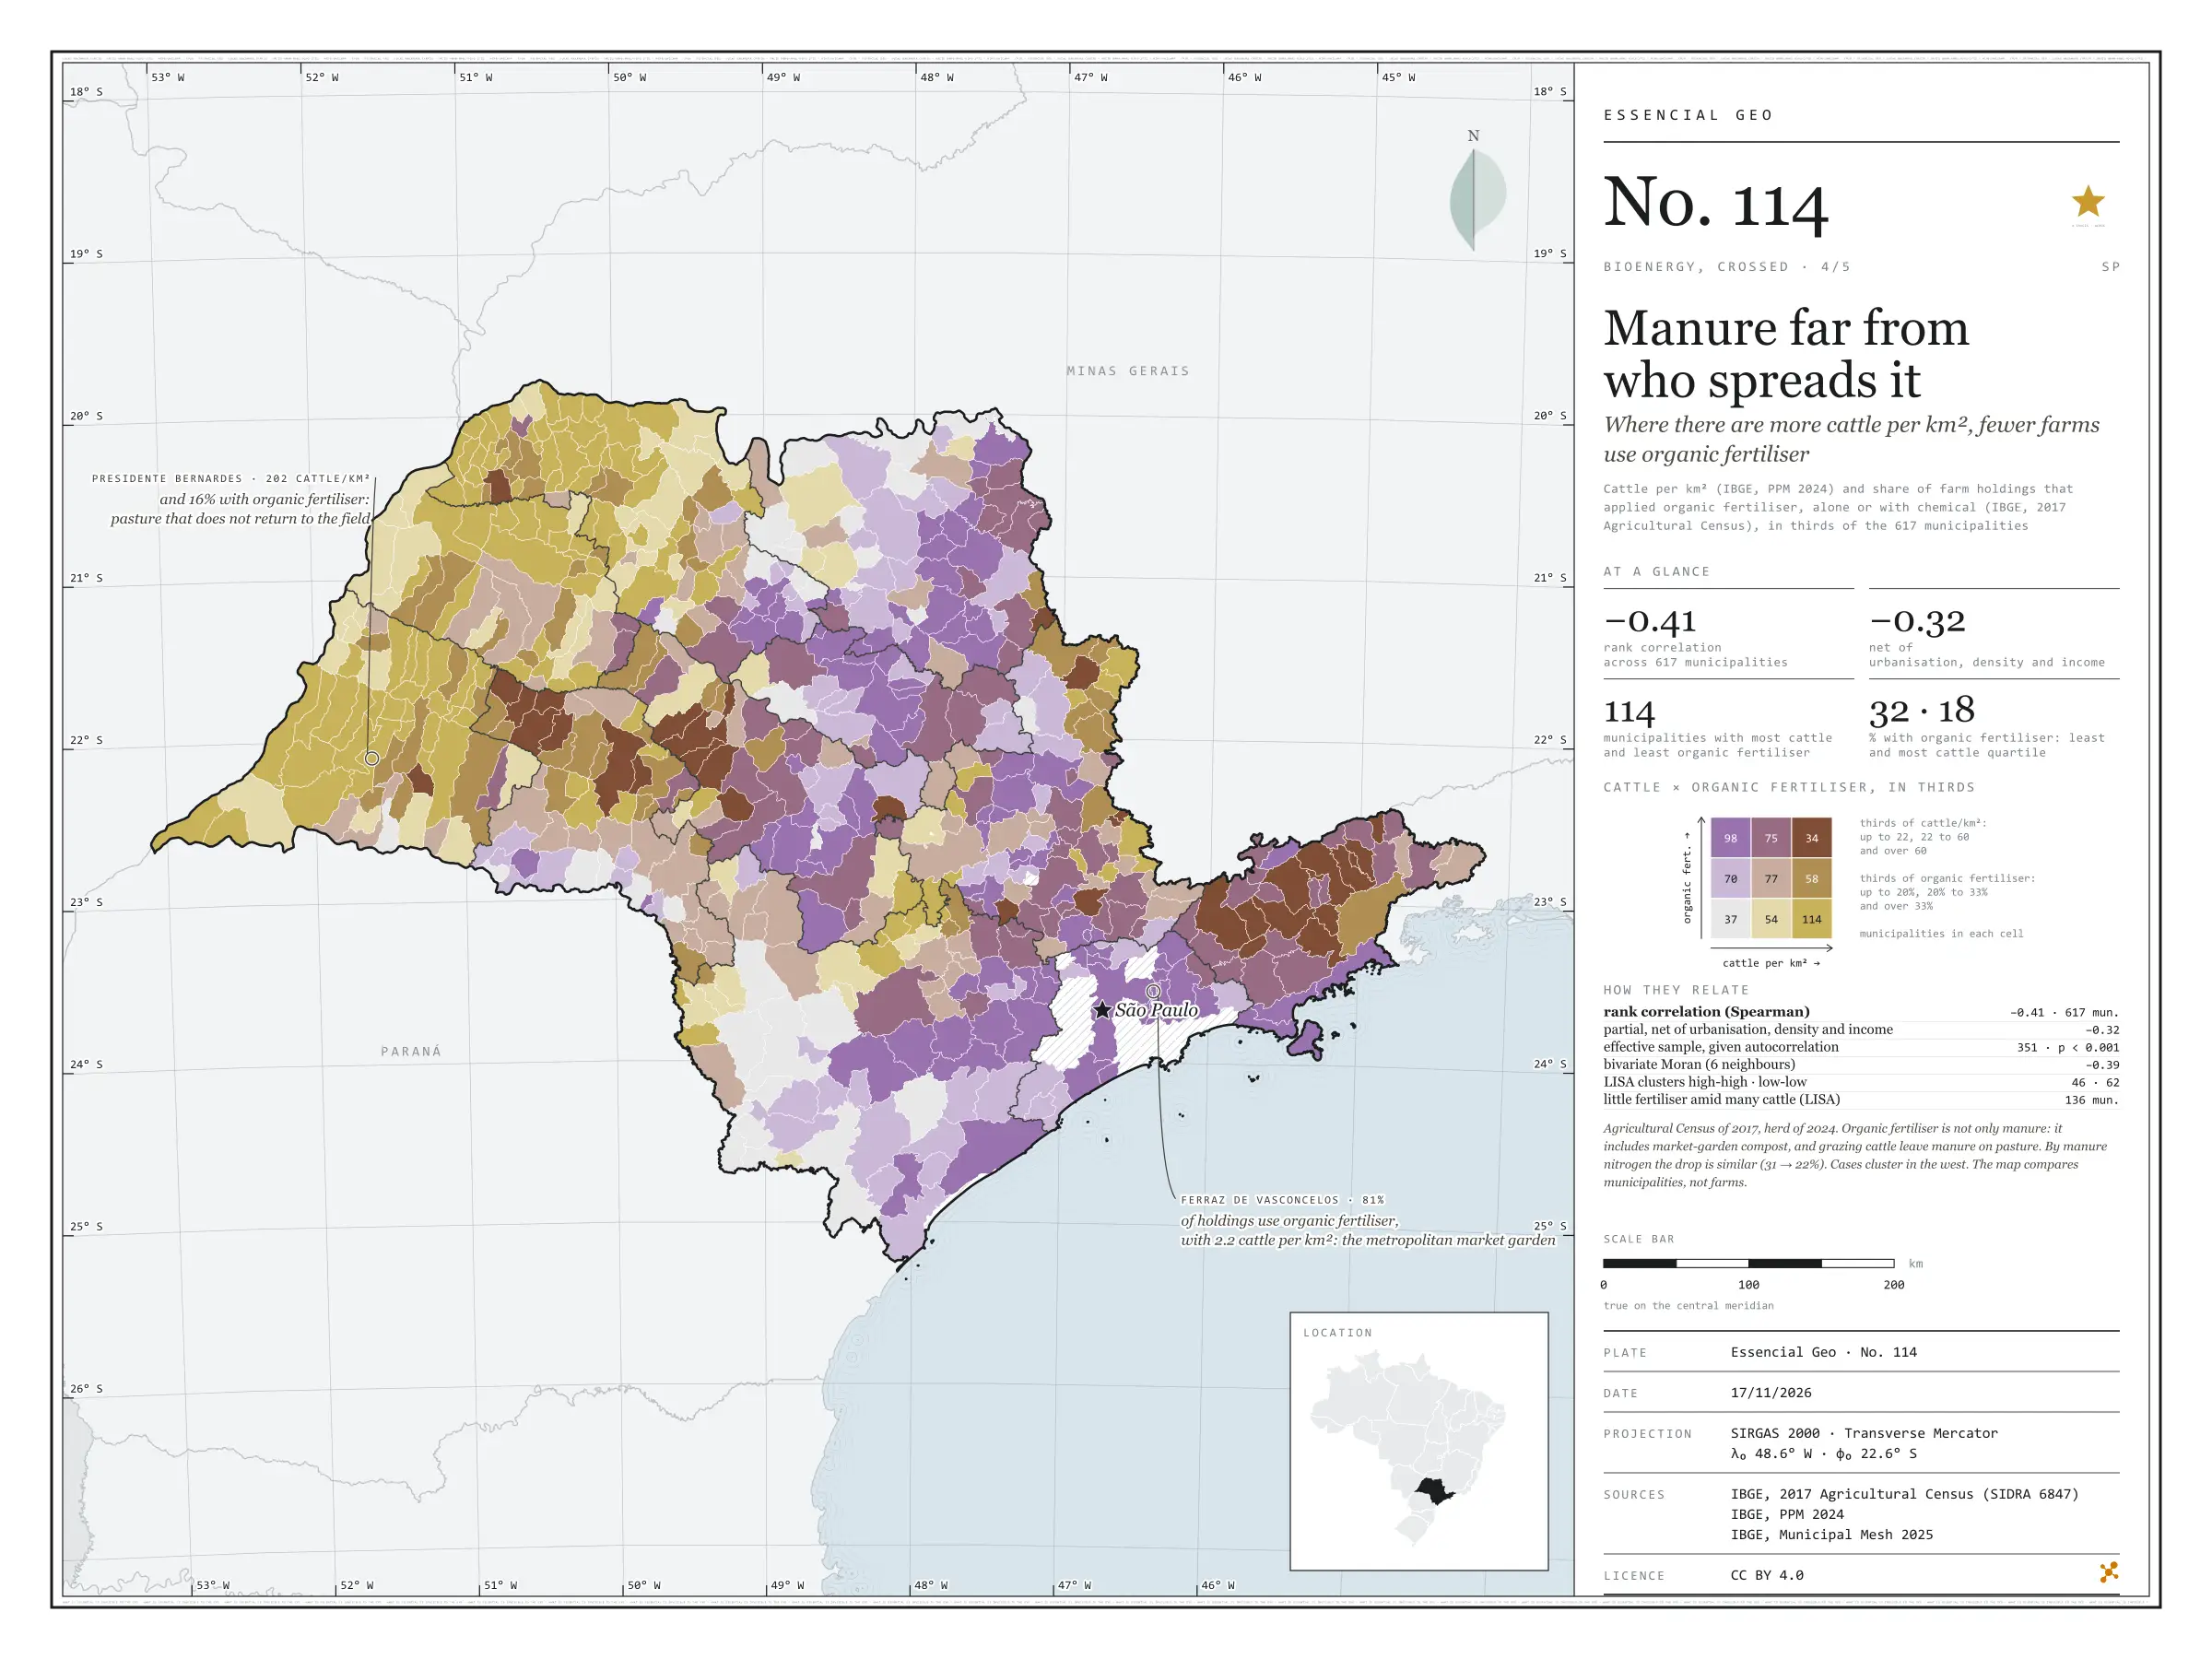
Cane in the tank
Where there is more cane, ethanol weighs more in what filling stations sell
In São Paulo municipalities with more cane, ethanol weighs more in the fuel sold for petrol and flex-fuel engines. In energy, hydrous ethanol was 43% of Otto-cycle sales statewide in 2024; in the third of municipalities with least cane, 38%; in the third with most, 52%. The rank correlation is 0.70 and stays at 0.59 net of urbanisation, density and income. In Ibaté, with cane on 51% of its area, ethanol reaches 69%; in São Luiz do Paraitinga, with no cane, it is 16%. Sales are not consumption, and prices, the fleet and distance from mills may lie behind it. First plate of the collection “Bioenergy, crossed”.
Technical record · downloads · citation
At a glance
0.7
52 %
135 municipalities
Layers
- municipios polygon 645 municipalities with the variables of all five plates, the bivariate classes and the LISA clusters (same GPKG as plates 111 to 115)
- gasodutos line Gas transmission pipelines and distribution network (EPE)
- regioes_intermediarias polygon 11 intermediate geographic regions
- limite_estadual polygon State boundary
Metadata
- Sources
- SEMIL/SP, Municipal Energy Yearbook 2025 (base year 2024): sales of hydrous ethanol, petrol C, diesel oil and piped natural gas by municipality (2025)
MapBiomas — Land cover and land use Collection 10 (2024) (2024)
IBGE — 2022 Population Census (population, urbanisation and income by municipality) (2022)
IBGE — Municipal Mesh 2025 (2025) - Extent
- São Paulo State (SP)
- CRS / Projection
- SIRGAS 2000 (EPSG:4674)
EPSG:4674 - Software
- Node.js · d3-geo · QGIS
- Method
- Share of municipal area under sugar cane (MapBiomas, collection 10, 2024) and hydrous ethanol’s share of the energy sold in the Otto cycle (ethanol and petrol C, SEMIL/SP, base year 2024), each in thirds of municipalities, crossed in a 3 × 3 bivariate map; Spearman rank correlations, raw and partial, and bivariate LISA.
- Version
- v1.0.0
- Licence
- CC BY 4.0
- DOI
- being registered on Zenodo
Downloads
- GPKG Municipalities and pipelines with the variables of all five plates, SIRGAS 2000, with QGIS styles (.gpkg) 4.7 MB
- CSV Municipal table (the same on all five plates) (.csv) 120 kB
- SVG Vector plate, for printing (.svg) 2.2 MB
- PNG Plate (PNG, 2400 px) (.png) 0.3 MB

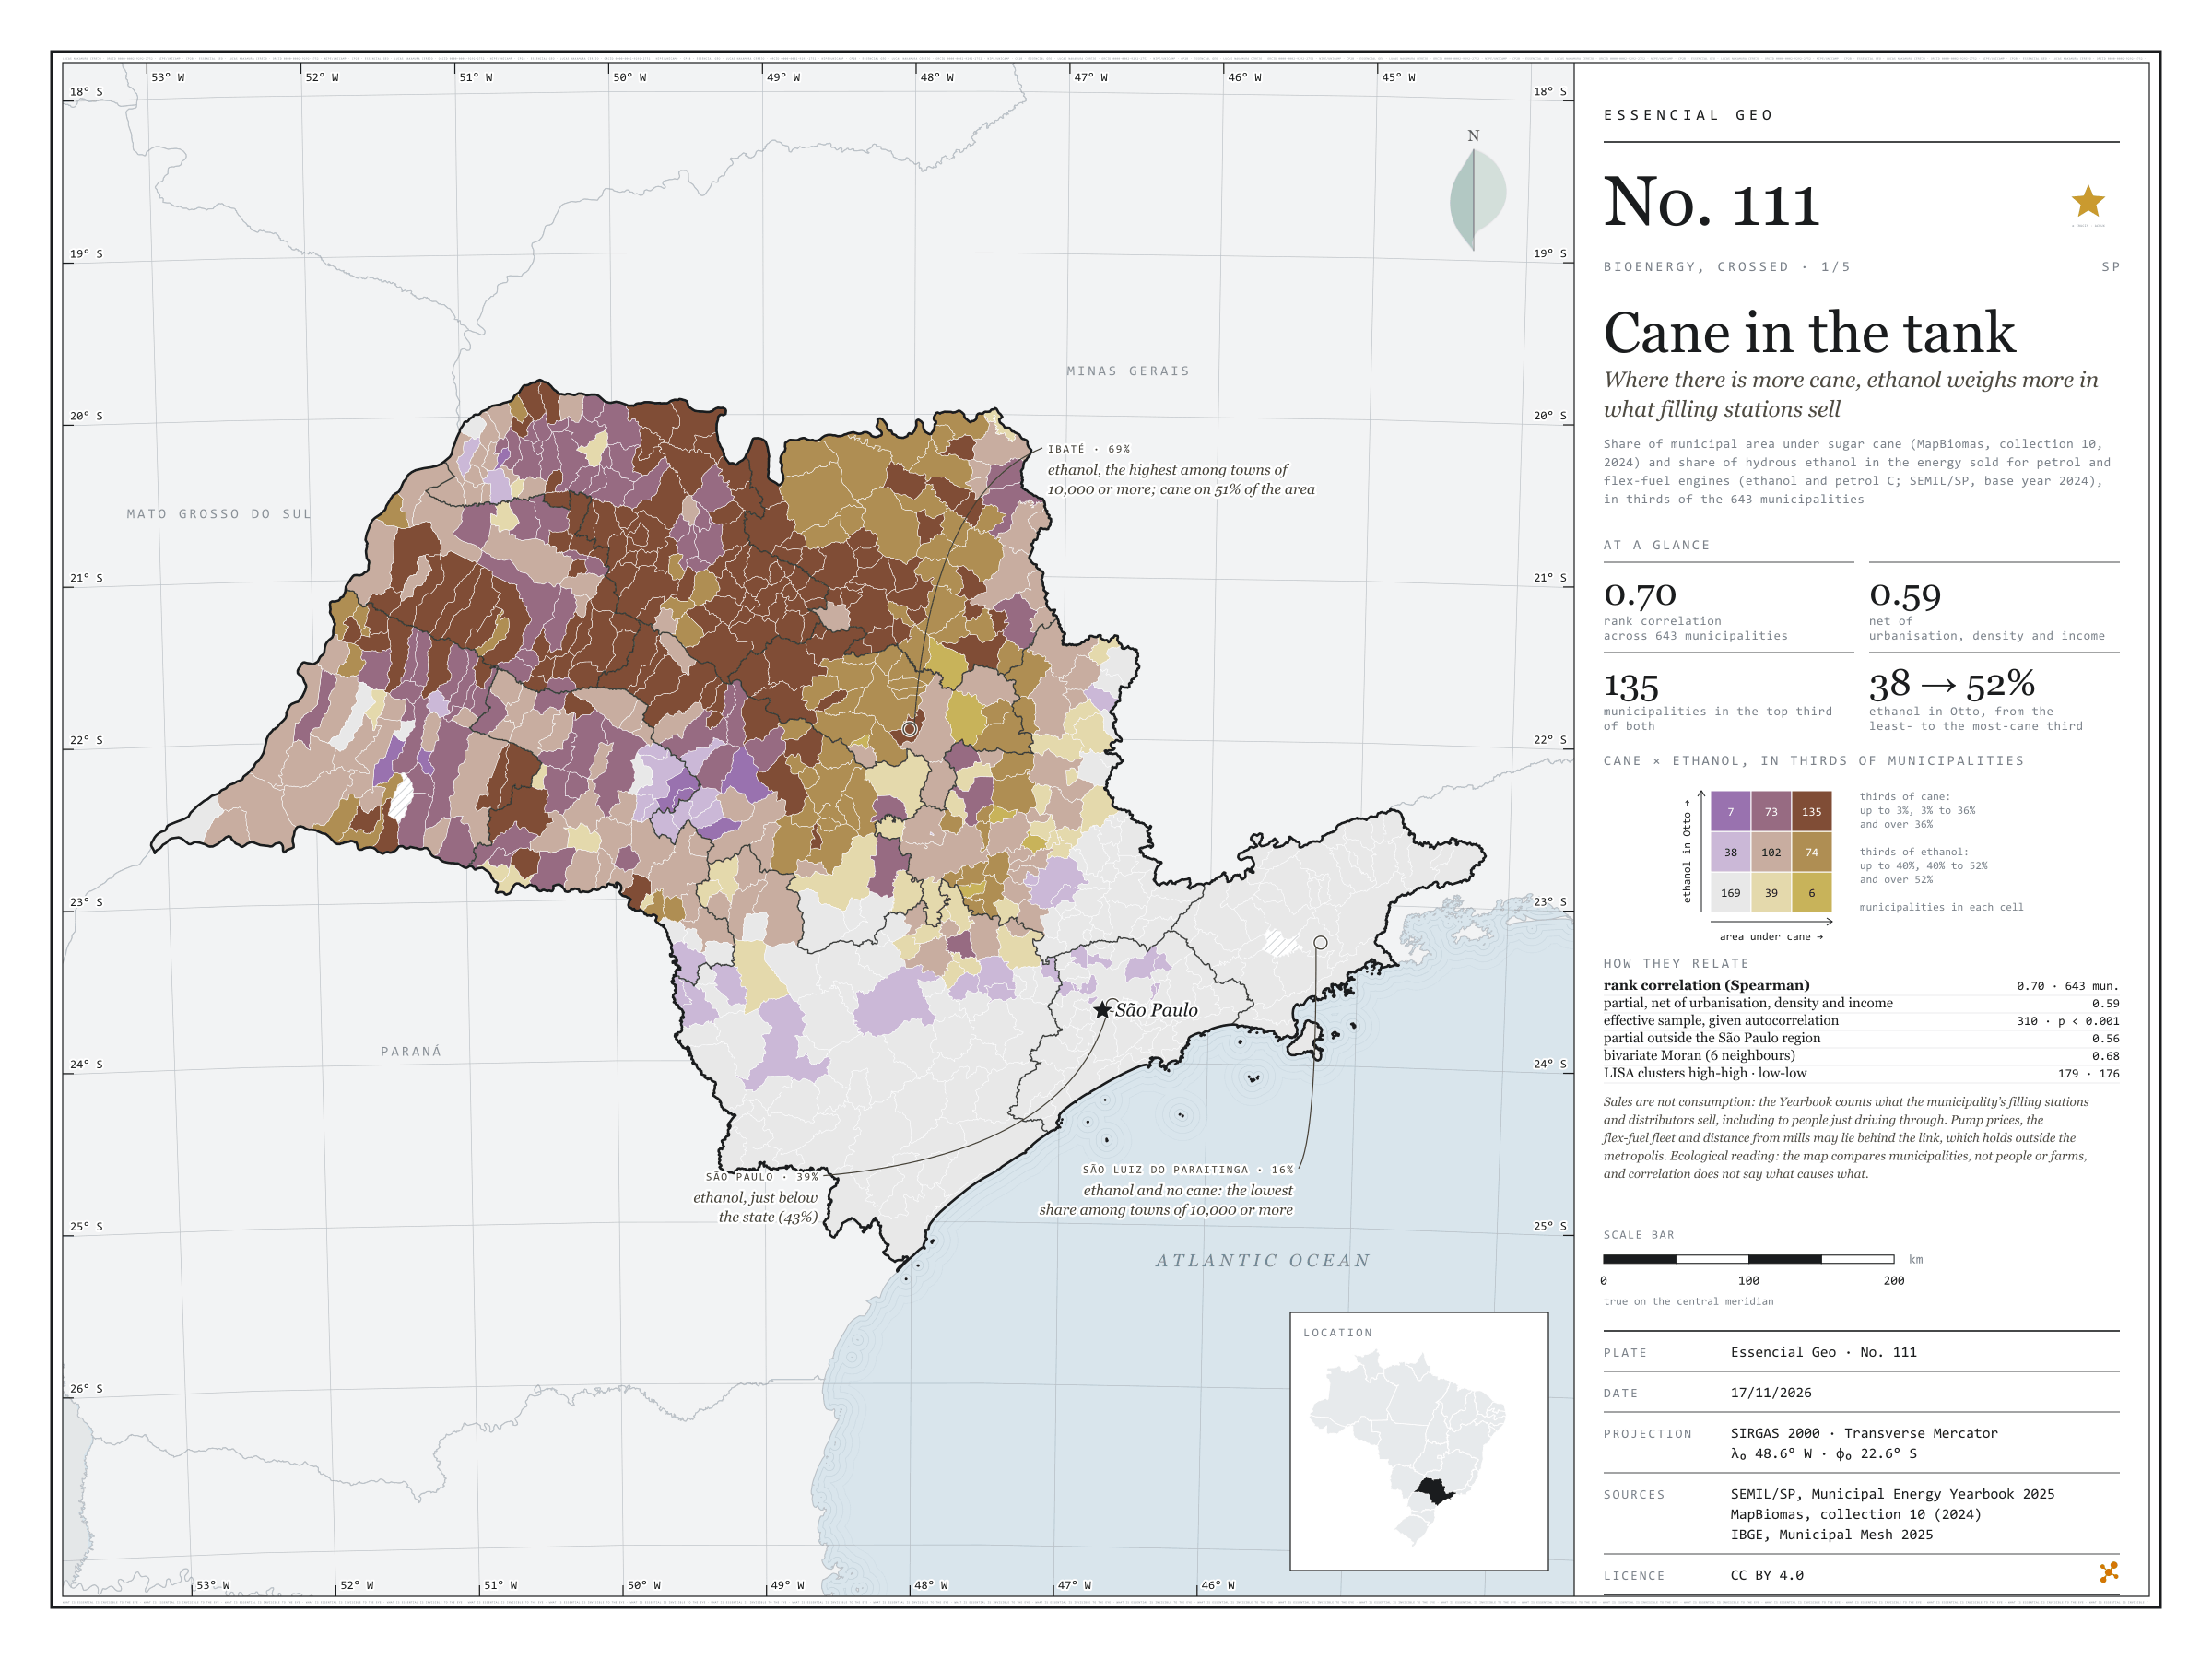
Figure to reuse
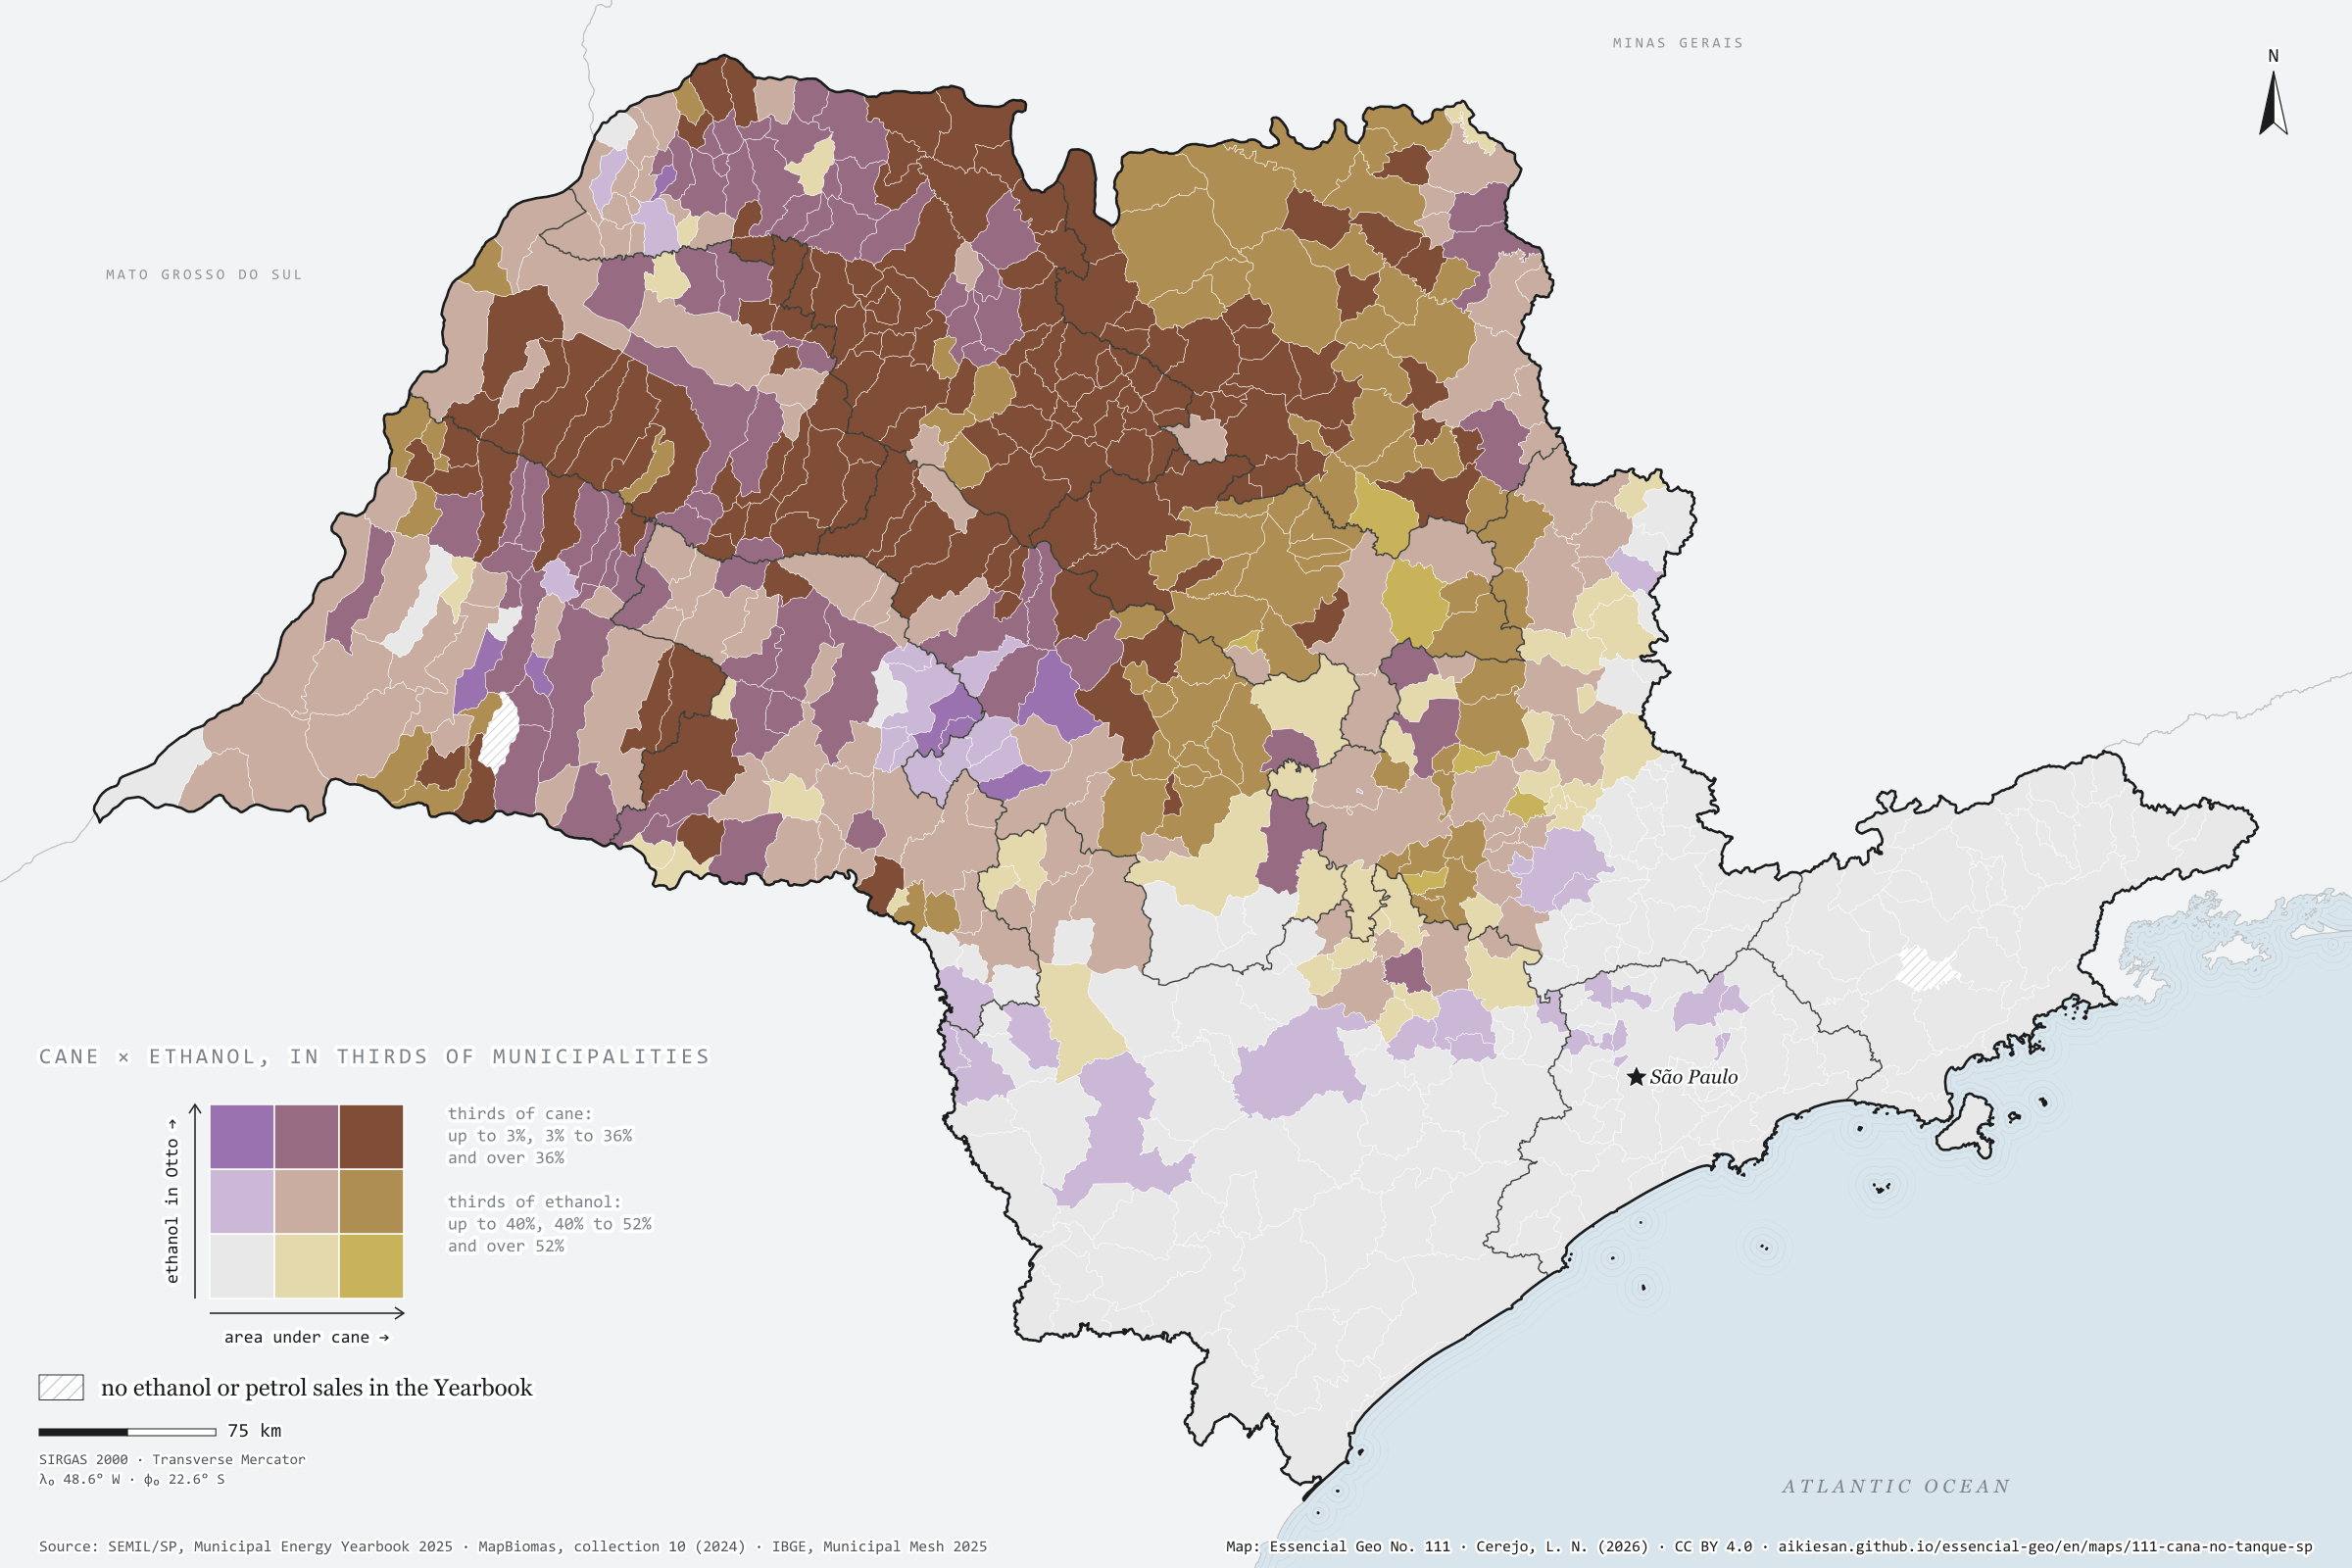
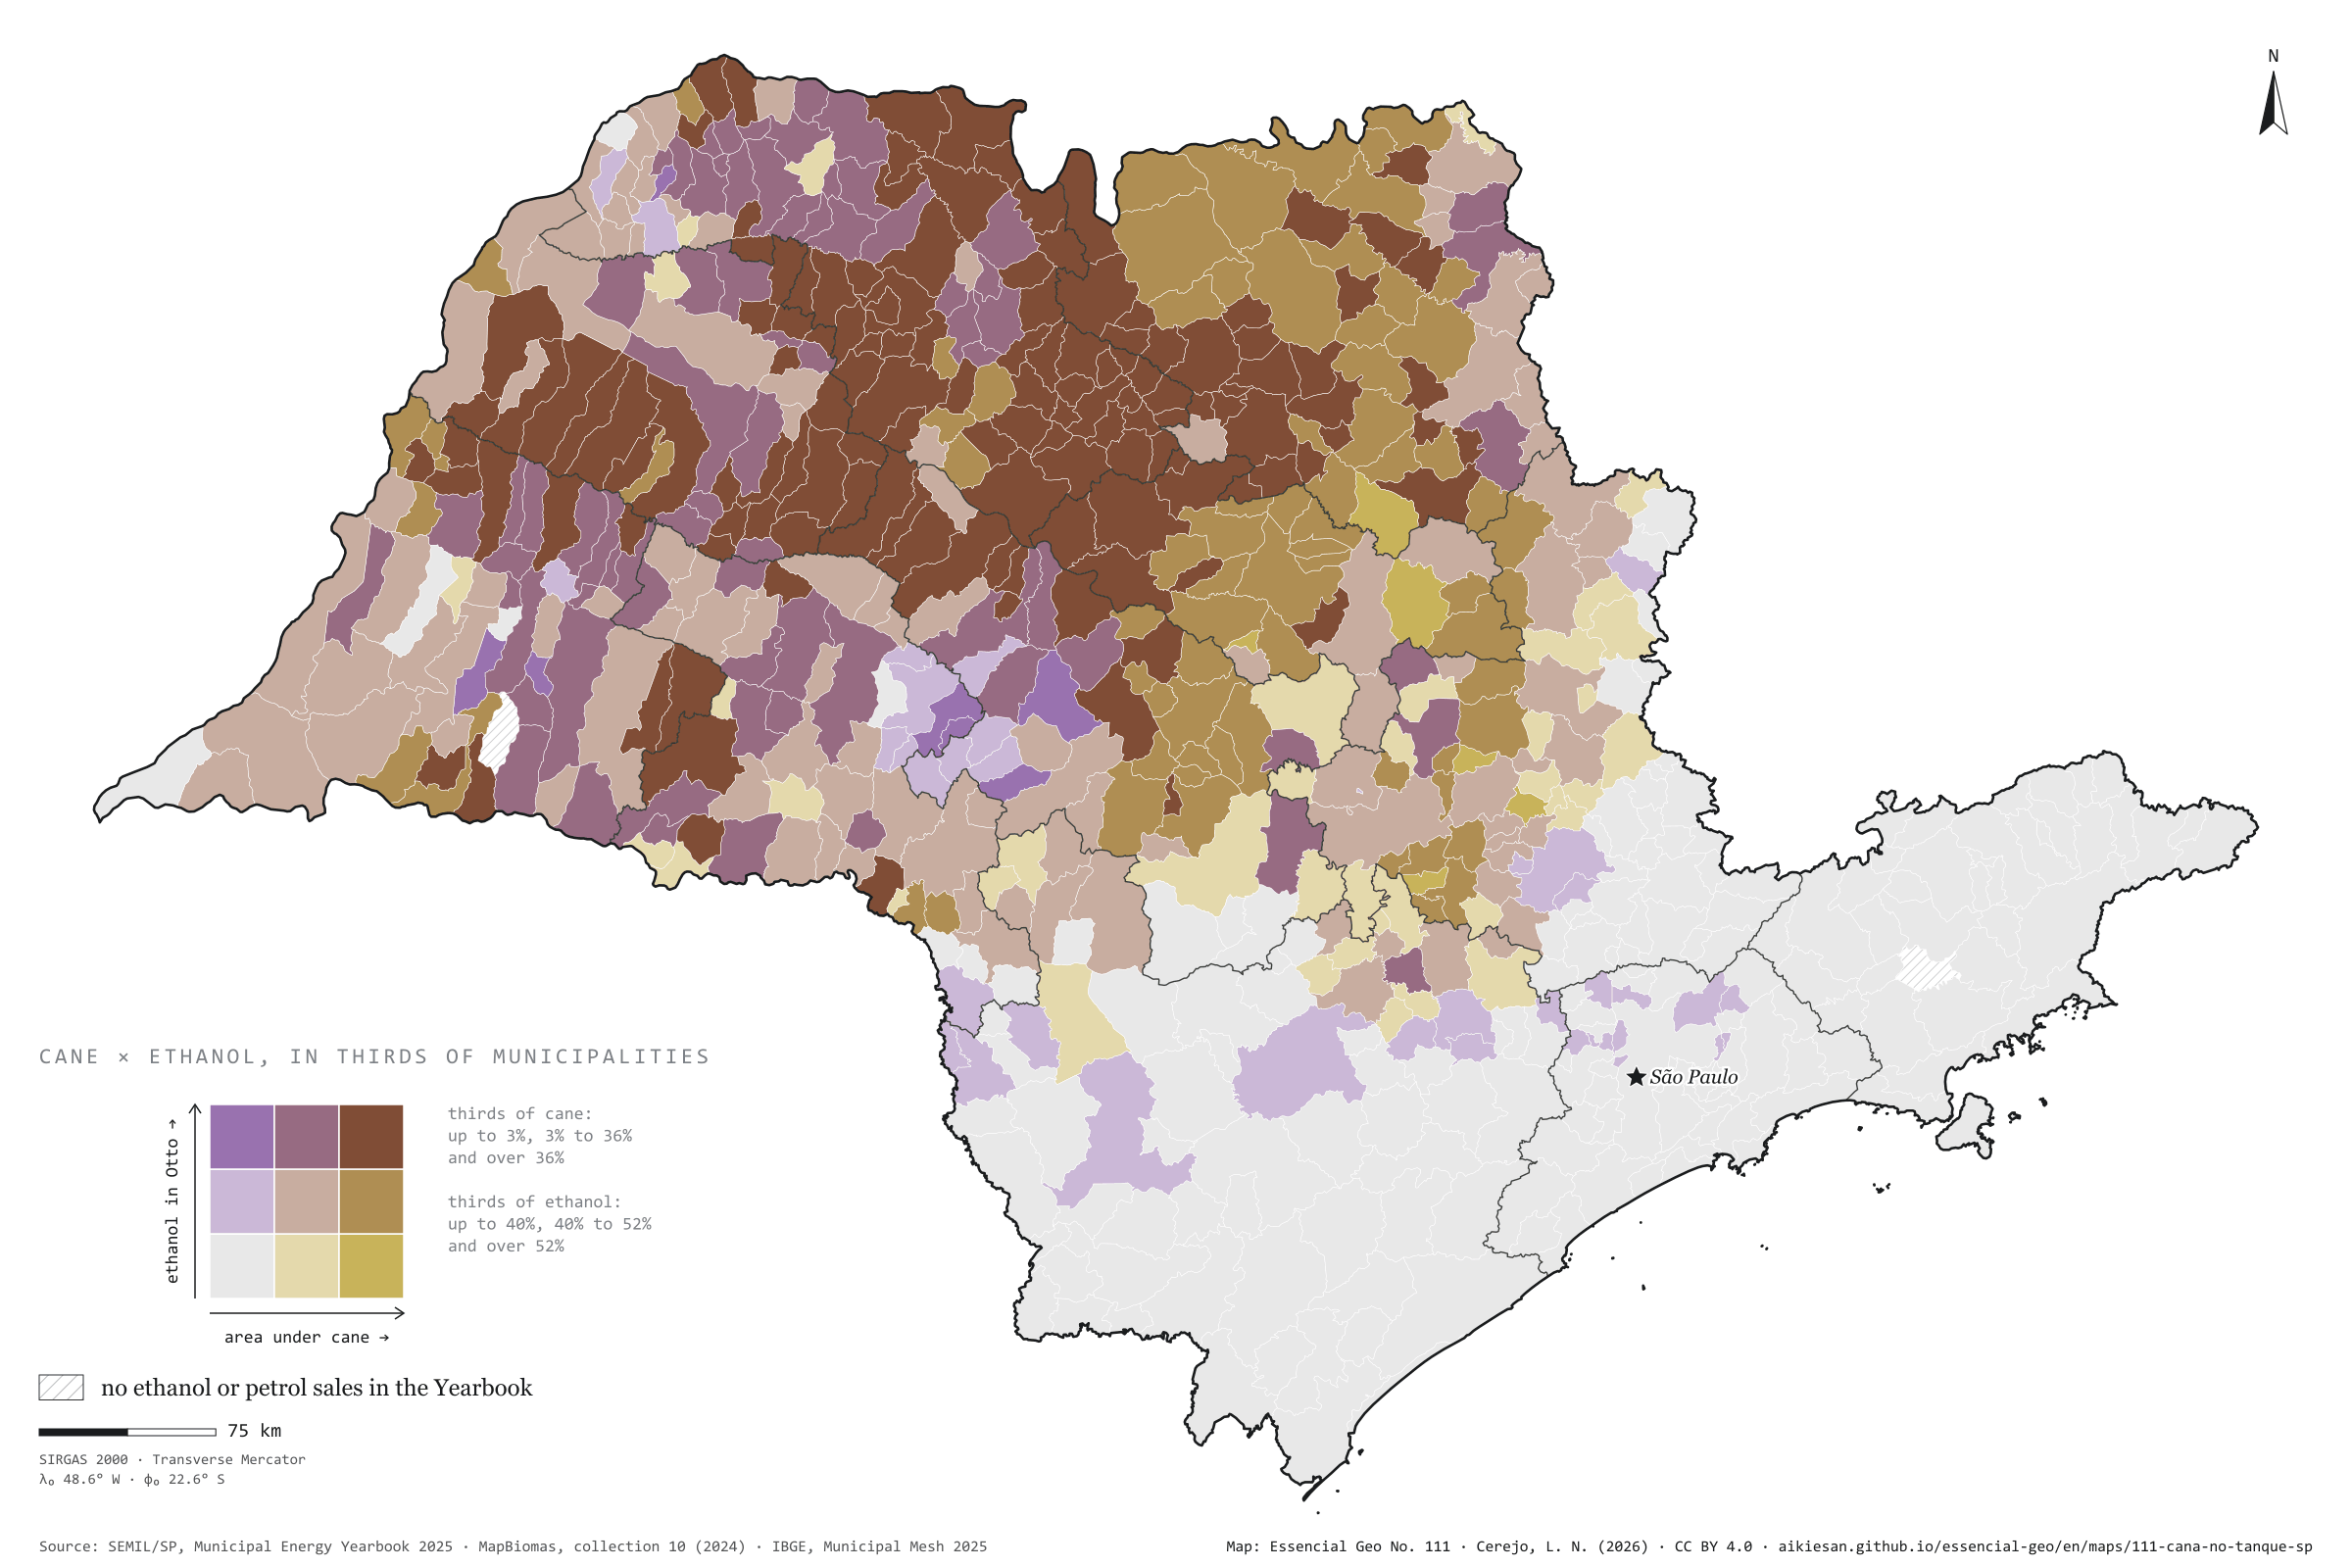
The map without a frame, with legend, scale, reference system and credit written on it: ready for papers, lectures and slides. In two versions: with the basemap (neighbours and sea) or only the mapped area, on white.
With basemap (PNG) Without basemap (PNG) QR code (SVG)
Point a camera at it to open this page.
How to cite
CEREJO, Lucas Nakamura. Cana no tanque: onde há mais canavial, o etanol pesa mais no que os postos vendem. Versão 1.0.0. [S. l.]: Essencial, 2026. Conjunto de dados. Disponível em: https://aikiesan.github.io/essencial-geo/en/maps/111-cana-no-tanque-sp/. Acesso em: 10 nov. 2026.
Cerejo, L. N. (2026). Cana no tanque: onde há mais canavial, o etanol pesa mais no que os postos vendem [Cane in the tank: Where there is more cane, ethanol weighs more in what filling stations sell] (Version 1.0.0) [Data set]. Essencial. https://aikiesan.github.io/essencial-geo/en/maps/111-cana-no-tanque-sp/
@dataset{cerejo2026_cana_no_tanque_sp,
  author    = {Cerejo, Lucas Nakamura},
  title     = {Cana no tanque: Onde há mais canavial, o etanol pesa mais no que os postos vendem},
  year      = {2026},
  publisher = {Essencial},
  version   = {1.0.0},
  url       = {https://aikiesan.github.io/essencial-geo/en/maps/111-cana-no-tanque-sp/},
  language  = {portuguese},
  note      = {English title: Cane in the tank: Where there is more cane, ethanol weighs more in what filling stations sell. Licence CC BY 4.0}
}