Skip to content
Essencial

Collection · 4 plates

Bioenergy in São Paulo

Biogas plants, livestock, sugarcane and sugar-energy mills: where the residues that can become energy are found across the state.

4 of 4 published

In reading order, from the first to the latest. All collections

The route

Read in order: each plate adds a layer to the one before.

Start with the first plate
  1. Plate 1/4 · No. 028 Biogas plants Where rubbish and manure become light
  2. Plate 2/4 · No. 029 Livestock Three herds, three geographies
  3. Plate 3/4 · No. 030 Sugarcane A green sea over a fifth of the state
  4. Plate 4/4 · No. 031 Mills and cane The harvest that lights the grid
Every plate, in full

No. 028 Energy · biomass Bioenergy in São Paulo 1/4

Biogas plants

Where rubbish and manure become light

Fig. 028 São Paulo state (SP) EPSG:4674 Source: MapBiomas, ANEEL, IBGE

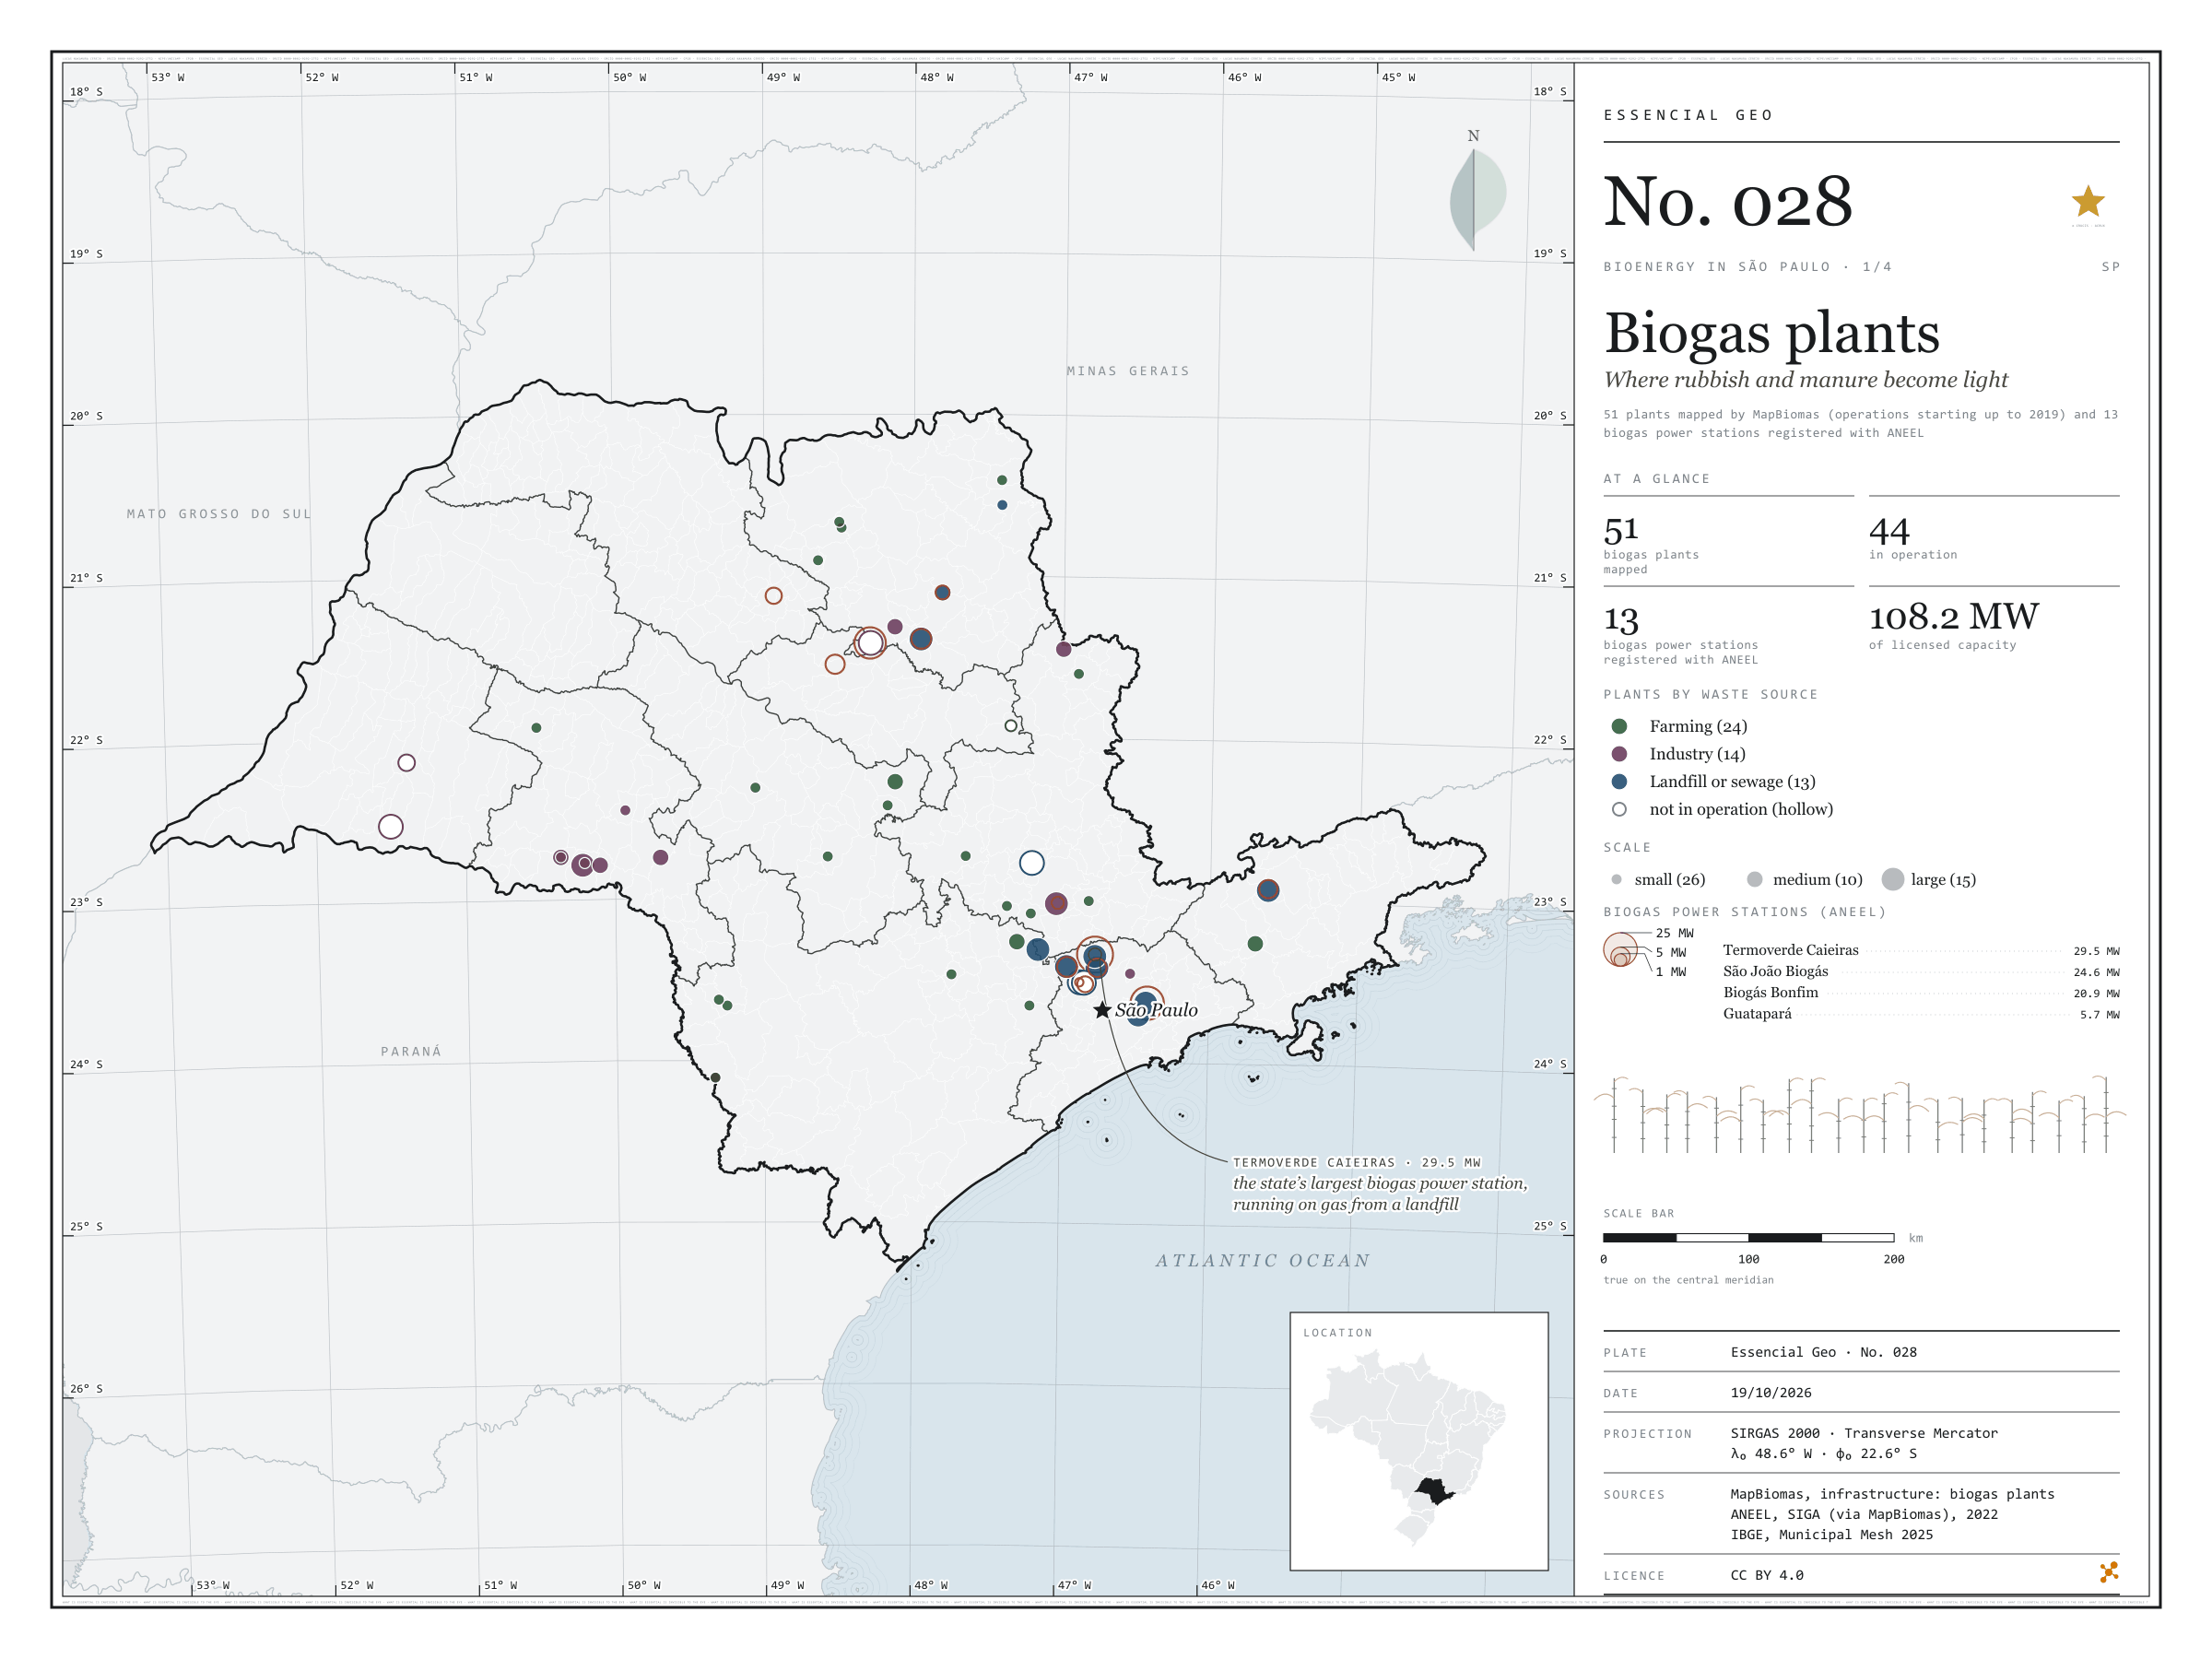
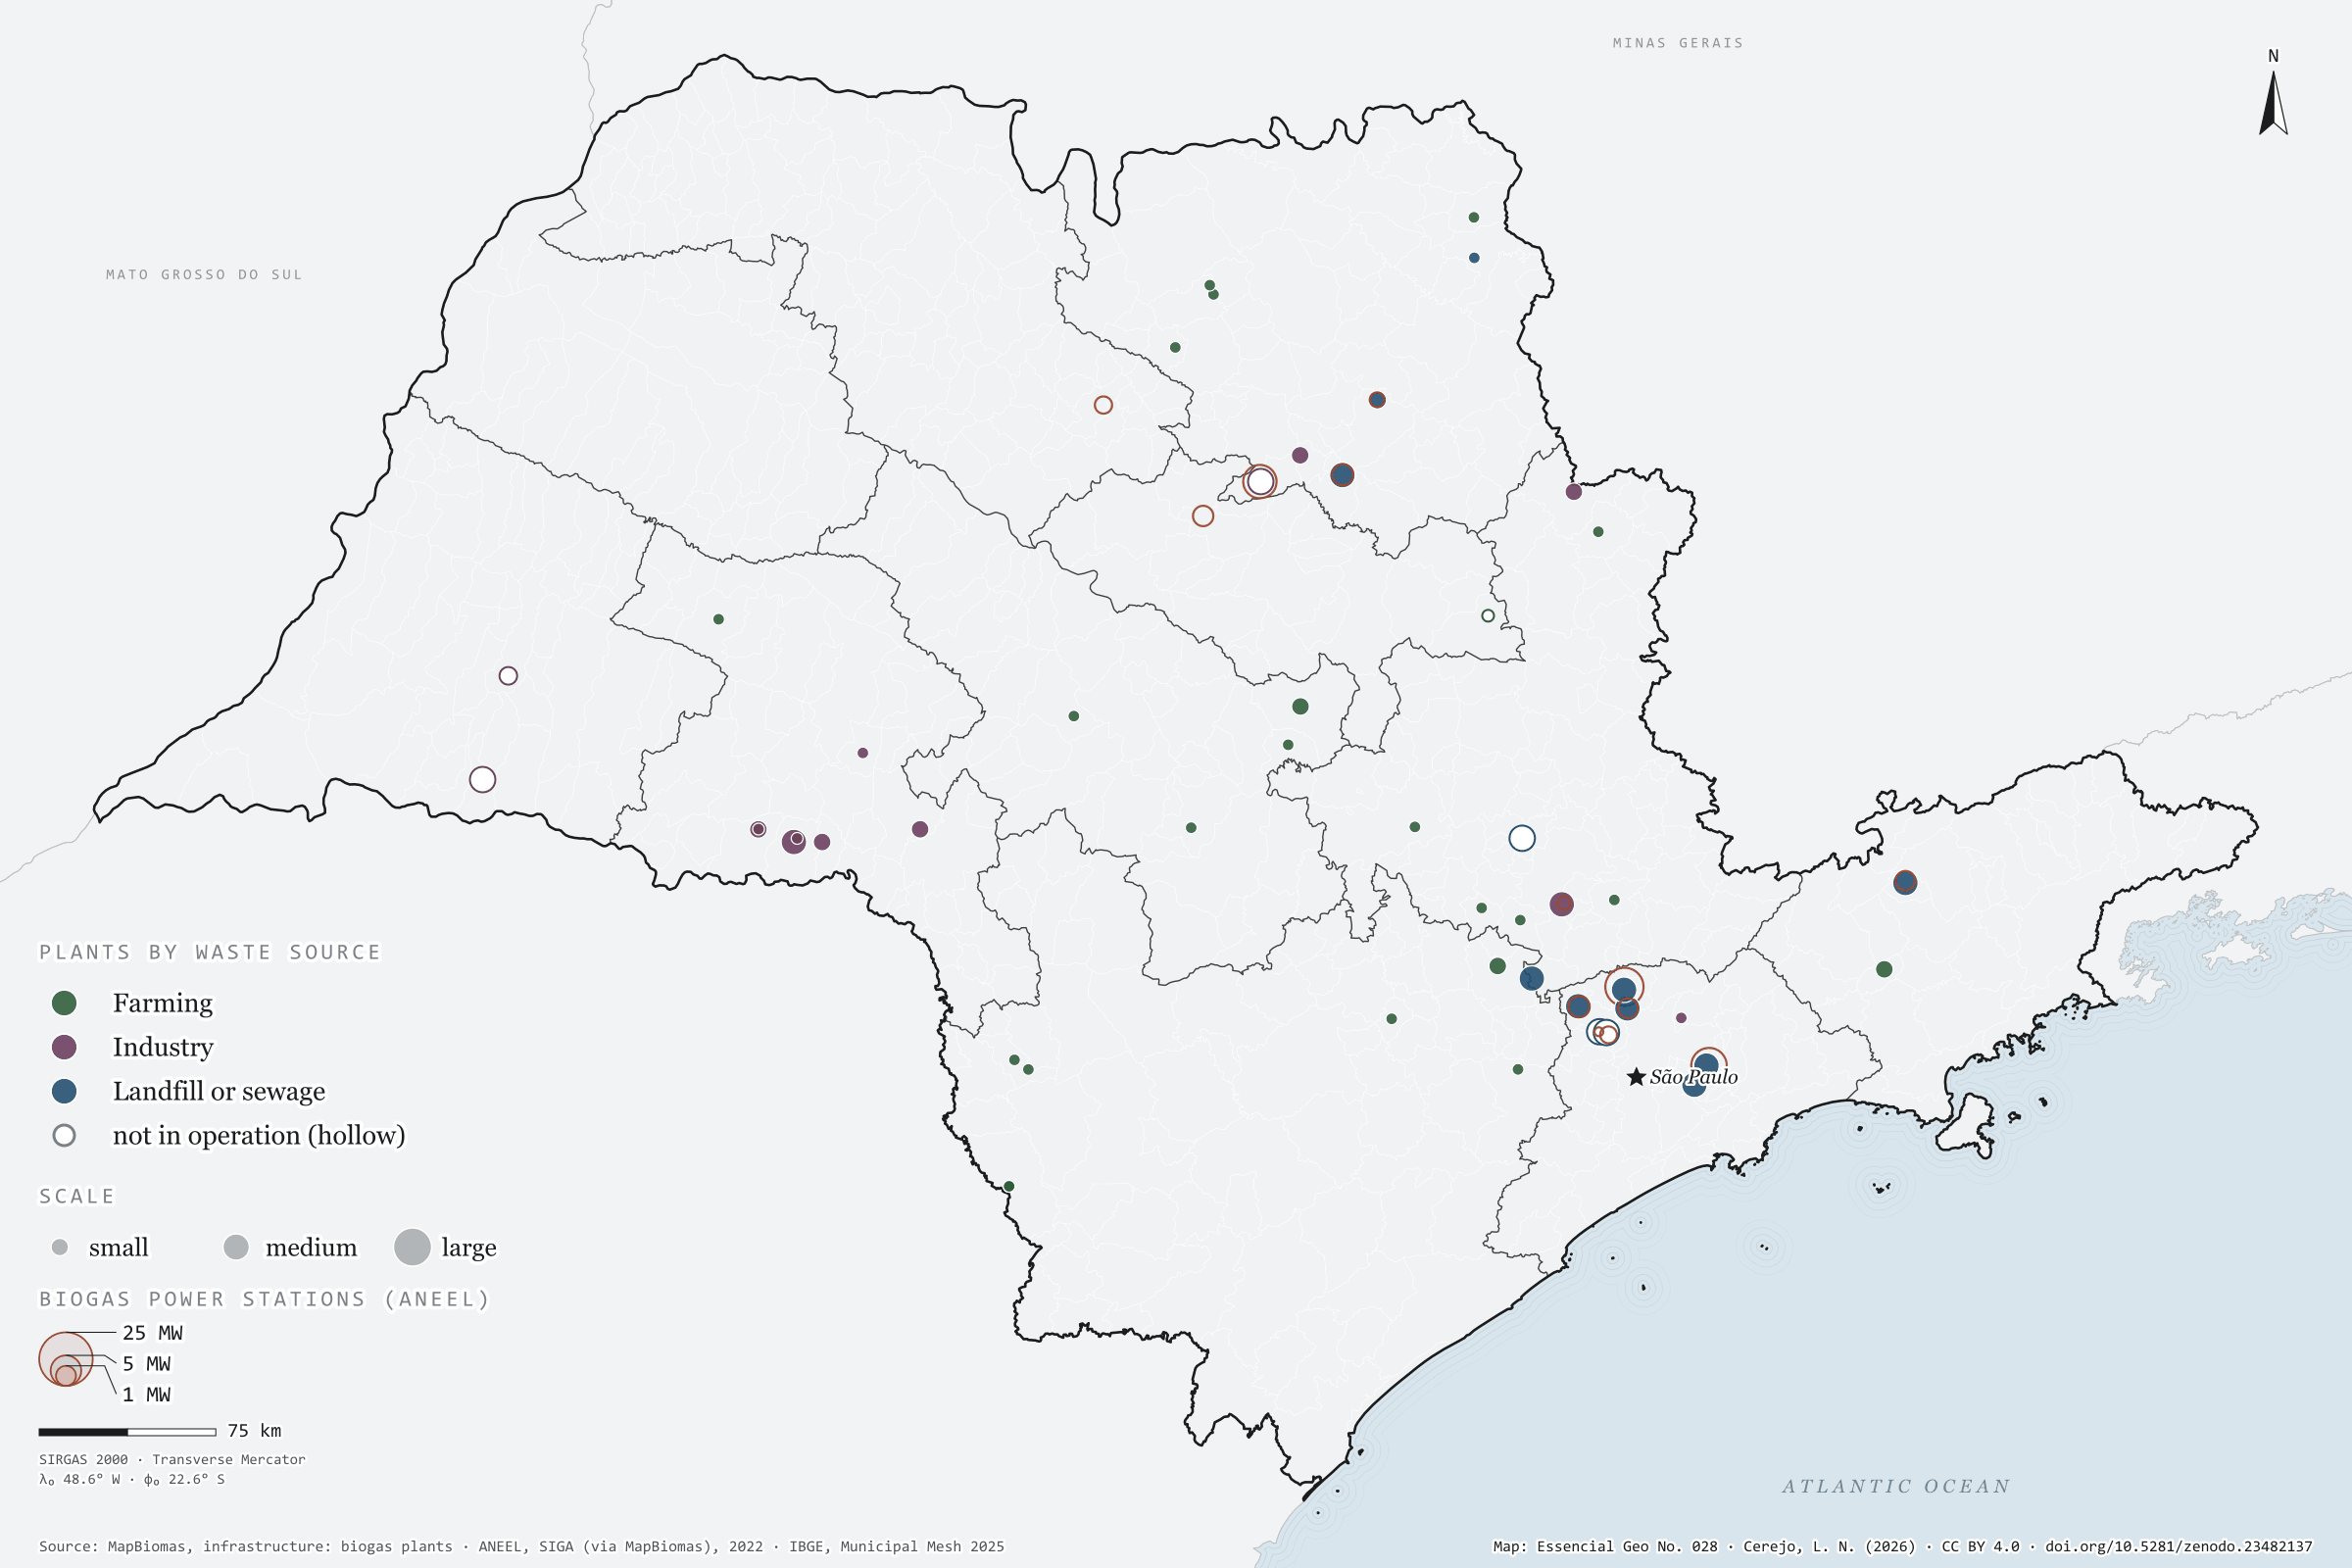
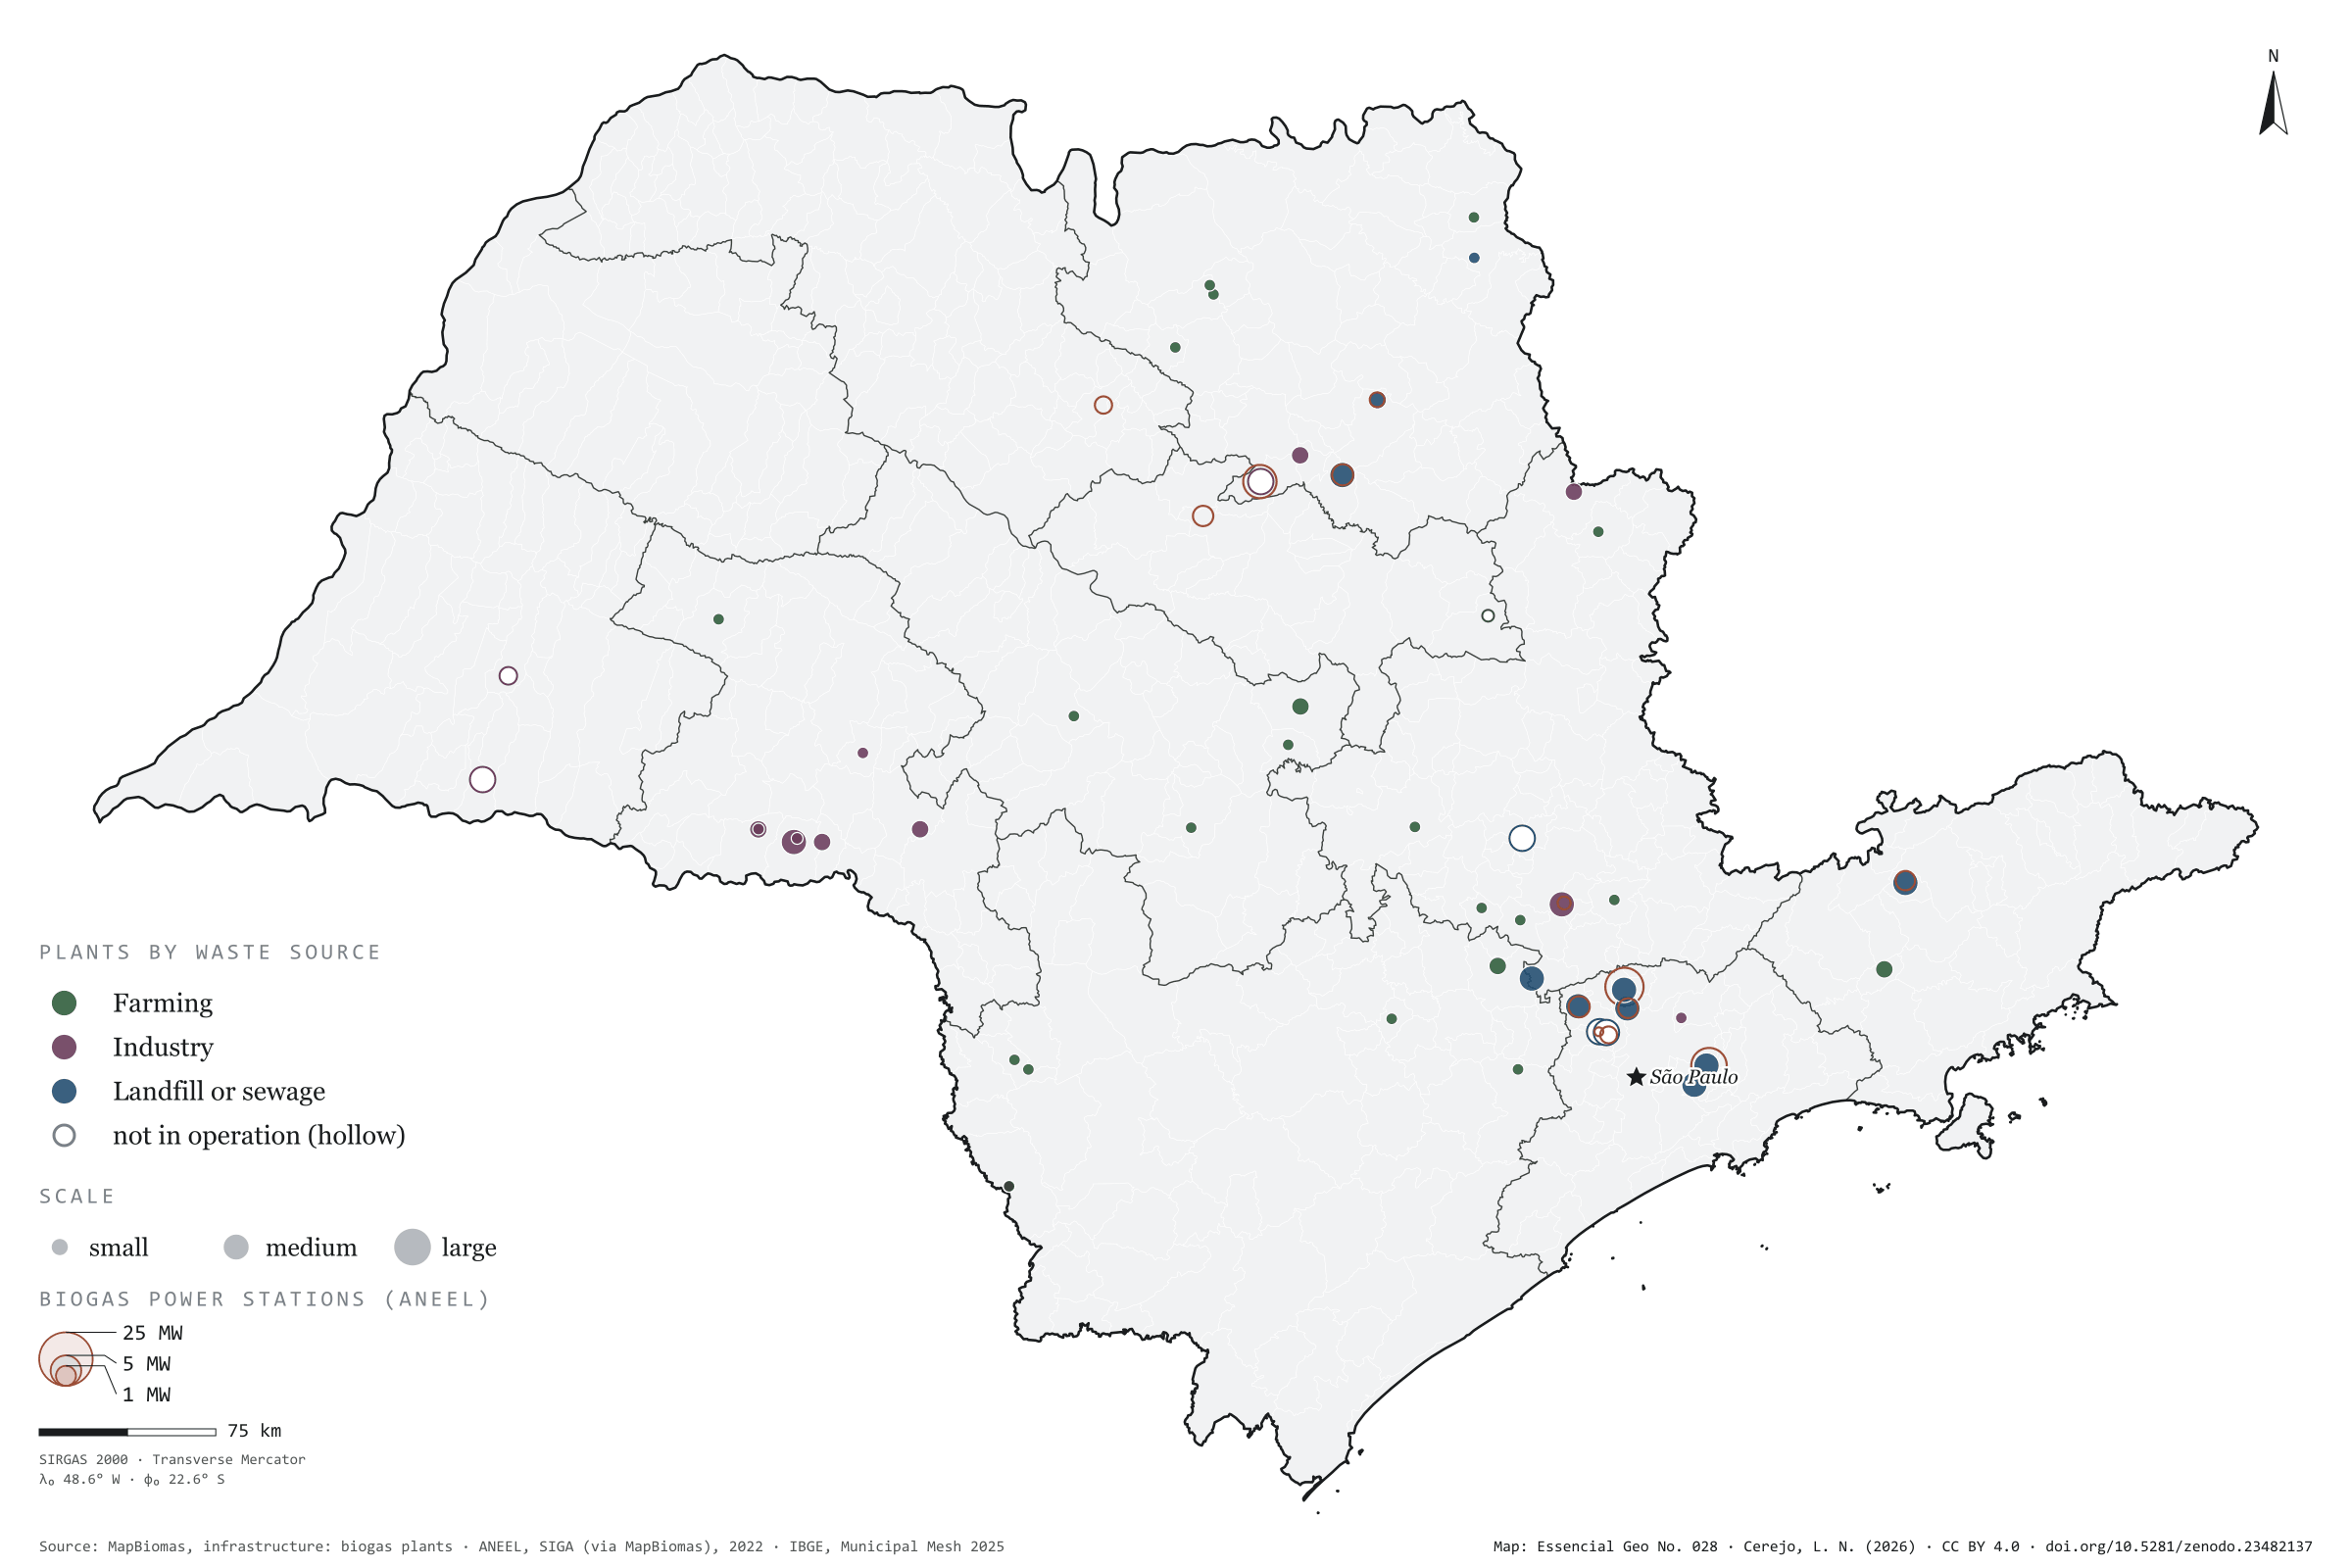
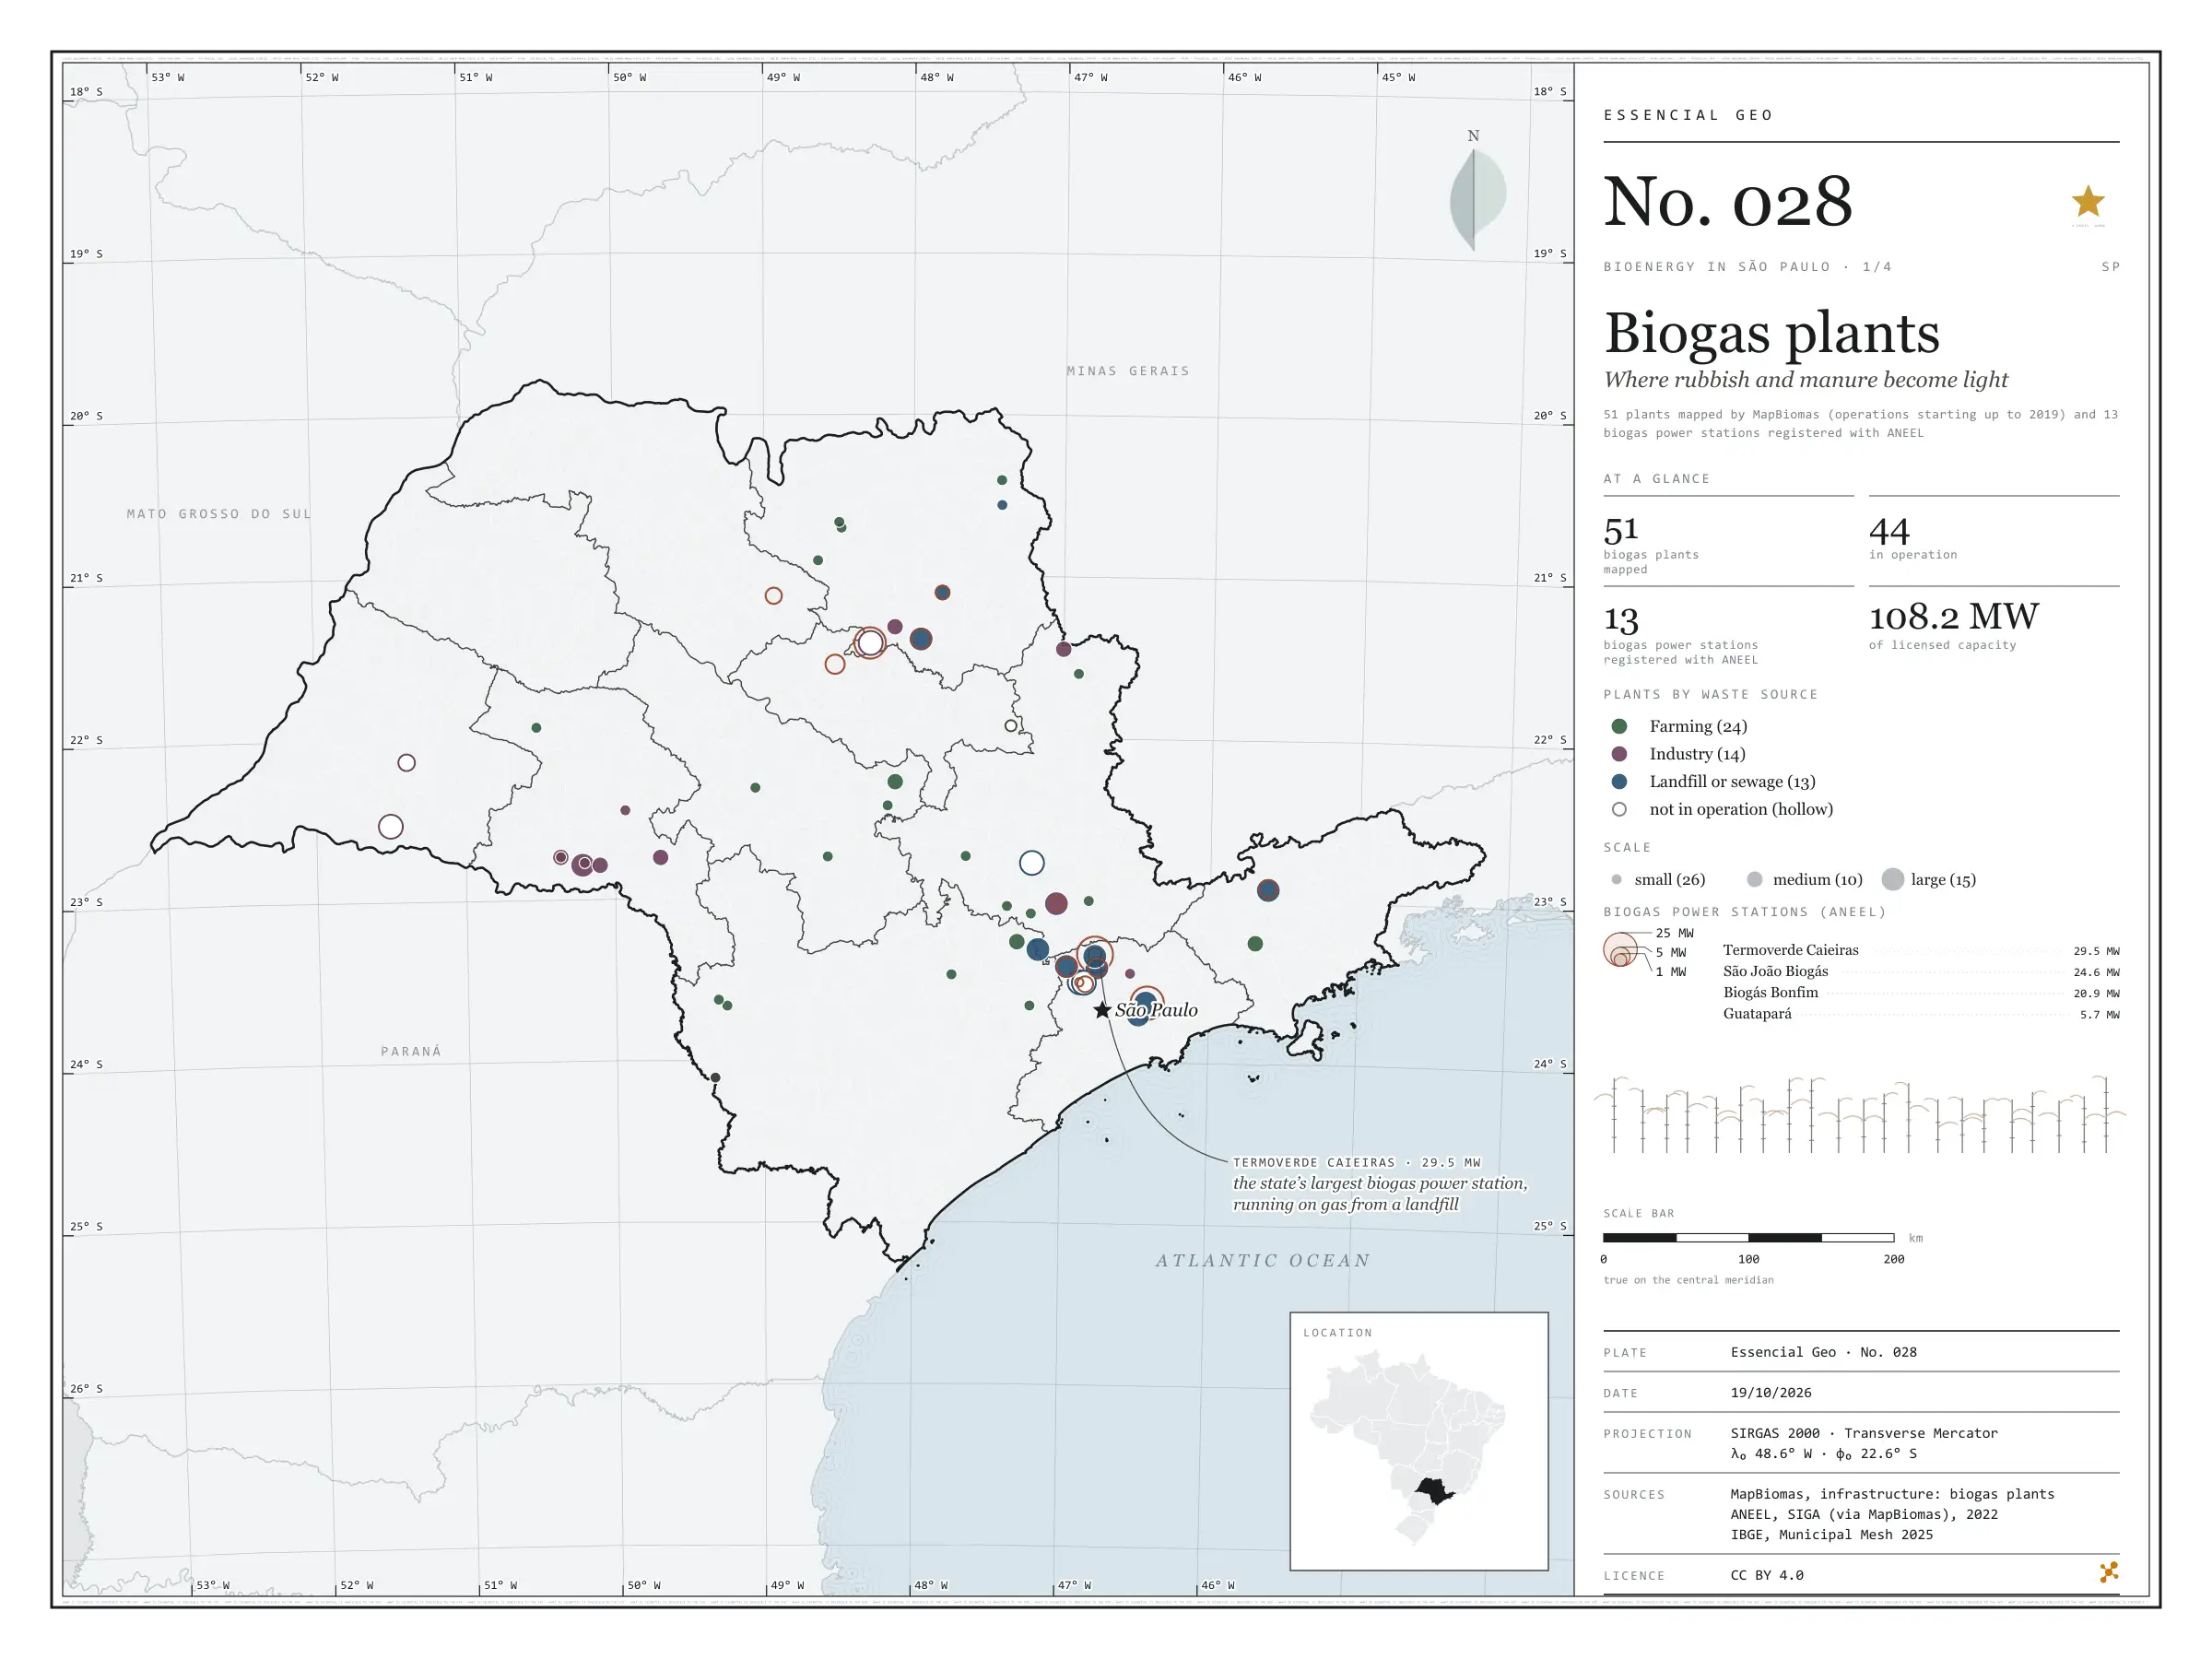
On top of a landfill in Caieiras, in Greater São Paulo, the gas rising from the rubbish drives the state’s largest biogas power station: 29.5 MW of licensed capacity. It is one of 13 biogas power stations registered with ANEEL in São Paulo, which together add up to 108.2 MW. MapBiomas maps other ways of using the same gas: 51 plants across the state, 44 of them in operation, burning manure from farms, industrial effluent and what comes out of landfills and sewage works to make electricity, heat or biomethane. On the map they gather around the capital and along the agro-industrial hubs of the interior. First plate of the collection “Bioenergy in São Paulo”, which follows waste all the way to energy.

Technical record · downloads · citation

At a glance

Biogas plants by waste source (plants)
  • Farming 24
  • Industry 14
  • Landfill or sewage 13
Biogas power stations (ANEEL)

108 MW

13 stations; the largest is Termoverde Caieiras (29.5 MW)

Layers

  • usinas_biogas point 51 biogas plants: category, main use, status, scale and start of operations
  • ute_biogas point 13 biogas power stations registered with ANEEL, with capacity (kW)
  • municipios polygon 645 municipalities, with the number of plants and biogas capacity
  • regioes_intermediarias polygon 11 intermediate geographic regions
  • limite_estadual polygon State boundary

Metadata

Extent
São Paulo state (SP)
CRS / Projection
SIRGAS 2000 (EPSG:4674)
EPSG:4674
Software
Python · GeoPandas · GDAL · QGIS · Node.js · d3-geo
Method
MapBiomas biogas plants and SIGA biogas power stations clipped to São Paulo state and assigned to municipalities by spatial join.
Version
v1.0.0
Licence
CC BY 4.0

Downloads

Figure to reuse

The map without a frame, with legend, scale, reference system and credit written on it: ready for papers, lectures and slides. In two versions: with the basemap (neighbours and sea) or only the mapped area, on white.

Point a camera at it to open this page.

How to cite

Cerejo, L. N. (2026). Usinas de biogás: onde o lixo e o esterco viram luz [Biogas plants: Where rubbish and manure become light] (Version 1.0.0) [Data set]. Zenodo. https://doi.org/10.5281/zenodo.23482137

No. 029 Energy · biomass Bioenergy in São Paulo 2/4

Livestock

Three herds, three geographies

Fig. 029 São Paulo state (SP) EPSG:4674 Source: IBGE

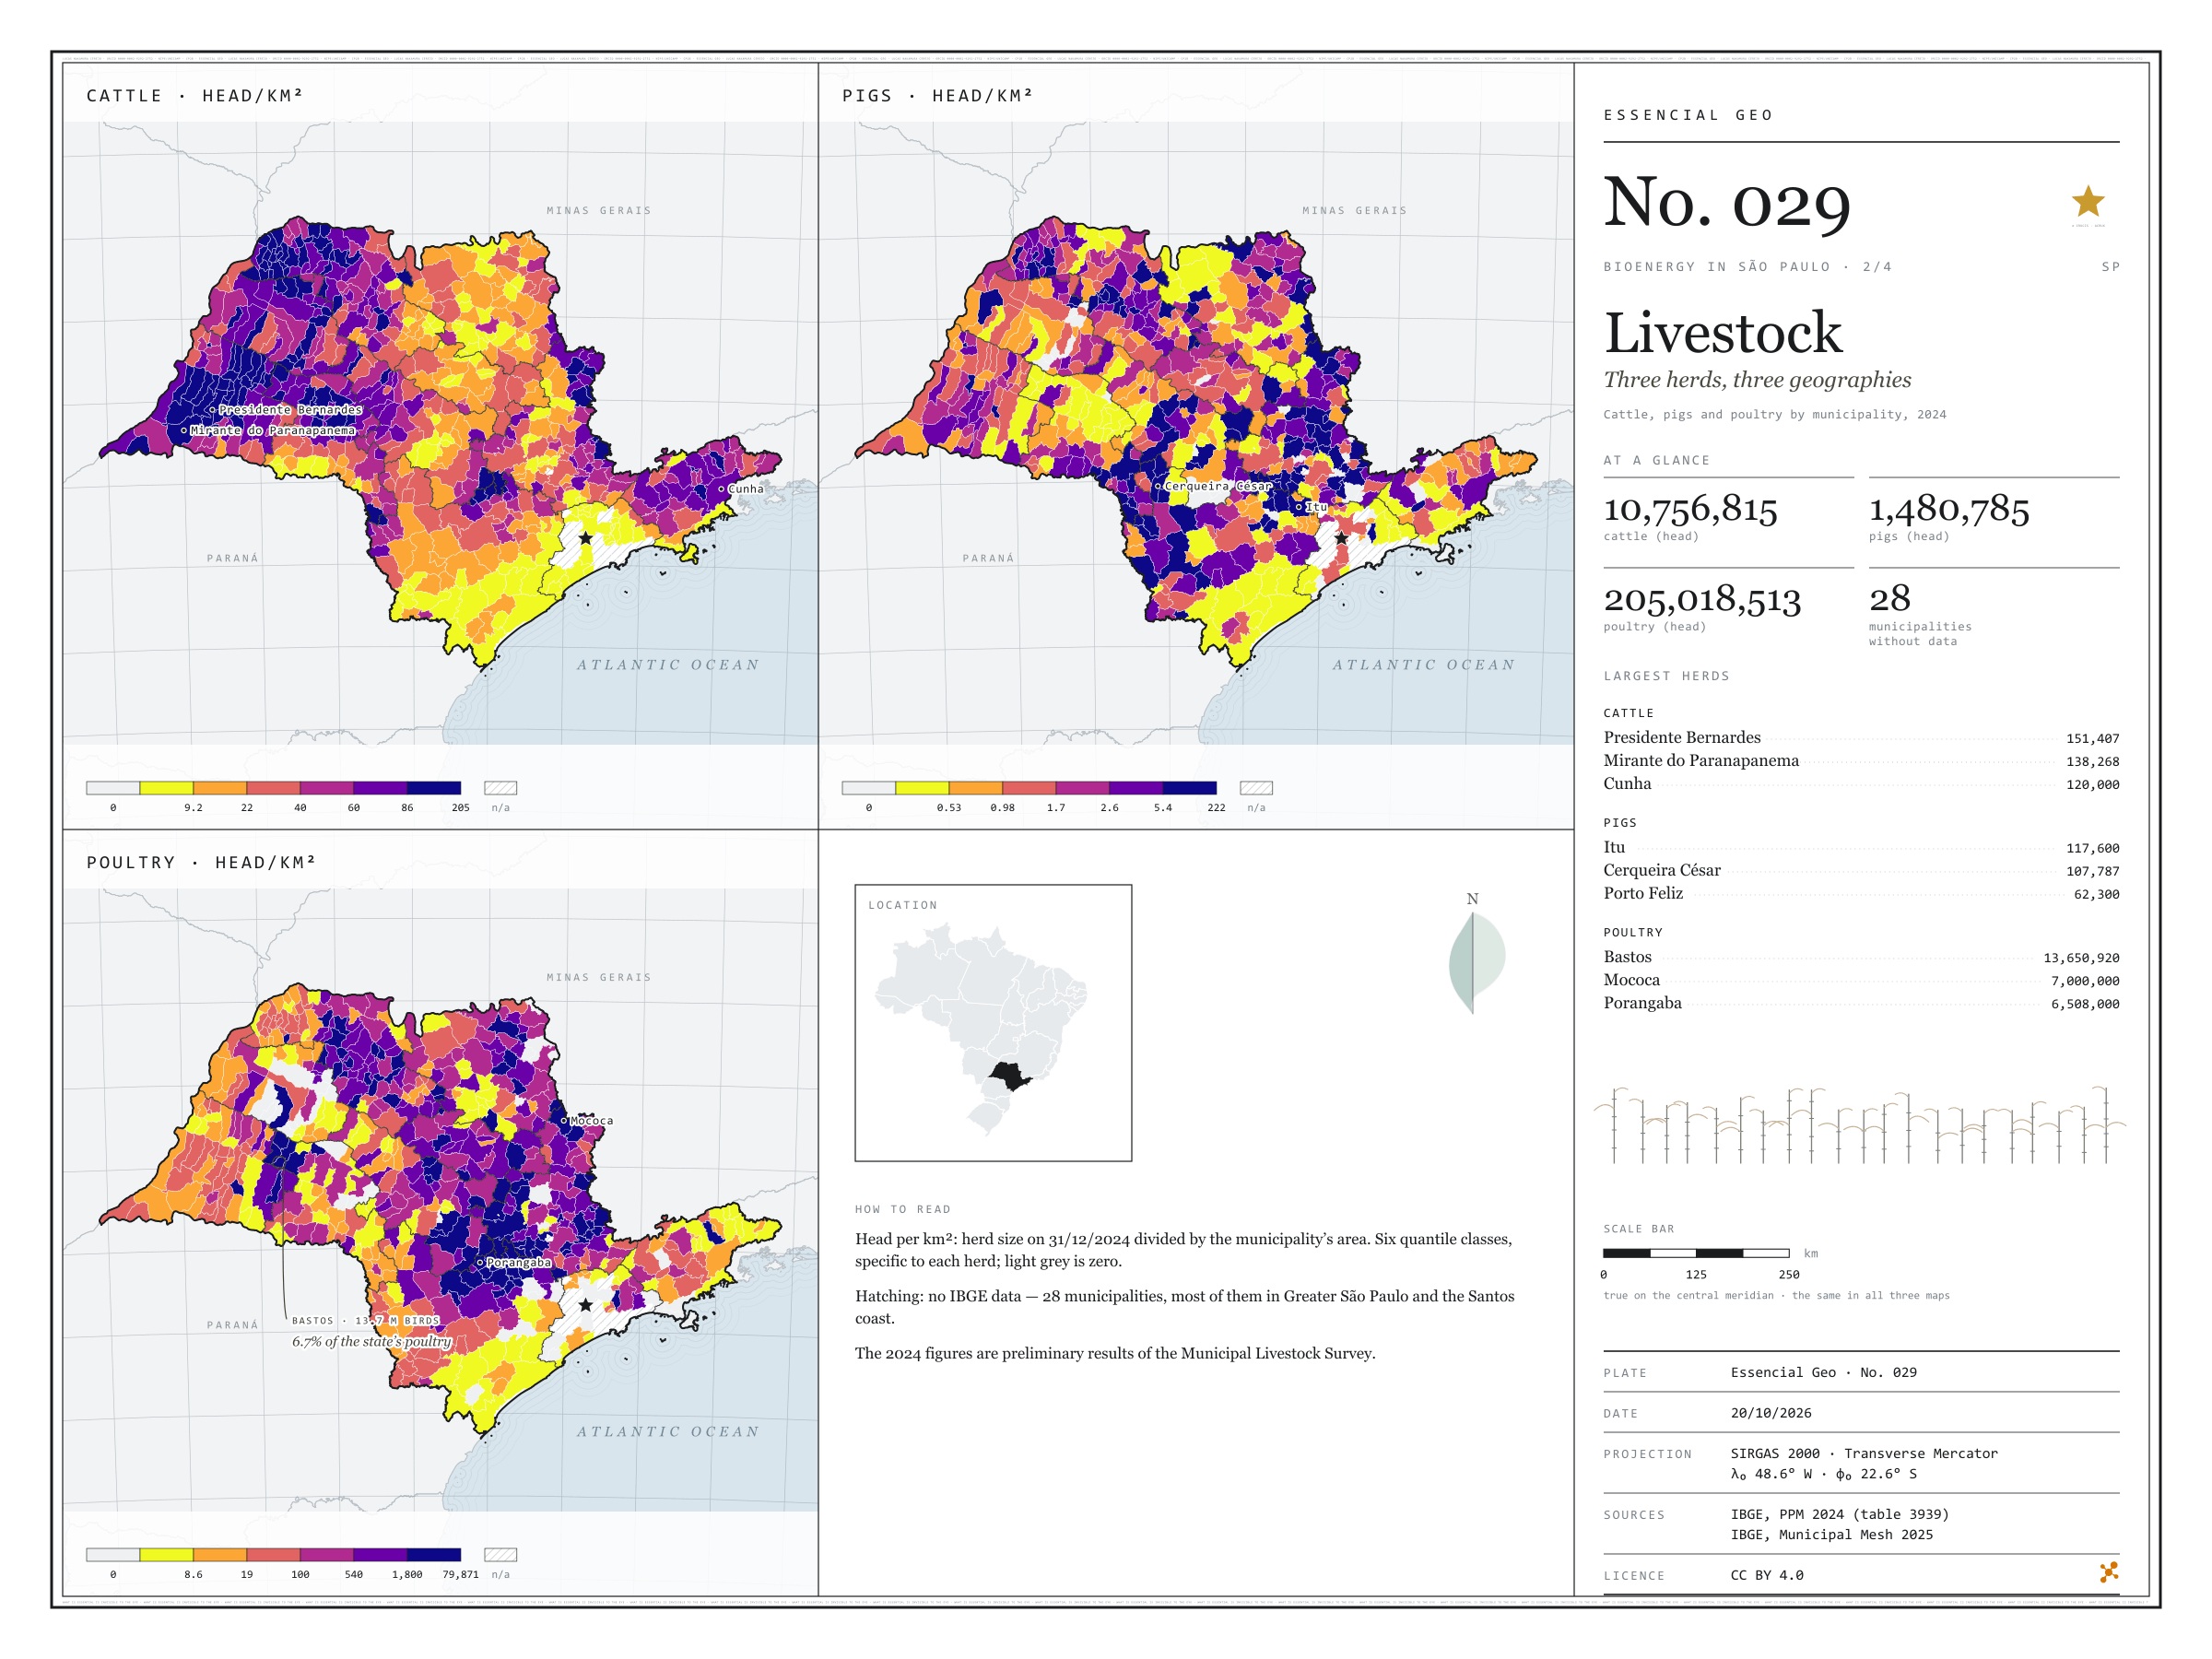
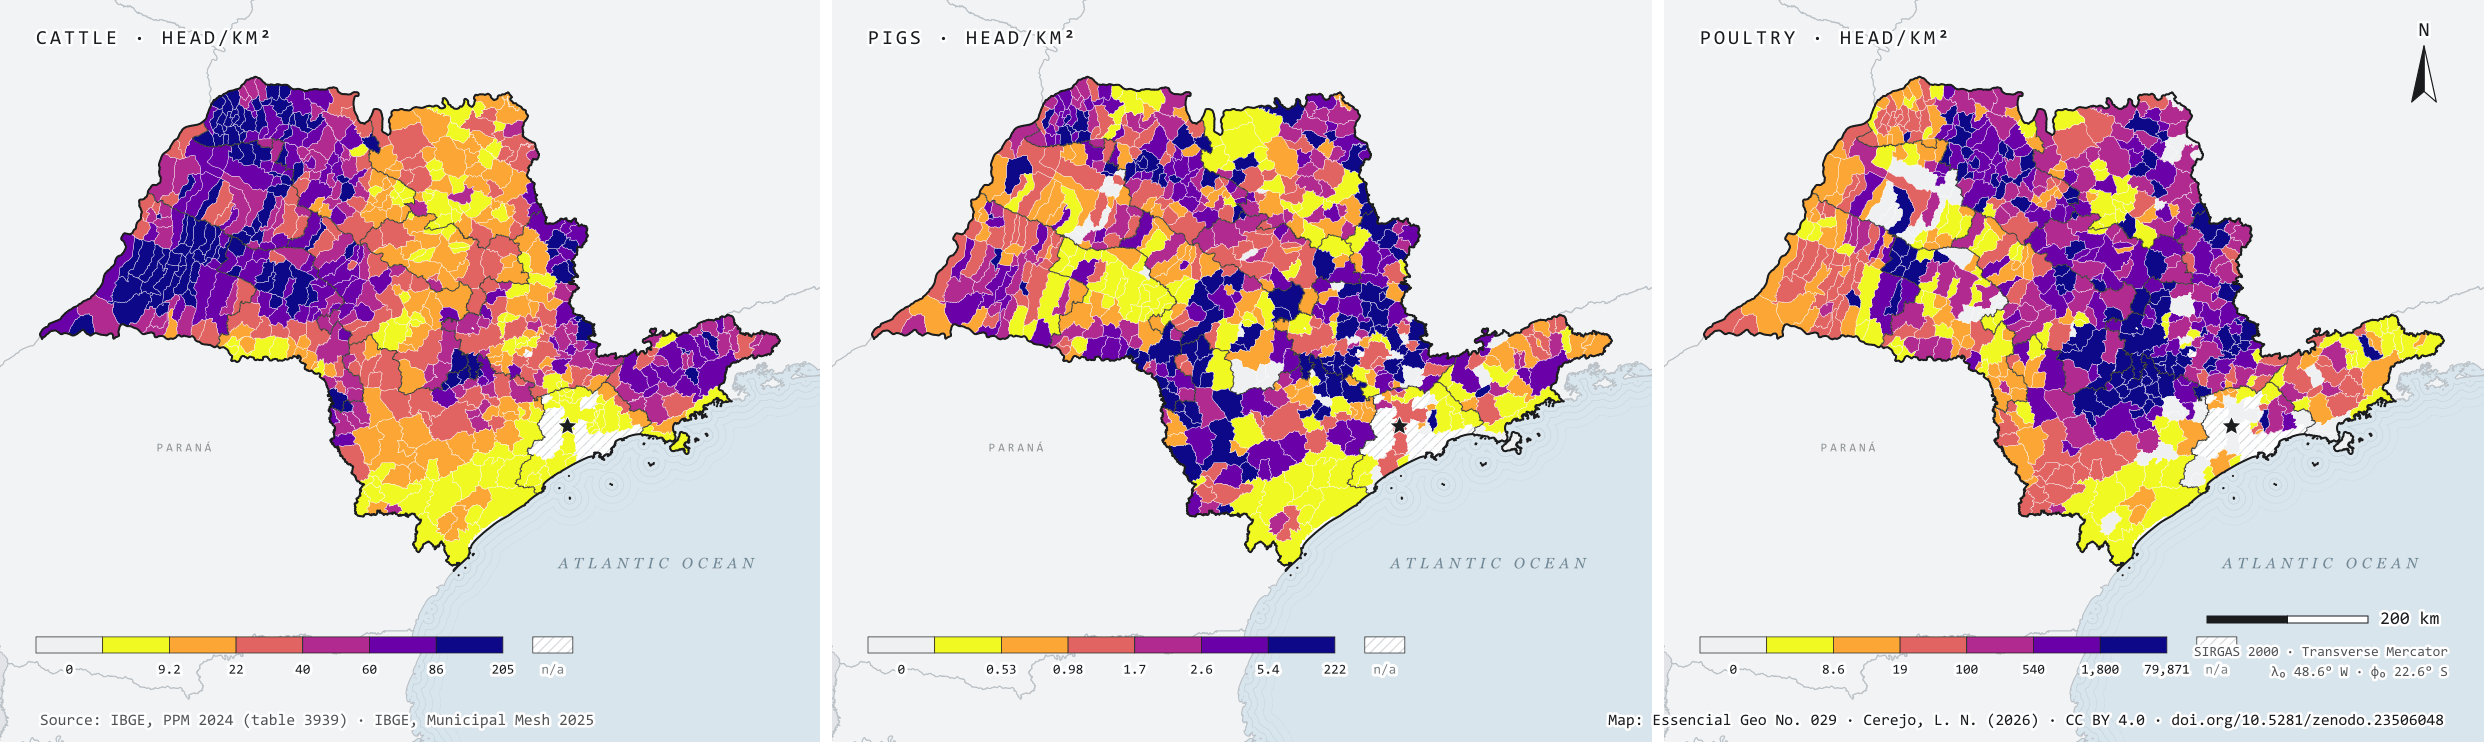
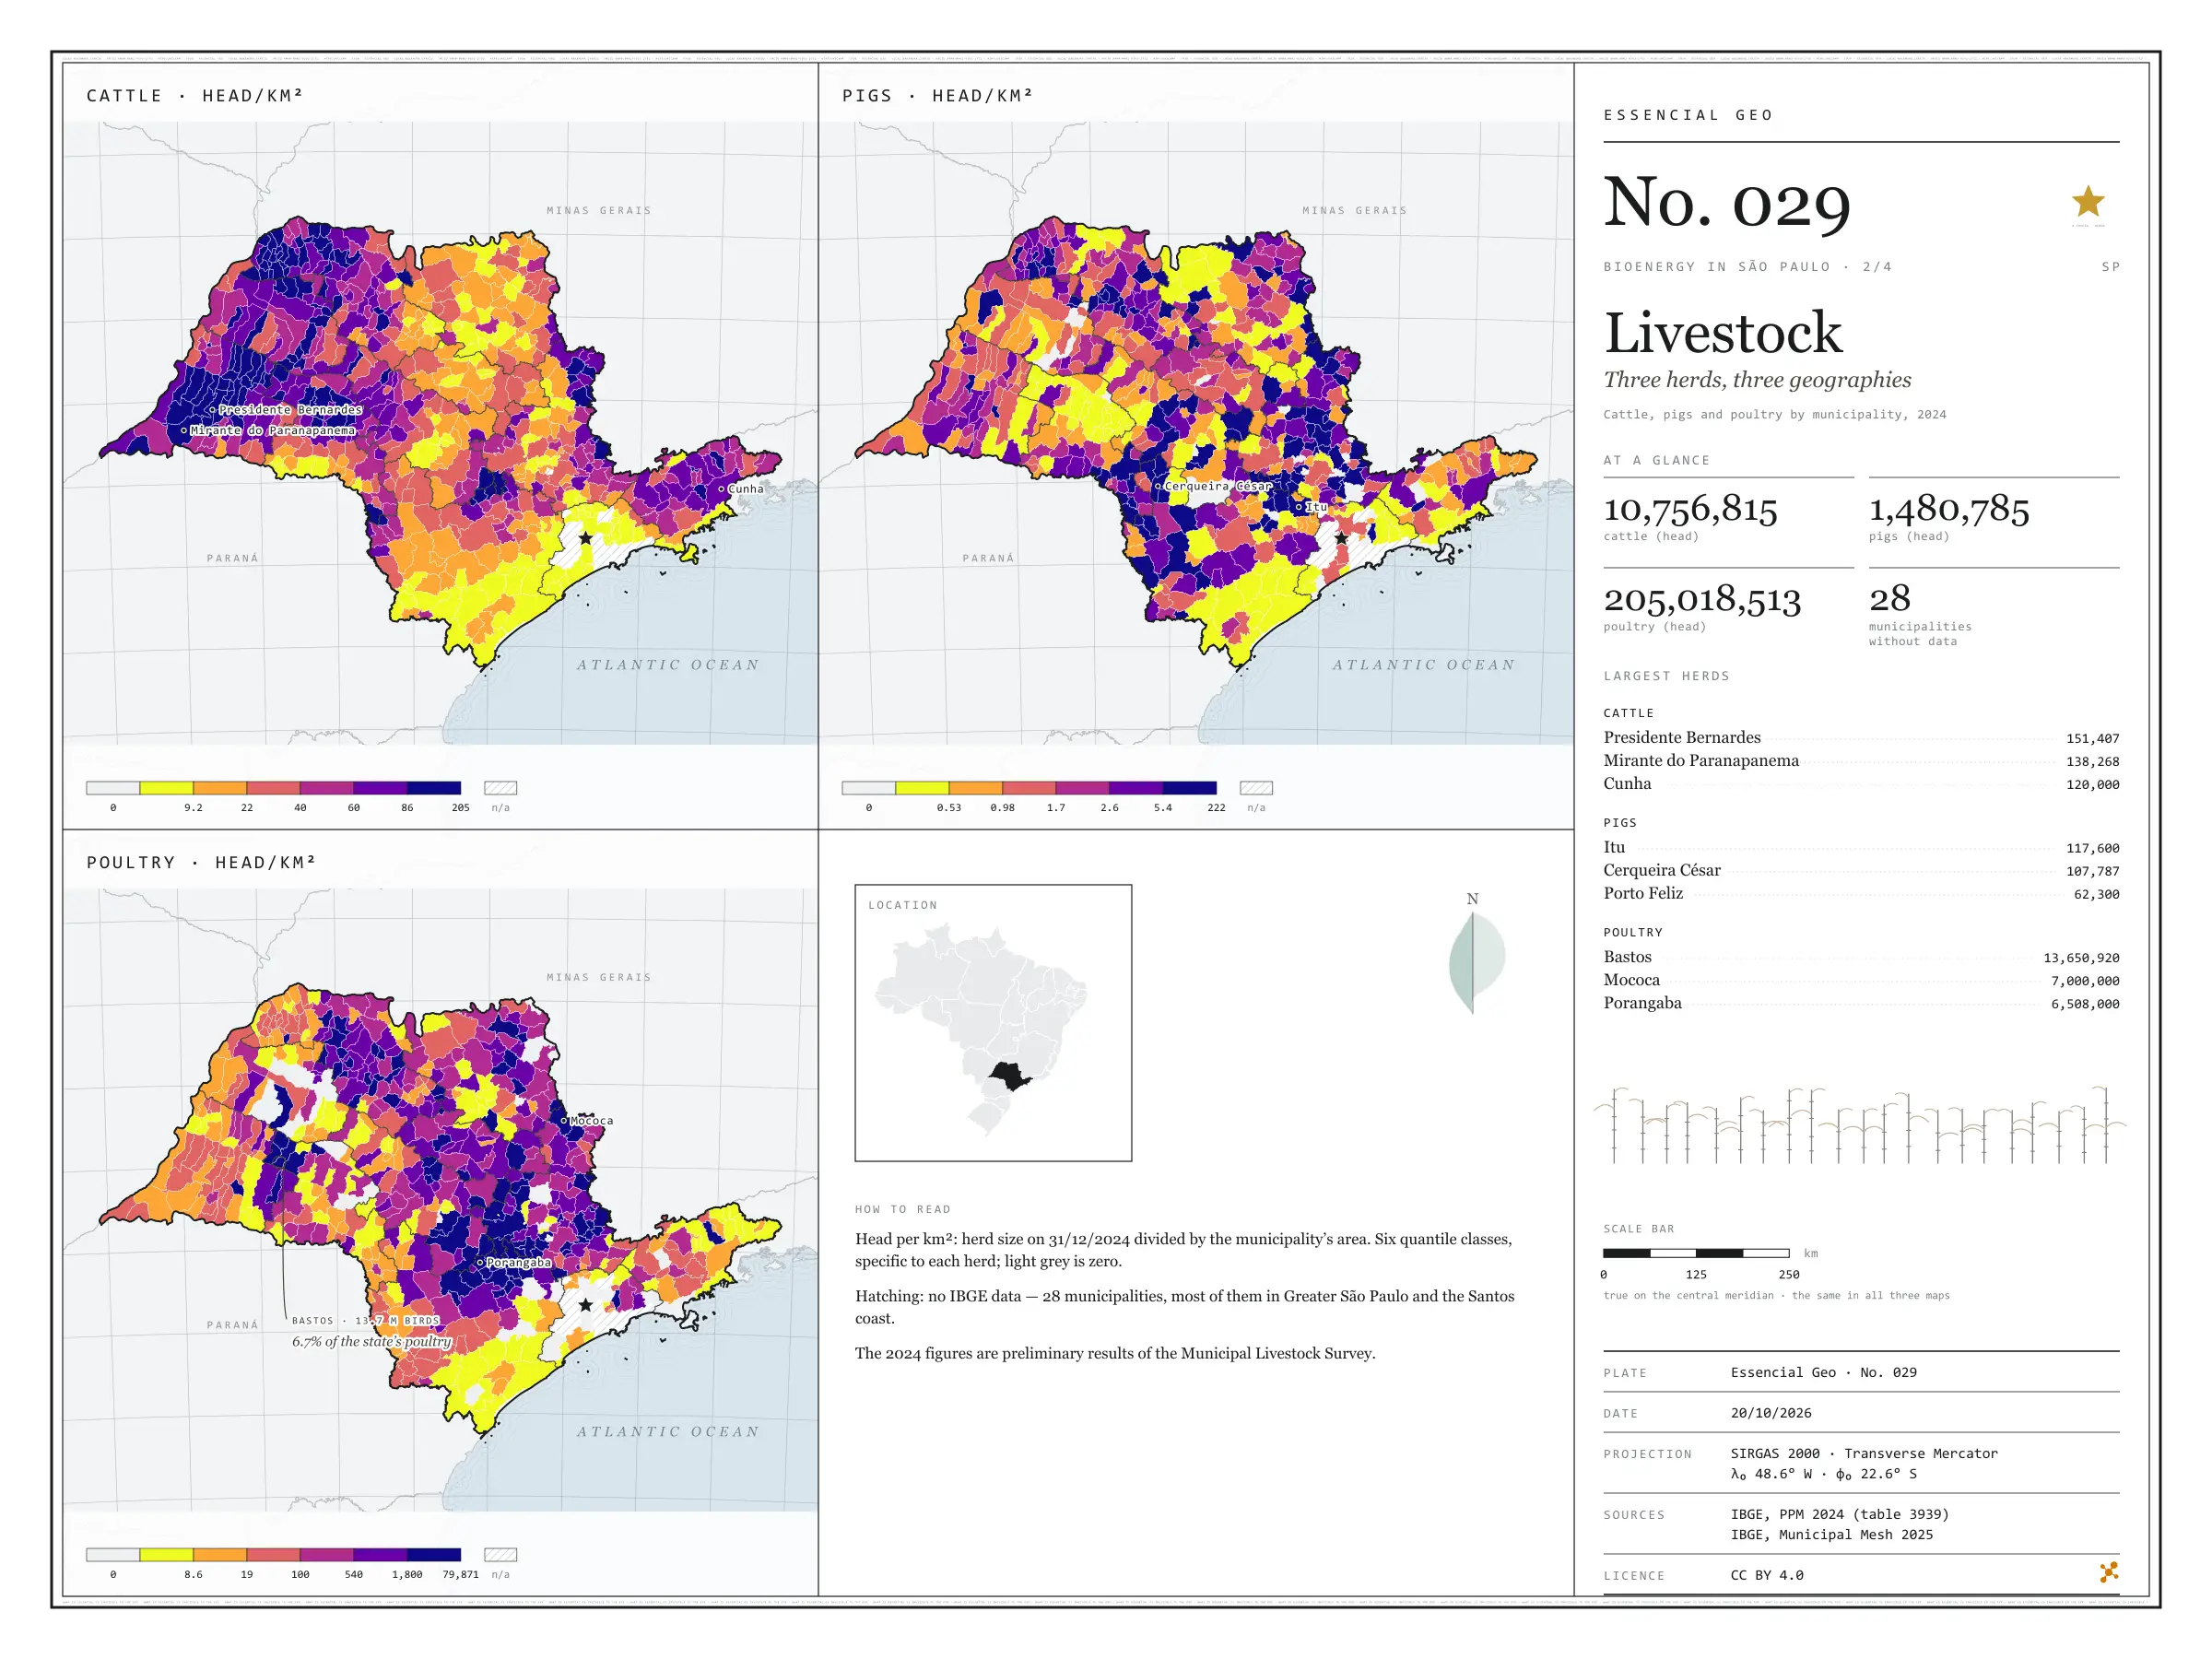
In 2024, São Paulo state held 10.8 million cattle, 1.5 million pigs and 205 million poultry. Side by side, the three herds occupy the state in different ways: cattle spread across the west, led by Presidente Bernardes (151,407 head) and Mirante do Paranapanema (138,268); pigs gather in a few hubs, such as Itu and Cerqueira César, each with over 100,000 head; and poultry cluster in farms, with Bastos alone holding 13.7 million birds. For anyone thinking about biogas, density matters more than the total: many animals on little land also concentrate the manure. Second plate of the collection “Bioenergy in São Paulo”.

Technical record · downloads · citation

At a glance

Cattle

10,756,815 head

617 municipalities with cattle; largest herd: Presidente Bernardes (151,407)

Pigs

1,480,785 head

584 municipalities with pigs; largest herd: Itu (117,600)

Poultry

205,018,513 head

572 municipalities with poultry; largest flock: Bastos (13,650,920)

Layers

  • municipios polygon 645 municipalities: herd size and density (head/km²) of cattle, pigs and poultry
  • regioes_intermediarias polygon 11 intermediate geographic regions
  • limite_estadual polygon State boundary

Metadata

Extent
São Paulo state (SP)
CRS / Projection
SIRGAS 2000 (EPSG:4674)
EPSG:4674
Software
Python · GeoPandas · GDAL · QGIS · Node.js · d3-geo
Method
Cattle, pig and poultry numbers from PPM 2024 joined to the Municipal Mesh by IBGE code and divided by municipal area; six quantile classes.
Version
v1.0.0
Licence
CC BY 4.0

Downloads

Figure to reuse

The map without a frame, with legend, scale, reference system and credit written on it: ready for papers, lectures and slides. In two versions: with the basemap (neighbours and sea) or only the mapped area, on white.

Point a camera at it to open this page.

How to cite

Cerejo, L. N. (2026). Rebanhos: três rebanhos, três geografias [Livestock: Three herds, three geographies] (Version 1.0.0) [Data set]. Zenodo. https://doi.org/10.5281/zenodo.23506048

No. 030 Land use Bioenergy in São Paulo 3/4

Sugarcane

A green sea over a fifth of the state

Fig. 030 São Paulo state (SP) EPSG:4674 Source: IBGE

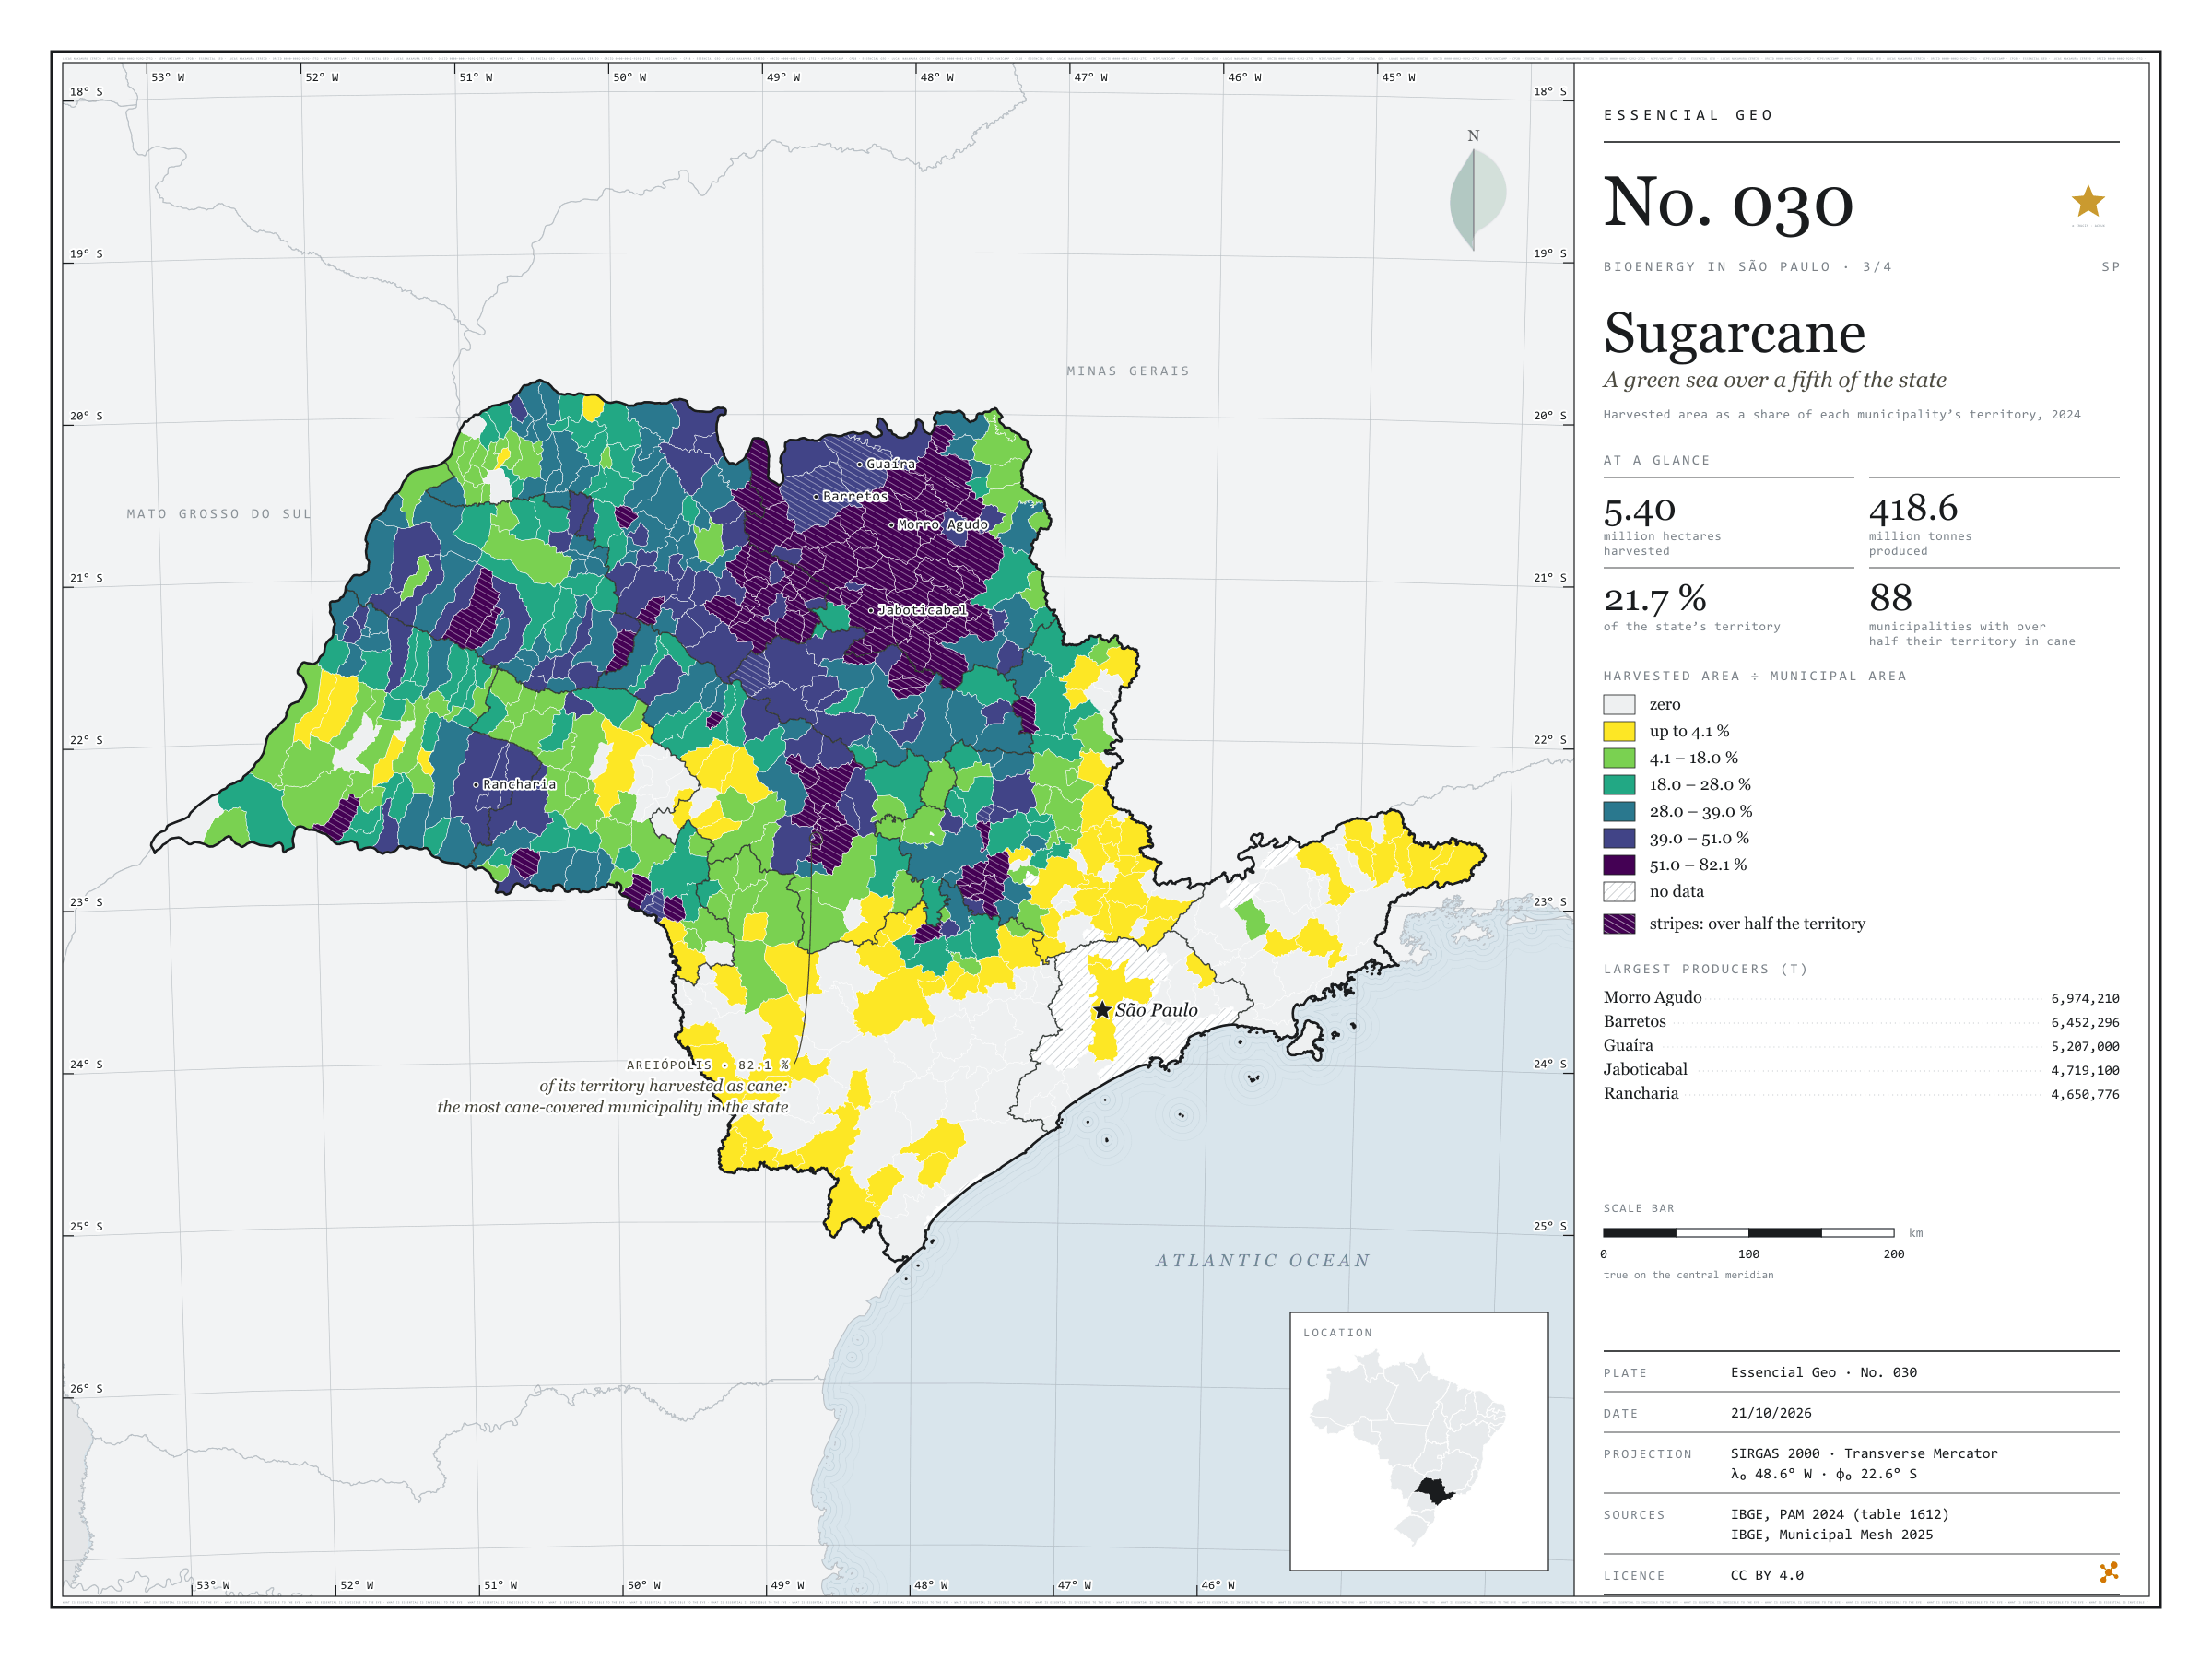
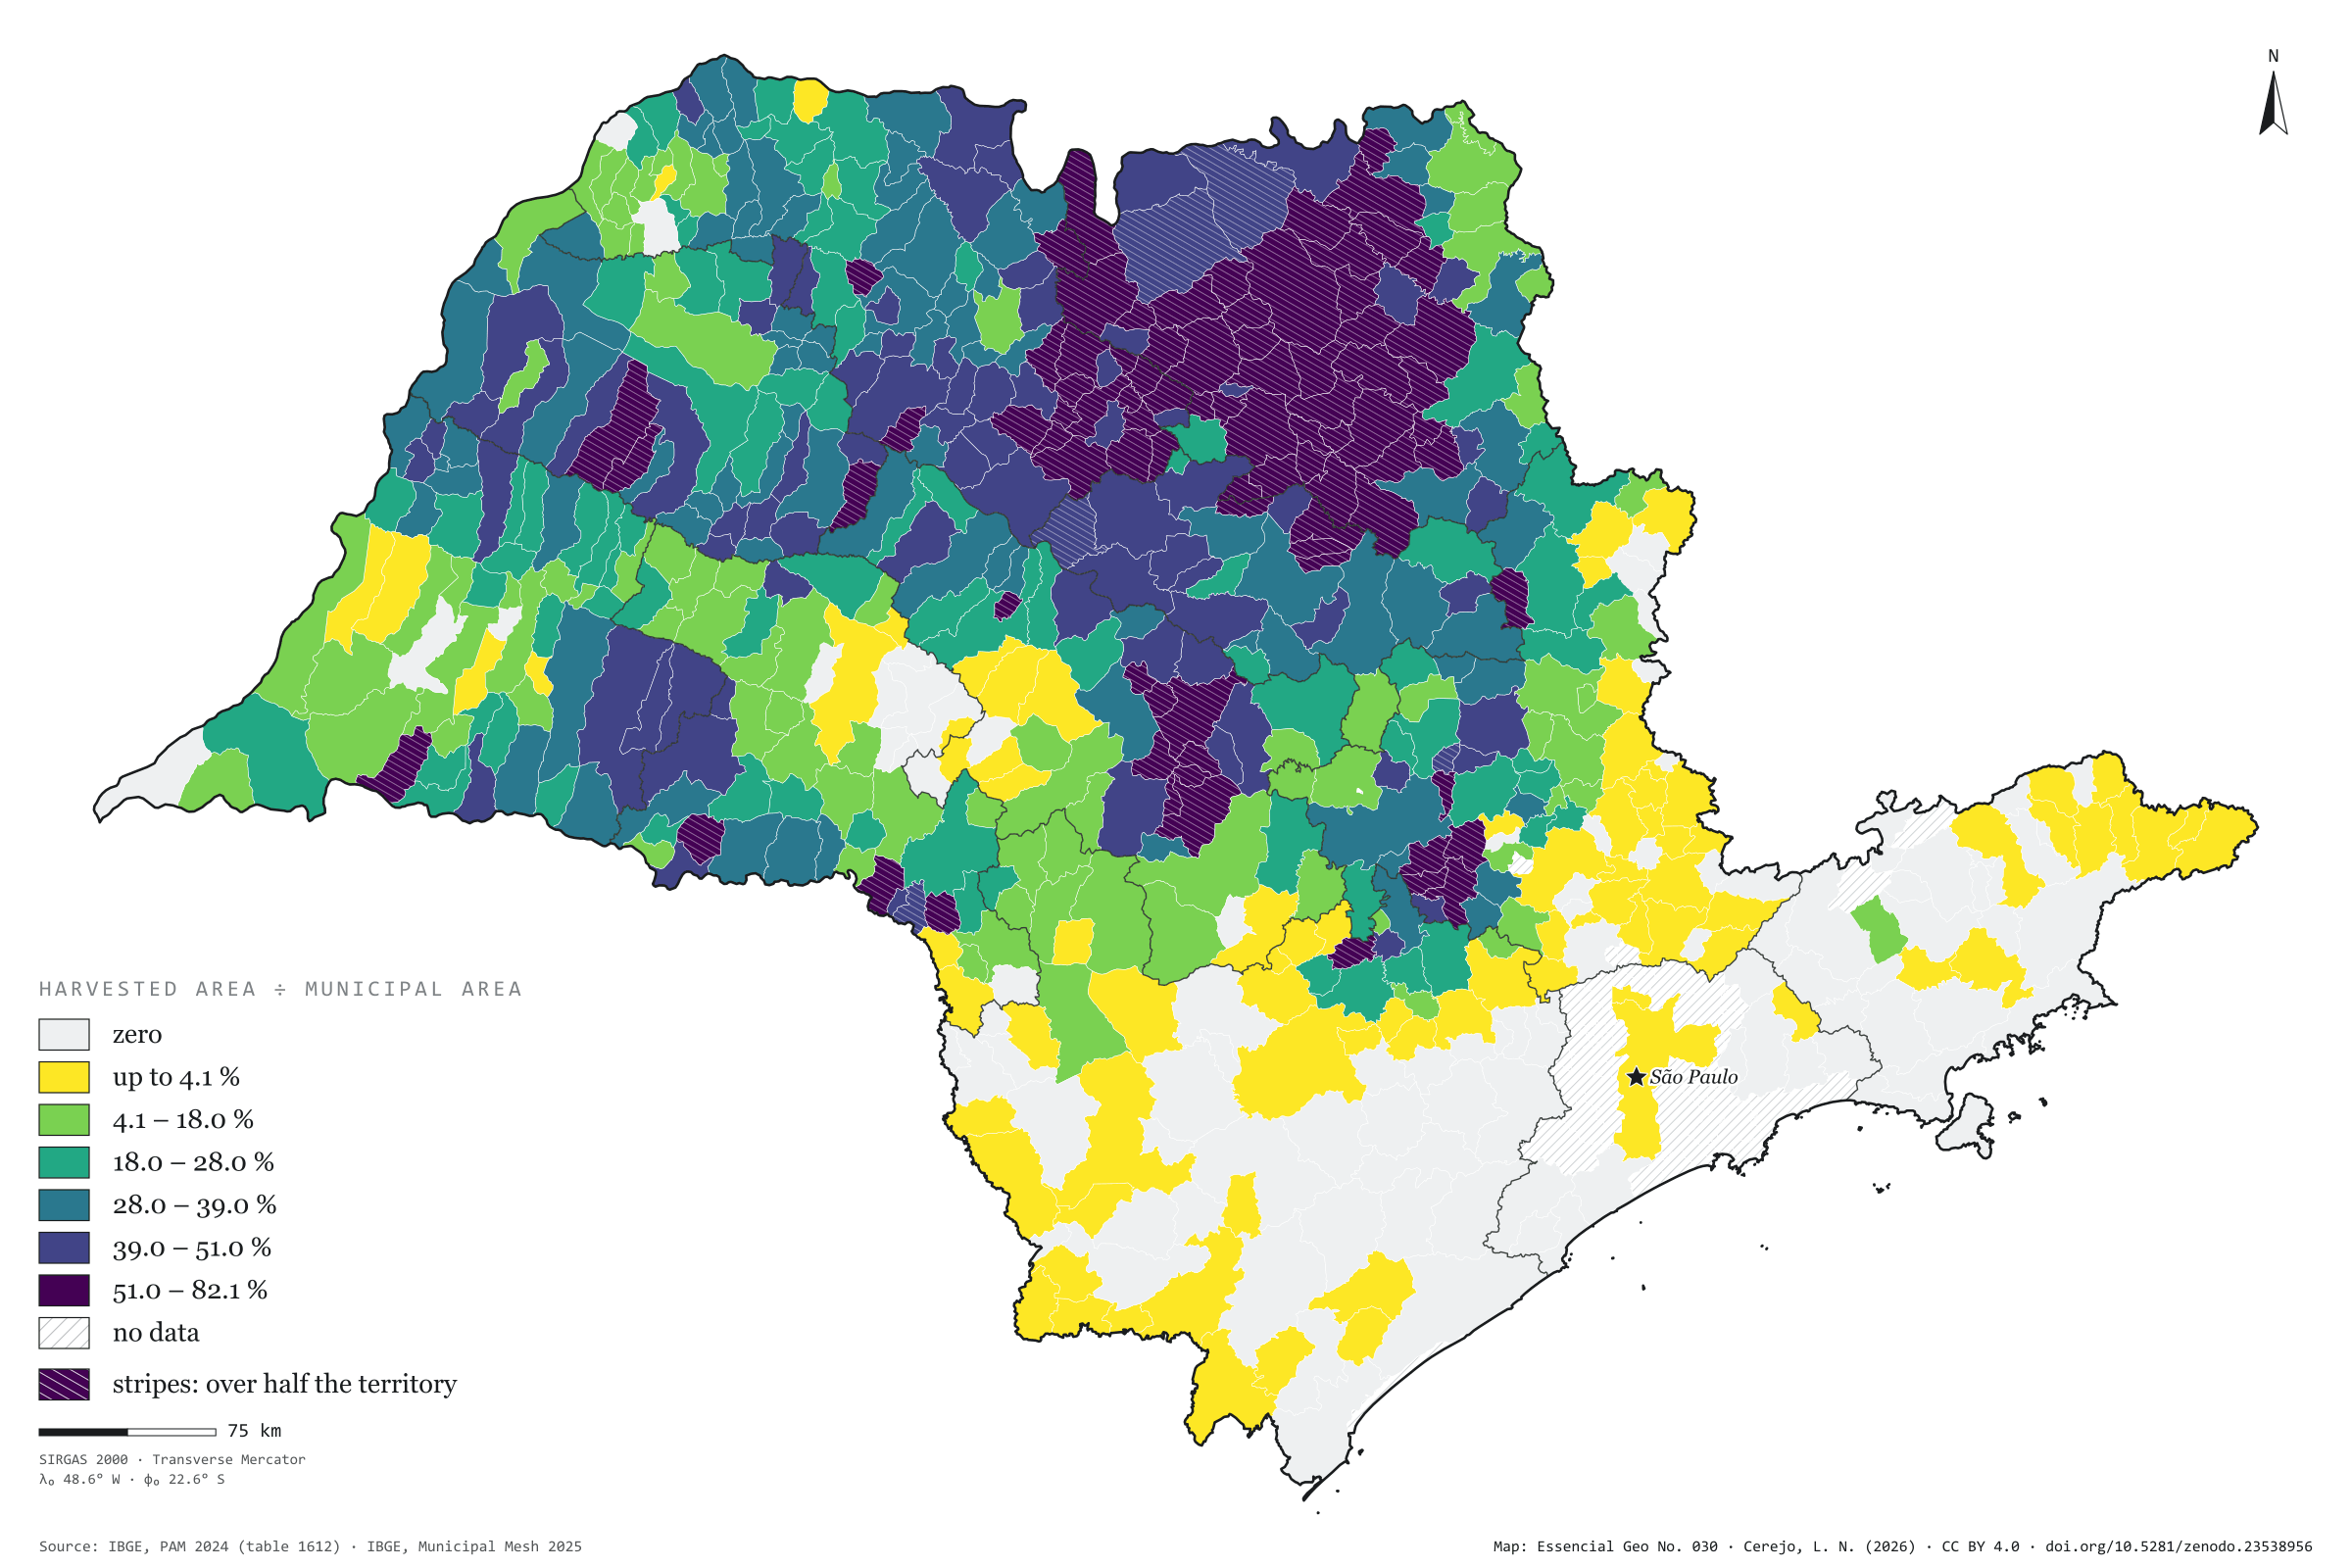
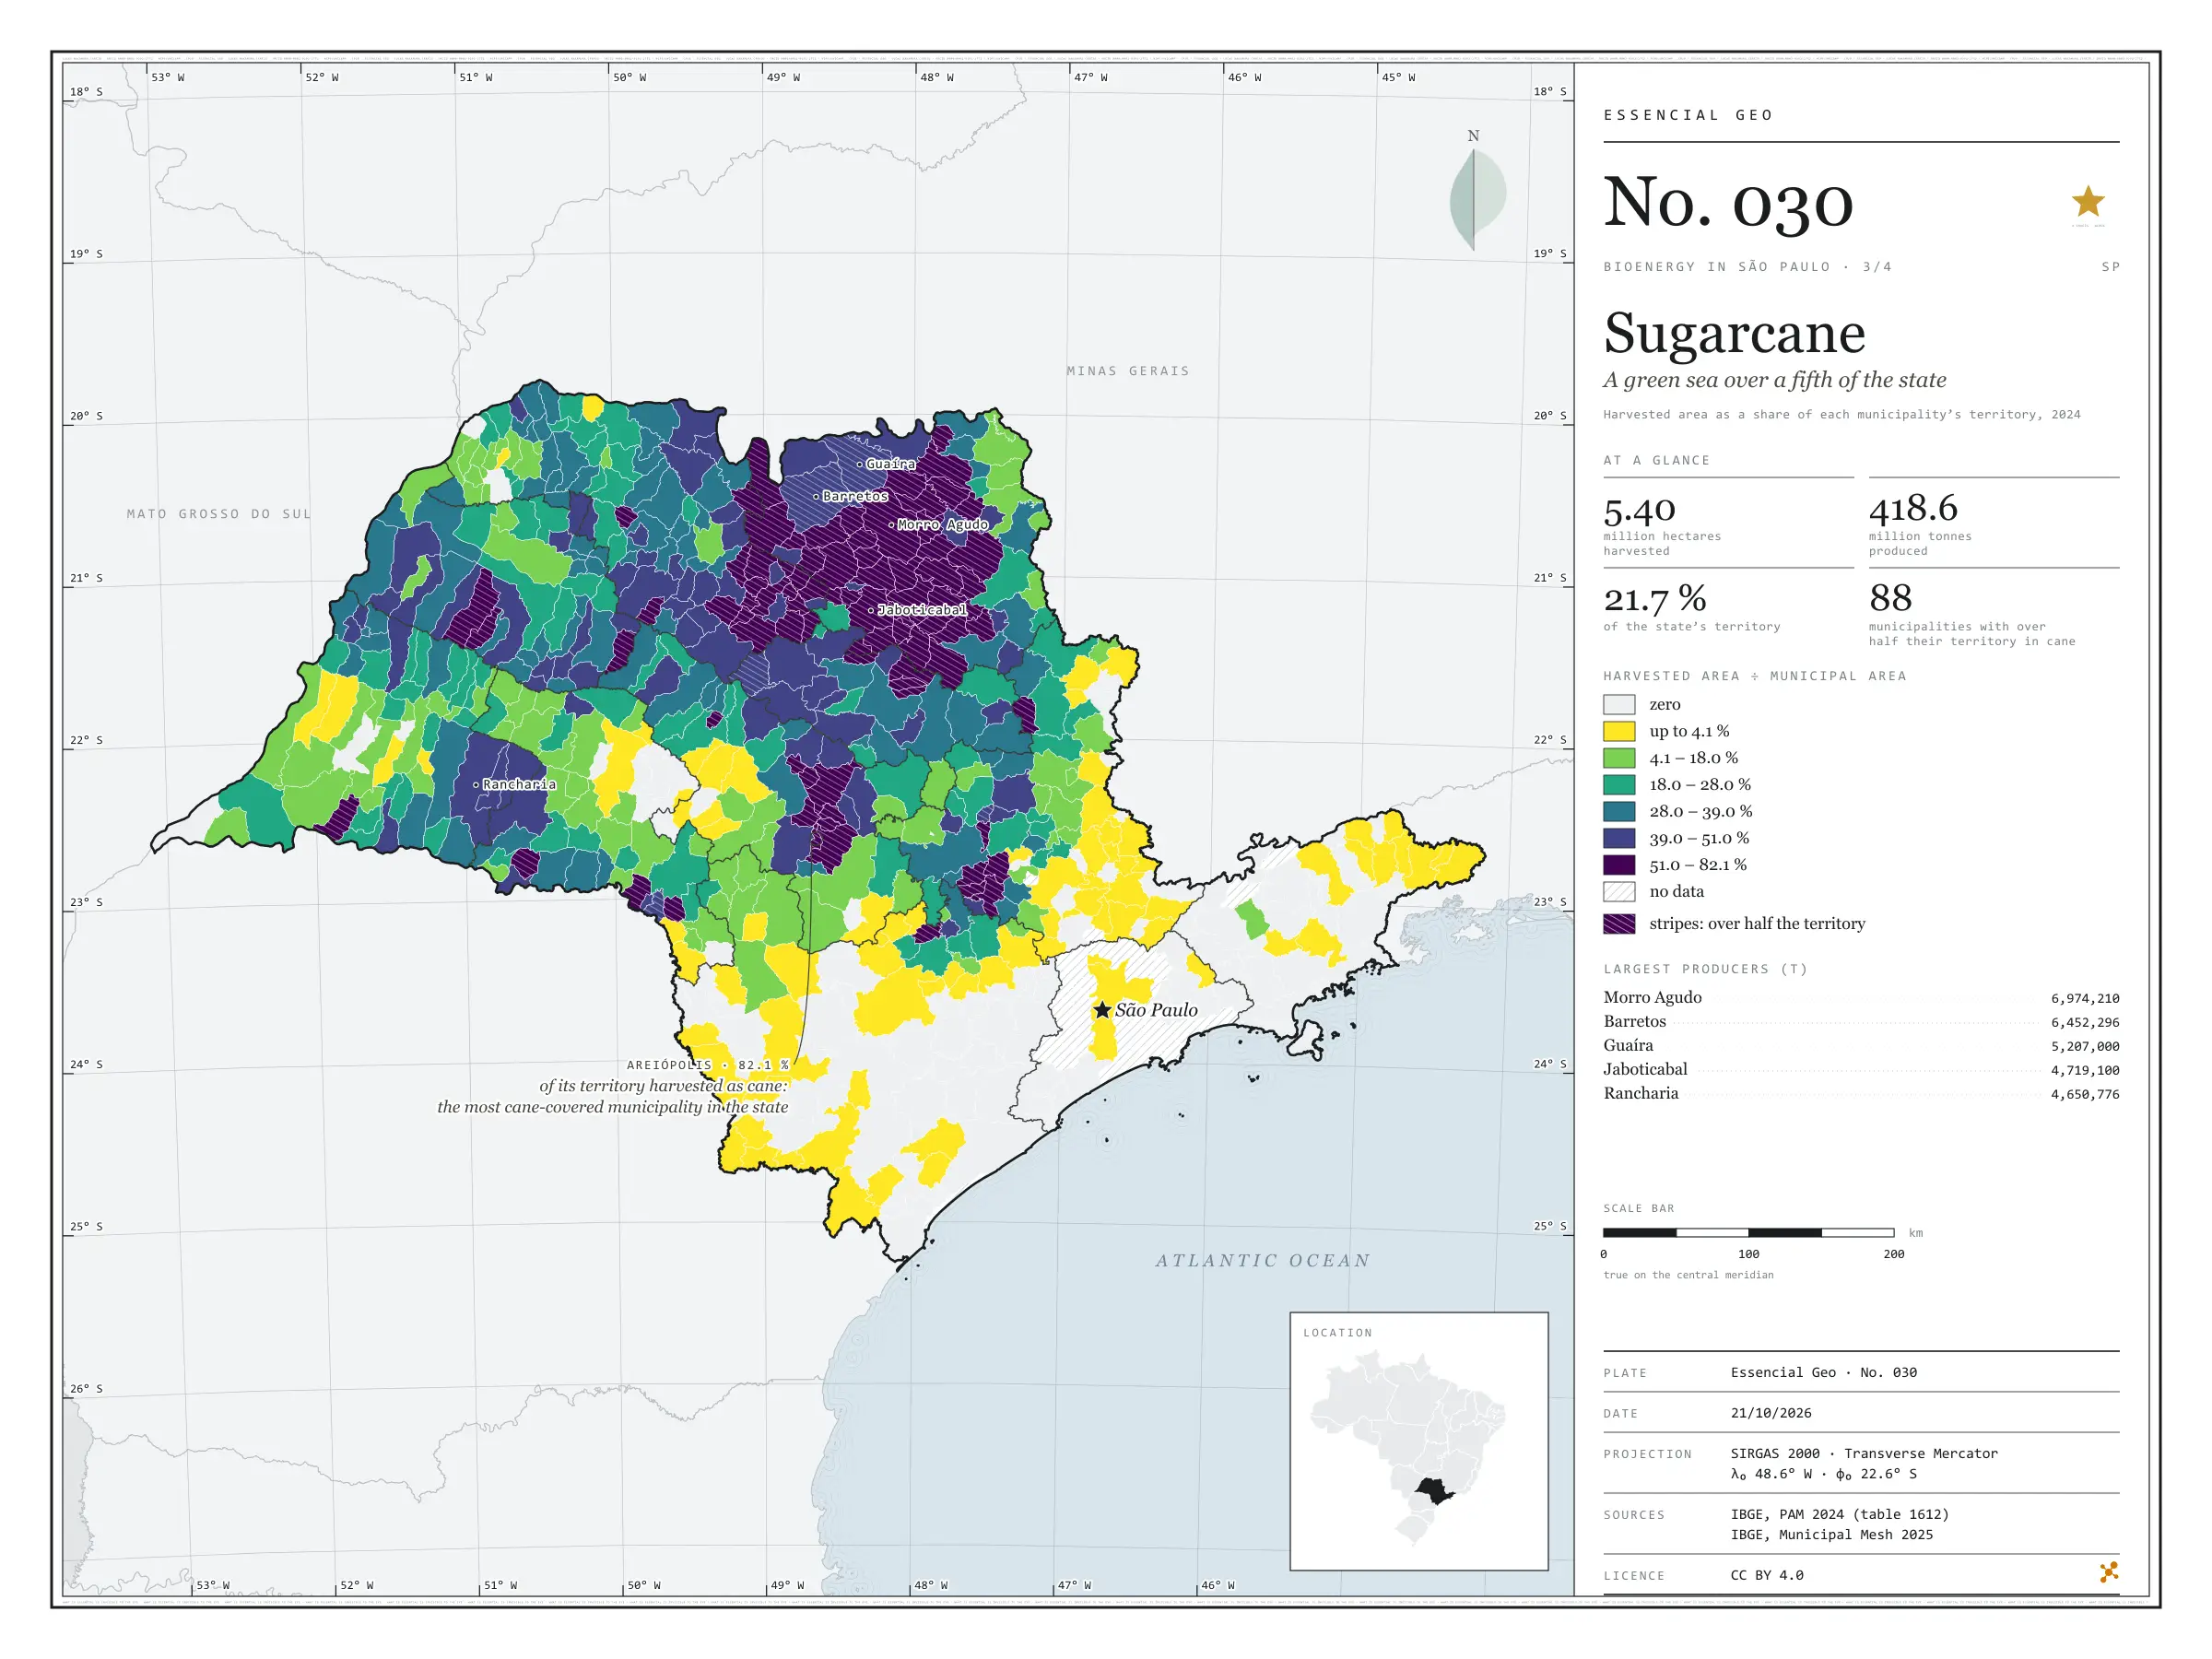
In 2024, São Paulo’s cane fields were harvested over 5.40 million hectares, 21.7% of the state, and yielded 418.6 million tonnes of cane. In 88 municipalities the harvested area exceeds half the territory; in Areiópolis it reaches 82%, and in Jaboticabal 81%. The map shows the dark patch that covers the north and centre of the state and has Morro Agudo as its largest producer (7.0 million tonnes), and it shows where the patch ends: in the Paraíba valley, the Ribeira valley and Greater São Paulo, cane all but disappears. Every tonne harvested leaves bagasse and straw, and every litre of ethanol leaves vinasse; this is the map São Paulo’s bioenergy rests on. Third plate of the collection “Bioenergy in São Paulo”.

Technical record · downloads · citation

At a glance

Harvested area

5,398,676 ha

21.7% of the state’s territory; 508 municipalities with harvested cane

Production

418,569,112 t

In 88 municipalities, harvested cane covers more than half the territory

Largest producers (t)
  • Morro Agudo 6,974,210
  • Barretos 6,452,296
  • Guaíra 5,207,000
  • Jaboticabal 4,719,100
  • Rancharia 4,650,776

Layers

  • municipios polygon 645 municipalities: harvested area (ha), production (t), share of territory (%) and yield (t/ha)
  • regioes_intermediarias polygon 11 intermediate geographic regions
  • limite_estadual polygon State boundary

Metadata

Extent
São Paulo state (SP)
CRS / Projection
SIRGAS 2000 (EPSG:4674)
EPSG:4674
Software
Python · GeoPandas · GDAL · QGIS · Node.js · d3-geo
Method
Harvested area and production of sugarcane from PAM 2024 joined to the Municipal Mesh by IBGE code; harvested area divided by municipal area, in six quantile classes.
Version
v1.0.0
Licence
CC BY 4.0

Downloads

Figure to reuse

The map without a frame, with legend, scale, reference system and credit written on it: ready for papers, lectures and slides. In two versions: with the basemap (neighbours and sea) or only the mapped area, on white.

Point a camera at it to open this page.

How to cite

Cerejo, L. N. (2026). Cana-de-açúcar: um mar verde sobre um quinto do estado [Sugarcane: A green sea over a fifth of the state] (Version 1.0.0) [Data set]. Zenodo. https://doi.org/10.5281/zenodo.23538956

No. 031 Energy · biomass Bioenergy in São Paulo 4/4

Mills and cane

The harvest that lights the grid

Fig. 031 São Paulo state (SP) EPSG:4674 Source: ANEEL, IBGE, EPE

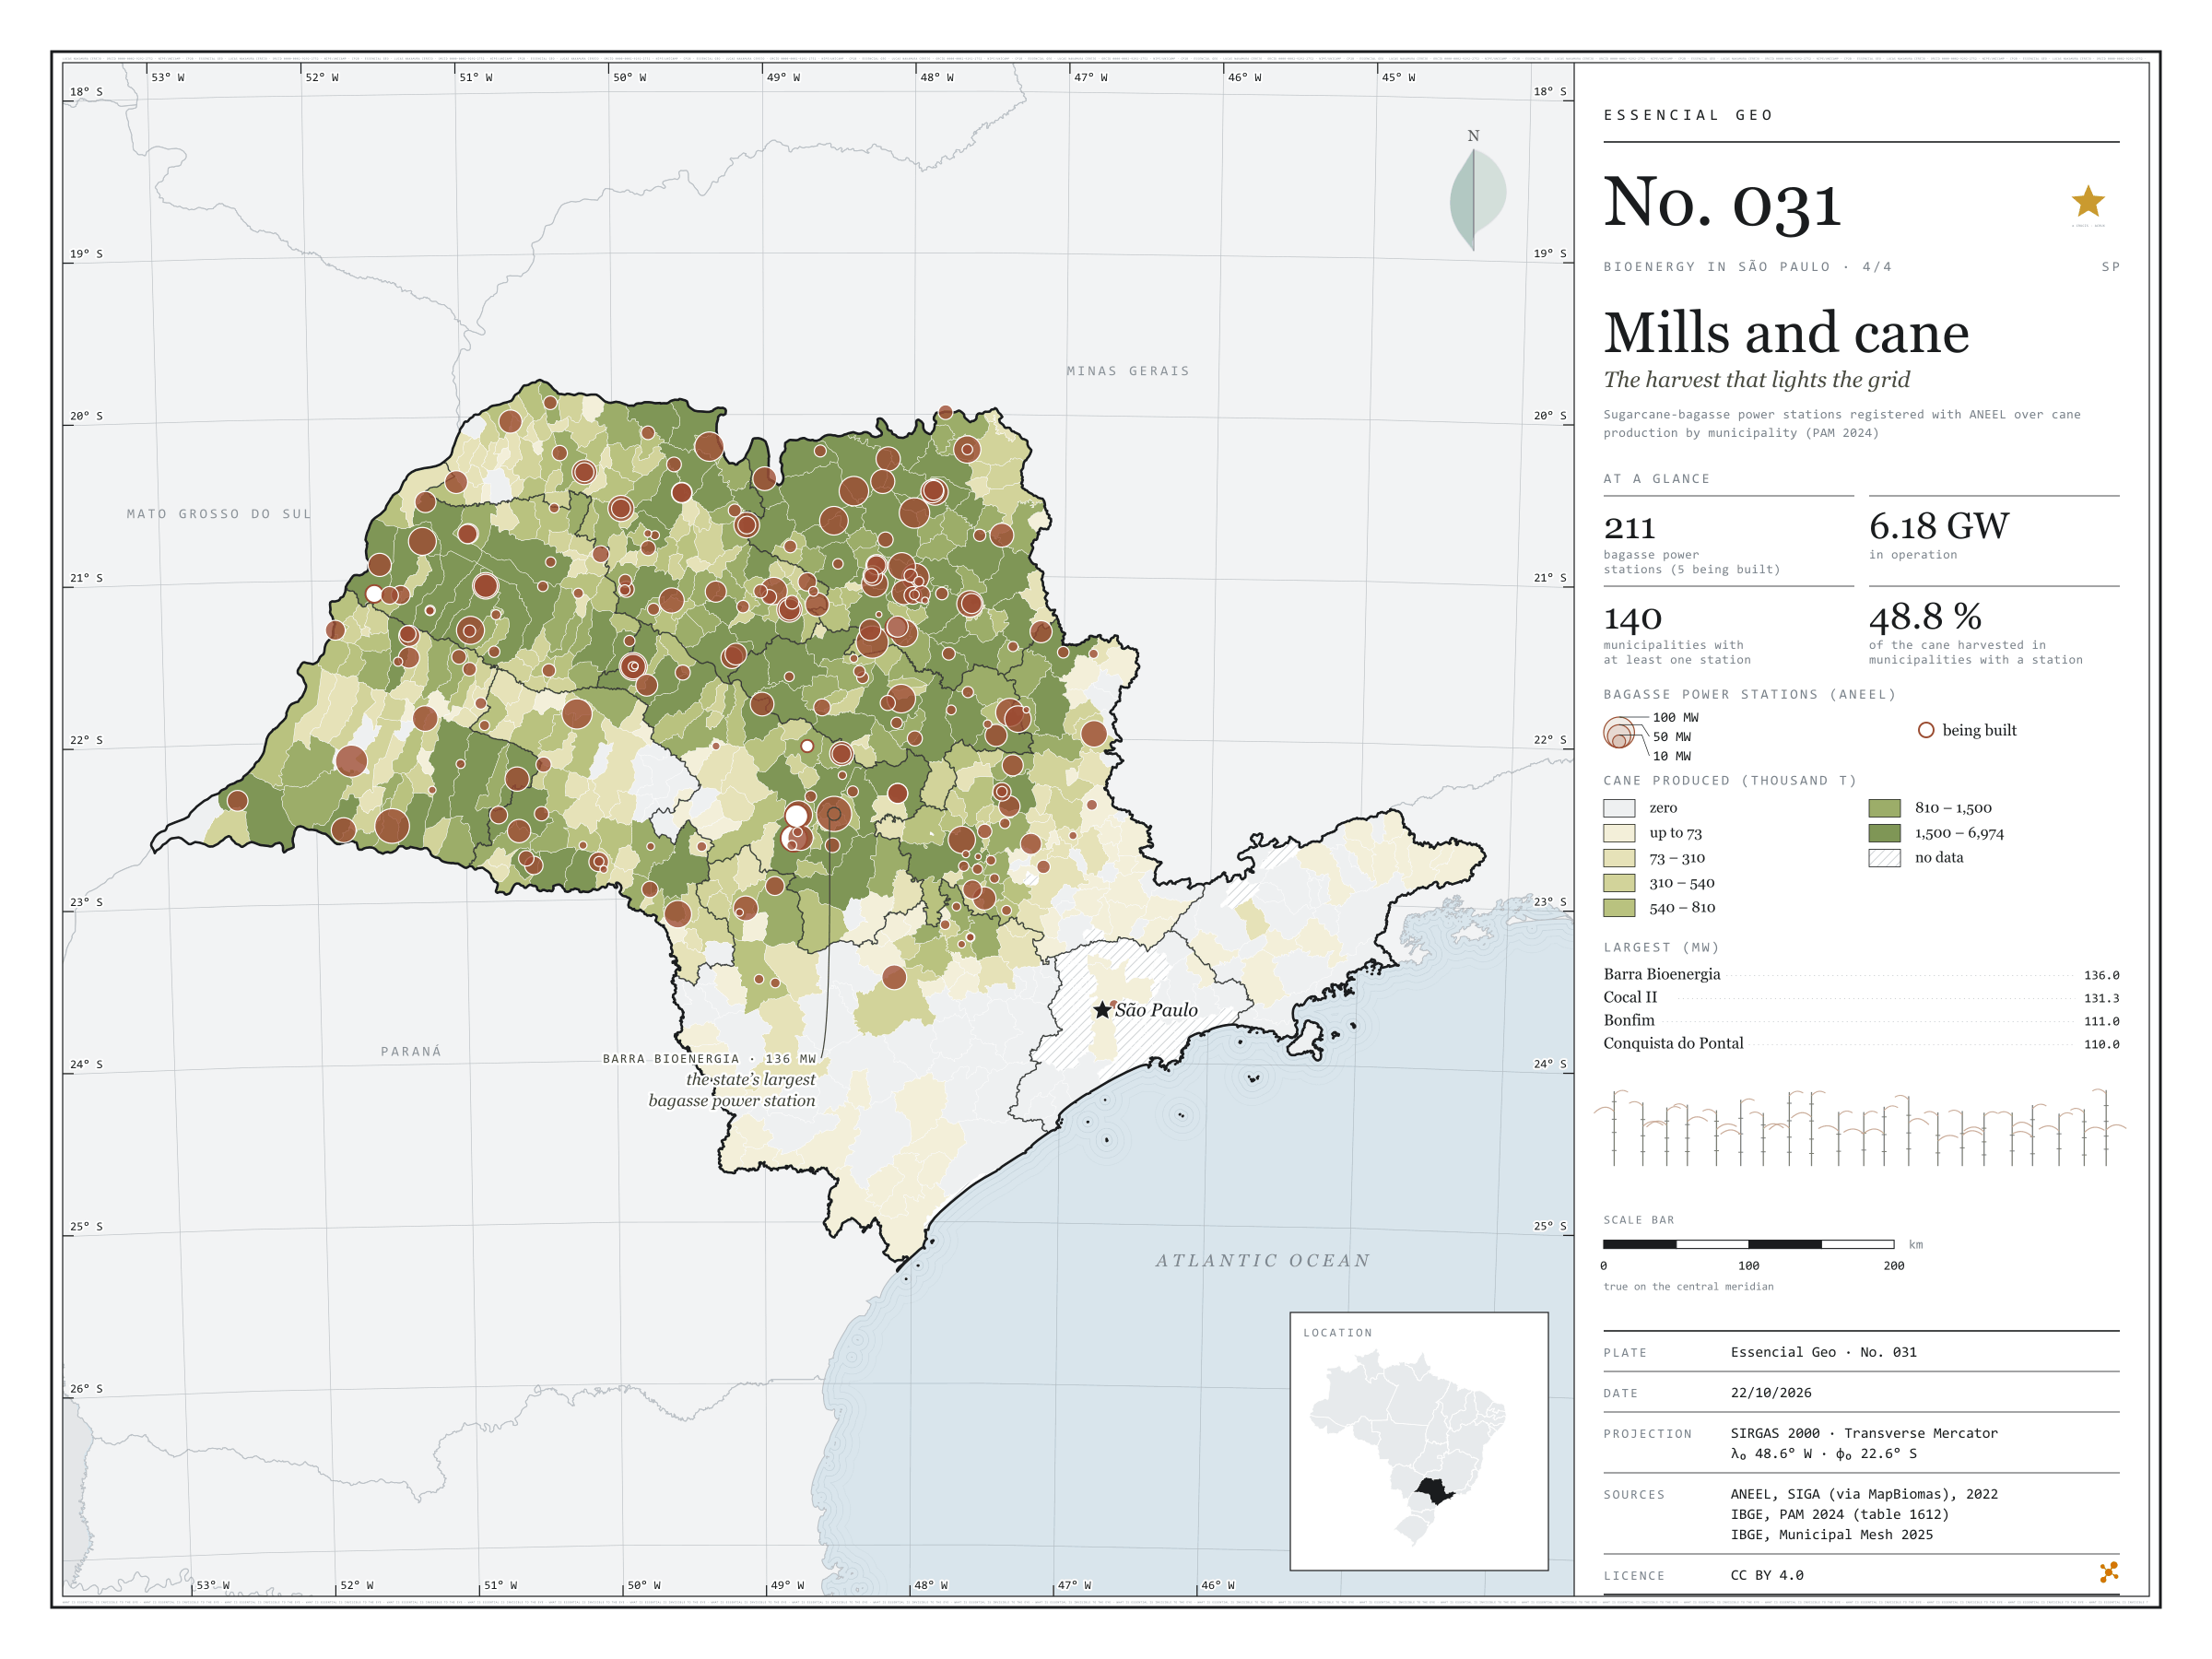
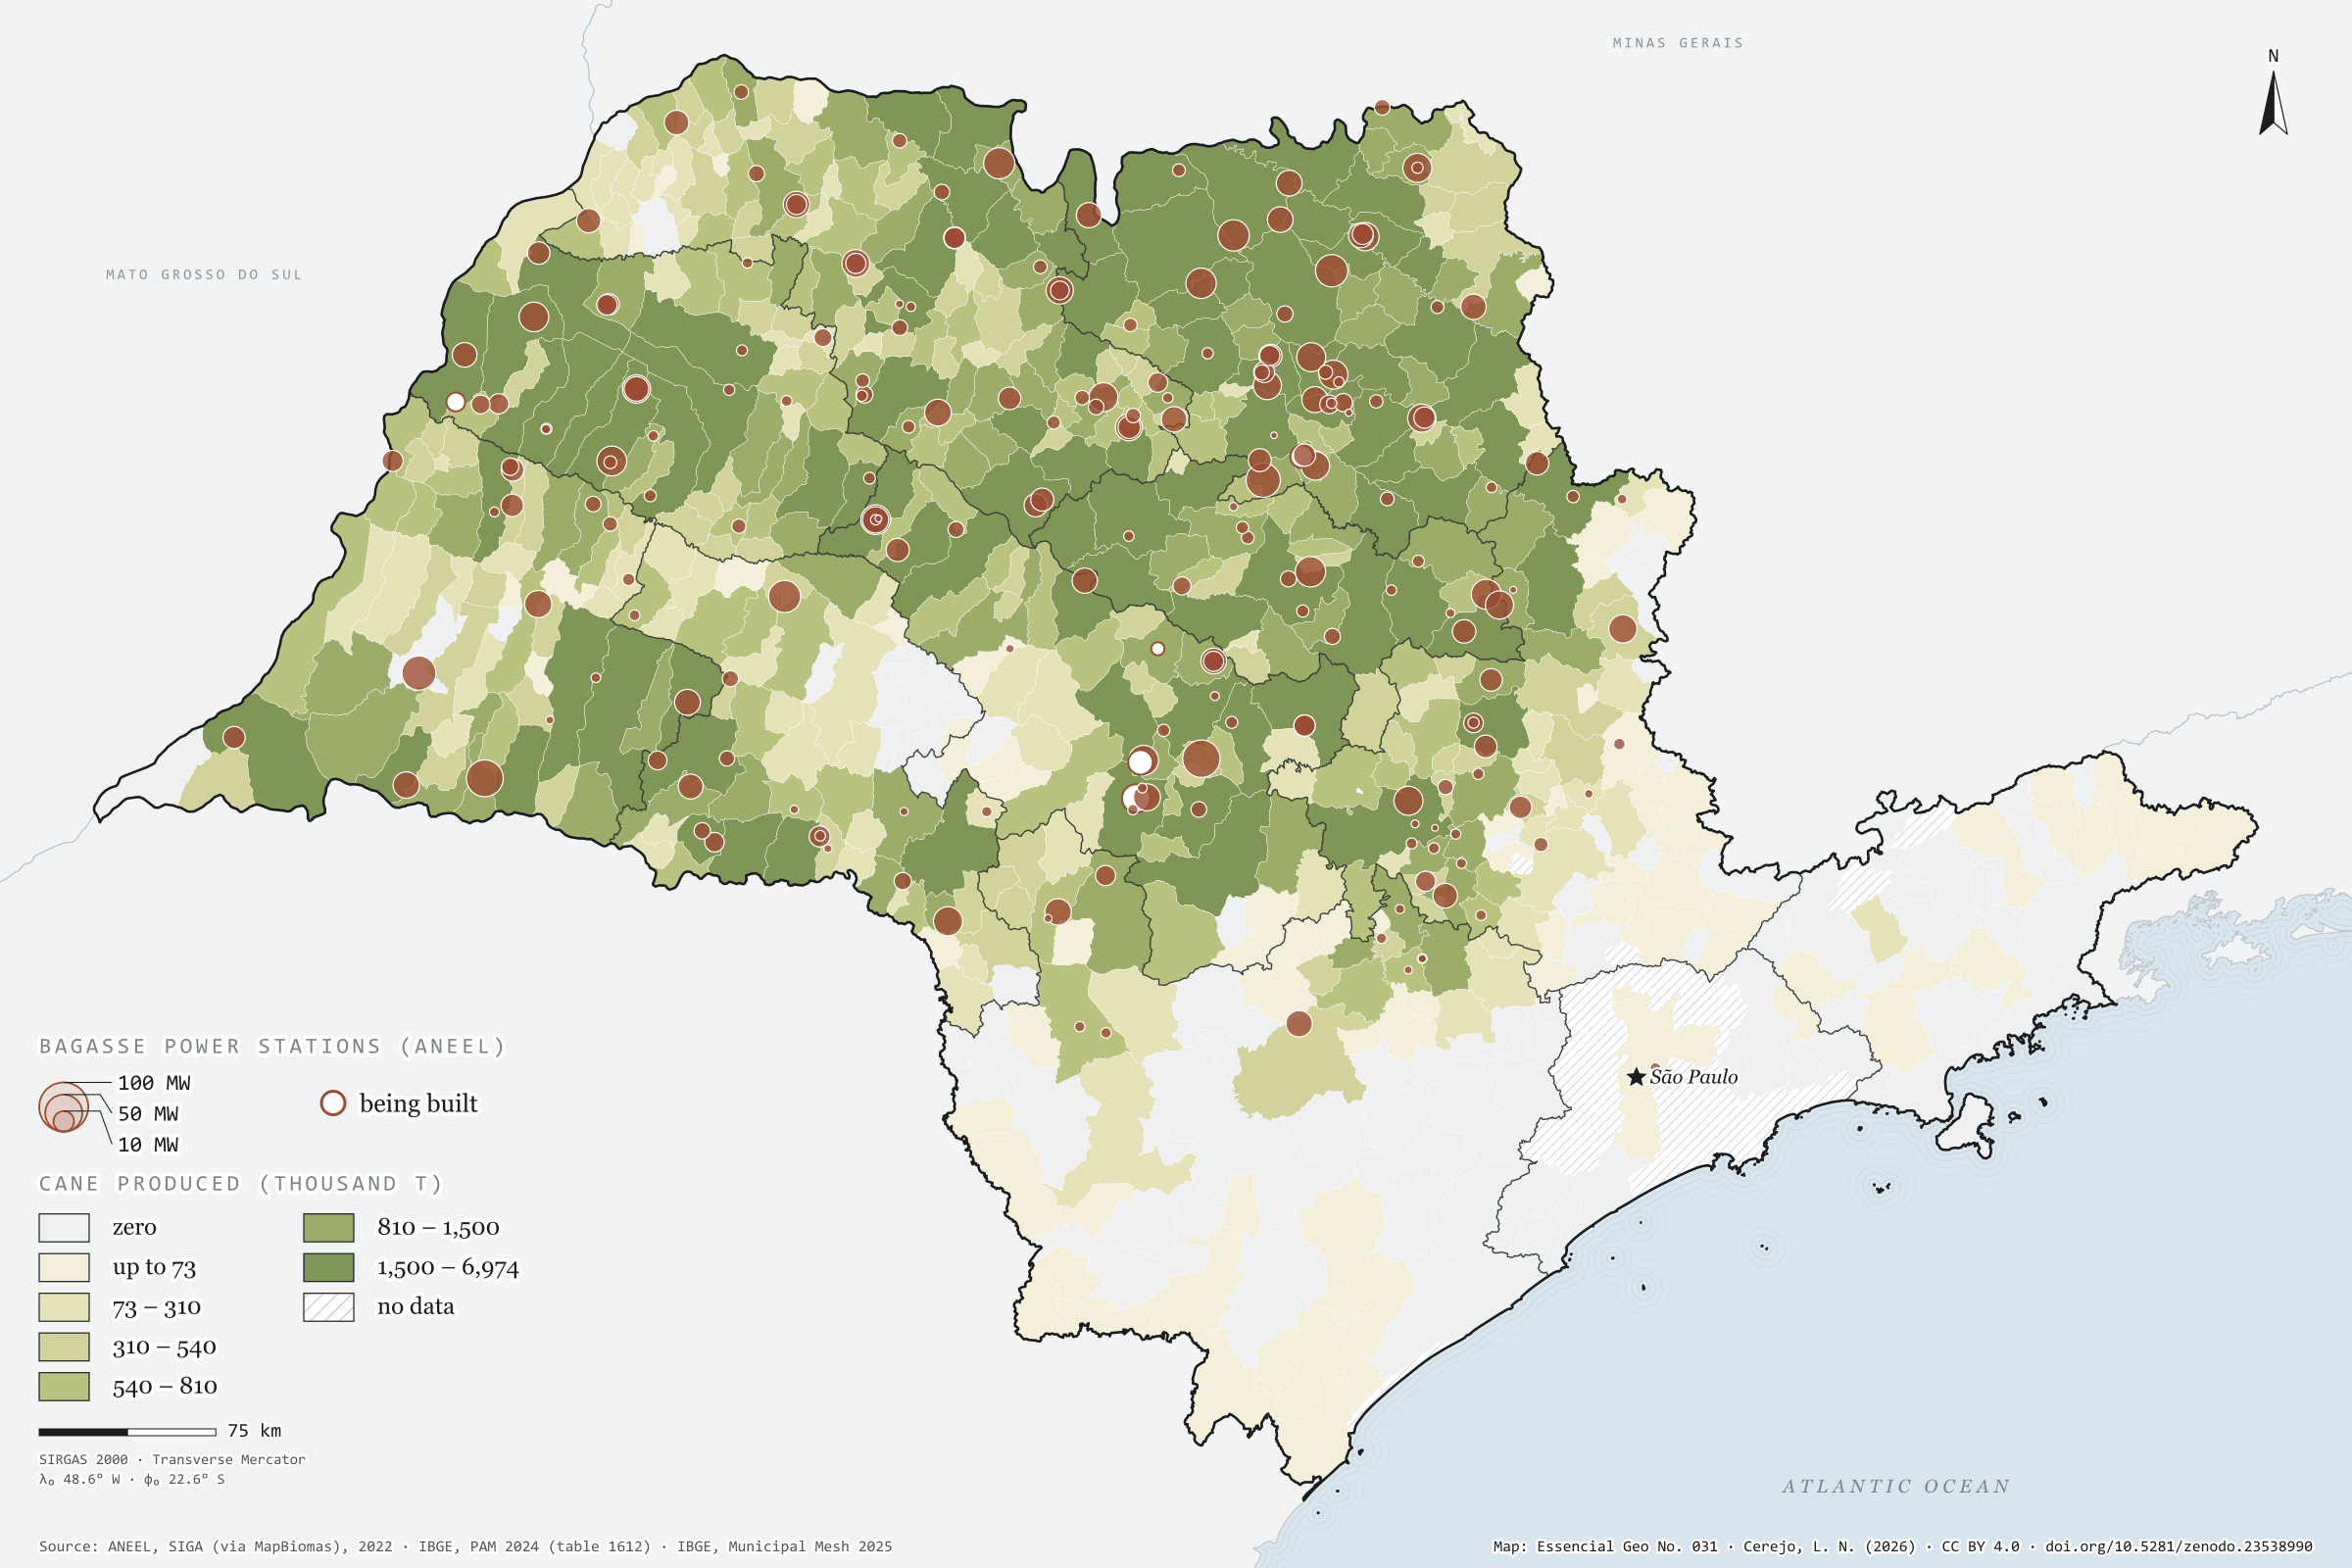
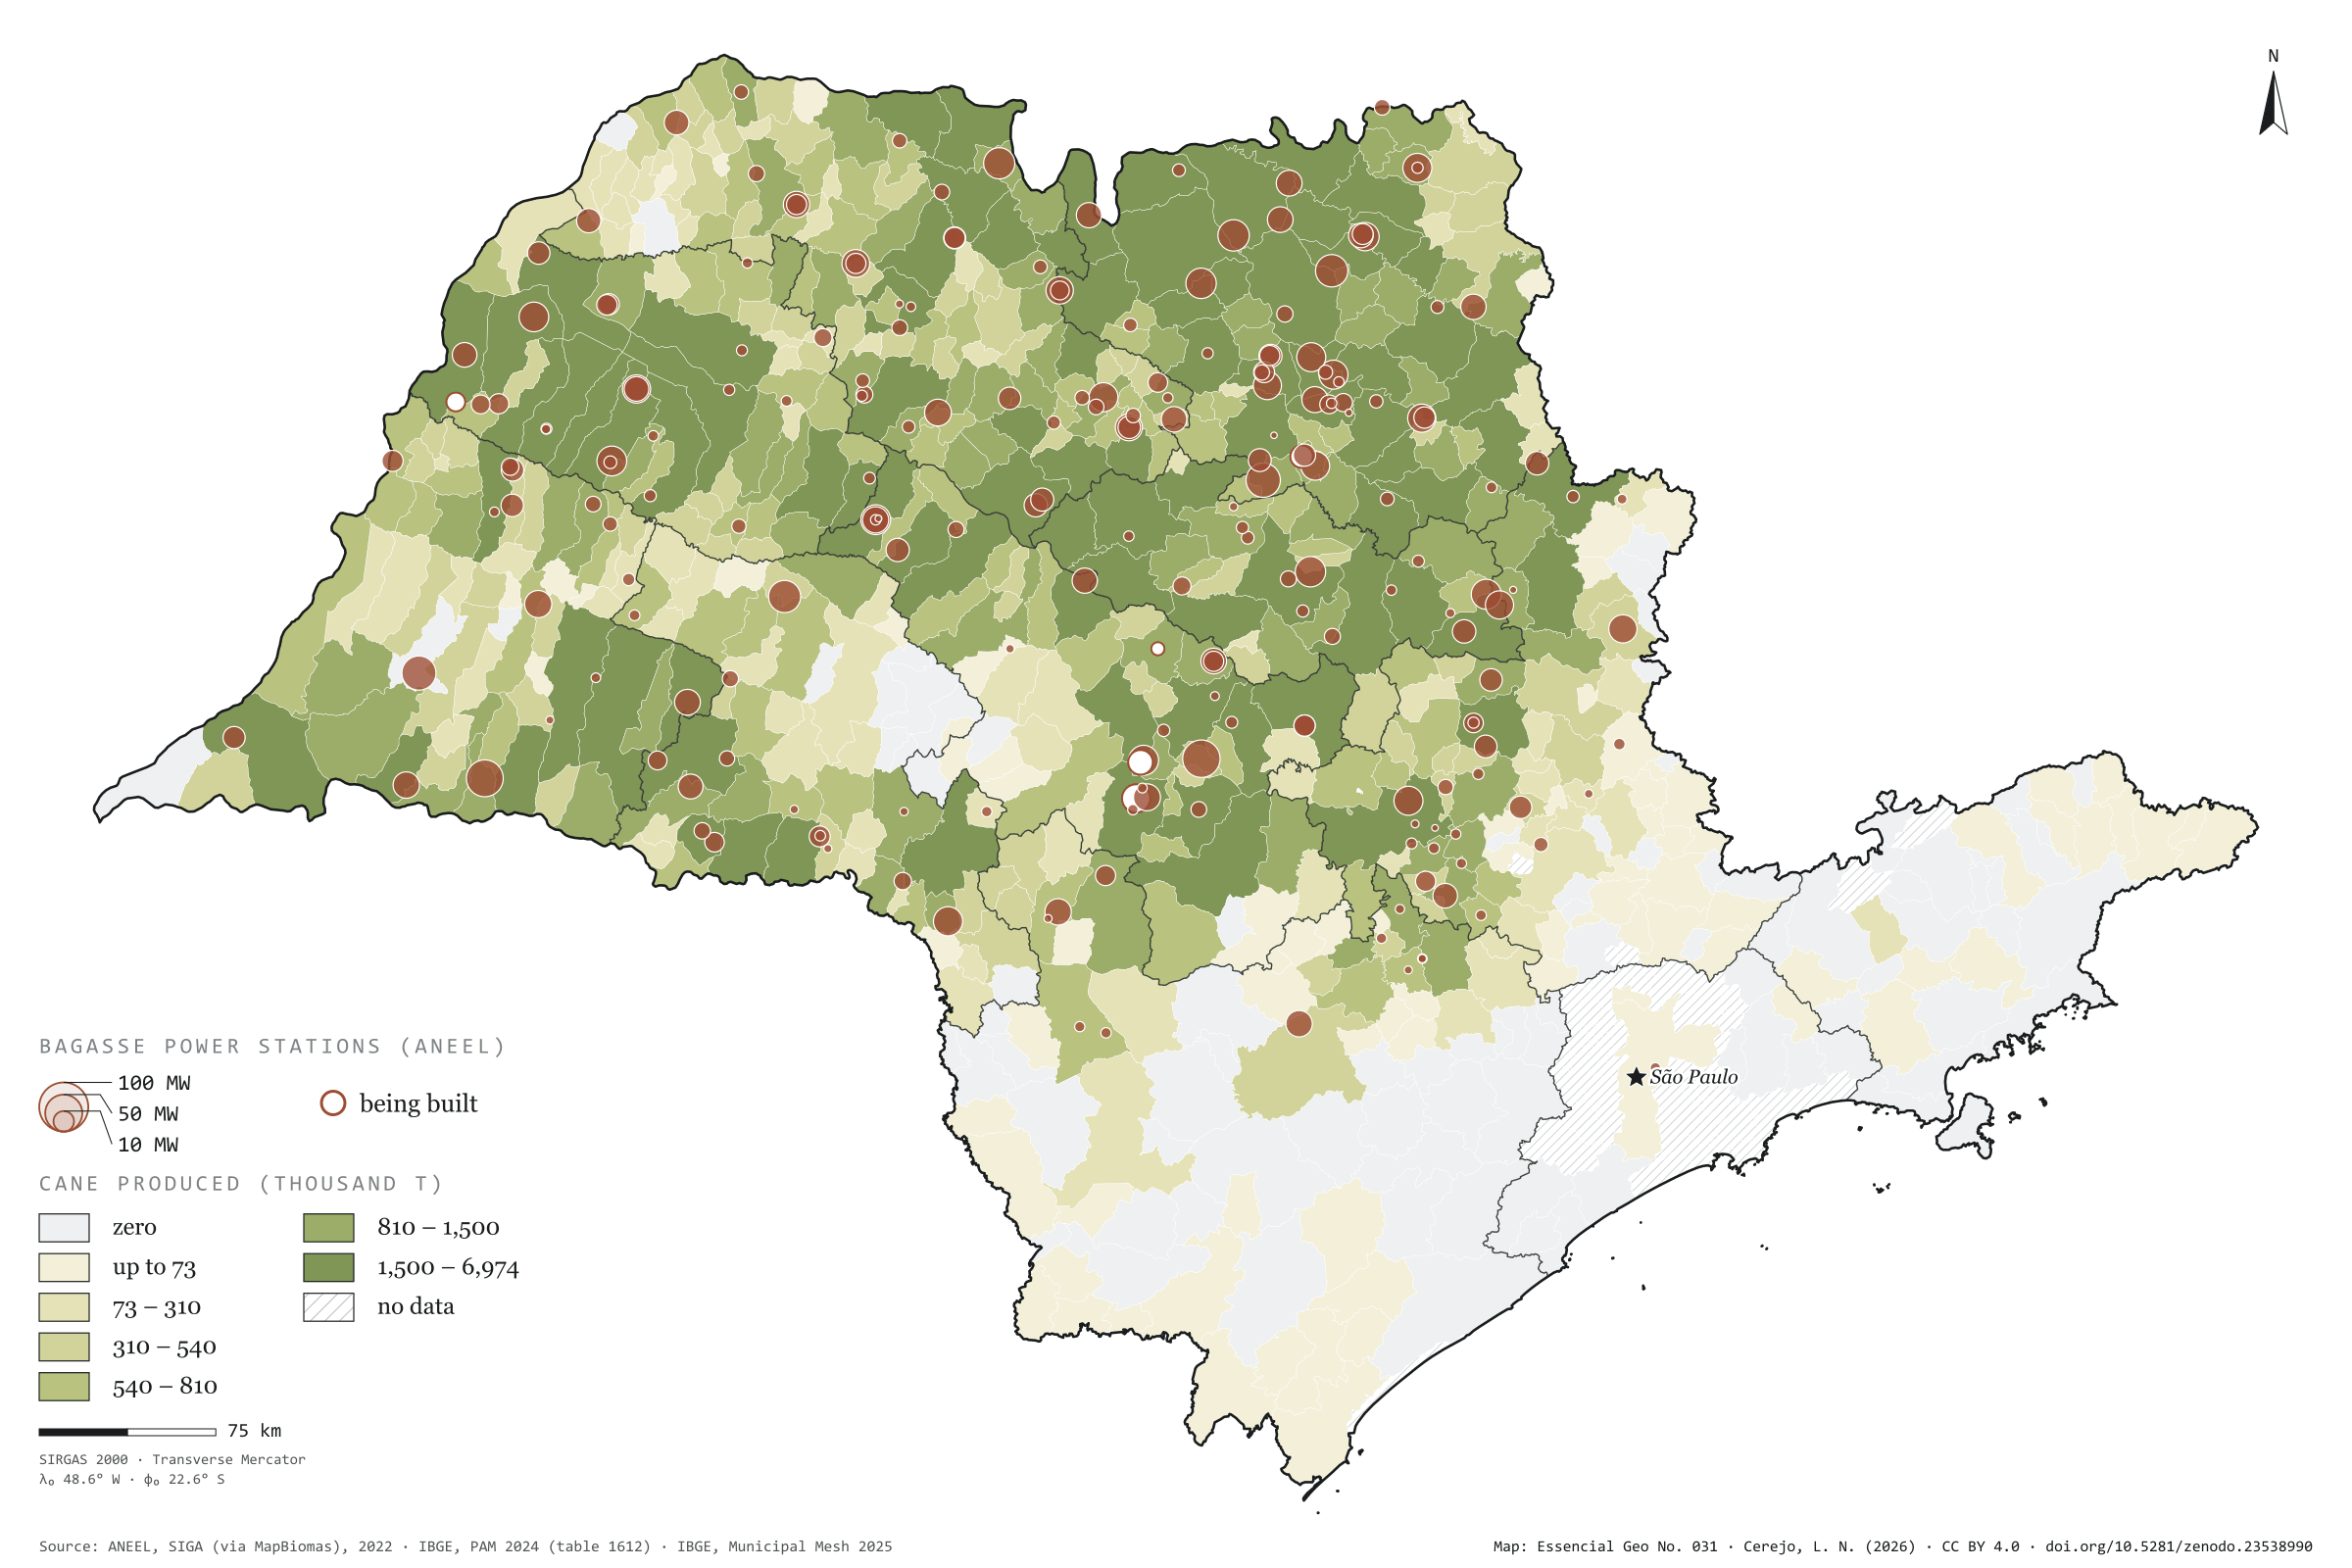
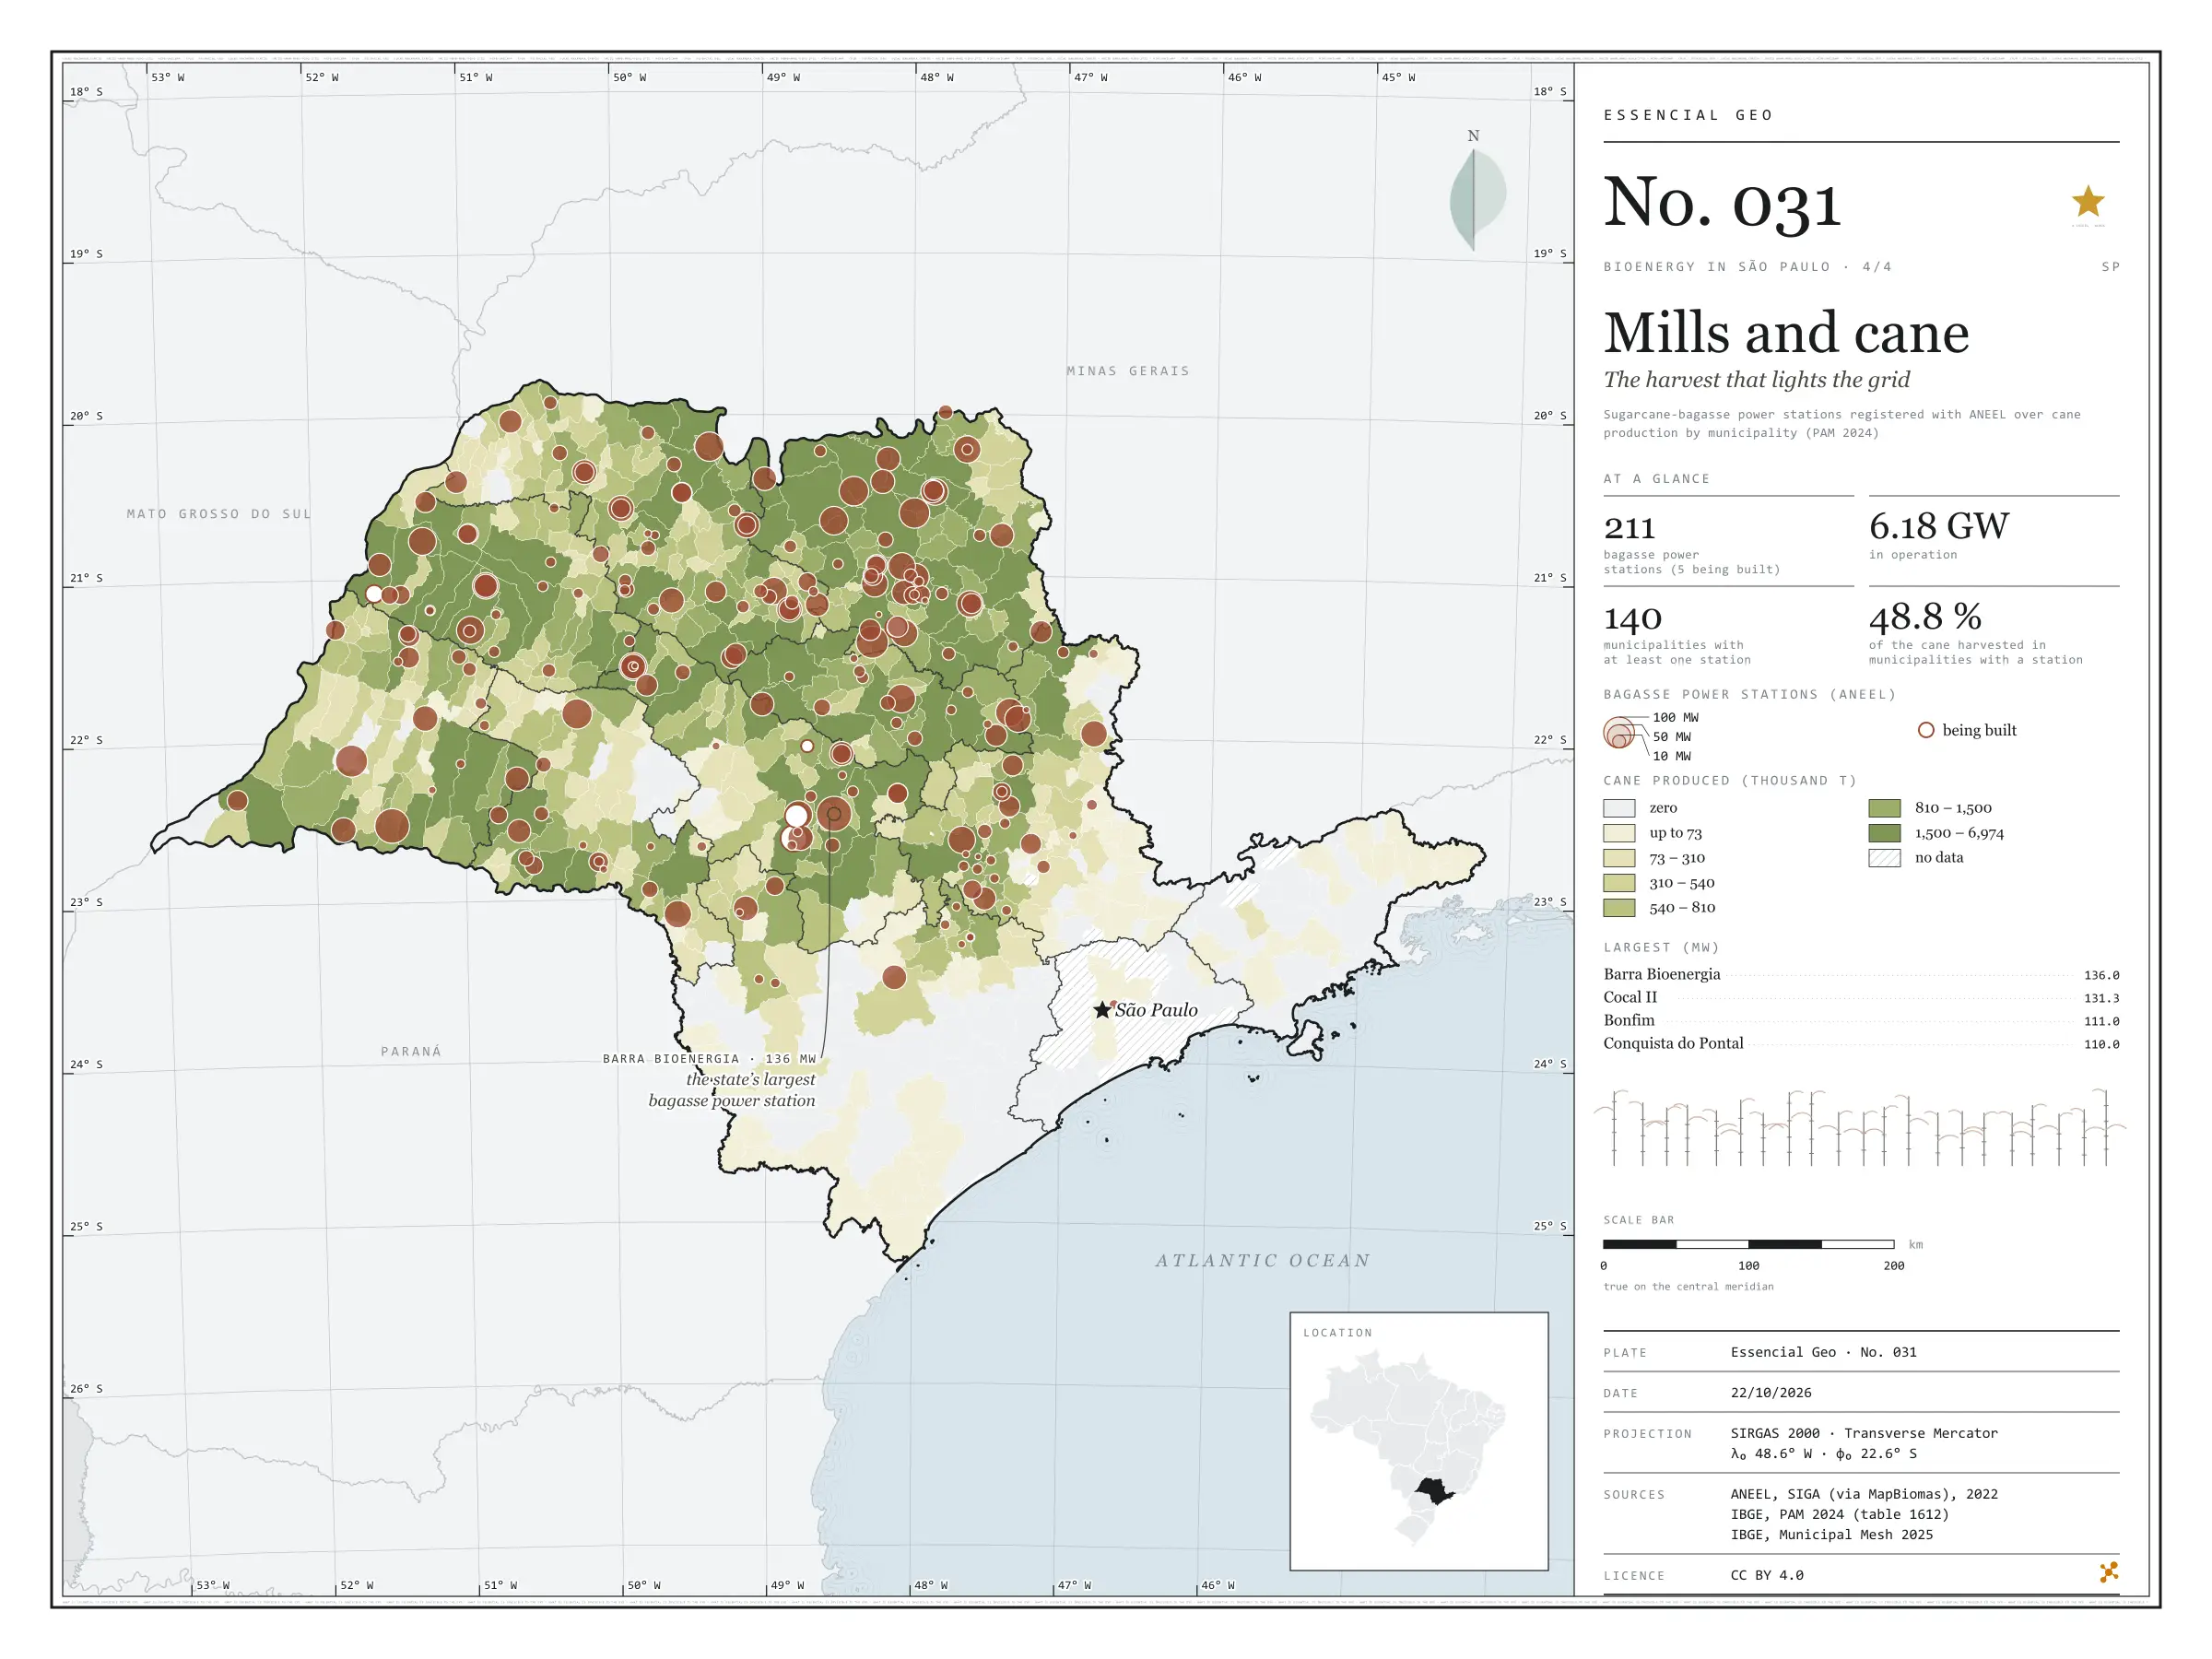
After crushing, sugarcane bagasse goes into the boiler, and the steam makes the mill’s own electricity plus a surplus for the grid. In São Paulo, 211 bagasse power stations are registered with ANEEL, 206 of them in operation, with 6.18 GW of licensed capacity; the largest, Barra Bioenergia in Barra Bonita, has 136 MW. Over the map of cane harvested in 2024, the circles show that the energy is born where the crop is: the 140 municipalities with at least one such station accounted for 48.8% of the cane harvested in the state. There, between cane field and substation, waste becomes grid. Final plate of the collection “Bioenergy in São Paulo”.

Technical record · downloads · citation

At a glance

Bagasse capacity in operation

6,179 MW

206 stations in operation and 5 being built

Largest bagasse power stations (MW)
  • Barra Bioenergia 136
  • Cocal II 131
  • Bonfim 111
  • Conquista do Pontal 110
  • Vale do Rosário 97
Cane in municipalities with a station

49 %

140 municipalities with at least one bagasse power station

Layers

  • ute_bagaco point 211 sugarcane-bagasse power stations: phase, capacity (kW), start of operations
  • usinas_epe_2018 point 161 sugar-energy mills from the EPE WebMap 2018: type, crushing class, ethanol capacity
  • municipios polygon 645 municipalities: cane production (t), number and capacity of power stations
  • regioes_intermediarias polygon 11 intermediate geographic regions
  • limite_estadual polygon State boundary

Metadata

Extent
São Paulo state (SP)
CRS / Projection
SIRGAS 2000 (EPSG:4674)
EPSG:4674
Software
Python · GeoPandas · GDAL · QGIS · Node.js · d3-geo
Method
SIGA bagasse power stations, by licensed capacity, over PAM 2024 cane production by municipality, in six quantile classes.
Version
v1.0.0
Licence
CC BY 4.0

Downloads

Figure to reuse

The map without a frame, with legend, scale, reference system and credit written on it: ready for papers, lectures and slides. In two versions: with the basemap (neighbours and sea) or only the mapped area, on white.

Point a camera at it to open this page.

How to cite

Cerejo, L. N. (2026). Usinas e cana: a colheita que acende a rede [Mills and cane: The harvest that lights the grid] (Version 1.0.0) [Data set]. Zenodo. https://doi.org/10.5281/zenodo.23538990

Technical record

Technical record · No. 028

Biogas plants

At a glance

Biogas plants by waste source (plants)
  • Farming 24
  • Industry 14
  • Landfill or sewage 13
Biogas power stations (ANEEL)

108 MW

13 stations; the largest is Termoverde Caieiras (29.5 MW)

Layers

  • usinas_biogas point 51 biogas plants: category, main use, status, scale and start of operations
  • ute_biogas point 13 biogas power stations registered with ANEEL, with capacity (kW)
  • municipios polygon 645 municipalities, with the number of plants and biogas capacity
  • regioes_intermediarias polygon 11 intermediate geographic regions
  • limite_estadual polygon State boundary

Metadata

Extent
São Paulo state (SP)
CRS / Projection
SIRGAS 2000 (EPSG:4674)
EPSG:4674
Software
Python · GeoPandas · GDAL · QGIS · Node.js · d3-geo
Method
MapBiomas biogas plants and SIGA biogas power stations clipped to São Paulo state and assigned to municipalities by spatial join.
Version
v1.0.0
Licence
CC BY 4.0

Downloads

Figure to reuse

The map without a frame, with legend, scale, reference system and credit written on it: ready for papers, lectures and slides. In two versions: with the basemap (neighbours and sea) or only the mapped area, on white.

Point a camera at it to open this page.

How to cite

Cerejo, L. N. (2026). Usinas de biogás: onde o lixo e o esterco viram luz [Biogas plants: Where rubbish and manure become light] (Version 1.0.0) [Data set]. Zenodo. https://doi.org/10.5281/zenodo.23482137

Data and plates under CC BY 4.0: use them in commercial drawings and papers, citing the source.

100%