Mills and cane
The harvest that lights the grid
Record, downloads and citationAfter crushing, sugarcane bagasse goes into the boiler, and the steam makes the mill’s own electricity plus a surplus for the grid. In São Paulo, 211 bagasse power stations are registered with ANEEL, 206 of them in operation, with 6.18 GW of licensed capacity; the largest, Barra Bioenergia in Barra Bonita, has 136 MW. Over the map of cane harvested in 2024, the circles show that the energy is born where the crop is: the 140 municipalities with at least one such station accounted for 48.8% of the cane harvested in the state. There, between cane field and substation, waste becomes grid. Final plate of the collection “Bioenergy in São Paulo”.
Technical record · downloads · citation
At a glance
6,179 MW
49 %
Layers
- ute_bagaco point 211 sugarcane-bagasse power stations: phase, capacity (kW), start of operations
- usinas_epe_2018 point 161 sugar-energy mills from the EPE WebMap 2018: type, crushing class, ethanol capacity
- municipios polygon 645 municipalities: cane production (t), number and capacity of power stations
- regioes_intermediarias polygon 11 intermediate geographic regions
- limite_estadual polygon State boundary
Metadata
- Sources
- ANEEL — Generation Information System (SIGA), as published in the MapBiomas infrastructure database (2022)
IBGE — Municipal Agricultural Production (PAM), table 1612 (2024)
EPE — WebMap: ethanol and sugar mills (extra GPKG layer) (2018)
IBGE — Municipal Mesh 2025 (2025) - Extent
- São Paulo state (SP)
- CRS / Projection
- SIRGAS 2000 (EPSG:4674)
EPSG:4674 - Software
- Python · GeoPandas · GDAL · QGIS · Node.js · d3-geo
- Method
- SIGA bagasse power stations, by licensed capacity, over PAM 2024 cane production by municipality, in six quantile classes.
- Version
- v1.0.0
- Licence
- CC BY 4.0
Downloads
- GPKG Five layers, SIRGAS 2000, with QGIS styles (.gpkg) 18.5 MB
- CSV All 211 power stations, with coordinates (.csv) 34 kB
- SVG Vector plate, for printing (.svg) 2.2 MB
- PNG Plate (PNG, 2400 px) (.png) 0.3 MB

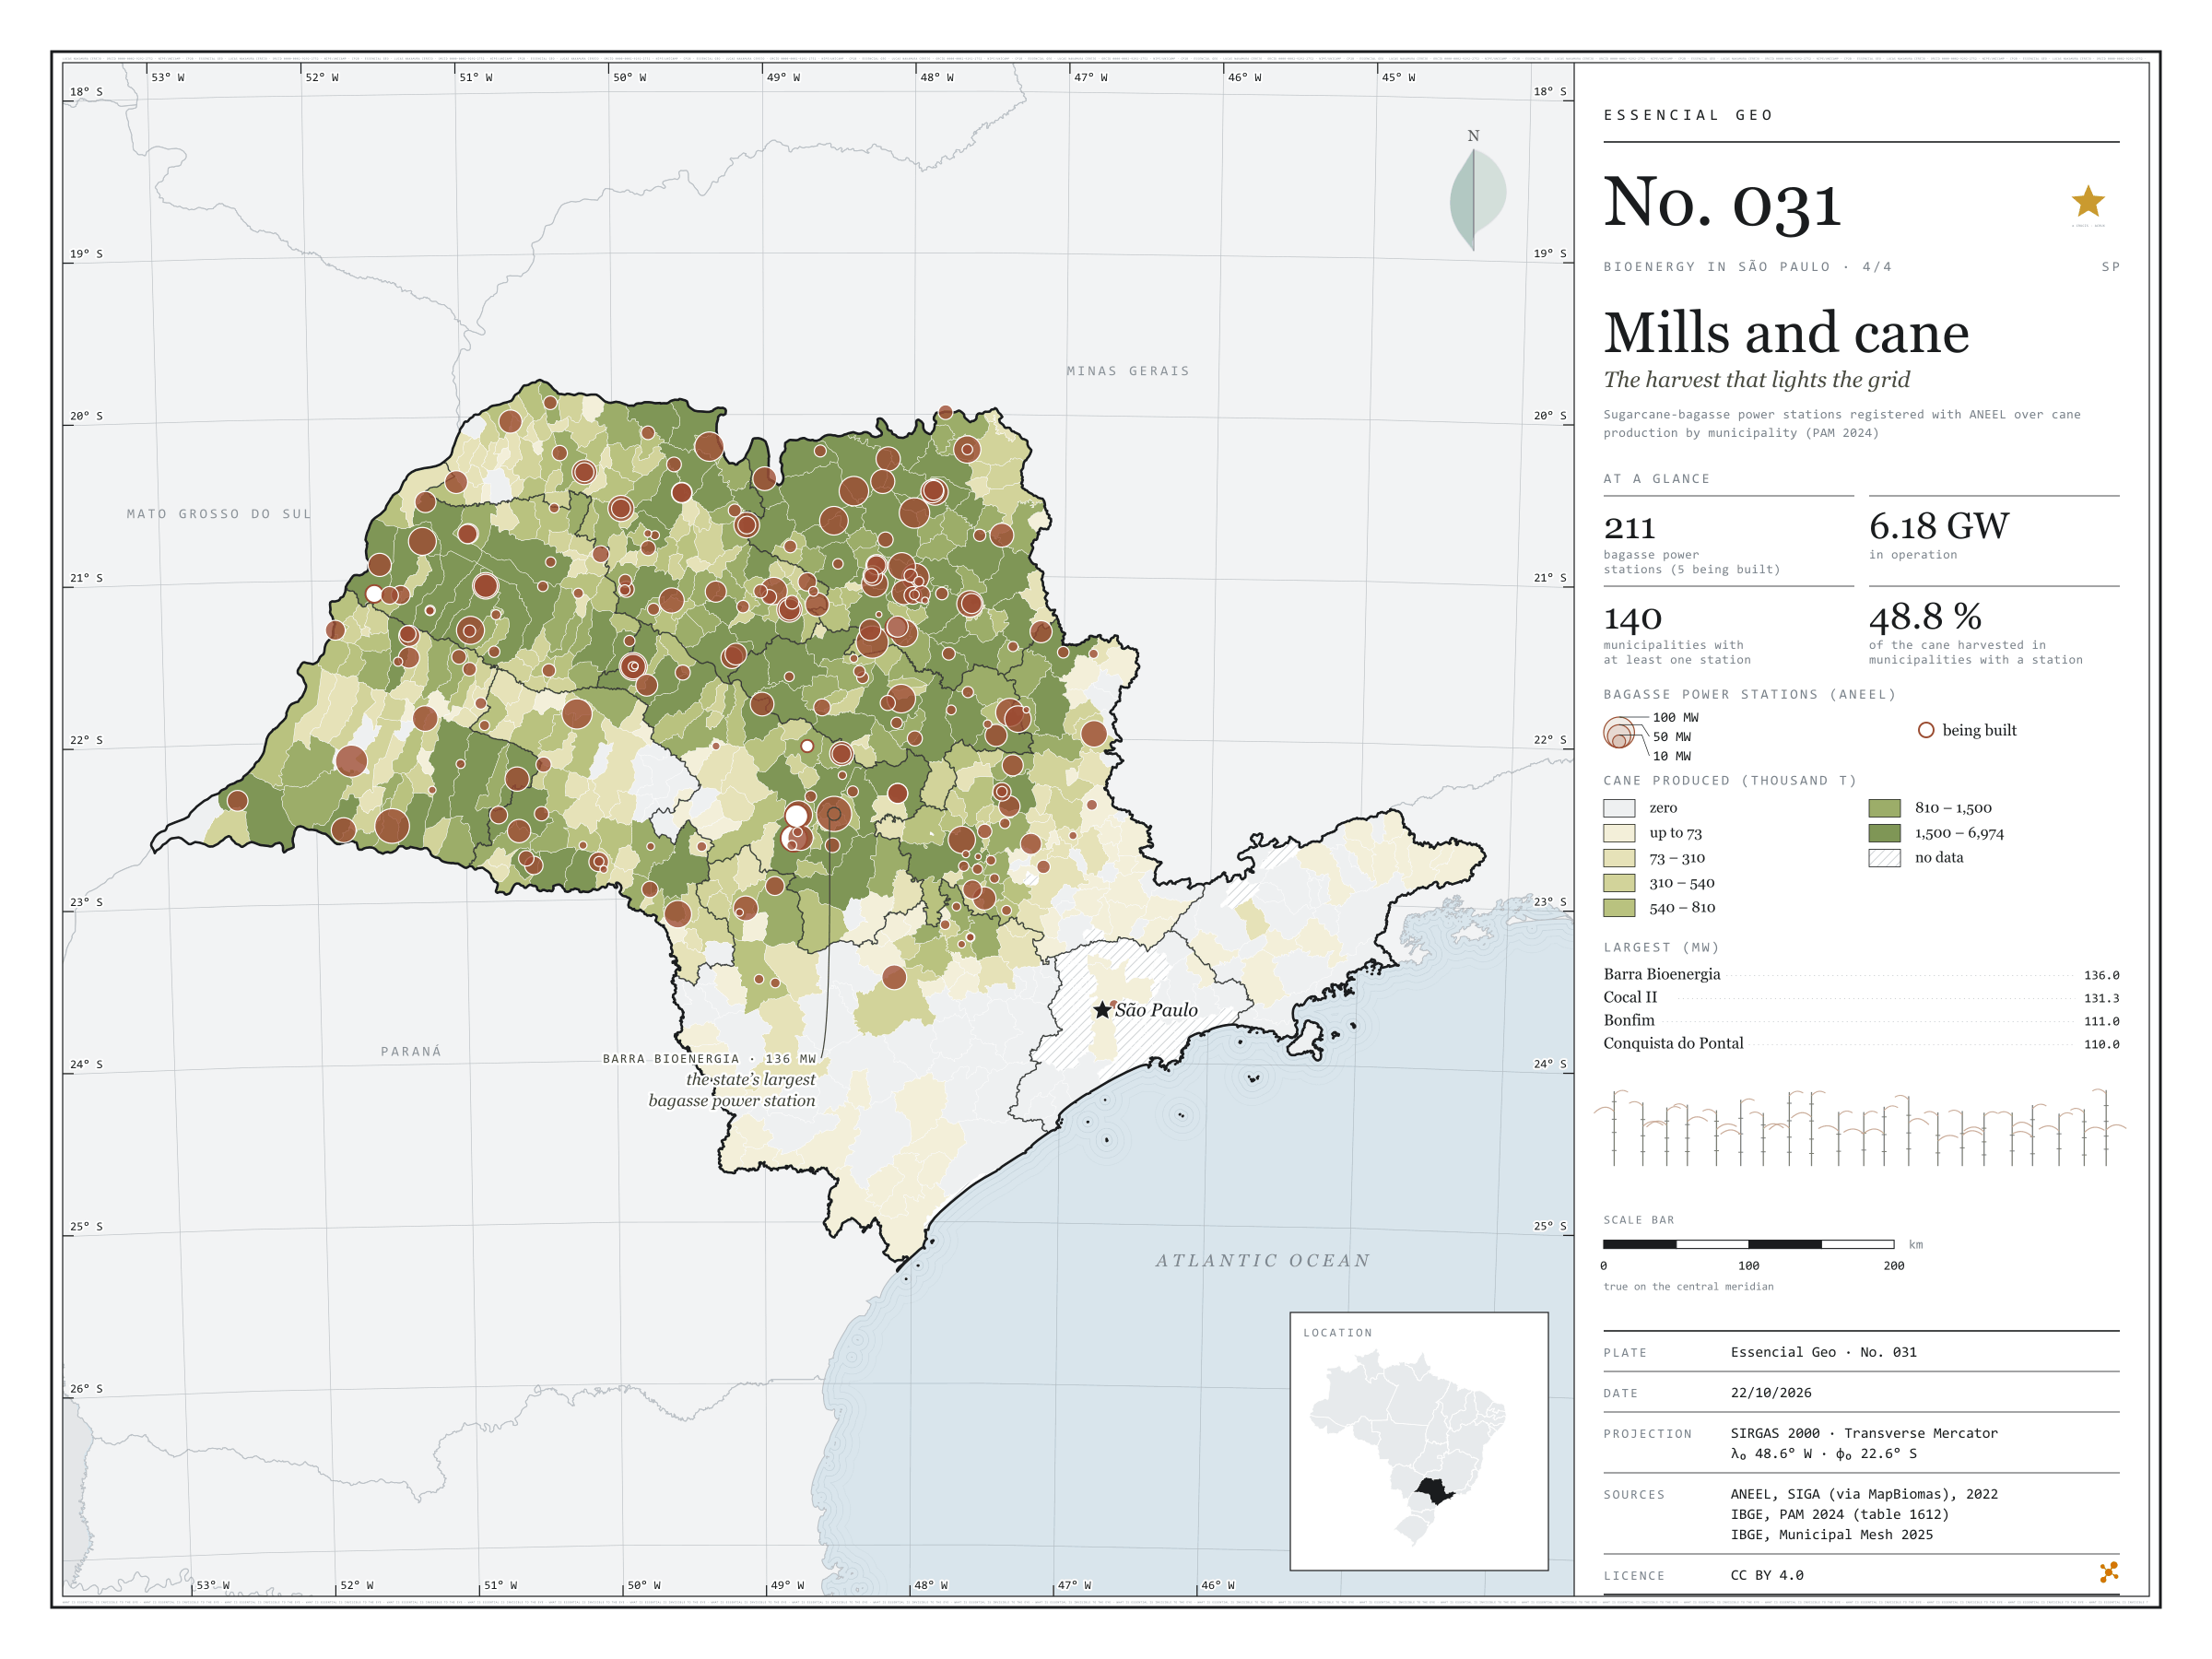
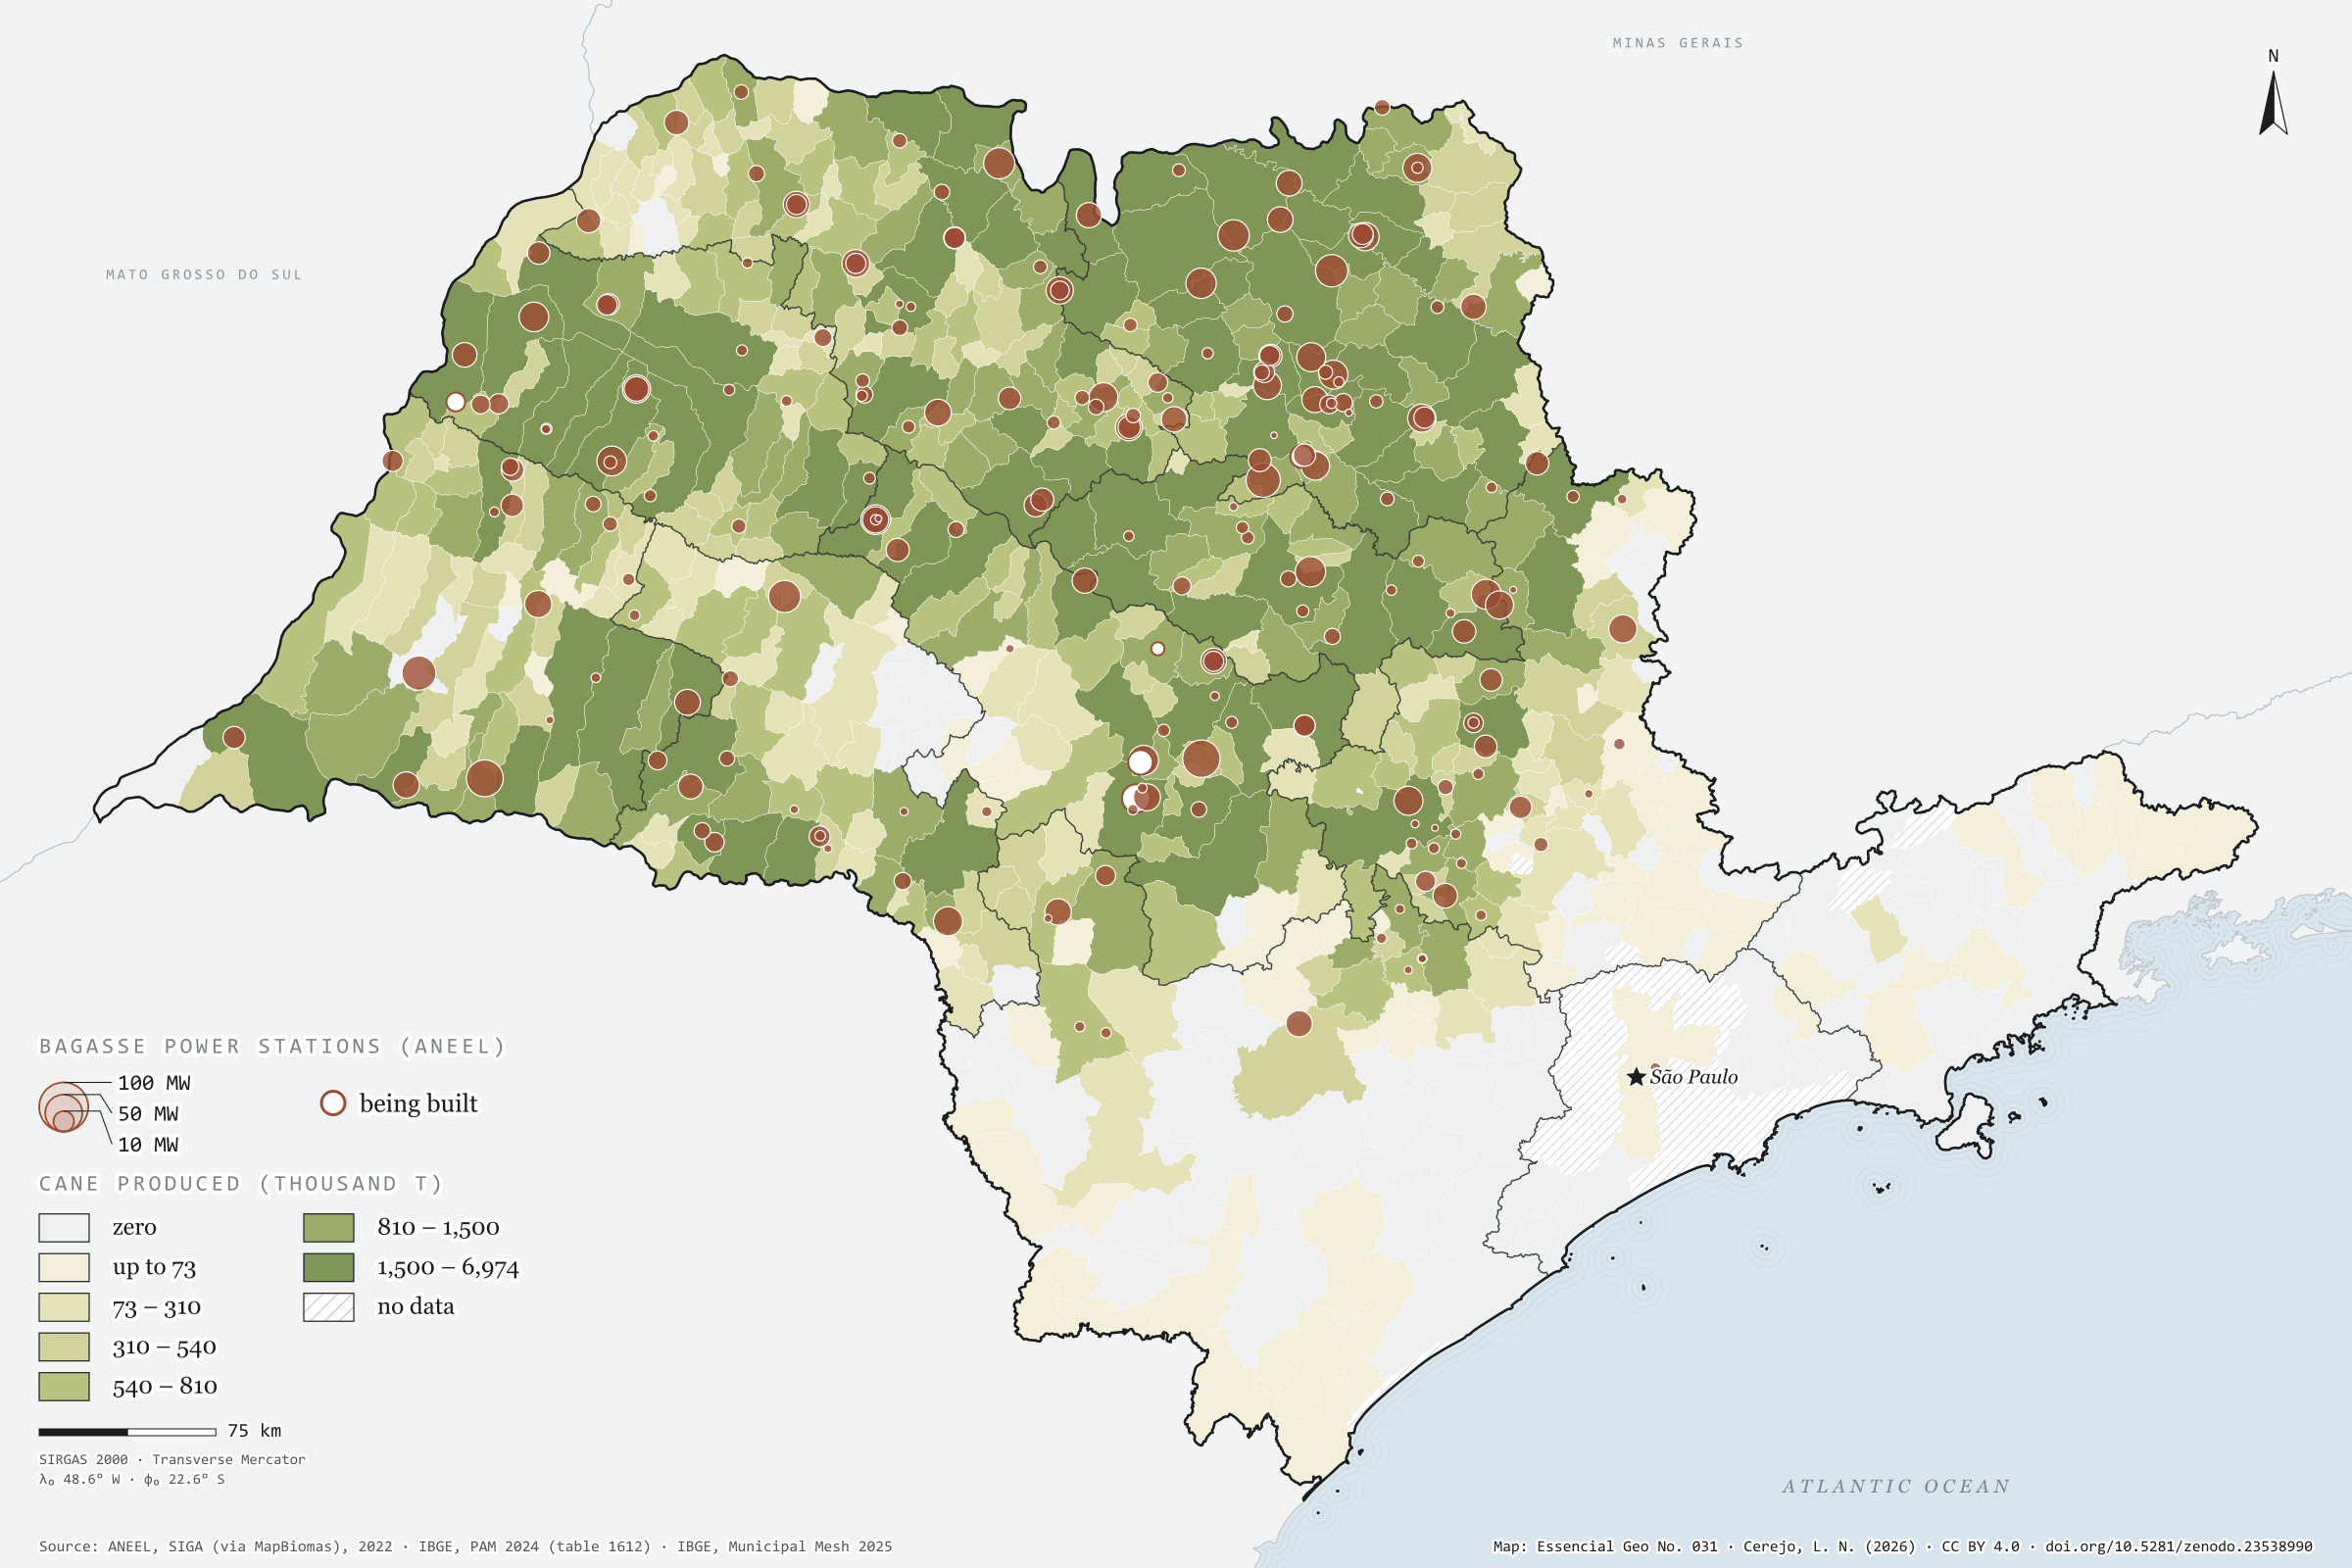
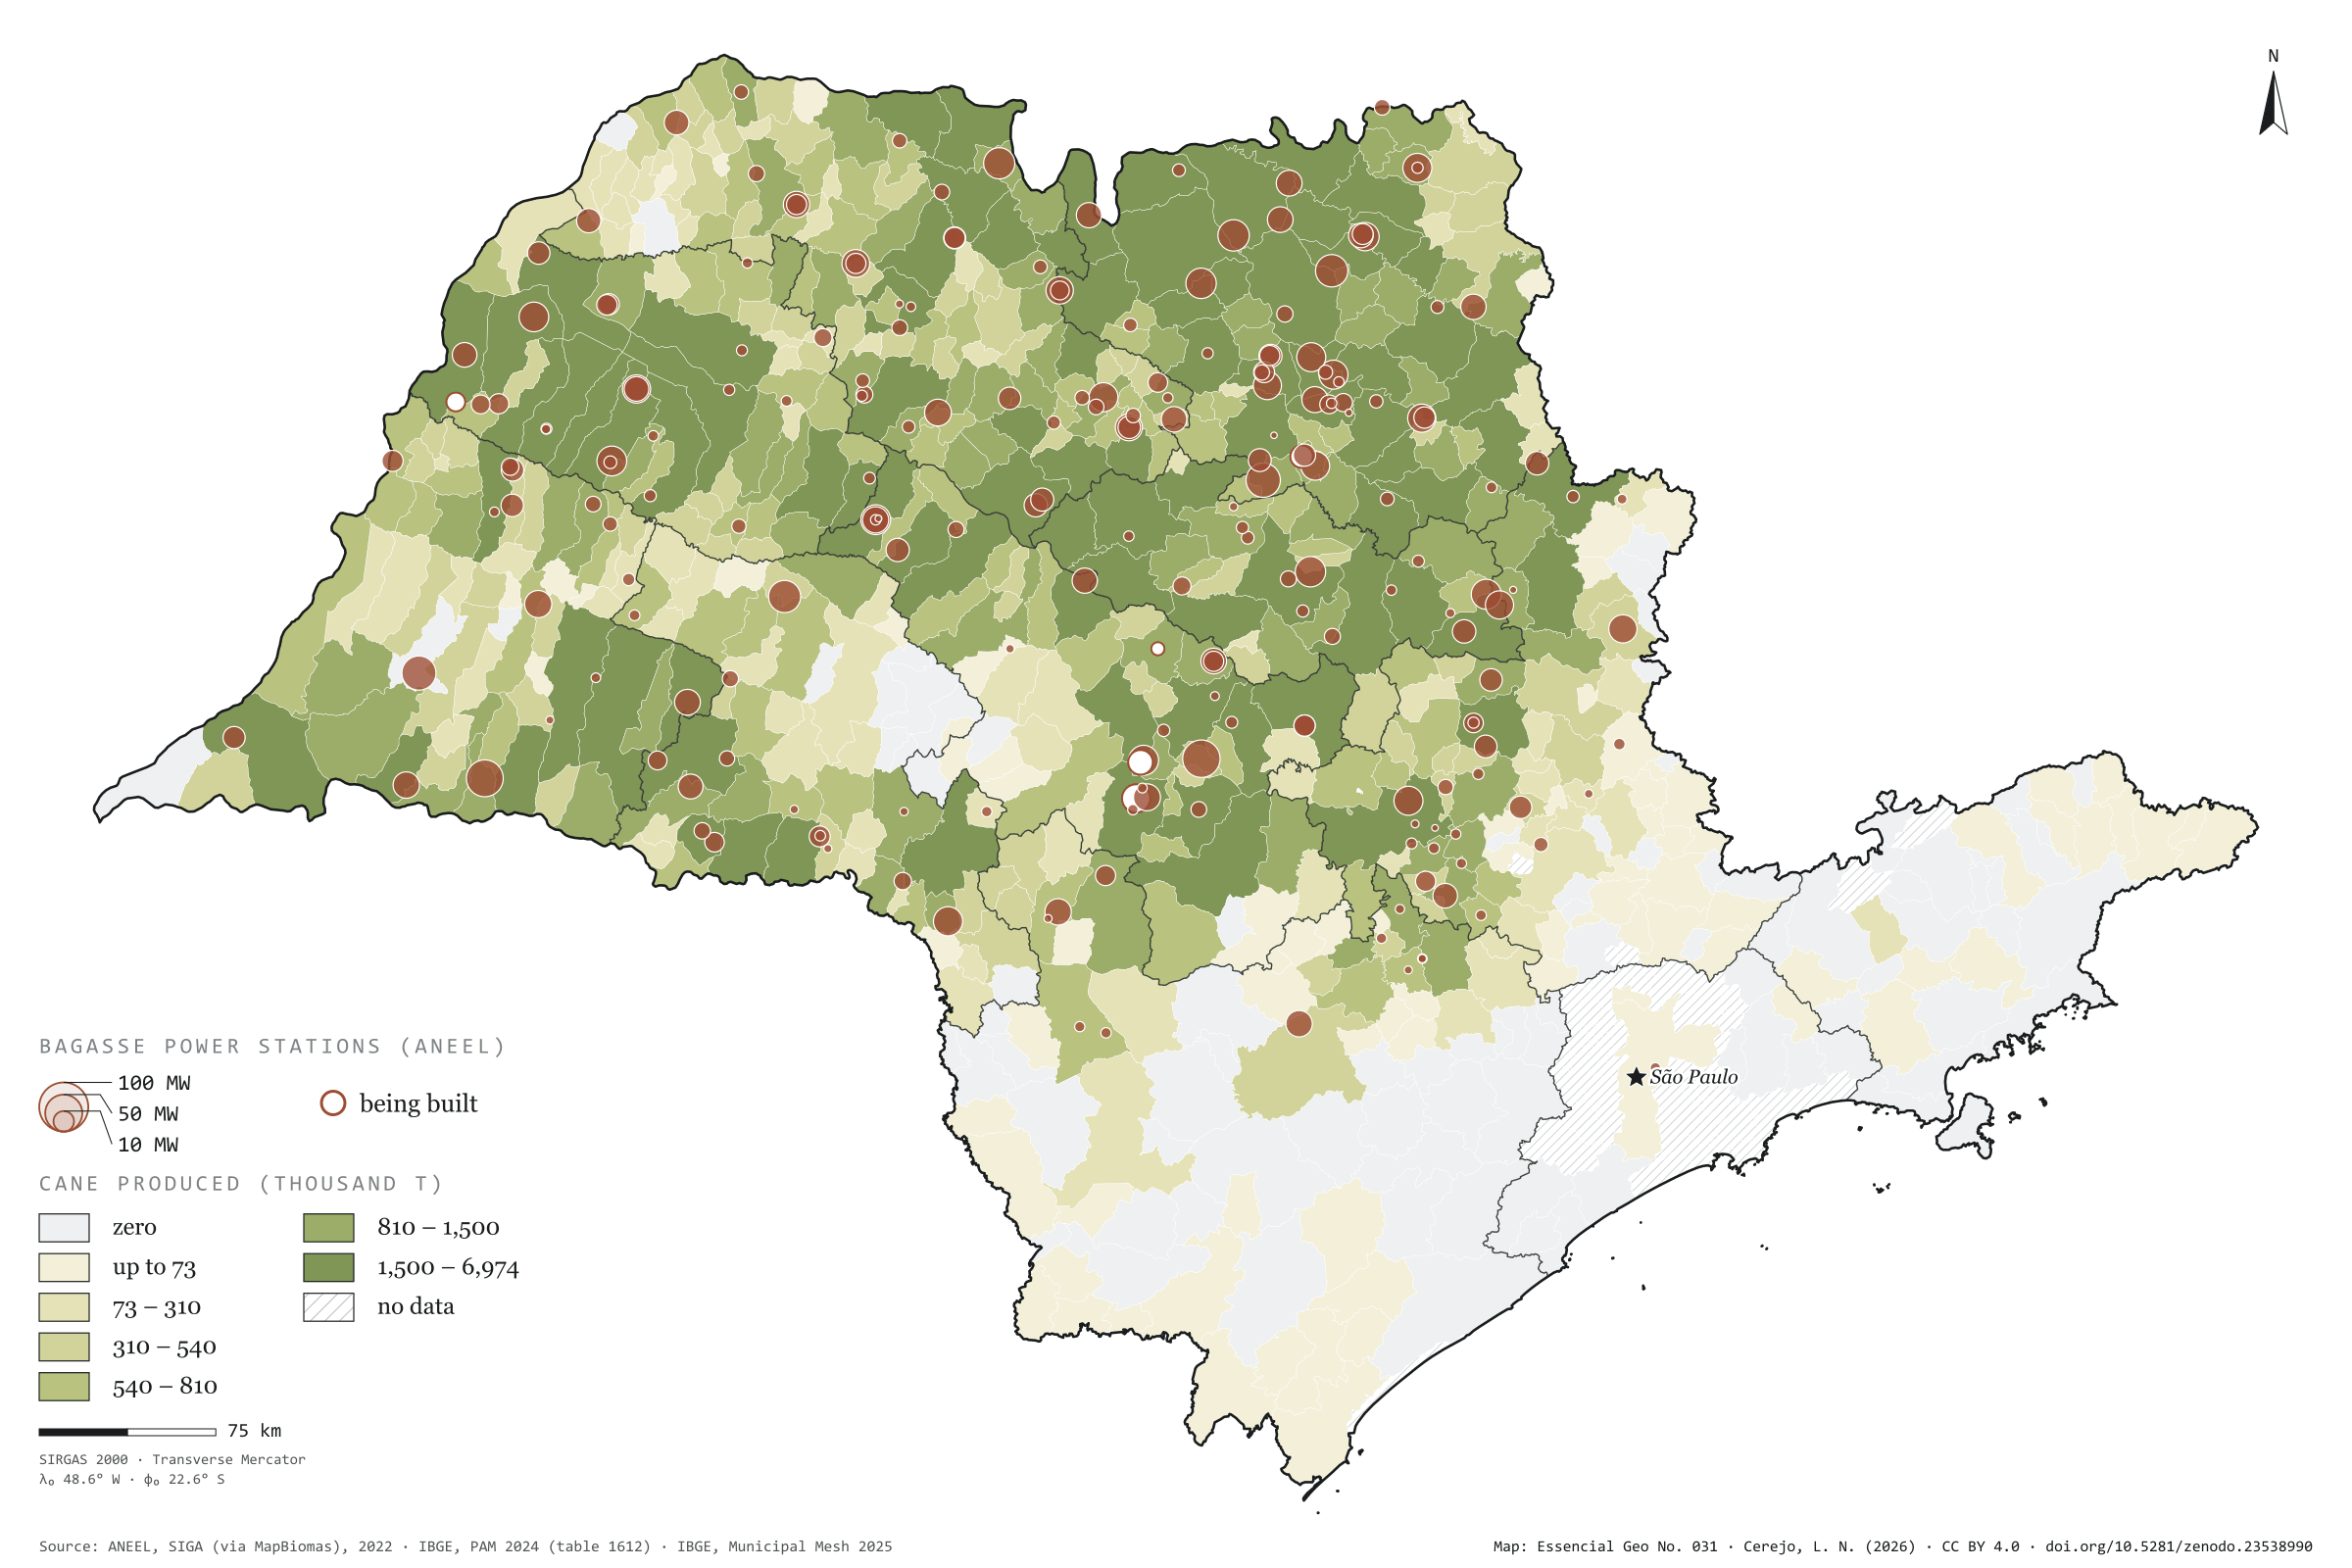
Figure to reuse
The map without a frame, with legend, scale, reference system and credit written on it: ready for papers, lectures and slides. In two versions: with the basemap (neighbours and sea) or only the mapped area, on white.
With basemap (PNG) Without basemap (PNG) QR code (SVG)
Point a camera at it to open this page.
How to cite
CEREJO, Lucas Nakamura. Usinas e cana: a colheita que acende a rede. Versão 1.0.0. [S. l.]: Zenodo, 2026. Conjunto de dados. DOI: 10.5281/zenodo.23538990. Disponível em: https://doi.org/10.5281/zenodo.23538990. Acesso em: 10 nov. 2026.
Cerejo, L. N. (2026). Usinas e cana: a colheita que acende a rede [Mills and cane: The harvest that lights the grid] (Version 1.0.0) [Data set]. Zenodo. https://doi.org/10.5281/zenodo.23538990
@dataset{cerejo2026_usinas_e_cana_sp,
  author    = {Cerejo, Lucas Nakamura},
  title     = {Usinas e cana: A colheita que acende a rede},
  year      = {2026},
  publisher = {Zenodo},
  version   = {1.0.0},
  doi       = {10.5281/zenodo.23538990},
  url       = {https://doi.org/10.5281/zenodo.23538990},
  language  = {portuguese},
  note      = {English title: Mills and cane: The harvest that lights the grid. Licence CC BY 4.0}
}