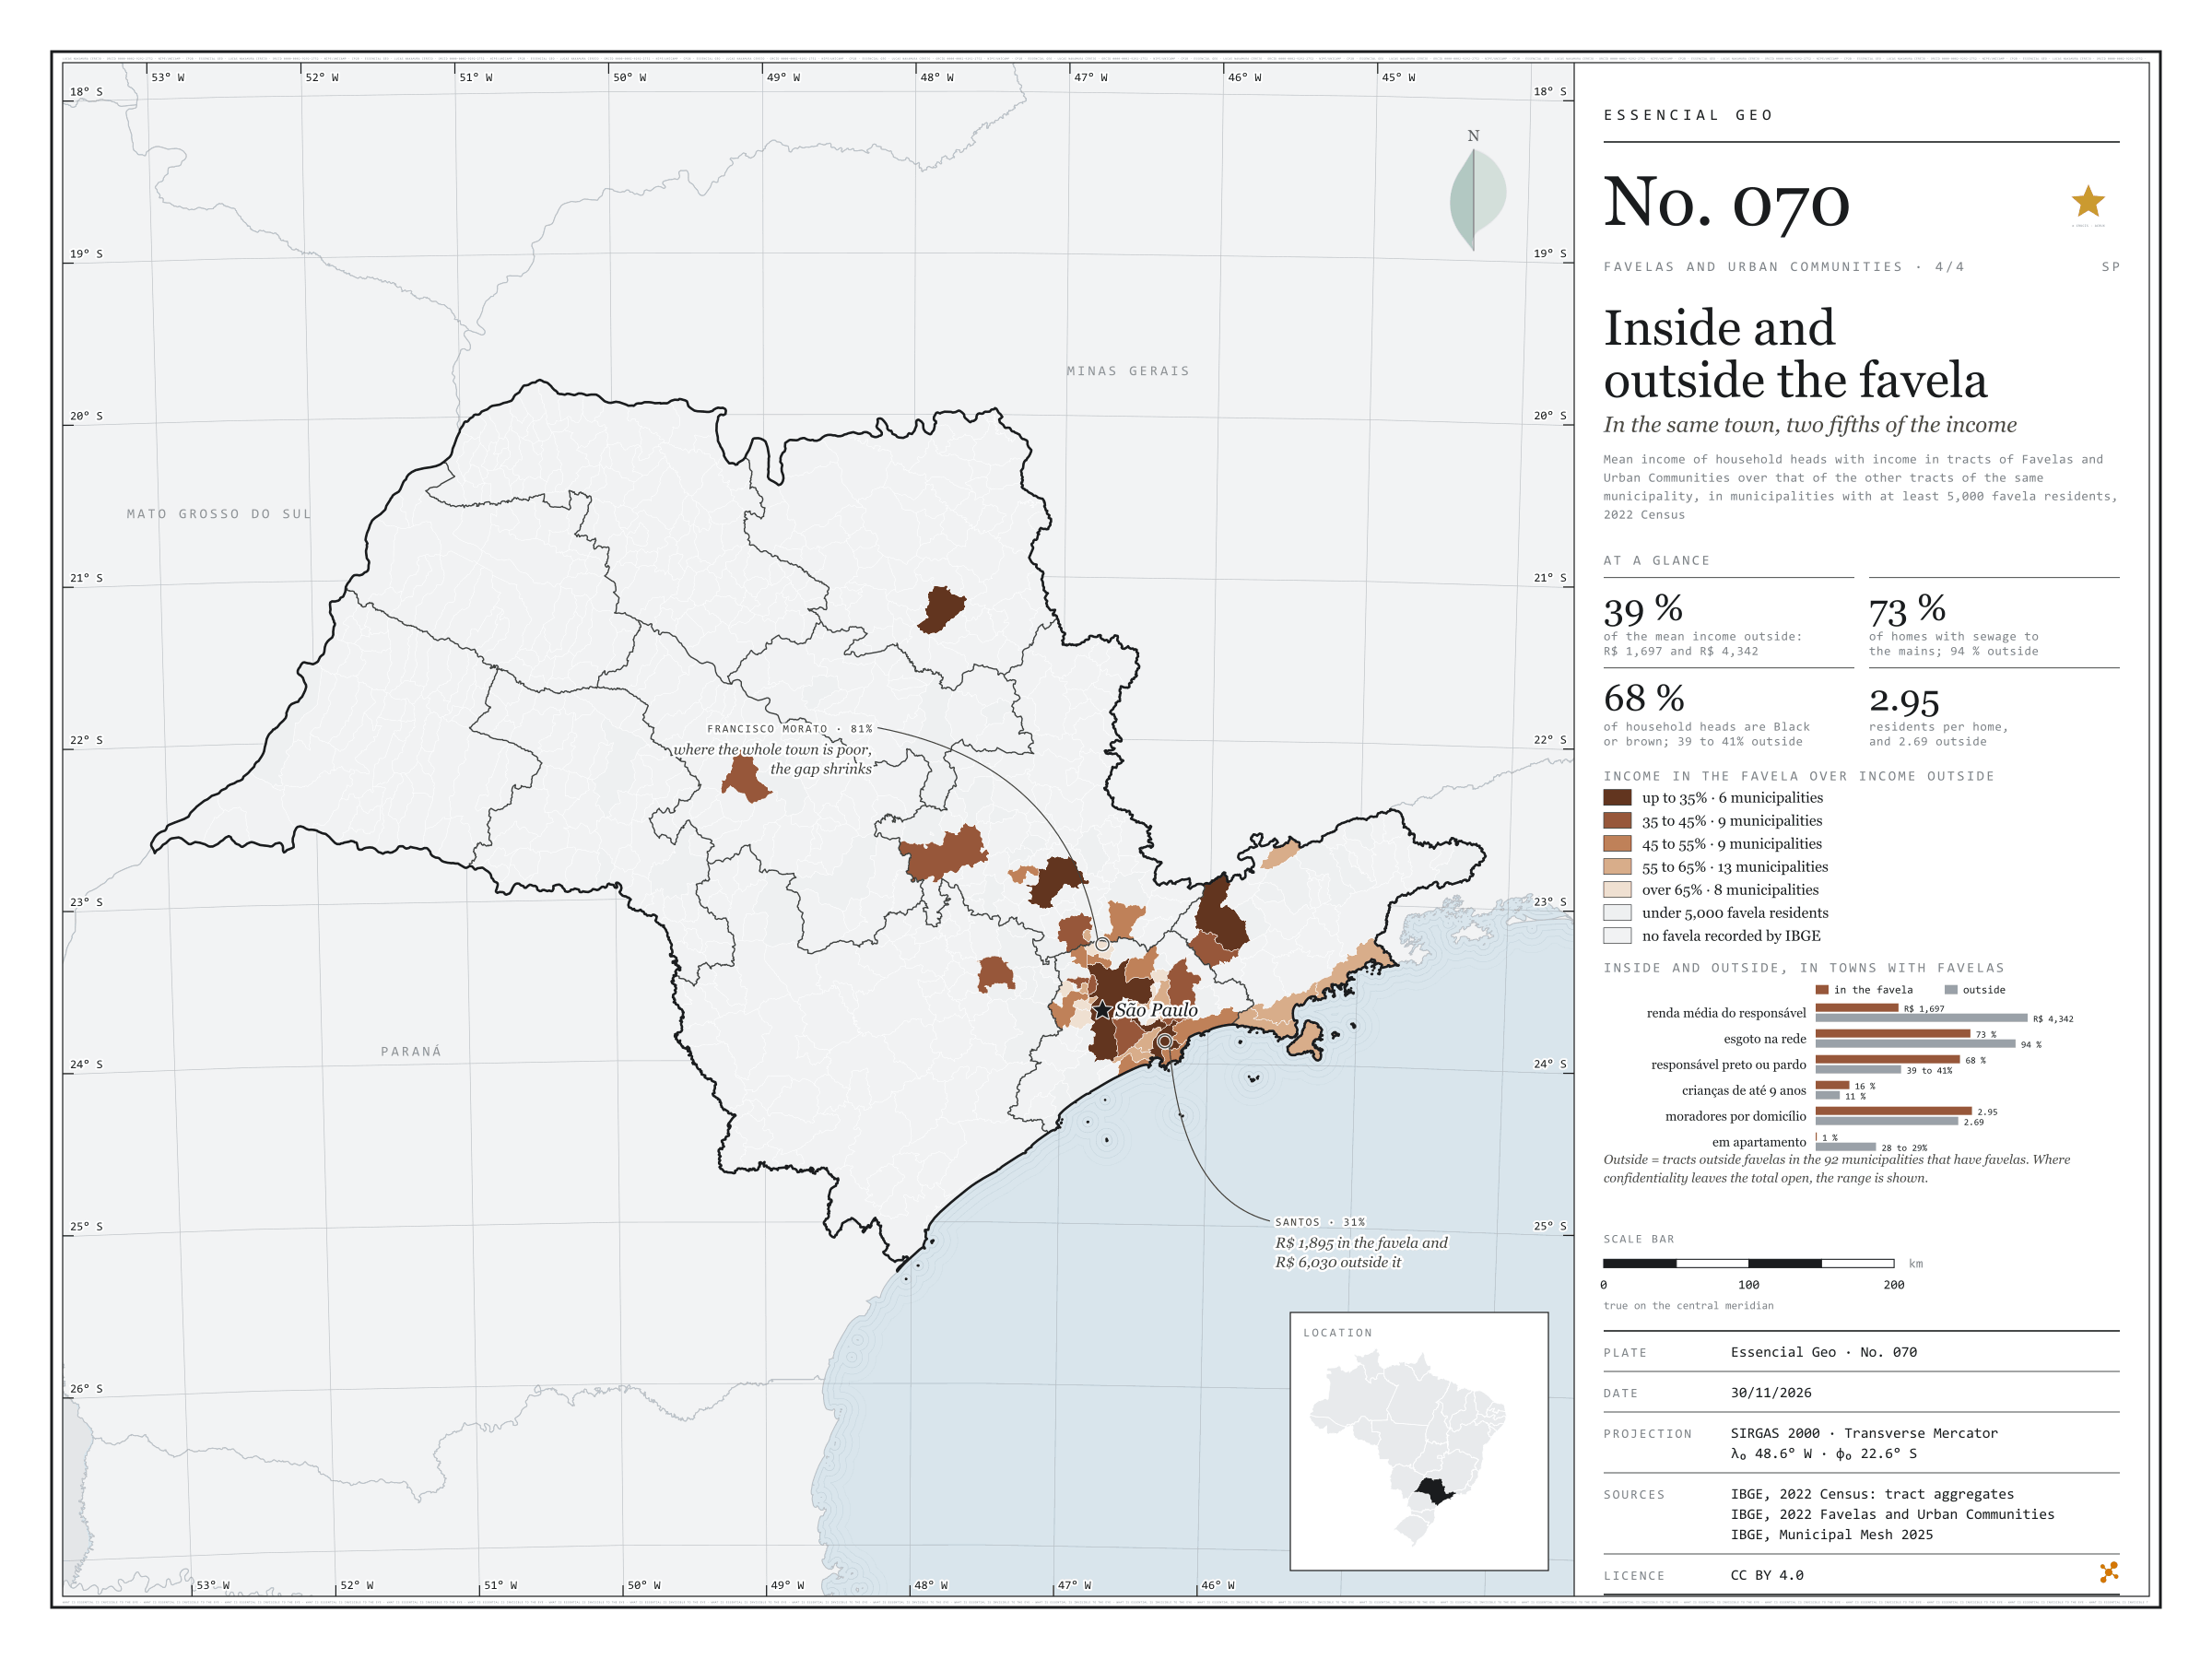
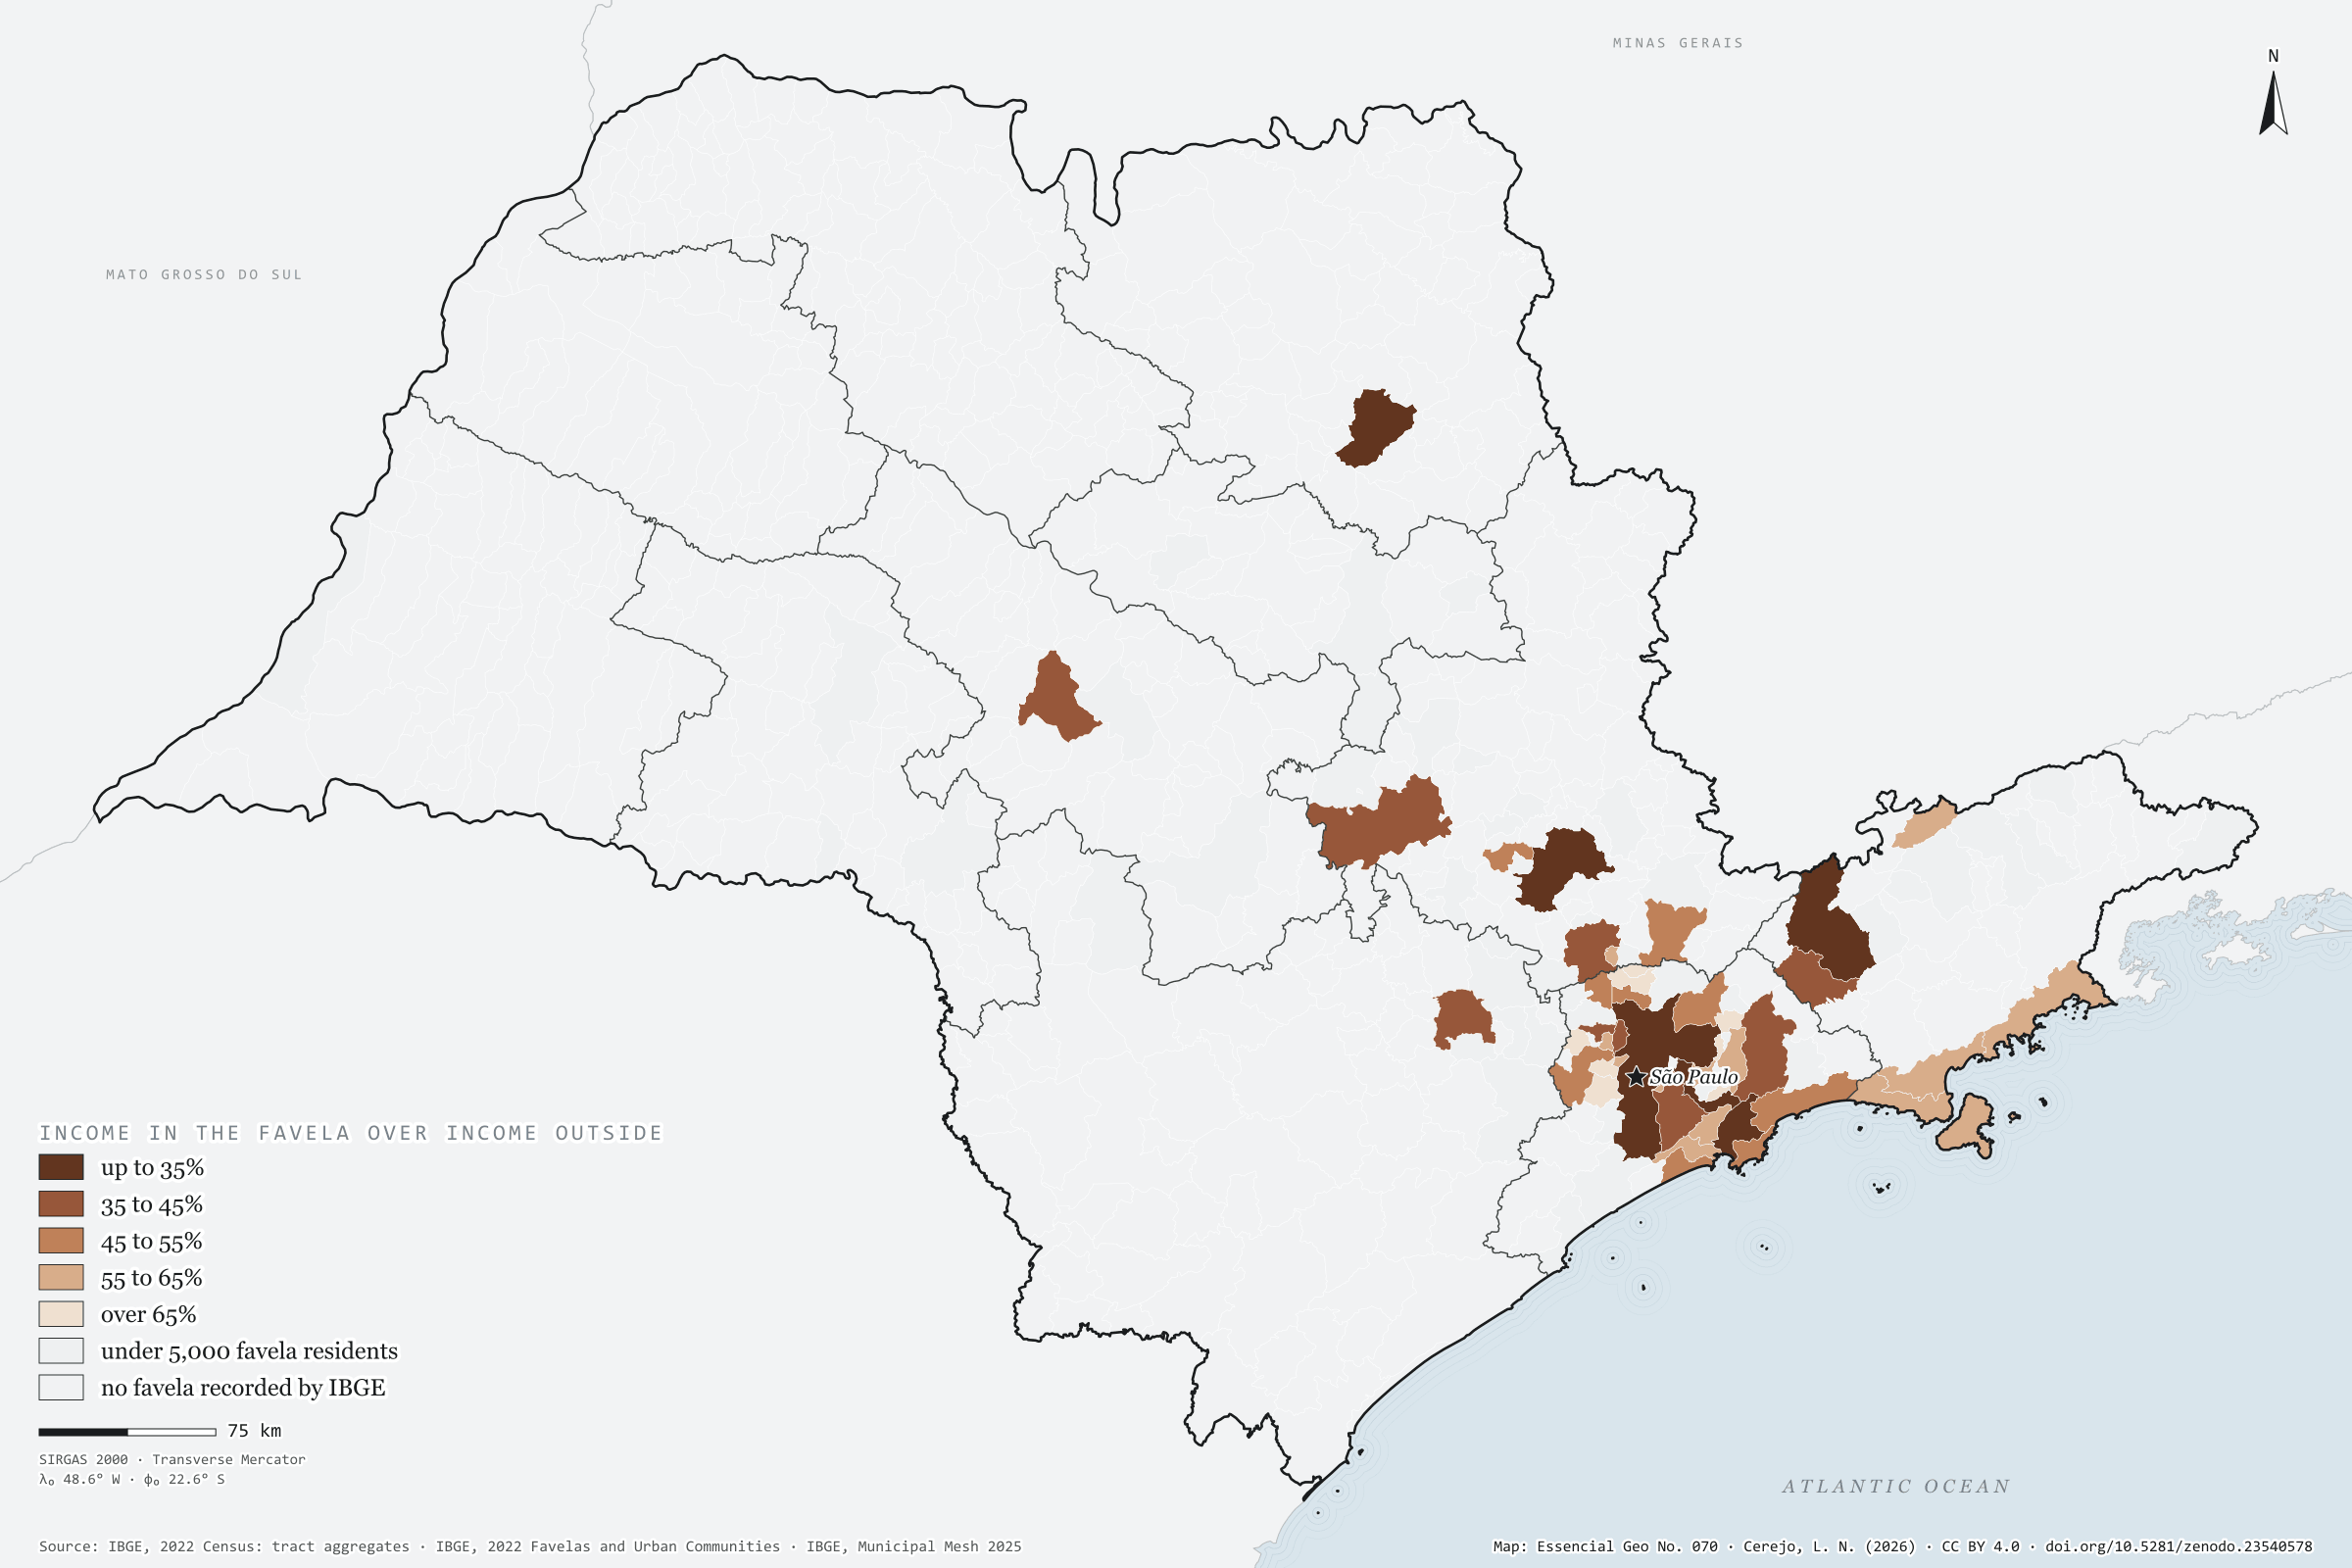
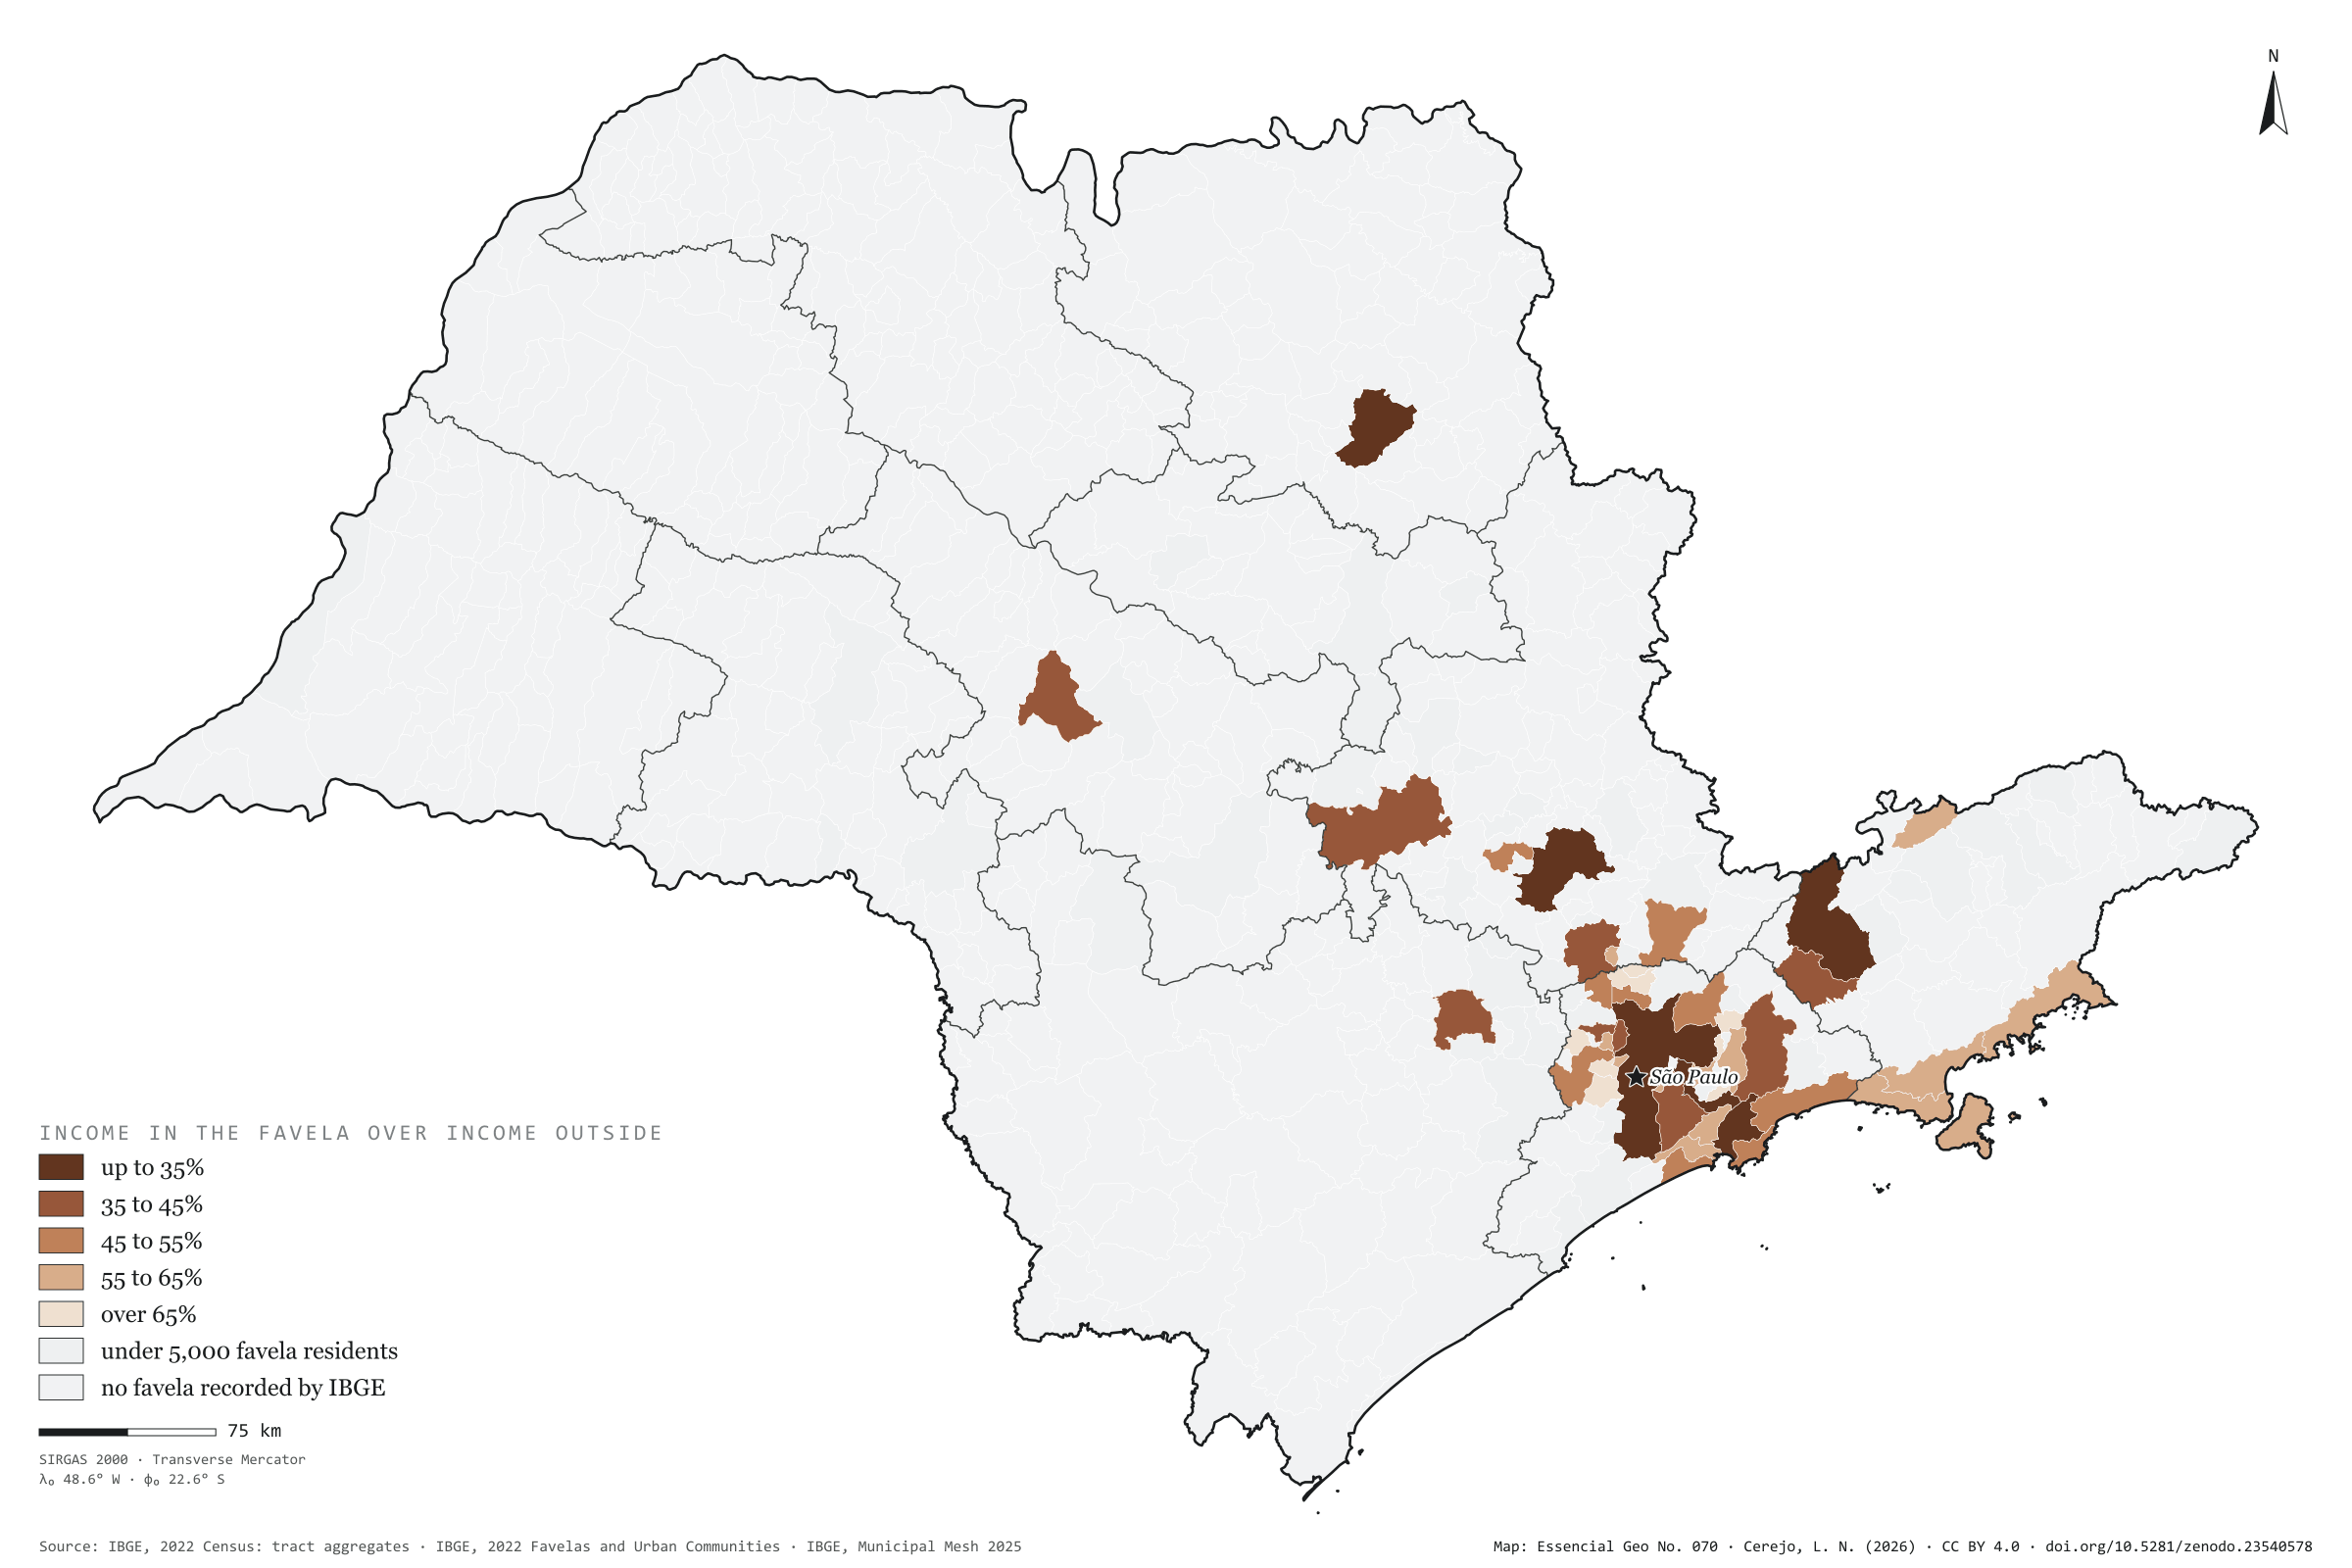
In the 92 São Paulo municipalities that have favelas, the mean income of the household head is R$ 1,697 in the favelas and R$ 4,342 in the rest of the same town: 2.6 times as much. Inside, 73% of homes have sewage to the mains, against 94% outside; 68% of household heads are Black or brown, against about 40%; 16% of residents are aged 9 or under, against 11%; and almost no one lives in a flat (0.5%, against 28%). The map compares income inside and outside in each of the 45 municipalities with at least 5,000 favela residents. The gap is widest in rich towns: in Santos and São Paulo, income in the favela is 31% of that outside; in Ribeirão Preto and São José dos Campos, 33%. It narrows where the whole town is poor, as in Francisco Morato, Itaquaquecetuba and Rio Grande da Serra, at 81%. Last plate of the collection “Favelas and urban communities”.
Technical record · downloads · citation
At a glance
Municipalities by income in the favela over income outside (municipalities)
up to 35%13.3%
35 to 45%20%
45 to 55%20%
55 to 65%28.9%
over 65%17.8%
Mean household-head income in the favela
1,697R$
R$ 4,342 outside, in the same municipalities
Favela homes with sewage to the mains
73%
94% outside
Layers
municipiospolygon645 municipalities: mean income inside and outside favelas and the ratio between them, plus people in favelas and surroundings
setores_fcupolygon8,008 tracts in Favelas and Urban Communities
regioes_intermediariaspolygon11 intermediate geographic regions
Mean income of household heads with income in tracts of Favelas and Urban Communities over that of the other tracts of the same municipality, from the 2022 Census tract aggregates, in municipalities with at least 5,000 favela residents, in five classes.
The map without a frame, with legend, scale, reference system and credit written on it: ready for papers, lectures and slides. In two versions: with the basemap (neighbours and sea) or only the mapped area, on white.
CEREJO, Lucas Nakamura. Dentro e fora da favela: na mesma cidade, dois quintos da renda. Versão 1.0.0. [S. l.]: Zenodo, 2026. Conjunto de dados. DOI: 10.5281/zenodo.23540578. Disponível em: https://doi.org/10.5281/zenodo.23540578. Acesso em: 10 nov. 2026.
Cerejo, L. N. (2026). Dentro e fora da favela: na mesma cidade, dois quintos da renda [Inside and outside the favela: In the same town, two fifths of the income] (Version 1.0.0) [Data set]. Zenodo. https://doi.org/10.5281/zenodo.23540578
@dataset{cerejo2026_dentro_e_fora_das_favelas_sp,
  author    = {Cerejo, Lucas Nakamura},
  title     = {Dentro e fora da favela: Na mesma cidade, dois quintos da renda},
  year      = {2026},
  publisher = {Zenodo},
  version   = {1.0.0},
  doi       = {10.5281/zenodo.23540578},
  url       = {https://doi.org/10.5281/zenodo.23540578},
  language  = {portuguese},
  note      = {English title: Inside and outside the favela: In the same town, two fifths of the income. Licence CC BY 4.0}
}
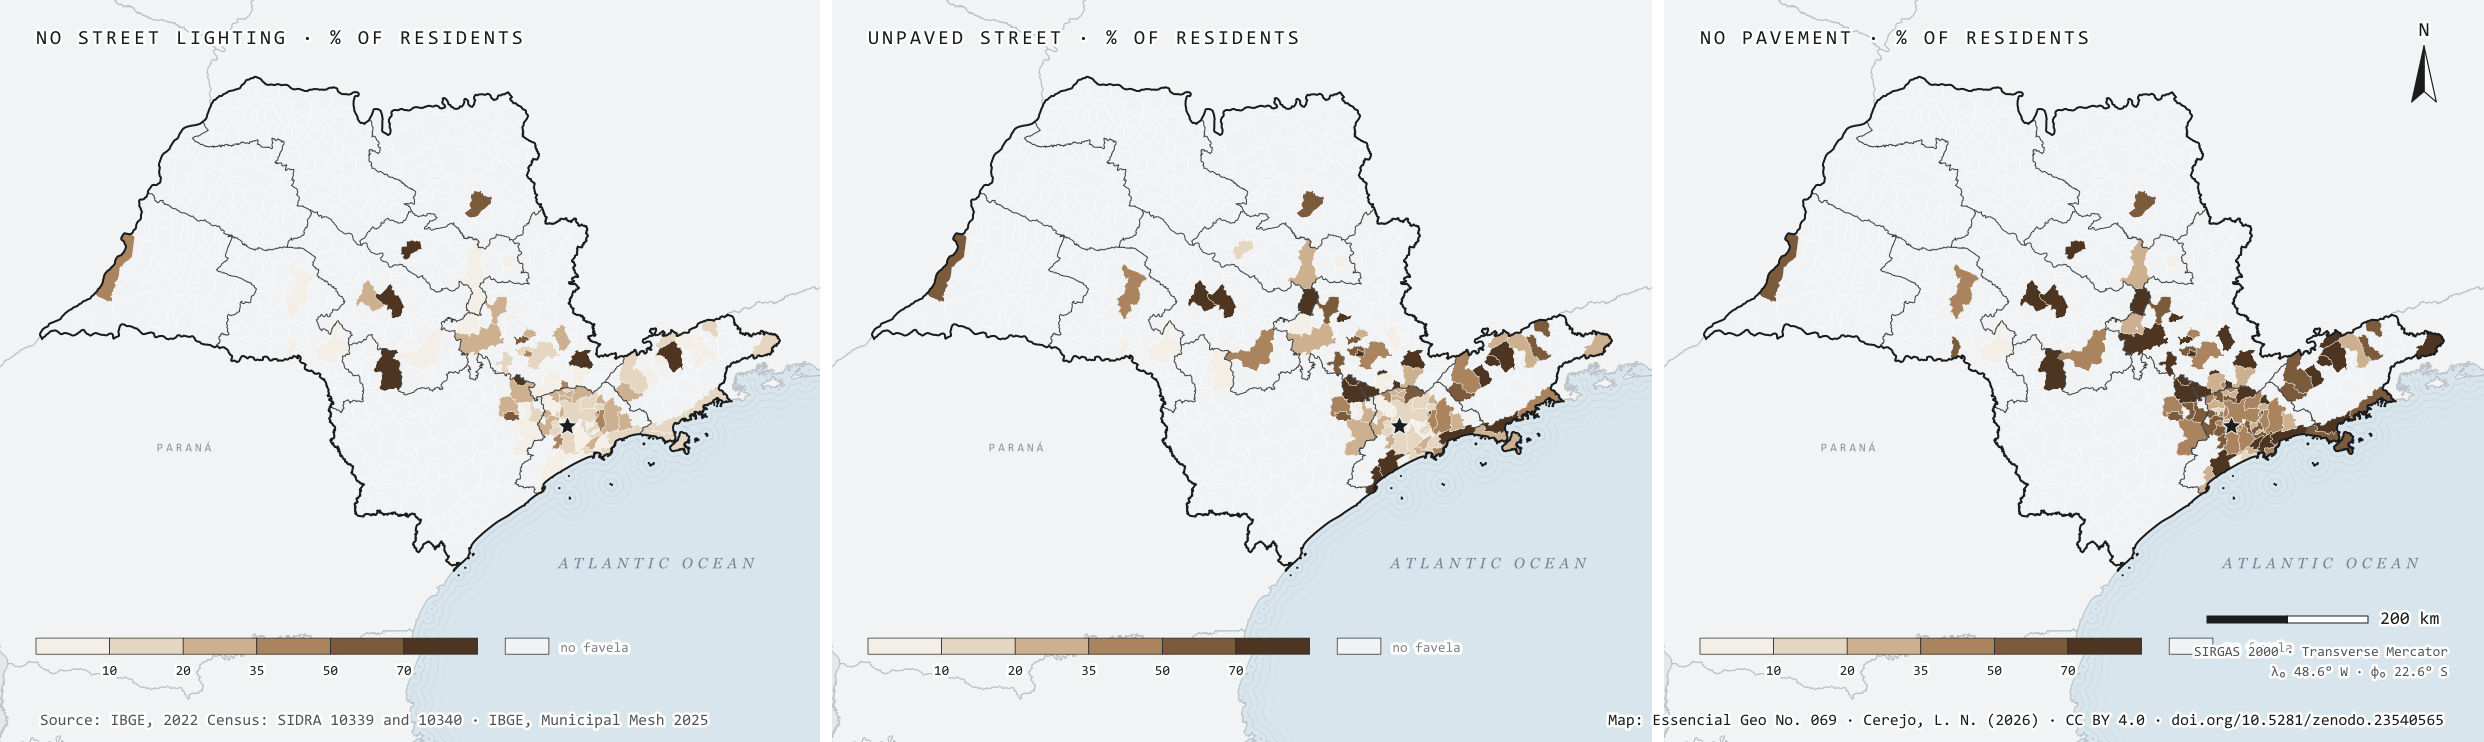
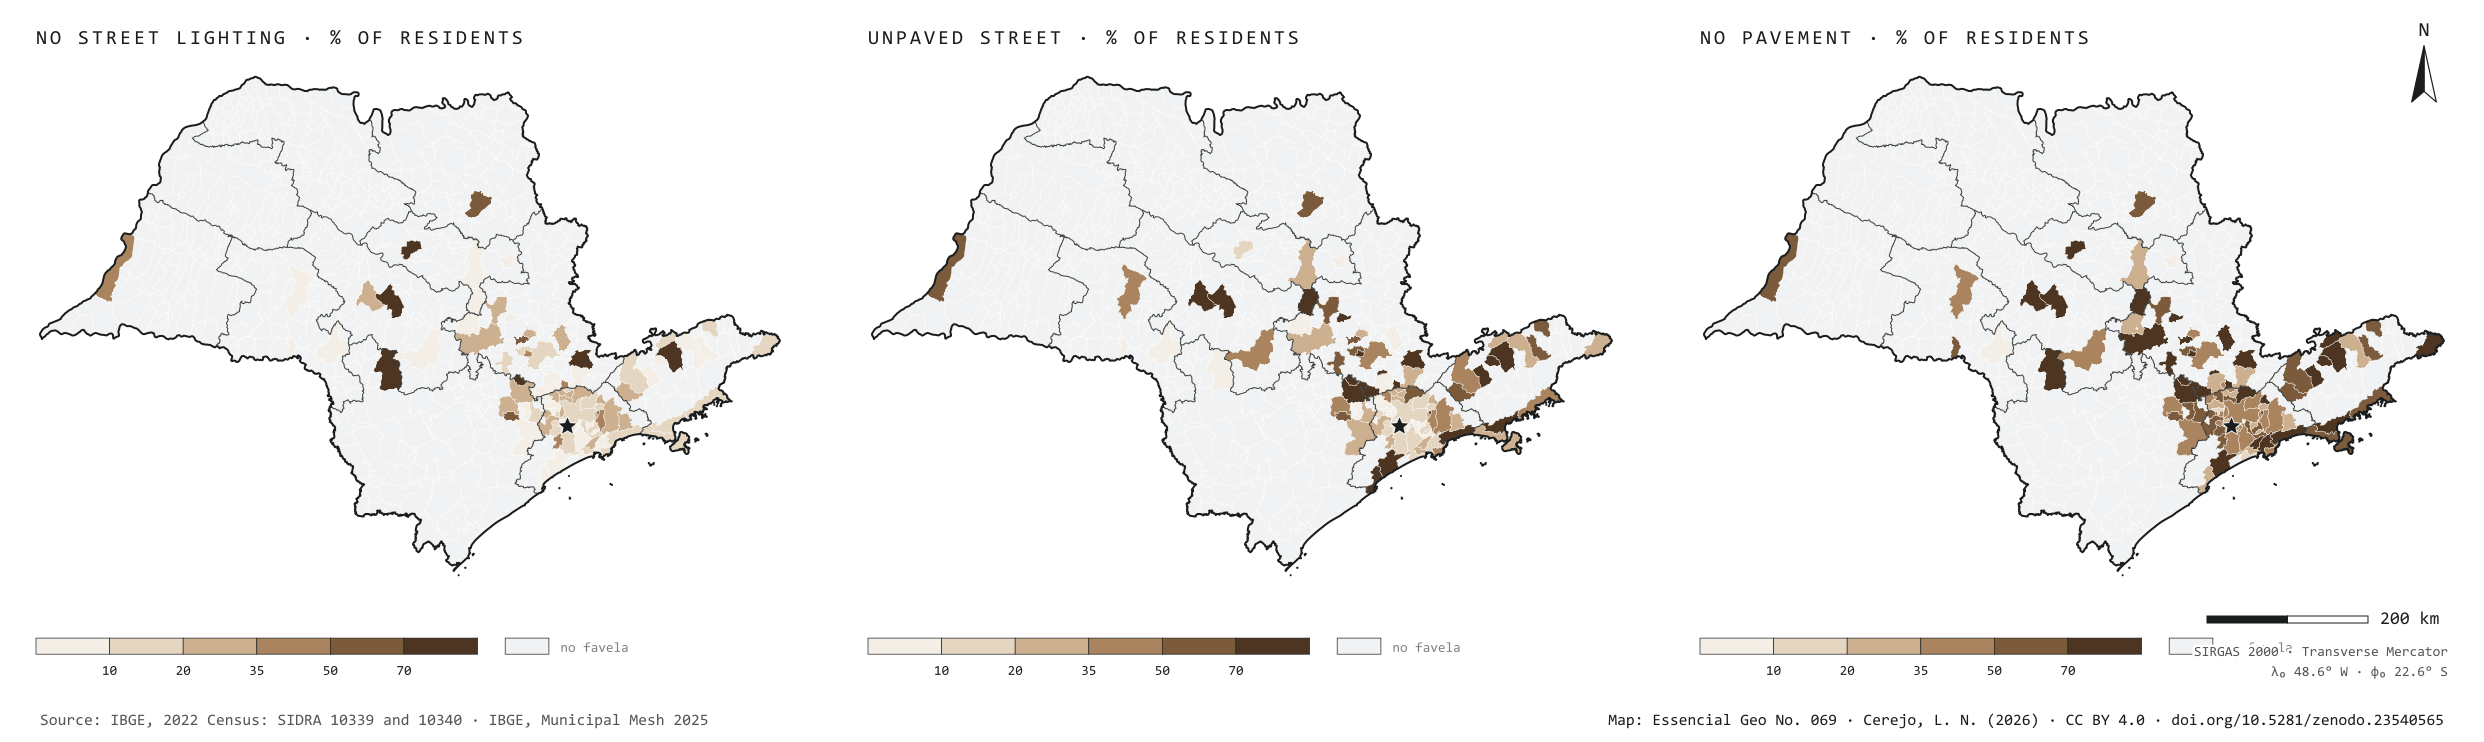
No street light at the door: 15% in São Paulo’s favelas, 9% in Brazil’s
Fig. 069São Paulo State (SP)EPSG:4674Source: IBGE
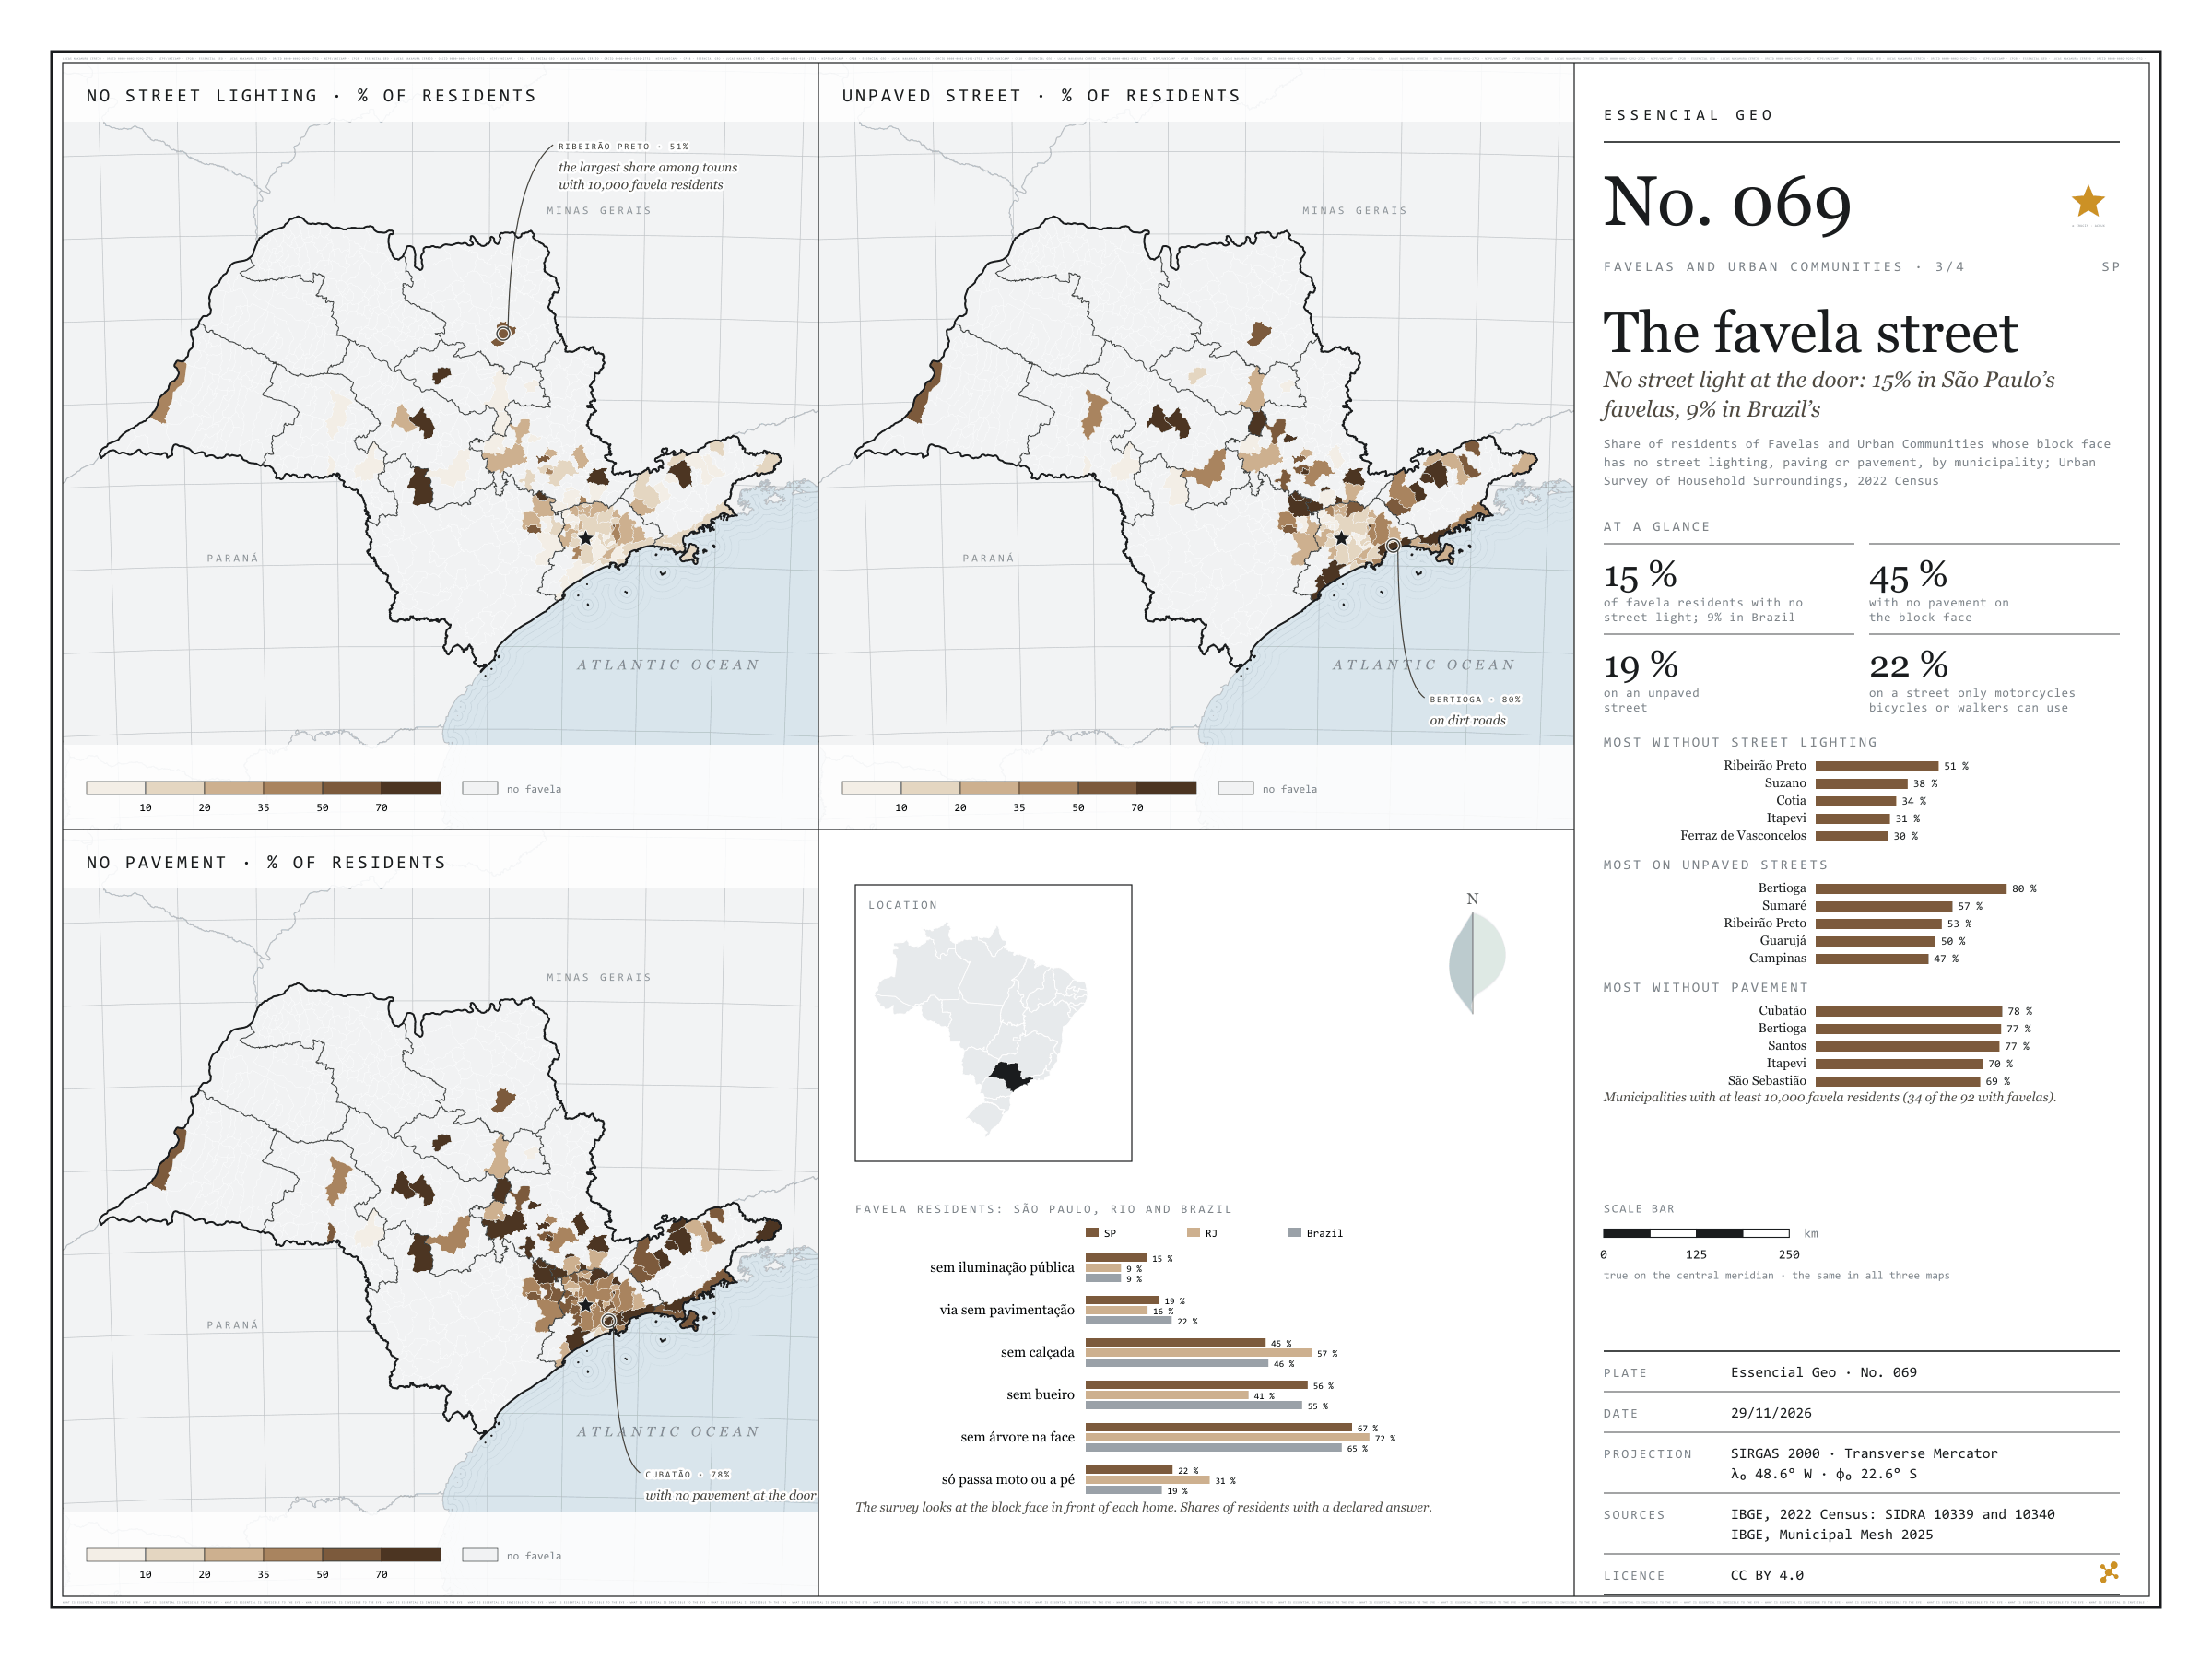
In the 2022 Census, the Urban Survey of Household Surroundings looked at the block face in front of each home. In São Paulo’s favelas, 15% of residents have no street lighting at the door, against 9% in the favelas of Rio and of Brazil as a whole. Paving is better than average: 19% live on an unpaved street, against 22% in Brazil. But 45% have no pavement to walk on, 56% no storm drain and 67% not a single tree on the block face, and for 22% the street only lets through motorbikes, bicycles or people on foot. Among the 34 municipalities with at least 10,000 favela residents, Ribeirão Preto leads on missing light, with 51% of residents in the dark; Bertioga on dirt roads, with 80%; and Cubatão on missing pavements, with 78%, ahead of Bertioga and Santos. The three maps share one frame: only the 92 municipalities with favelas.
Technical record · downloads · citation
At a glance
Favela residents with no street lighting on their block face
15%
8.9% in Brazil and in Rio de Janeiro
Favela residents with no pavement
45%
46.1% in Brazil
Favela residents on unpaved streets
19%
21.7% in Brazil
Layers
municipiospolygon645 municipalities: favela residents with surveyed surroundings and the shares without street lighting, paving, storm drains, pavement and trees, and on streets for motorbikes or pedestrians only
setores_fcupolygon8,008 tracts in Favelas and Urban Communities
regioes_intermediariaspolygon11 intermediate geographic regions
Residents of Favelas and Urban Communities whose block face has no street lighting, paving or pavement over residents with the feature declared, by municipality, from SIDRA 10340, in six classes; municipalities without favelas shown apart.
The map without a frame, with legend, scale, reference system and credit written on it: ready for papers, lectures and slides. In two versions: with the basemap (neighbours and sea) or only the mapped area, on white.
CEREJO, Lucas Nakamura. A rua da favela: sem luz pública na porta: 15 % nas favelas paulistas, 9 % nas do país. Versão 1.0.0. [S. l.]: Zenodo, 2026. Conjunto de dados. DOI: 10.5281/zenodo.23540565. Disponível em: https://doi.org/10.5281/zenodo.23540565. Acesso em: 10 nov. 2026.
Cerejo, L. N. (2026). A rua da favela: sem luz pública na porta: 15 % nas favelas paulistas, 9 % nas do país [The favela street: No street light at the door: 15% in São Paulo’s favelas, 9% in Brazil’s] (Version 1.0.0) [Data set]. Zenodo. https://doi.org/10.5281/zenodo.23540565
@dataset{cerejo2026_entorno_das_favelas_sp,
  author    = {Cerejo, Lucas Nakamura},
  title     = {A rua da favela: Sem luz pública na porta: 15 % nas favelas paulistas, 9 % nas do país},
  year      = {2026},
  publisher = {Zenodo},
  version   = {1.0.0},
  doi       = {10.5281/zenodo.23540565},
  url       = {https://doi.org/10.5281/zenodo.23540565},
  language  = {portuguese},
  note      = {English title: The favela street: No street light at the door: 15% in São Paulo’s favelas, 9% in Brazil’s. Licence CC BY 4.0}
}
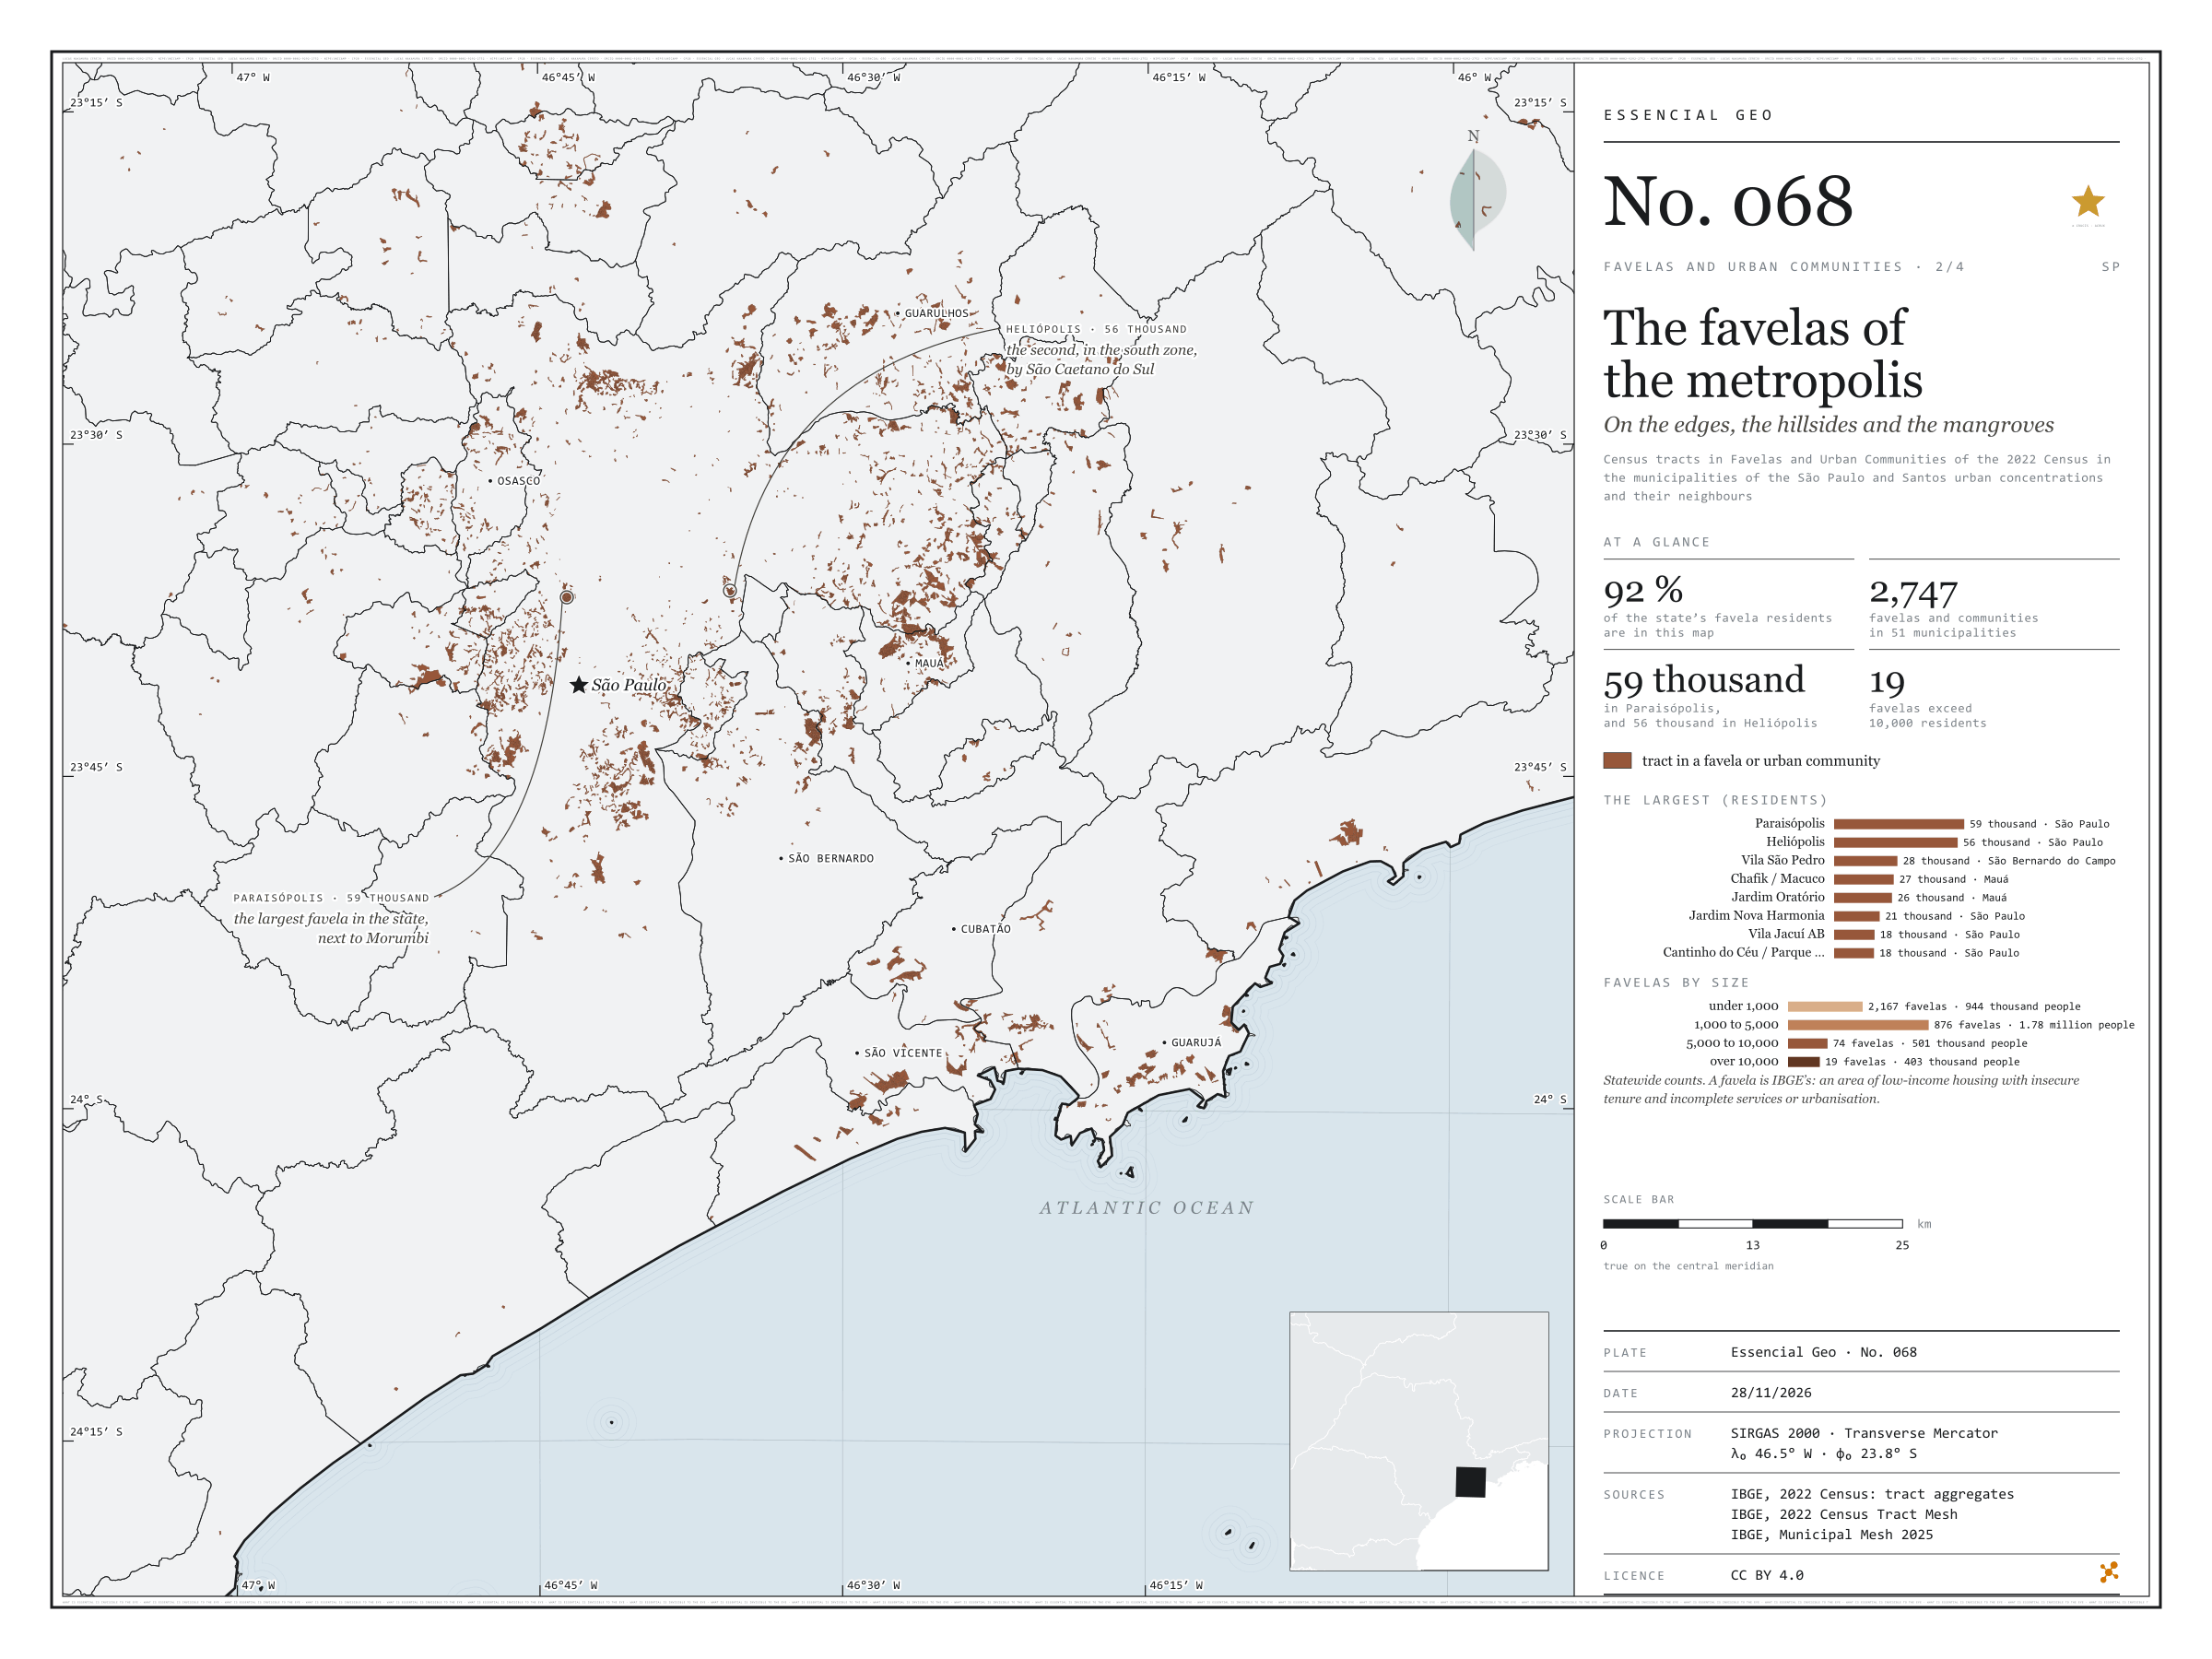
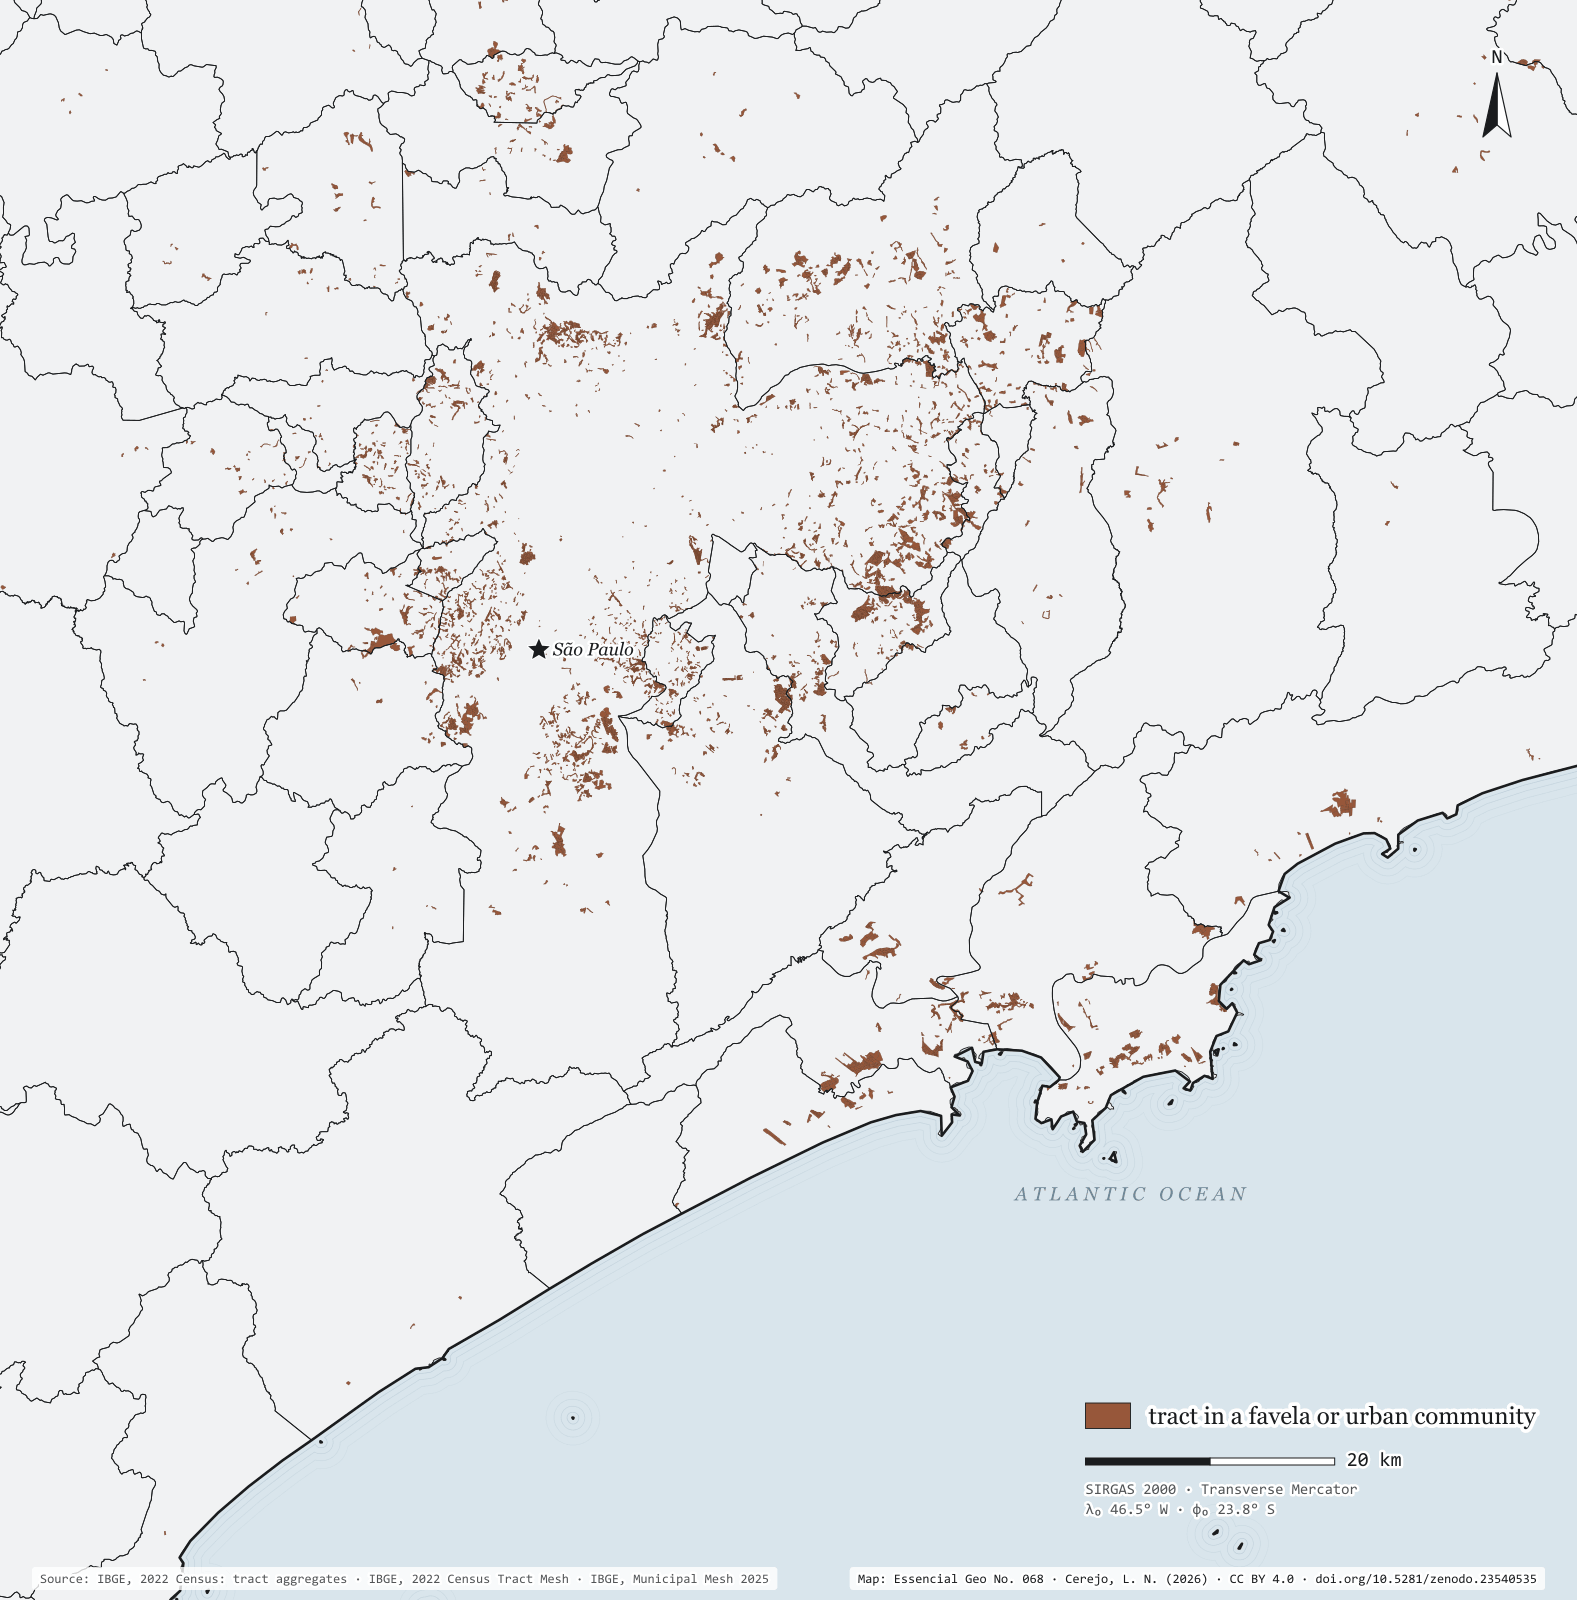
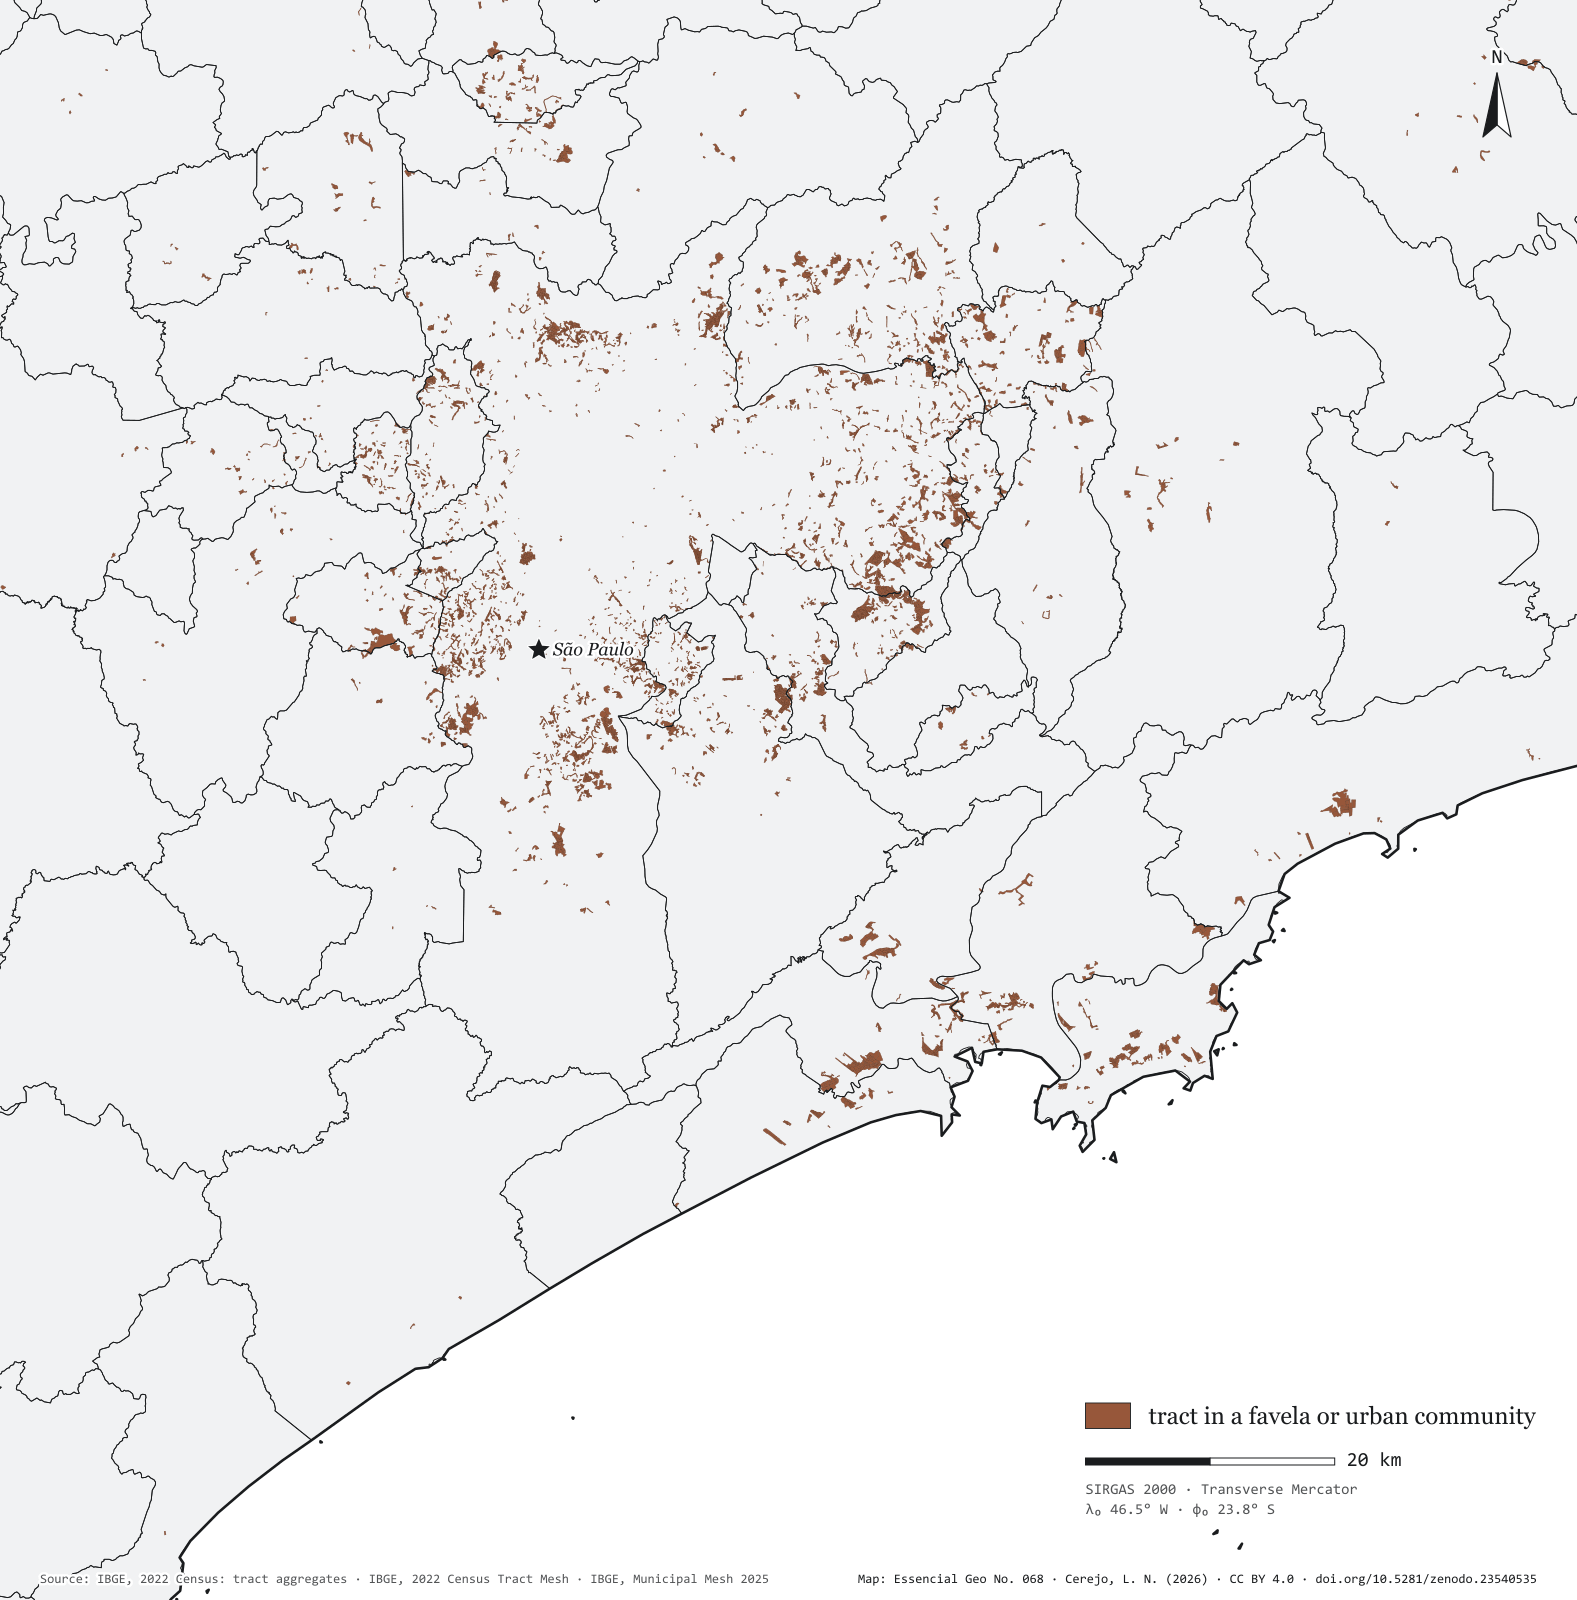
Fig. 068Greater São Paulo and the Santos coast (SP)EPSG:4674Source: IBGE
Seen tract by tract, the favelas of Greater São Paulo and the Santos coast are not one patch but hundreds of fragments on valley floors, hillsides and the edges of reservoirs, streams and mangroves. The map window, from Francisco Morato to Guarujá, holds 92% of the state’s favela residents, in 2,747 communities across 51 municipalities. The two largest are in the capital: Paraisópolis, with 59,000 residents, beside Morumbi, and Heliópolis, with 56,000, in the south, next to São Caetano do Sul. Then come Vila São Pedro, in São Bernardo do Campo, with 28,000, and Chafik/Macuco and Jardim Oratório, in Mauá. In the state, only 19 favelas exceed 10,000 residents, with 403,000 people between them; most are small: 2,167 have fewer than 1,000 residents, and the bulk of the population, 1.78 million, lives in the 876 with 1,000 to 5,000.
Technical record · downloads · citation
At a glance
Favela residents by favela size, statewide (people)
under 1,00026%
1,000 to 5,00049.1%
5,000 to 10,00013.8%
over 10,00011.1%
The state’s favela residents in this window
92%
2,747 favelas and communities in 51 municipalities
Residents of Paraisópolis
58,527people
Layers
setores_fcupolygon8,008 tracts in Favelas and Urban Communities: community code and name, municipality, people and occupied households
municipiospolygon645 municipalities: people, people in favelas, number of communities and population share
regioes_intermediariaspolygon11 intermediate geographic regions
Census tracts coded as a Favela or Urban Community in the 2022 Census aggregates, drawn over the municipal mesh; residents of each community = sum of people in its tracts.
The map without a frame, with legend, scale, reference system and credit written on it: ready for papers, lectures and slides. In two versions: with the basemap (neighbours and sea) or only the mapped area, on white.
CEREJO, Lucas Nakamura. As favelas da metrópole: nas margens, nas encostas e nos mangues. Versão 1.0.0. [S. l.]: Zenodo, 2026. Conjunto de dados. DOI: 10.5281/zenodo.23540535. Disponível em: https://doi.org/10.5281/zenodo.23540535. Acesso em: 10 nov. 2026.
Cerejo, L. N. (2026). As favelas da metrópole: nas margens, nas encostas e nos mangues [The favelas of the metropolis: On the banks, the slopes and the mangroves] (Version 1.0.0) [Data set]. Zenodo. https://doi.org/10.5281/zenodo.23540535
@dataset{cerejo2026_favelas_na_metropole_sp,
  author    = {Cerejo, Lucas Nakamura},
  title     = {As favelas da metrópole: Nas margens, nas encostas e nos mangues},
  year      = {2026},
  publisher = {Zenodo},
  version   = {1.0.0},
  doi       = {10.5281/zenodo.23540535},
  url       = {https://doi.org/10.5281/zenodo.23540535},
  language  = {portuguese},
  note      = {English title: The favelas of the metropolis: On the banks, the slopes and the mangroves. Licence CC BY 4.0}
}
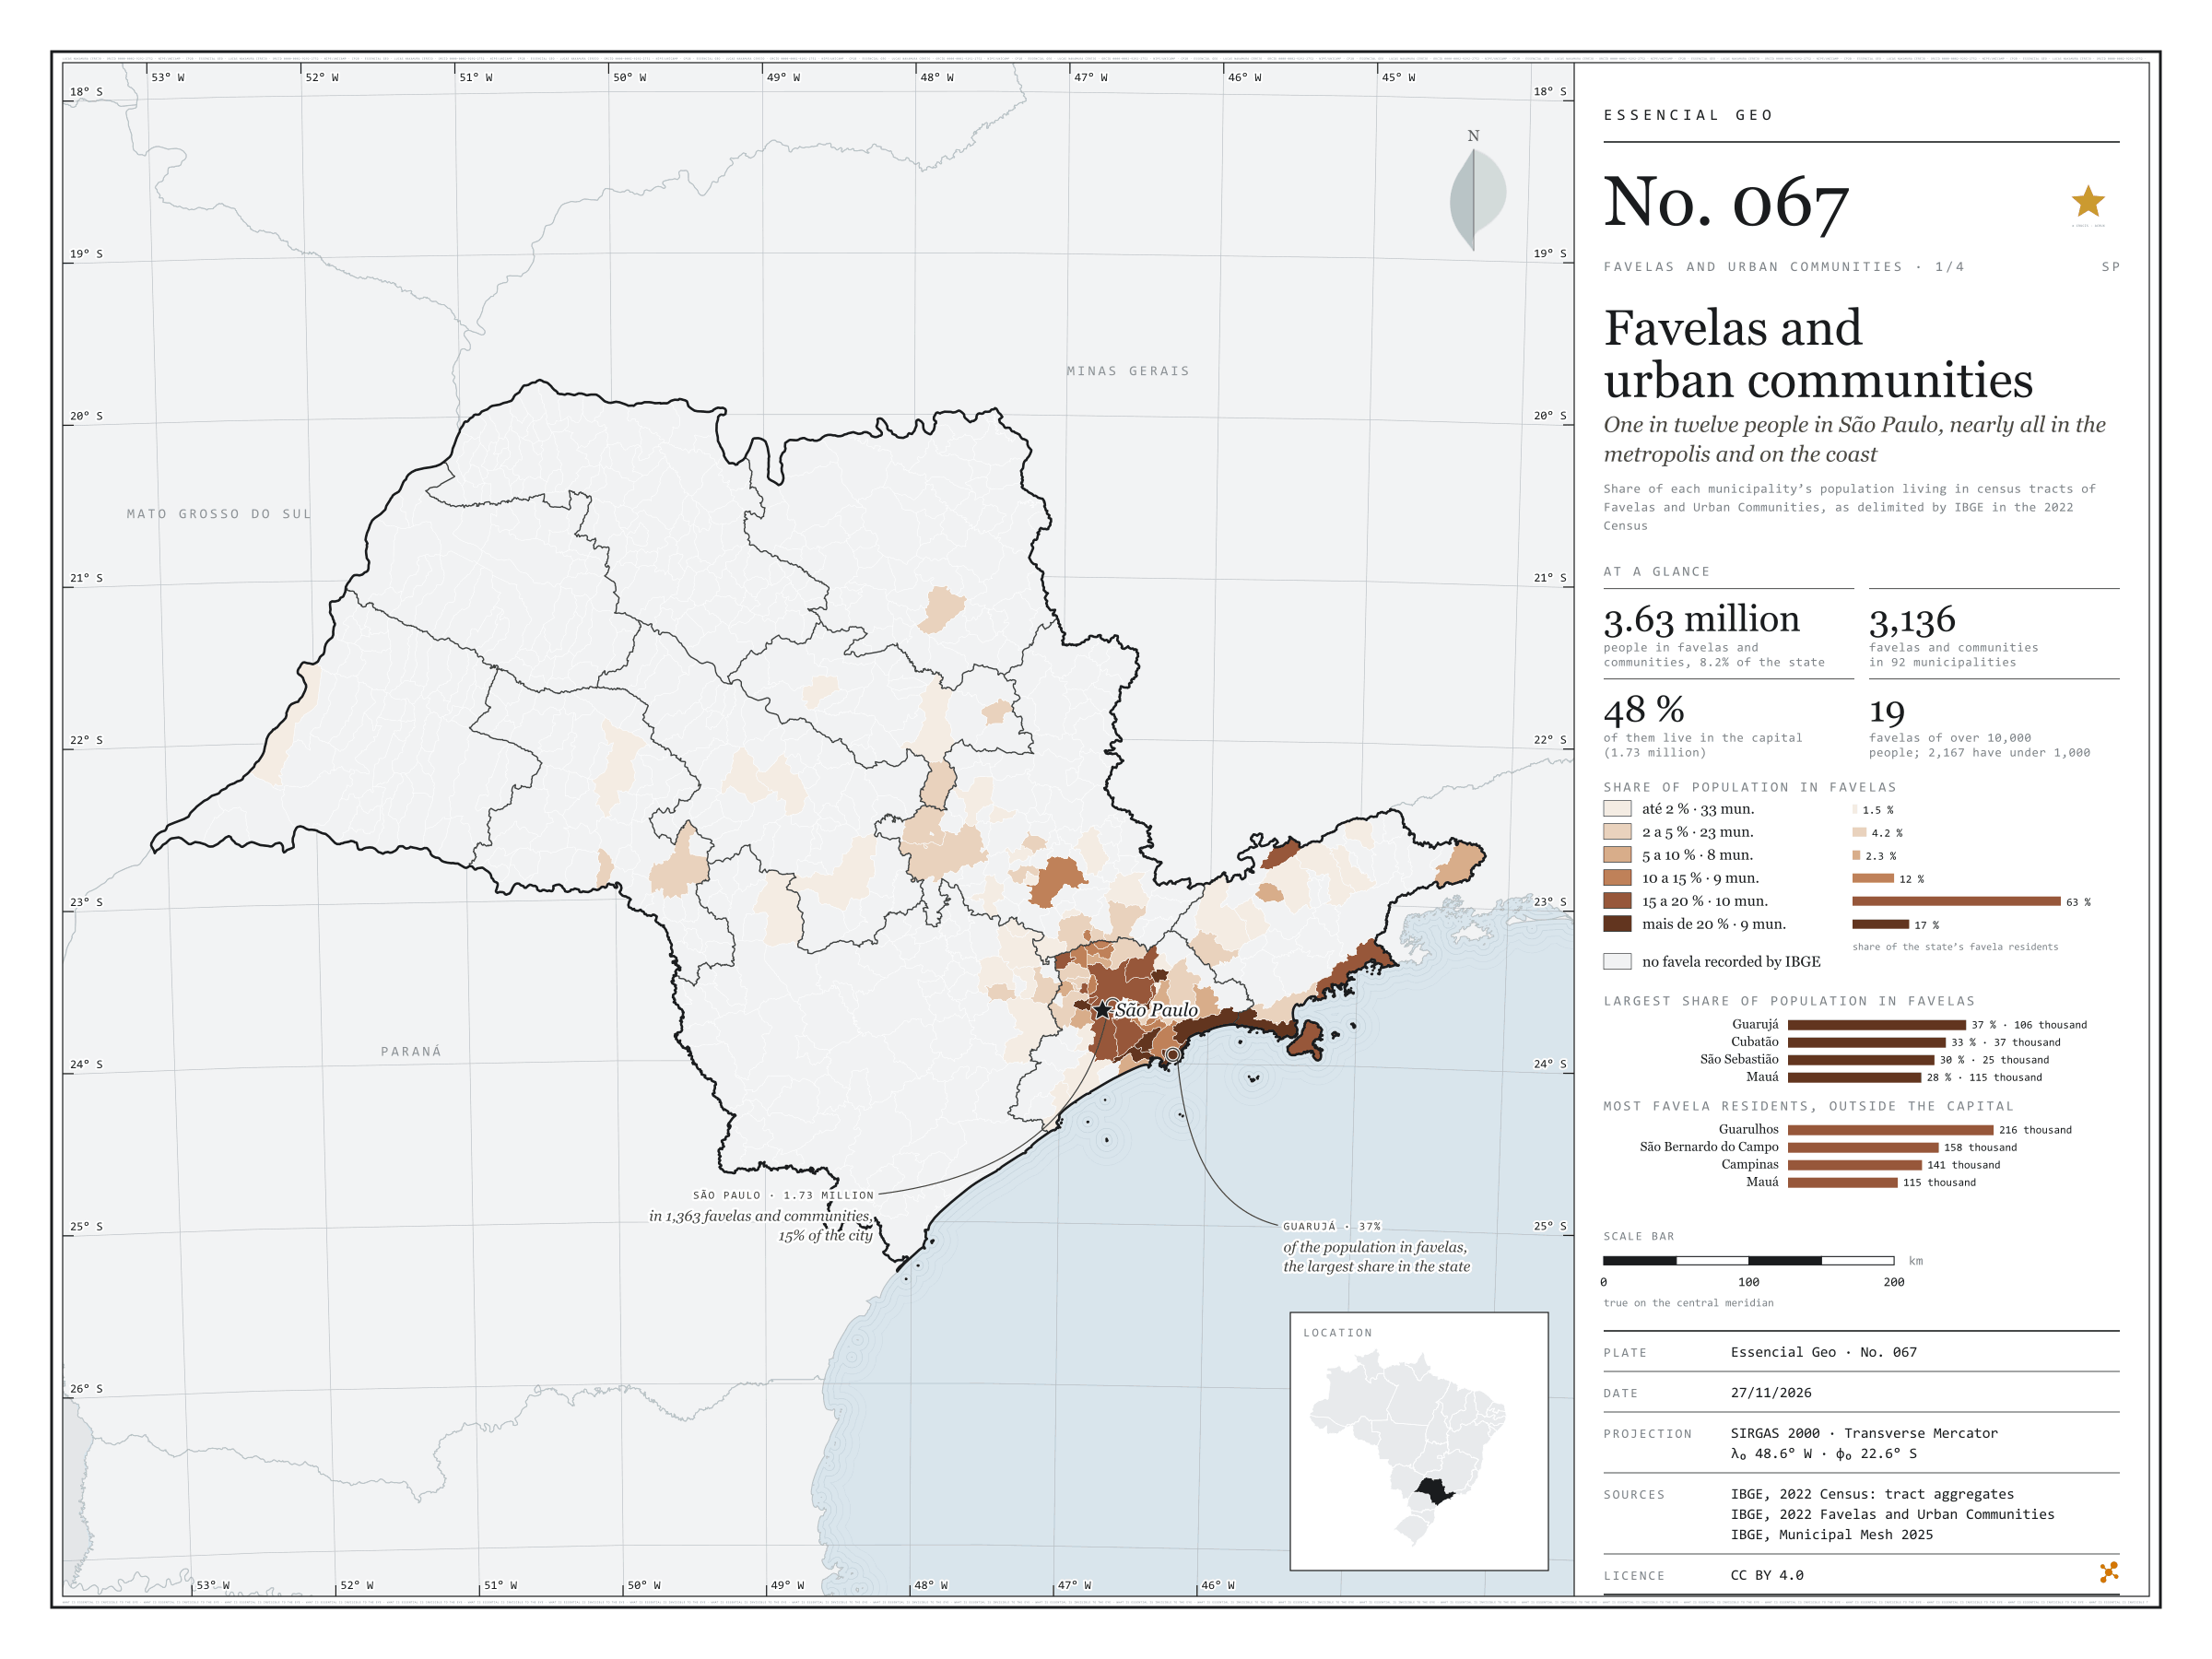
One in twelve people in São Paulo, nearly all in the metropolis and on the coast
Fig. 067São Paulo State (SP)EPSG:4674Source: IBGE
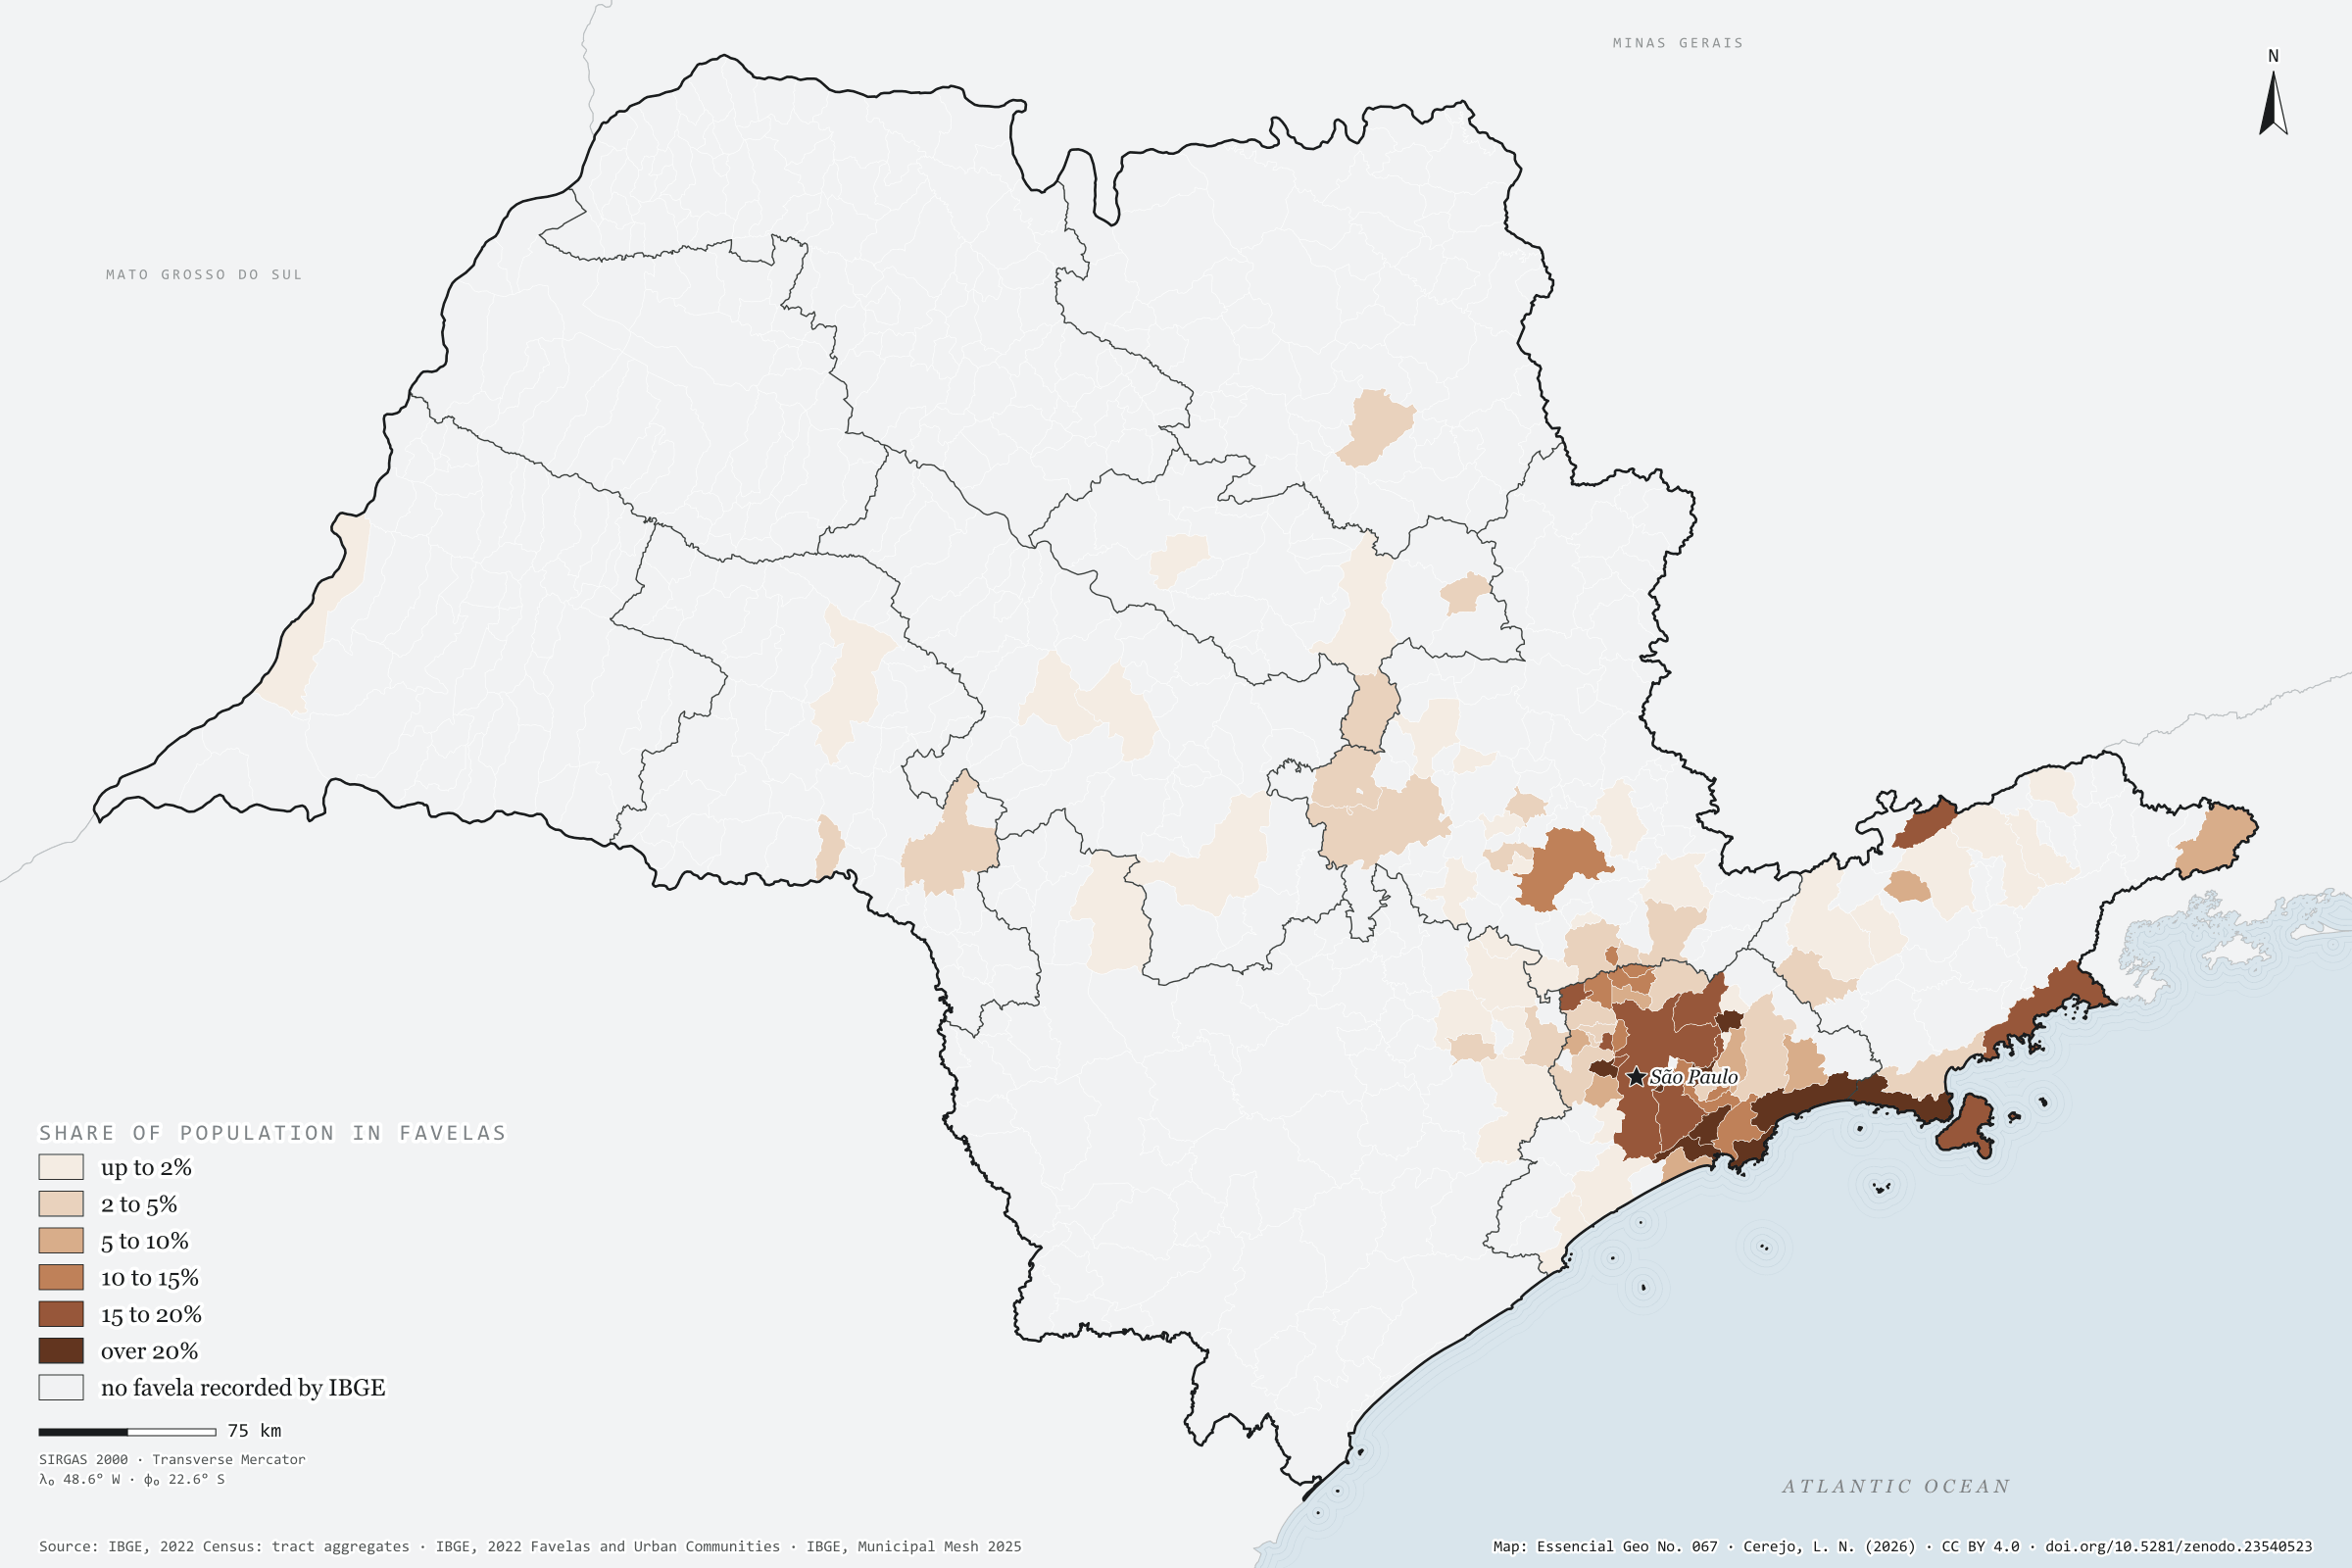
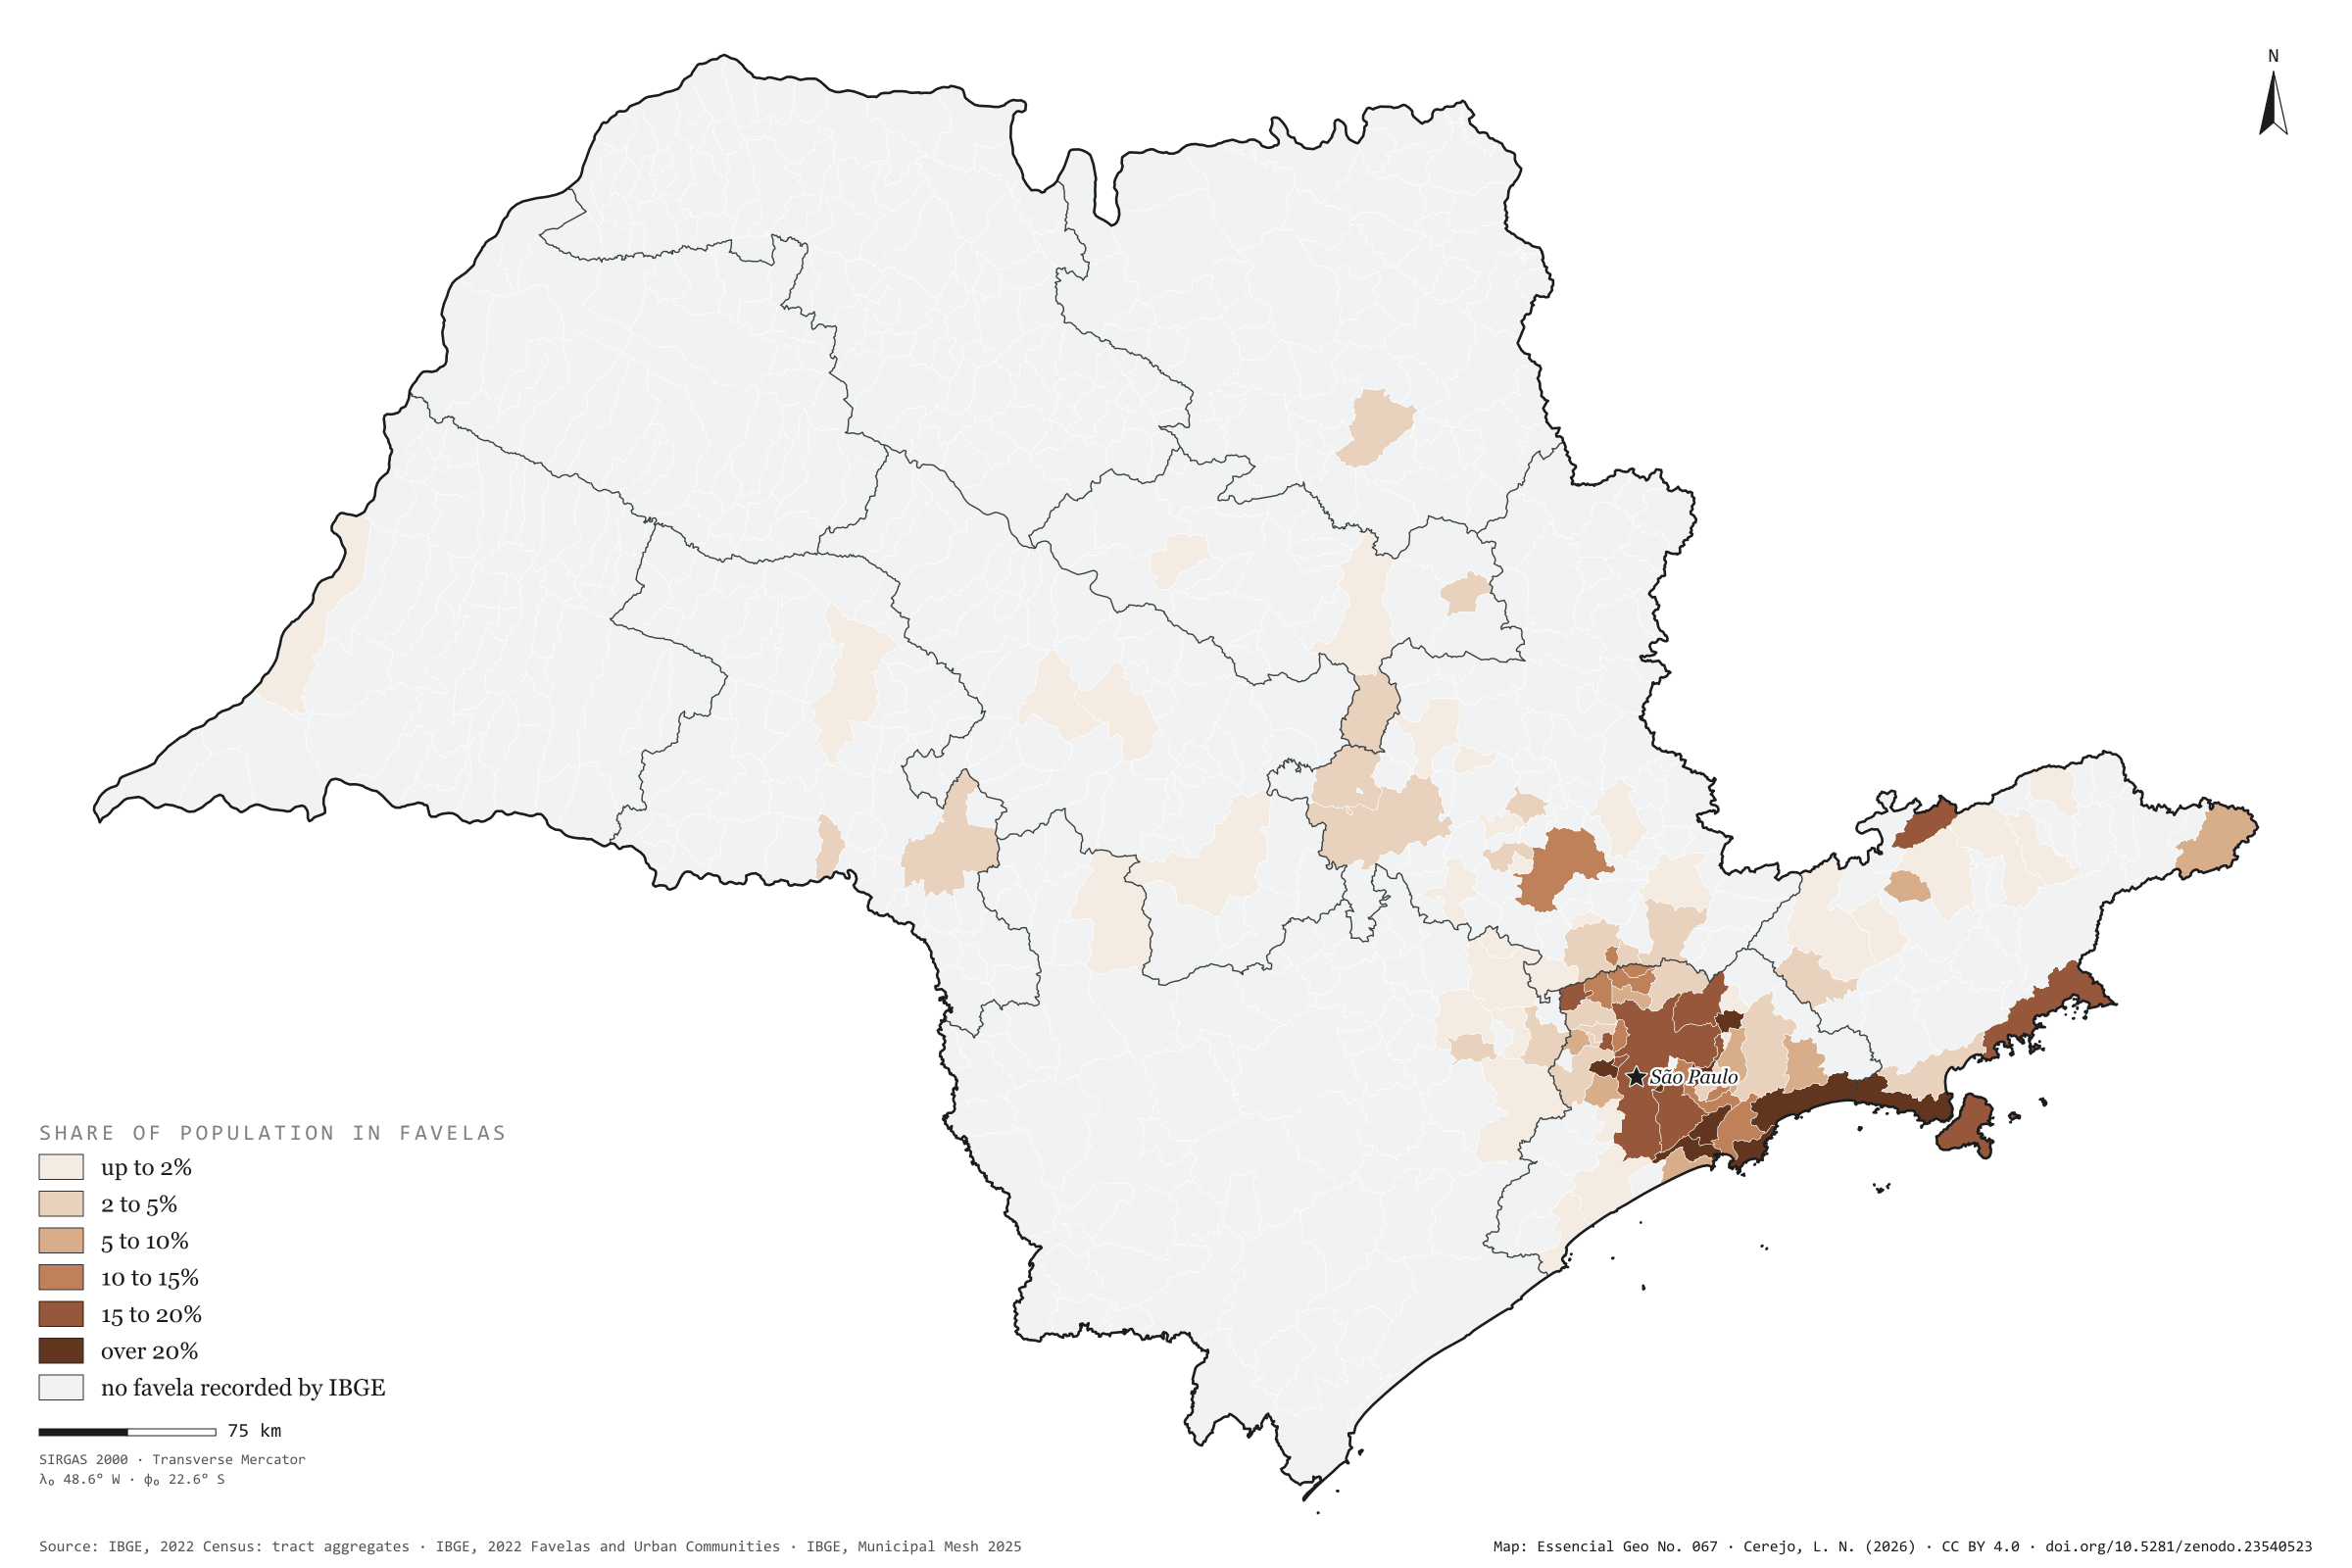
In 2022, 3.63 million people in São Paulo lived in tracts that IBGE classed as Favelas and Urban Communities: 8.2% of the population, one in twelve. There are 3,136 favelas and communities in 92 of the 645 municipalities. The capital has 1.73 million residents in them, nearly half the state’s total, in 1,363 communities: 15% of the city. By share of population, the coast leads: in Guarujá, 37% of residents live in favelas; in Cubatão, 33%; in São Sebastião, 30%. Outside the capital, the town with most people in favelas is Guarulhos, with 216,000, ahead of São Bernardo do Campo and Campinas. Inland, the exception is Campinas, with 12% of its population in favelas; in Ribeirão Preto it is 3%, in Sorocaba 2%. First plate of the collection “Favelas and urban communities”.
Technical record · downloads · citation
At a glance
Favela residents by the municipality’s share of population in favelas (people)
up to 2%1.5%
2 to 5%4.2%
5 to 10%2.3%
10 to 15%12.5%
15 to 20%62.5%
over 20%17%
People in favelas and urban communities
8.2%
3.63 million people
Favelas and urban communities
3,136communities
in 92 municipalities
Layers
setores_fcupolygon8,008 tracts in Favelas and Urban Communities: community code and name, municipality, people and occupied households
municipiospolygon645 municipalities: people, people in favelas, number of communities, population share, surroundings and income inside and outside
regioes_intermediariaspolygon11 intermediate geographic regions
People in census tracts coded as a Favela or Urban Community over all people in each municipality, from the 2022 Census tract aggregates, in six classes; municipalities with no recorded favela shown apart.
The map without a frame, with legend, scale, reference system and credit written on it: ready for papers, lectures and slides. In two versions: with the basemap (neighbours and sea) or only the mapped area, on white.
CEREJO, Lucas Nakamura. Favelas e comunidades urbanas: um em cada doze paulistas, quase todos na metrópole e no litoral. Versão 1.0.0. [S. l.]: Zenodo, 2026. Conjunto de dados. DOI: 10.5281/zenodo.23540523. Disponível em: https://doi.org/10.5281/zenodo.23540523. Acesso em: 10 nov. 2026.
Cerejo, L. N. (2026). Favelas e comunidades urbanas: um em cada doze paulistas, quase todos na metrópole e no litoral [Favelas and urban communities: One in twelve people in São Paulo, nearly all in the metropolis and on the coast] (Version 1.0.0) [Data set]. Zenodo. https://doi.org/10.5281/zenodo.23540523
@dataset{cerejo2026_favelas_sp,
  author    = {Cerejo, Lucas Nakamura},
  title     = {Favelas e comunidades urbanas: Um em cada doze paulistas, quase todos na metrópole e no litoral},
  year      = {2026},
  publisher = {Zenodo},
  version   = {1.0.0},
  doi       = {10.5281/zenodo.23540523},
  url       = {https://doi.org/10.5281/zenodo.23540523},
  language  = {portuguese},
  note      = {English title: Favelas and urban communities: One in twelve people in São Paulo, nearly all in the metropolis and on the coast. Licence CC BY 4.0}
}
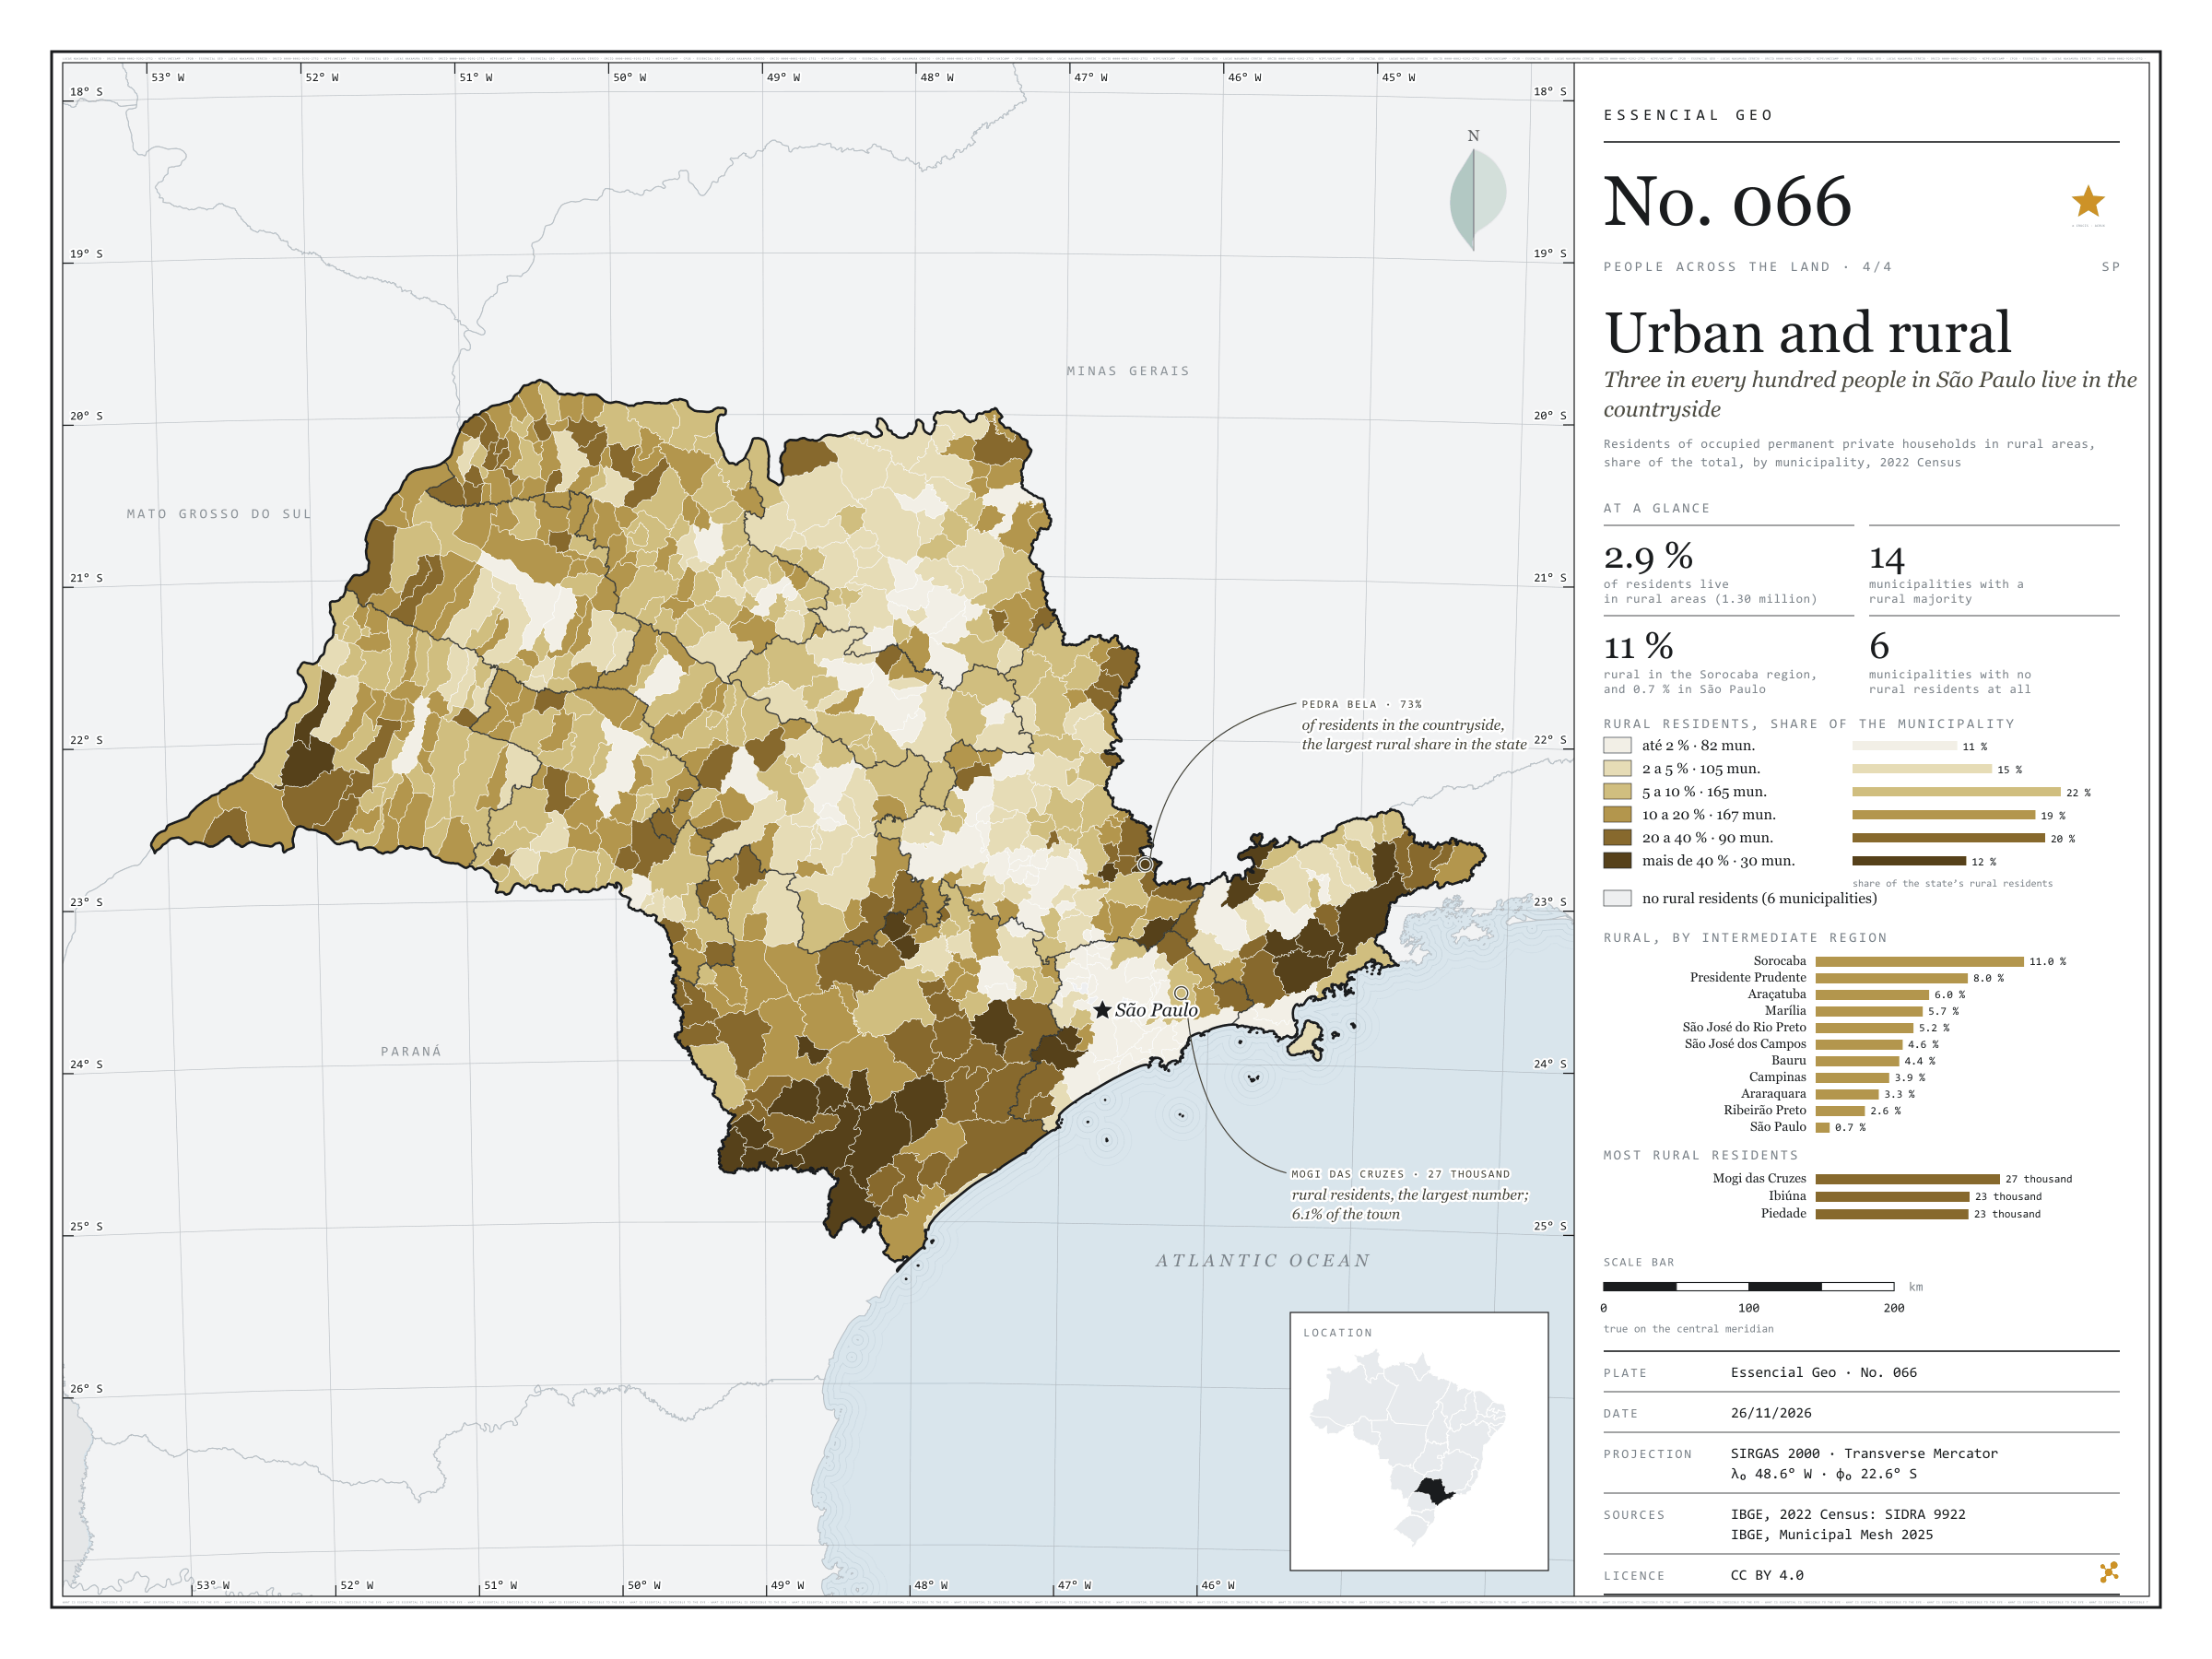
Three in every hundred people in São Paulo live in the countryside
Fig. 066São Paulo State (SP)EPSG:4674Source: IBGE
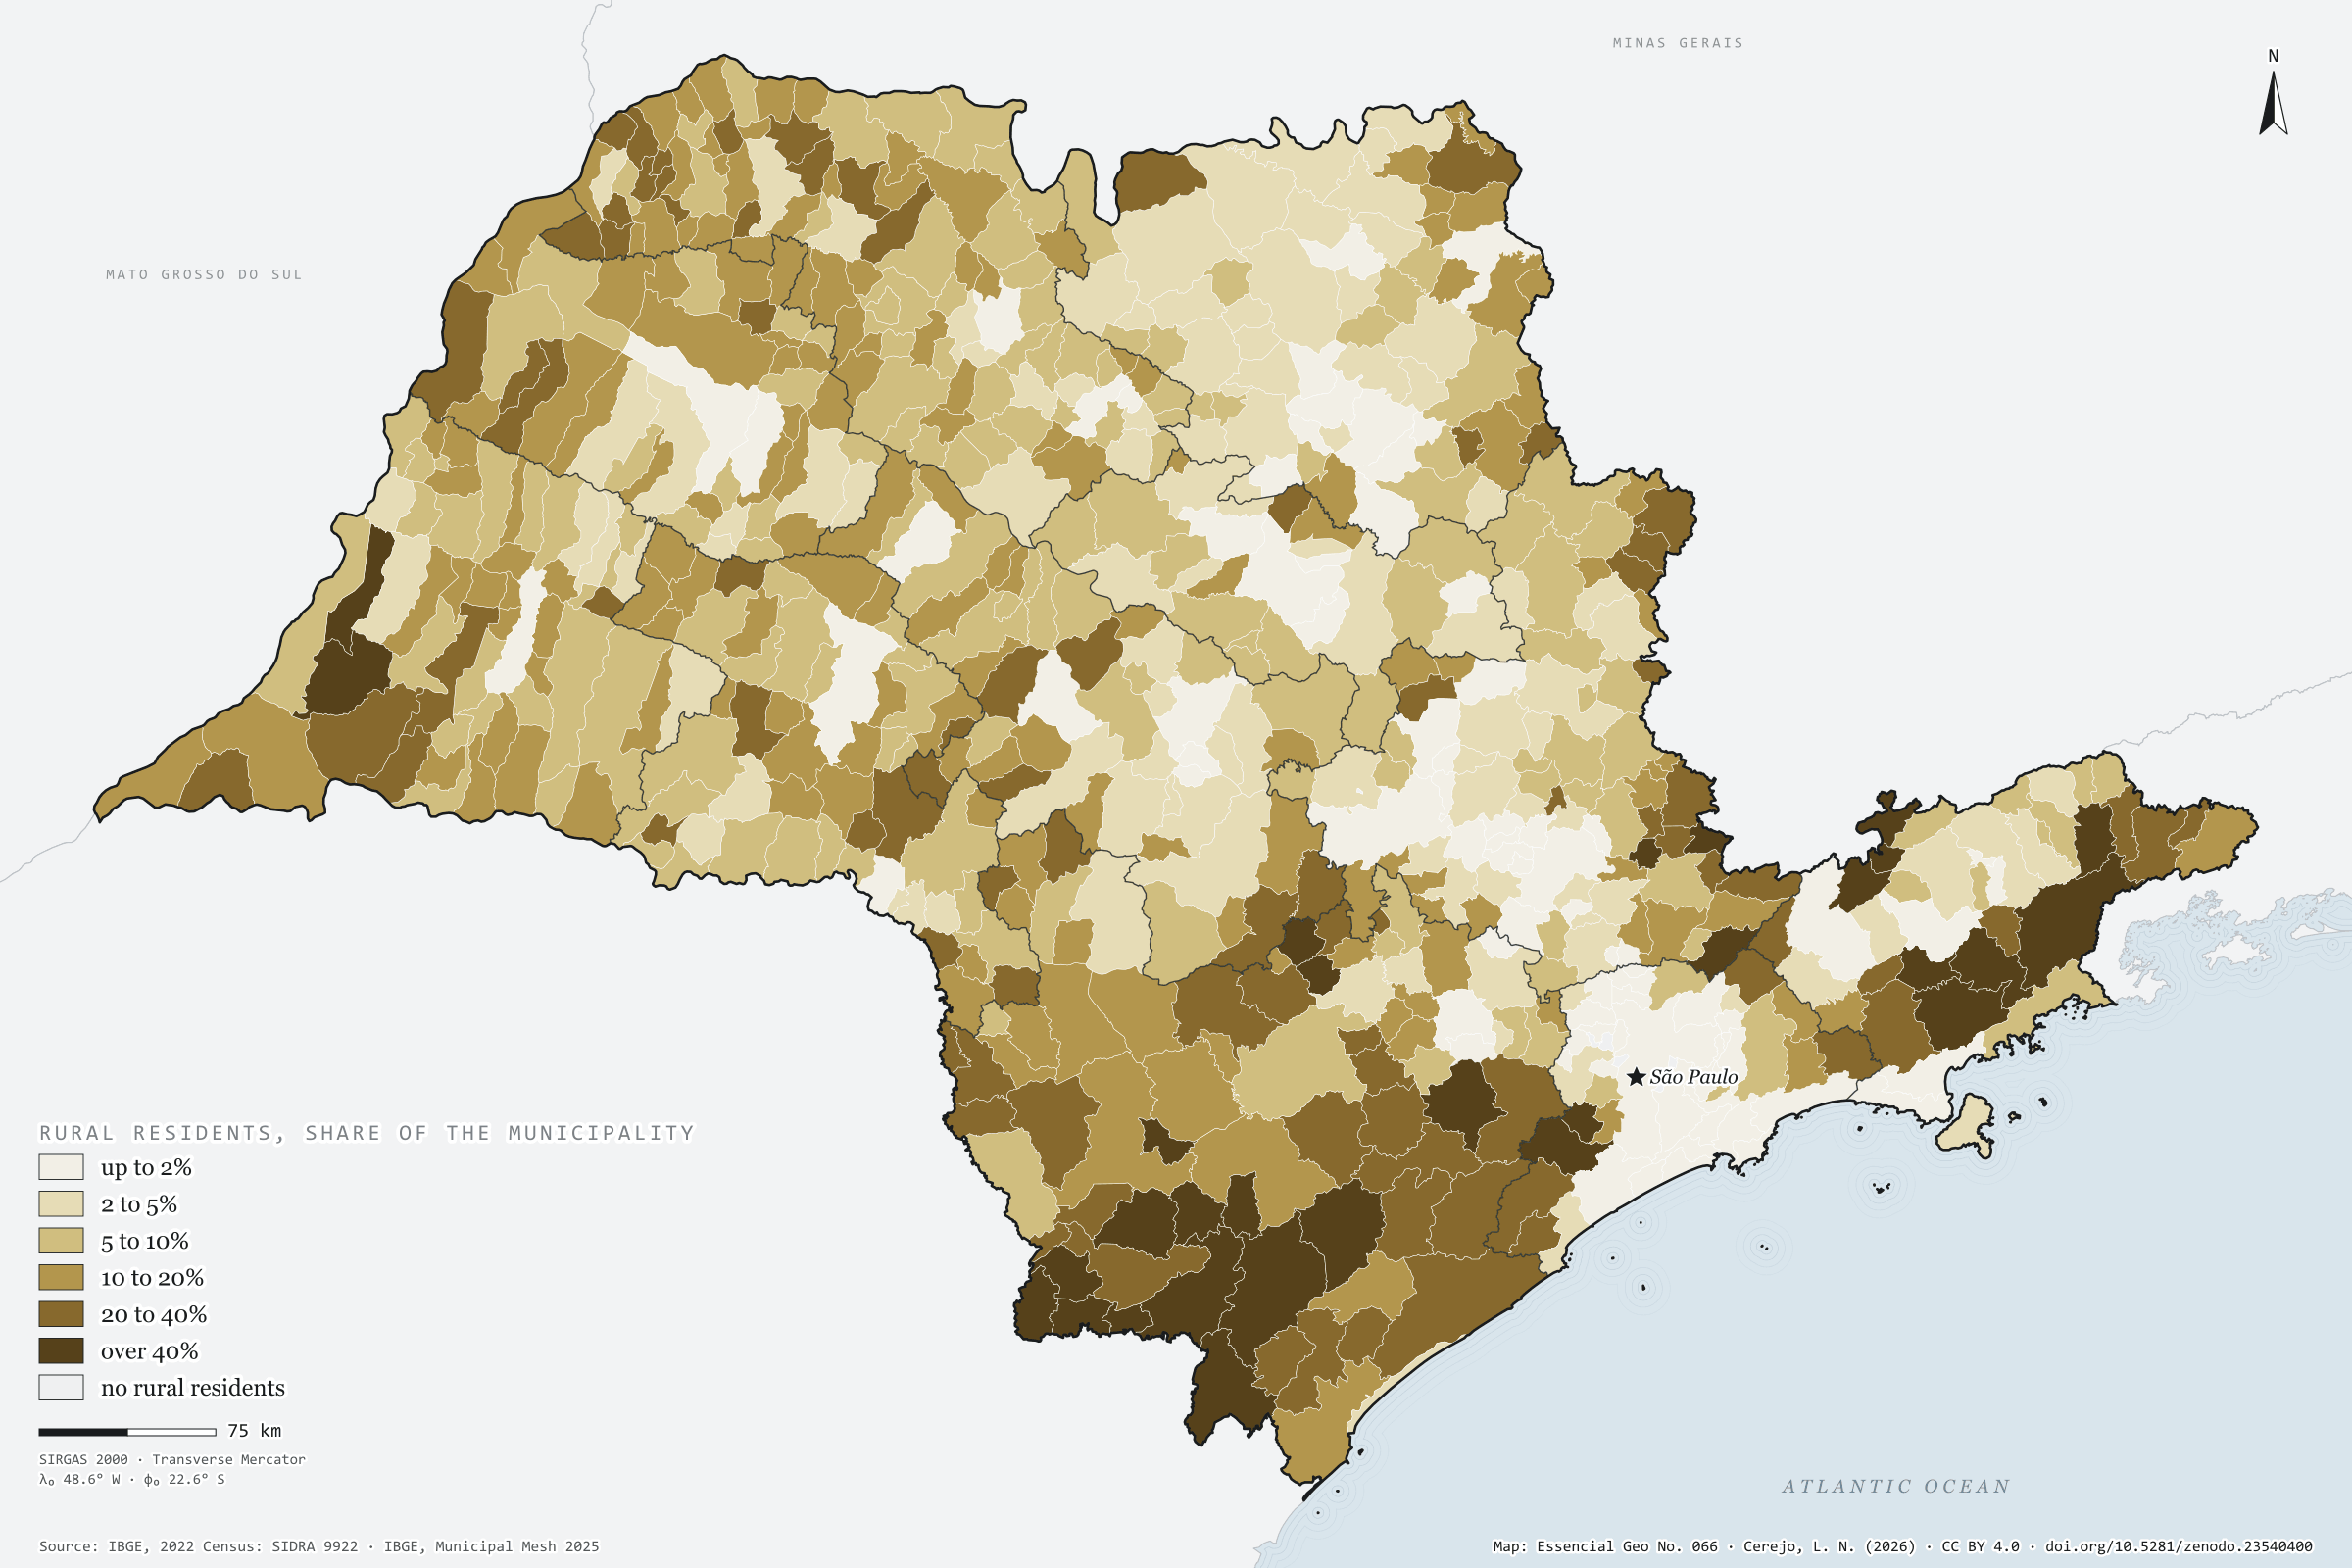
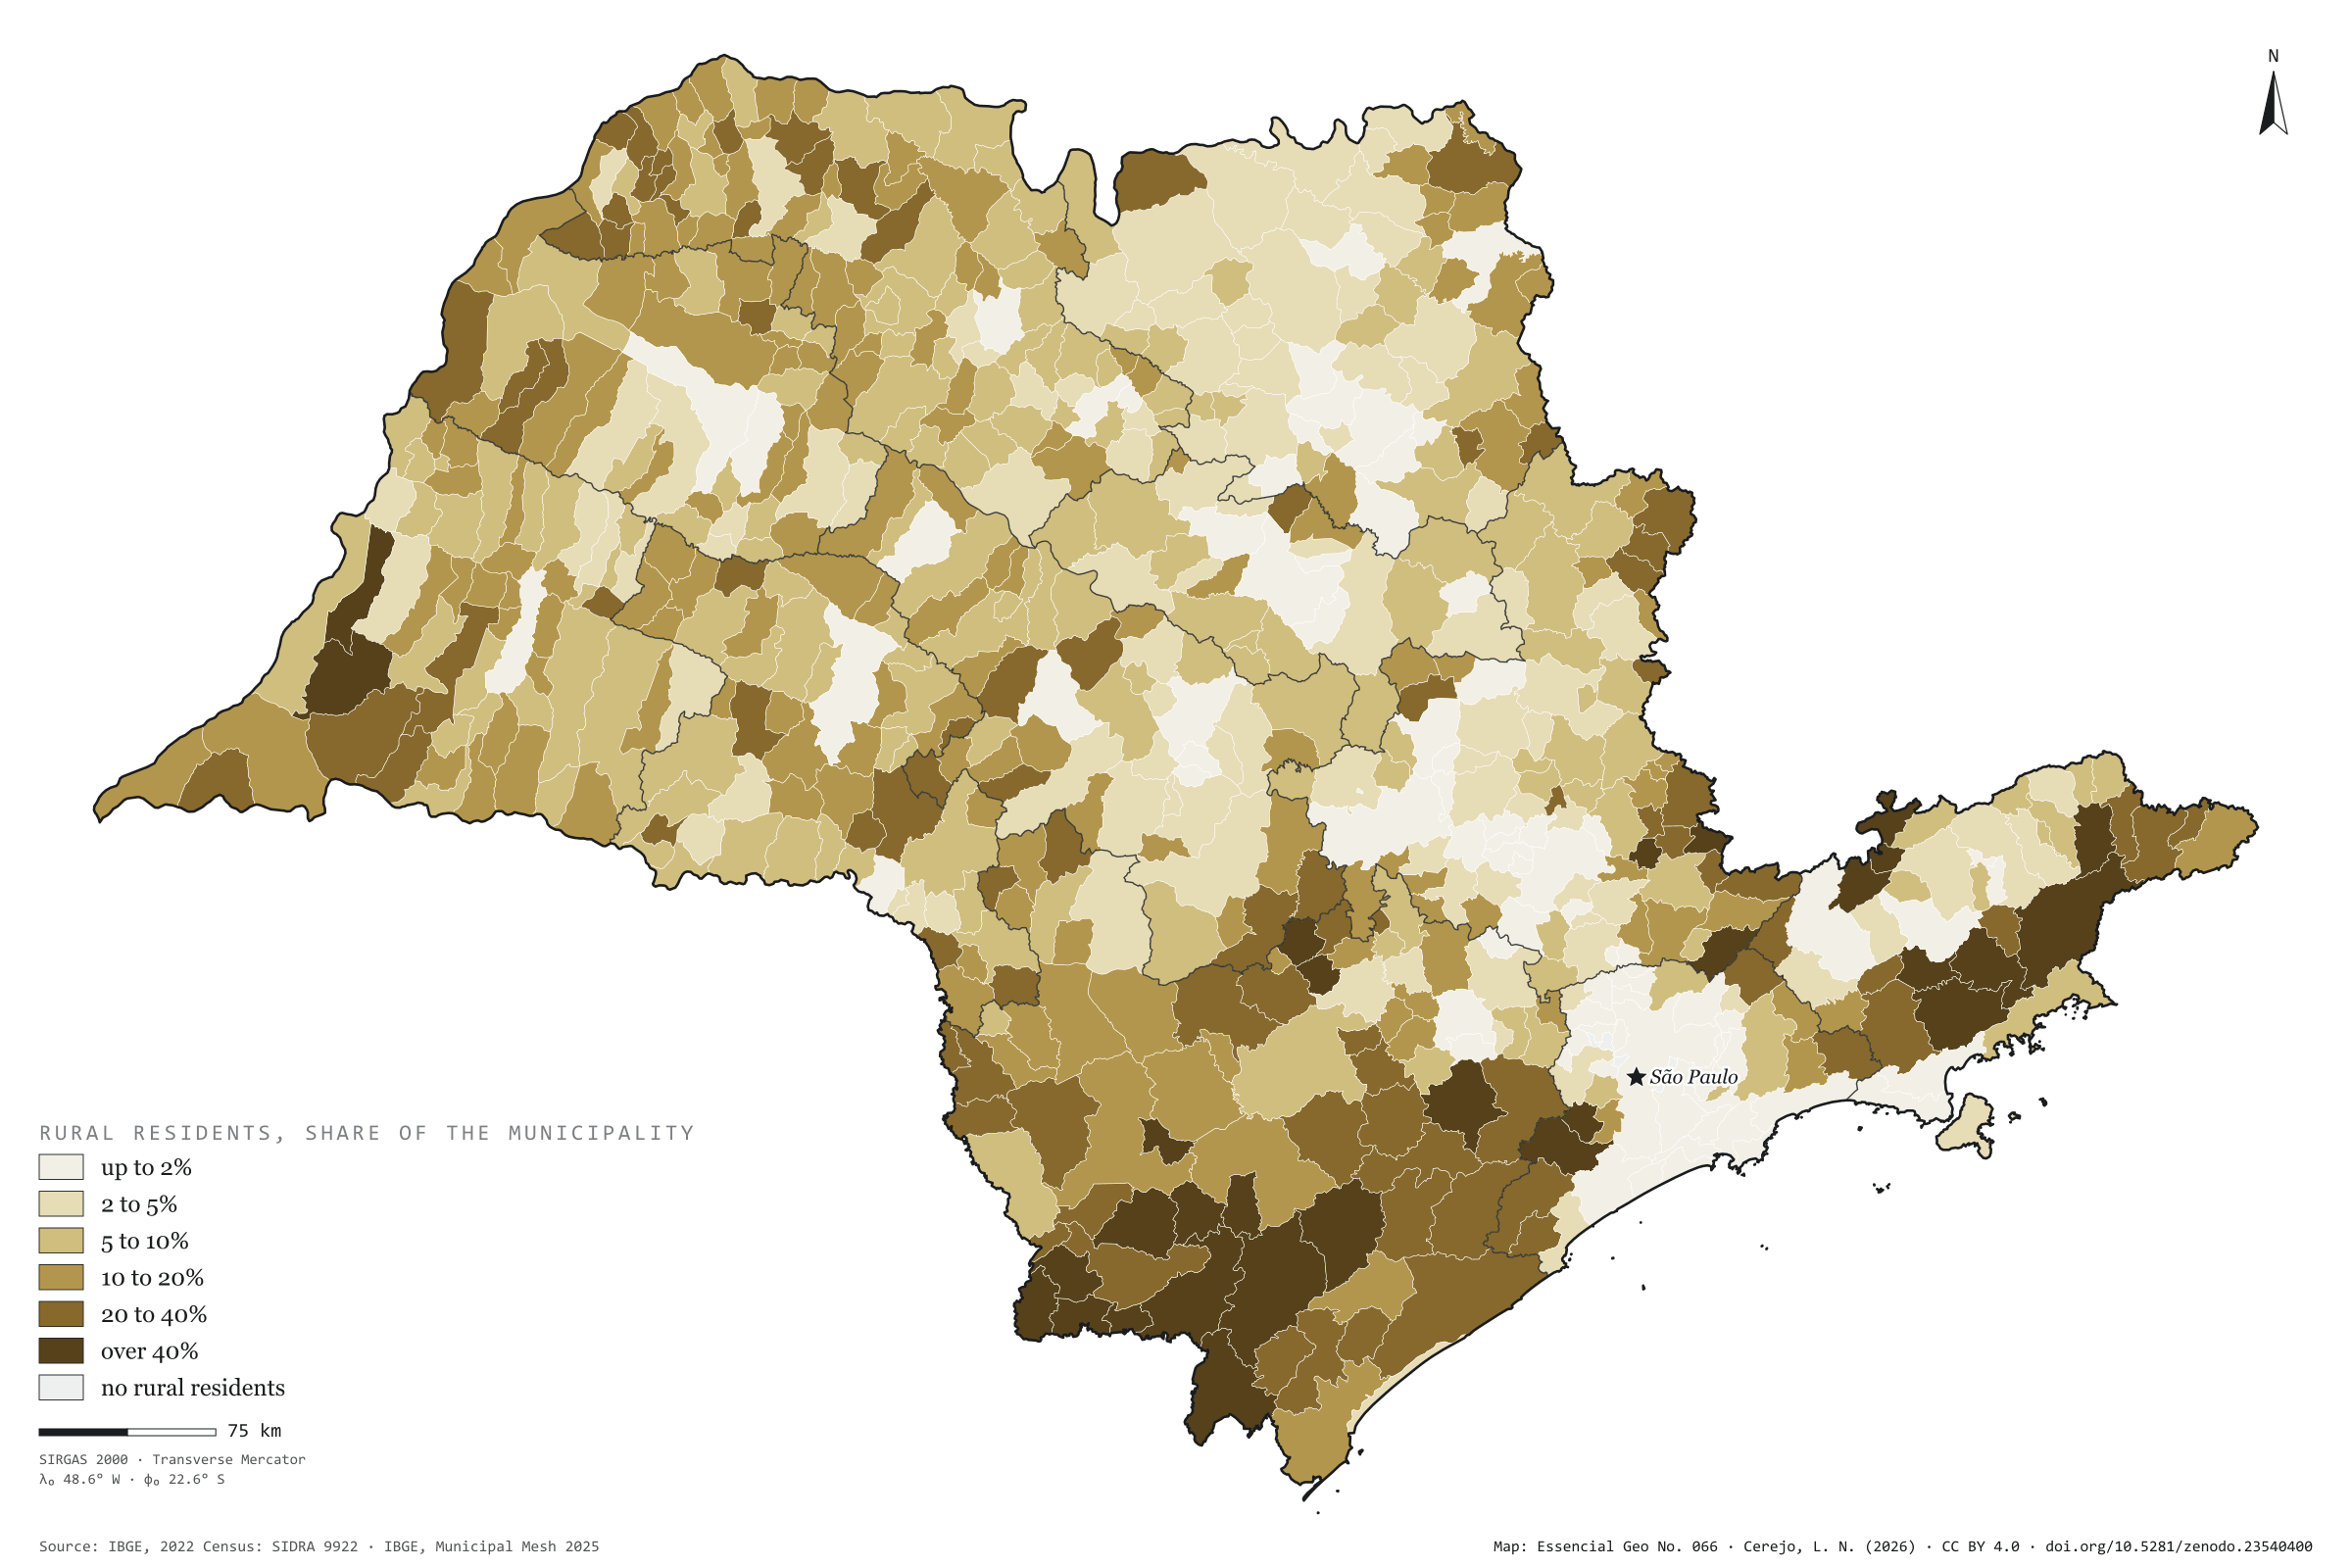
Of the 44.1 million residents of private households in São Paulo, 1.30 million live in rural areas: 2.9%, three in every hundred. The state’s countryside is concentrated in the south and east: in the Sorocaba intermediate region, 11% of residents are rural; in Presidente Prudente, 8%; in São Paulo, 0.7%. The map darkens in the Ribeira Valley and the upper Paranapanema, the Mantiqueira and the Serra do Mar, where towns are small and homes scattered. Pedra Bela, on the border with Minas Gerais, has 73% of its residents in the countryside, and 14 municipalities have a rural majority. In numbers, the largest countryside is Mogi das Cruzes’s, with 27,000 rural residents, ahead of Ibiúna and Piedade; the capital has 16,000. Five municipalities in Greater São Paulo, and Águas de São Pedro, have none. Last plate of the collection “People across the land”.
Technical record · downloads · citation
At a glance
Rural residents by the municipality’s rural share (people)
up to 2%11.1%
2 to 5%14.8%
5 to 10%22.1%
10 to 20%19.4%
20 to 40%20.5%
over 40%12.1%
Residents of rural households
2.9%
1.30 million of 44.1 million
Municipalities with a rural majority
14municipalities
Layers
municipiospolygon645 municipalities: urban and rural households and residents, rural share, age and sex (the same layer as plate 064)
regioes_intermediariaspolygon11 intermediate geographic regions
Residents of occupied permanent private households in rural areas over all residents of those households, by municipality, from SIDRA 9922, in six classes; municipalities with no rural residents shown apart.
The map without a frame, with legend, scale, reference system and credit written on it: ready for papers, lectures and slides. In two versions: with the basemap (neighbours and sea) or only the mapped area, on white.
CEREJO, Lucas Nakamura. Urbano e rural: três em cada cem paulistas moram no campo. Versão 1.0.0. [S. l.]: Zenodo, 2026. Conjunto de dados. DOI: 10.5281/zenodo.23540400. Disponível em: https://doi.org/10.5281/zenodo.23540400. Acesso em: 10 nov. 2026.
Cerejo, L. N. (2026). Urbano e rural: três em cada cem paulistas moram no campo [Urban and rural: Three in every hundred people in São Paulo live in the countryside] (Version 1.0.0) [Data set]. Zenodo. https://doi.org/10.5281/zenodo.23540400
@dataset{cerejo2026_urbano_e_rural_sp,
  author    = {Cerejo, Lucas Nakamura},
  title     = {Urbano e rural: Três em cada cem paulistas moram no campo},
  year      = {2026},
  publisher = {Zenodo},
  version   = {1.0.0},
  doi       = {10.5281/zenodo.23540400},
  url       = {https://doi.org/10.5281/zenodo.23540400},
  language  = {portuguese},
  note      = {English title: Urban and rural: Three in every hundred people in São Paulo live in the countryside. Licence CC BY 4.0}
}
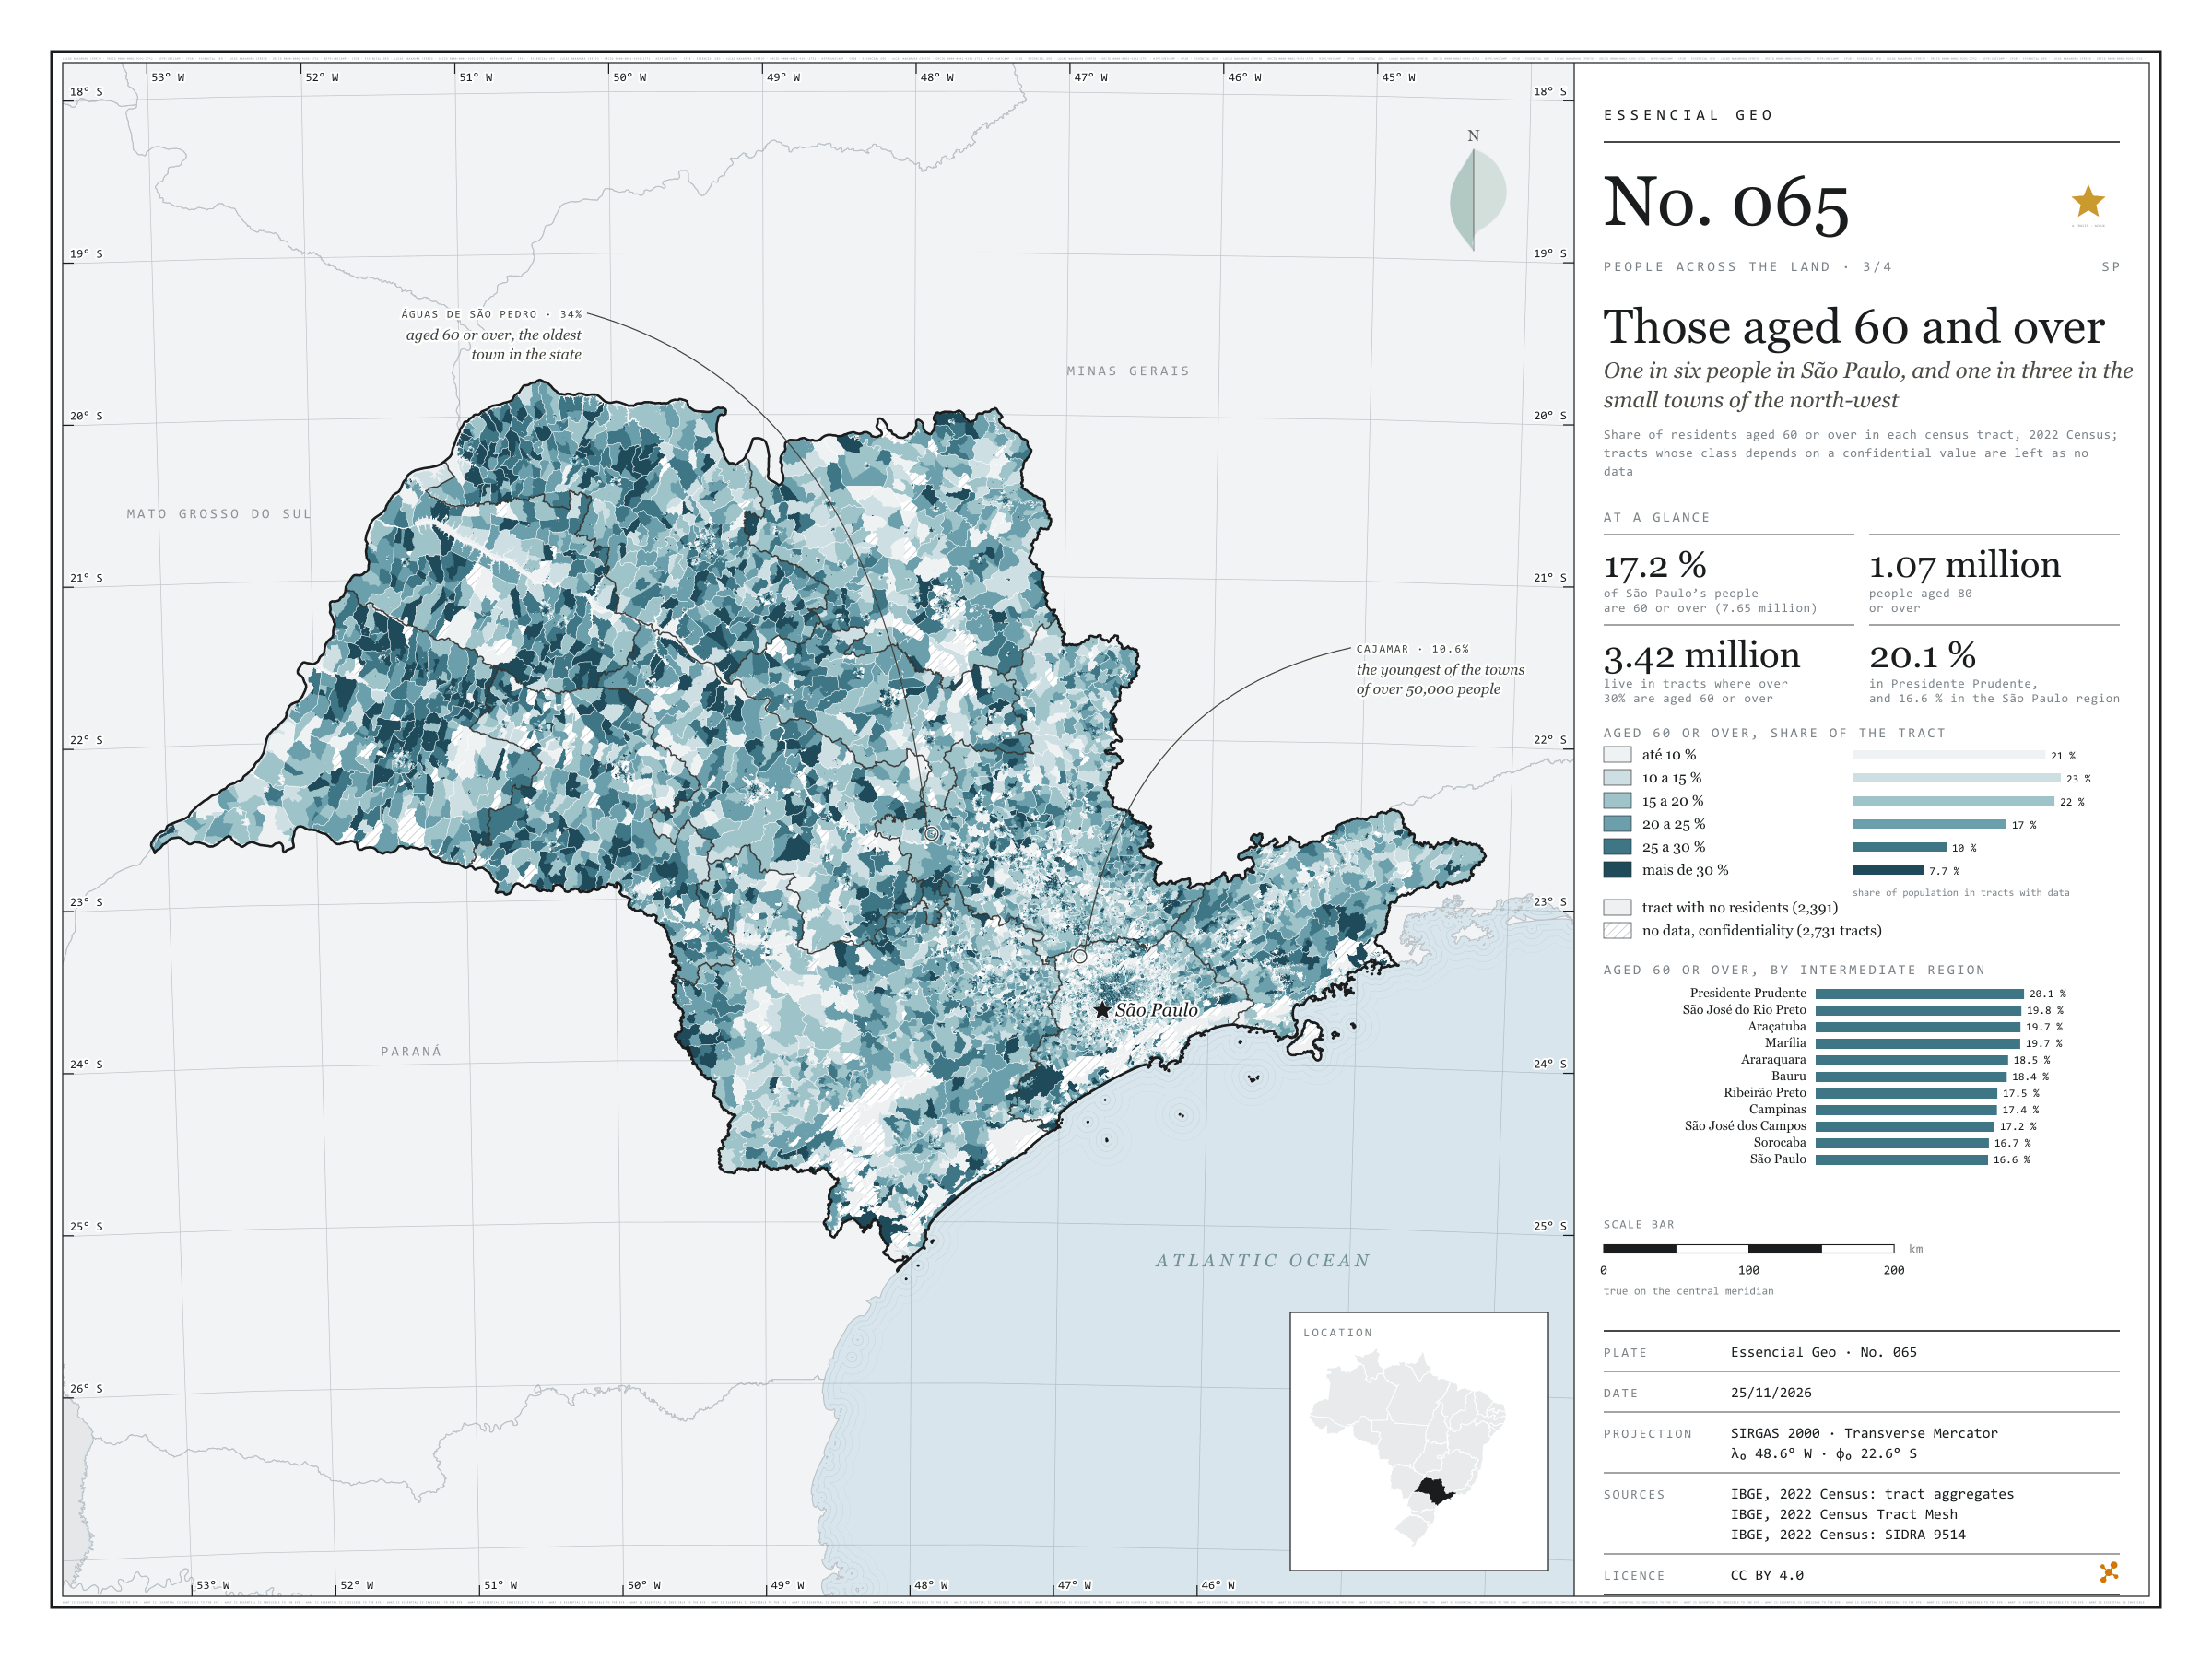
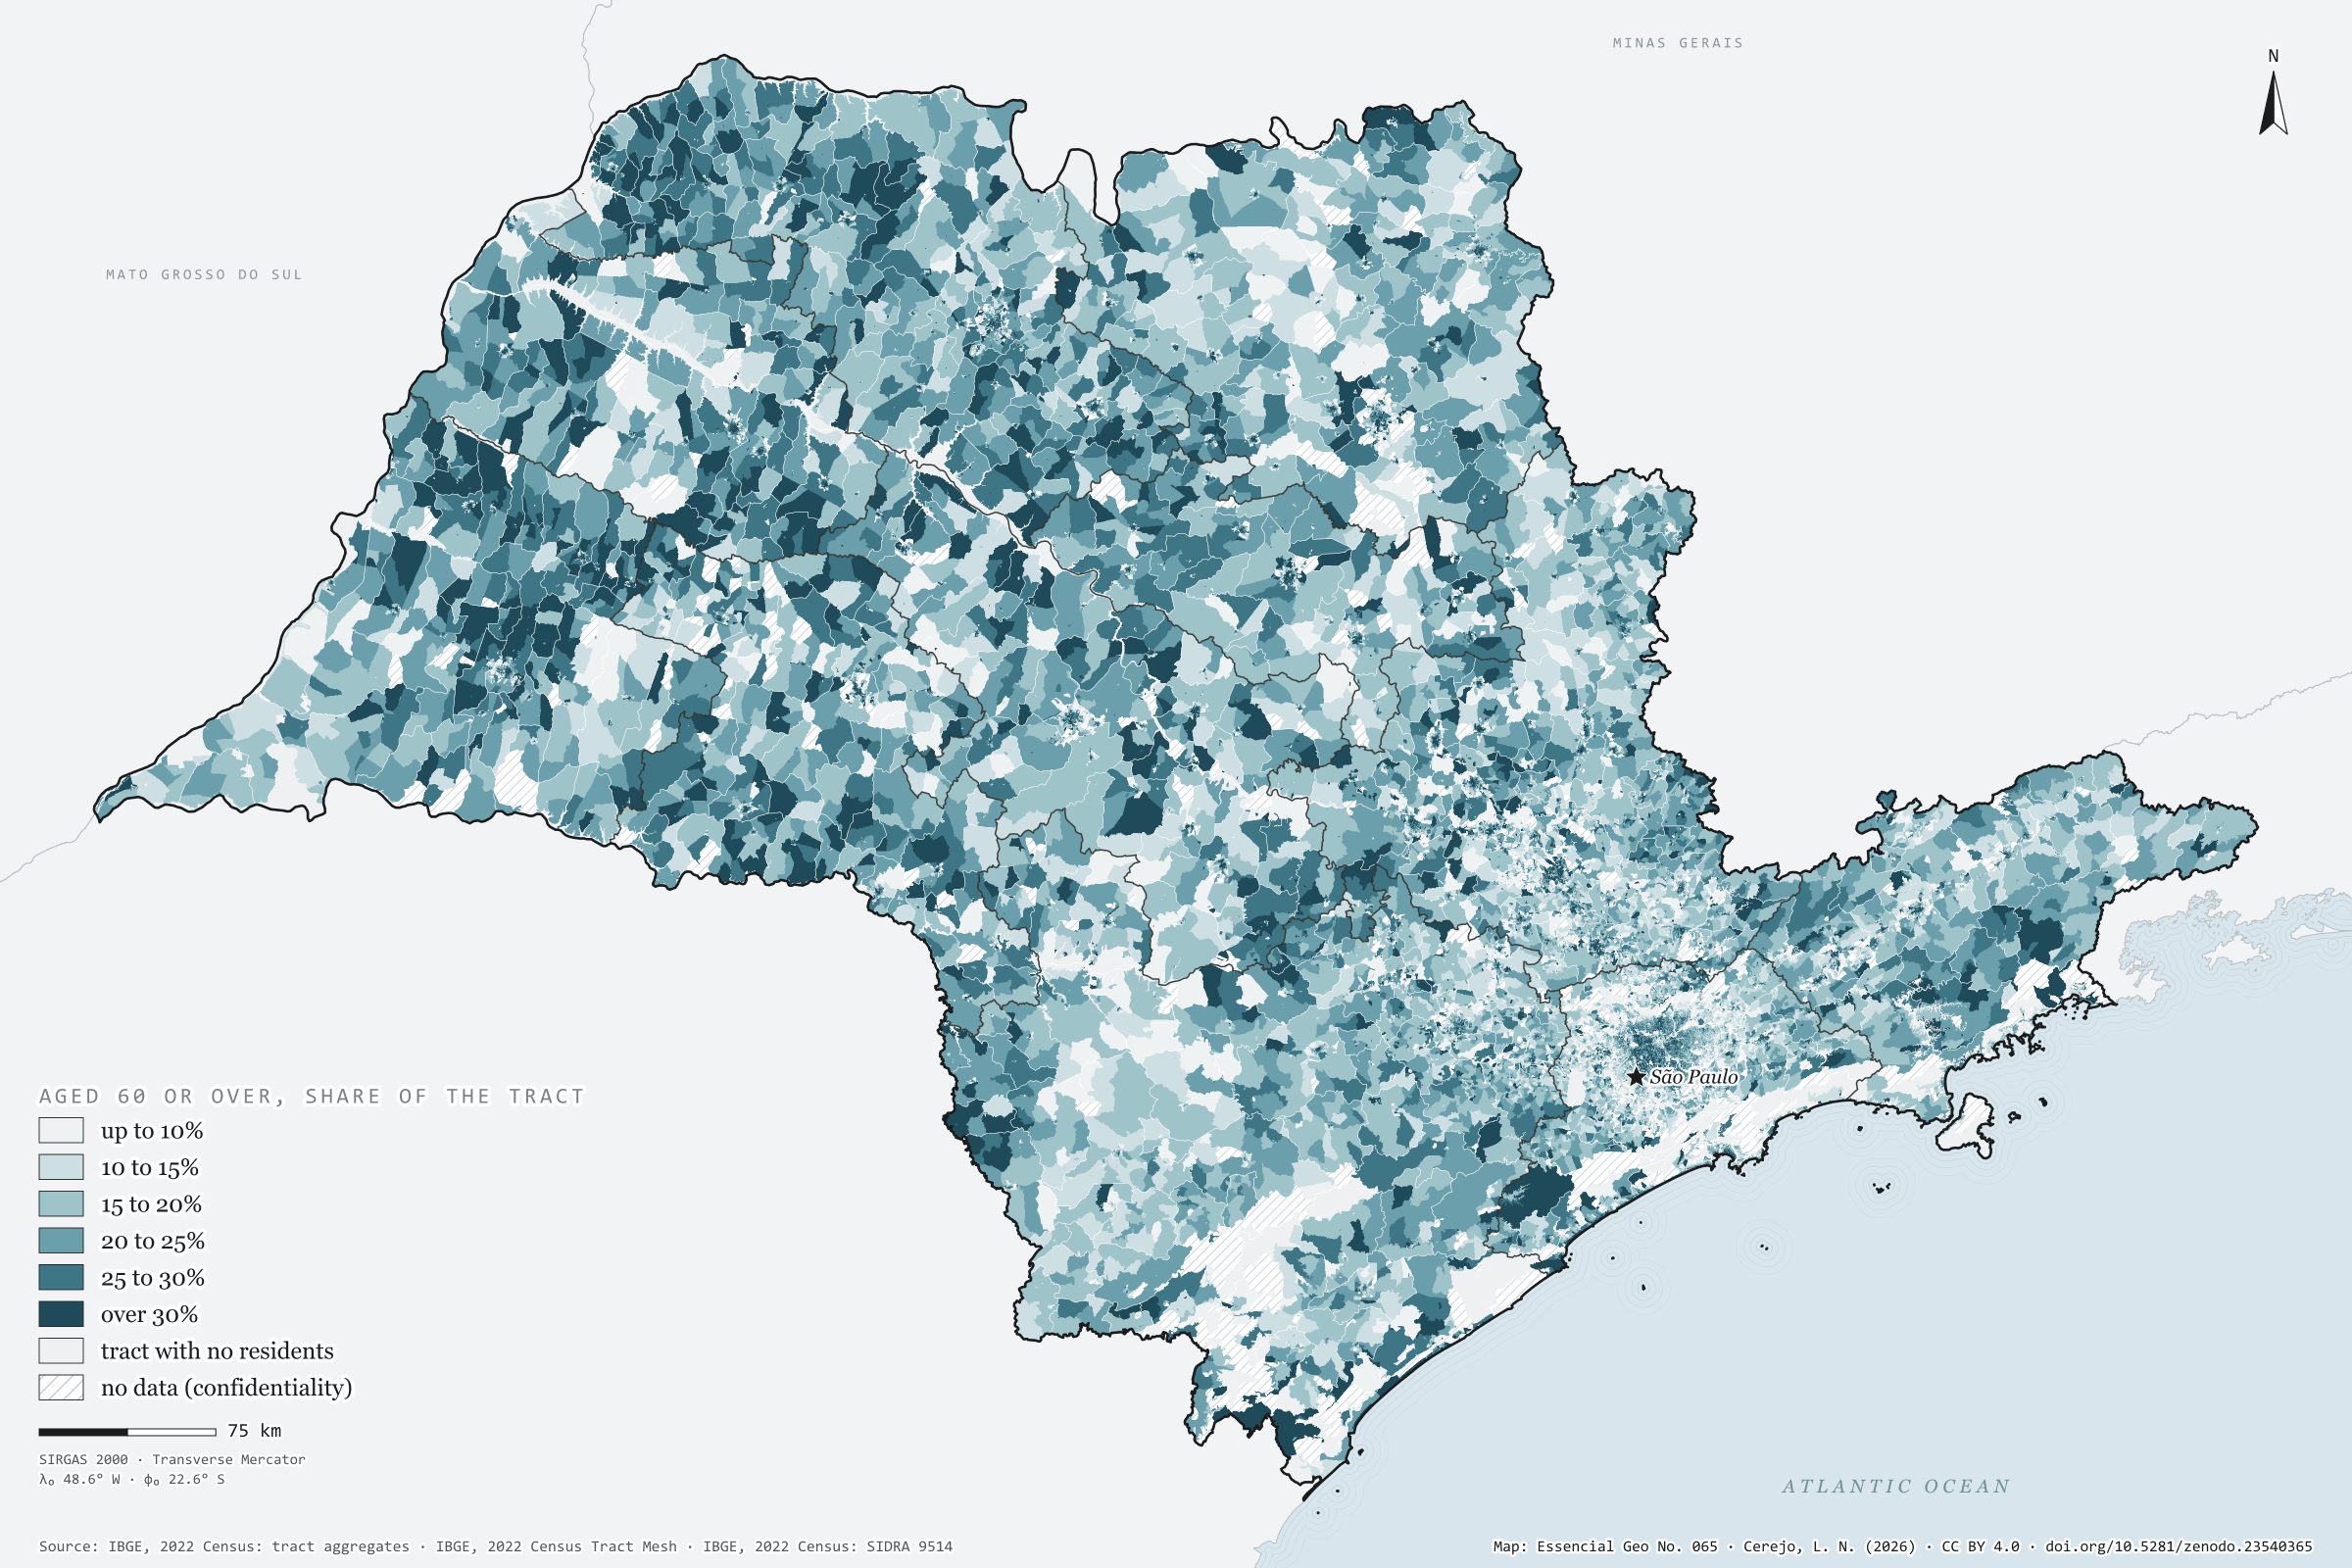
One in six people in São Paulo, and one in three in the small towns of the north-west
Fig. 065São Paulo State (SP)EPSG:4674Source: IBGE
In 2022, 7.65 million people in São Paulo were aged 60 or over: 17.2% of the population, one in six. Over a million were past 80. Tract by tract, the map shows where they live. The dark blue of tracts where over 30% are 60 or older, home to 3.4 million people, spreads across the north-west and west: in the Presidente Prudente region, 20.1% are 60 or over; in the São Paulo region, 16.6%. In small towns such as Turmalina, Nova Canaã Paulista and Santana da Ponte Pensa, almost one in three; in Águas de São Pedro, 34%, the highest share in the state. Cajamar, in Greater São Paulo, is the youngest of the towns of over 50,000 people, with 10.6%. Plate 064 shows median age and the ageing index by municipality. Third plate of the collection “People across the land”.
Technical record · downloads · citation
At a glance
Population by share aged 60 or over in the tract (people)
up to 10%20.9%
10 to 15%22.6%
15 to 20%21.9%
20 to 25%16.7%
25 to 30%10.2%
over 30%7.7%
People aged 60 or over
17%
7.65 million of 44.4 million
People aged 80 or over
1,067,356people
Layers
setorespolygon103,319 tracts: people by age group and 60-plus class (the same layer as plate 063)
regioes_intermediariaspolygon11 intermediate geographic regions
People aged 60 to 69 and 70 or over as a share of each 2022 Census tract’s population, in six classes; confidential counts are worth 1 or 2, and a tract gets a class only when it is the same in both cases; state, municipal and regional totals from SIDRA 9514, without confidentiality.
The map without a frame, with legend, scale, reference system and credit written on it: ready for papers, lectures and slides. In two versions: with the basemap (neighbours and sea) or only the mapped area, on white.
CEREJO, Lucas Nakamura. Os de 60 anos ou mais: um em cada seis paulistas, e um em cada três nas cidades pequenas do noroeste. Versão 1.0.0. [S. l.]: Zenodo, 2026. Conjunto de dados. DOI: 10.5281/zenodo.23540365. Disponível em: https://doi.org/10.5281/zenodo.23540365. Acesso em: 10 nov. 2026.
Cerejo, L. N. (2026). Os de 60 anos ou mais: um em cada seis paulistas, e um em cada três nas cidades pequenas do noroeste [Those aged 60 and over: One in six people in São Paulo, and one in three in the small towns of the north-west] (Version 1.0.0) [Data set]. Zenodo. https://doi.org/10.5281/zenodo.23540365
@dataset{cerejo2026_idosos_sp,
  author    = {Cerejo, Lucas Nakamura},
  title     = {Os de 60 anos ou mais: Um em cada seis paulistas, e um em cada três nas cidades pequenas do noroeste},
  year      = {2026},
  publisher = {Zenodo},
  version   = {1.0.0},
  doi       = {10.5281/zenodo.23540365},
  url       = {https://doi.org/10.5281/zenodo.23540365},
  language  = {portuguese},
  note      = {English title: Those aged 60 and over: One in six people in São Paulo, and one in three in the small towns of the north-west. Licence CC BY 4.0}
}
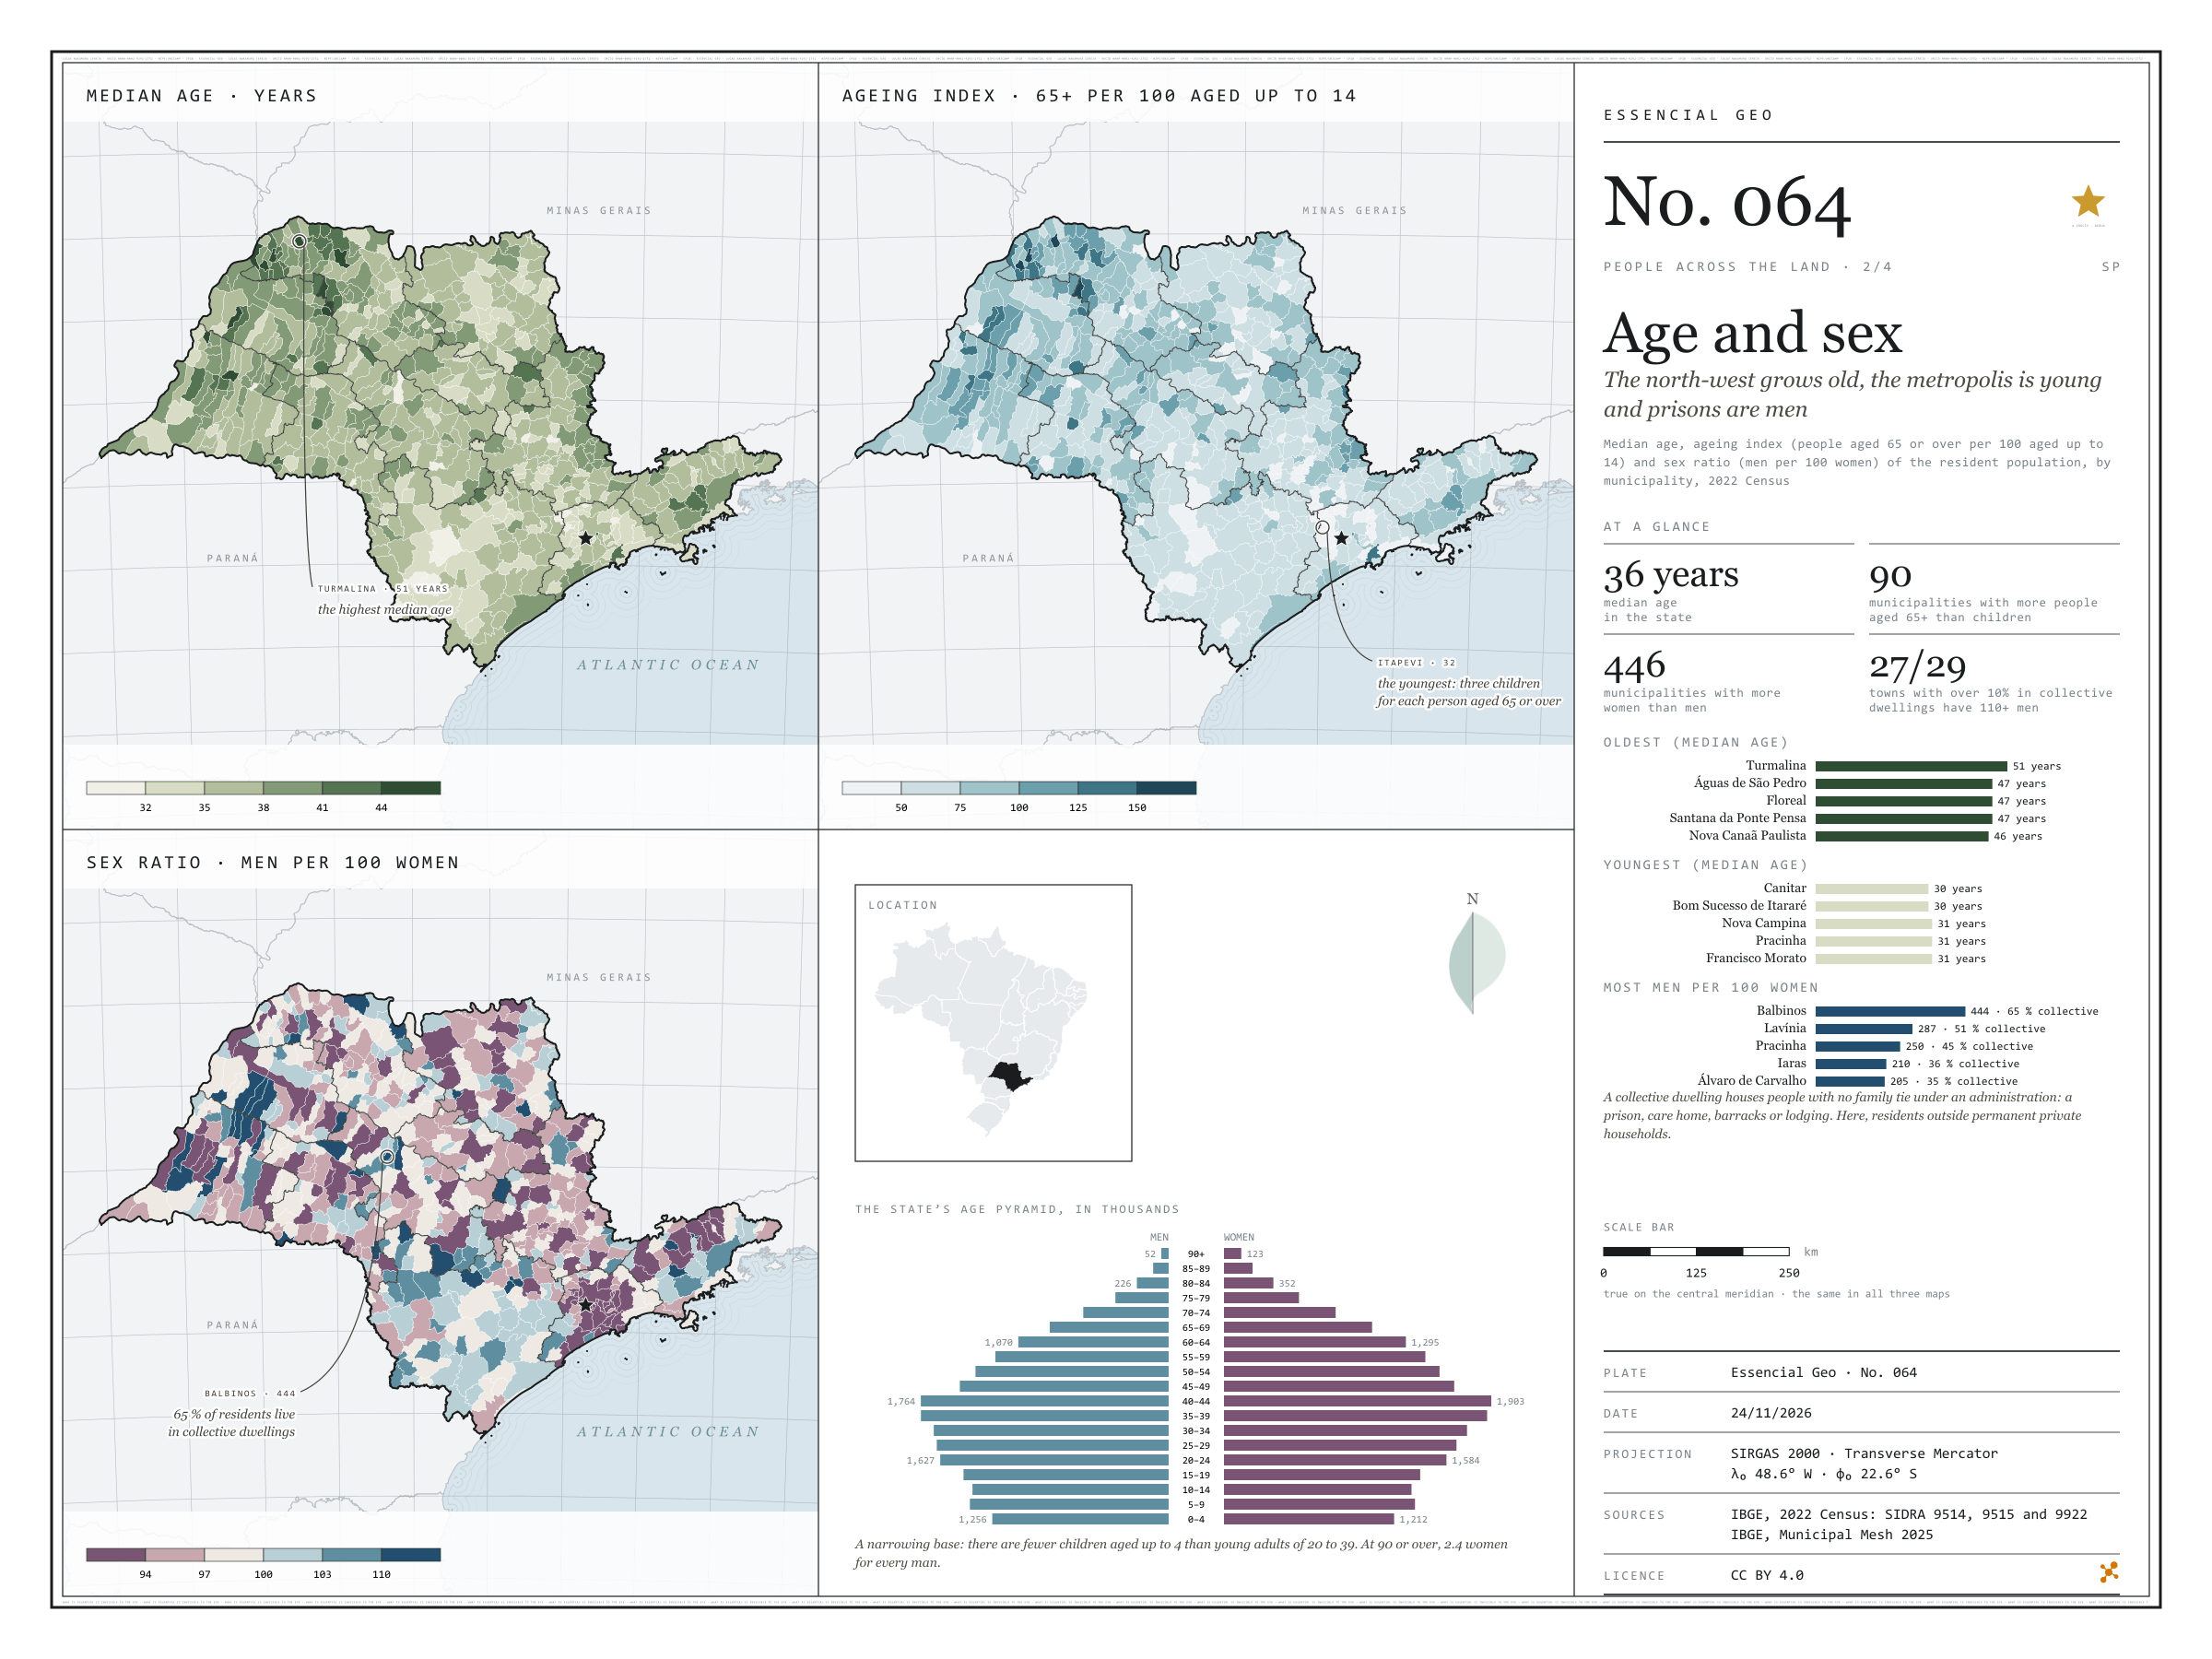
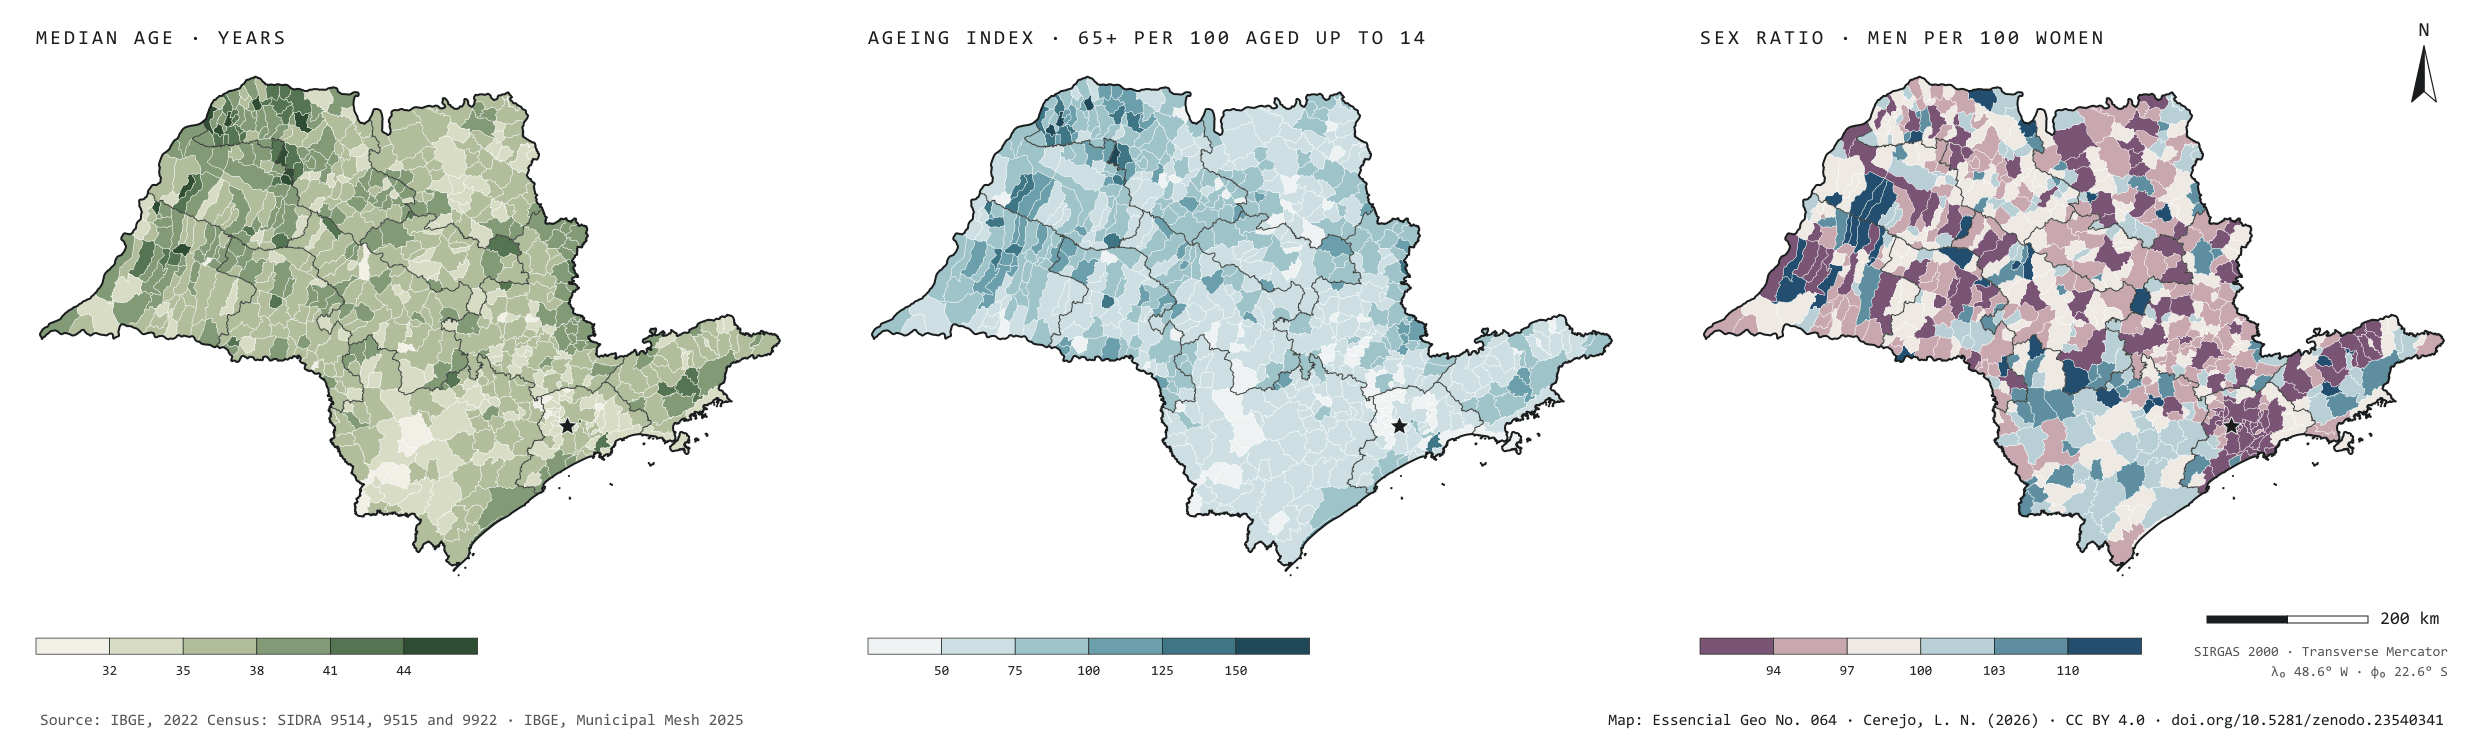
The north-west grows old, the metropolis is young and prisons are men
Fig. 064São Paulo State (SP)EPSG:4674Source: IBGE
The median age in São Paulo is 36: half the people are younger, half older. But the state is ageing unevenly. In the north-west, in small towns such as Turmalina (51), Floreal and Santana da Ponte Pensa (47), there are already more people aged 65 or over than children up to 14: 90 municipalities are like this. In Greater São Paulo the index falls to 32 in Itapevi, three children per older person. In 446 of the 645 municipalities there are more women than men; Santos has 83 men per 100 women. The sex ratio map has dark blue patches: Balbinos has 444 men per 100 women, and 65% of its residents live in collective dwellings. Of the 29 towns with over 10% of their people in such dwellings, prisons among them, 27 exceed 110 men per 100 women. Second plate of the collection “People across the land”.
Technical record · downloads · citation
At a glance
Municipalities by median age (municipalities)
up to 32 years2.6%
33 to 3522%
36 to 3842.9%
39 to 4124.7%
42 to 445.9%
45 or over1.9%
Median age in the state
36years
Municipalities with more people aged 65 or over than aged up to 14
90municipalities
Municipalities with more women than men
446municipalities
Layers
municipiospolygon645 municipalities: people, men, women, median age, ageing index, sex ratio, aged up to 14 and 60 or over, urban and rural households and residents, residents outside private households
regioes_intermediariaspolygon11 intermediate geographic regions
Median age, ageing index (people aged 65 or over per 100 aged up to 14) and sex ratio (men per 100 women) of the resident population by municipality, from SIDRA 9515, in six classes each; the state’s pyramid from SIDRA 9514; residents outside occupied permanent private households = population (9514) minus residents of those households (9922).
The map without a frame, with legend, scale, reference system and credit written on it: ready for papers, lectures and slides. In two versions: with the basemap (neighbours and sea) or only the mapped area, on white.
CEREJO, Lucas Nakamura. Idade e sexo: o noroeste envelhece, a metrópole é jovem e os presídios são homens. Versão 1.0.0. [S. l.]: Zenodo, 2026. Conjunto de dados. DOI: 10.5281/zenodo.23540341. Disponível em: https://doi.org/10.5281/zenodo.23540341. Acesso em: 10 nov. 2026.
Cerejo, L. N. (2026). Idade e sexo: o noroeste envelhece, a metrópole é jovem e os presídios são homens [Age and sex: The north-west grows old, the metropolis is young and prisons are men] (Version 1.0.0) [Data set]. Zenodo. https://doi.org/10.5281/zenodo.23540341
@dataset{cerejo2026_idade_e_sexo_sp,
  author    = {Cerejo, Lucas Nakamura},
  title     = {Idade e sexo: O noroeste envelhece, a metrópole é jovem e os presídios são homens},
  year      = {2026},
  publisher = {Zenodo},
  version   = {1.0.0},
  doi       = {10.5281/zenodo.23540341},
  url       = {https://doi.org/10.5281/zenodo.23540341},
  language  = {portuguese},
  note      = {English title: Age and sex: The north-west grows old, the metropolis is young and prisons are men. Licence CC BY 4.0}
}
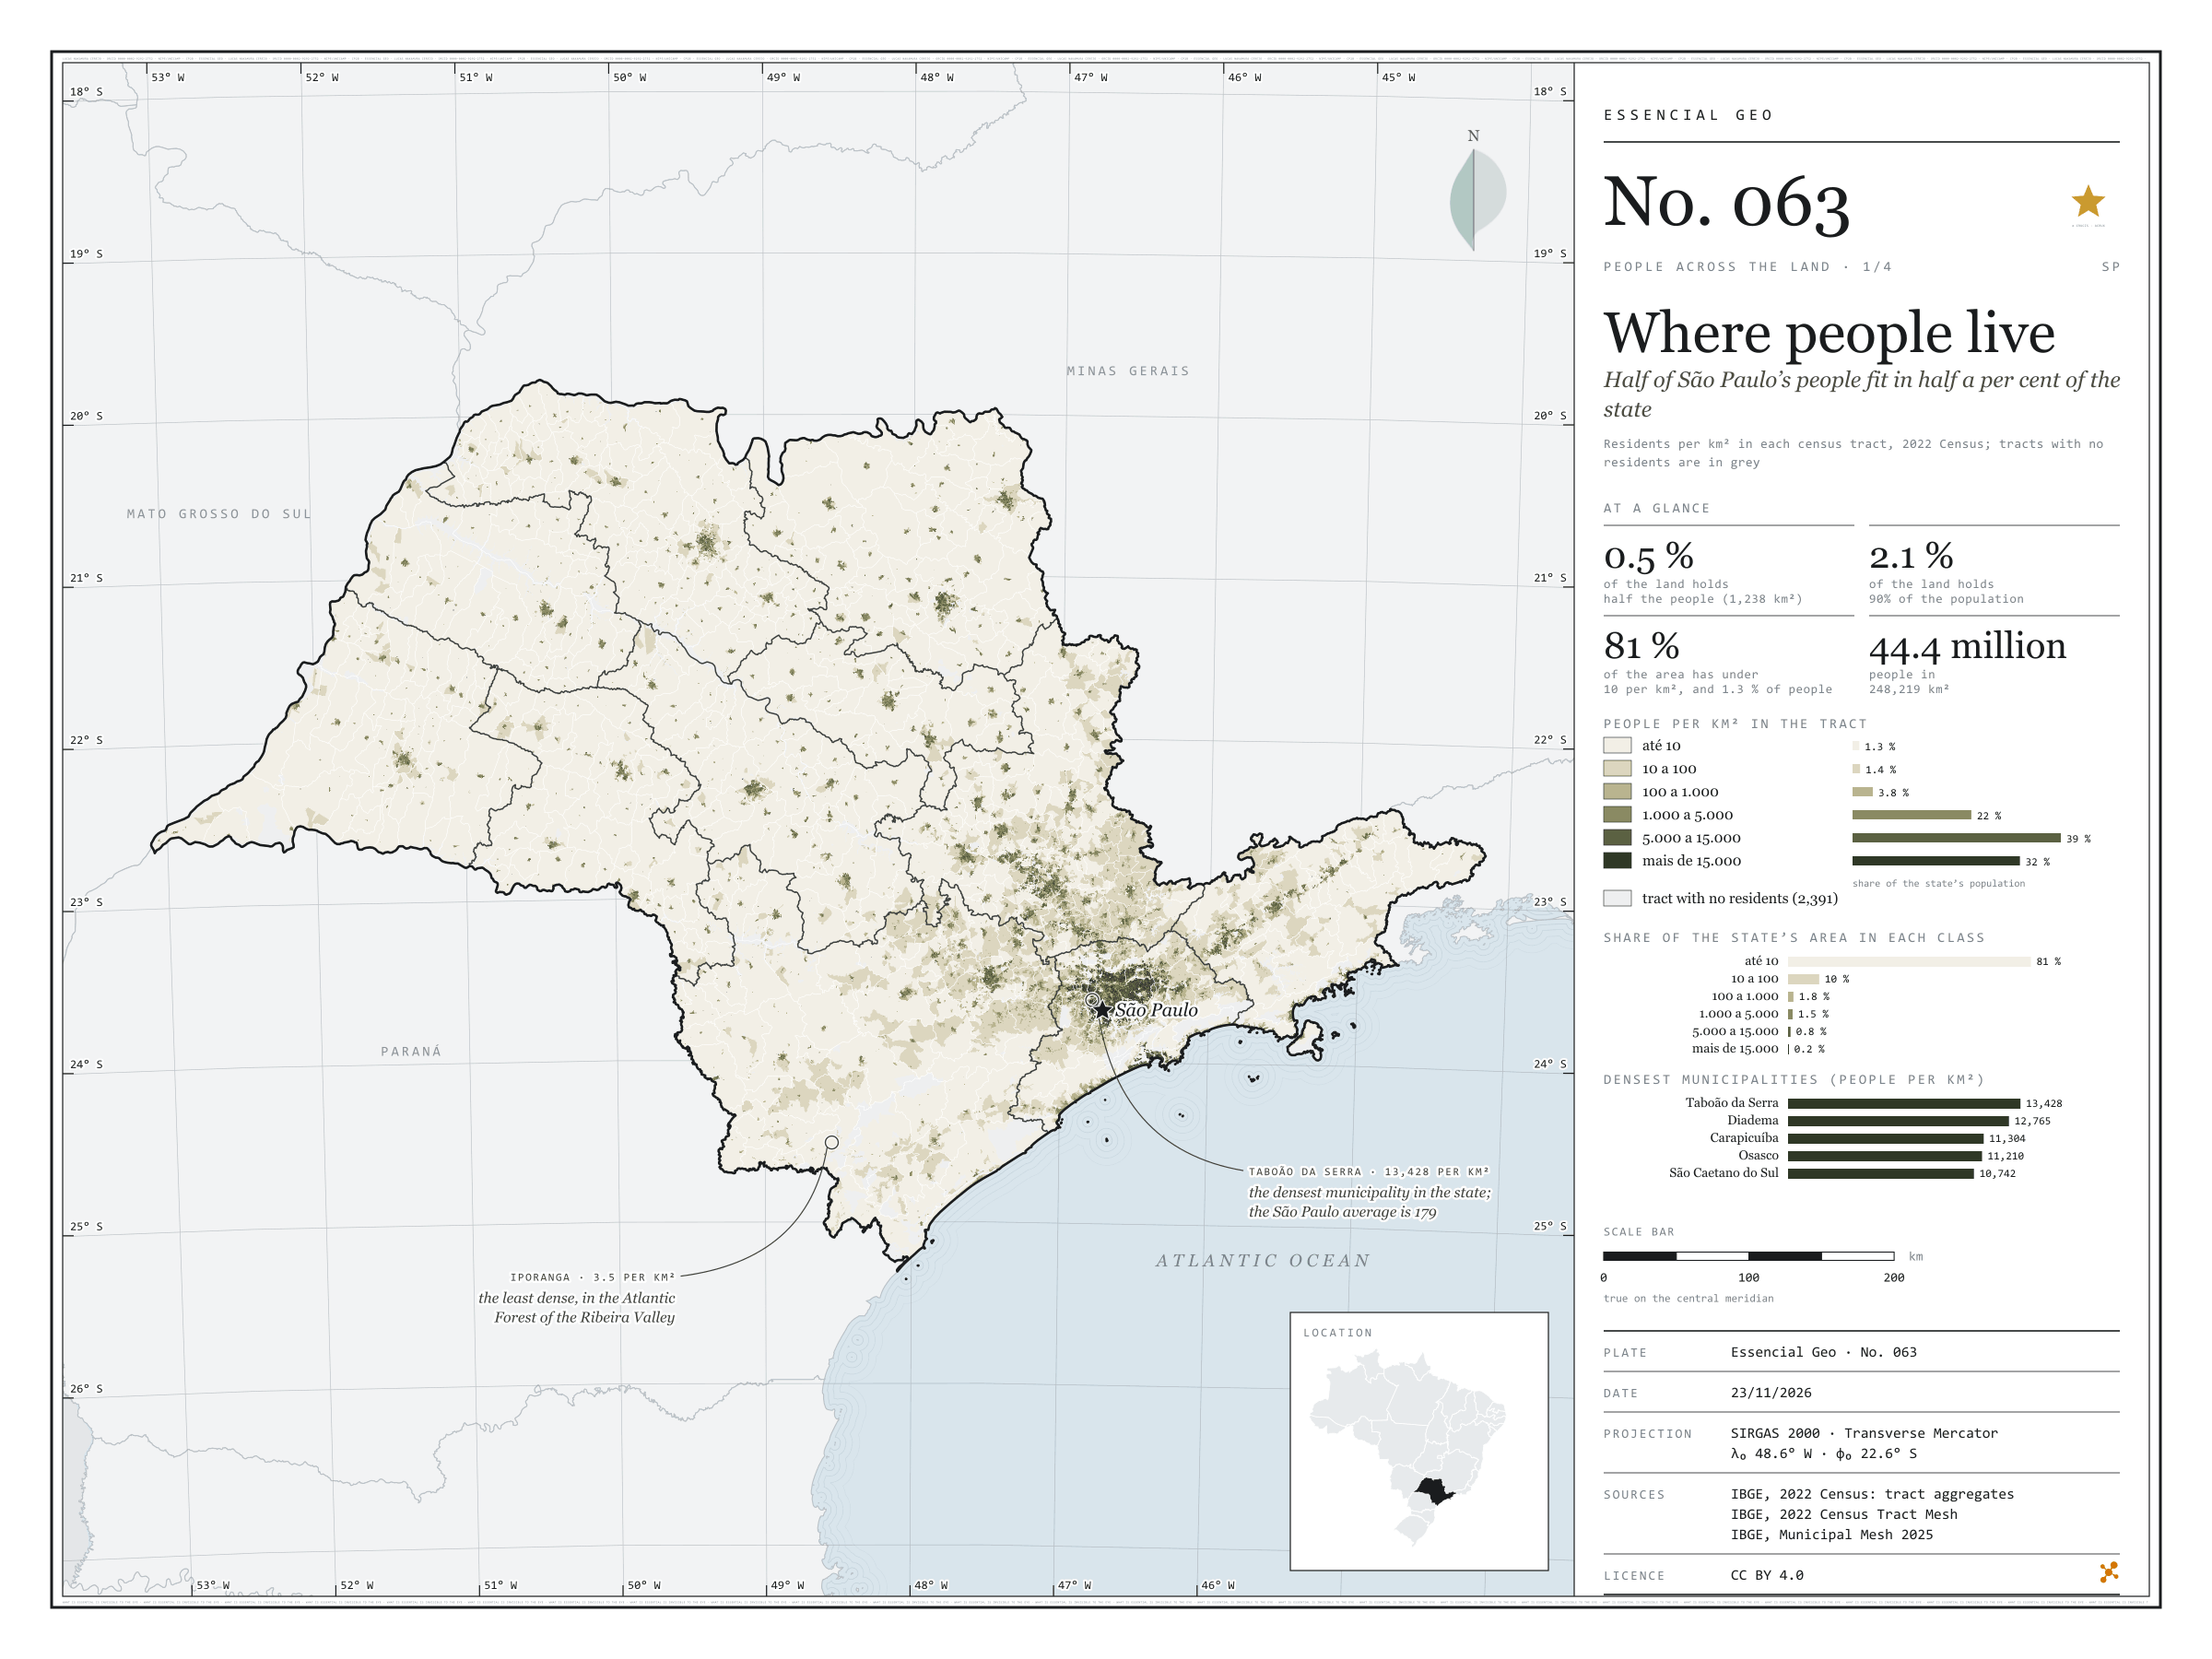
Half of São Paulo’s people fit in half a per cent of the state
Fig. 063São Paulo State (SP)EPSG:4674Source: IBGE
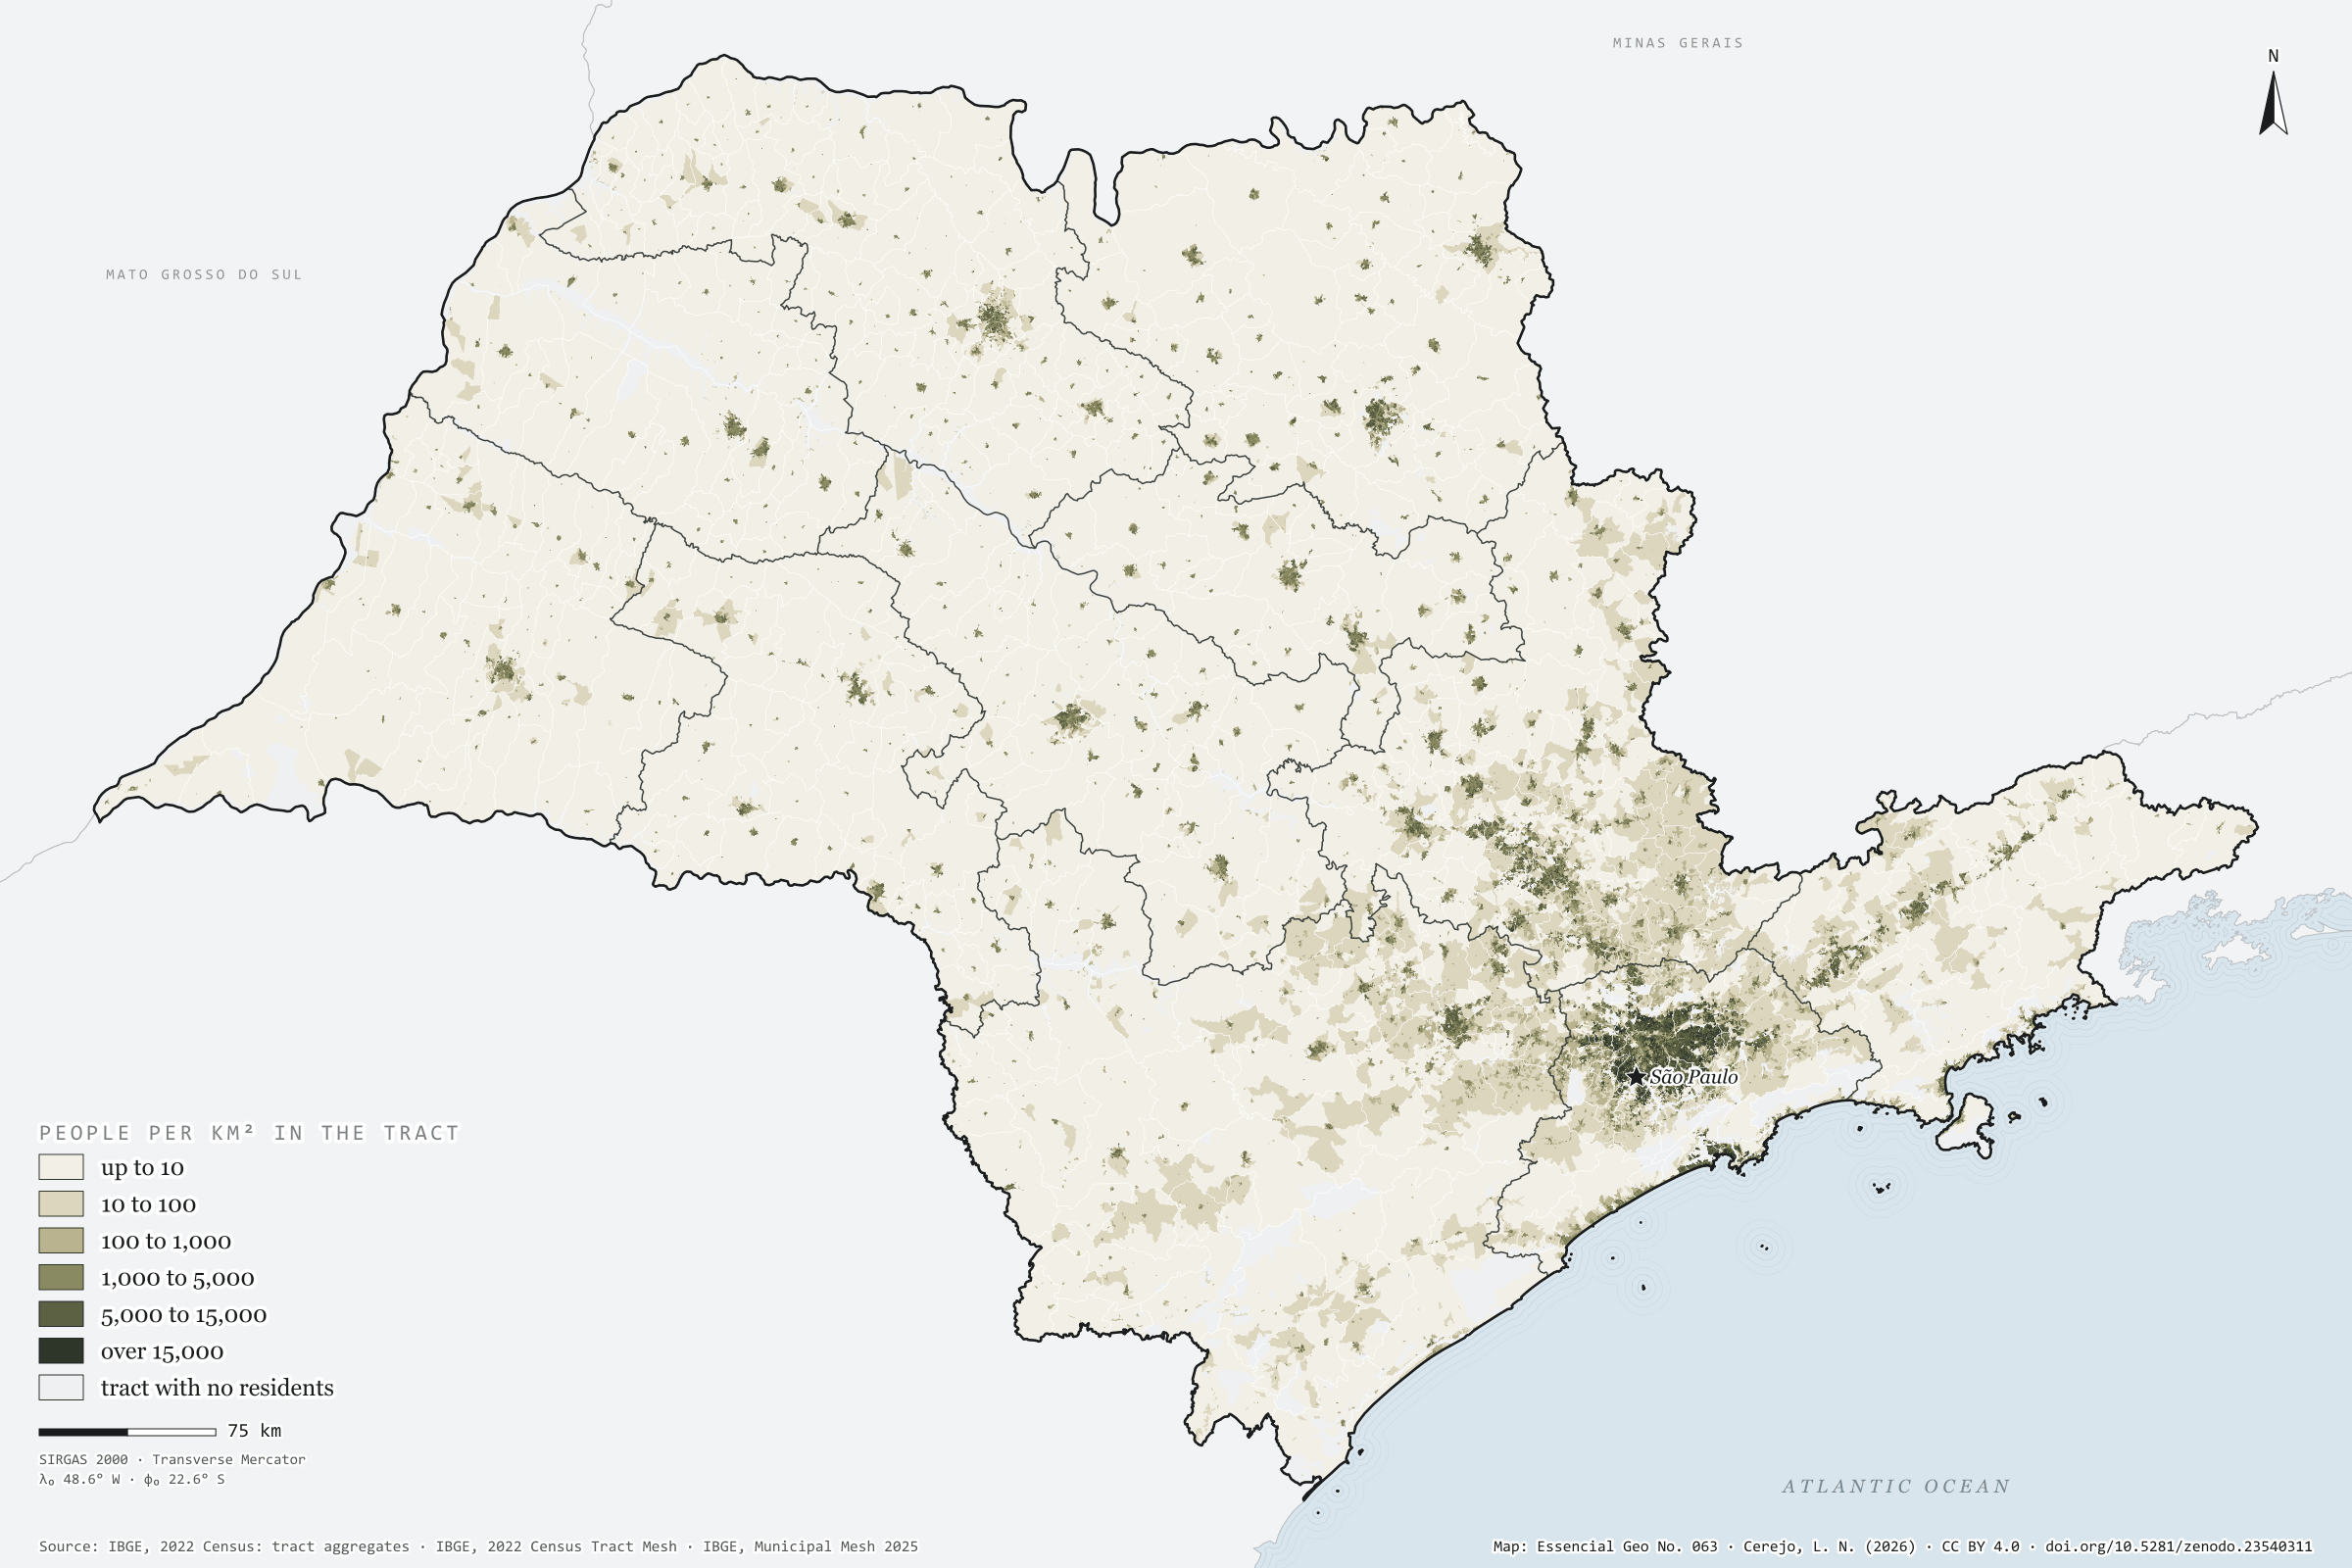
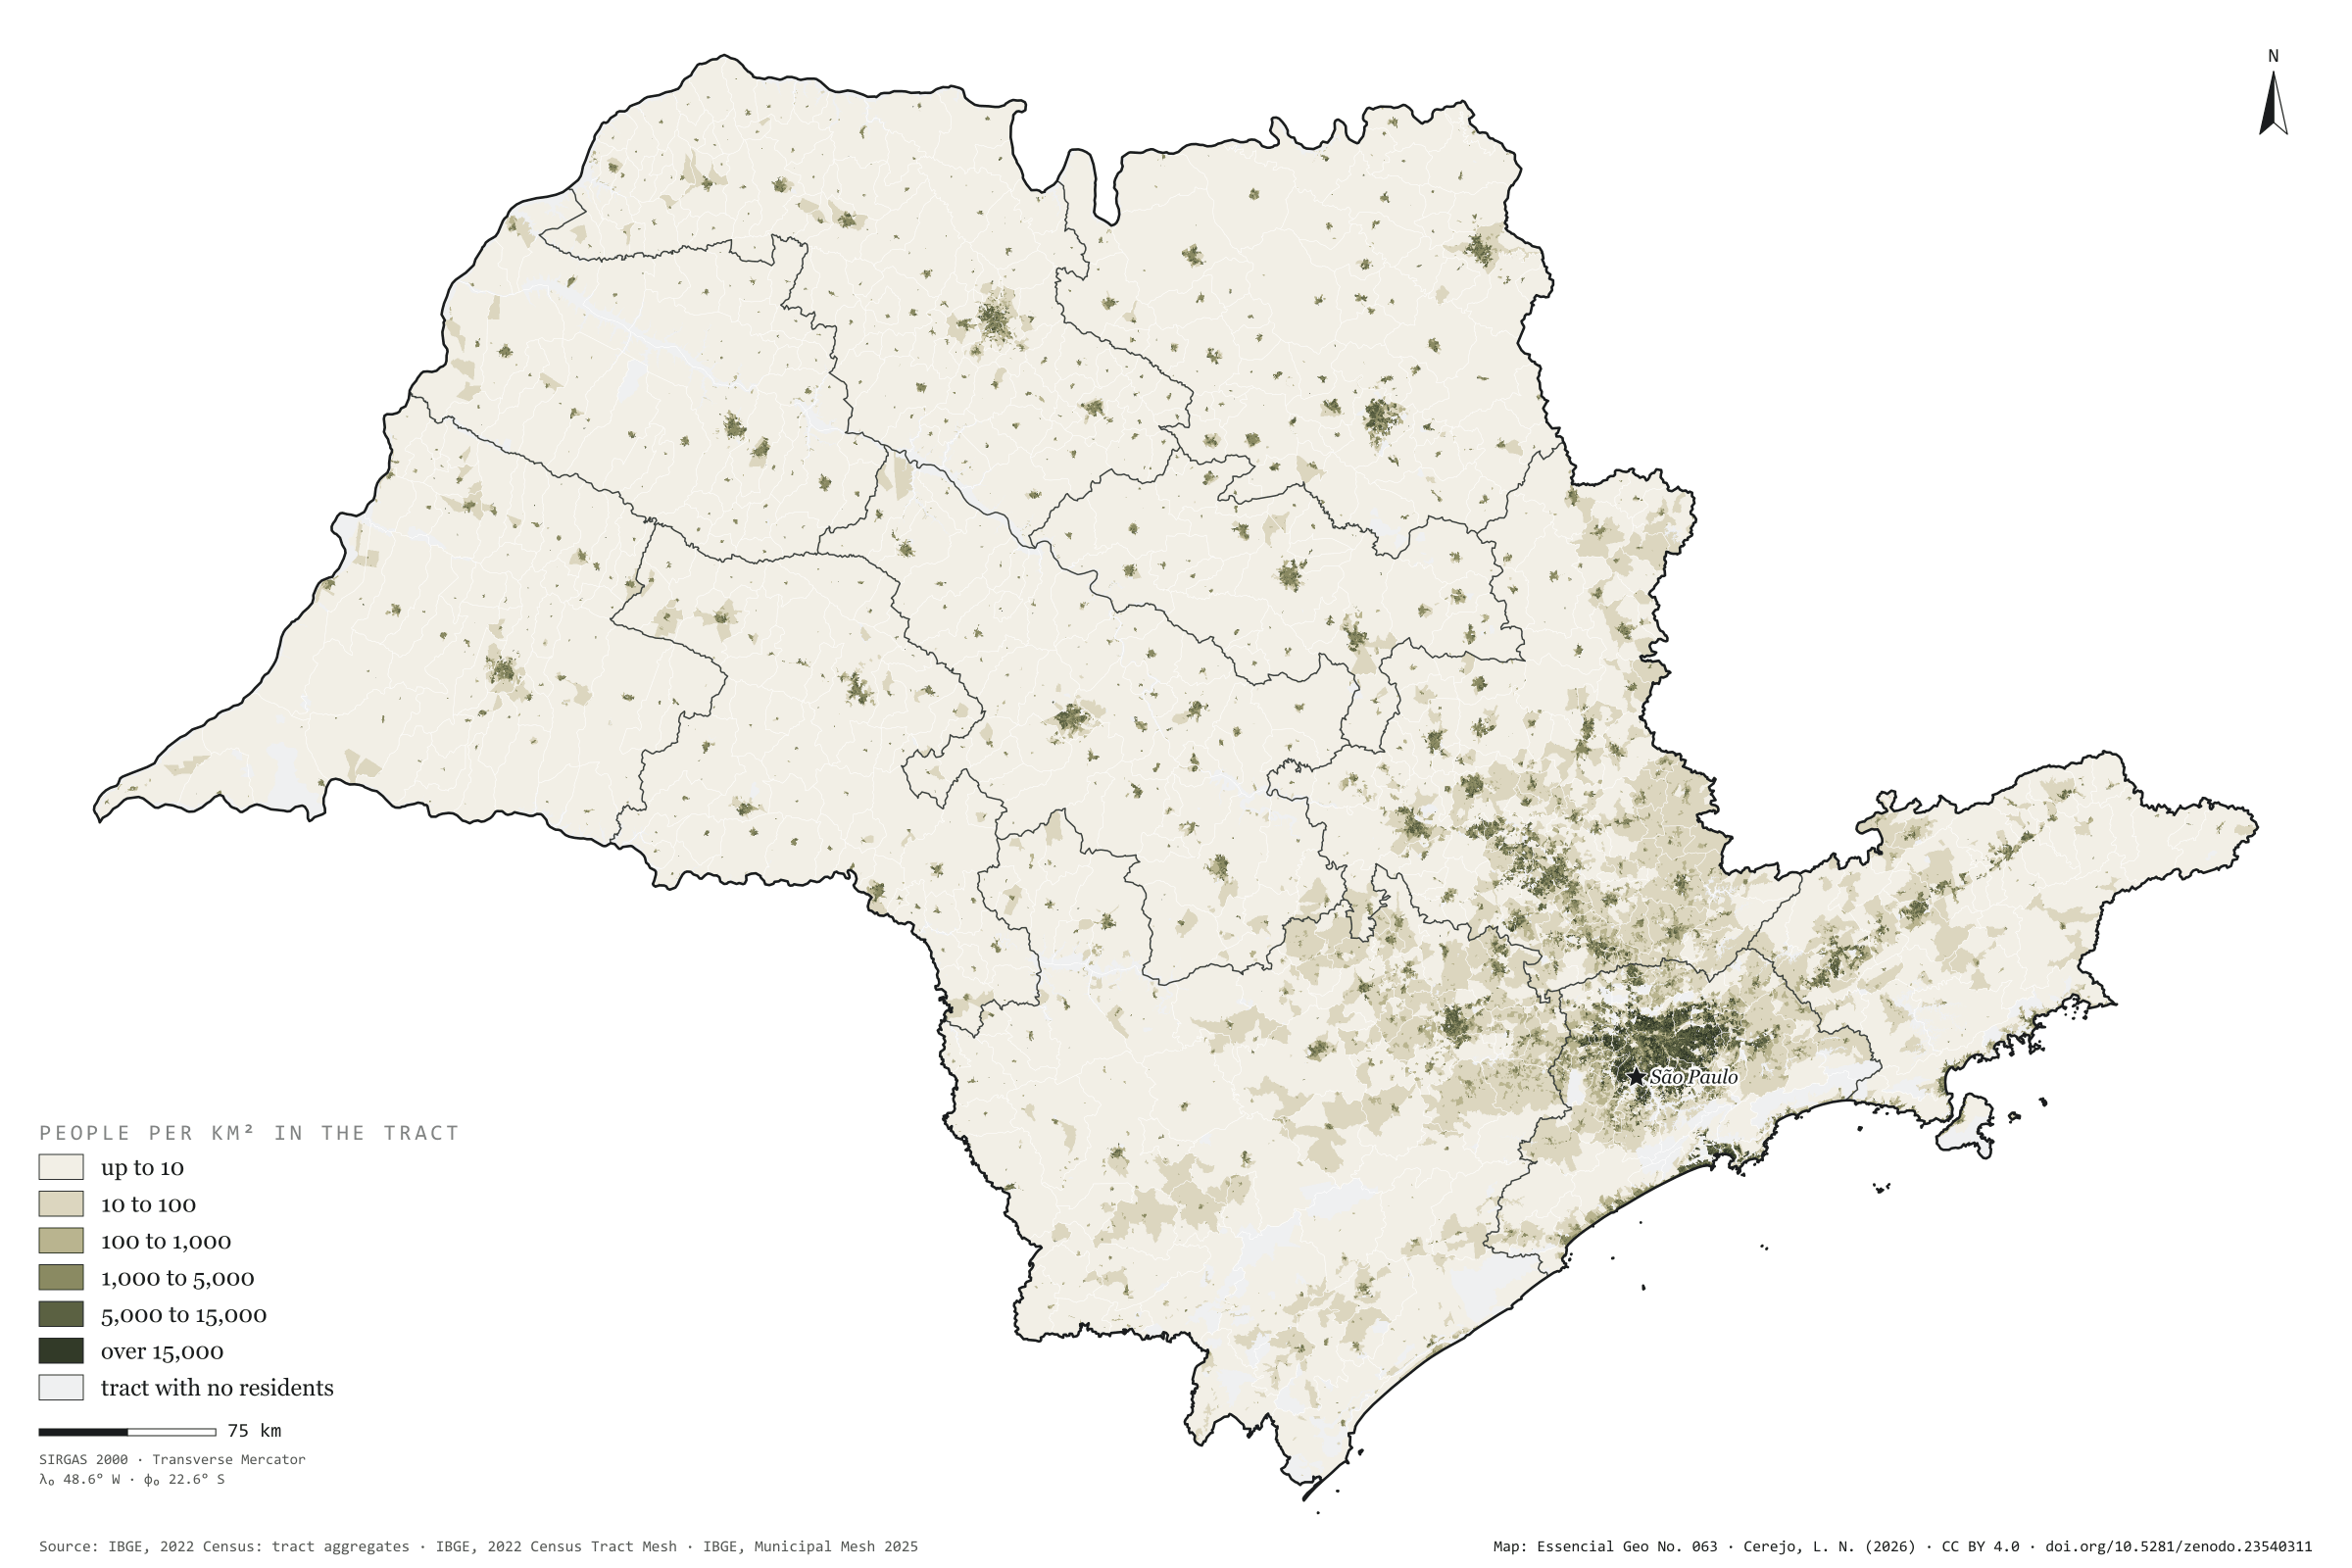
São Paulo has 44.4 million people on 248,000 km², 179 per km² on average. But the average misleads. Half the population lives in census tracts that together cover 1,238 km², 0.5% of the state; 90% live on 2.1%. At the other end, 81% of the area has fewer than 10 residents per km² and holds 1.3% of the people. The map is almost all cream, with dark dots for the towns and one continuous patch in Greater São Paulo, reaching towards Campinas, Sorocaba and the Paraíba Valley. The densest municipality is Taboão da Serra, with 13,428 residents per km², followed by Diadema and Carapicuíba; the capital has 7,521. The least dense is Iporanga, in the Ribeira Valley, with 3.5. First plate of the collection “People across the land”.
Technical record · downloads · citation
At a glance
Population by tract density (residents per km²) (people)
up to 101.3%
10 to 1001.4%
100 to 1,0003.8%
1,000 to 5,00022.5%
5,000 to 15,00039.4%
over 15,00031.6%
Share of the land where half the population lives
0.5%
1,238 km² of 248,219 km²
Residents per km² in the state
179people per km²
Layers
setorespolygon103,319 tracts: area, people, residents per km², people by age group and density and 60-plus classes
regioes_intermediariaspolygon11 intermediate geographic regions
Residents per km² of each 2022 Census tract (the tract’s own area), in six classes; share of the state’s population and area in each class; cumulative area of tracts from densest to least dense until they hold half and 90% of the population.
The map without a frame, with legend, scale, reference system and credit written on it: ready for papers, lectures and slides. In two versions: with the basemap (neighbours and sea) or only the mapped area, on white.
CEREJO, Lucas Nakamura. Onde mora a gente: metade dos paulistas cabe em meio por cento do estado. Versão 1.0.0. [S. l.]: Zenodo, 2026. Conjunto de dados. DOI: 10.5281/zenodo.23540311. Disponível em: https://doi.org/10.5281/zenodo.23540311. Acesso em: 10 nov. 2026.
Cerejo, L. N. (2026). Onde mora a gente: metade dos paulistas cabe em meio por cento do estado [Where people live: Half of São Paulo’s people fit in half a per cent of the state] (Version 1.0.0) [Data set]. Zenodo. https://doi.org/10.5281/zenodo.23540311
@dataset{cerejo2026_densidade_sp,
  author    = {Cerejo, Lucas Nakamura},
  title     = {Onde mora a gente: Metade dos paulistas cabe em meio por cento do estado},
  year      = {2026},
  publisher = {Zenodo},
  version   = {1.0.0},
  doi       = {10.5281/zenodo.23540311},
  url       = {https://doi.org/10.5281/zenodo.23540311},
  language  = {portuguese},
  note      = {English title: Where people live: Half of São Paulo’s people fit in half a per cent of the state. Licence CC BY 4.0}
}
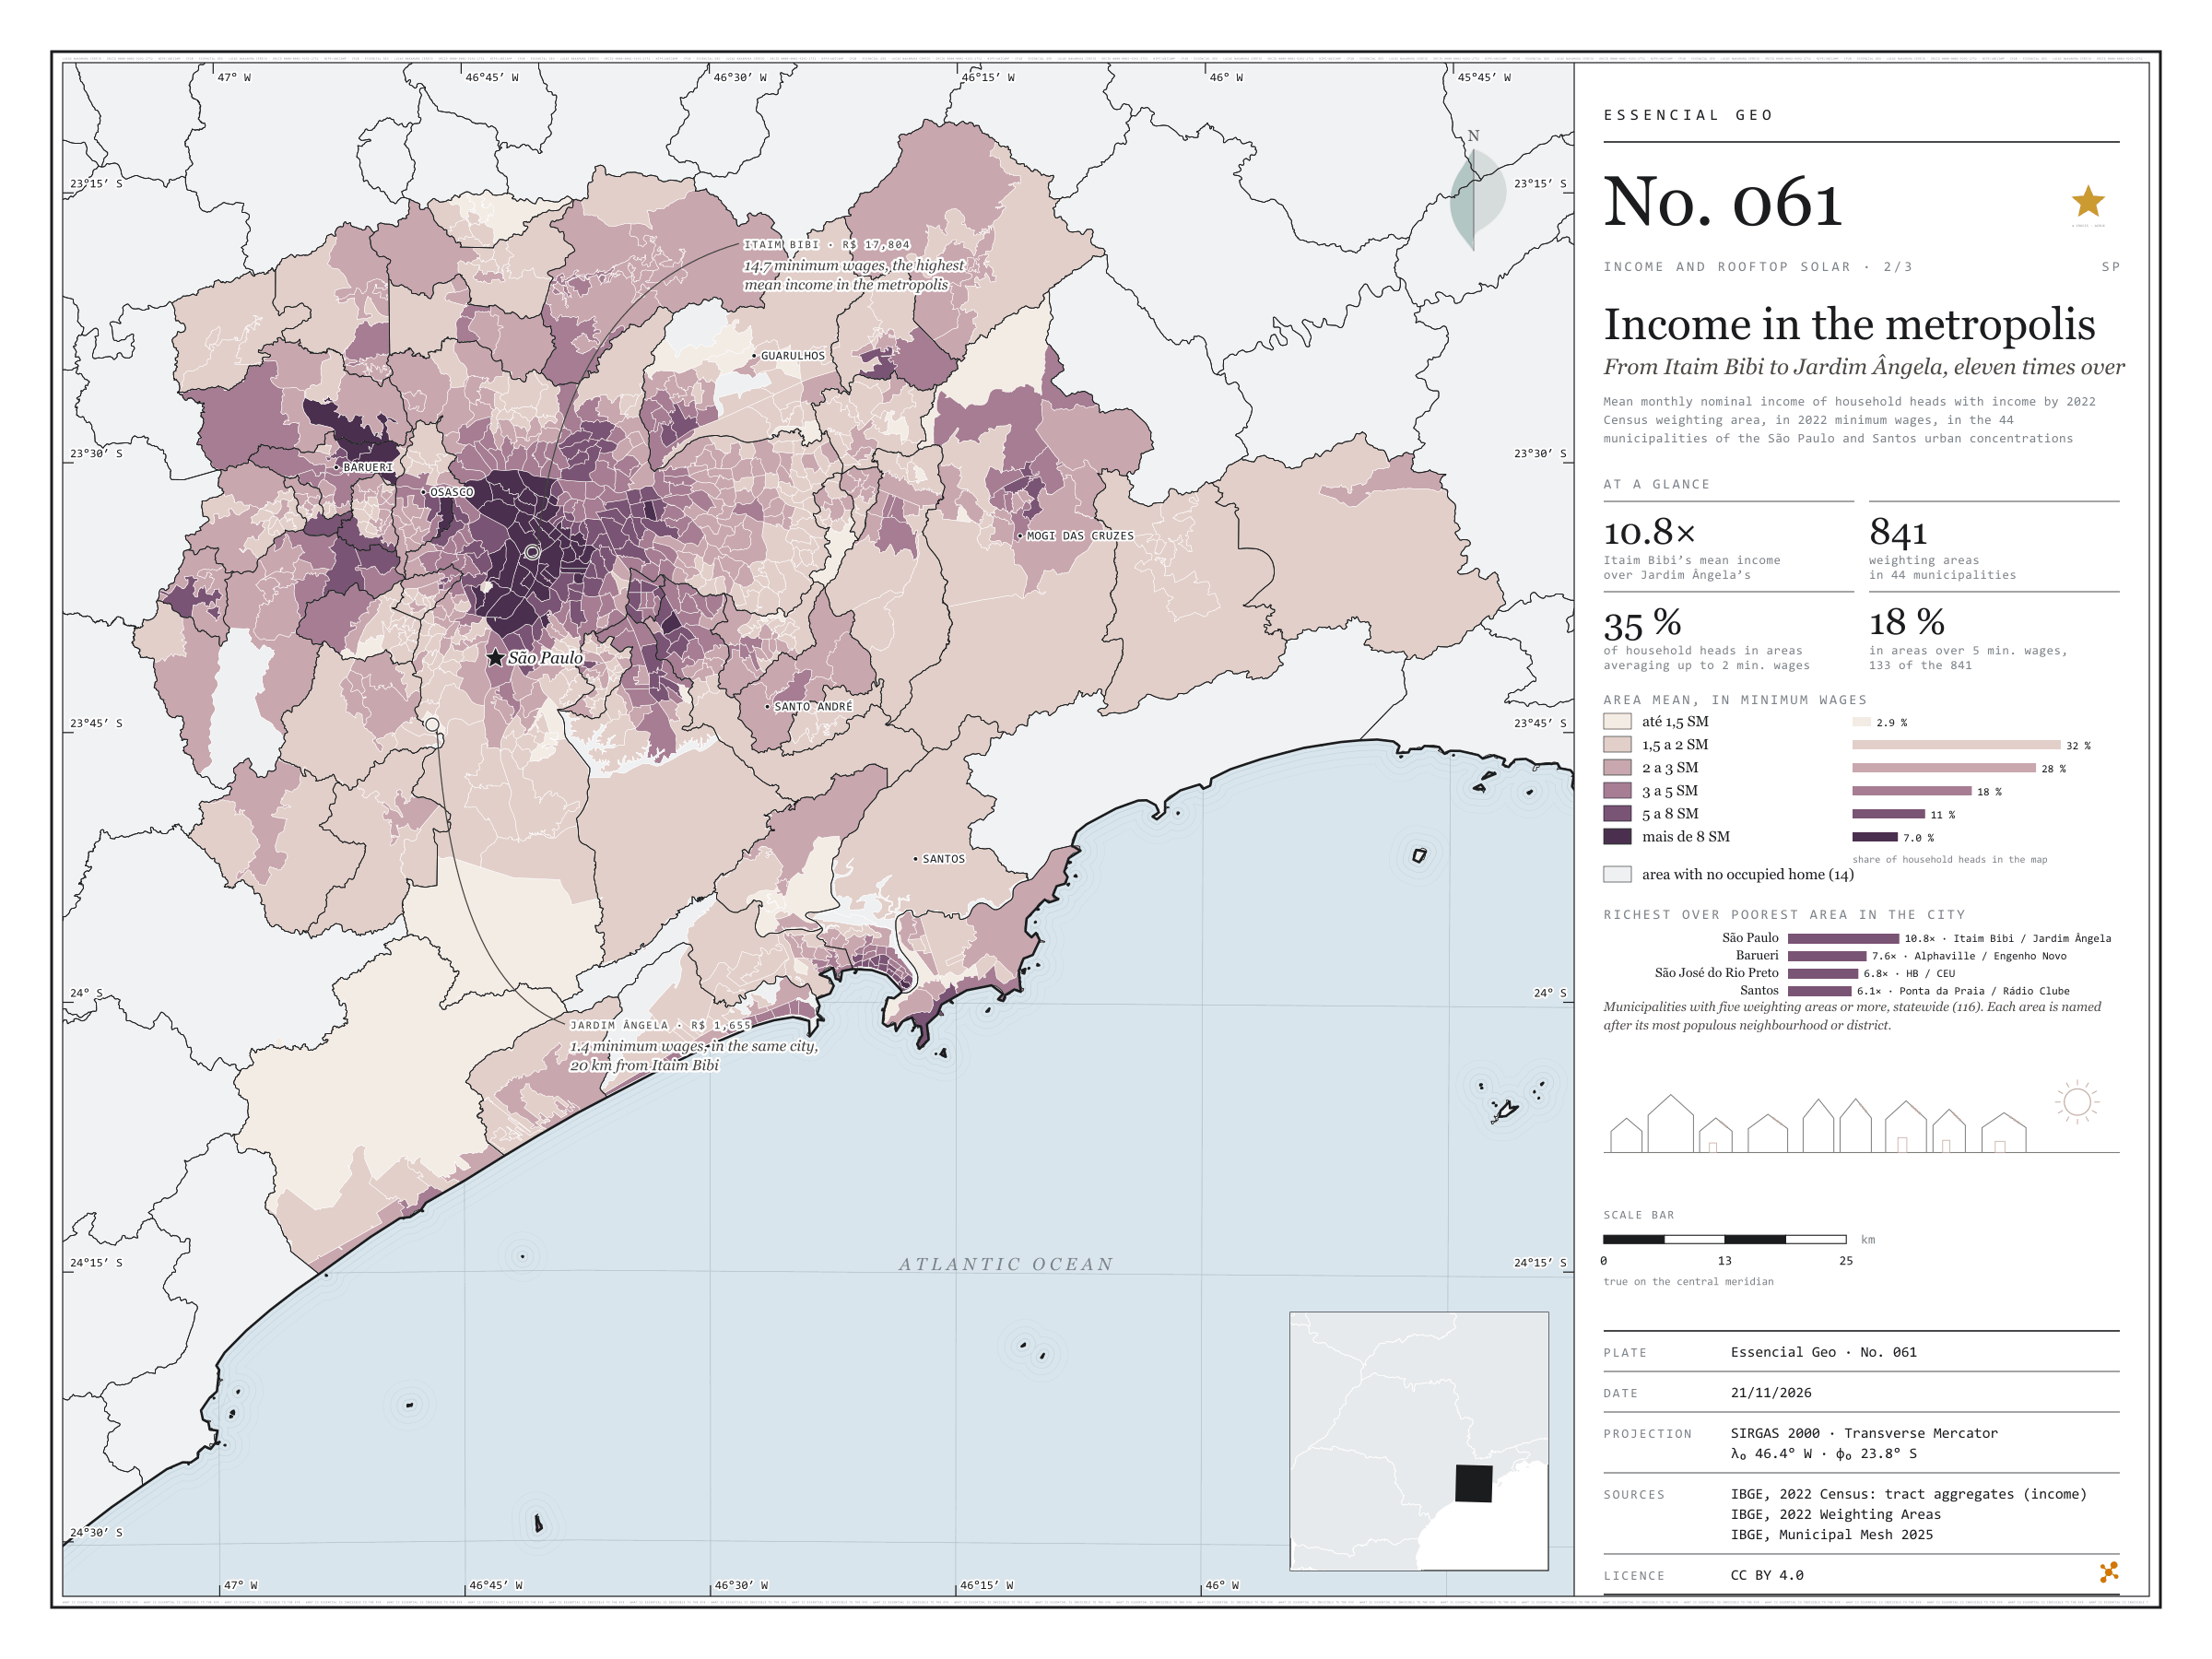
From Itaim Bibi to Jardim Ângela, eleven times over
Fig. 061São Paulo and Santos urban concentrations (SP)EPSG:4674Source: IBGE
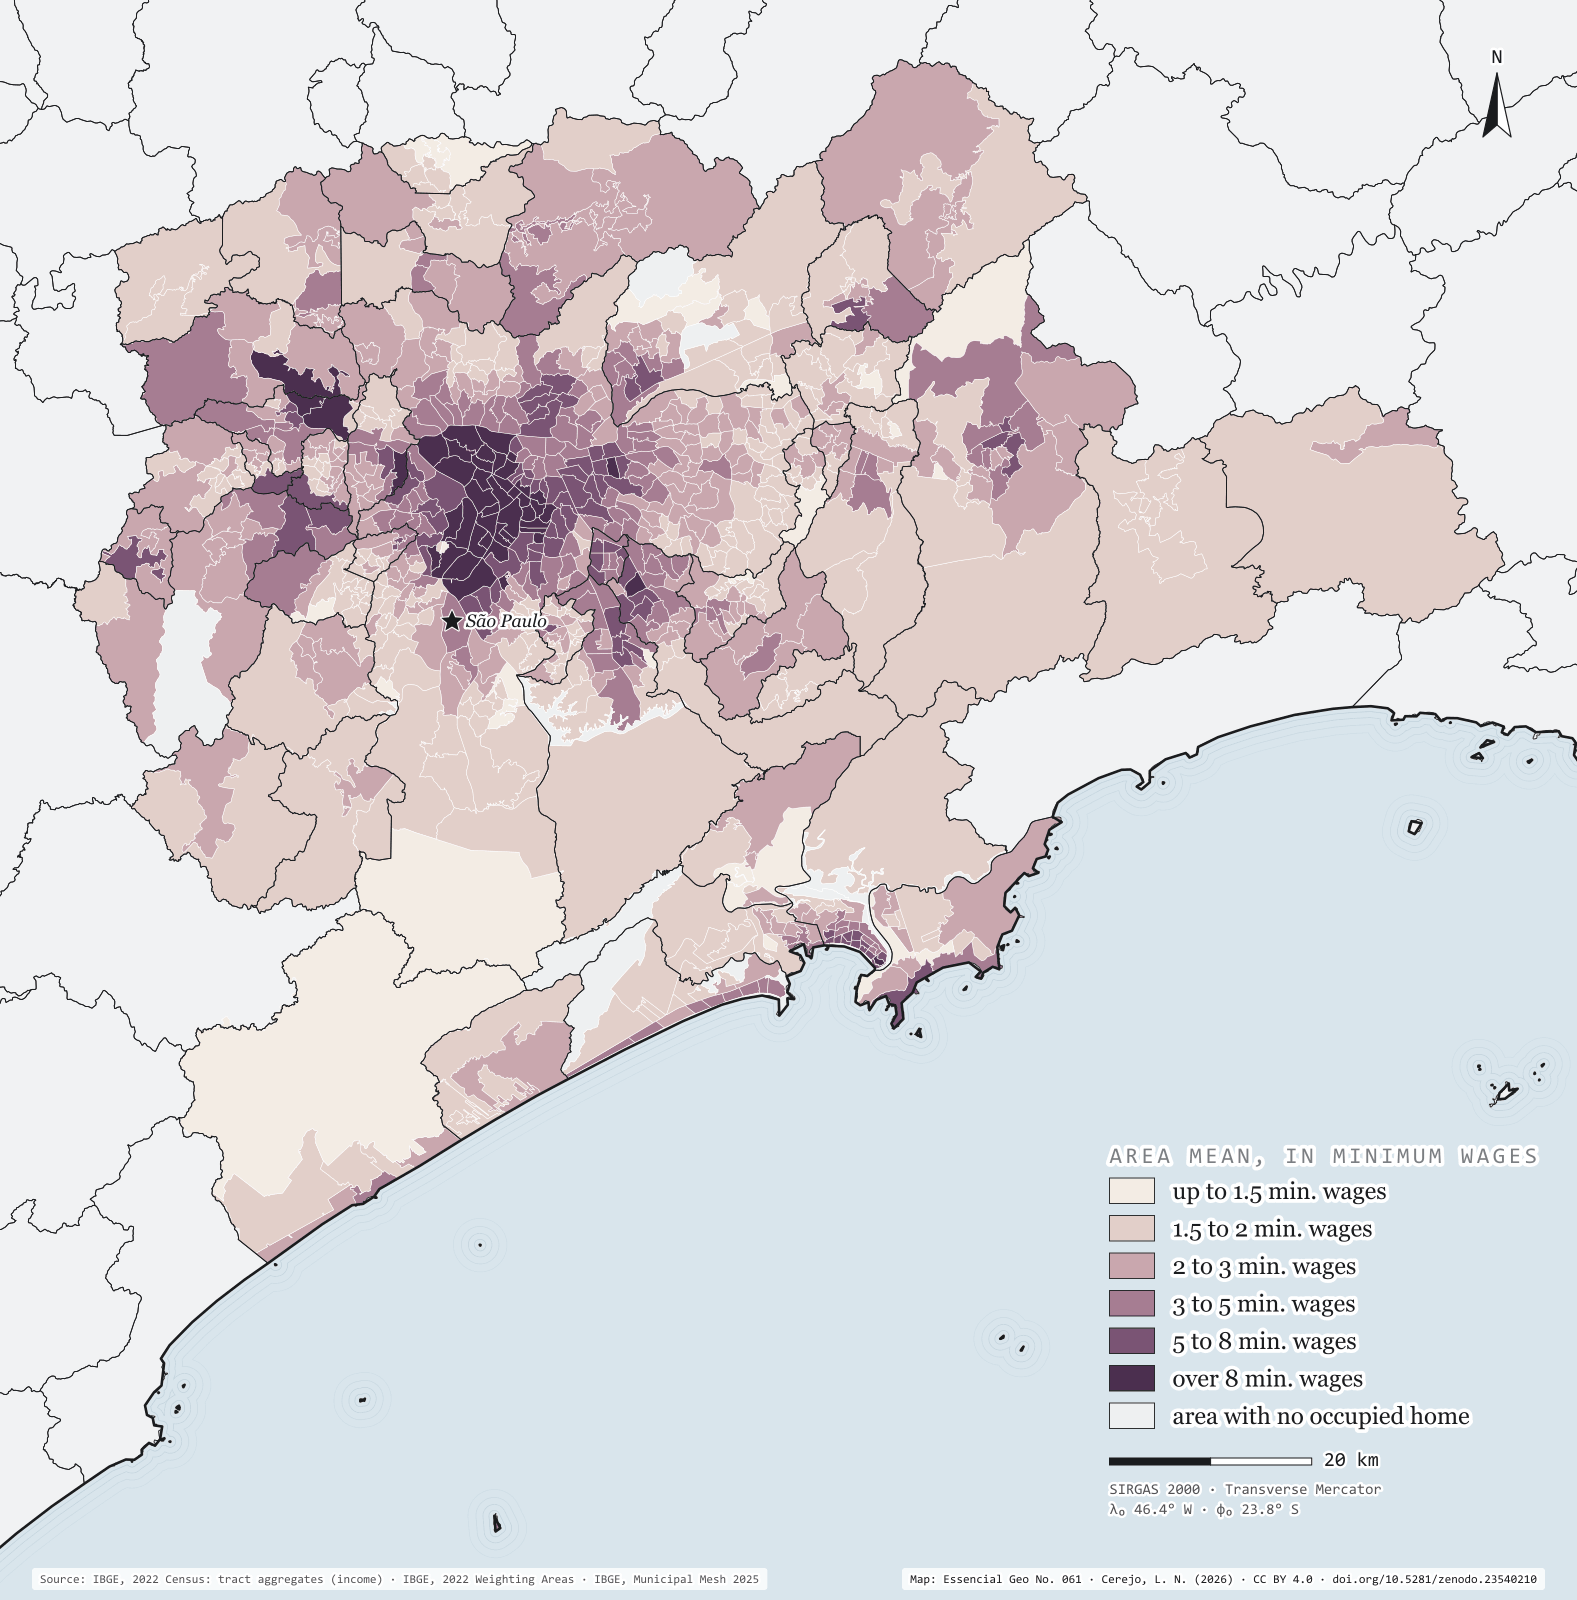
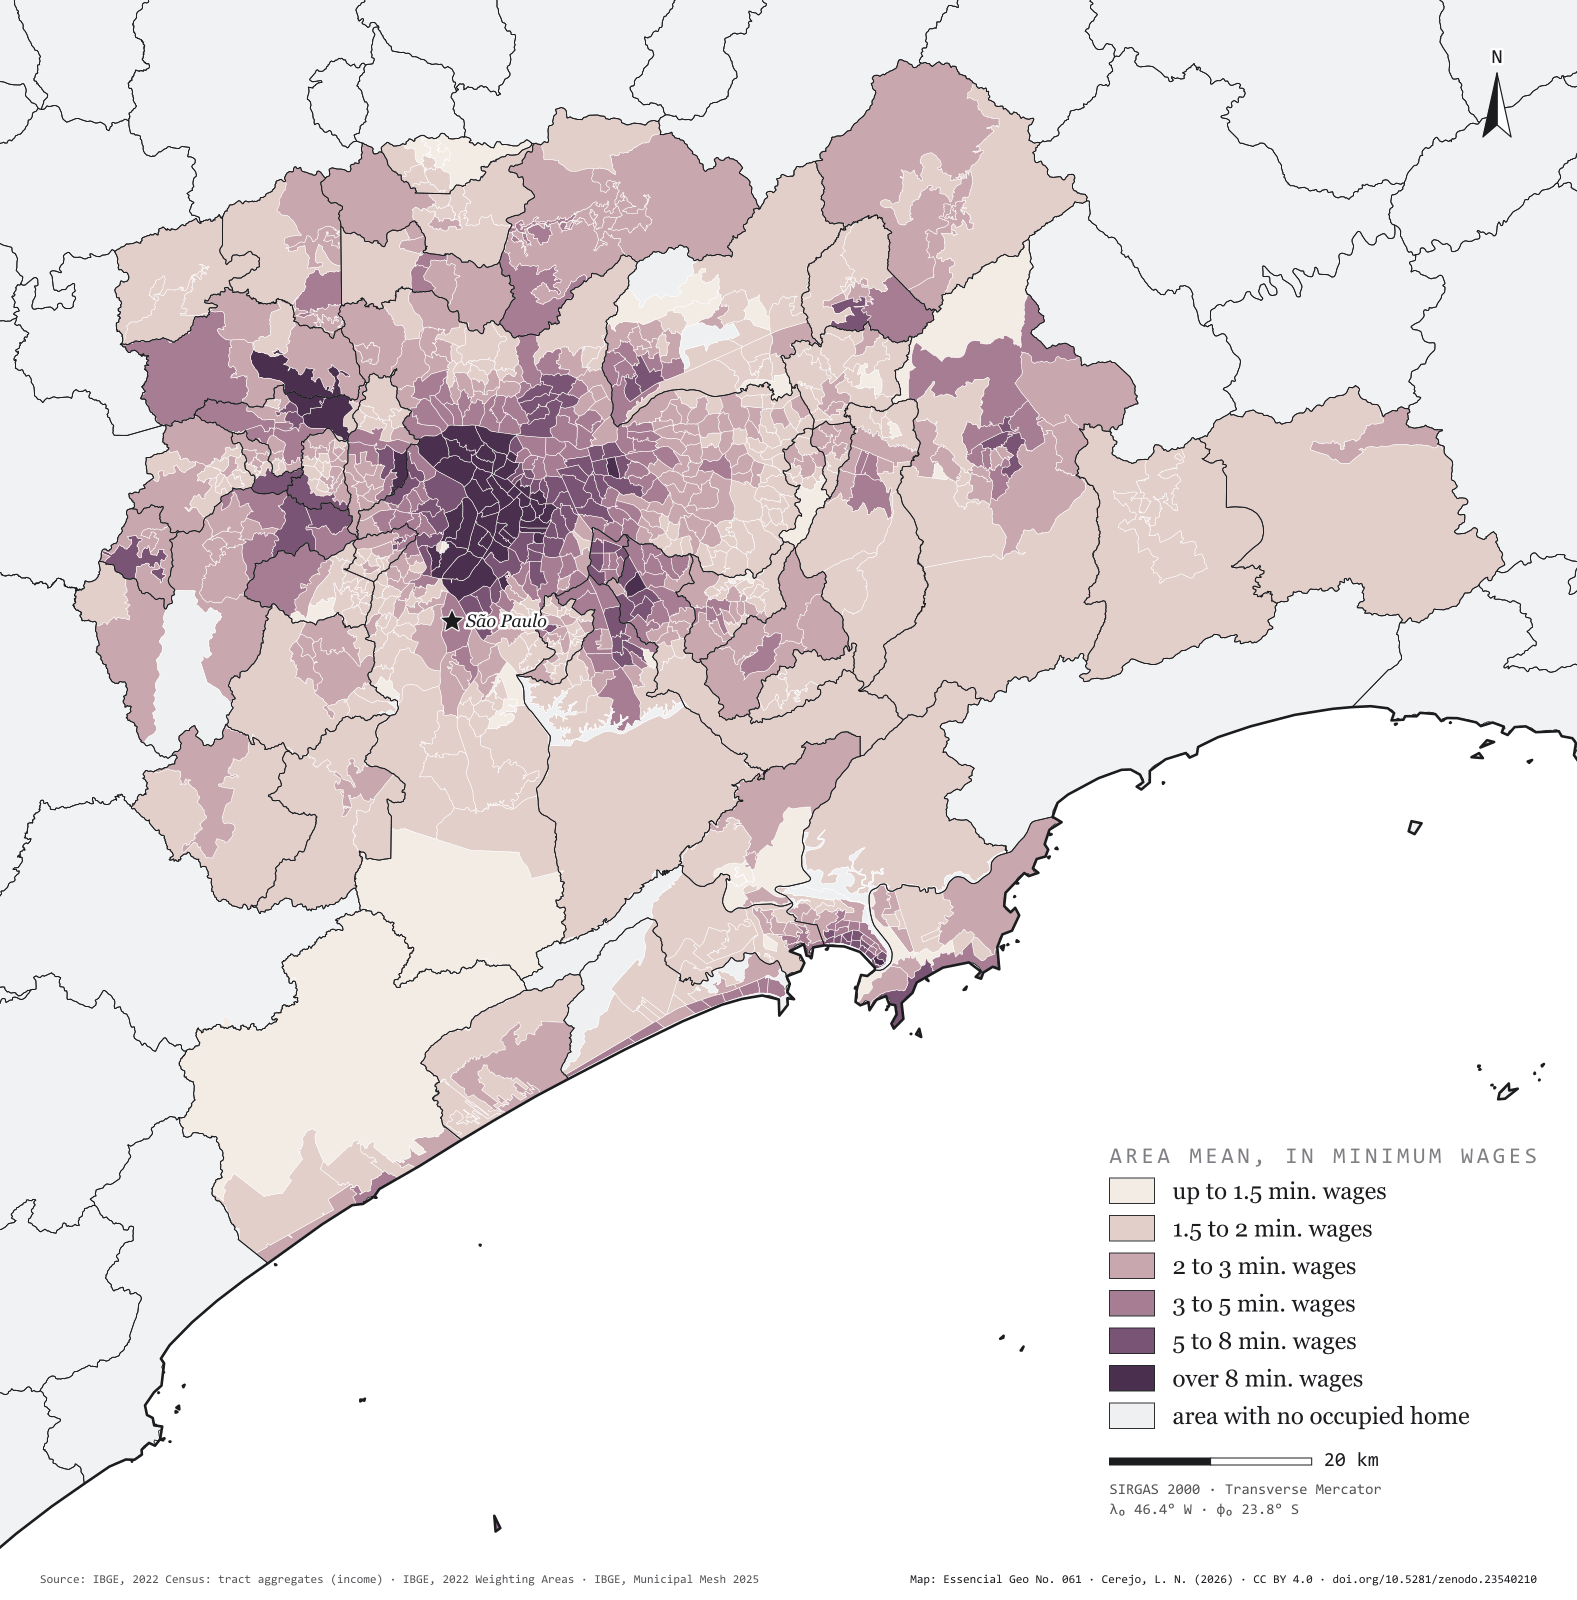
Greater São Paulo and the Santos lowlands add up to 44 municipalities and 22.3 million people. IBGE divides them into 841 inhabited weighting areas, and in each one the mean income of household heads can be worked out. The richest is Itaim Bibi, in the capital: R$ 17,804 a month, 14.7 minimum wages of 2022. Twenty kilometres away, in the same city, the Jardim Ângela area has R$ 1,655, 1.4 minimum wages: a gap of 10.8 times, the largest among São Paulo municipalities with five areas or more. Barueri comes next, from Alphaville to Engenho Novo (7.6 times), and Santos, from Ponta da Praia to Rádio Clube (6.1). The map shows the capital’s rich centre, stretching south-west to Alphaville, ringed by a pale belt that runs from Francisco Morato to Itaquaquecetuba and down the escarpment to the coast. Second plate of the collection “Income and rooftop solar”.
Technical record · downloads · citation
At a glance
Household heads by the weighting area’s mean income (household heads)
up to 1.5 min. wages2.9%
1.5 to 2 min. wages32.2%
2 to 3 min. wages28.3%
3 to 5 min. wages18.4%
5 to 8 min. wages11.2%
over 8 min. wages7%
Itaim Bibi over Jardim Ângela, mean income
11times
R$ 17,804 and R$ 1,655 a month
Layers
areas_de_ponderacaopolygon2,535 weighting areas statewide: main neighbourhood or district, people, household heads, mean income in reais and in minimum wages
regioes_intermediariaspolygon11 intermediate geographic regions
Mean income of household heads with income by 2022 Census weighting area: mean of tracts with data, weighted by the number of household heads, in 2022 minimum wages (R$ 1,212), in the 44 municipalities of the São Paulo and Santos urban concentrations.
The map without a frame, with legend, scale, reference system and credit written on it: ready for papers, lectures and slides. In two versions: with the basemap (neighbours and sea) or only the mapped area, on white.
CEREJO, Lucas Nakamura. A renda na metrópole: do Itaim Bibi ao Jardim Ângela, onze vezes. Versão 1.0.0. [S. l.]: Zenodo, 2026. Conjunto de dados. DOI: 10.5281/zenodo.23540210. Disponível em: https://doi.org/10.5281/zenodo.23540210. Acesso em: 10 nov. 2026.
Cerejo, L. N. (2026). A renda na metrópole: do Itaim Bibi ao Jardim Ângela, onze vezes [Income in the metropolis: From Itaim Bibi to Jardim Ângela, eleven times over] (Version 1.0.0) [Data set]. Zenodo. https://doi.org/10.5281/zenodo.23540210
@dataset{cerejo2026_renda_na_metropole_sp,
  author    = {Cerejo, Lucas Nakamura},
  title     = {A renda na metrópole: Do Itaim Bibi ao Jardim Ângela, onze vezes},
  year      = {2026},
  publisher = {Zenodo},
  version   = {1.0.0},
  doi       = {10.5281/zenodo.23540210},
  url       = {https://doi.org/10.5281/zenodo.23540210},
  language  = {portuguese},
  note      = {English title: Income in the metropolis: From Itaim Bibi to Jardim Ângela, eleven times over. Licence CC BY 4.0}
}
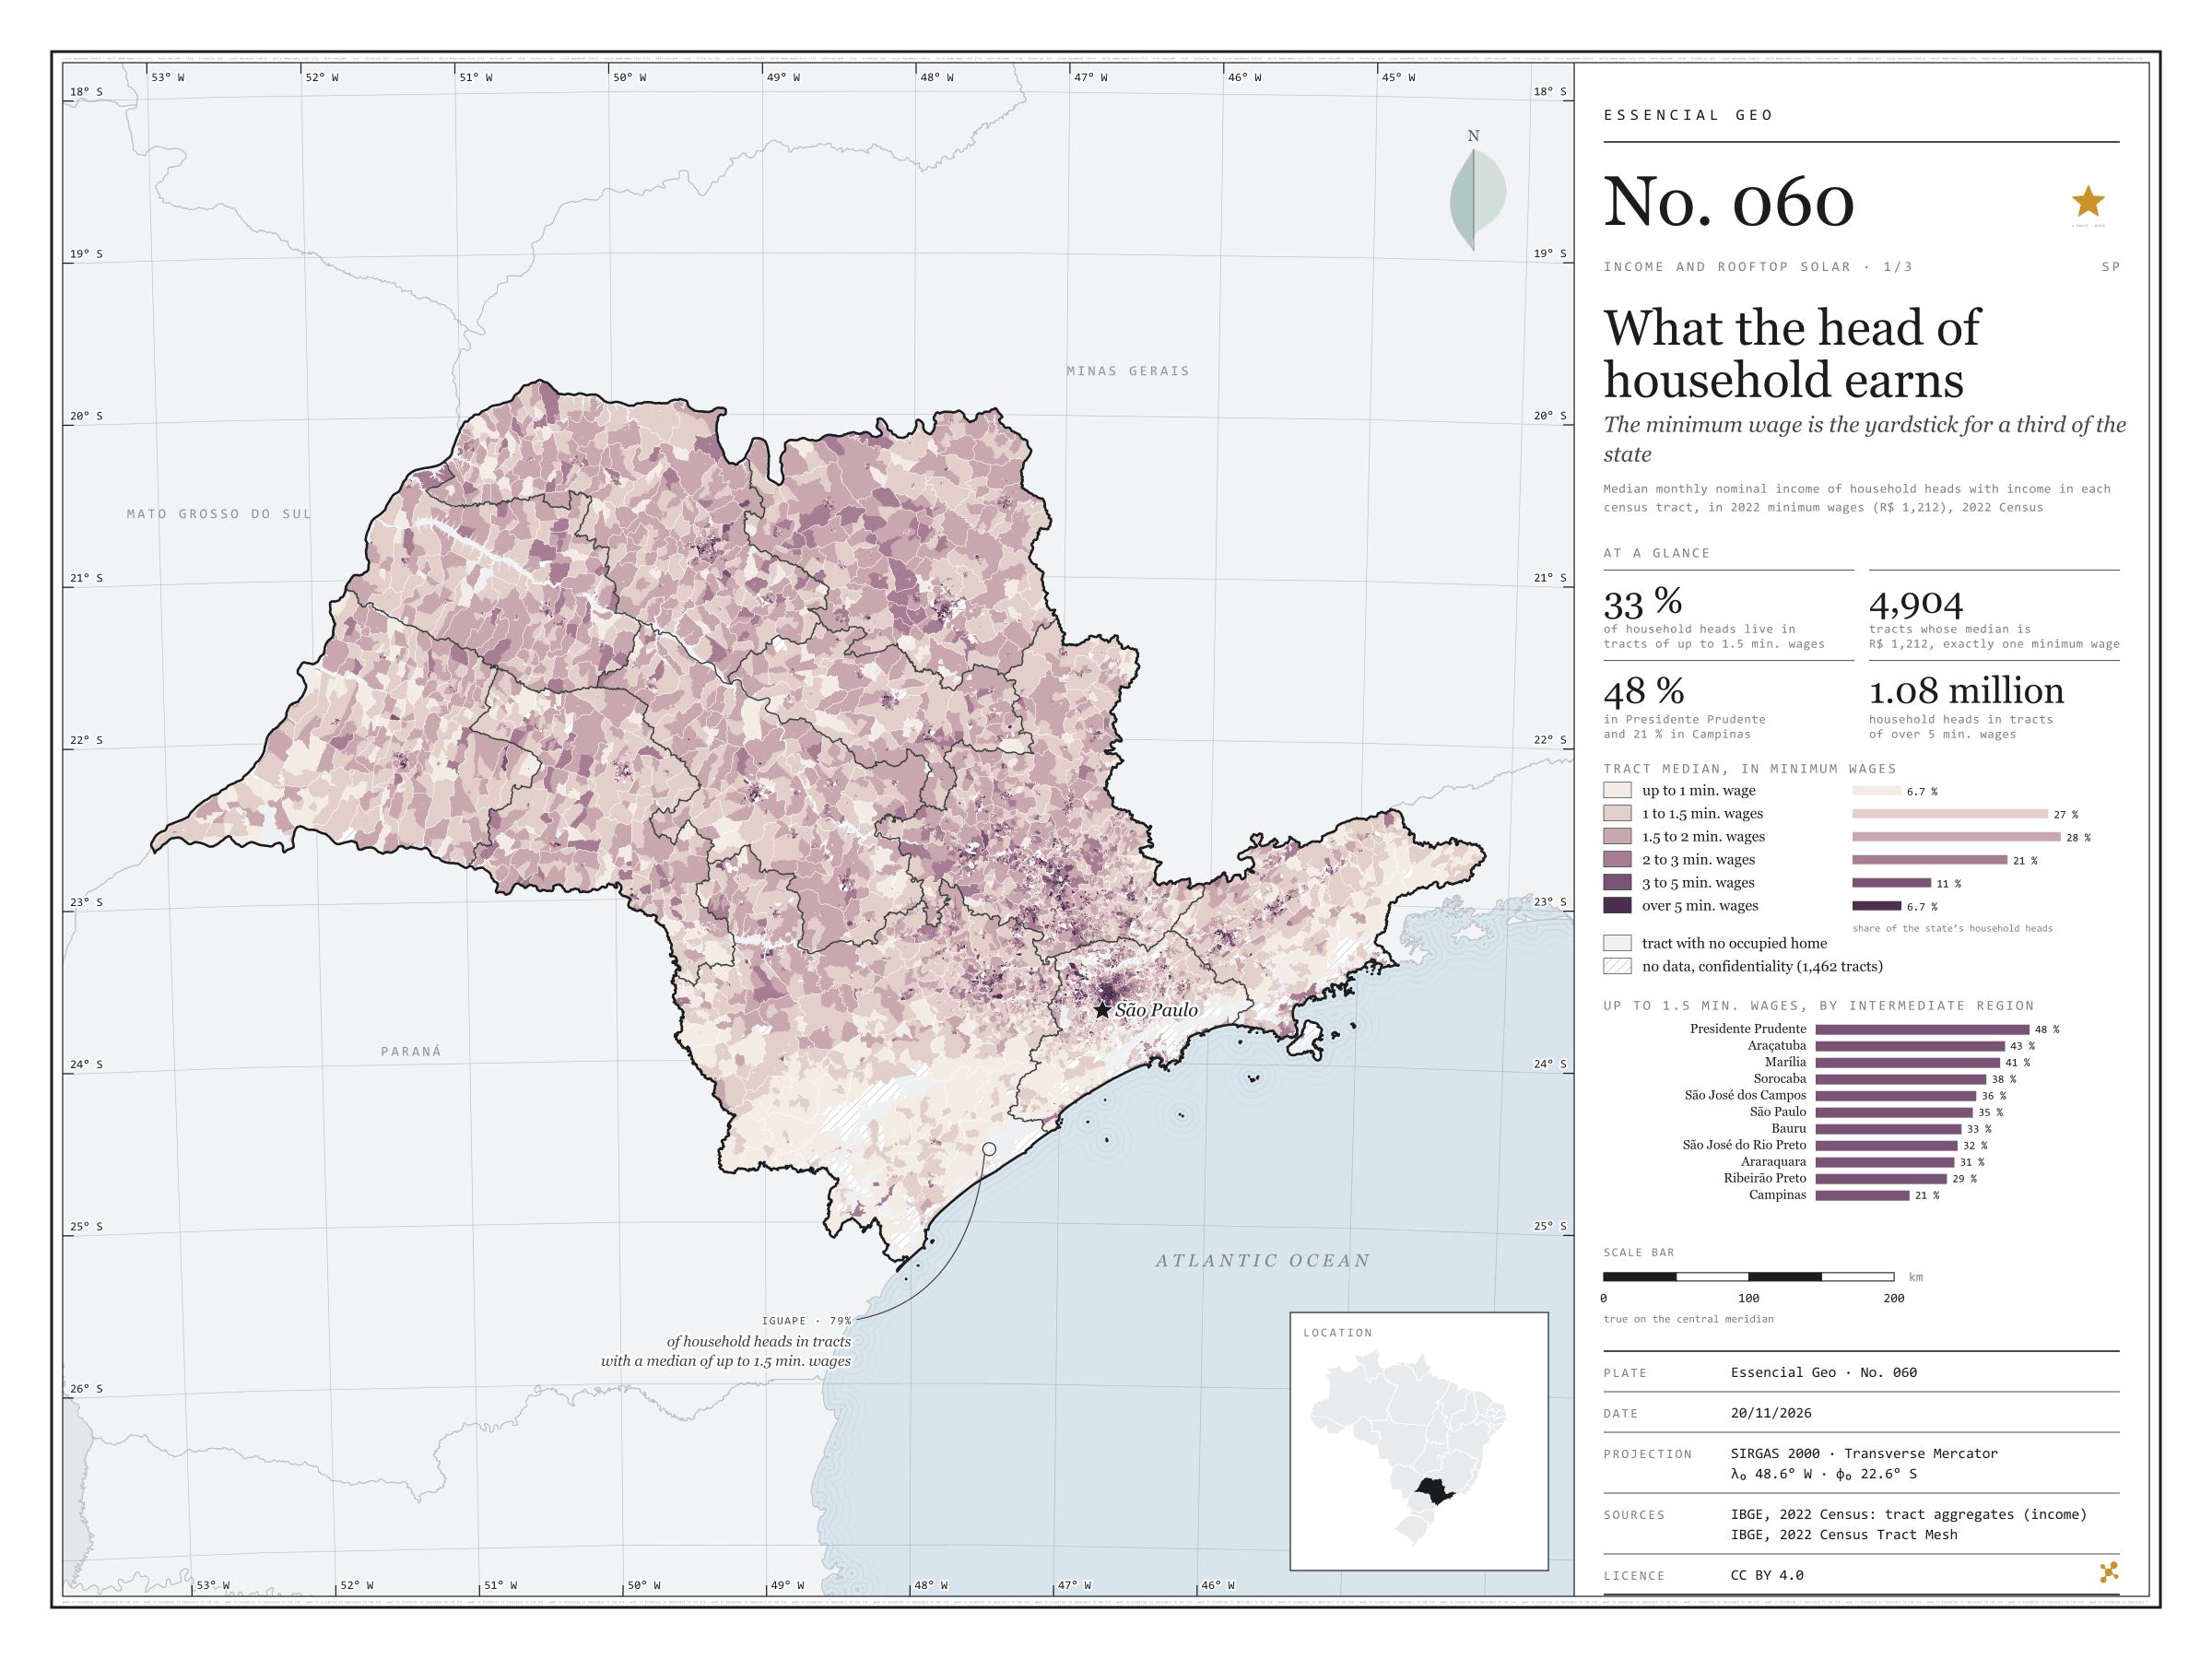
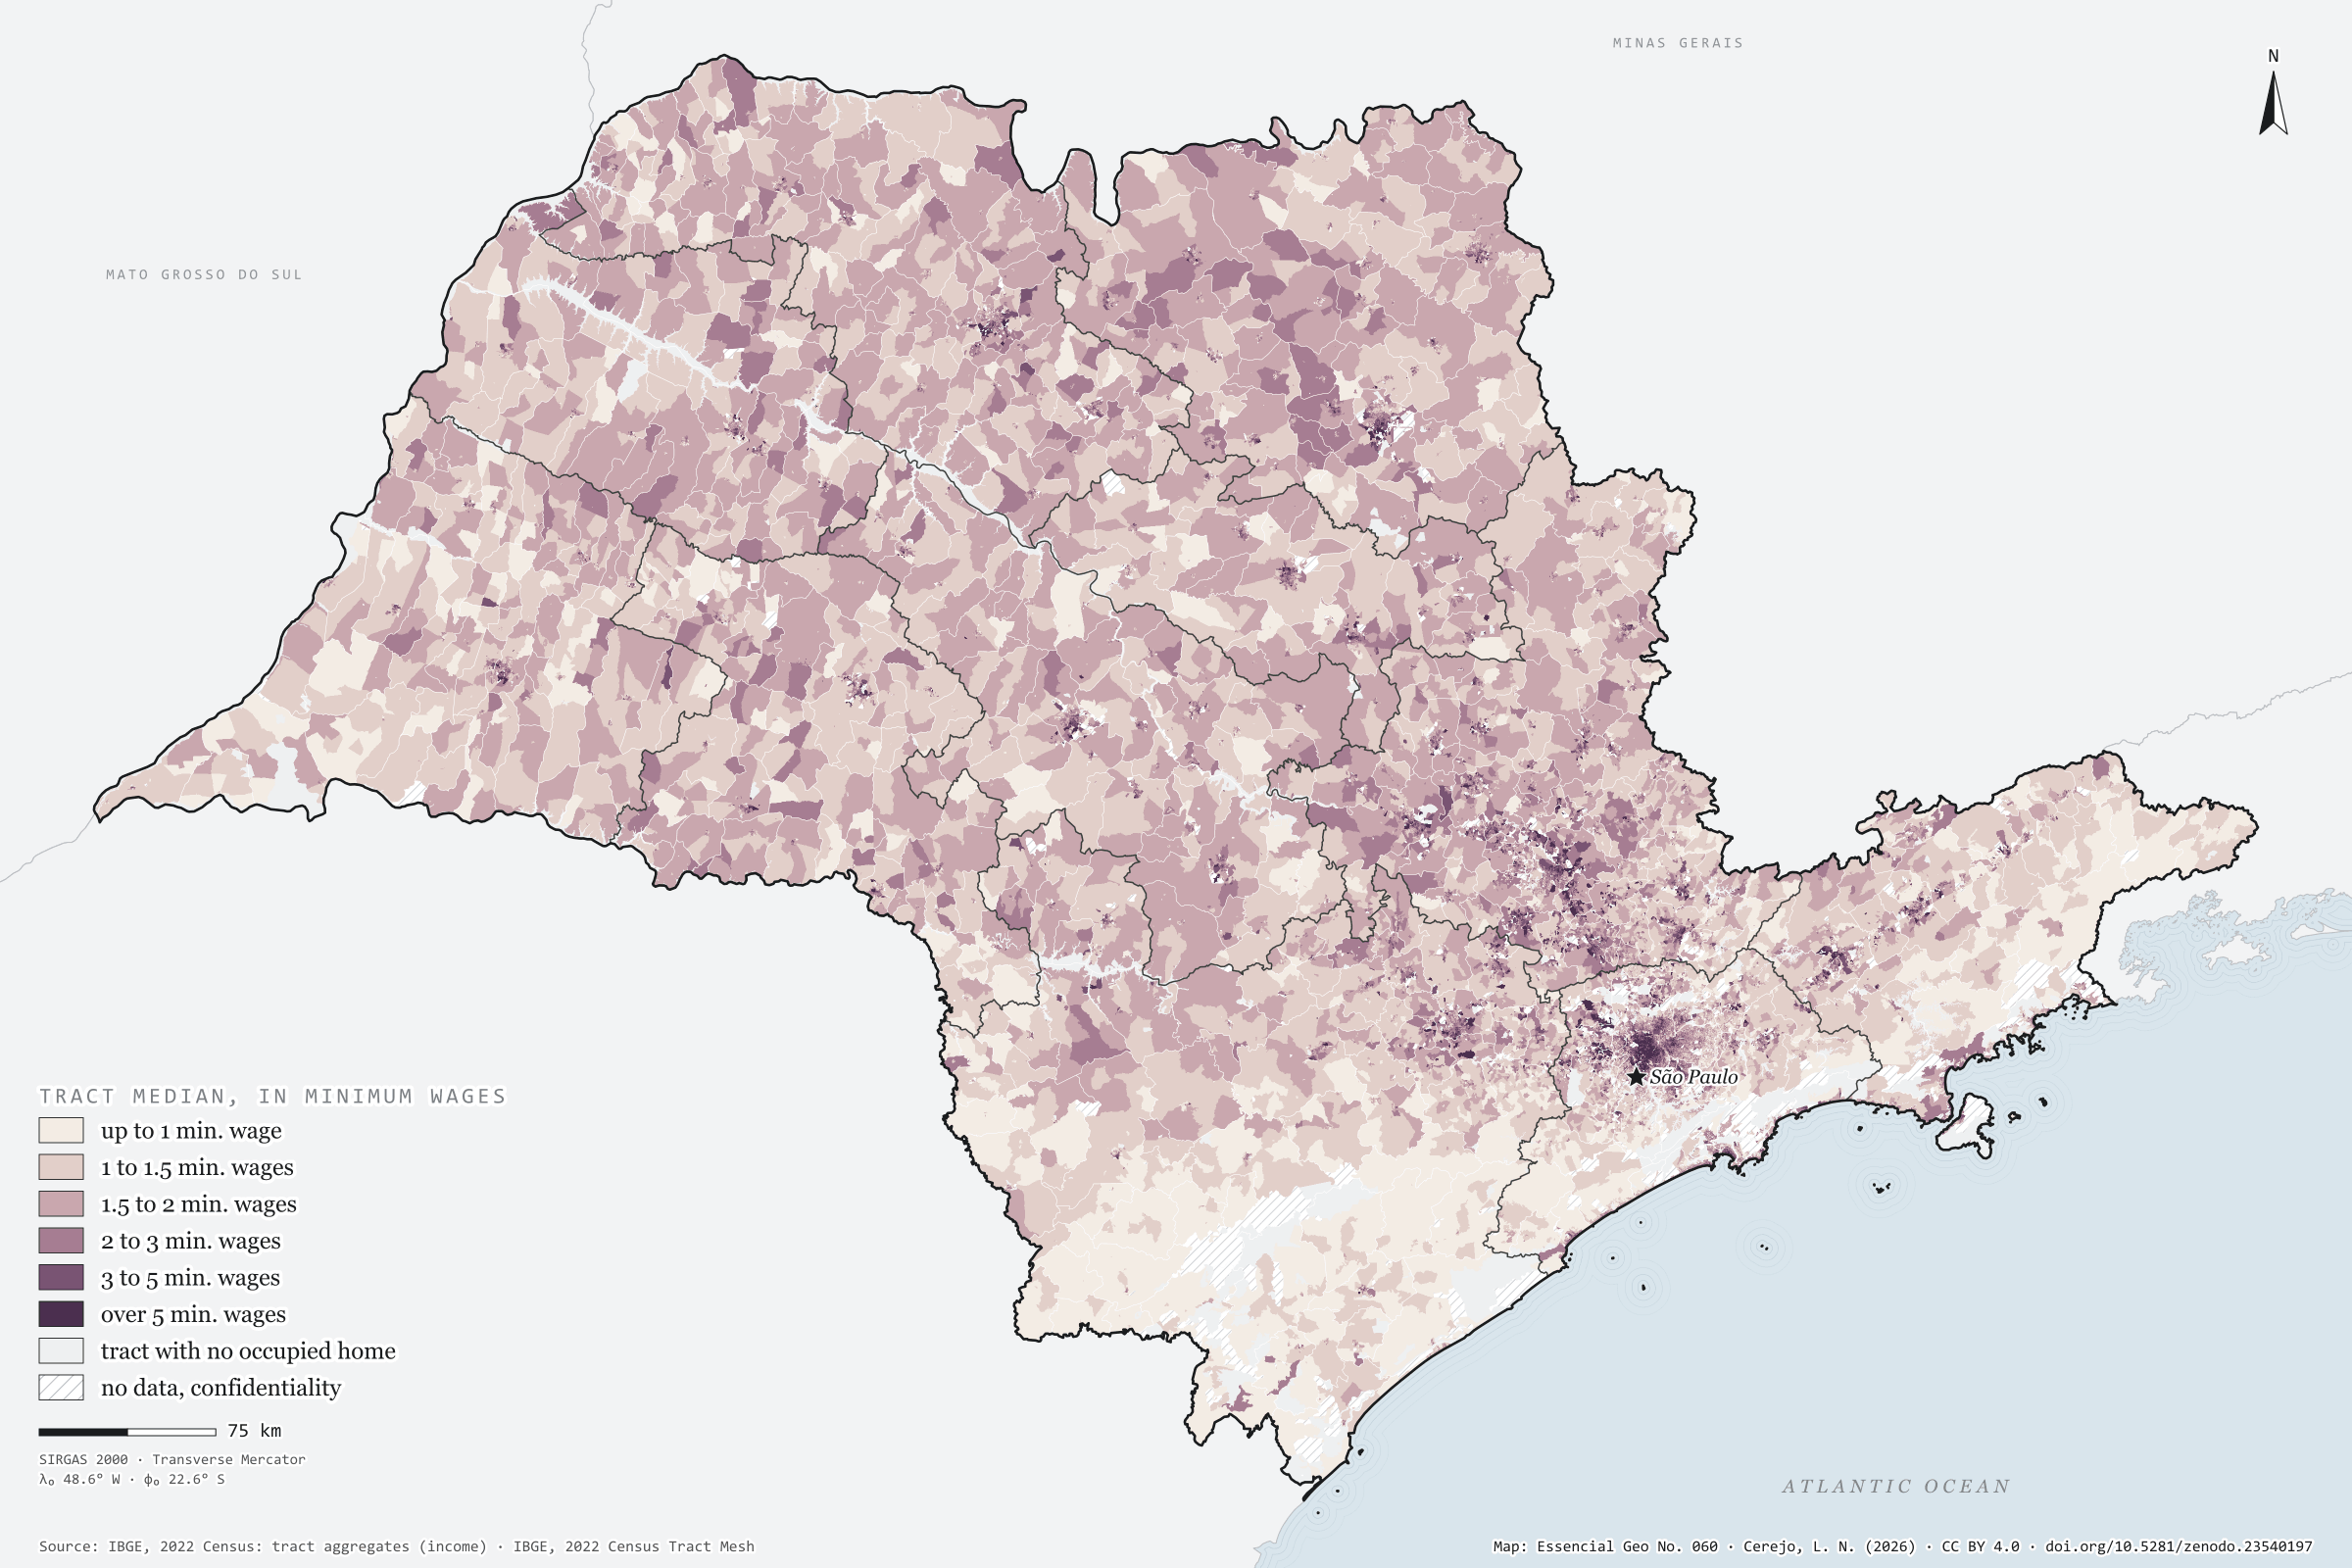
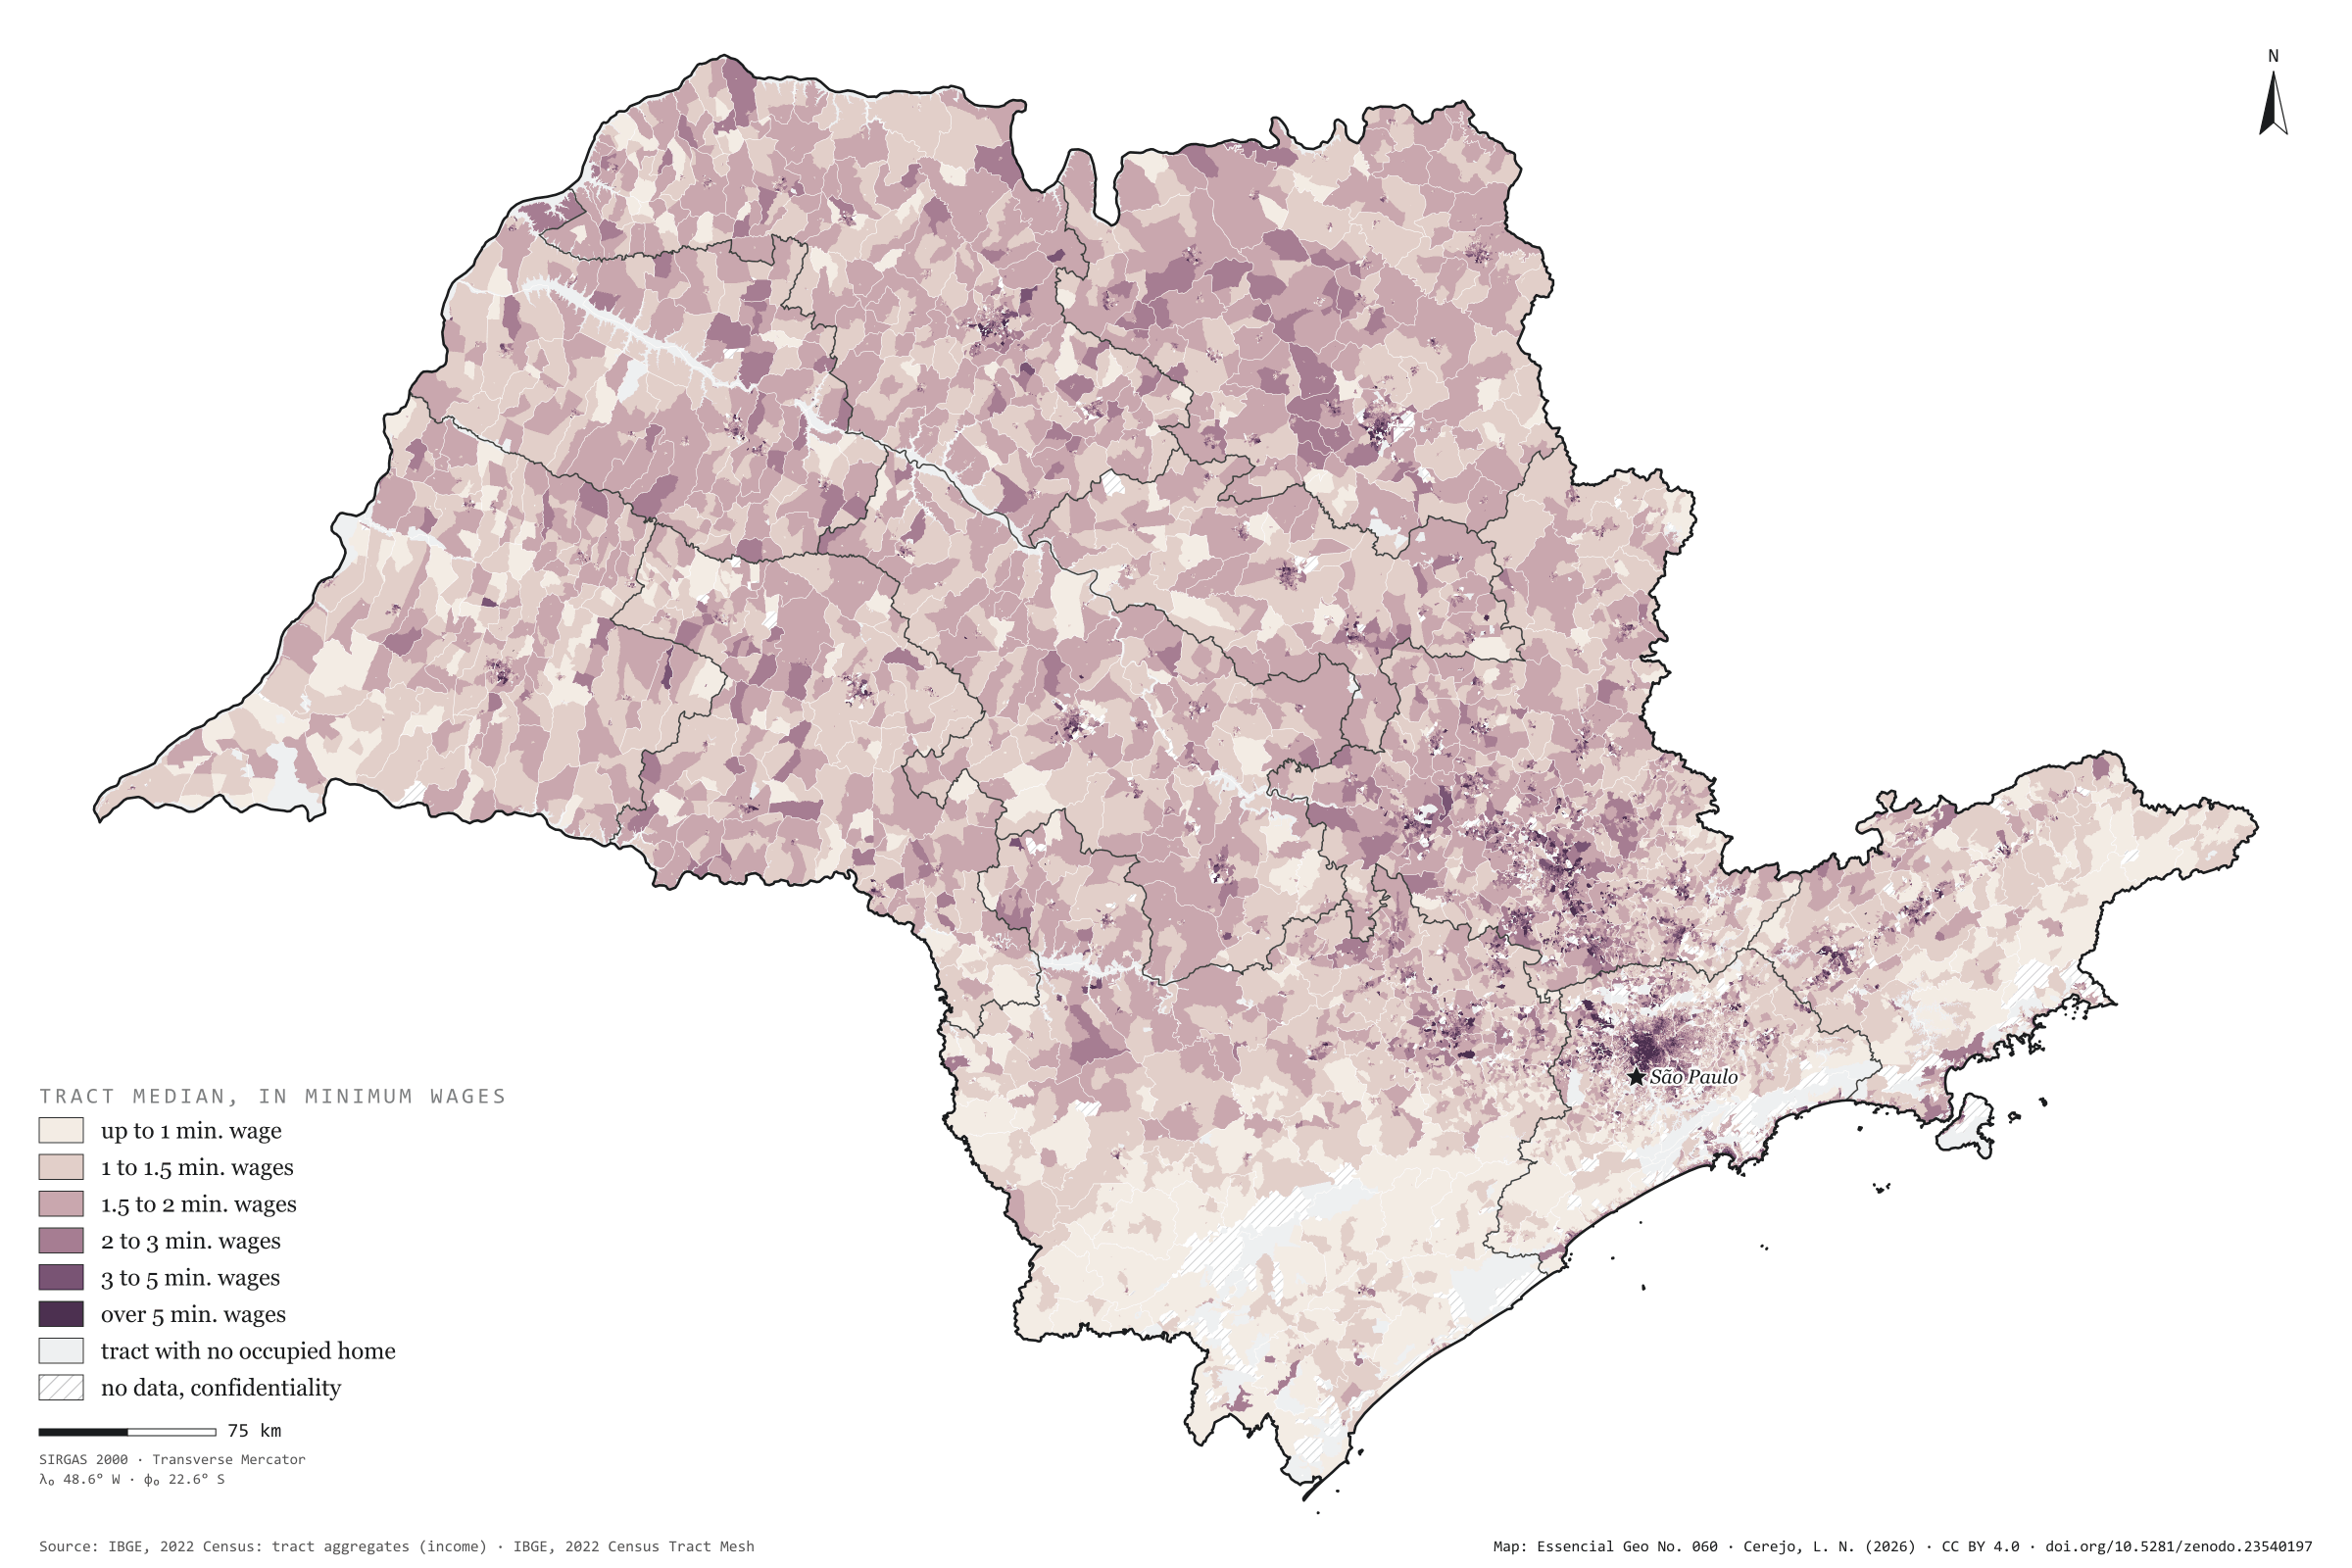
The minimum wage is the yardstick for a third of the state
Fig. 060São Paulo State (SP)EPSG:4674Source: IBGE
In each census tract of São Paulo, what does the person responsible for the household earn? The 2022 Census gives the median income of household heads with income, and the minimum wage of the time, R$ 1,212, works as a yardstick: in 4,904 tracts the median is exactly one minimum wage. A third of the state’s 16.2 million household heads live in tracts with a median of up to 1.5 minimum wages. The map pales in the Ribeira Valley and the west; in the Presidente Prudente region, 48% of household heads live in such tracts; in the Campinas region, 21%. In Iguape it is 79%; in Francisco Morato, in Greater São Paulo, 78%. At the other end, 1.08 million household heads live in tracts of over 5 minimum wages; the largest shares are in São Caetano do Sul (23%), Santana de Parnaíba and Vinhedo. Plate 034 zooms in on the Campinas region. First plate of the collection “Income and rooftop solar”.
Technical record · downloads · citation
At a glance
Household heads by tract median (household heads)
up to 1 min. wage6.7%
1 to 1.5 min. wages26.6%
1.5 to 2 min. wages28.3%
2 to 3 min. wages21.1%
3 to 5 min. wages10.7%
over 5 min. wages6.7%
Household heads in tracts of up to 1.5 minimum wages
33%
5.40 million of 16.2 million
Tracts with a median of exactly one minimum wage
4,904tracts
Layers
setorespolygon103,319 tracts: household heads, mean and median income in reais and in minimum wages, class
regioes_intermediariaspolygon11 intermediate geographic regions
Median monthly nominal income of household heads with income, by 2022 Census tract, in six classes measured in 2022 minimum wages (R$ 1,212); tracts with confidential values are left as no data.
The map without a frame, with legend, scale, reference system and credit written on it: ready for papers, lectures and slides. In two versions: with the basemap (neighbours and sea) or only the mapped area, on white.
CEREJO, Lucas Nakamura. Quanto ganha quem responde pela casa: o salário mínimo é a régua de um terço do estado. Versão 1.0.0. [S. l.]: Zenodo, 2026. Conjunto de dados. DOI: 10.5281/zenodo.23540197. Disponível em: https://doi.org/10.5281/zenodo.23540197. Acesso em: 10 nov. 2026.
Cerejo, L. N. (2026). Quanto ganha quem responde pela casa: o salário mínimo é a régua de um terço do estado [What the head of household earns: The minimum wage is the yardstick for a third of the state] (Version 1.0.0) [Data set]. Zenodo. https://doi.org/10.5281/zenodo.23540197
@dataset{cerejo2026_renda_mediana_sp,
  author    = {Cerejo, Lucas Nakamura},
  title     = {Quanto ganha quem responde pela casa: O salário mínimo é a régua de um terço do estado},
  year      = {2026},
  publisher = {Zenodo},
  version   = {1.0.0},
  doi       = {10.5281/zenodo.23540197},
  url       = {https://doi.org/10.5281/zenodo.23540197},
  language  = {portuguese},
  note      = {English title: What the head of household earns: The minimum wage is the yardstick for a third of the state. Licence CC BY 4.0}
}
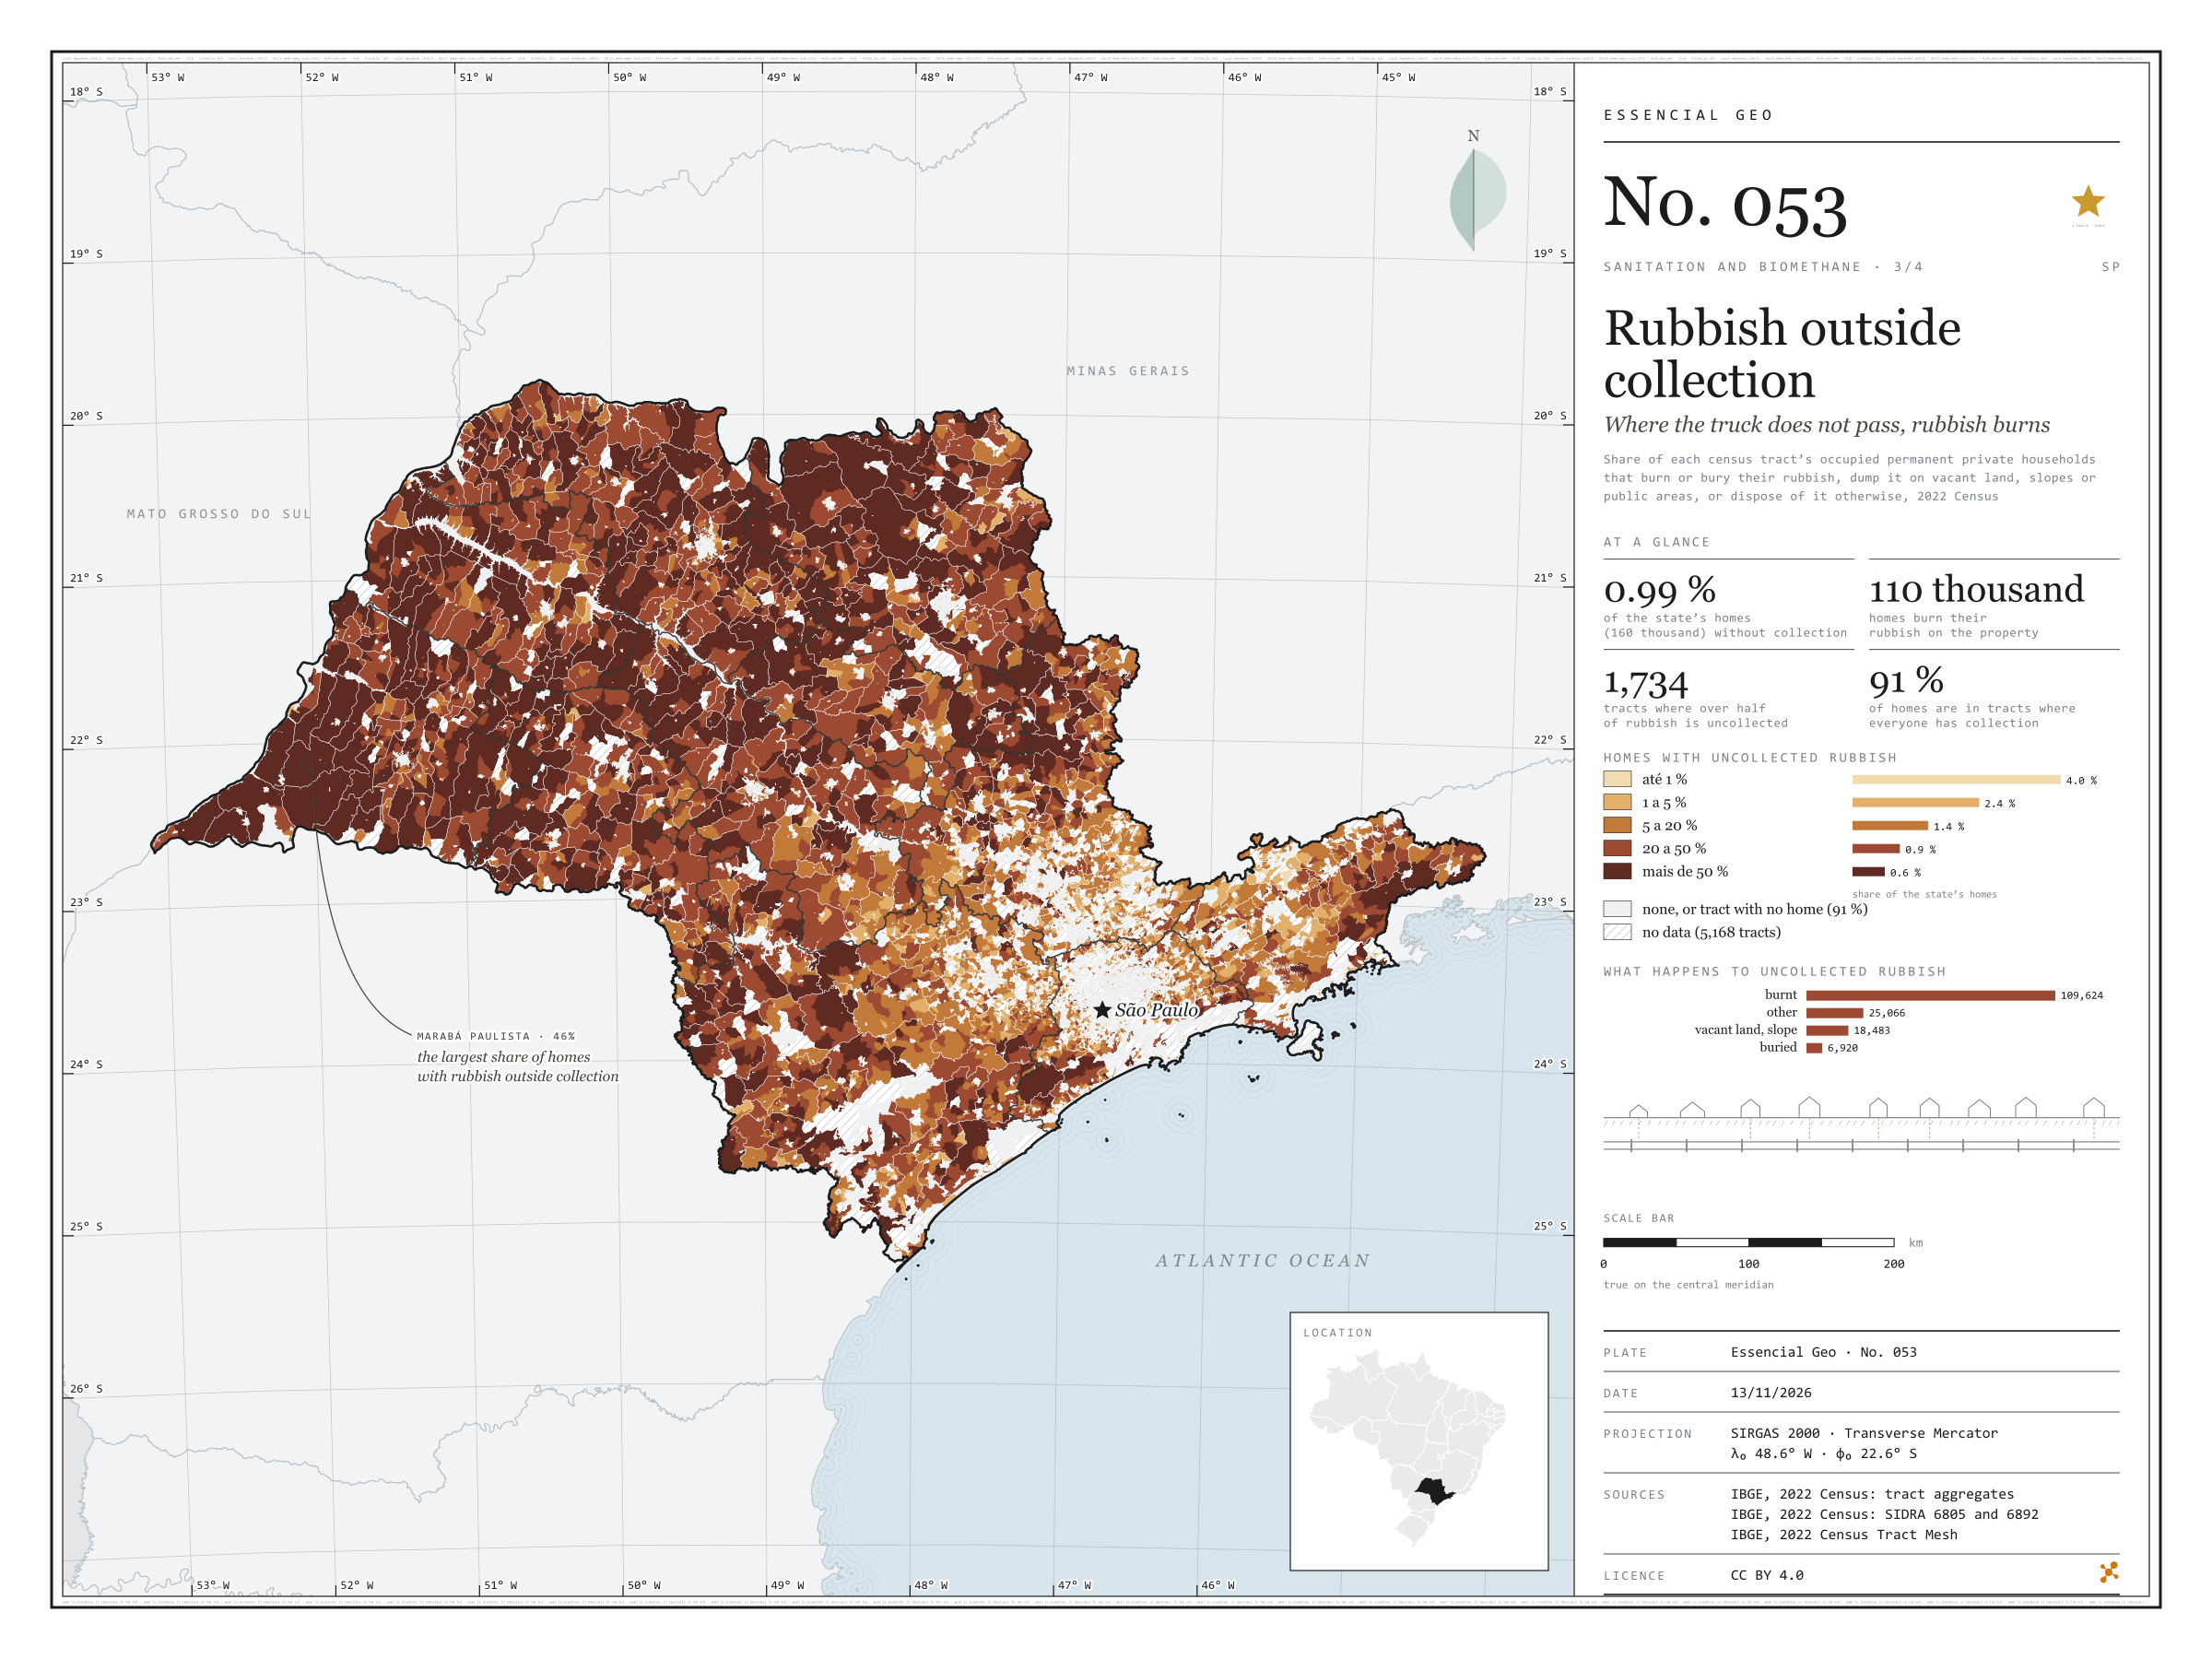
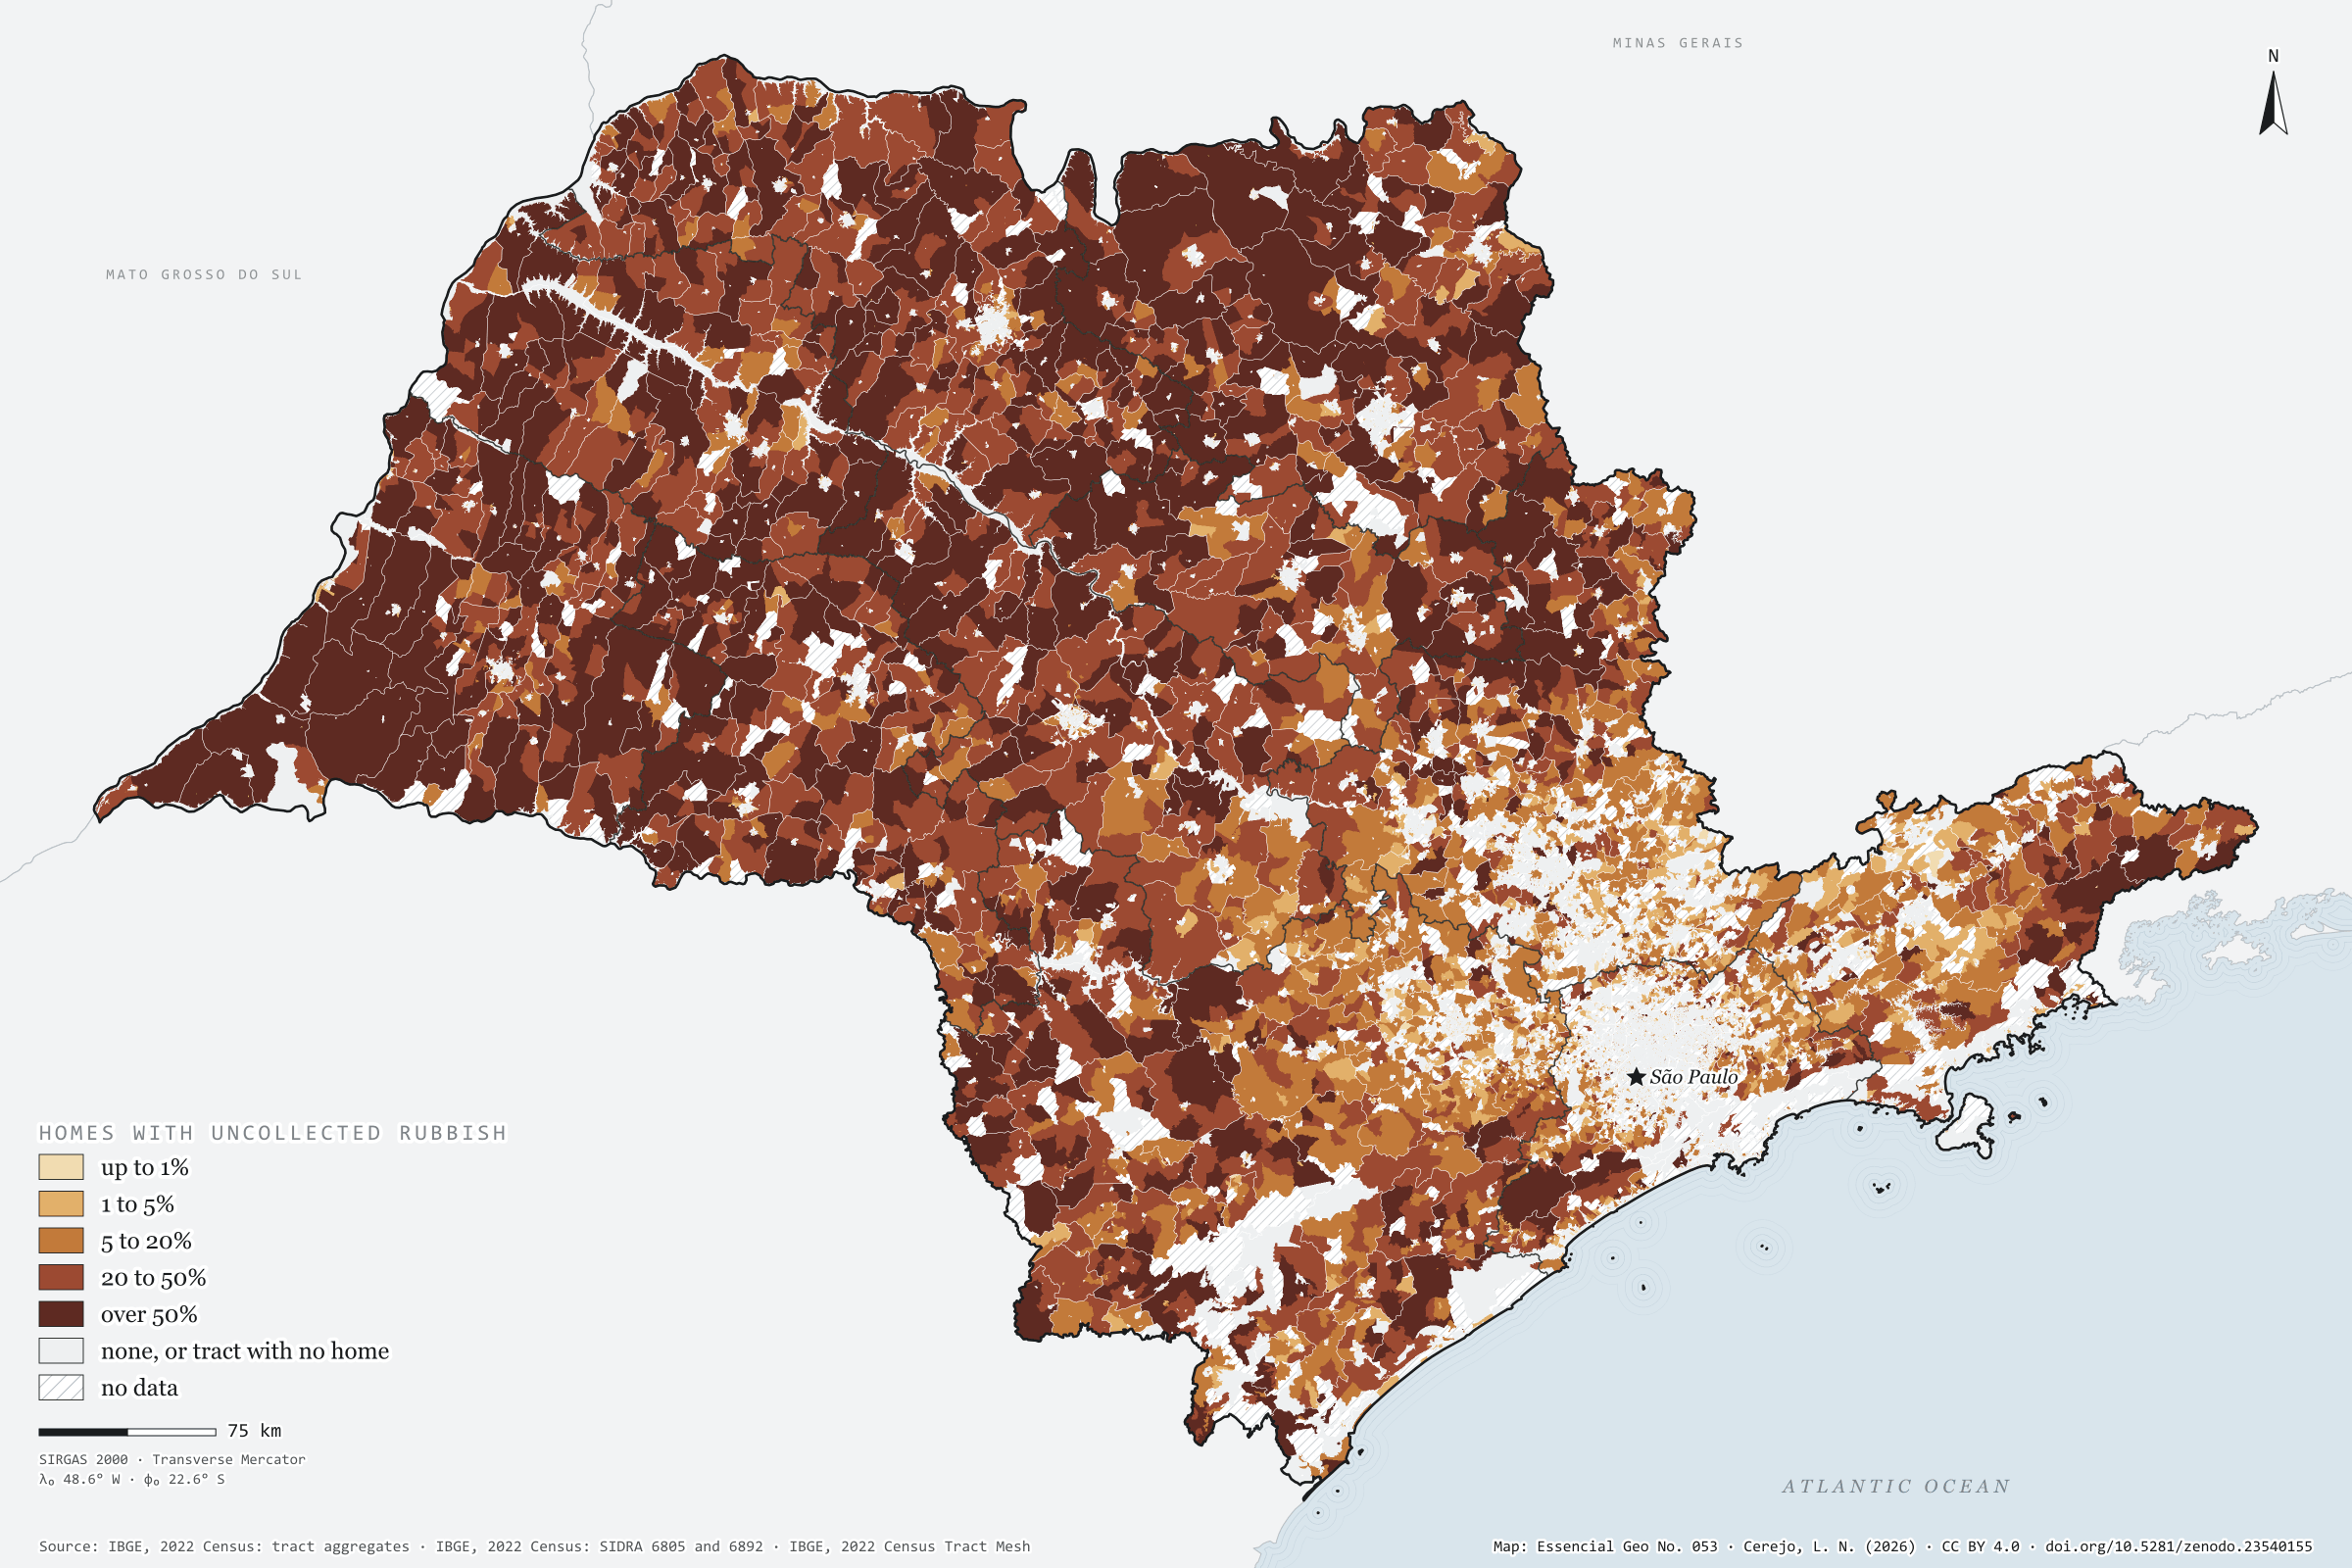
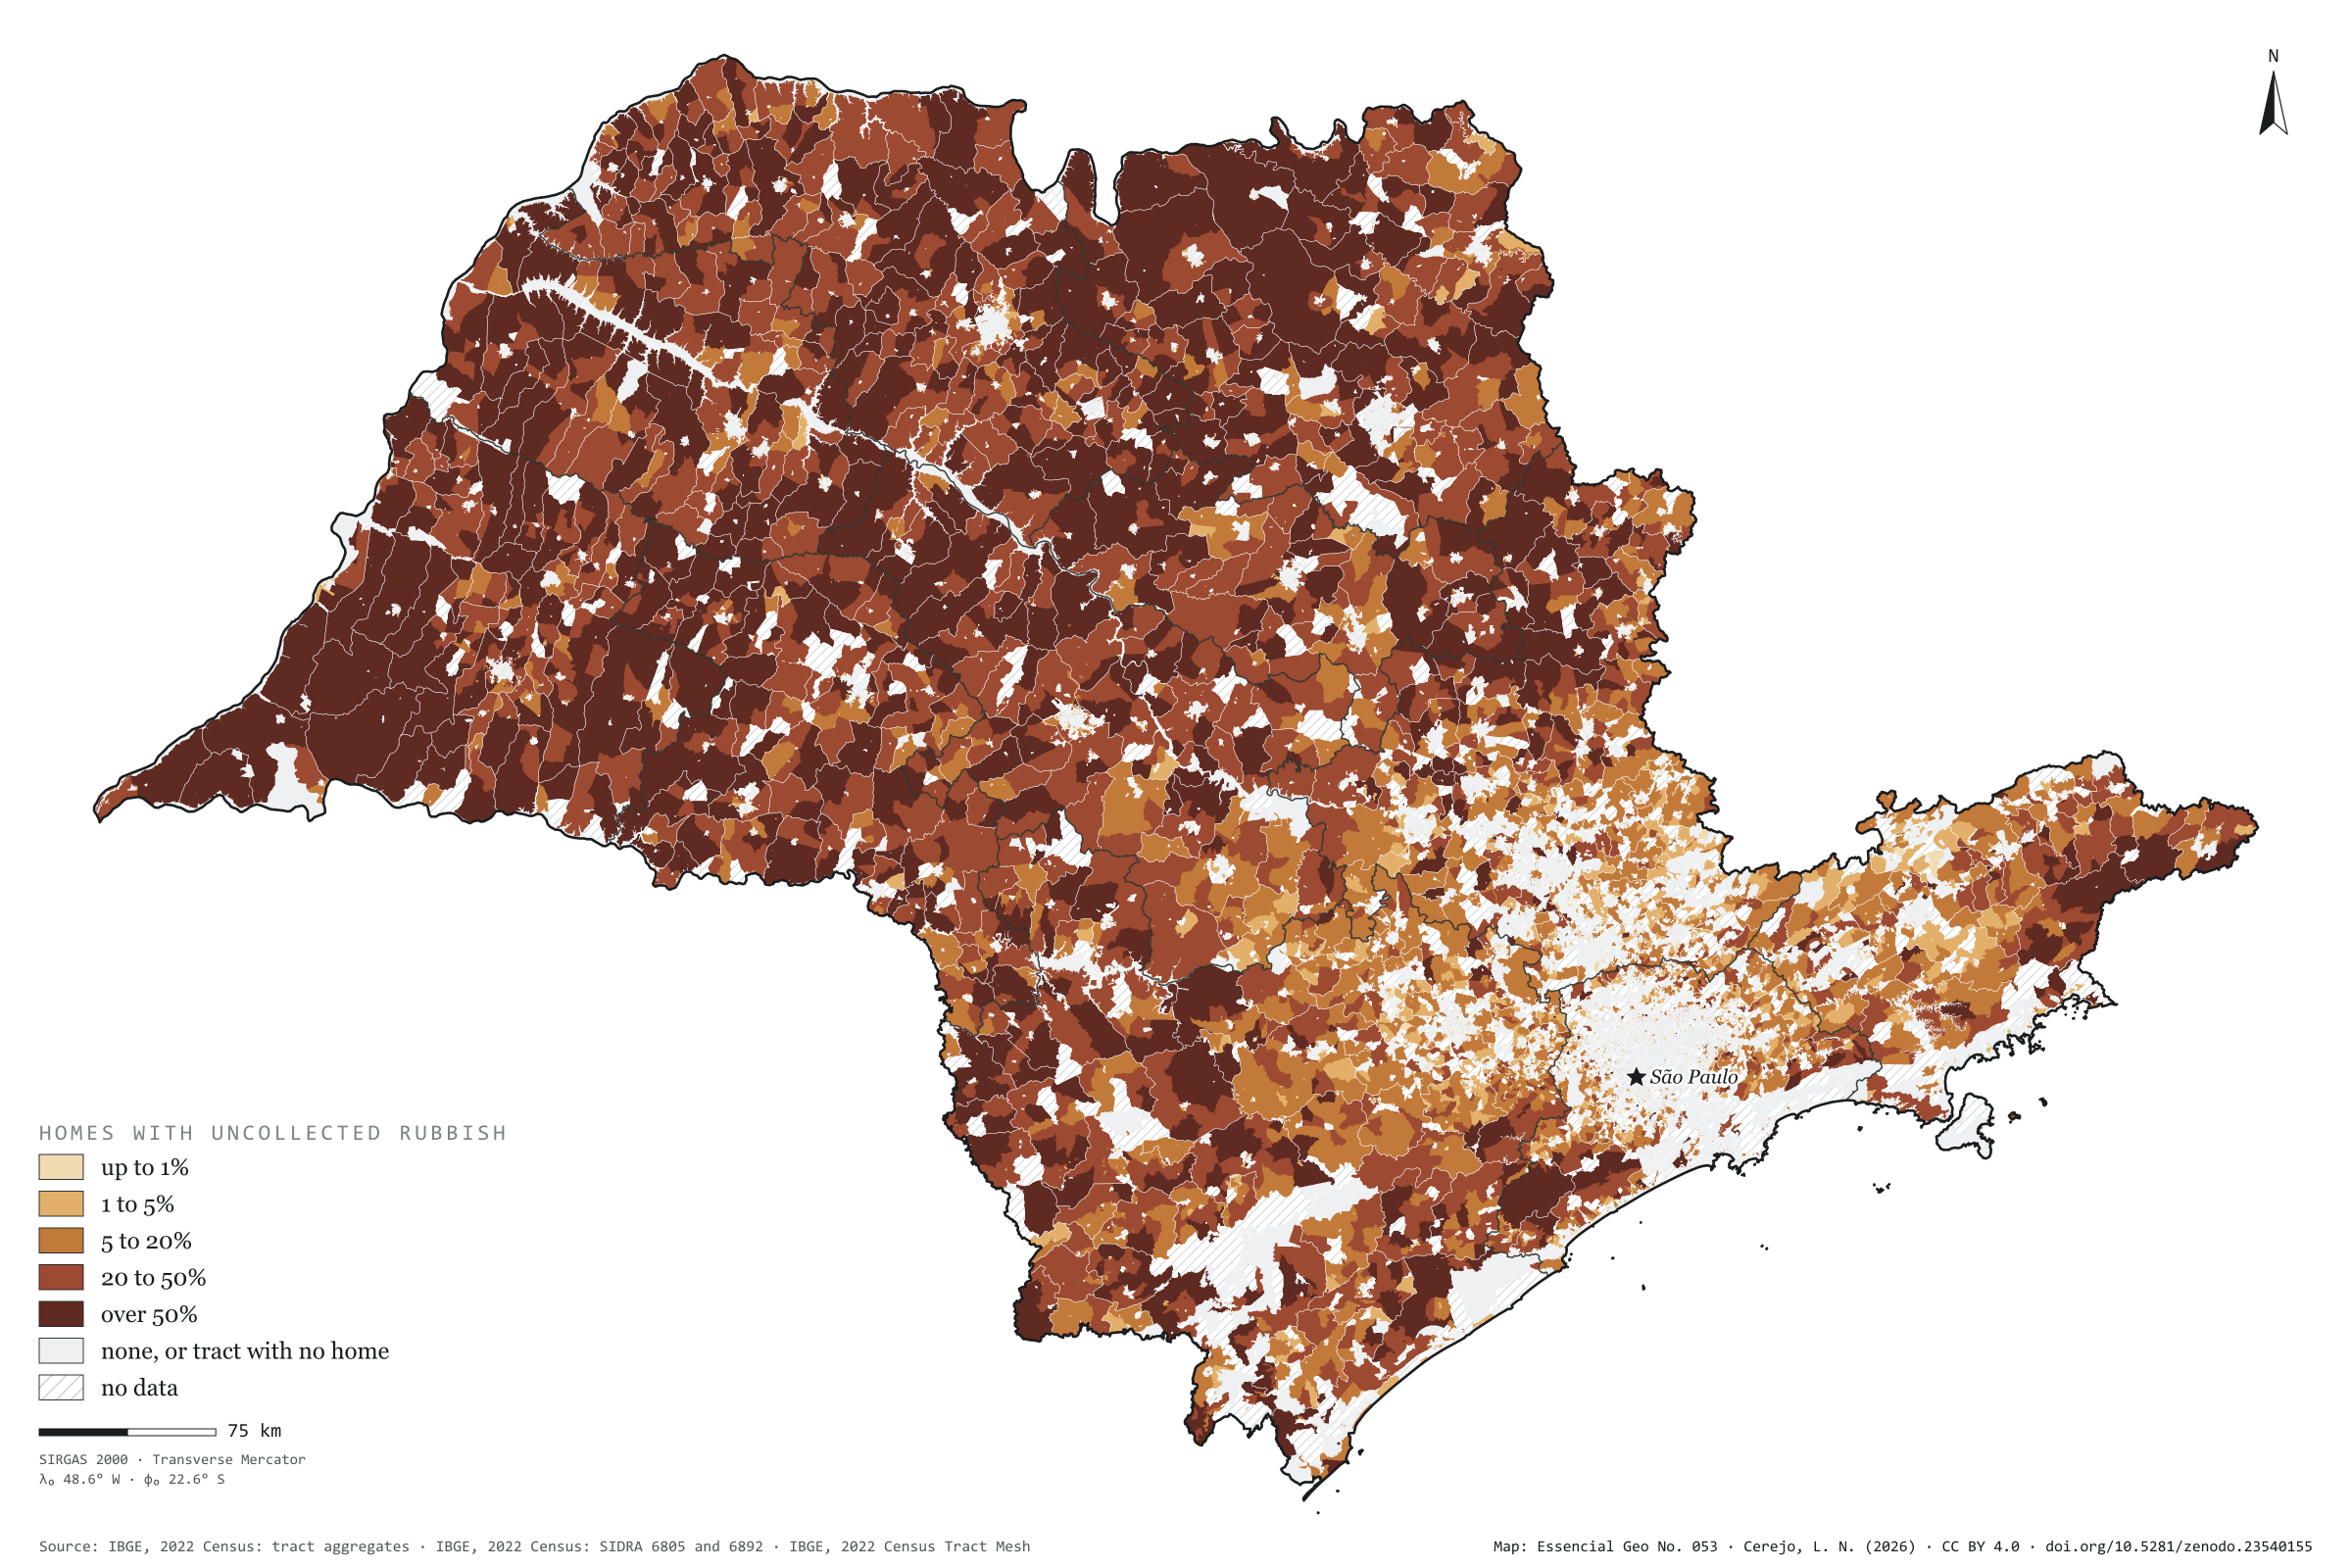
Nearly all of São Paulo’s rubbish is collected: in 2022, only 0.99% of households, 160,000, disposed of it otherwise. But that 1% is not spread out. It is in the countryside, where the truck does not reach, and the most common destination is fire: 110,000 households burnt their rubbish on the property. Painted tract by tract, the map shows the state inside out: the towns are pale, with collection for everyone, and the rural interior darkens. In 1,734 tracts, more than half the households had no collection. Marabá Paulista, in the Pontal do Paranapanema, has the largest share of its households outside collection (46%); the capital has the largest number (12,094). Rubbish that is not collected does not reach a landfill or a digester either. Third plate of the collection “Sanitation and biomethane”.
Technical record · downloads · citation
At a glance
Households, by the share of their tract with uncollected rubbish (households)
none90.7%
up to 1%4%
1 to 5%2.4%
5 to 20%1.4%
20 to 50%0.9%
over 50%0.6%
Households with uncollected rubbish
1%
160,093 of 16,224,248 (SIDRA 6892)
Households burning rubbish on the property
109,624households
Layers
setorespolygon103,319 census tracts: households by rubbish destination and uncollected-rubbish class (same GPKG as plate 051)
regioes_intermediariaspolygon11 intermediate geographic regions
Share of each census tract’s occupied permanent private households that burn or bury their rubbish, dump it on vacant land, slopes or public areas, or dispose of it otherwise, in five classes and zero; tracts with withheld values get a class only when it does not depend on the omitted value.
The map without a frame, with legend, scale, reference system and credit written on it: ready for papers, lectures and slides. In two versions: with the basemap (neighbours and sea) or only the mapped area, on white.
CEREJO, Lucas Nakamura. Lixo fora da coleta: onde o caminhão não passa, o lixo queima. Versão 1.0.0. [S. l.]: Zenodo, 2026. Conjunto de dados. DOI: 10.5281/zenodo.23540155. Disponível em: https://doi.org/10.5281/zenodo.23540155. Acesso em: 10 nov. 2026.
Cerejo, L. N. (2026). Lixo fora da coleta: onde o caminhão não passa, o lixo queima [Rubbish outside collection: Where the truck does not pass, rubbish burns] (Version 1.0.0) [Data set]. Zenodo. https://doi.org/10.5281/zenodo.23540155
@dataset{cerejo2026_lixo_fora_da_coleta_sp,
  author    = {Cerejo, Lucas Nakamura},
  title     = {Lixo fora da coleta: Onde o caminhão não passa, o lixo queima},
  year      = {2026},
  publisher = {Zenodo},
  version   = {1.0.0},
  doi       = {10.5281/zenodo.23540155},
  url       = {https://doi.org/10.5281/zenodo.23540155},
  language  = {portuguese},
  note      = {English title: Rubbish outside collection: Where the truck does not pass, rubbish burns. Licence CC BY 4.0}
}
Mains in town, pits in the country, rivers at the edge
Fig. 052São Paulo State (SP)EPSG:4674Source: IBGE
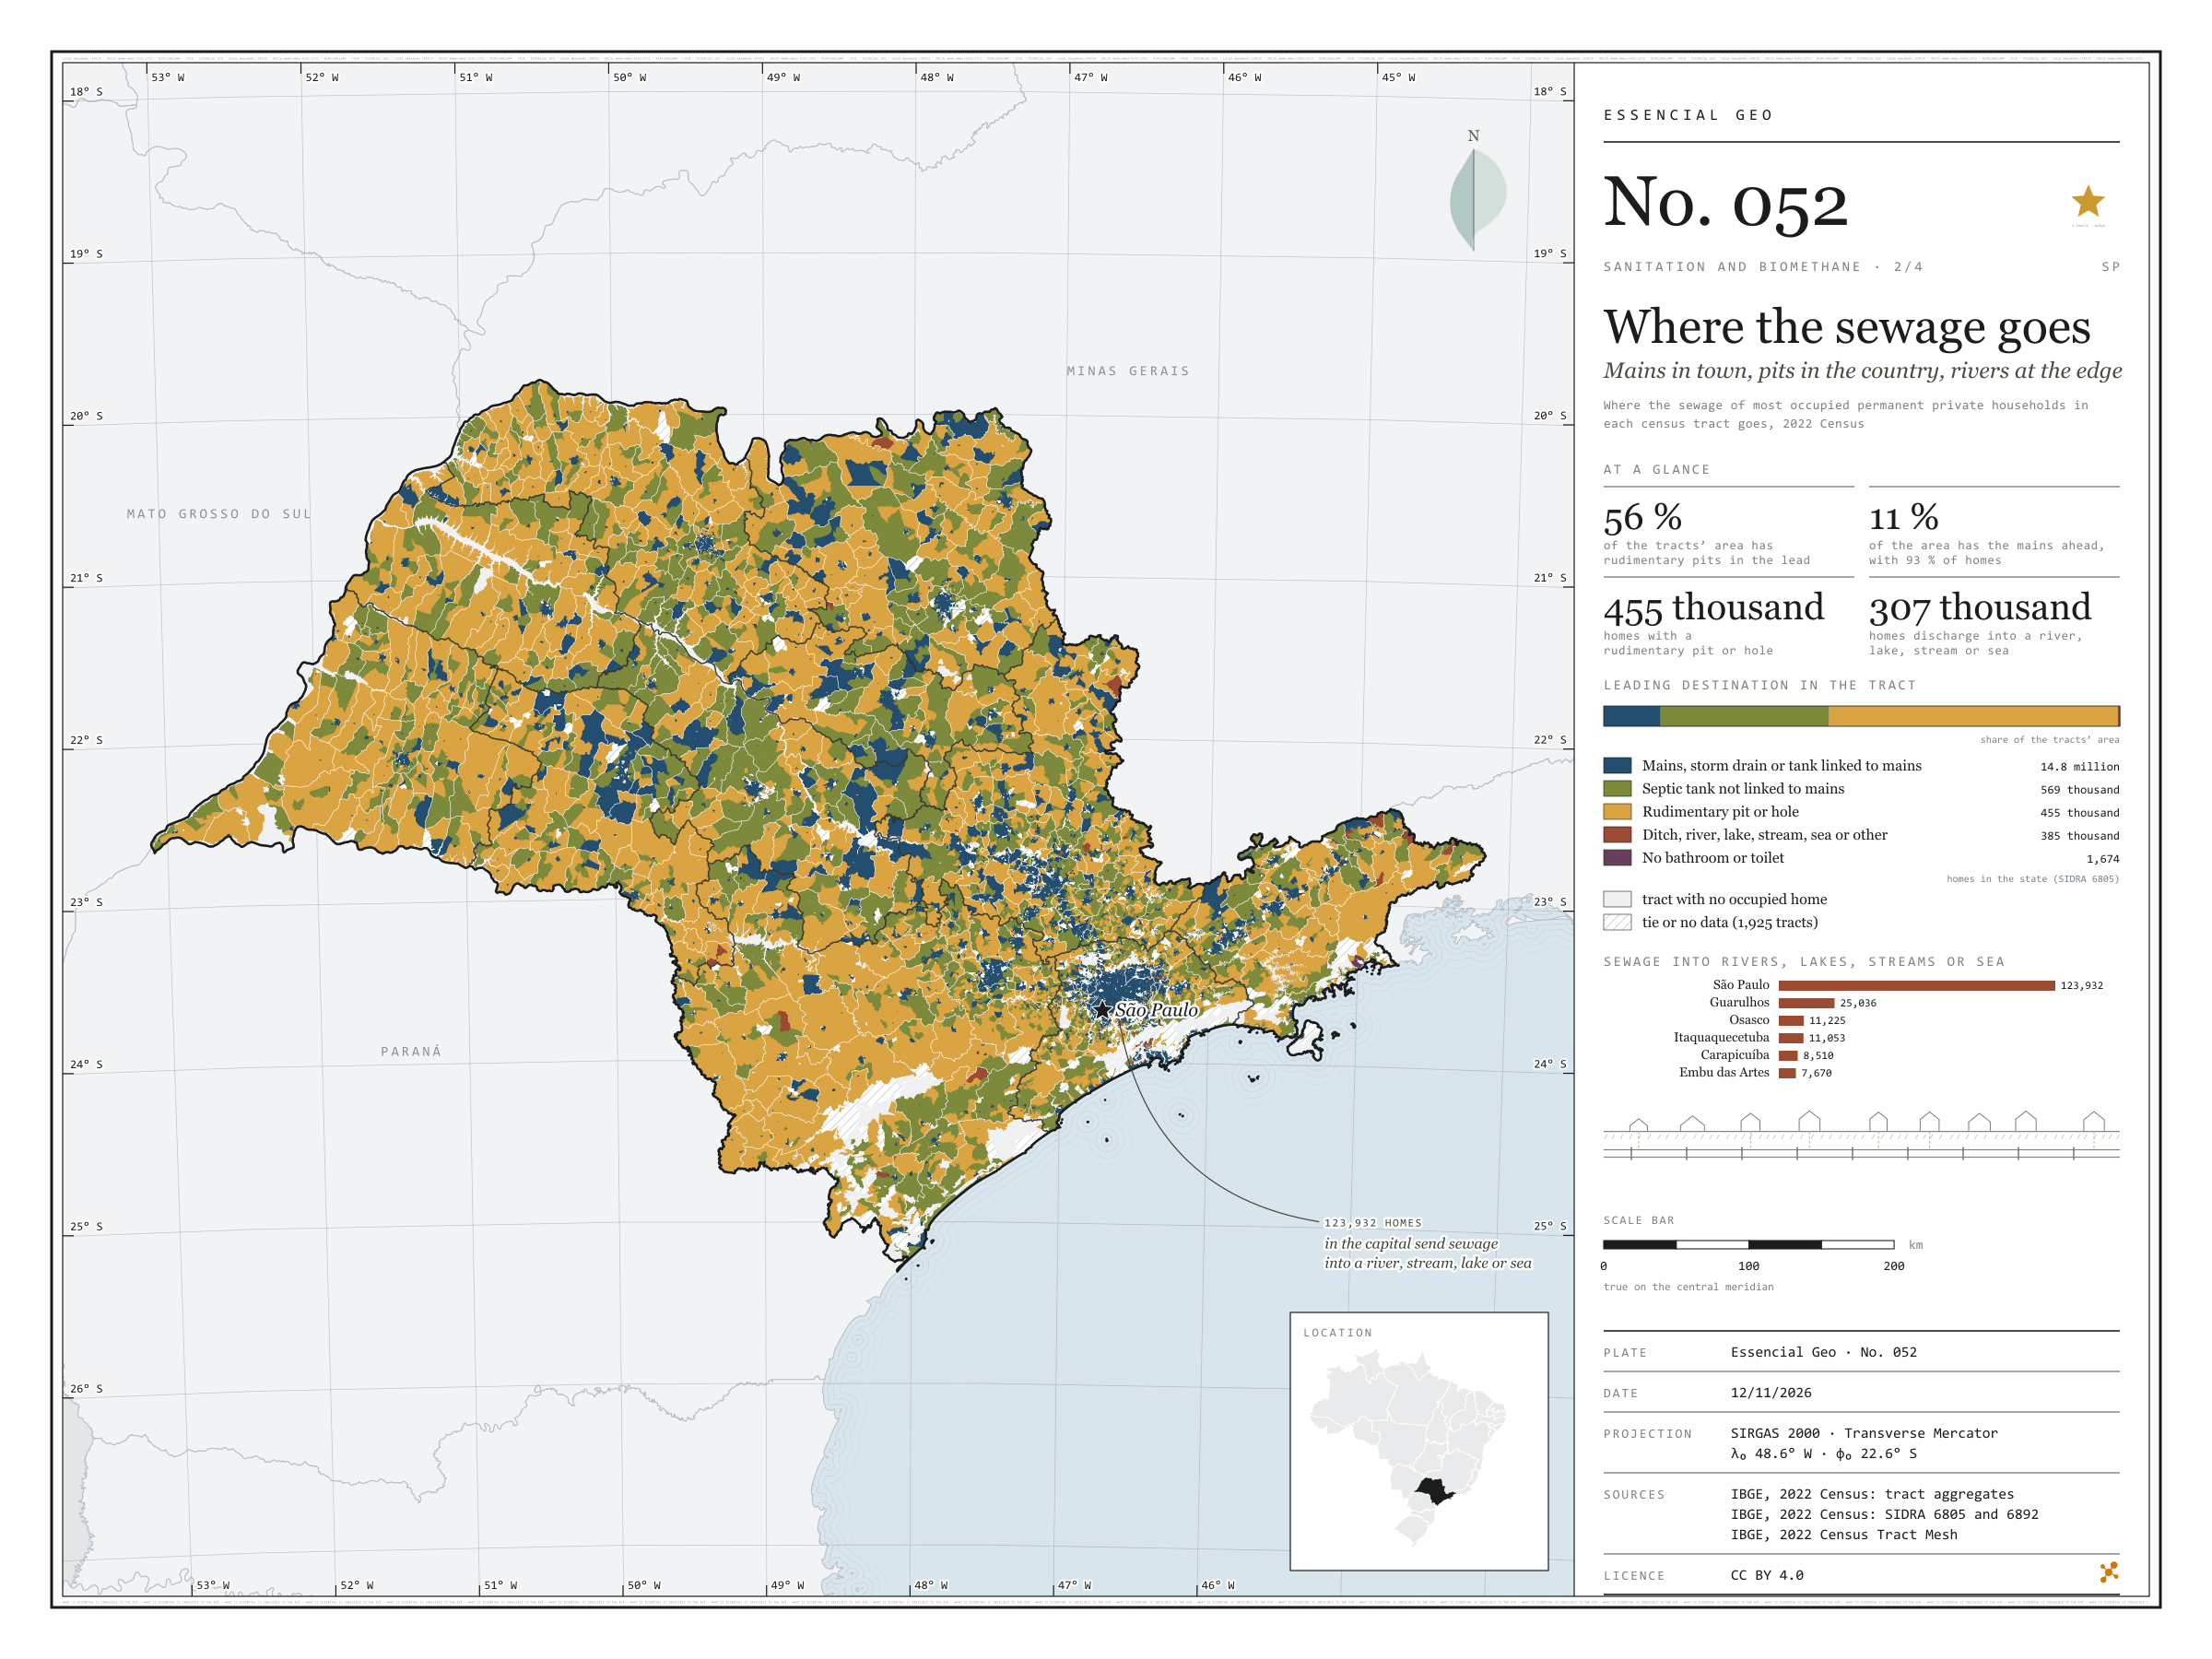
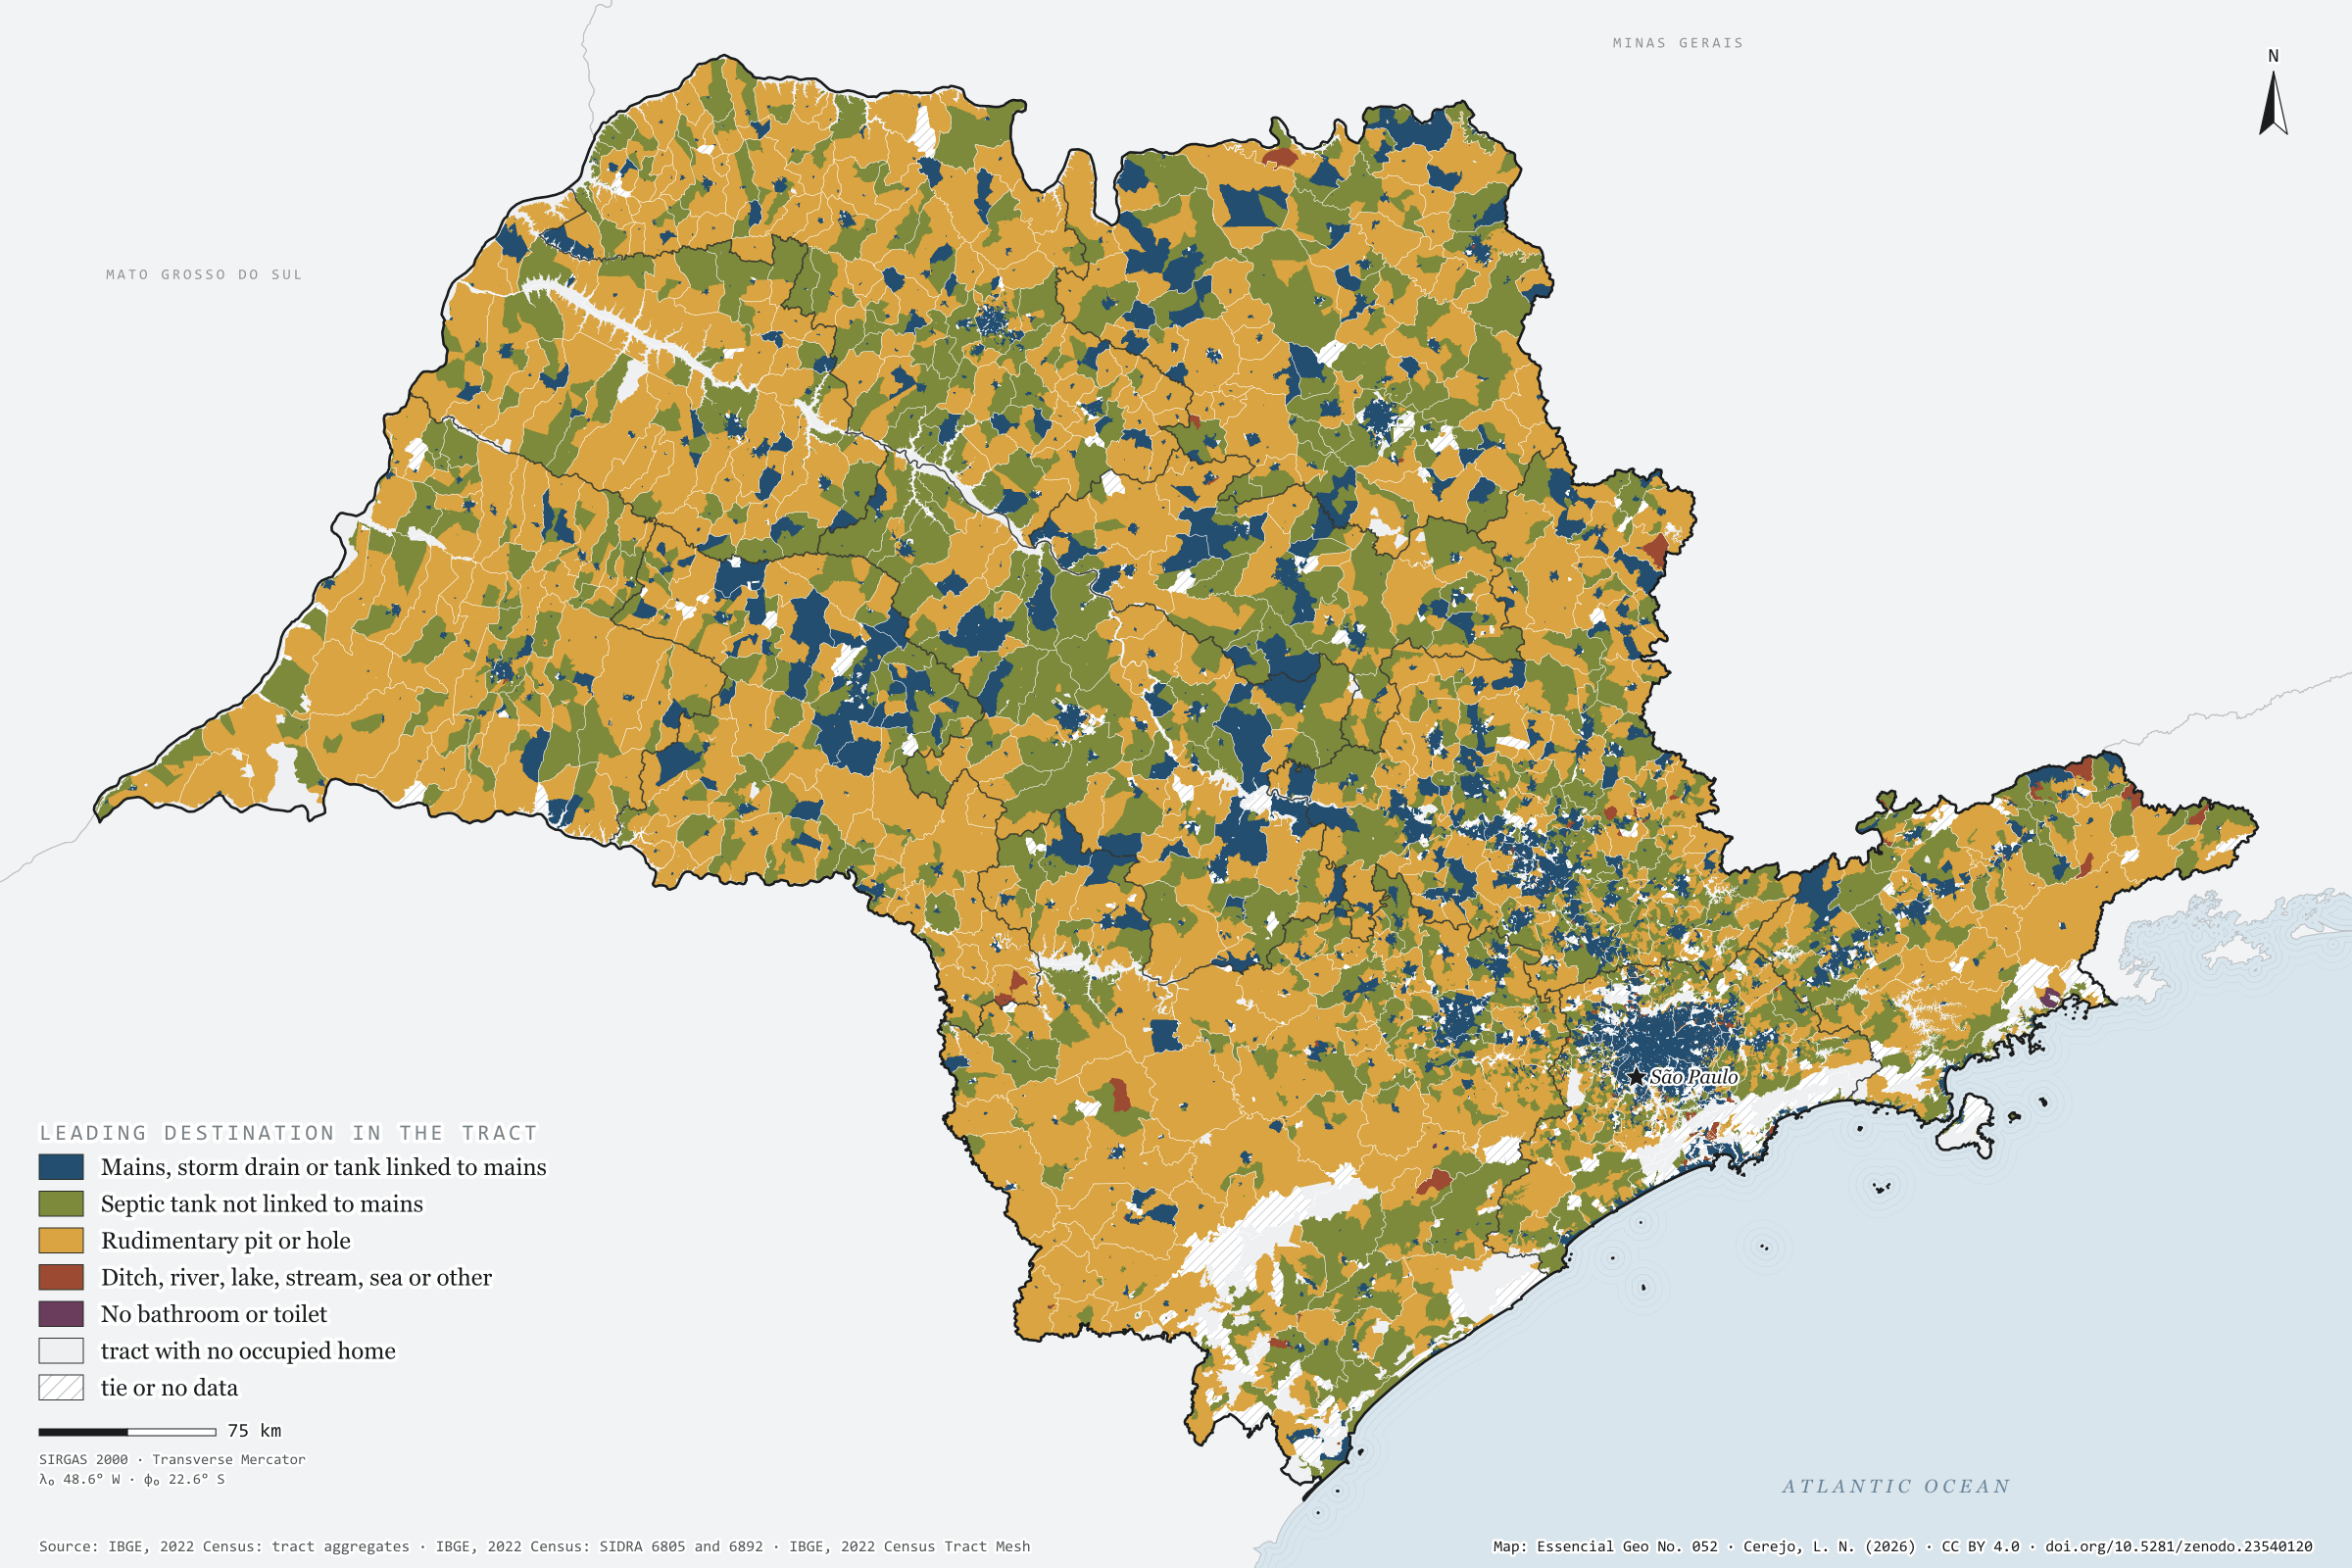
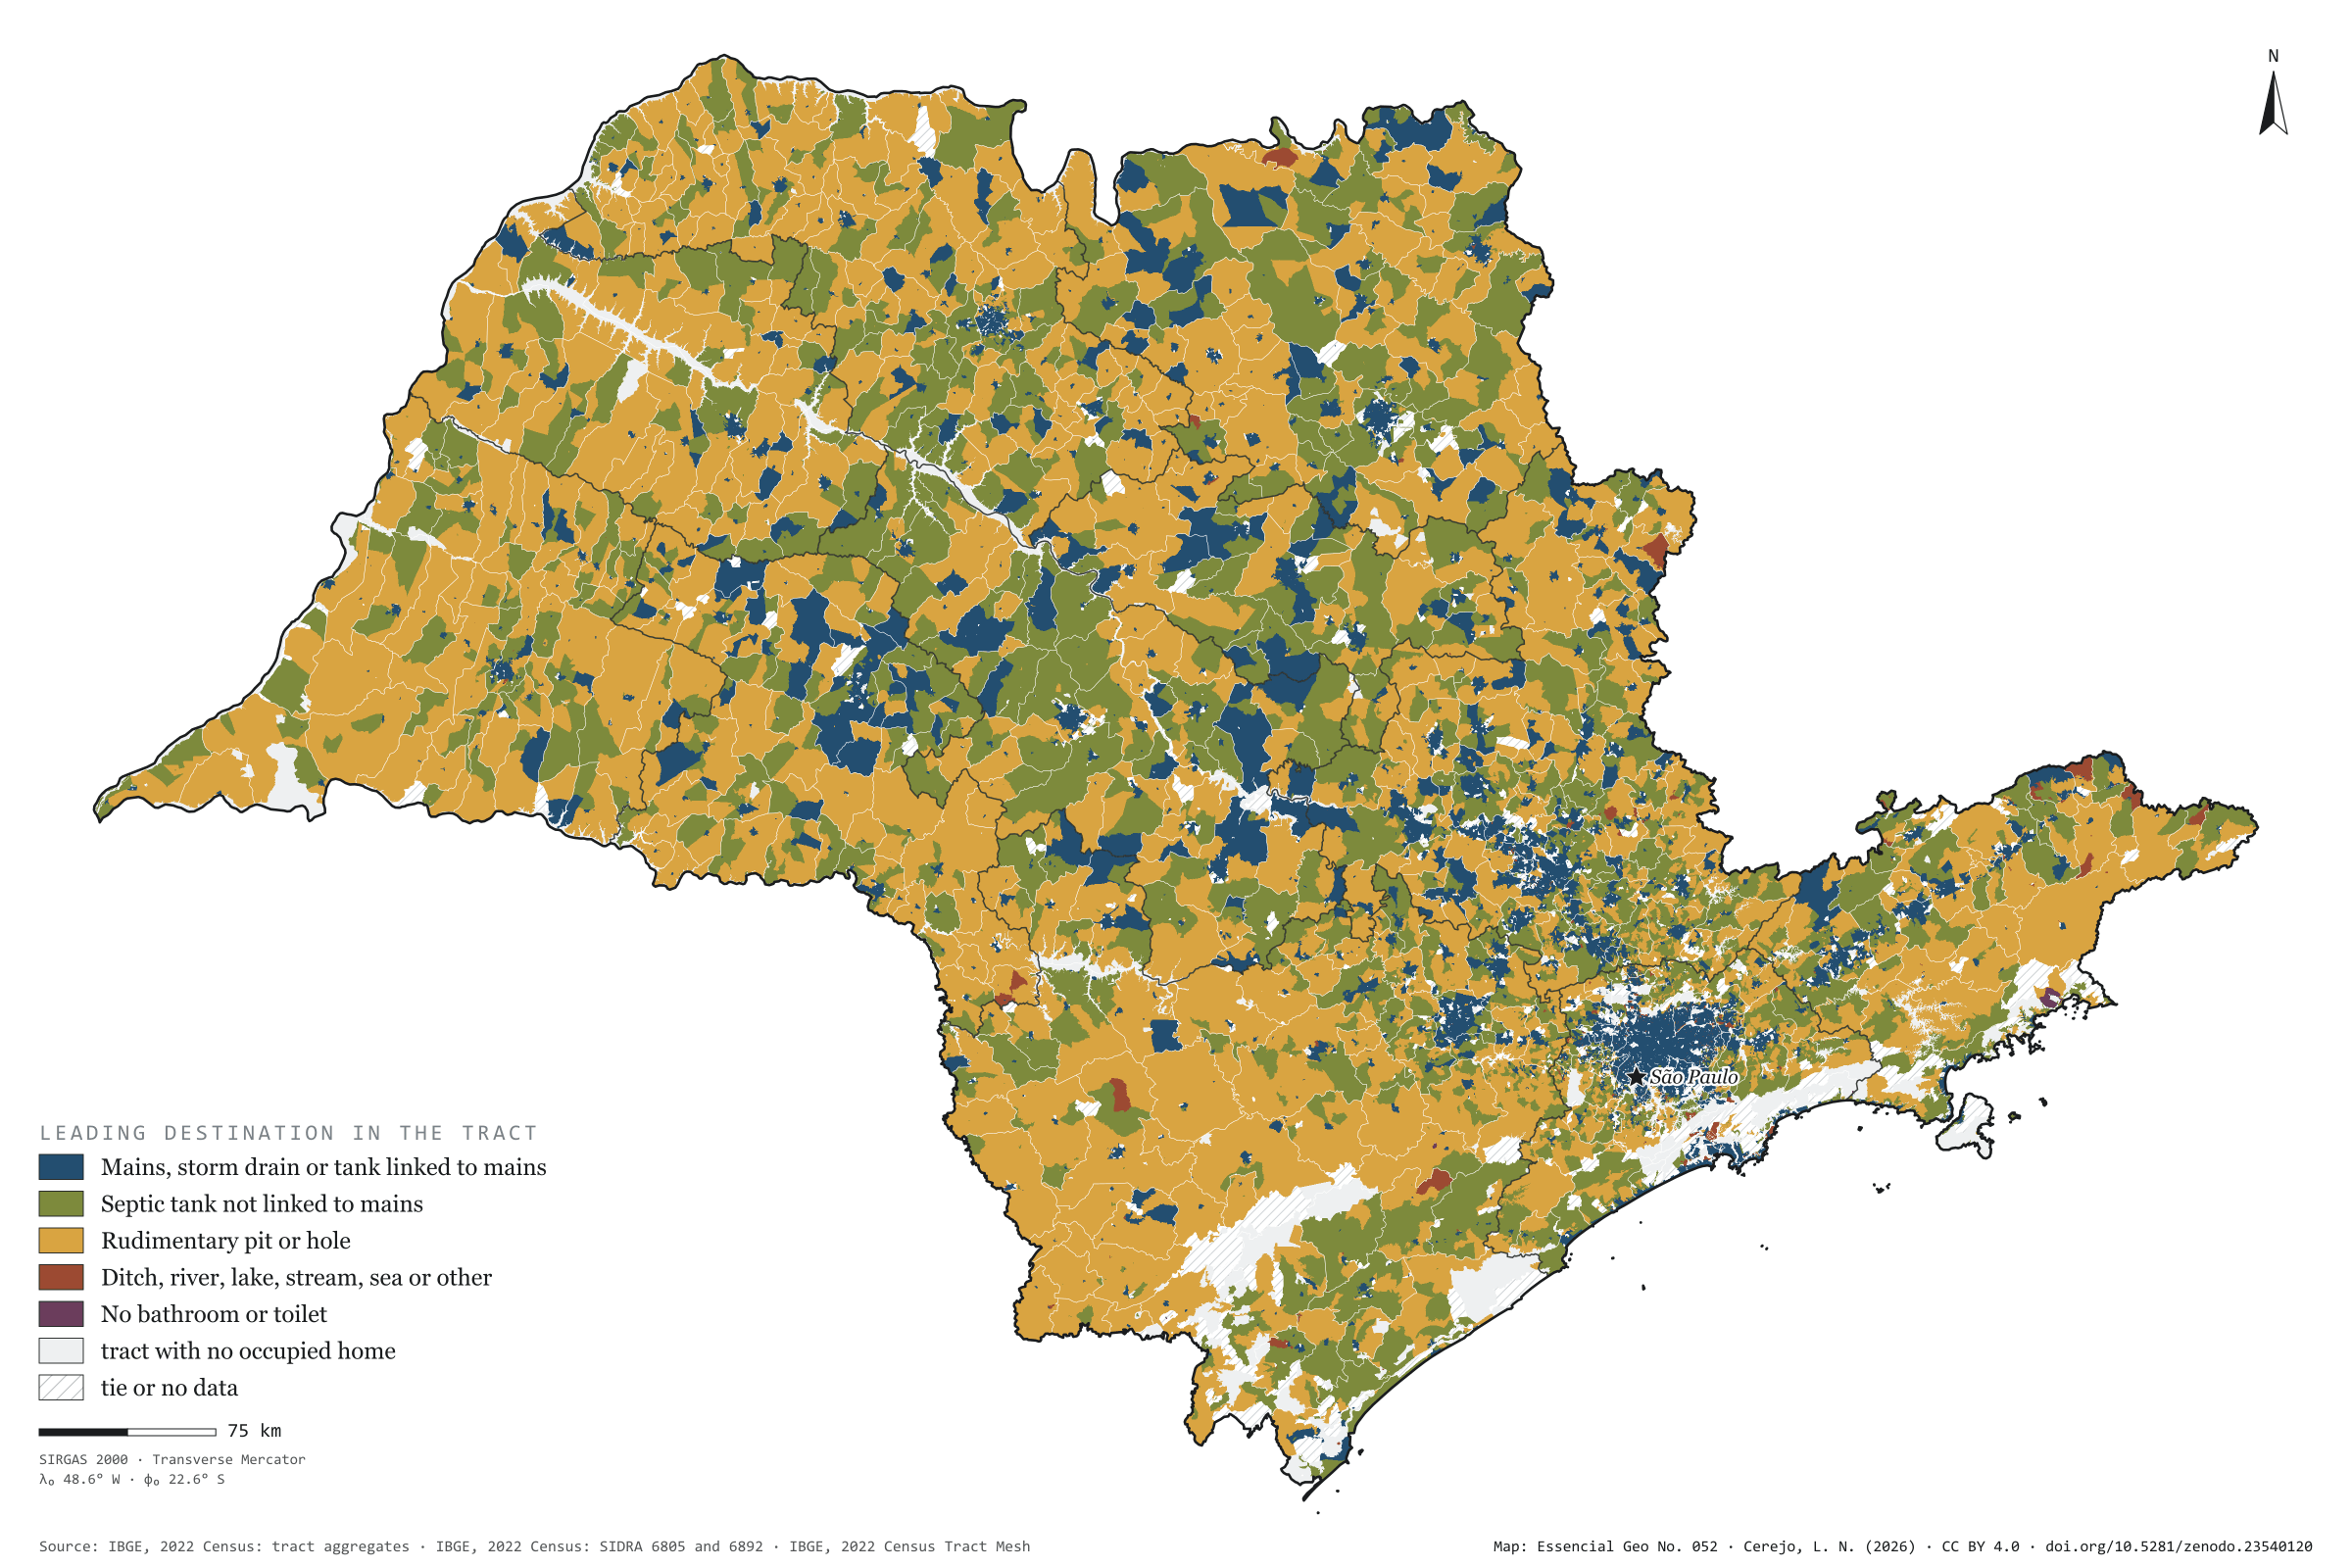
Off the mains, São Paulo’s sewage goes three ways. In 2022, 569,000 households used a septic tank, 455,000 a rudimentary pit or hole, and 385,000 discharged into a ditch, river, lake, stream, the sea or elsewhere. The map colours each census tract by where most of its households send their sewage. The mains lead in only 11% of the area, but 93% of households live there; rudimentary pits lead in 56% of the area and septic tanks in 33%, in a mosaic that covers the interior. Sewage discharged into rivers, lakes, streams or the sea is urban: of the 307,000 households doing so, 124,000 are in the capital and three quarters of the rest in the São Paulo intermediate region. Second plate of the collection “Sanitation and biomethane”.
Technical record · downloads · citation
At a glance
Households by sewage destination in the state (households)
Mains, storm drain or linked tank91.3%
Septic tank not linked3.5%
Rudimentary pit or hole2.8%
Ditch, river, lake, stream, sea or other2.4%
No bathroom or toilet0%
Tract area where rudimentary pits lead
56%
129,000 km² of 231,000 km² of tracts with a defined leader
Households in the capital discharging sewage into rivers, lakes, streams or the sea
123,932households
40% of the state’s 306,691
Layers
setorespolygon103,319 census tracts: households by sewage destination and leading destination (same GPKG as plate 051)
regioes_intermediariaspolygon11 intermediate geographic regions
Where the sewage of most occupied permanent private households in each census tract goes, in five groups; a group wins only when its minimum exceeds every other group’s maximum, counting withheld values as 1 or 2.
The map without a frame, with legend, scale, reference system and credit written on it: ready for papers, lectures and slides. In two versions: with the basemap (neighbours and sea) or only the mapped area, on white.
CEREJO, Lucas Nakamura. Para onde vai o esgoto: rede na cidade, fossa no campo, rio na beira. Versão 1.0.0. [S. l.]: Zenodo, 2026. Conjunto de dados. DOI: 10.5281/zenodo.23540120. Disponível em: https://doi.org/10.5281/zenodo.23540120. Acesso em: 10 nov. 2026.
Cerejo, L. N. (2026). Para onde vai o esgoto: rede na cidade, fossa no campo, rio na beira [Where the sewage goes: Mains in town, pits in the country, rivers at the edge] (Version 1.0.0) [Data set]. Zenodo. https://doi.org/10.5281/zenodo.23540120
@dataset{cerejo2026_destino_do_esgoto_sp,
  author    = {Cerejo, Lucas Nakamura},
  title     = {Para onde vai o esgoto: Rede na cidade, fossa no campo, rio na beira},
  year      = {2026},
  publisher = {Zenodo},
  version   = {1.0.0},
  doi       = {10.5281/zenodo.23540120},
  url       = {https://doi.org/10.5281/zenodo.23540120},
  language  = {portuguese},
  note      = {English title: Where the sewage goes: Mains in town, pits in the country, rivers at the edge. Licence CC BY 4.0}
}
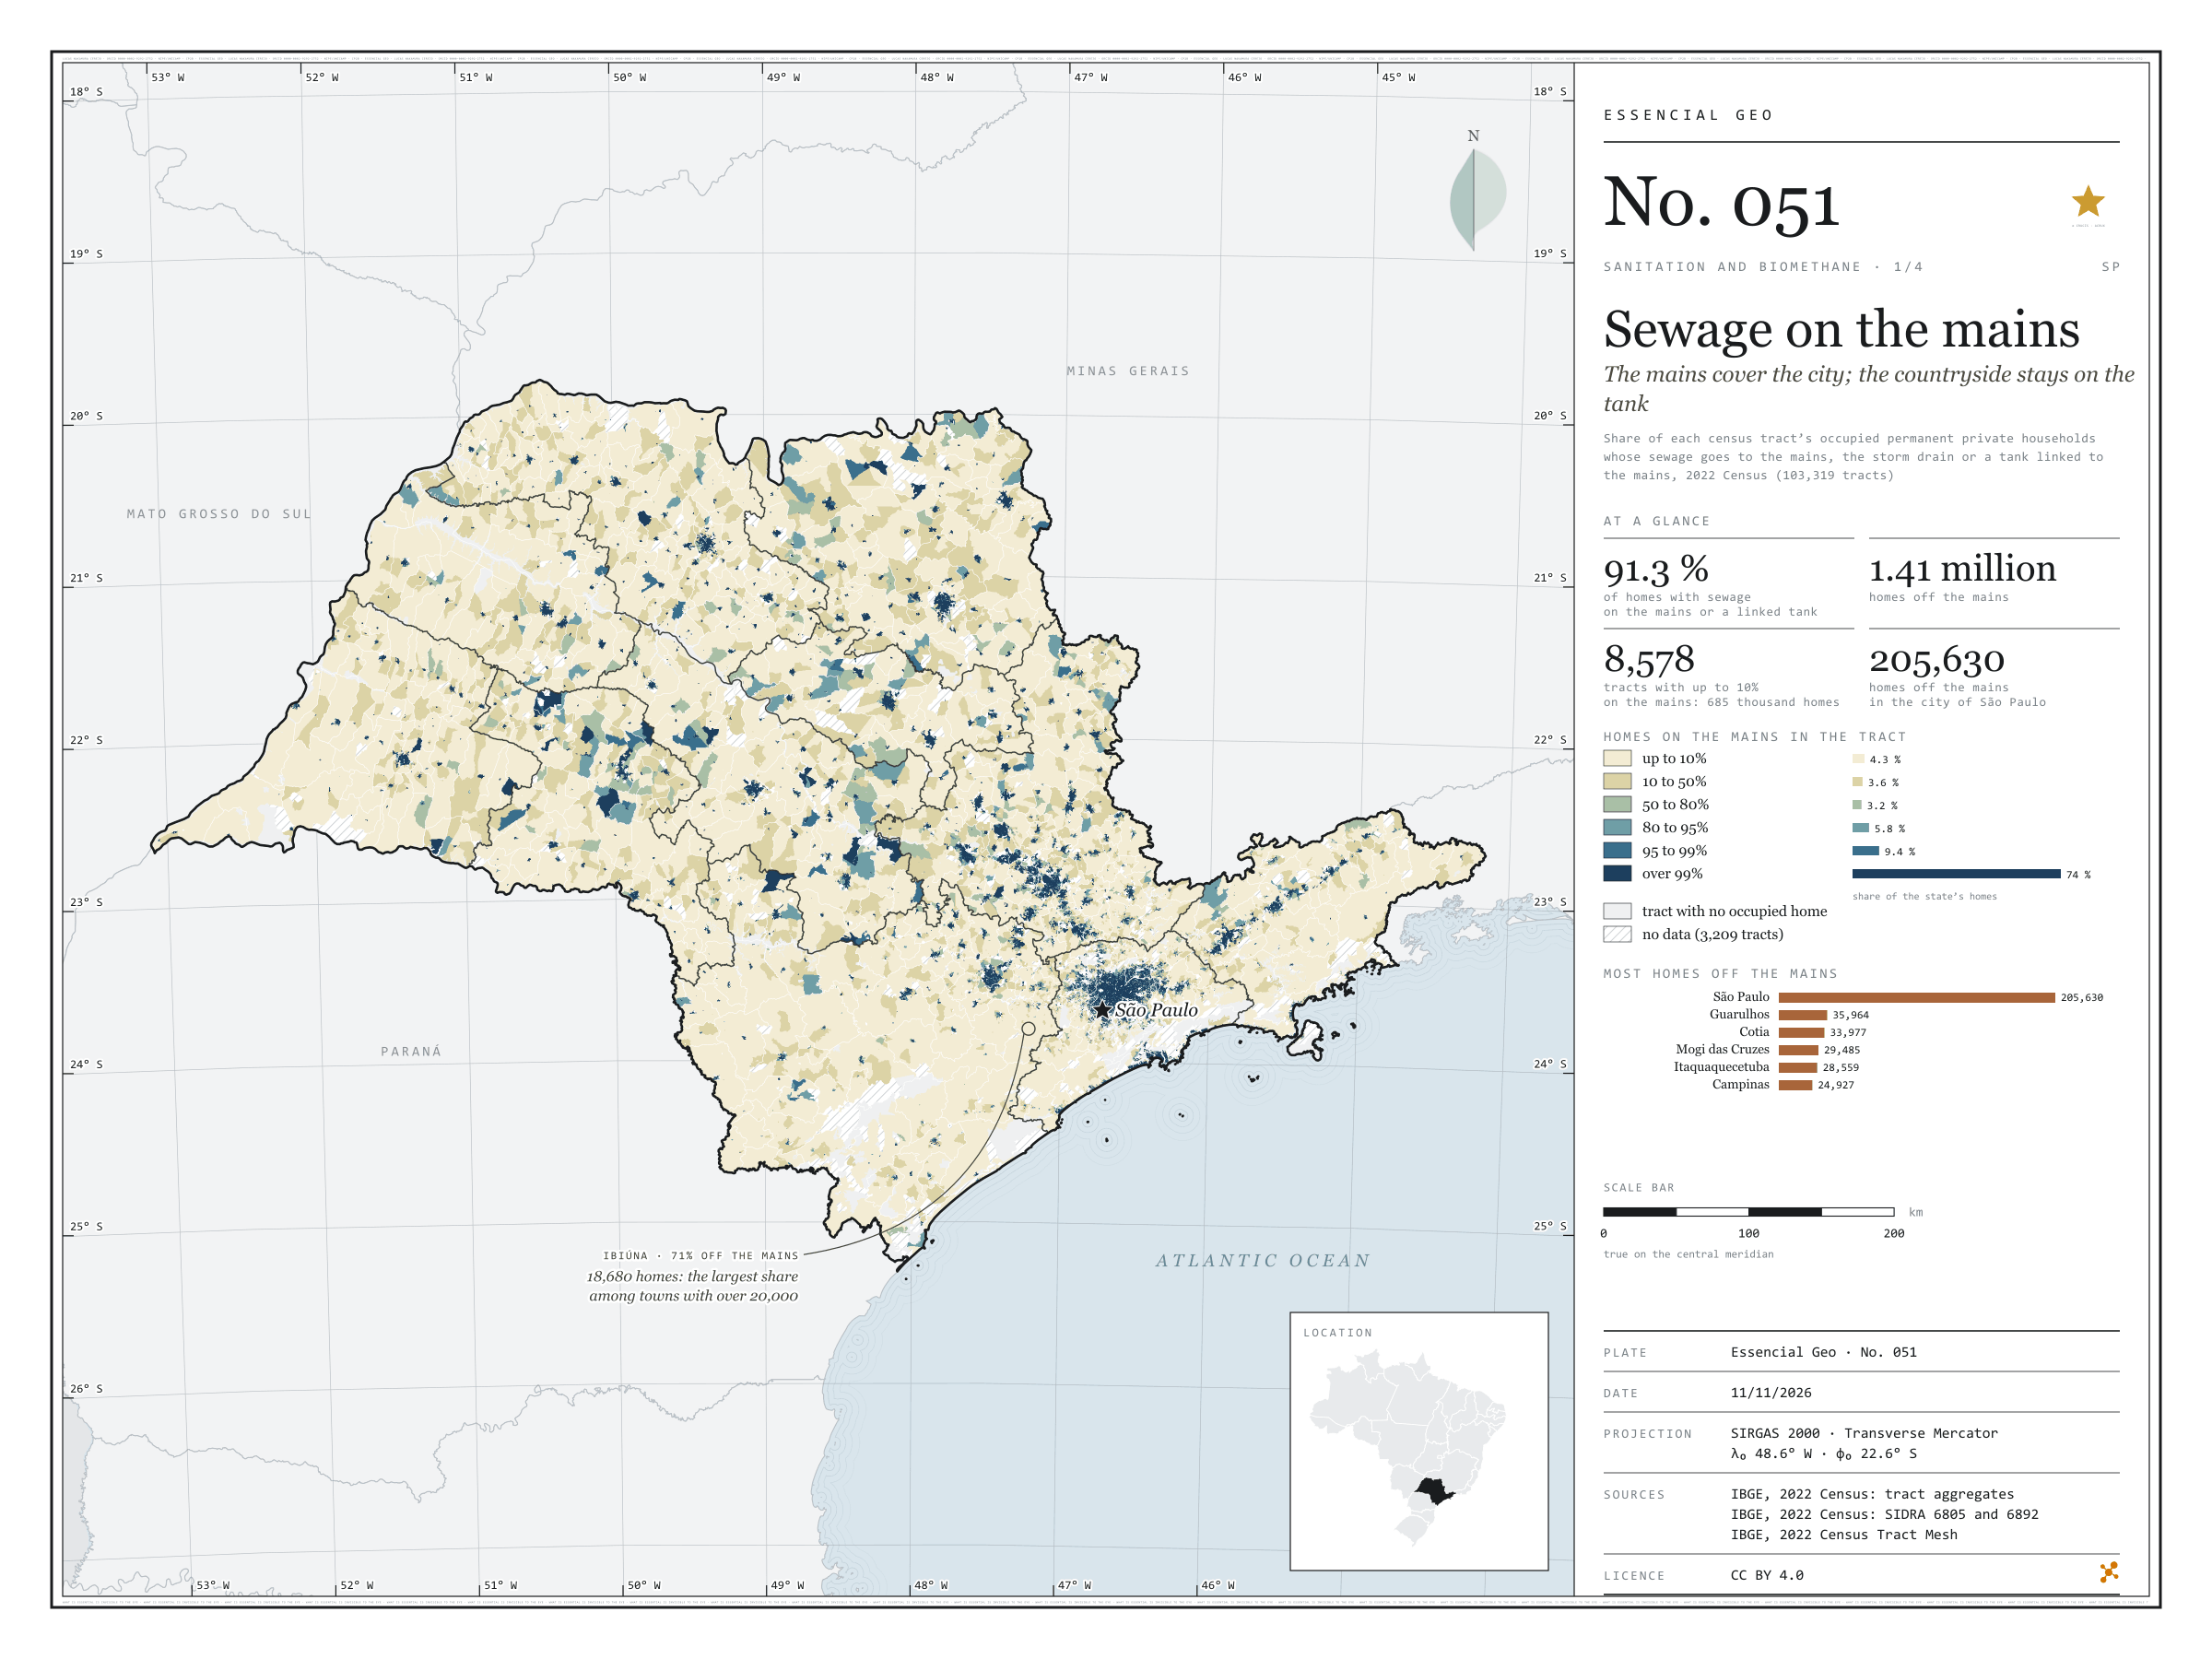
The mains cover the city; the countryside stays on the tank
Fig. 051São Paulo State (SP)EPSG:4674Source: IBGE
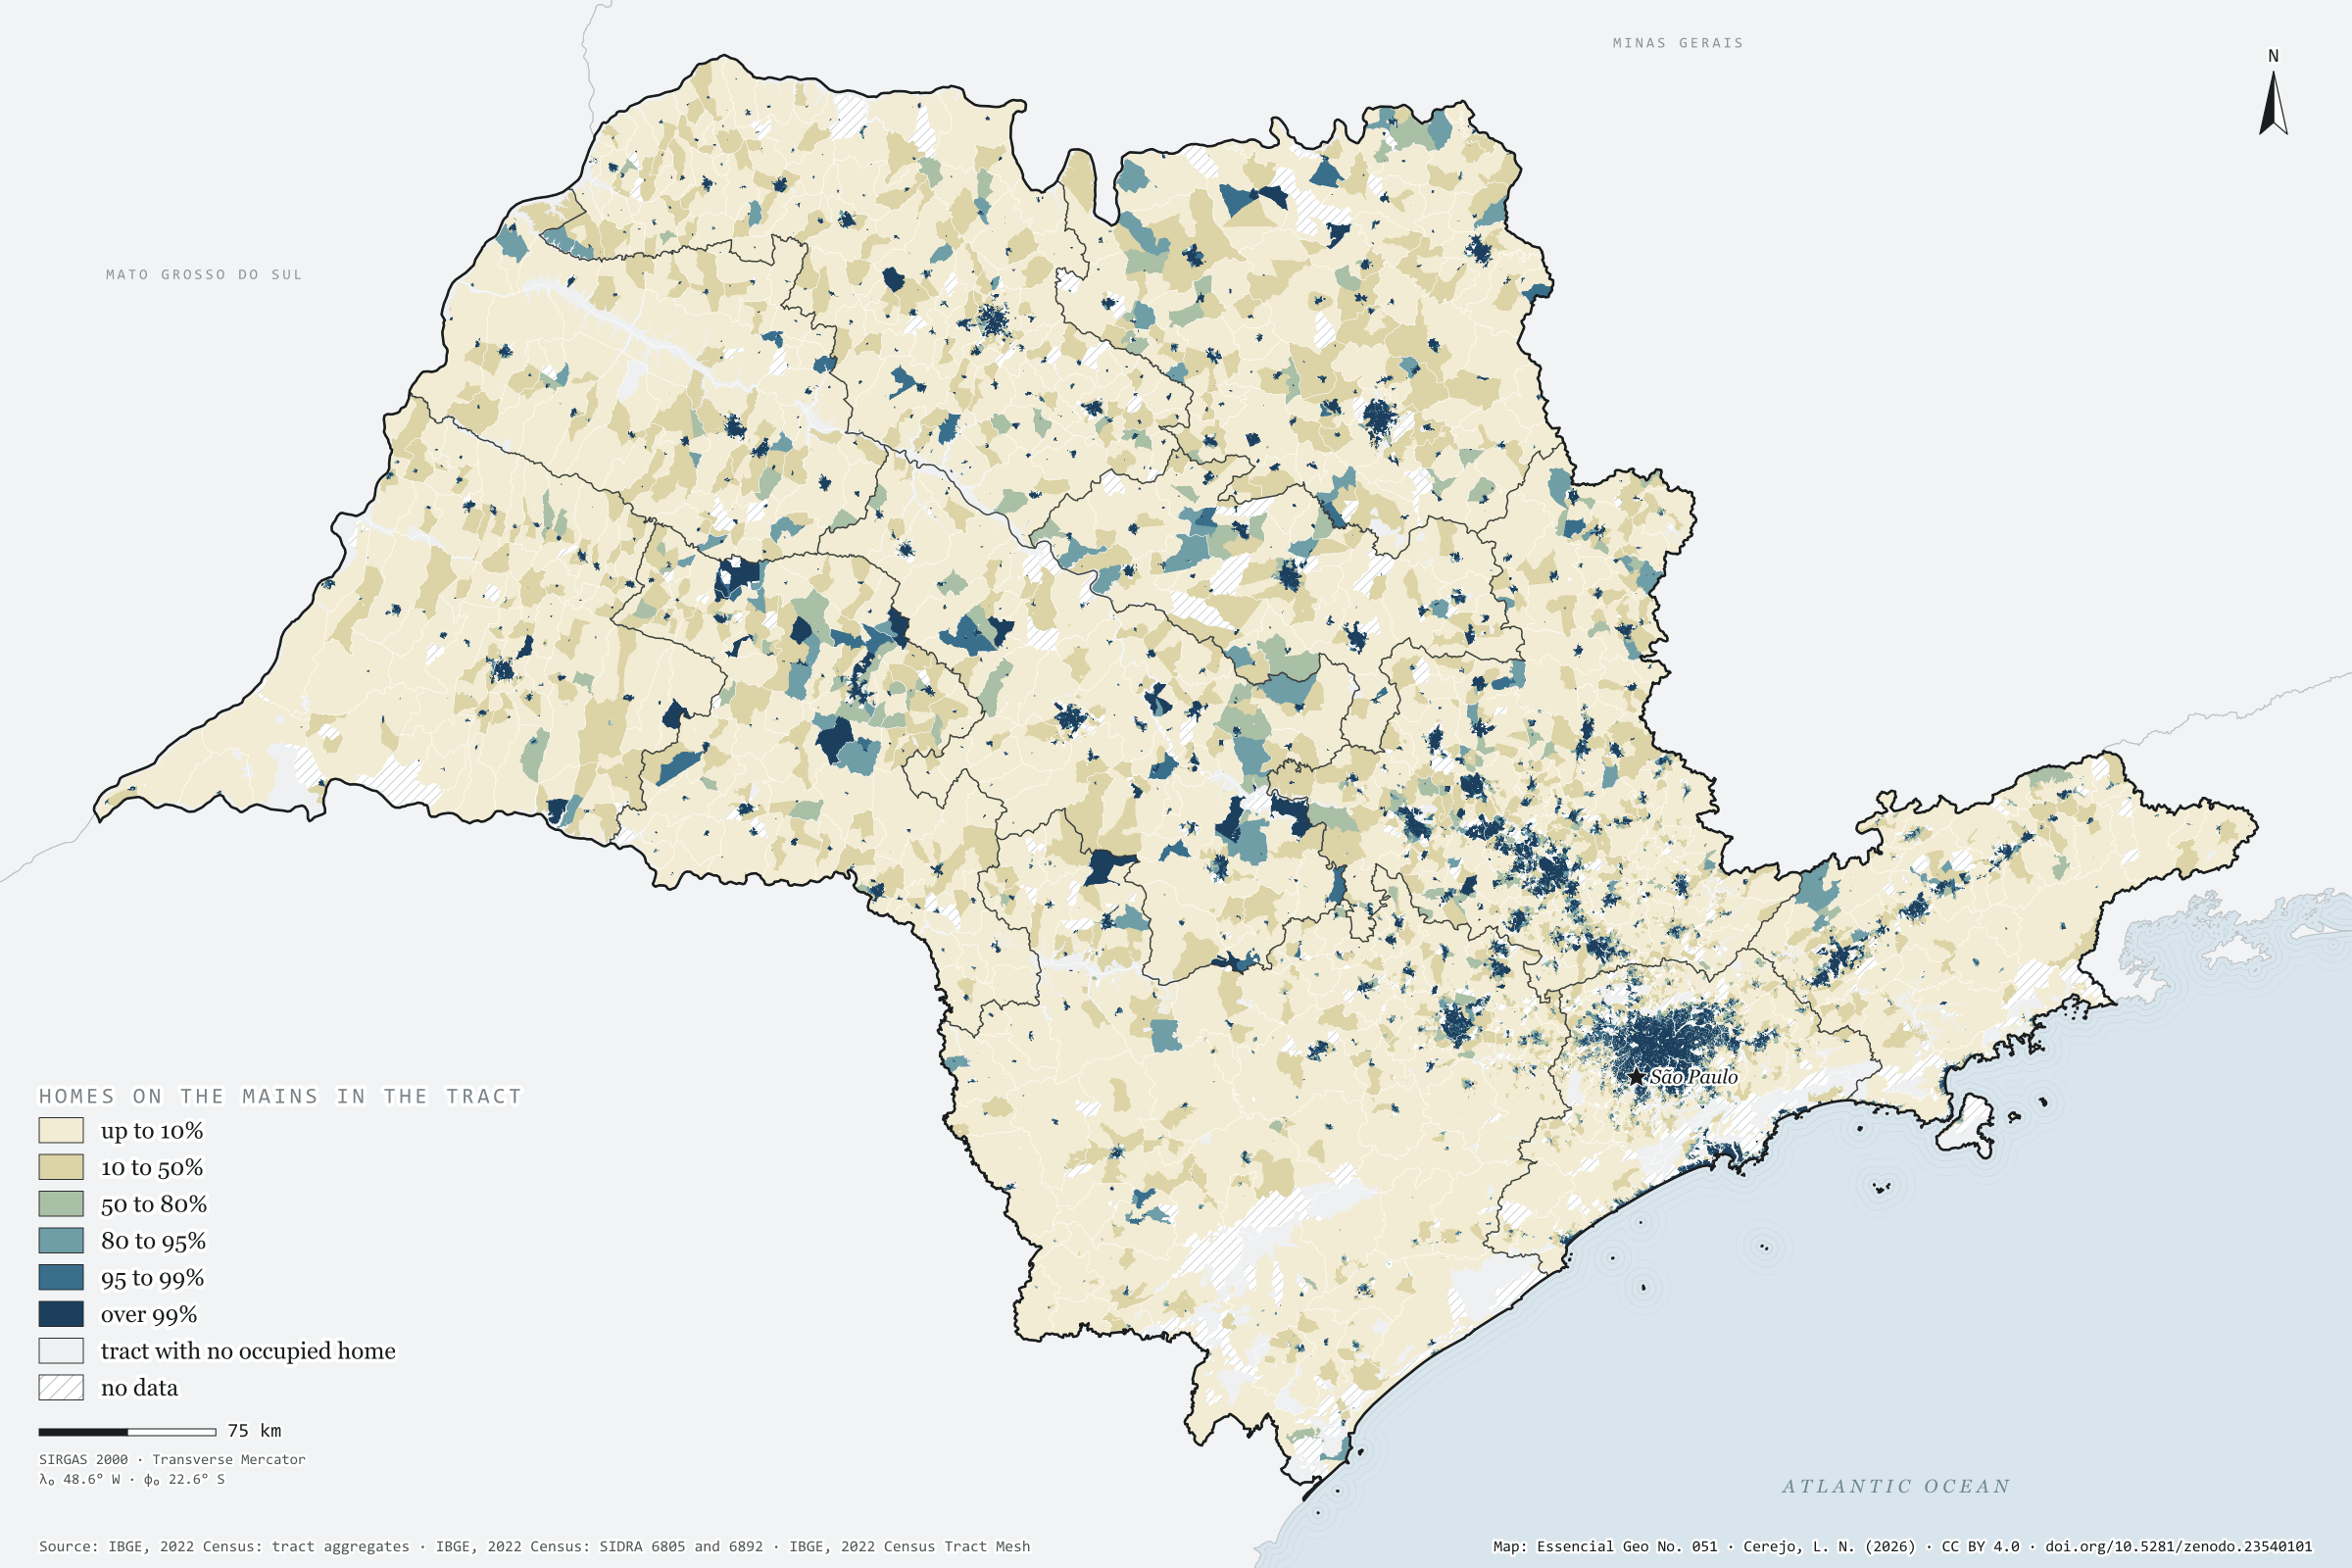
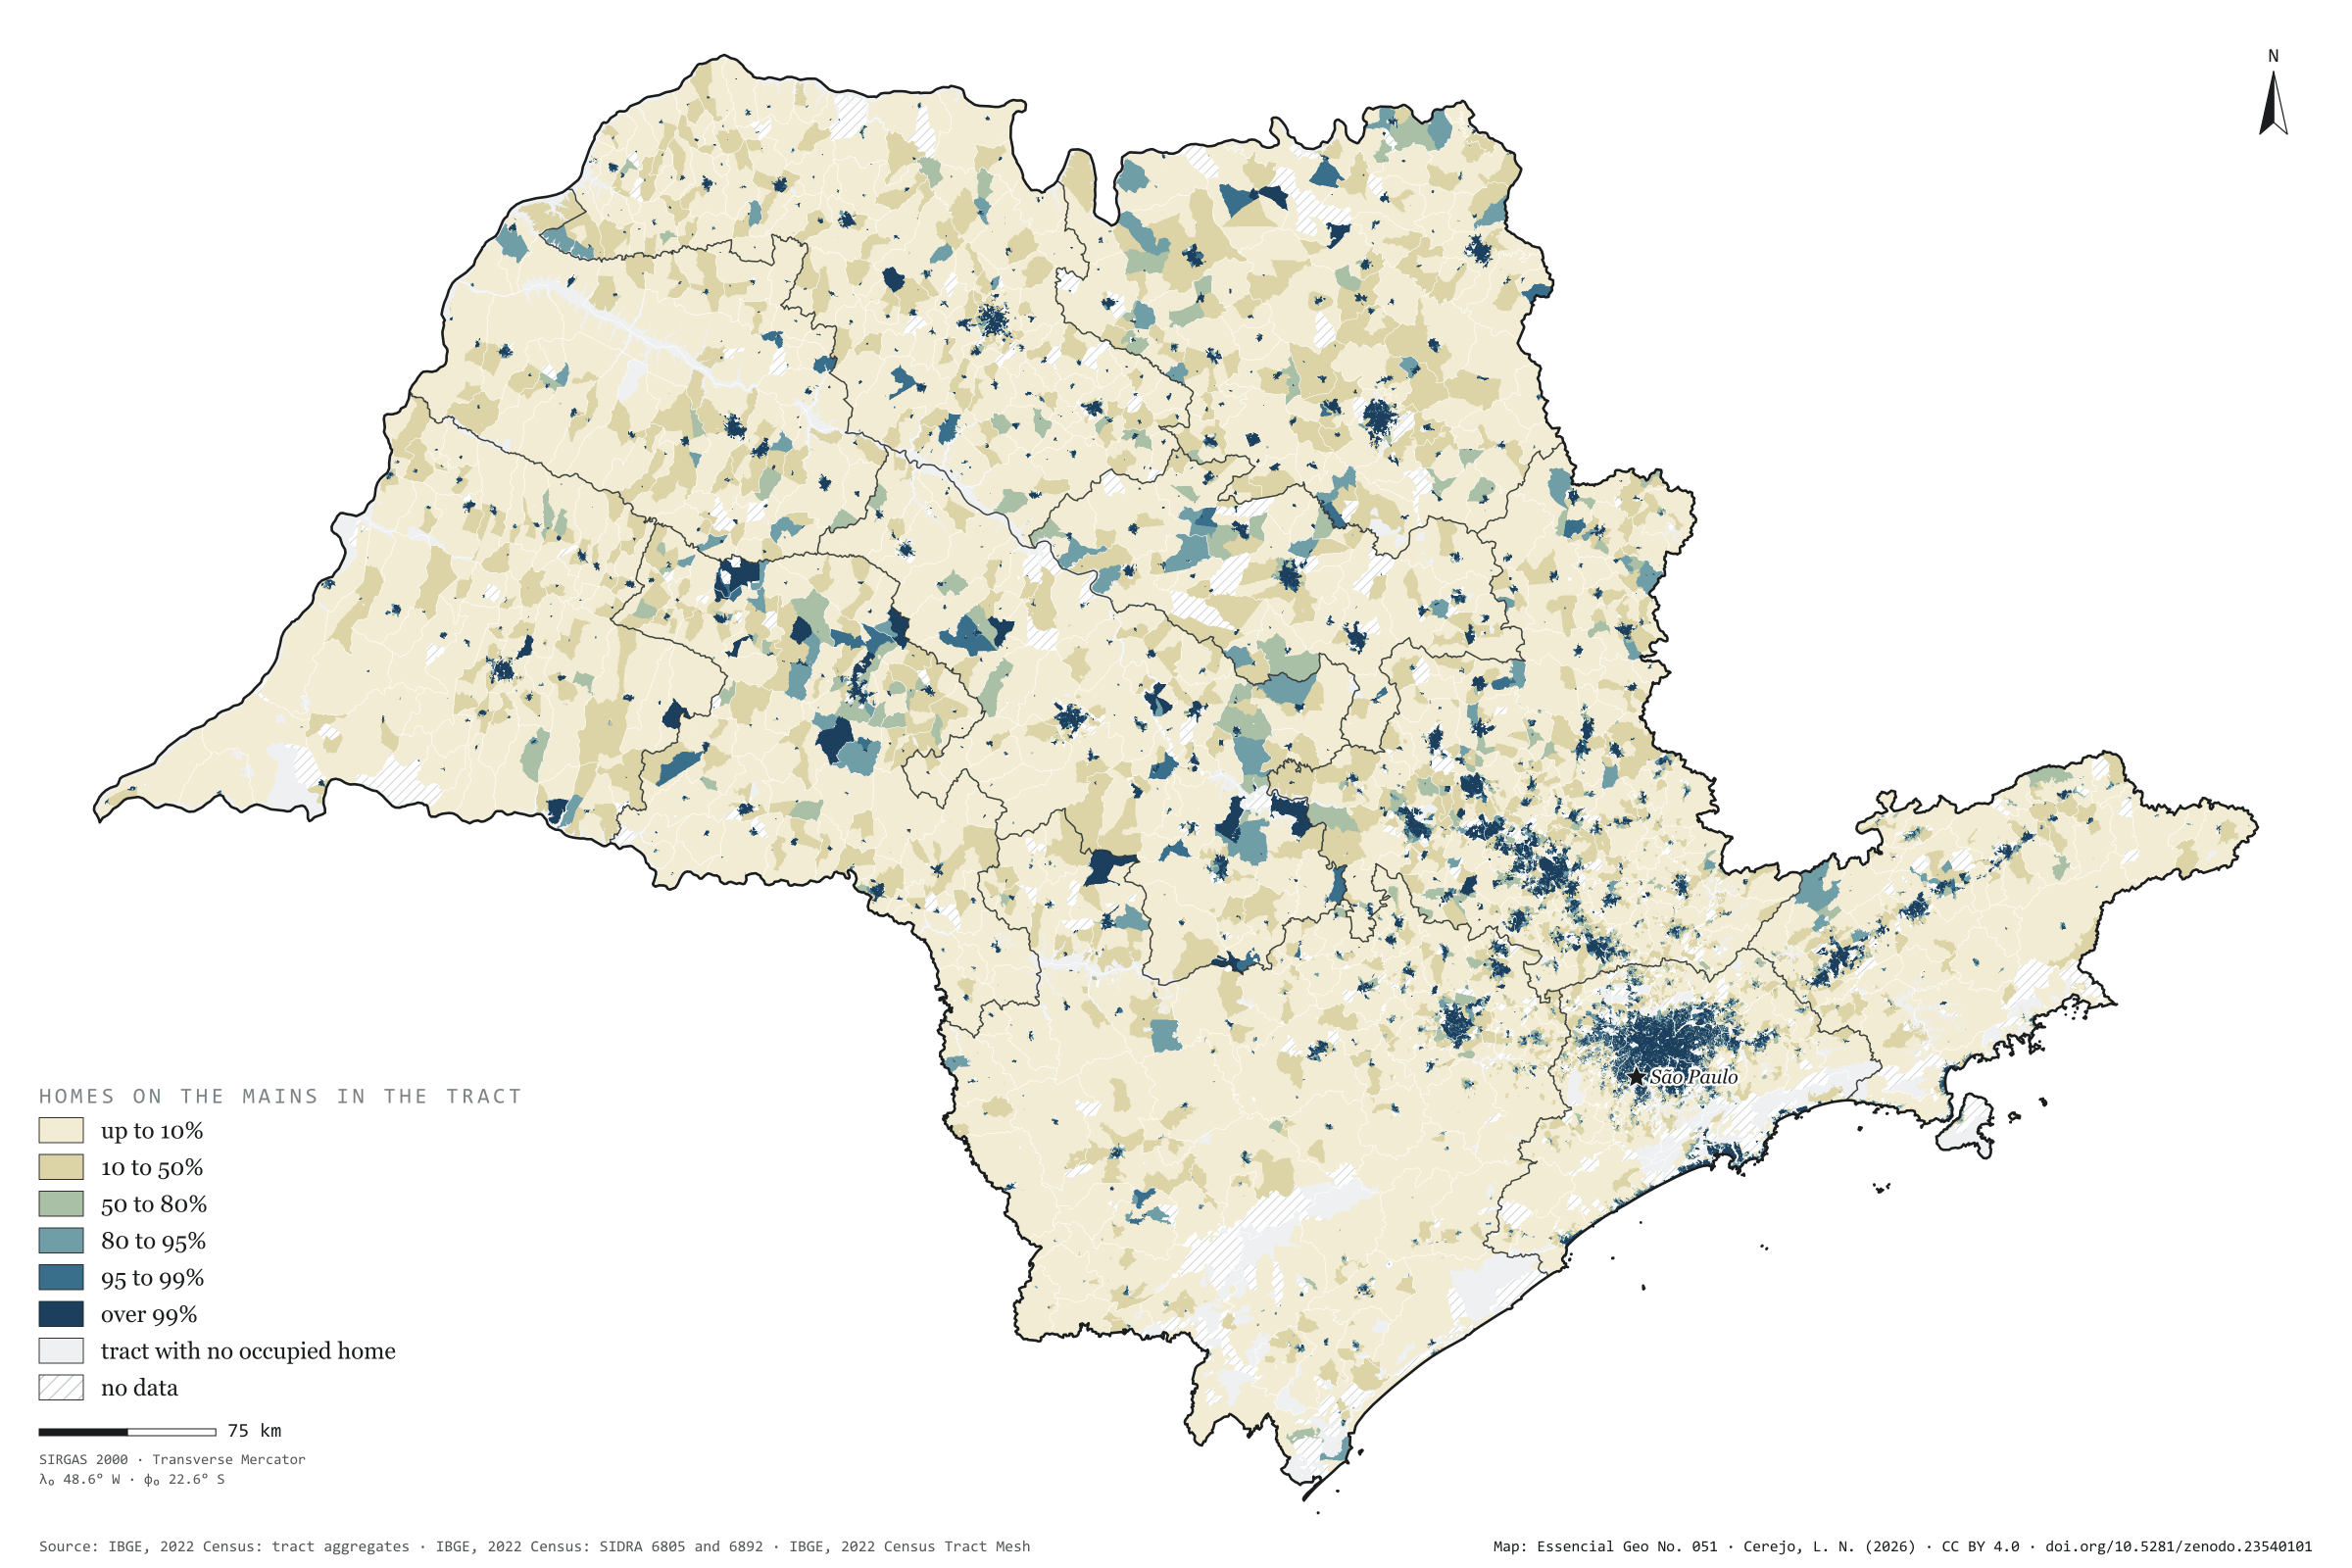
In 2022, 91.3% of households in São Paulo state had their sewage connected to the mains, to the storm drain or to a septic tank linked to the mains: 14.8 million out of 16.2 million. 1.41 million were missing. Painted tract by tract, the map shows the mains as an urban thing: three households in four live in tracts where over 99% are connected, but those tracts are small, and the cream of the rural tracts, where almost no one is on the mains, covers most of the state. The city of São Paulo has 205,630 households off the mains, the largest absolute number; among towns with more than 20,000 households, Ibiúna has the largest share off the mains (71%). First plate of the collection “Sanitation and biomethane”.
Technical record · downloads · citation
At a glance
Households, by the share of their tract connected to the sewer mains (households)
up to 10%4.3%
10 to 50%3.6%
50 to 80%3.2%
80 to 95%5.8%
95 to 99%9.4%
over 99%73.7%
Households with sewage on the mains or a tank linked to the mains
91%
14,813,509 of 16,224,248 households (SIDRA 6805)
Households off the mains in the city of São Paulo
205,630households
4.8% of the capital’s households
Layers
setorespolygon103,319 census tracts: households by sewage and rubbish destination, mains-connection class, leading destination and uncollected-rubbish class
regioes_intermediariaspolygon11 intermediate geographic regions
Share of each census tract’s occupied permanent private households whose sewage goes to the mains, the storm drain or a tank linked to the mains, in six classes; tracts with withheld values get a class only when it does not depend on the omitted value.
The map without a frame, with legend, scale, reference system and credit written on it: ready for papers, lectures and slides. In two versions: with the basemap (neighbours and sea) or only the mapped area, on white.
CEREJO, Lucas Nakamura. Esgoto na rede: a rede cobre a cidade; o campo fica na fossa. Versão 1.0.0. [S. l.]: Zenodo, 2026. Conjunto de dados. DOI: 10.5281/zenodo.23540101. Disponível em: https://doi.org/10.5281/zenodo.23540101. Acesso em: 10 nov. 2026.
Cerejo, L. N. (2026). Esgoto na rede: a rede cobre a cidade; o campo fica na fossa [Sewage on the mains: The mains cover the city; the countryside stays on the tank] (Version 1.0.0) [Data set]. Zenodo. https://doi.org/10.5281/zenodo.23540101
@dataset{cerejo2026_esgoto_na_rede_sp,
  author    = {Cerejo, Lucas Nakamura},
  title     = {Esgoto na rede: A rede cobre a cidade; o campo fica na fossa},
  year      = {2026},
  publisher = {Zenodo},
  version   = {1.0.0},
  doi       = {10.5281/zenodo.23540101},
  url       = {https://doi.org/10.5281/zenodo.23540101},
  language  = {portuguese},
  note      = {English title: Sewage on the mains: The mains cover the city; the countryside stays on the tank. Licence CC BY 4.0}
}
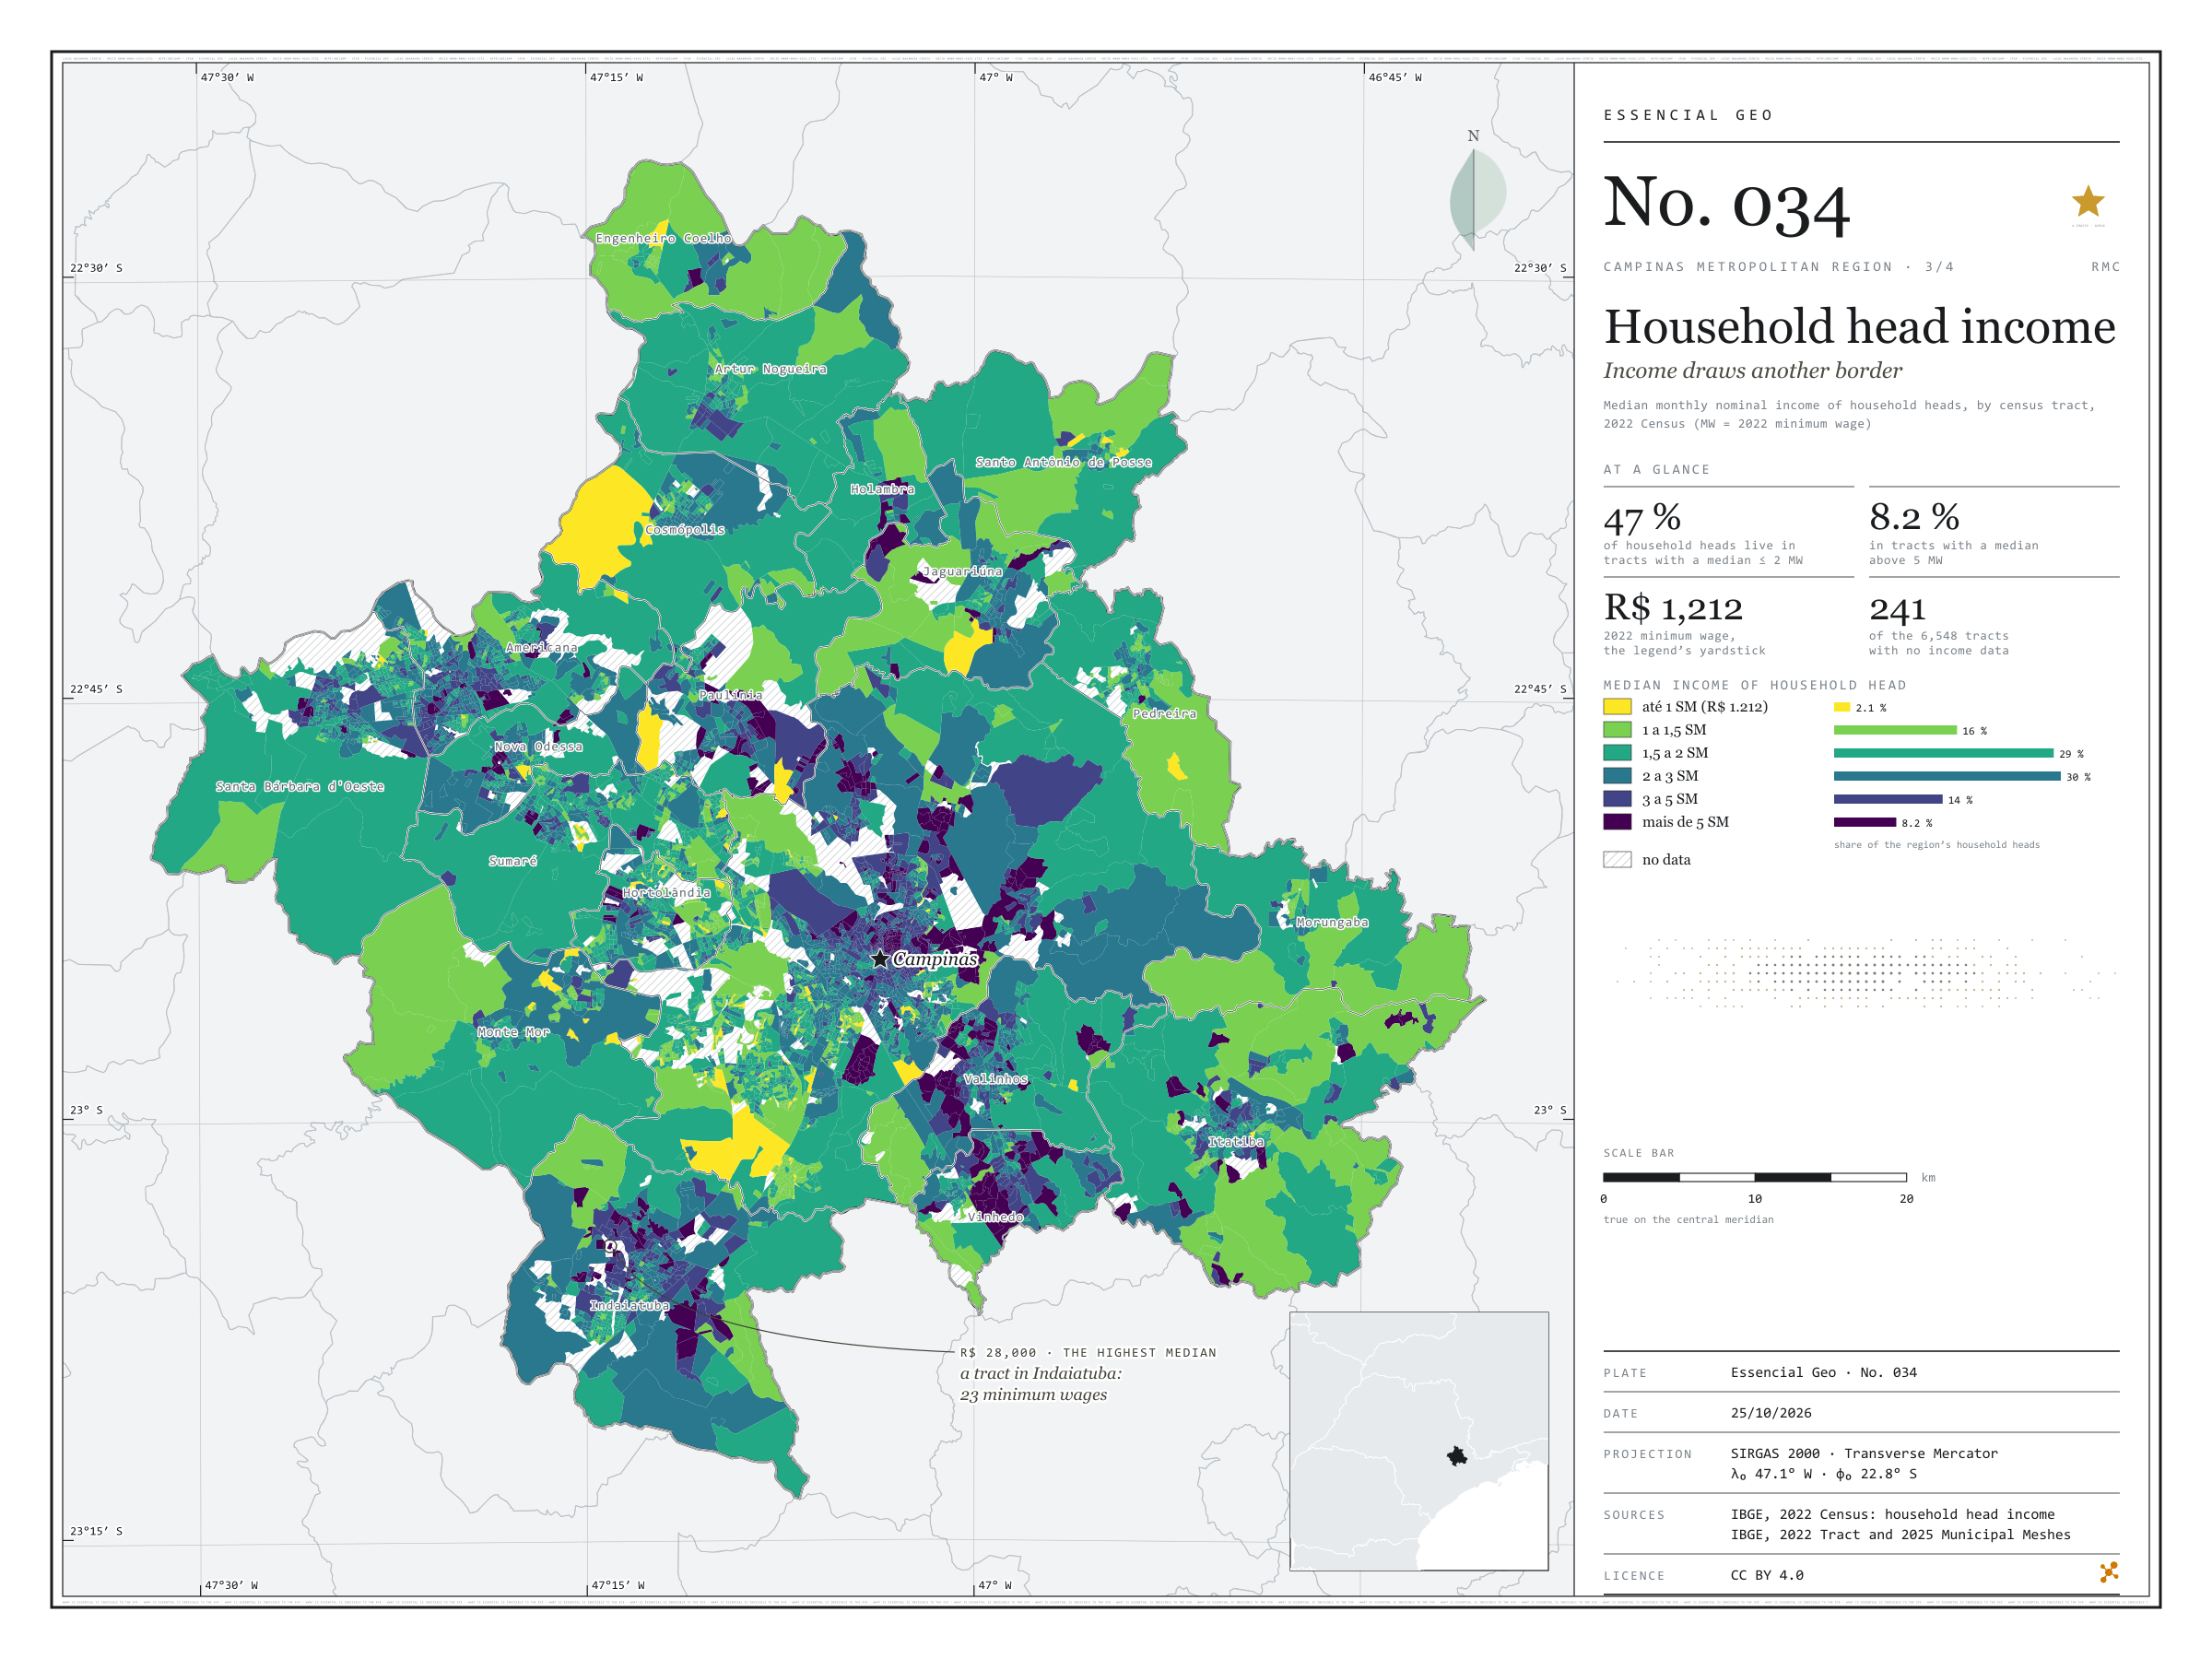
Fig. 034Campinas Metropolitan Region (SP)EPSG:4674Source: IBGE
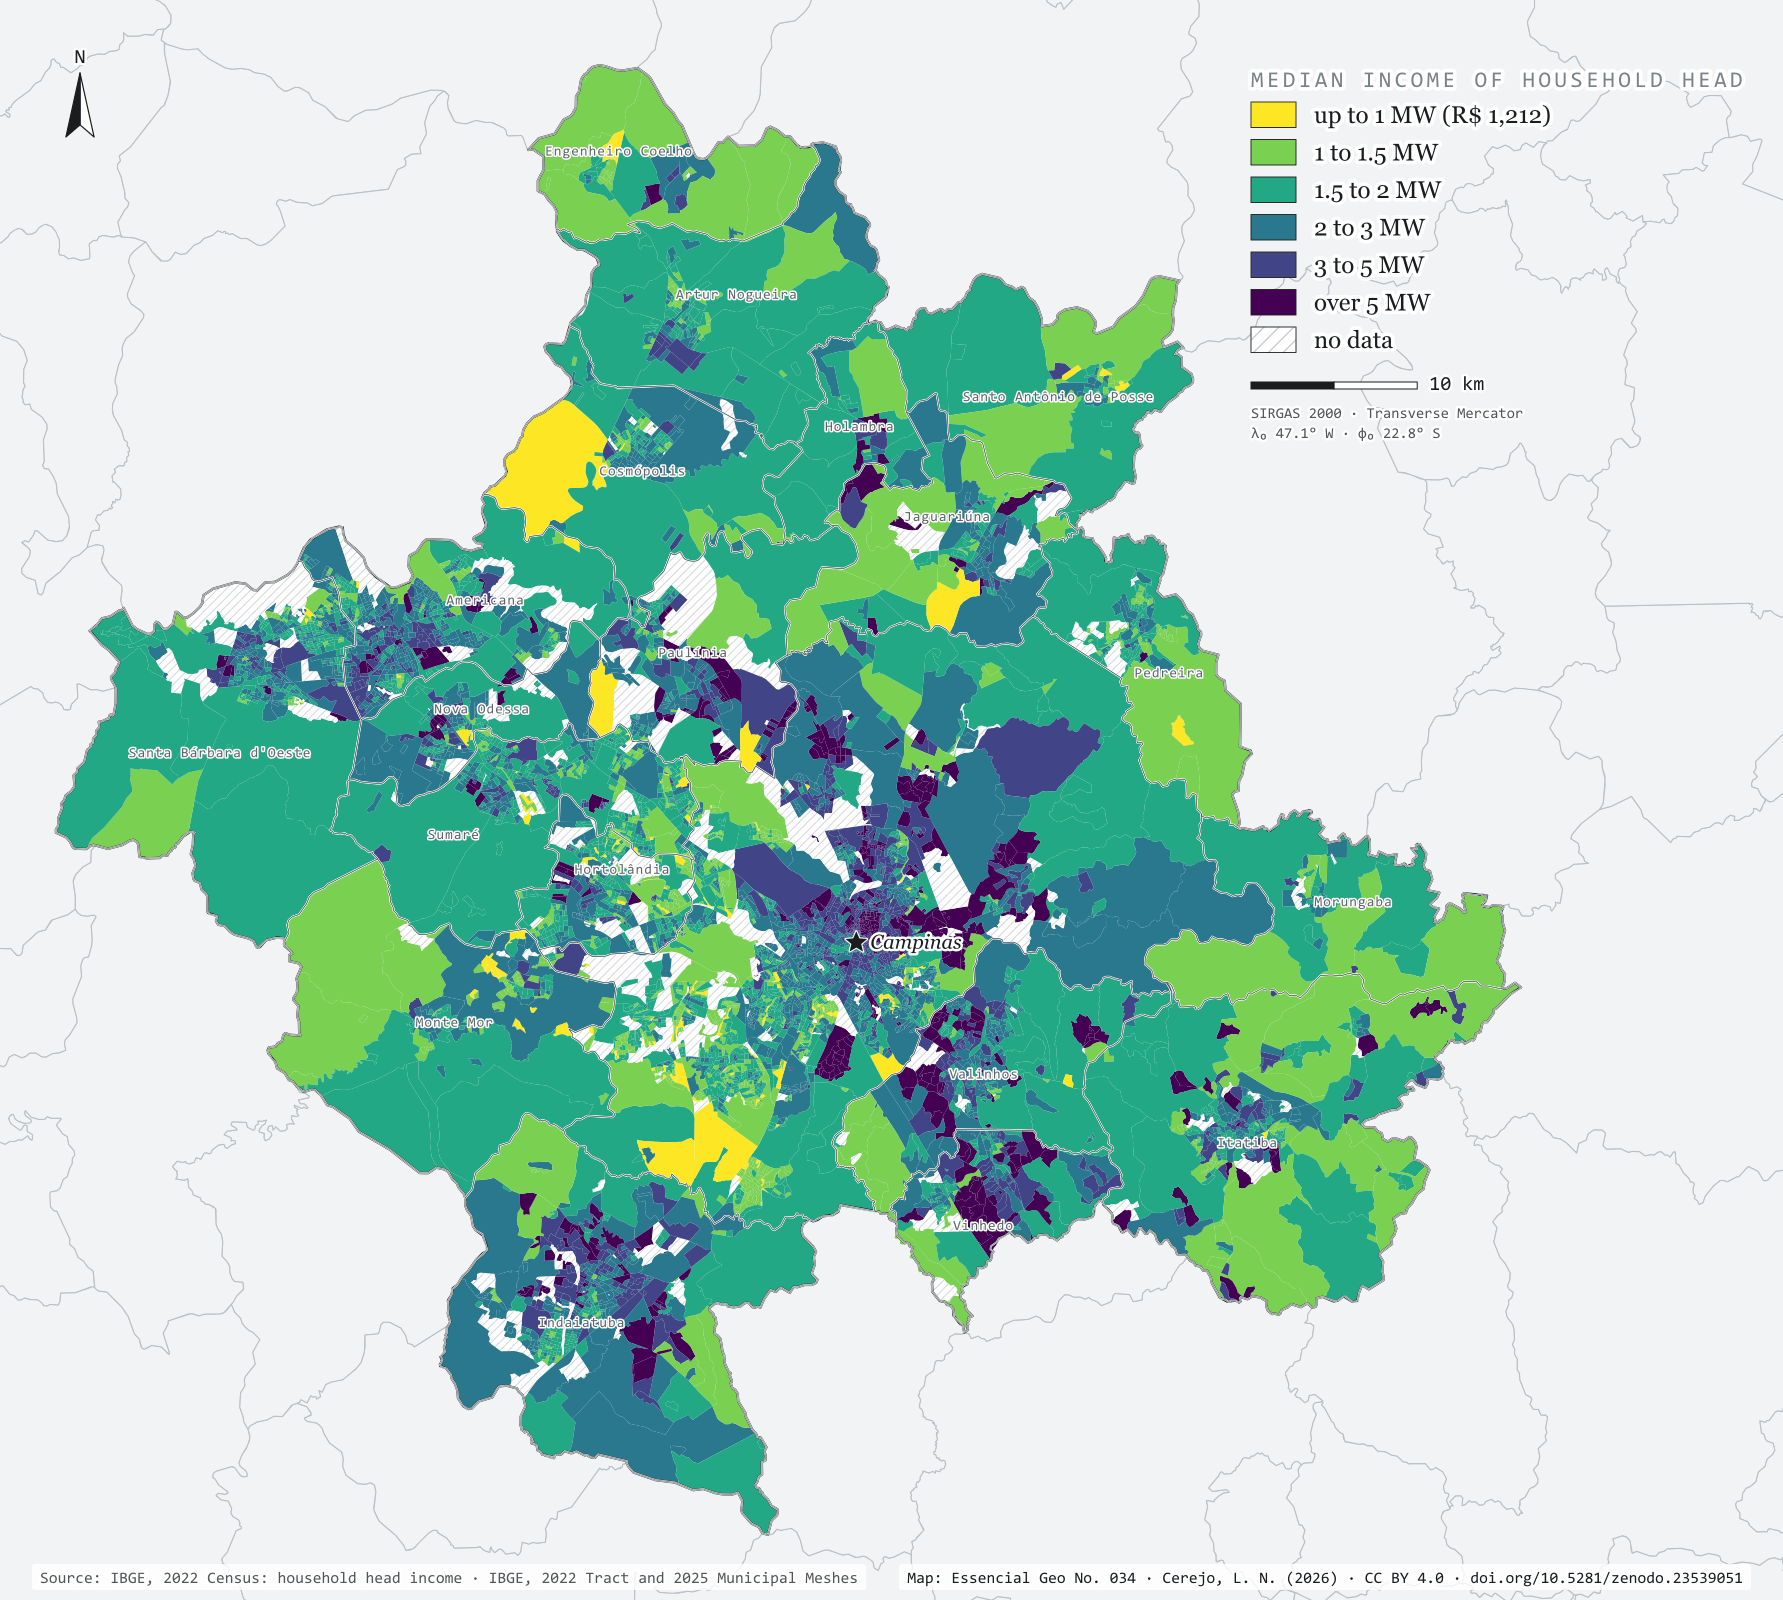
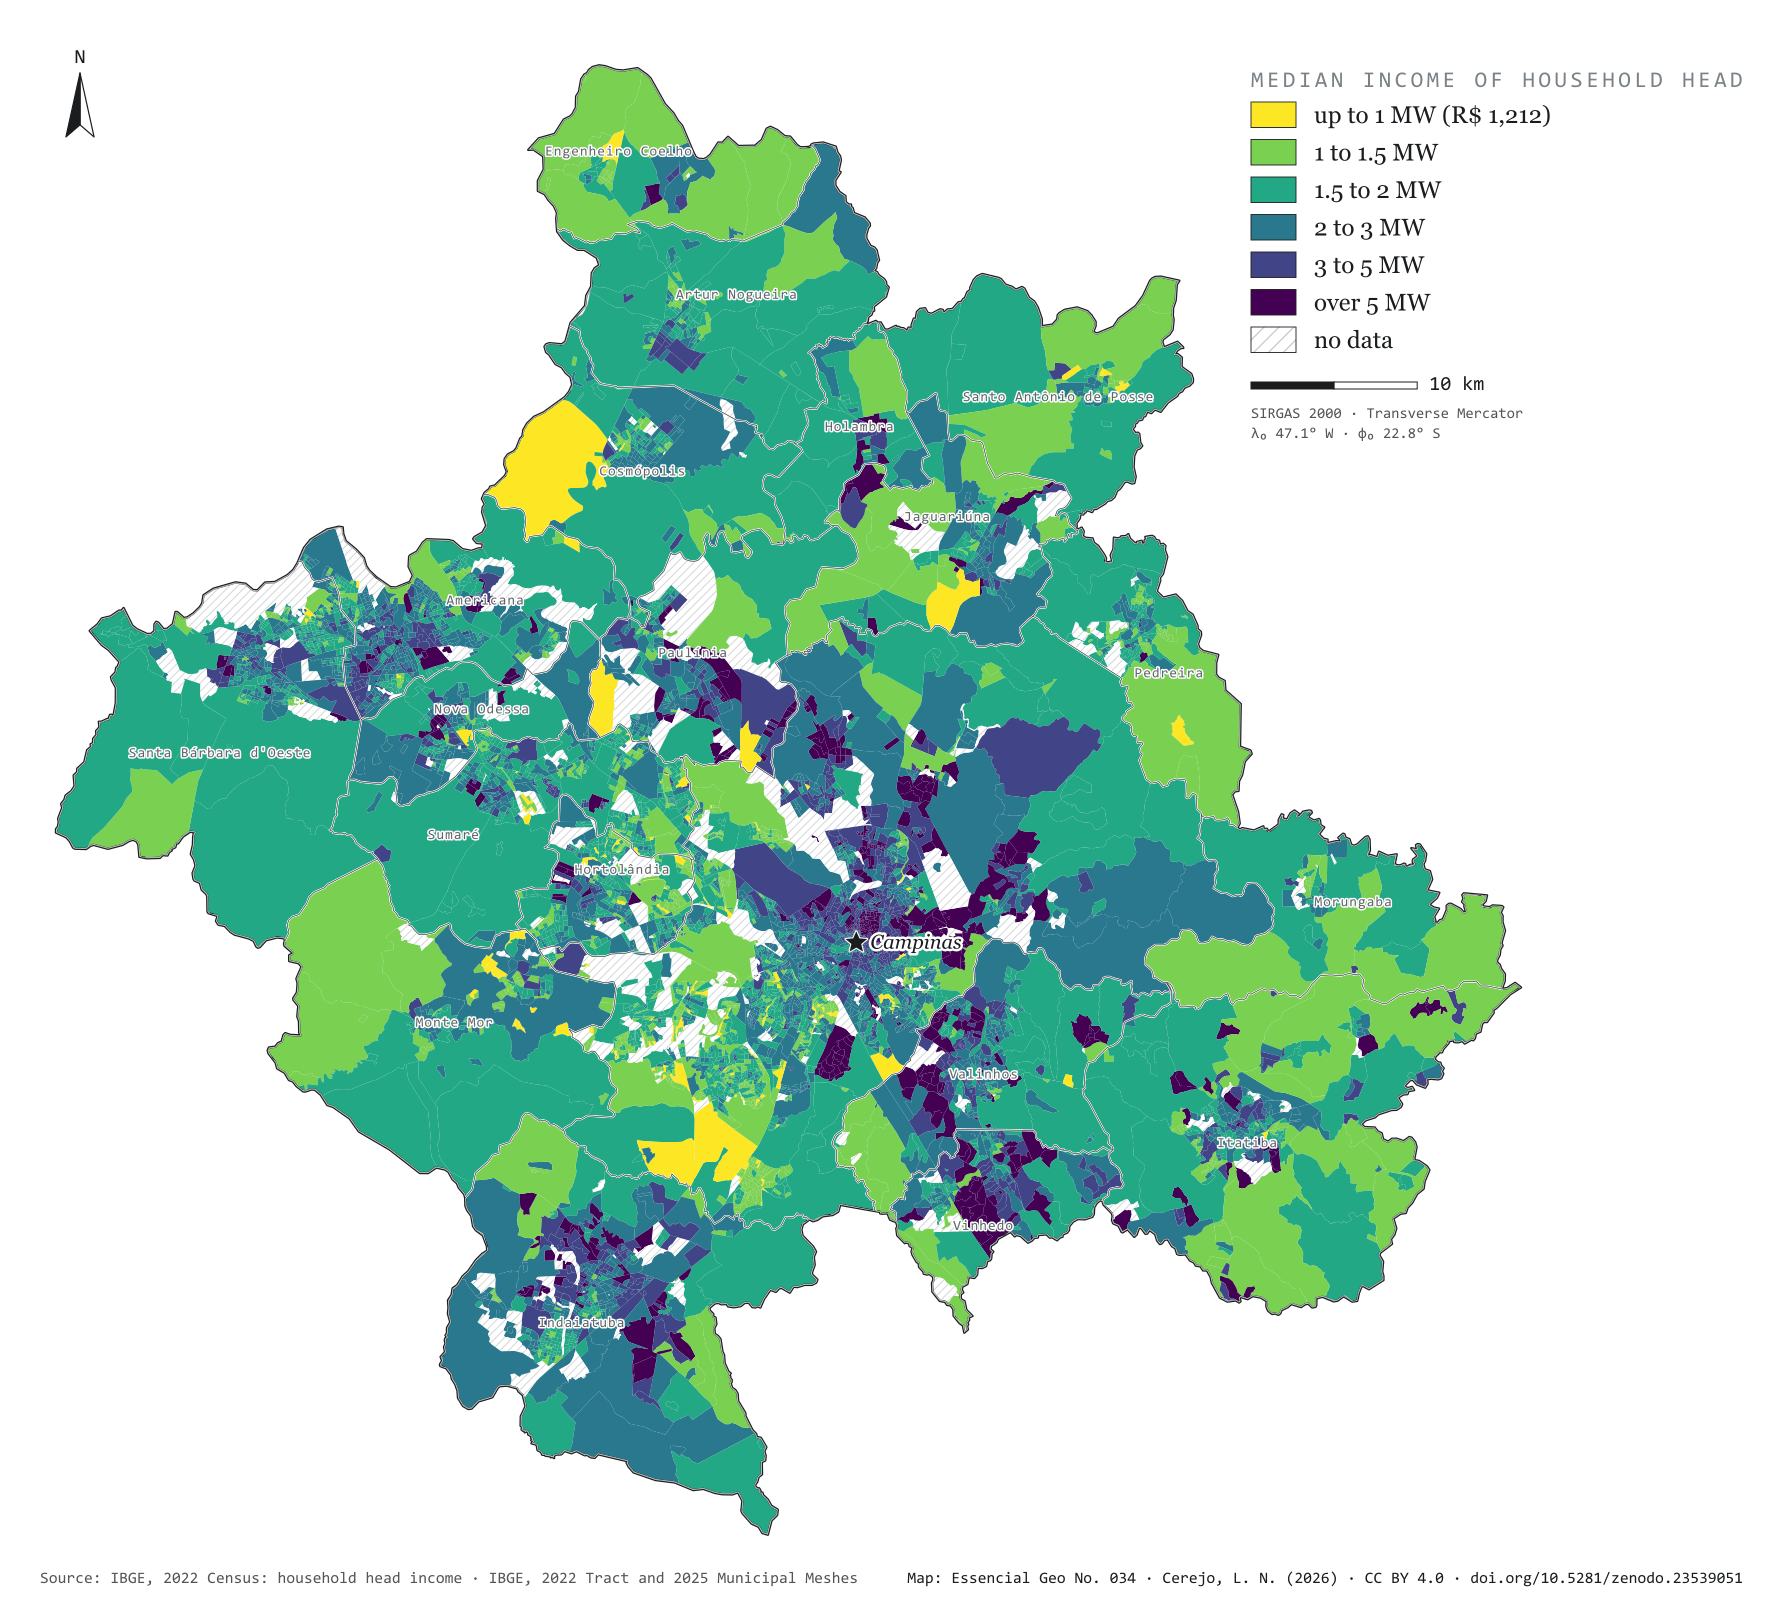
In 2022, the Brazilian minimum wage was R$ 1,212 a month. In the Campinas Metropolitan Region, 47% of household heads lived in census tracts where the heads’ median income did not exceed two minimum wages; 8.2% lived in tracts above five. The map colours each tract by median income and draws a border that is not the municipal one: in Vinhedo, Valinhos and Indaiatuba, one head in three lives in tracts above three minimum wages; in Hortolândia and Sumaré, one in ten; in Monte Mor, under 3%. The highest median, R$ 28,000 (23 minimum wages), belongs to a tract in Indaiatuba. Third plate of the collection “Campinas Metropolitan Region”.
Technical record · downloads · citation
At a glance
Household heads, by the tract’s median income (minimum wages) (people)
até 1 SM2.1%
1 a 1,5 SM16.3%
1,5 a 2 SM29%
2 a 3 SM30%
3 a 5 SM14.4%
mais de 5 SM8.2%
Household heads in tracts with a median of up to 2 minimum wages
47%
548,714 of the 1,156,822 heads in tracts with data
Highest tract median income
28,000R$
In Indaiatuba: 23 minimum wages
Layers
setorespolygon6,548 census tracts: household heads, residents, mean and median household head income
The map without a frame, with legend, scale, reference system and credit written on it: ready for papers, lectures and slides. In two versions: with the basemap (neighbours and sea) or only the mapped area, on white.
CEREJO, Lucas Nakamura. Renda do responsável: a renda desenha outra fronteira. Versão 1.0.0. [S. l.]: Zenodo, 2026. Conjunto de dados. DOI: 10.5281/zenodo.23539051. Disponível em: https://doi.org/10.5281/zenodo.23539051. Acesso em: 10 nov. 2026.
Cerejo, L. N. (2026). Renda do responsável: a renda desenha outra fronteira [Household head income: Income draws another border] (Version 1.0.0) [Data set]. Zenodo. https://doi.org/10.5281/zenodo.23539051
@dataset{cerejo2026_renda_rmc,
  author    = {Cerejo, Lucas Nakamura},
  title     = {Renda do responsável: A renda desenha outra fronteira},
  year      = {2026},
  publisher = {Zenodo},
  version   = {1.0.0},
  doi       = {10.5281/zenodo.23539051},
  url       = {https://doi.org/10.5281/zenodo.23539051},
  language  = {portuguese},
  note      = {English title: Household head income: Income draws another border. Licence CC BY 4.0}
}
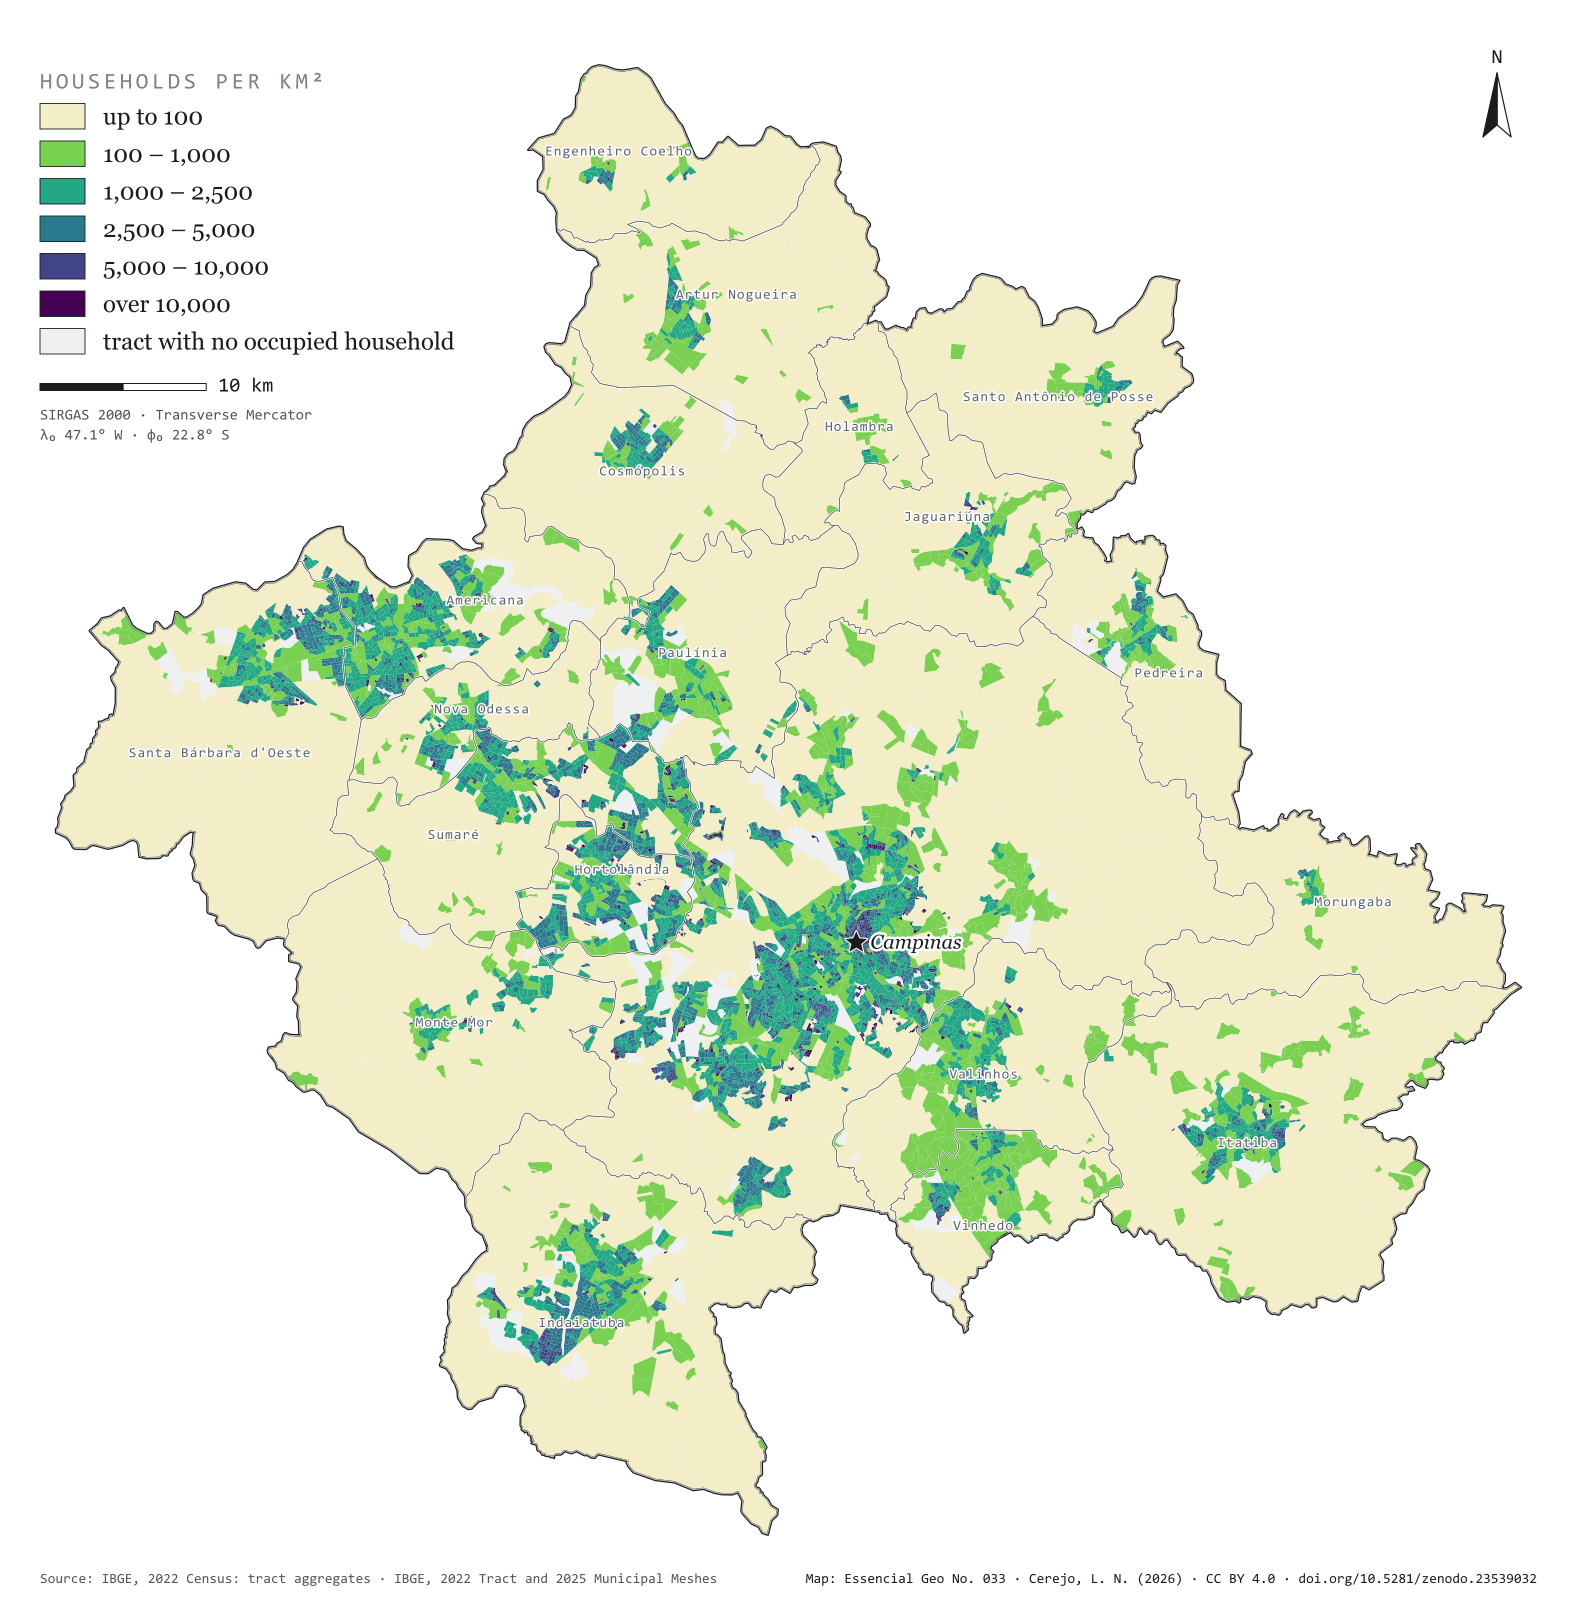
Fig. 033Campinas Metropolitan Region (SP)EPSG:4674Source: IBGE
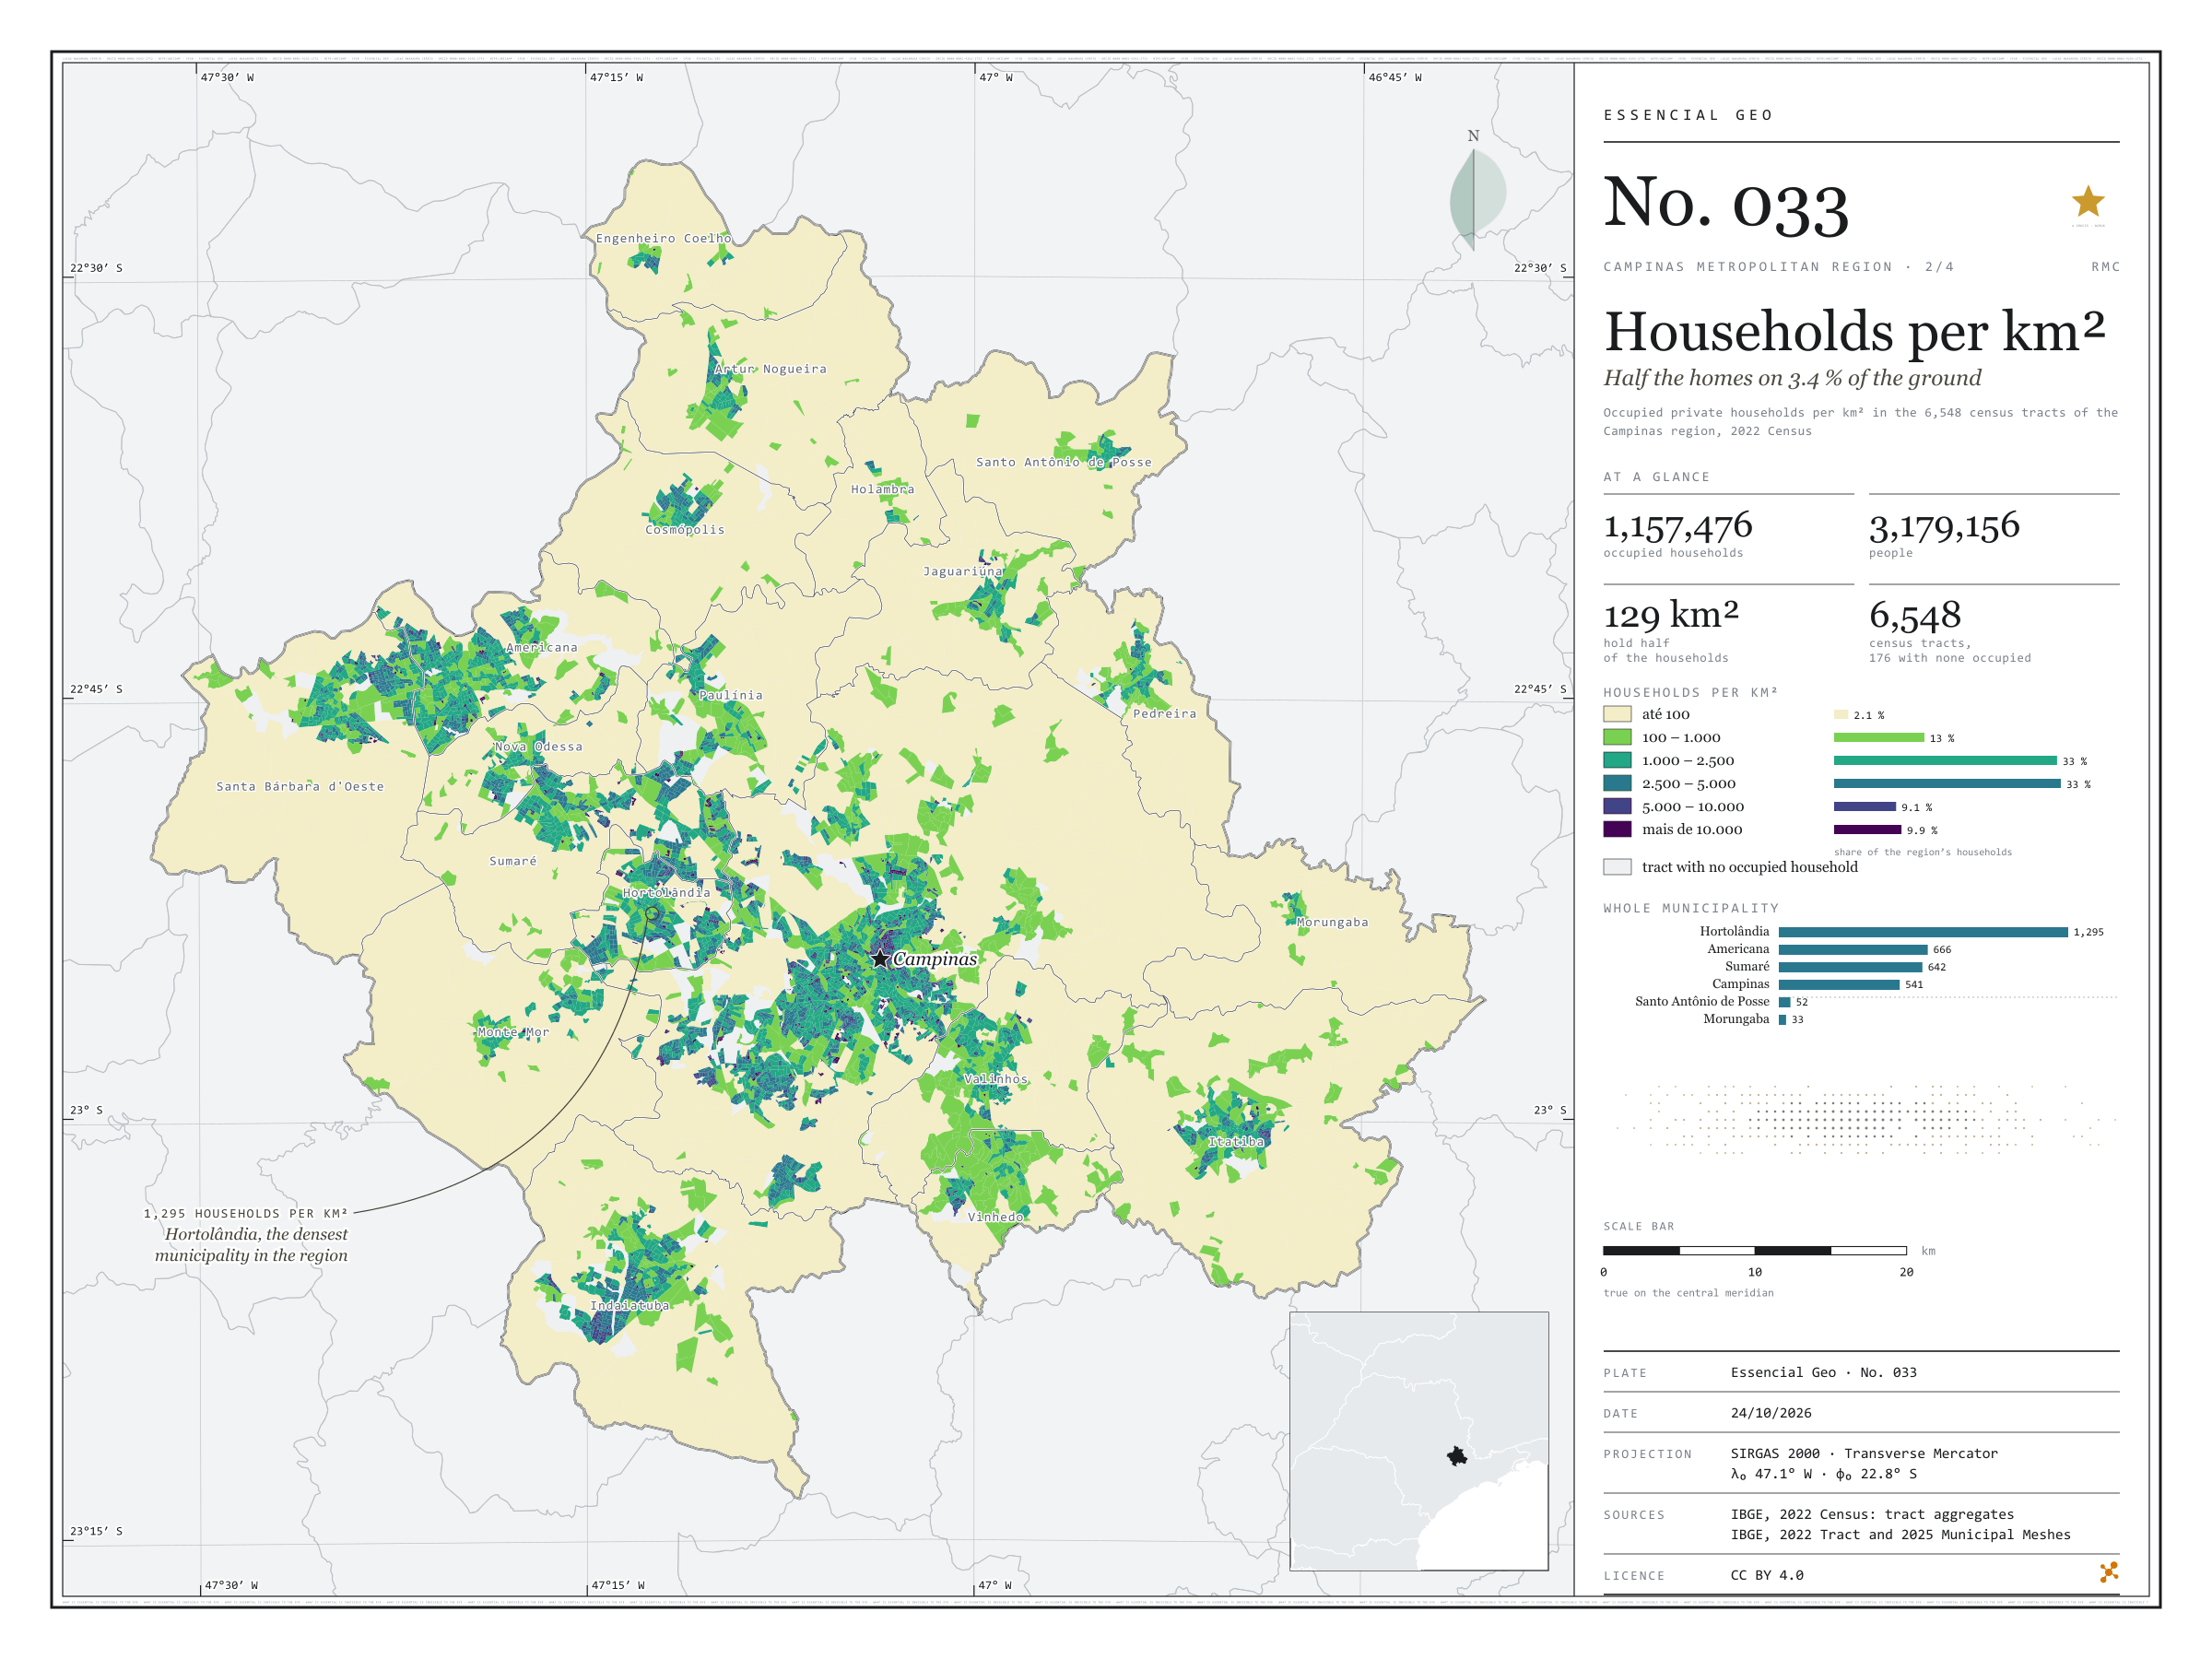
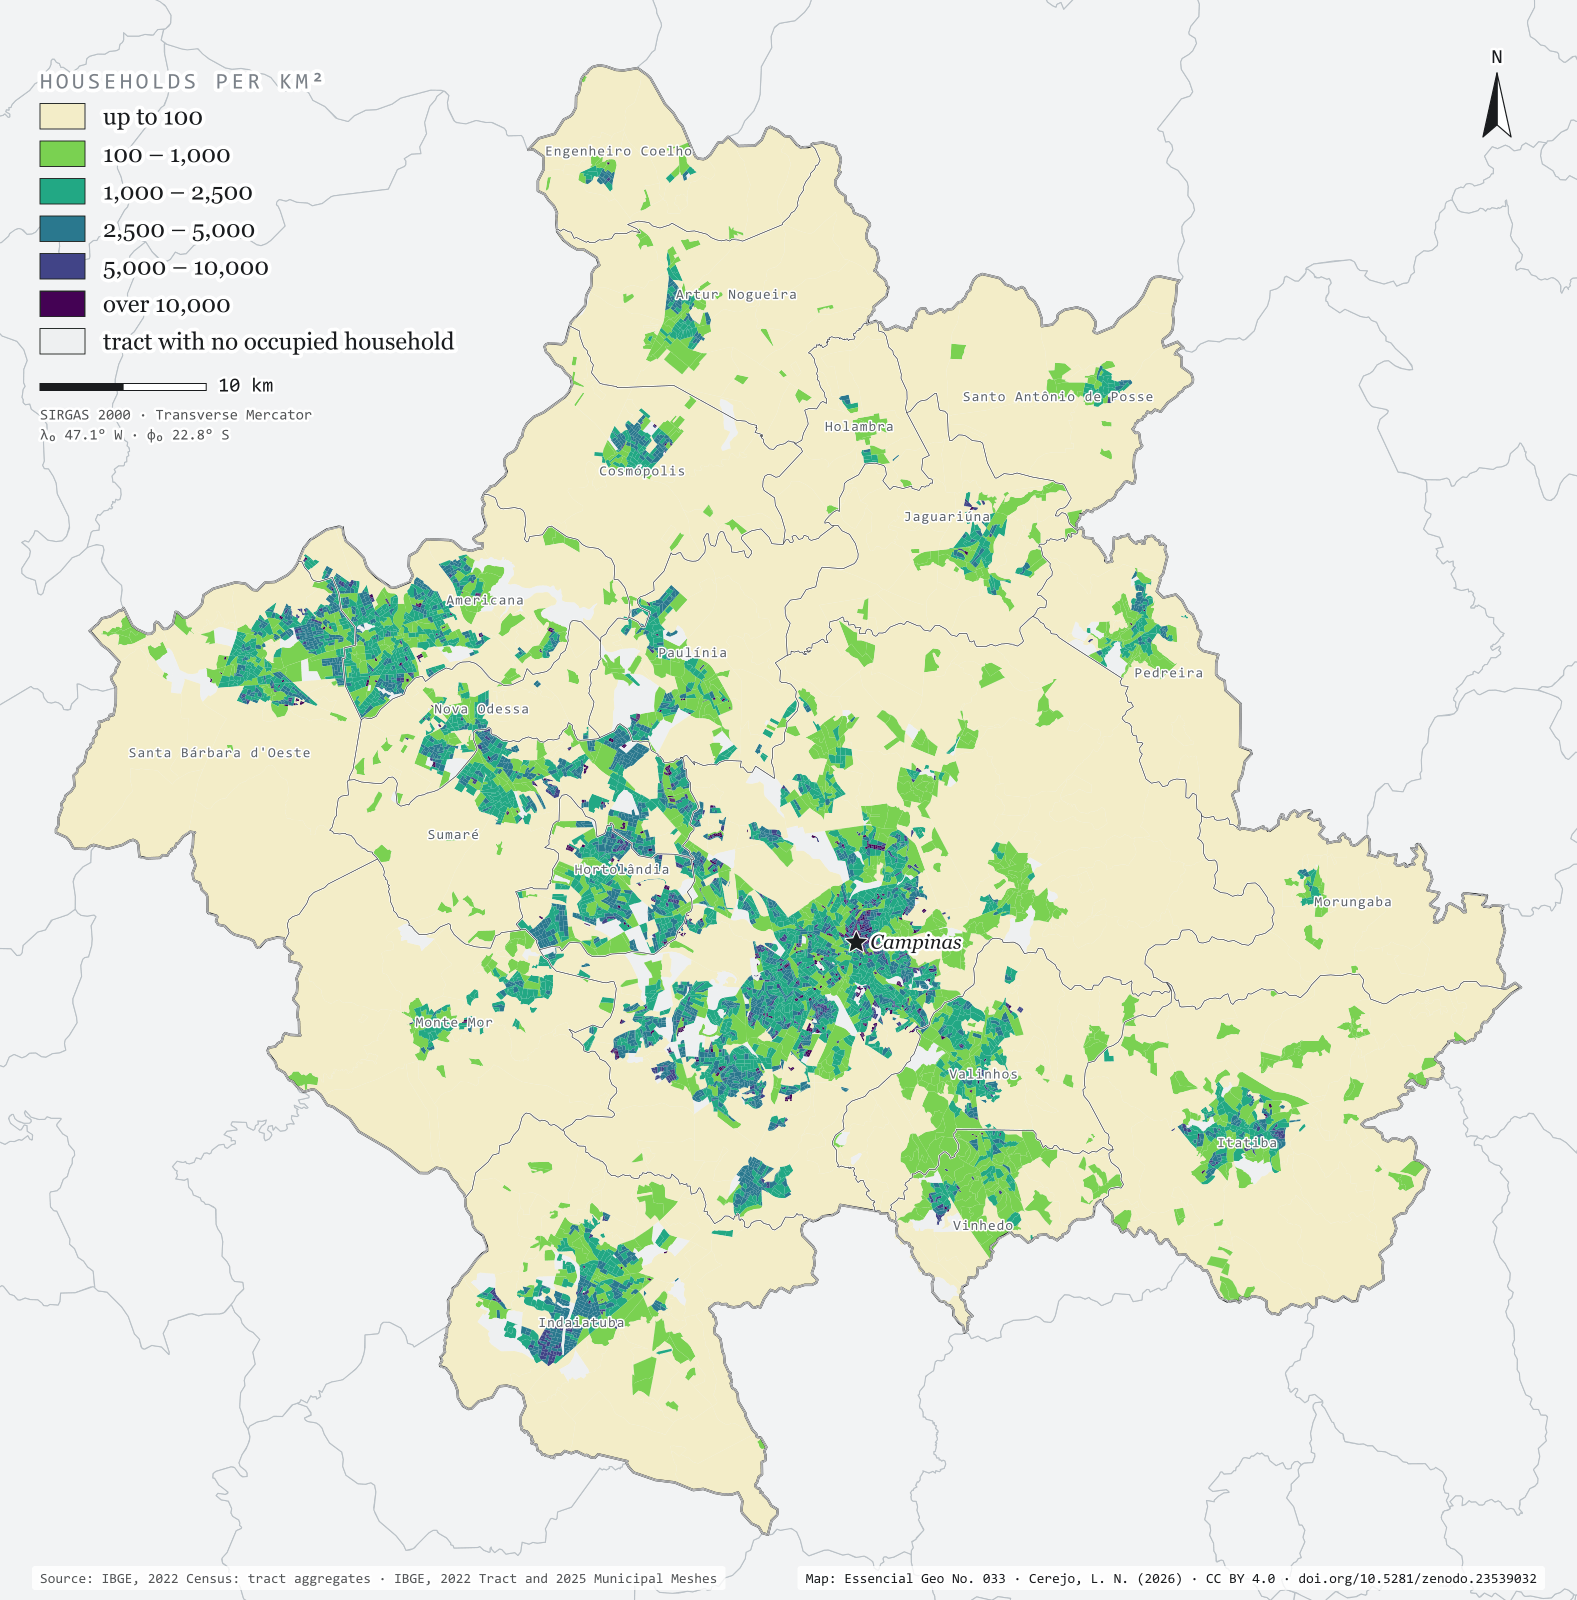
The 2022 Census counted 1,157,476 occupied households in the 20 municipalities of the Campinas Metropolitan Region, home to 3,179,156 people. Half of those homes fit into 129 km², 3.4% of the region’s area. The map colours each of the 6,548 census tracts by households per km² and shows the city in layers: central Campinas and the neighbourhoods of Sumaré, Hortolândia and Americana above 5,000, the fringe of housing estates between 1,000 and 5,000 and, all around, the countryside, below 100. Hortolândia is the densest municipality, with 1,295 households per km²; Morungaba the least dense, with 33. Second plate of the collection “Campinas Metropolitan Region”.
Technical record · downloads · citation
At a glance
The region’s households, by tract density (households per km²) (households)
até 1002.1%
100 – 1.00013.2%
1.000 – 2.50032.6%
2.500 – 5.00033.2%
5.000 – 10.0009.1%
mais de 10.0009.9%
Households per km², whole municipality (five densest) (households/km²)
Hortolândia1,295
Americana666
Sumaré642
Campinas541
Vinhedo339
Area holding half the households
129km²
3.4% of the region’s 3,791 km²
Layers
setorespolygon6,548 census tracts: urban/rural status, area, people, occupied households and households per km²
municipiospolygon20 municipalities: households, people, area, tracts and households per km²
The map without a frame, with legend, scale, reference system and credit written on it: ready for papers, lectures and slides. In two versions: with the basemap (neighbours and sea) or only the mapped area, on white.
CEREJO, Lucas Nakamura. Domicílios por km²: metade dos lares em 3,4 % do chão. Versão 1.0.0. [S. l.]: Zenodo, 2026. Conjunto de dados. DOI: 10.5281/zenodo.23539032. Disponível em: https://doi.org/10.5281/zenodo.23539032. Acesso em: 10 nov. 2026.
Cerejo, L. N. (2026). Domicílios por km²: metade dos lares em 3,4 % do chão [Households per km²: Half the homes on 3.4 % of the ground] (Version 1.0.0) [Data set]. Zenodo. https://doi.org/10.5281/zenodo.23539032
@dataset{cerejo2026_domicilios_rmc,
  author    = {Cerejo, Lucas Nakamura},
  title     = {Domicílios por km²: Metade dos lares em 3,4 % do chão},
  year      = {2026},
  publisher = {Zenodo},
  version   = {1.0.0},
  doi       = {10.5281/zenodo.23539032},
  url       = {https://doi.org/10.5281/zenodo.23539032},
  language  = {portuguese},
  note      = {English title: Households per km²: Half the homes on 3.4 % of the ground. Licence CC BY 4.0}
}