Age and sex
The north-west grows old, the metropolis is young and prisons are men
Record, downloads and citationThe median age in São Paulo is 36: half the people are younger, half older. But the state is ageing unevenly. In the north-west, in small towns such as Turmalina (51), Floreal and Santana da Ponte Pensa (47), there are already more people aged 65 or over than children up to 14: 90 municipalities are like this. In Greater São Paulo the index falls to 32 in Itapevi, three children per older person. In 446 of the 645 municipalities there are more women than men; Santos has 83 men per 100 women. The sex ratio map has dark blue patches: Balbinos has 444 men per 100 women, and 65% of its residents live in collective dwellings. Of the 29 towns with over 10% of their people in such dwellings, prisons among them, 27 exceed 110 men per 100 women. Second plate of the collection “People across the land”.
Technical record · downloads · citation
At a glance
- up to 32 years 2.6%
- 33 to 35 22%
- 36 to 38 42.9%
- 39 to 41 24.7%
- 42 to 44 5.9%
- 45 or over 1.9%
36 years
90 municipalities
446 municipalities
Layers
- municipios polygon 645 municipalities: people, men, women, median age, ageing index, sex ratio, aged up to 14 and 60 or over, urban and rural households and residents, residents outside private households
- regioes_intermediarias polygon 11 intermediate geographic regions
- limite_estadual polygon State boundary
Metadata
- Sources
- IBGE — 2022 Population Census: table 9514 (resident population by sex and age) (2022)
IBGE — 2022 Population Census: table 9515 (ageing index, median age and sex ratio) (2022)
IBGE — 2022 Population Census: table 9922 (households and residents by urban/rural status) (2022)
IBGE — Municipal Mesh 2025 (2025) - Extent
- São Paulo State (SP)
- CRS / Projection
- SIRGAS 2000 (EPSG:4674)
EPSG:4674 - Software
- Node.js · d3-geo · QGIS
- Method
- Median age, ageing index (people aged 65 or over per 100 aged up to 14) and sex ratio (men per 100 women) of the resident population by municipality, from SIDRA 9515, in six classes each; the state’s pyramid from SIDRA 9514; residents outside occupied permanent private households = population (9514) minus residents of those households (9922).
- Version
- v1.0.0
- Licence
- CC BY 4.0
Downloads
- GPKG Municipalities with age, sex and urban/rural status, SIRGAS 2000, with QGIS styles (.gpkg) 4.5 MB
- CSV Municipal table (.csv) 70 kB
- SVG Vector plate, for printing (.svg) 5.8 MB
- PNG Plate (PNG, 2400 px) (.png) 0.3 MB

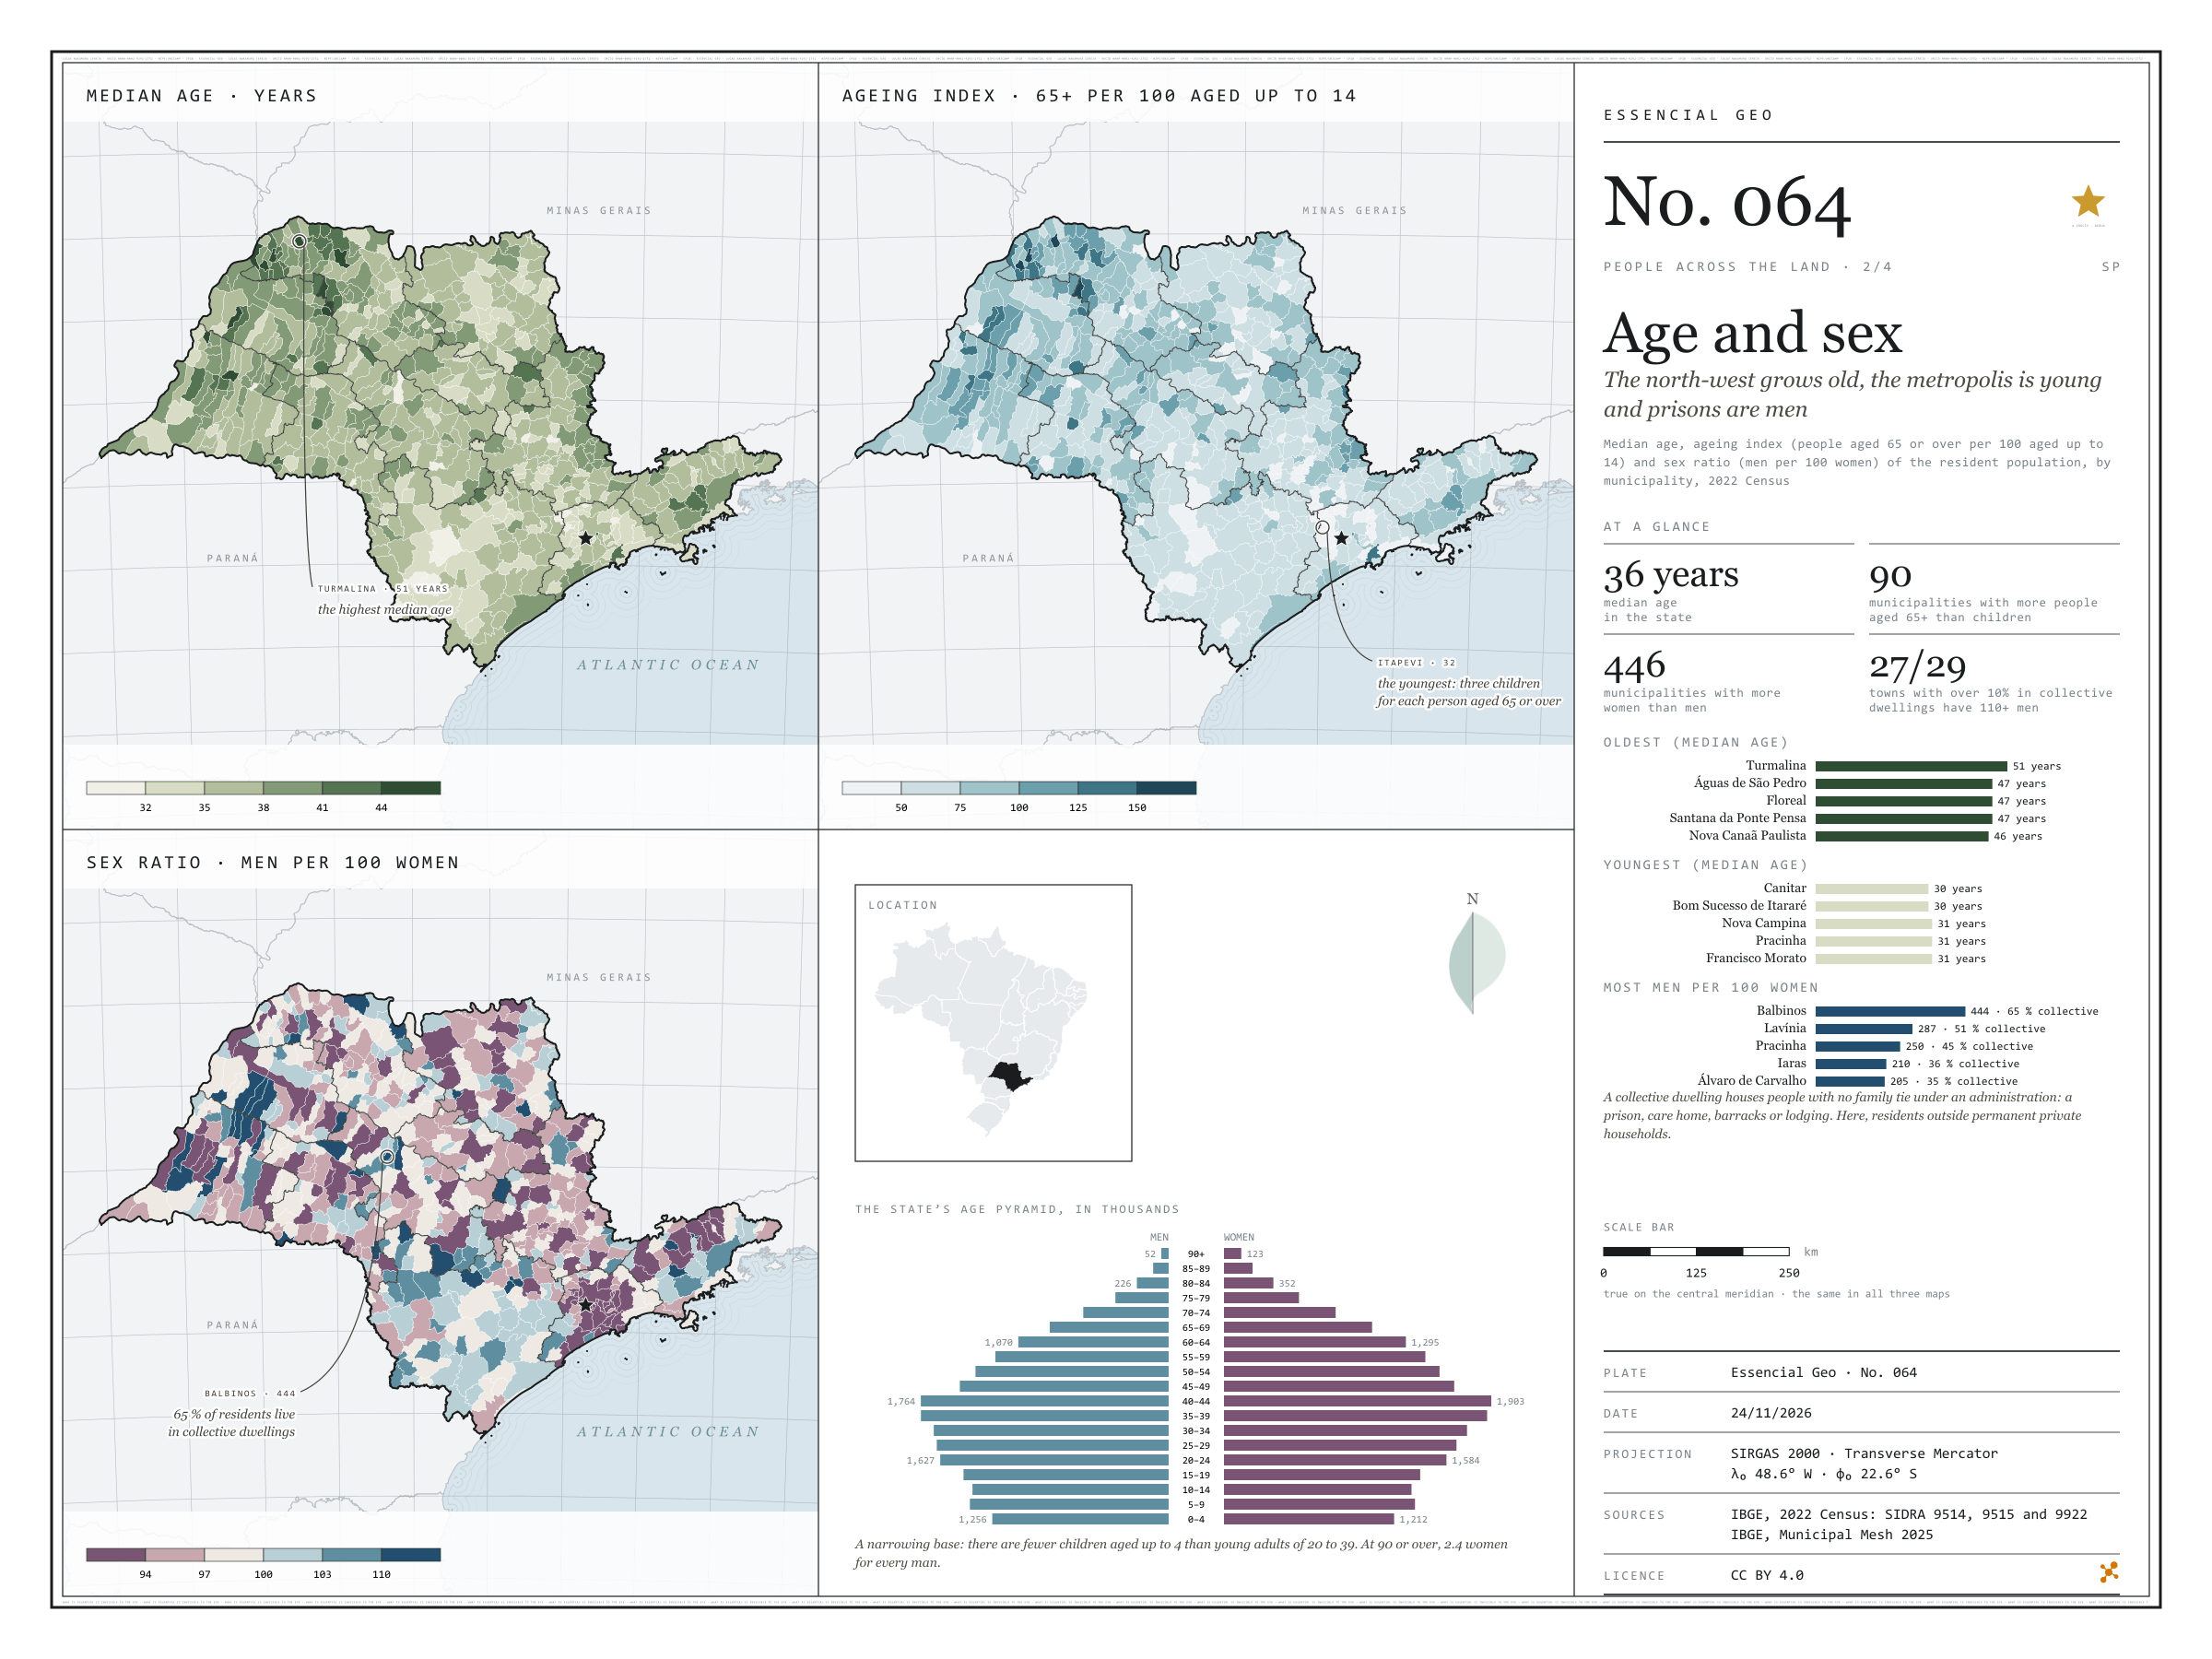
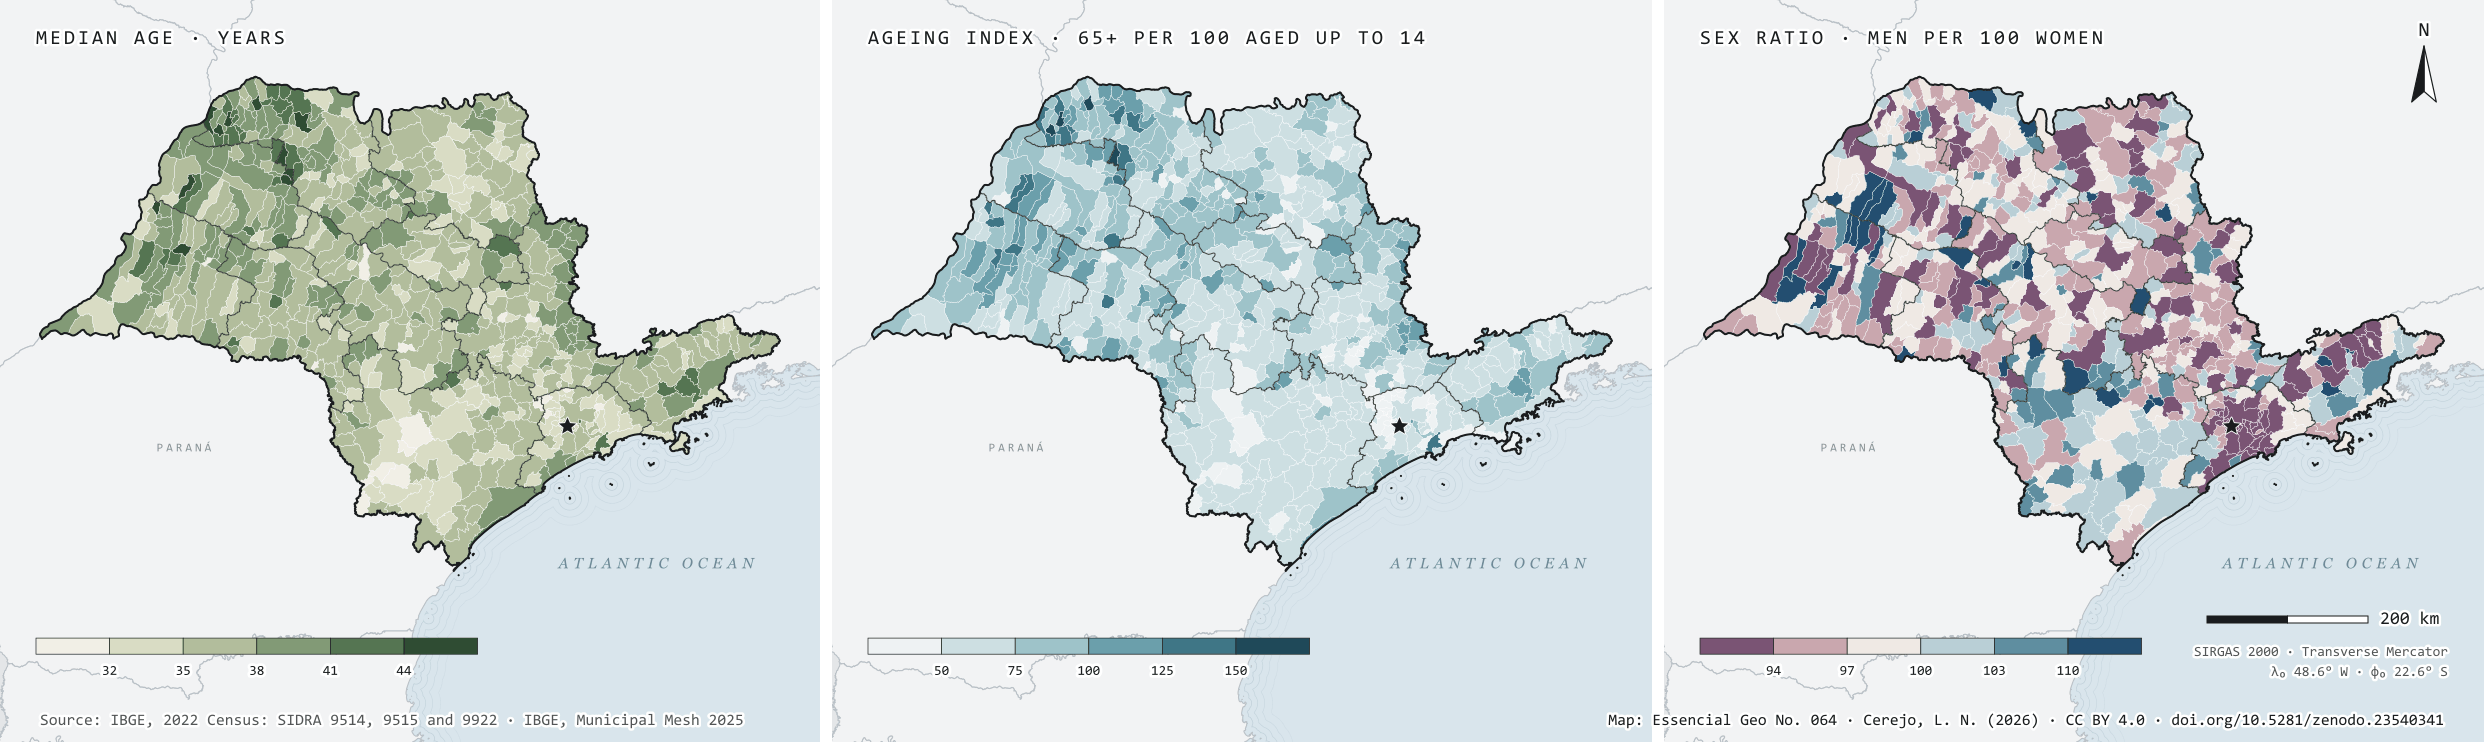
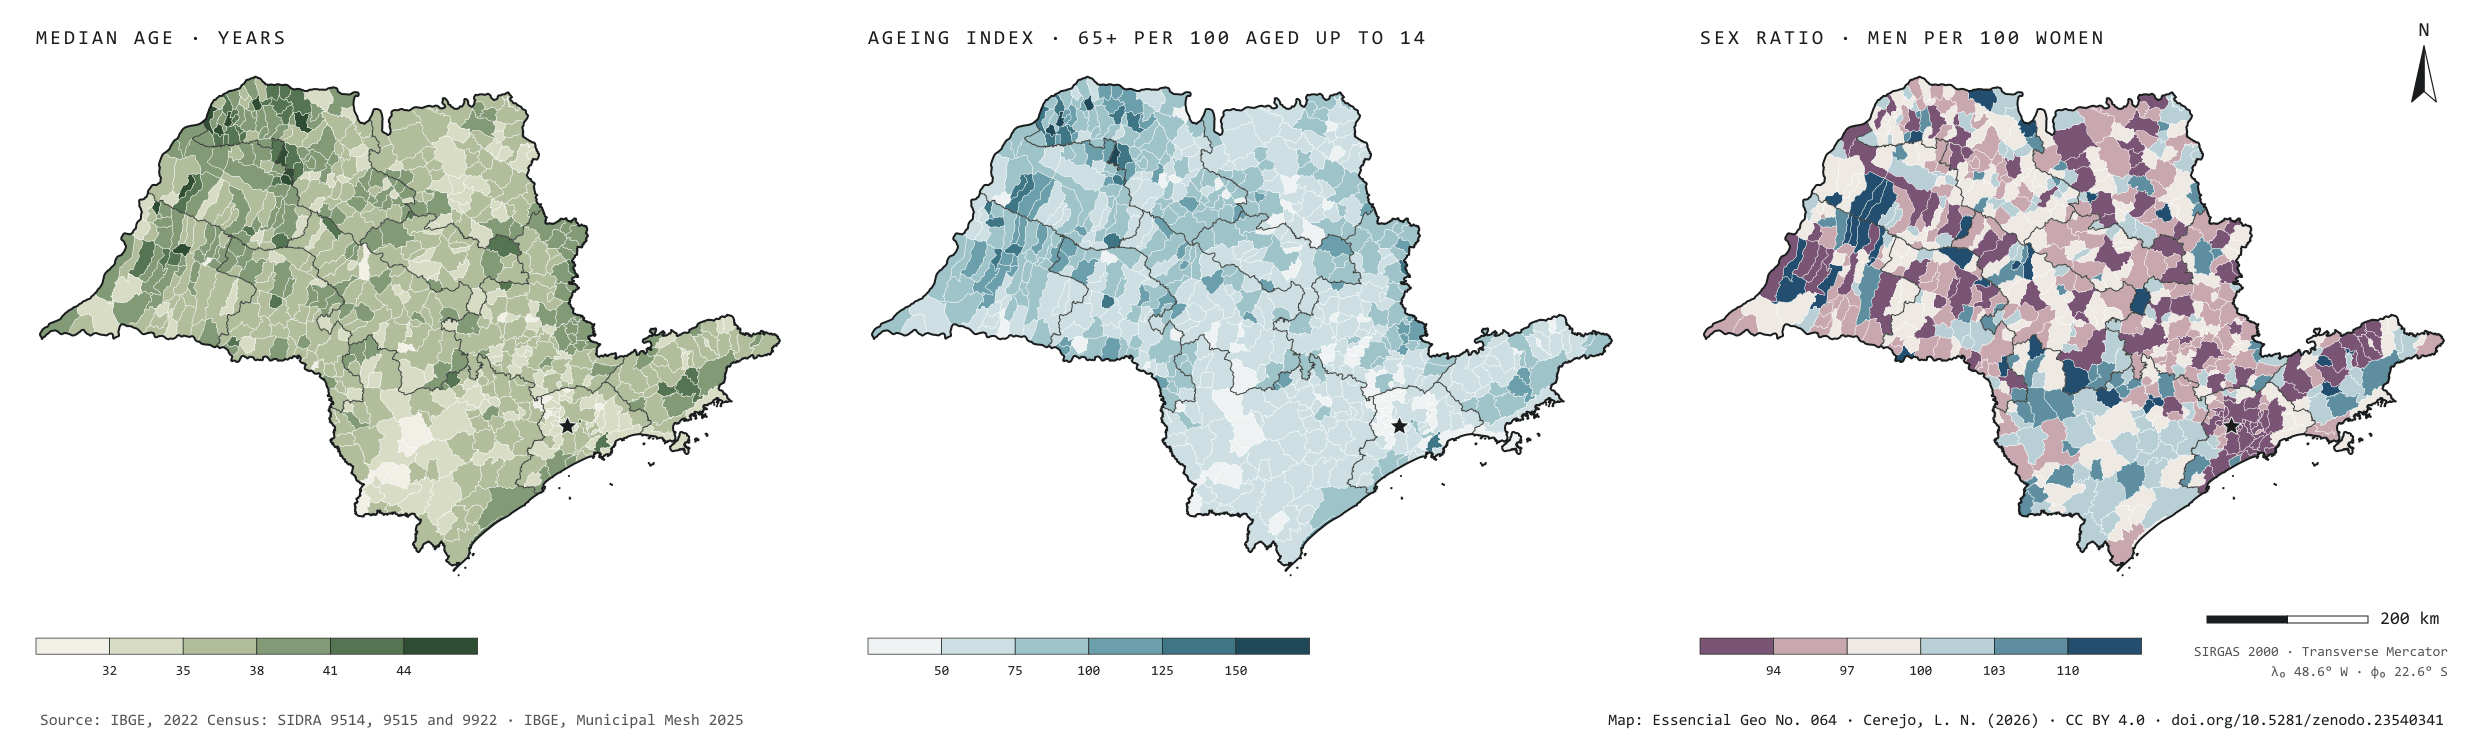
Figure to reuse
The map without a frame, with legend, scale, reference system and credit written on it: ready for papers, lectures and slides. In two versions: with the basemap (neighbours and sea) or only the mapped area, on white.
With basemap (PNG) Without basemap (PNG) QR code (SVG)
Point a camera at it to open this page.
How to cite
CEREJO, Lucas Nakamura. Idade e sexo: o noroeste envelhece, a metrópole é jovem e os presídios são homens. Versão 1.0.0. [S. l.]: Zenodo, 2026. Conjunto de dados. DOI: 10.5281/zenodo.23540341. Disponível em: https://doi.org/10.5281/zenodo.23540341. Acesso em: 10 nov. 2026.
Cerejo, L. N. (2026). Idade e sexo: o noroeste envelhece, a metrópole é jovem e os presídios são homens [Age and sex: The north-west grows old, the metropolis is young and prisons are men] (Version 1.0.0) [Data set]. Zenodo. https://doi.org/10.5281/zenodo.23540341
@dataset{cerejo2026_idade_e_sexo_sp,
  author    = {Cerejo, Lucas Nakamura},
  title     = {Idade e sexo: O noroeste envelhece, a metrópole é jovem e os presídios são homens},
  year      = {2026},
  publisher = {Zenodo},
  version   = {1.0.0},
  doi       = {10.5281/zenodo.23540341},
  url       = {https://doi.org/10.5281/zenodo.23540341},
  language  = {portuguese},
  note      = {English title: Age and sex: The north-west grows old, the metropolis is young and prisons are men. Licence CC BY 4.0}
}