Who works with biomass in São Paulo, from RAIS: bioeconomy jobs in each municipality, the industries that generate organic waste, the sugarcane chain and who treats rubbish and sewage.
Fig. 076São Paulo State (SP)EPSG:4674Source: MTE/PDET, JRC (European Commission), IBGE
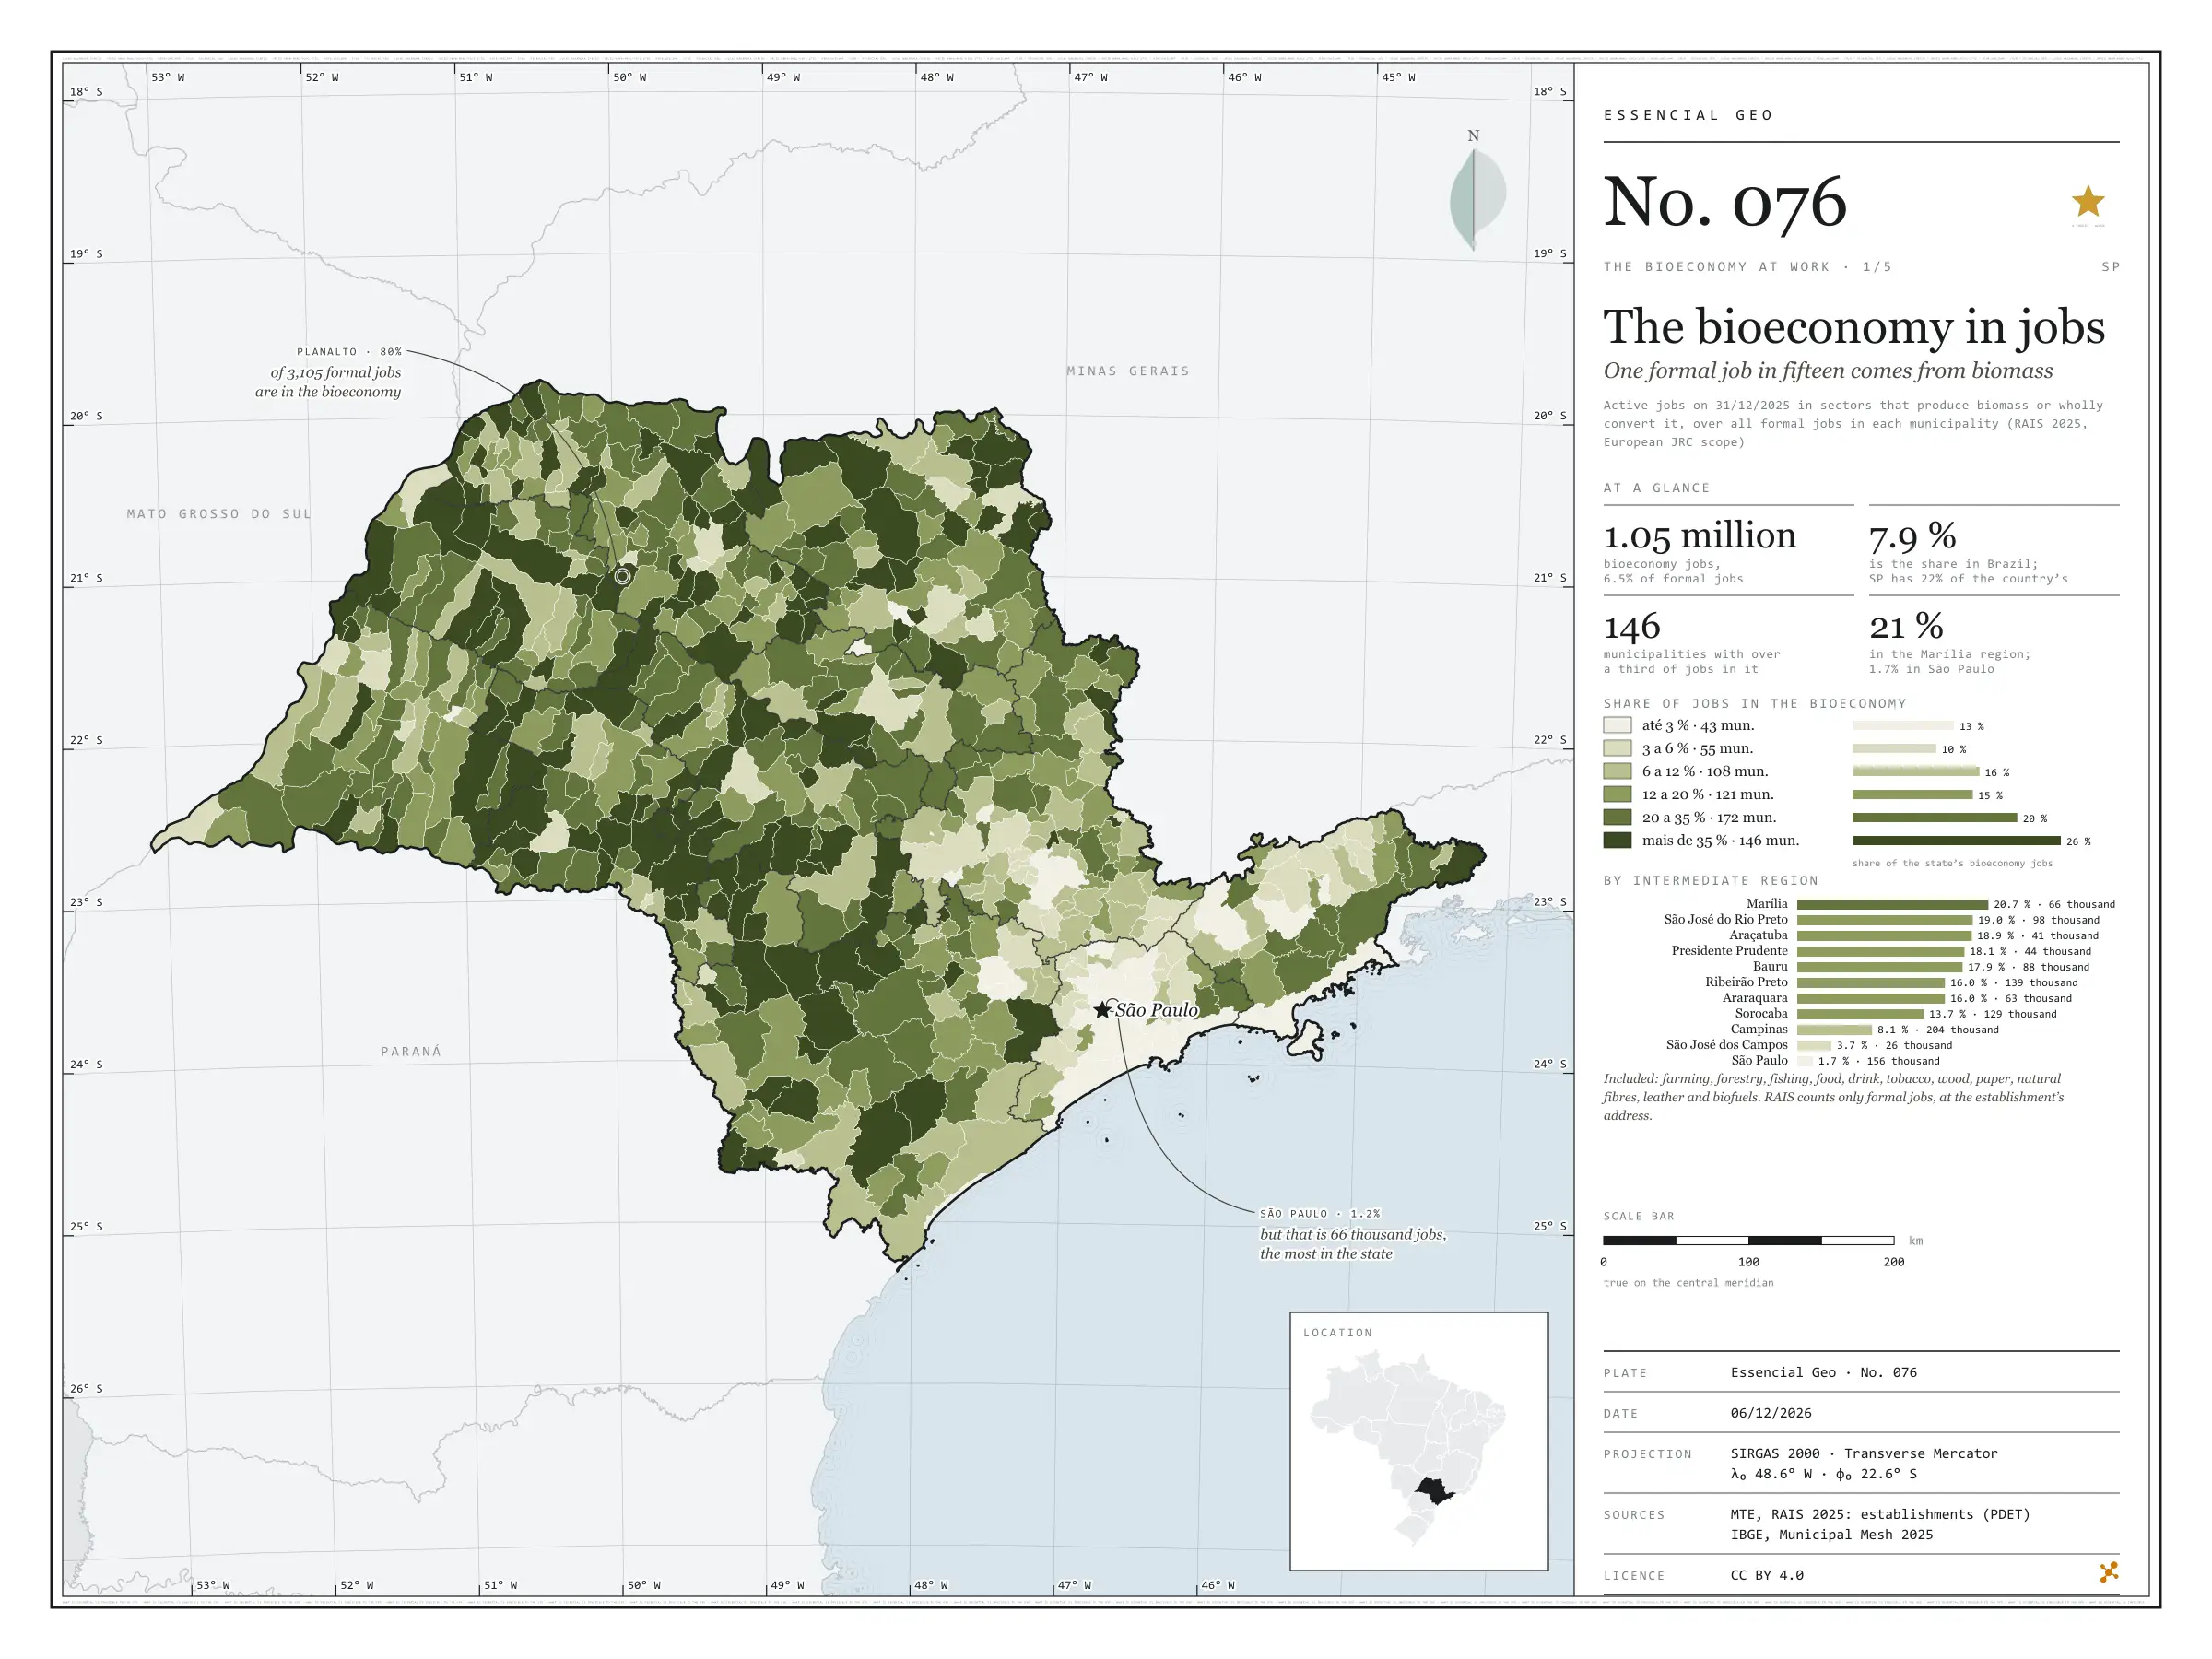
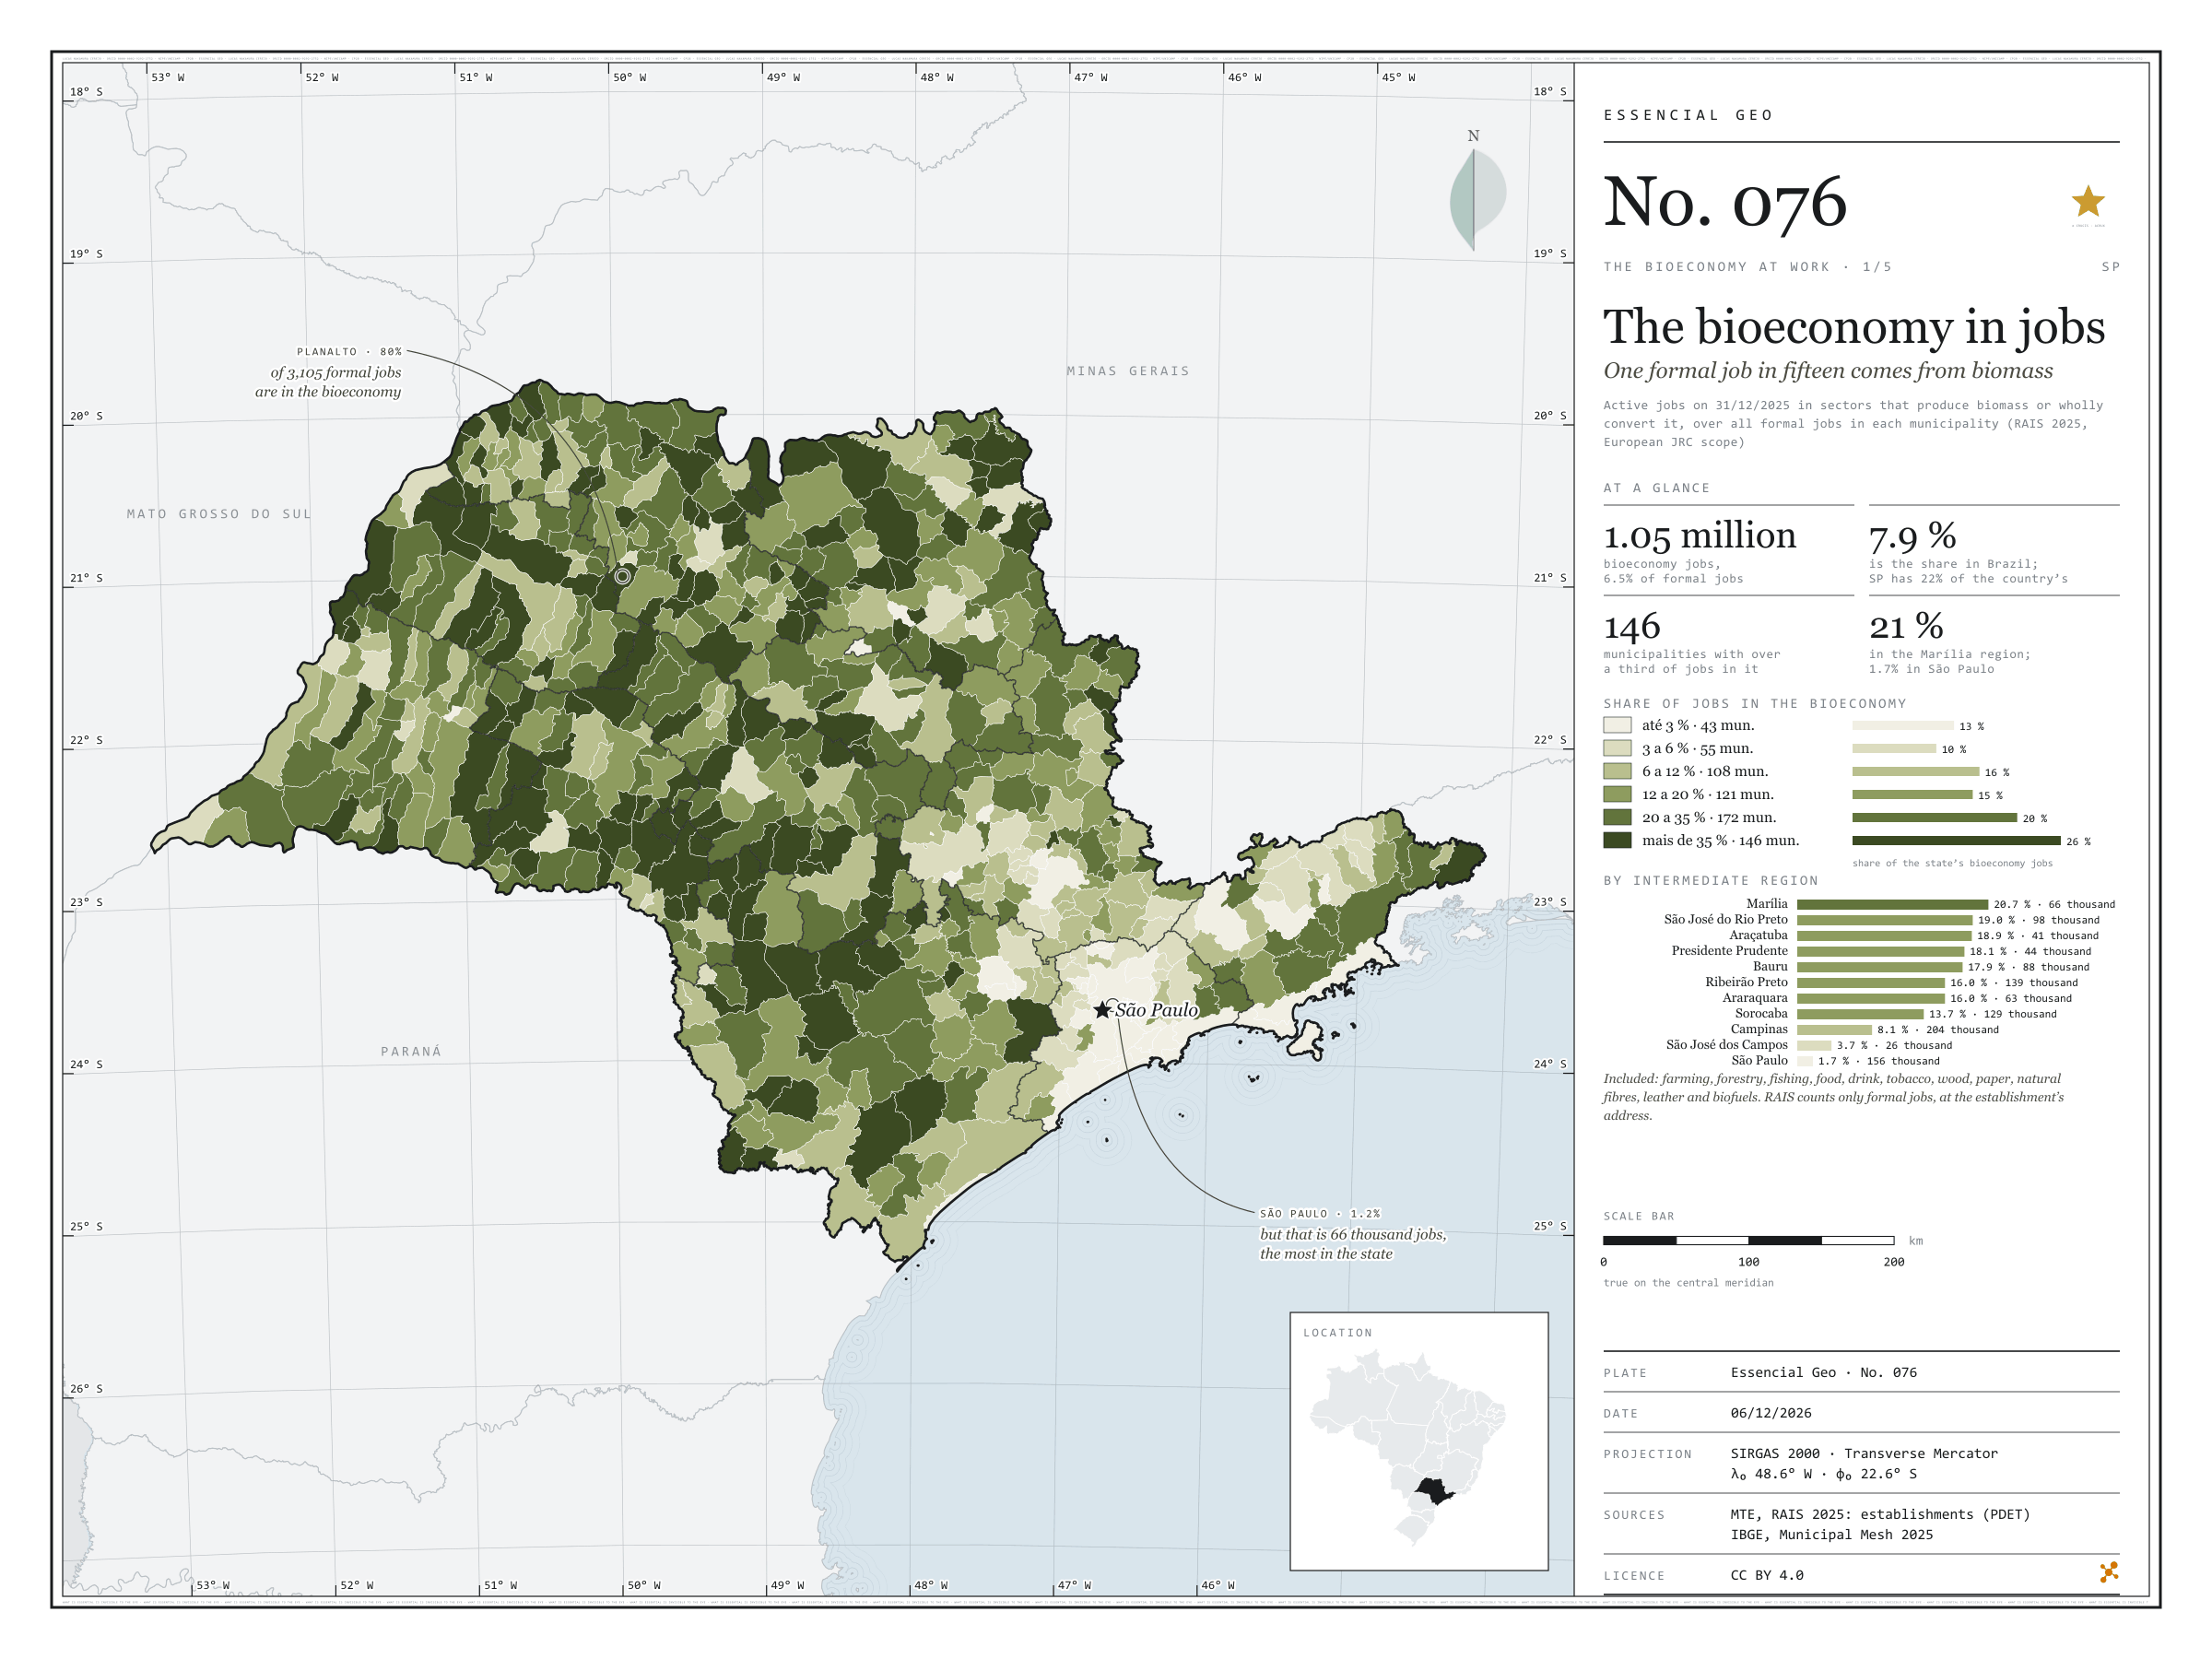
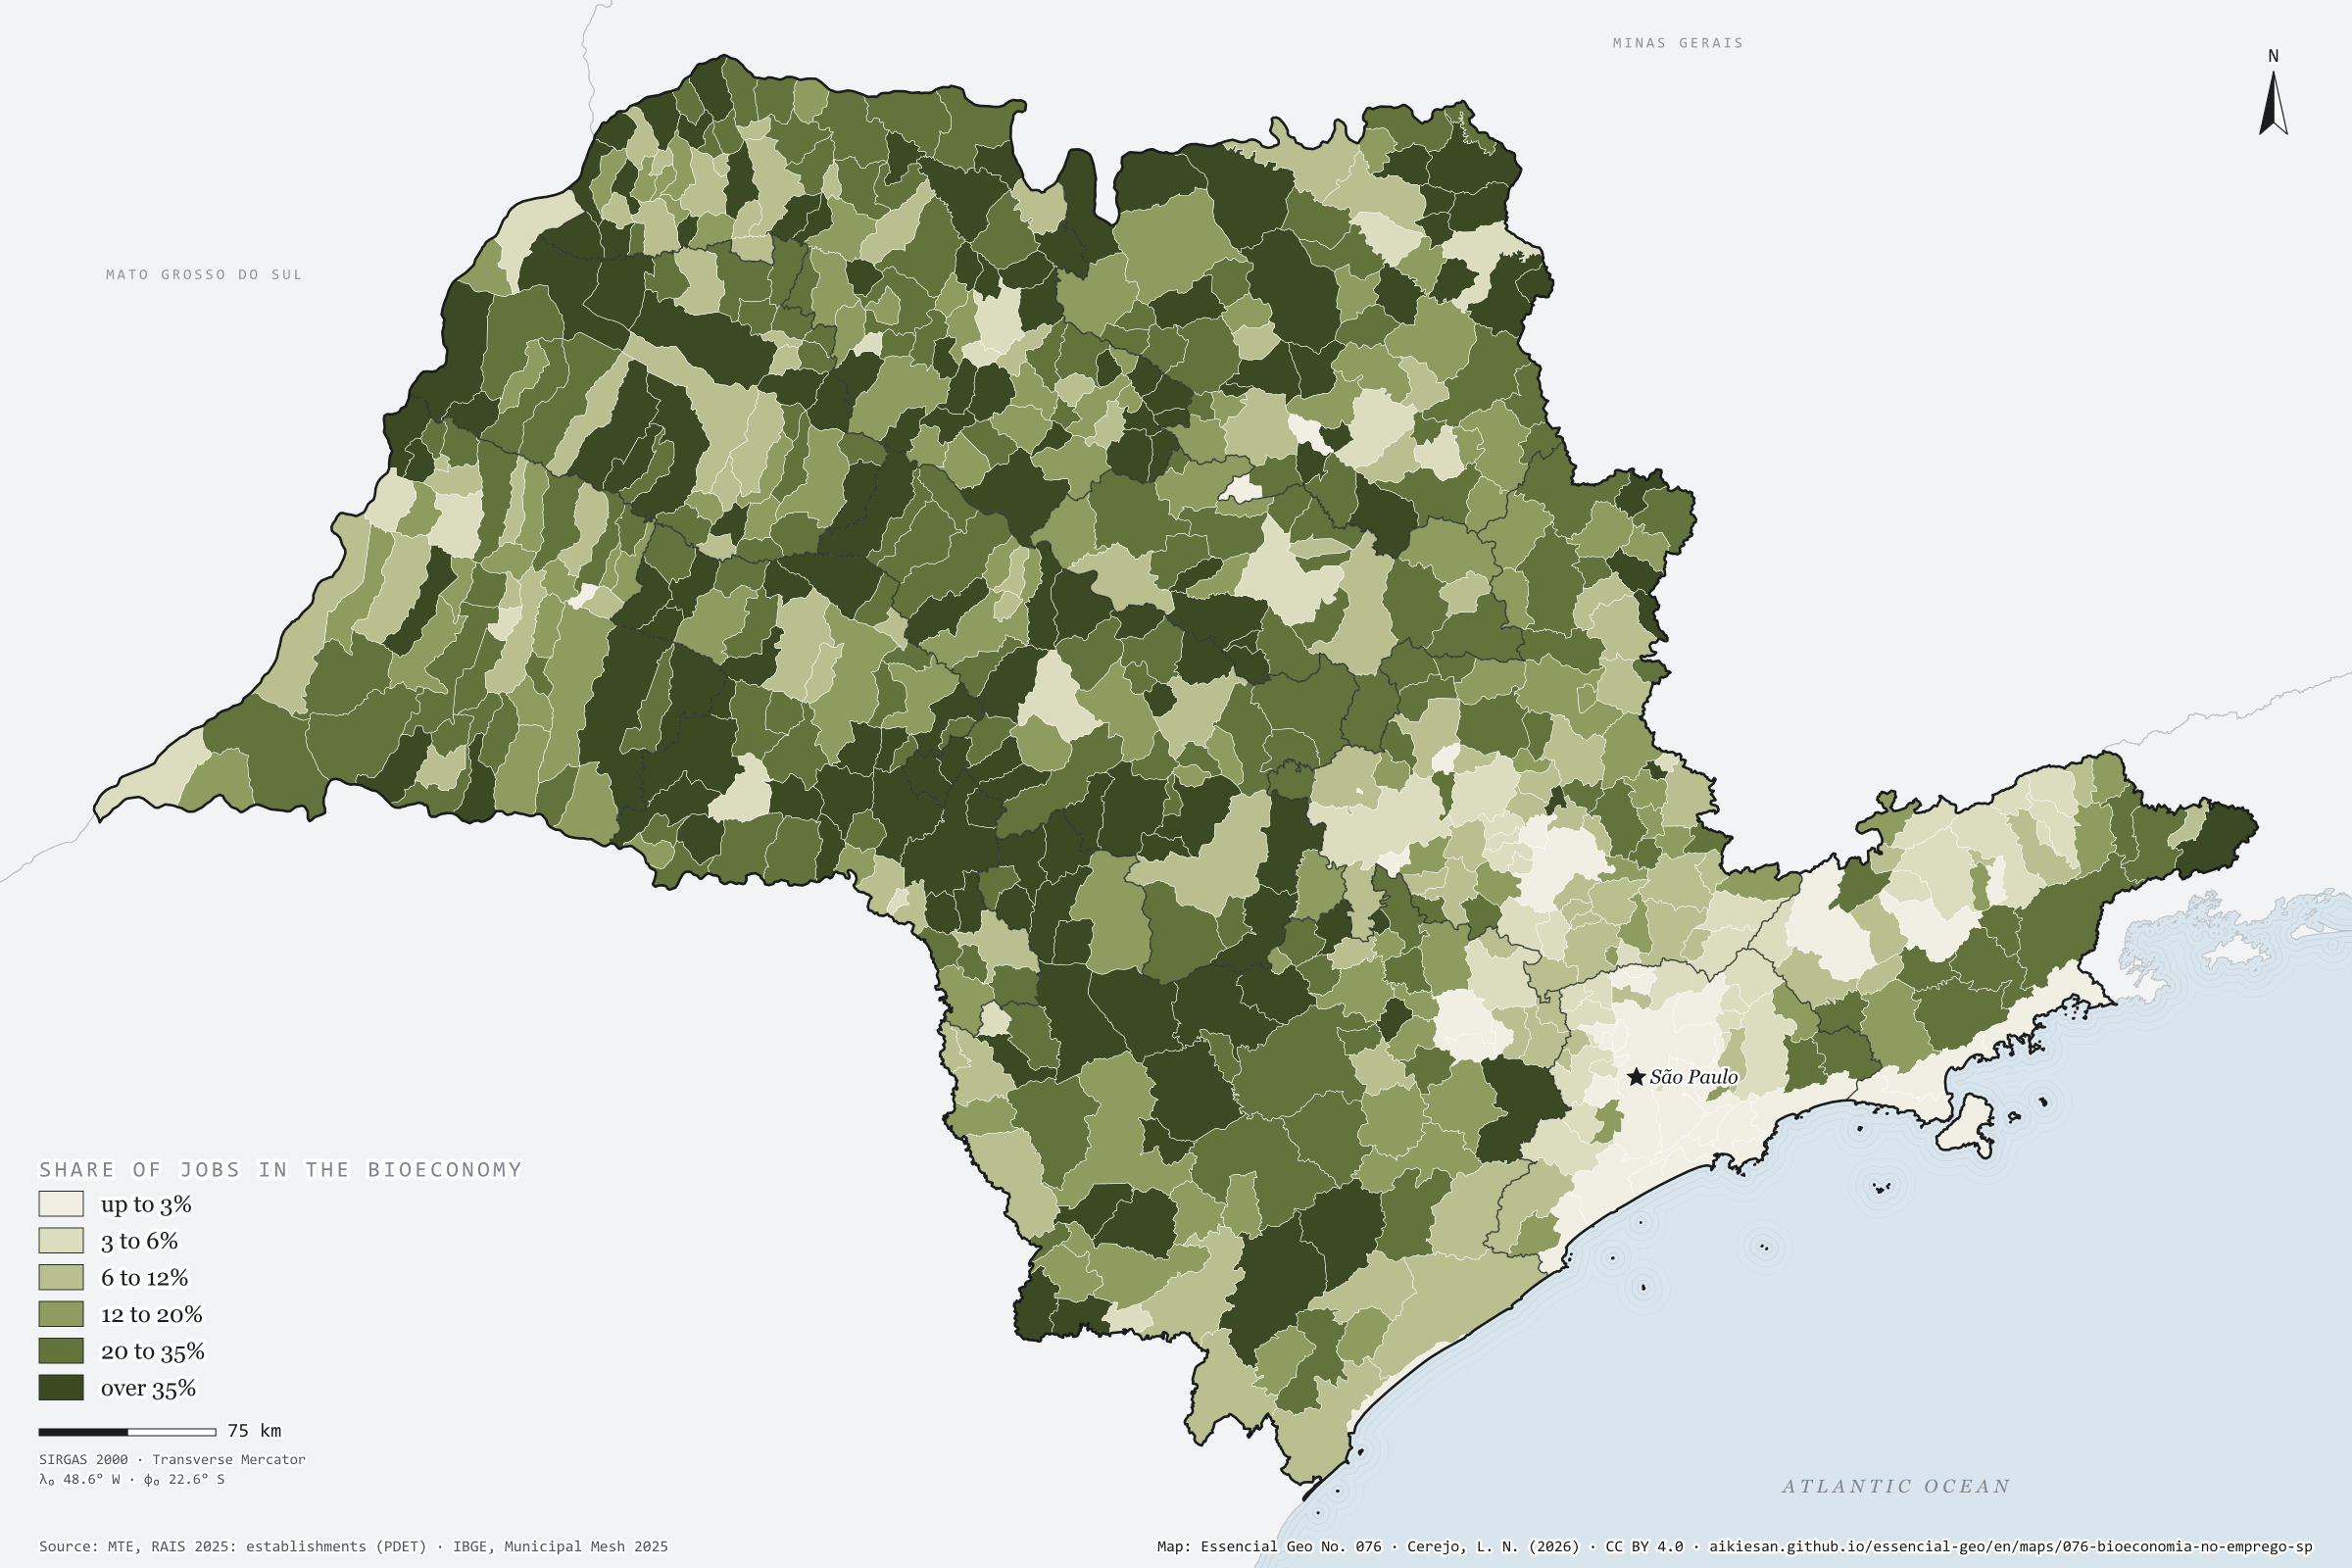
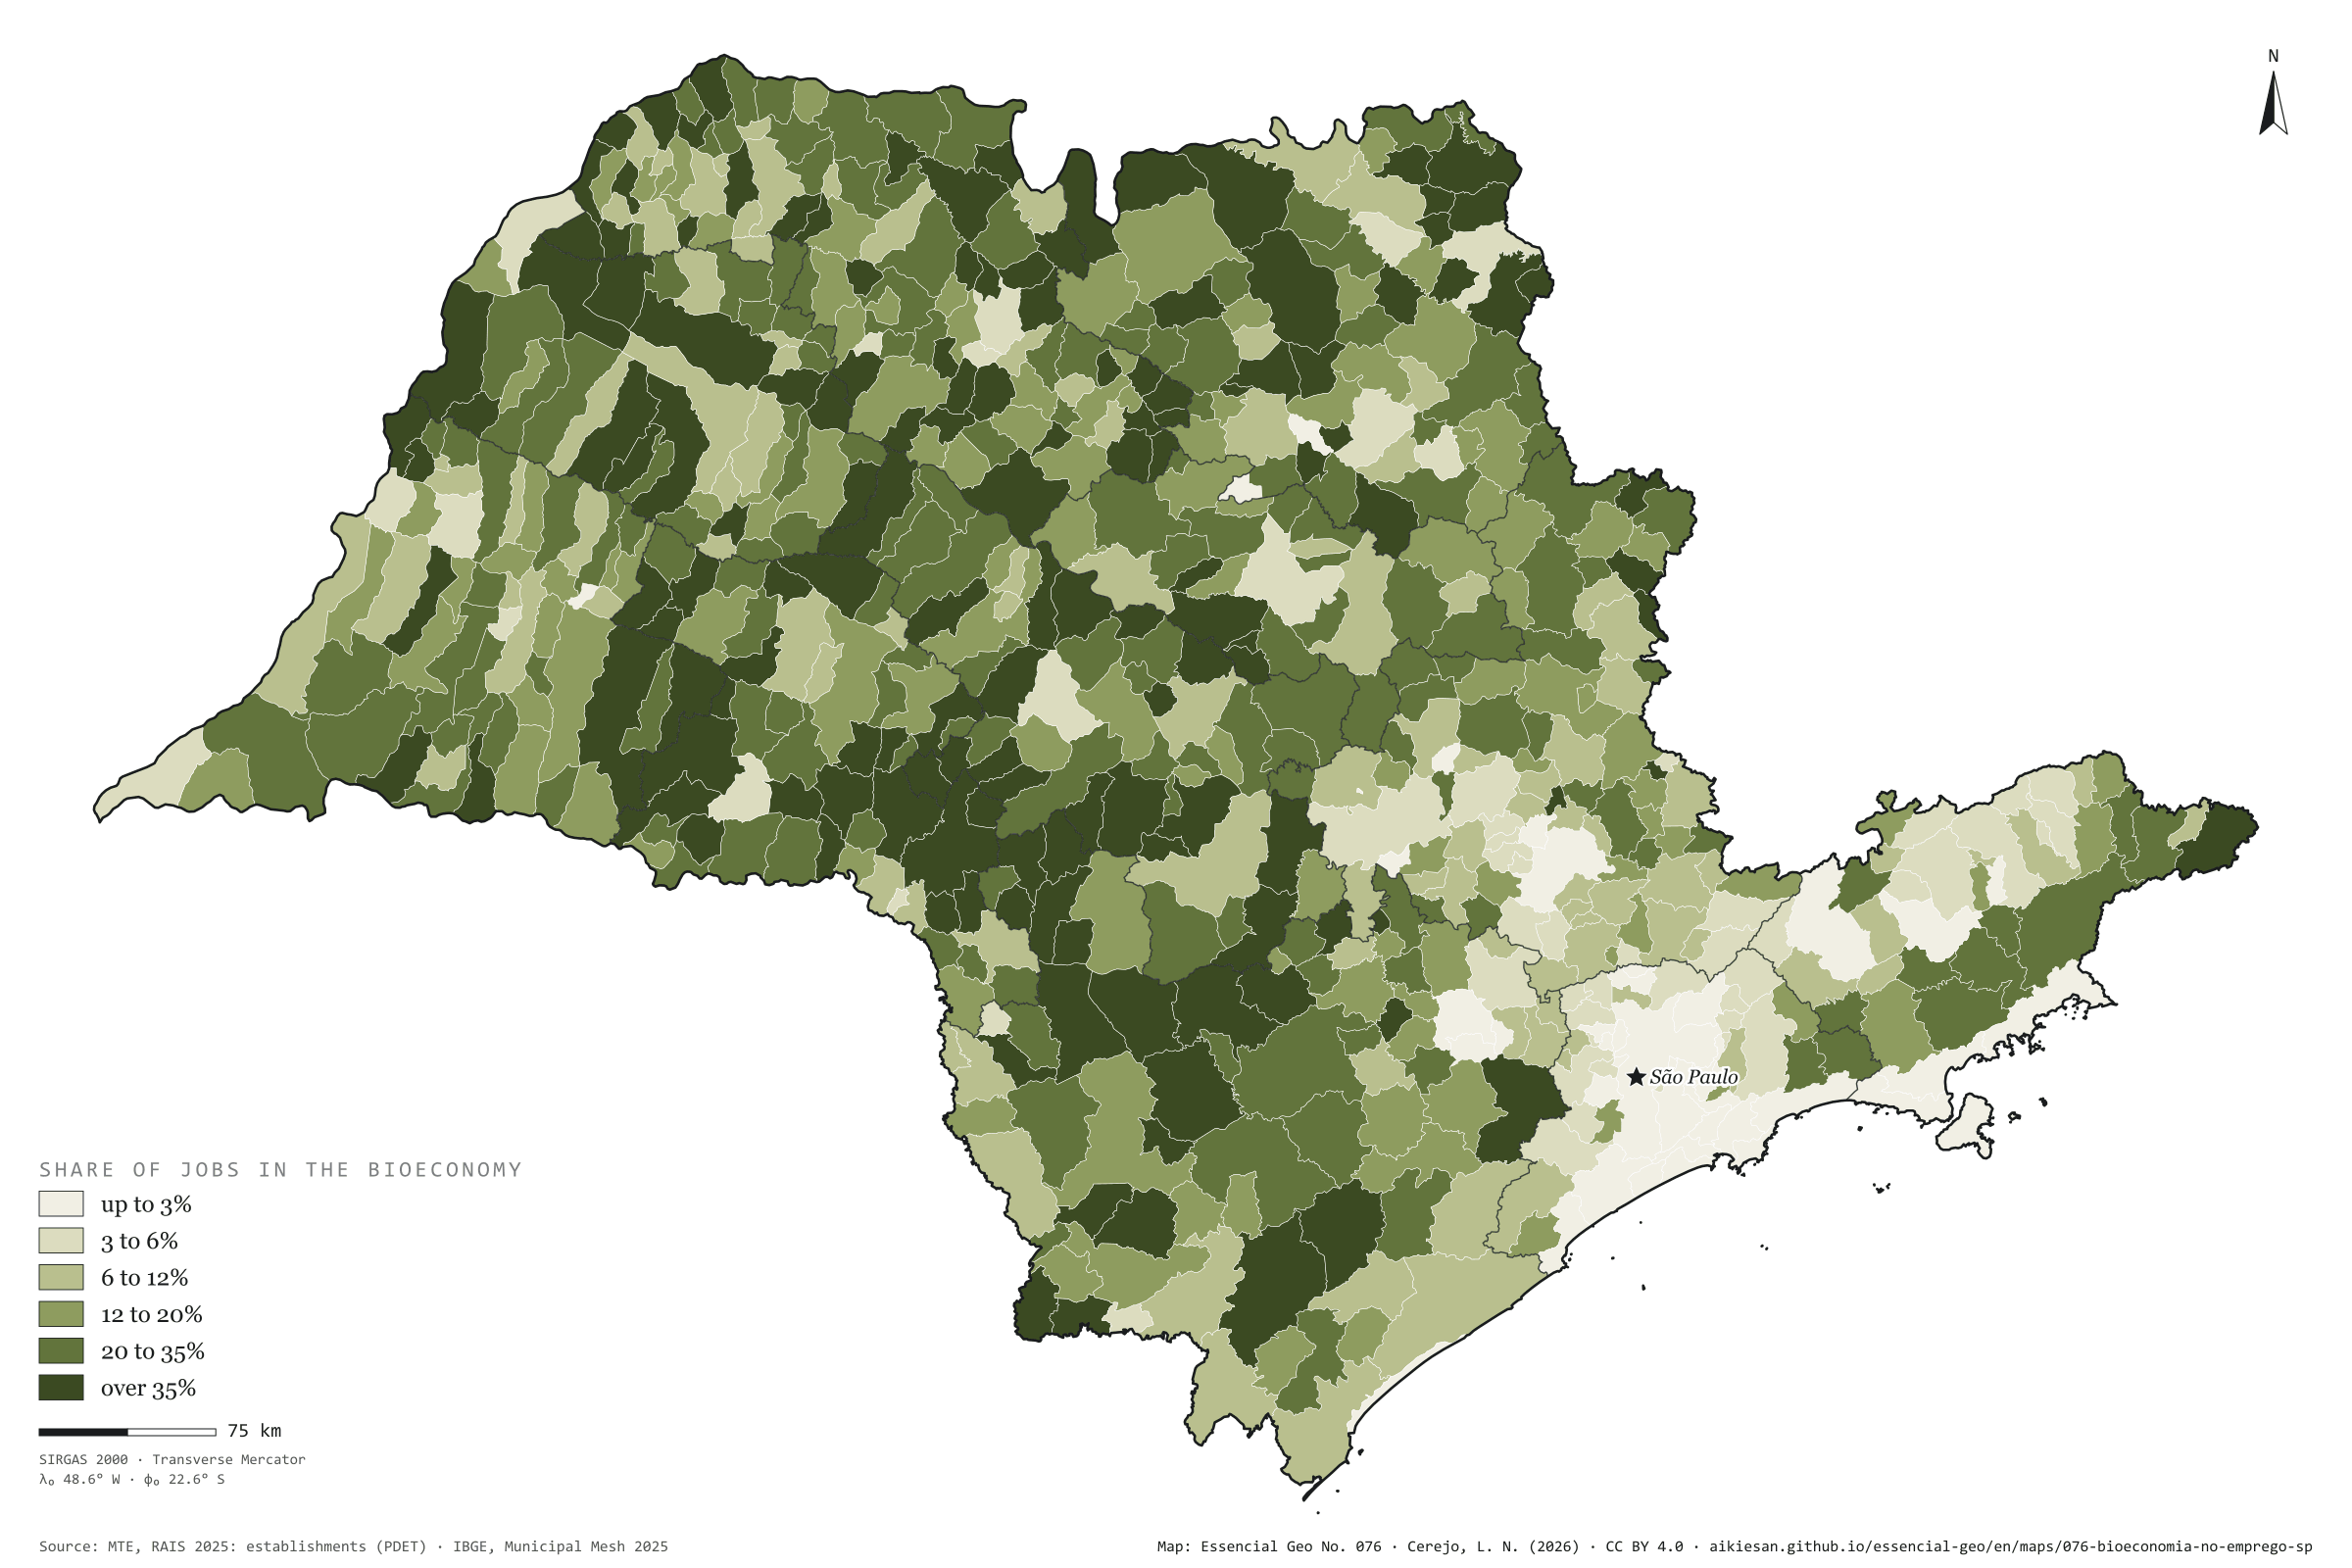
On 31 December 2025, 1.05 million formal jobs in São Paulo were in the bioeconomy: in farming, fishing and forestry, and in the industries that wholly convert biomass, such as food, drink, wood, paper, natural fibres, leather and biofuels. This is the scope the European Commission’s Joint Research Centre (JRC) uses to measure the European Union’s bioeconomy. They are 6.5% of the state’s 16.16 million jobs, below Brazil’s 7.9%, yet SP holds 22% of the country’s formal bioeconomy. The share grows westwards: 20.7% in the Marília region, 1.7% in the São Paulo region. In 146 municipalities over 35% of formal jobs come from biomass; in Planalto, 80%. The capital has the largest number, 66,000 jobs, but only 1.2% of its own. First plate of the collection “The bioeconomy at work”.
Technical record · downloads · citation
At a glance
Bioeconomy jobs by the bioeconomy’s share of the municipality’s jobs (jobs)
up to 3%12.6%
3 to 6%10.4%
6 to 12%15.8%
12 to 20%14.9%
20 to 35%20.5%
over 35%25.9%
Formal jobs in the bioeconomy
6.5%
1.05 million jobs; Brazil, 7.9%
SP’s share of Brazil’s formal bioeconomy
22%
of 4.74 million jobs
Layers
municipiospolygon645 municipalities: jobs, bioeconomy jobs by segment, share and location quotient, organic-waste-generating industries, waste and sewage, CP2B biomethane potential and population
regioes_intermediariaspolygon11 intermediate geographic regions
Active jobs on 31/12/2025 in the bioeconomy’s CNAE subclasses (farming, fishing and forestry; food, drink and tobacco; wood, paper and wooden furniture; natural fibres and leather; biofuels), within the European JRC scope, over all active jobs in each municipality, in six classes.
The map without a frame, with legend, scale, reference system and credit written on it: ready for papers, lectures and slides. In two versions: with the basemap (neighbours and sea) or only the mapped area, on white.
CEREJO, Lucas Nakamura. A bioeconomia no emprego: um em cada quinze empregos formais vem da biomassa. Versão 1.0.0. [S. l.]: Essencial, 2026. Conjunto de dados. Disponível em: https://aikiesan.github.io/essencial-geo/en/maps/076-bioeconomia-no-emprego-sp/. Acesso em: 10 nov. 2026.
Cerejo, L. N. (2026). A bioeconomia no emprego: um em cada quinze empregos formais vem da biomassa [The bioeconomy in jobs: One formal job in fifteen comes from biomass] (Version 1.0.0) [Data set]. Essencial. https://aikiesan.github.io/essencial-geo/en/maps/076-bioeconomia-no-emprego-sp/
@dataset{cerejo2026_bioeconomia_no_emprego_sp,
  author    = {Cerejo, Lucas Nakamura},
  title     = {A bioeconomia no emprego: Um em cada quinze empregos formais vem da biomassa},
  year      = {2026},
  publisher = {Essencial},
  version   = {1.0.0},
  url       = {https://aikiesan.github.io/essencial-geo/en/maps/076-bioeconomia-no-emprego-sp/},
  language  = {portuguese},
  note      = {English title: The bioeconomy in jobs: One formal job in fifteen comes from biomass. Licence CC BY 4.0}
}
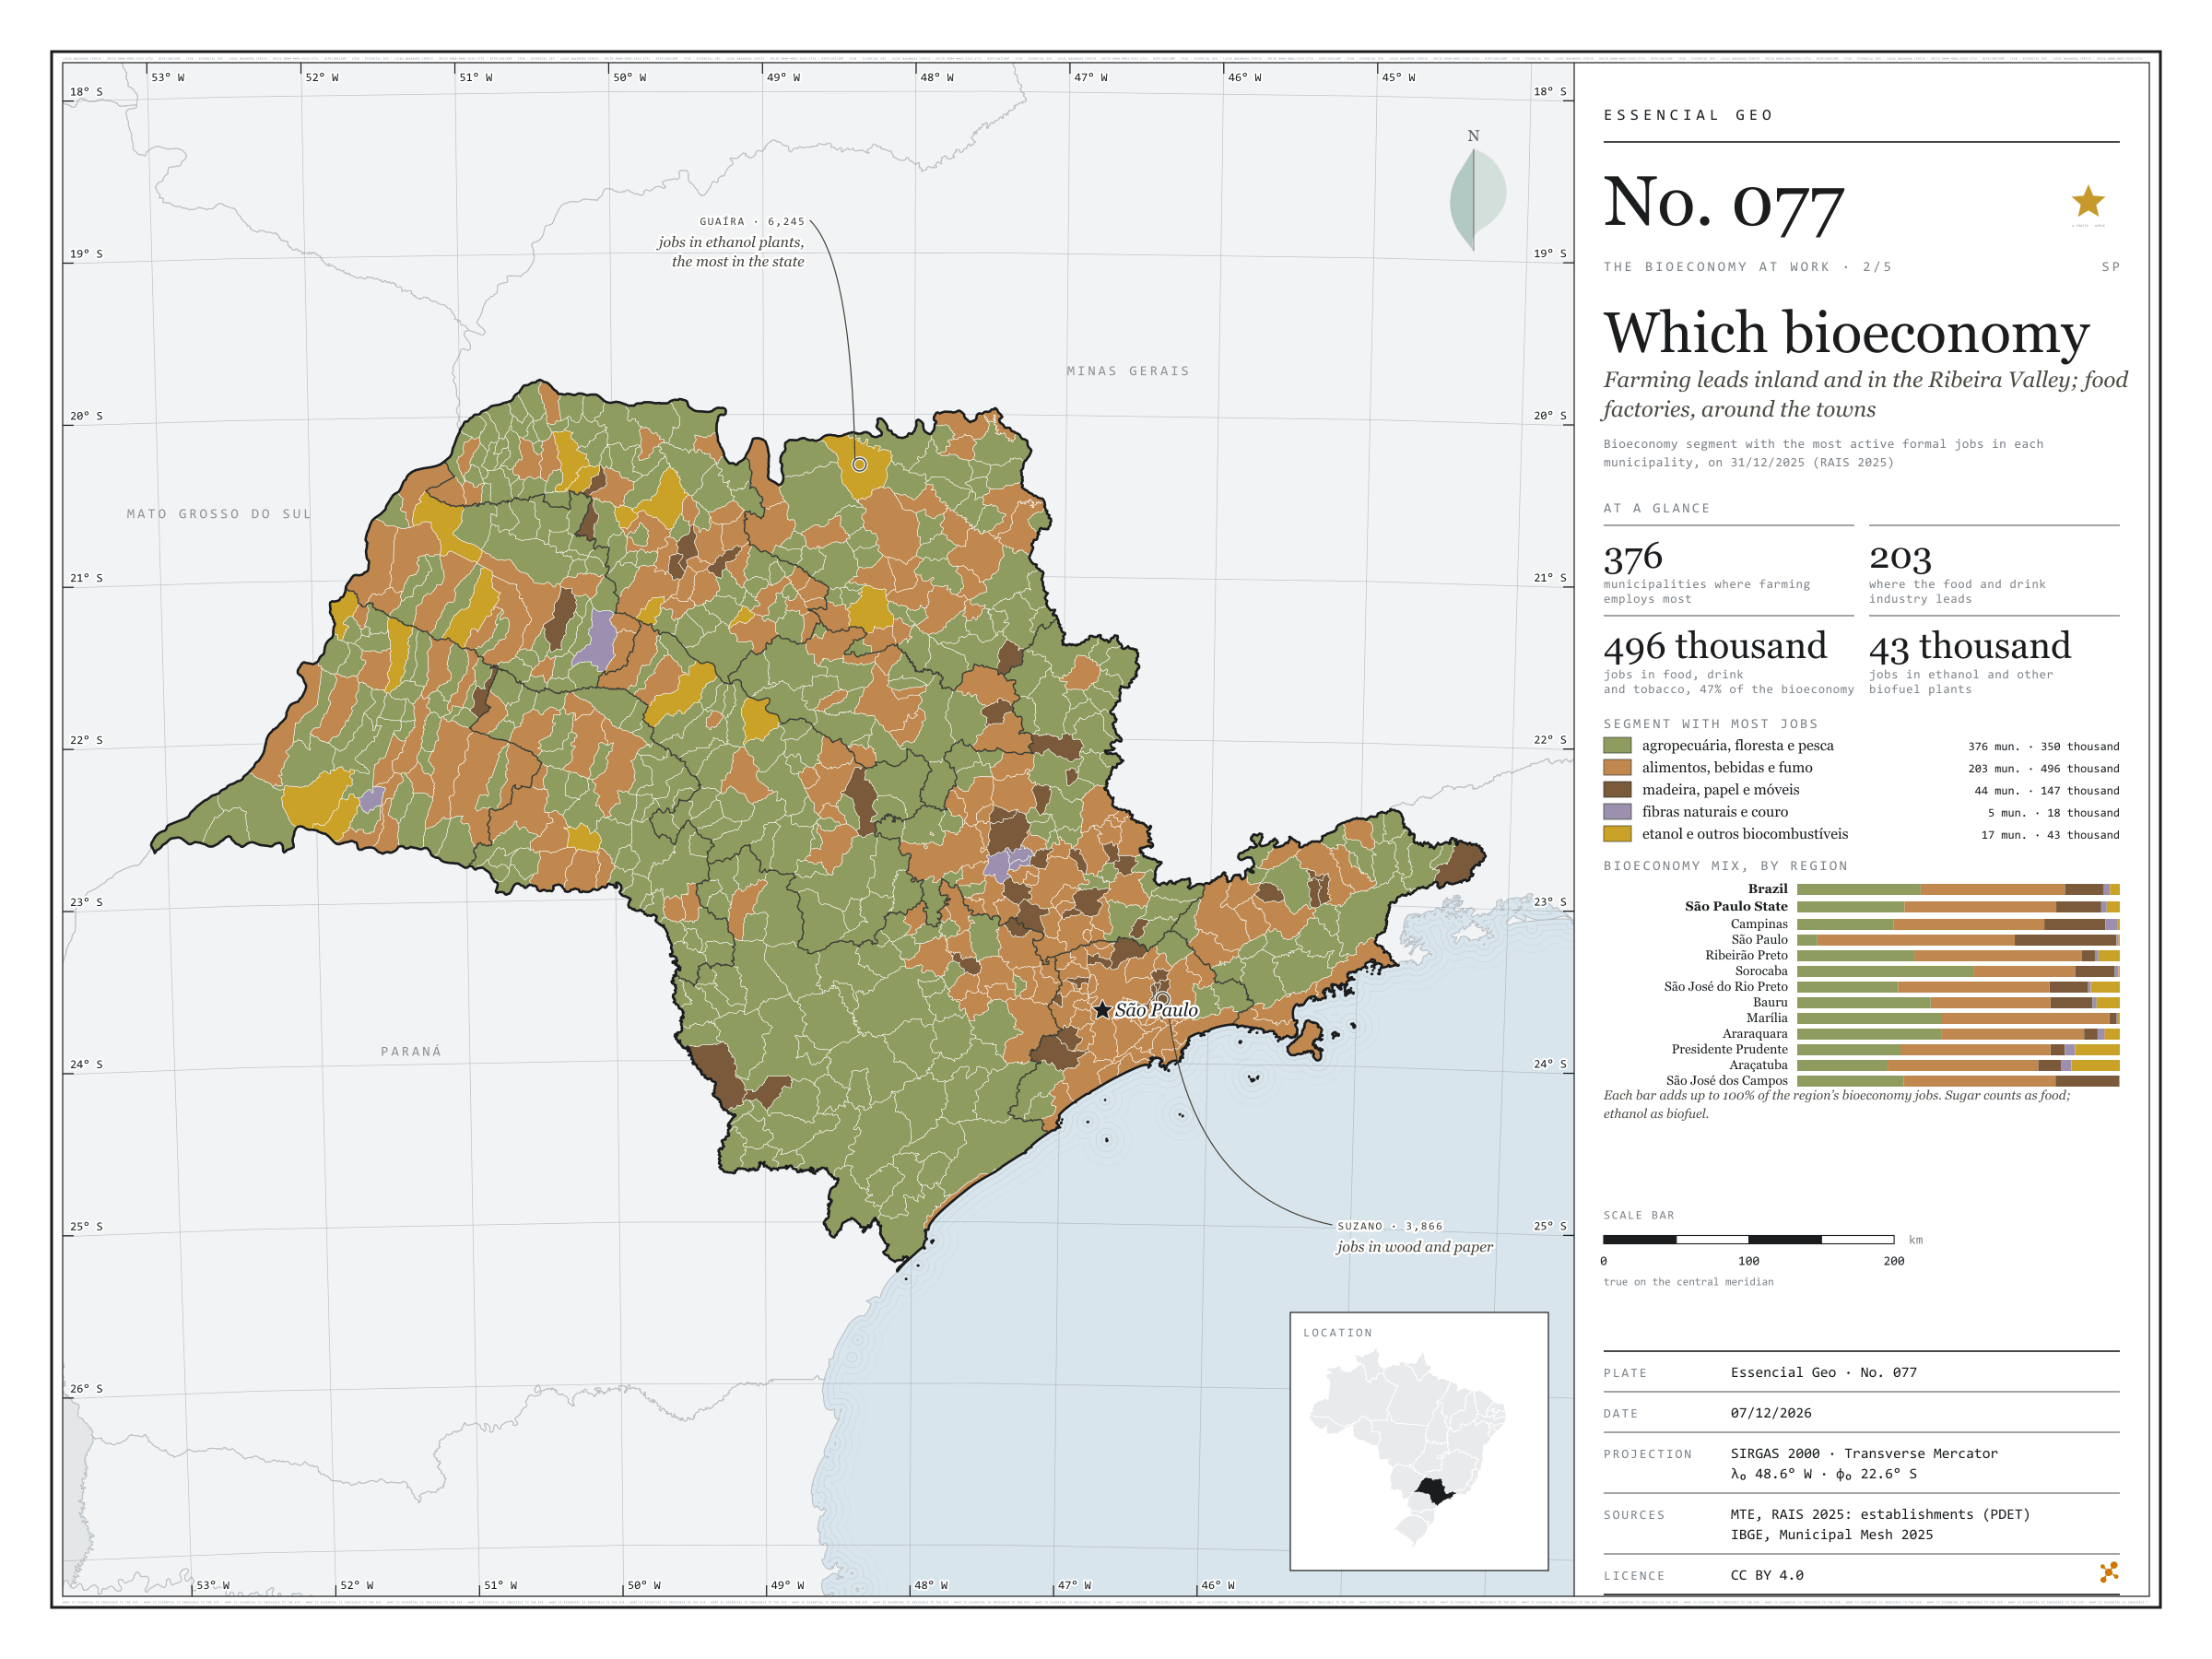
Farming leads inland and in the Ribeira Valley; food factories, around the towns
Fig. 077São Paulo State (SP)EPSG:4674Source: MTE/PDET, JRC (European Commission), IBGE
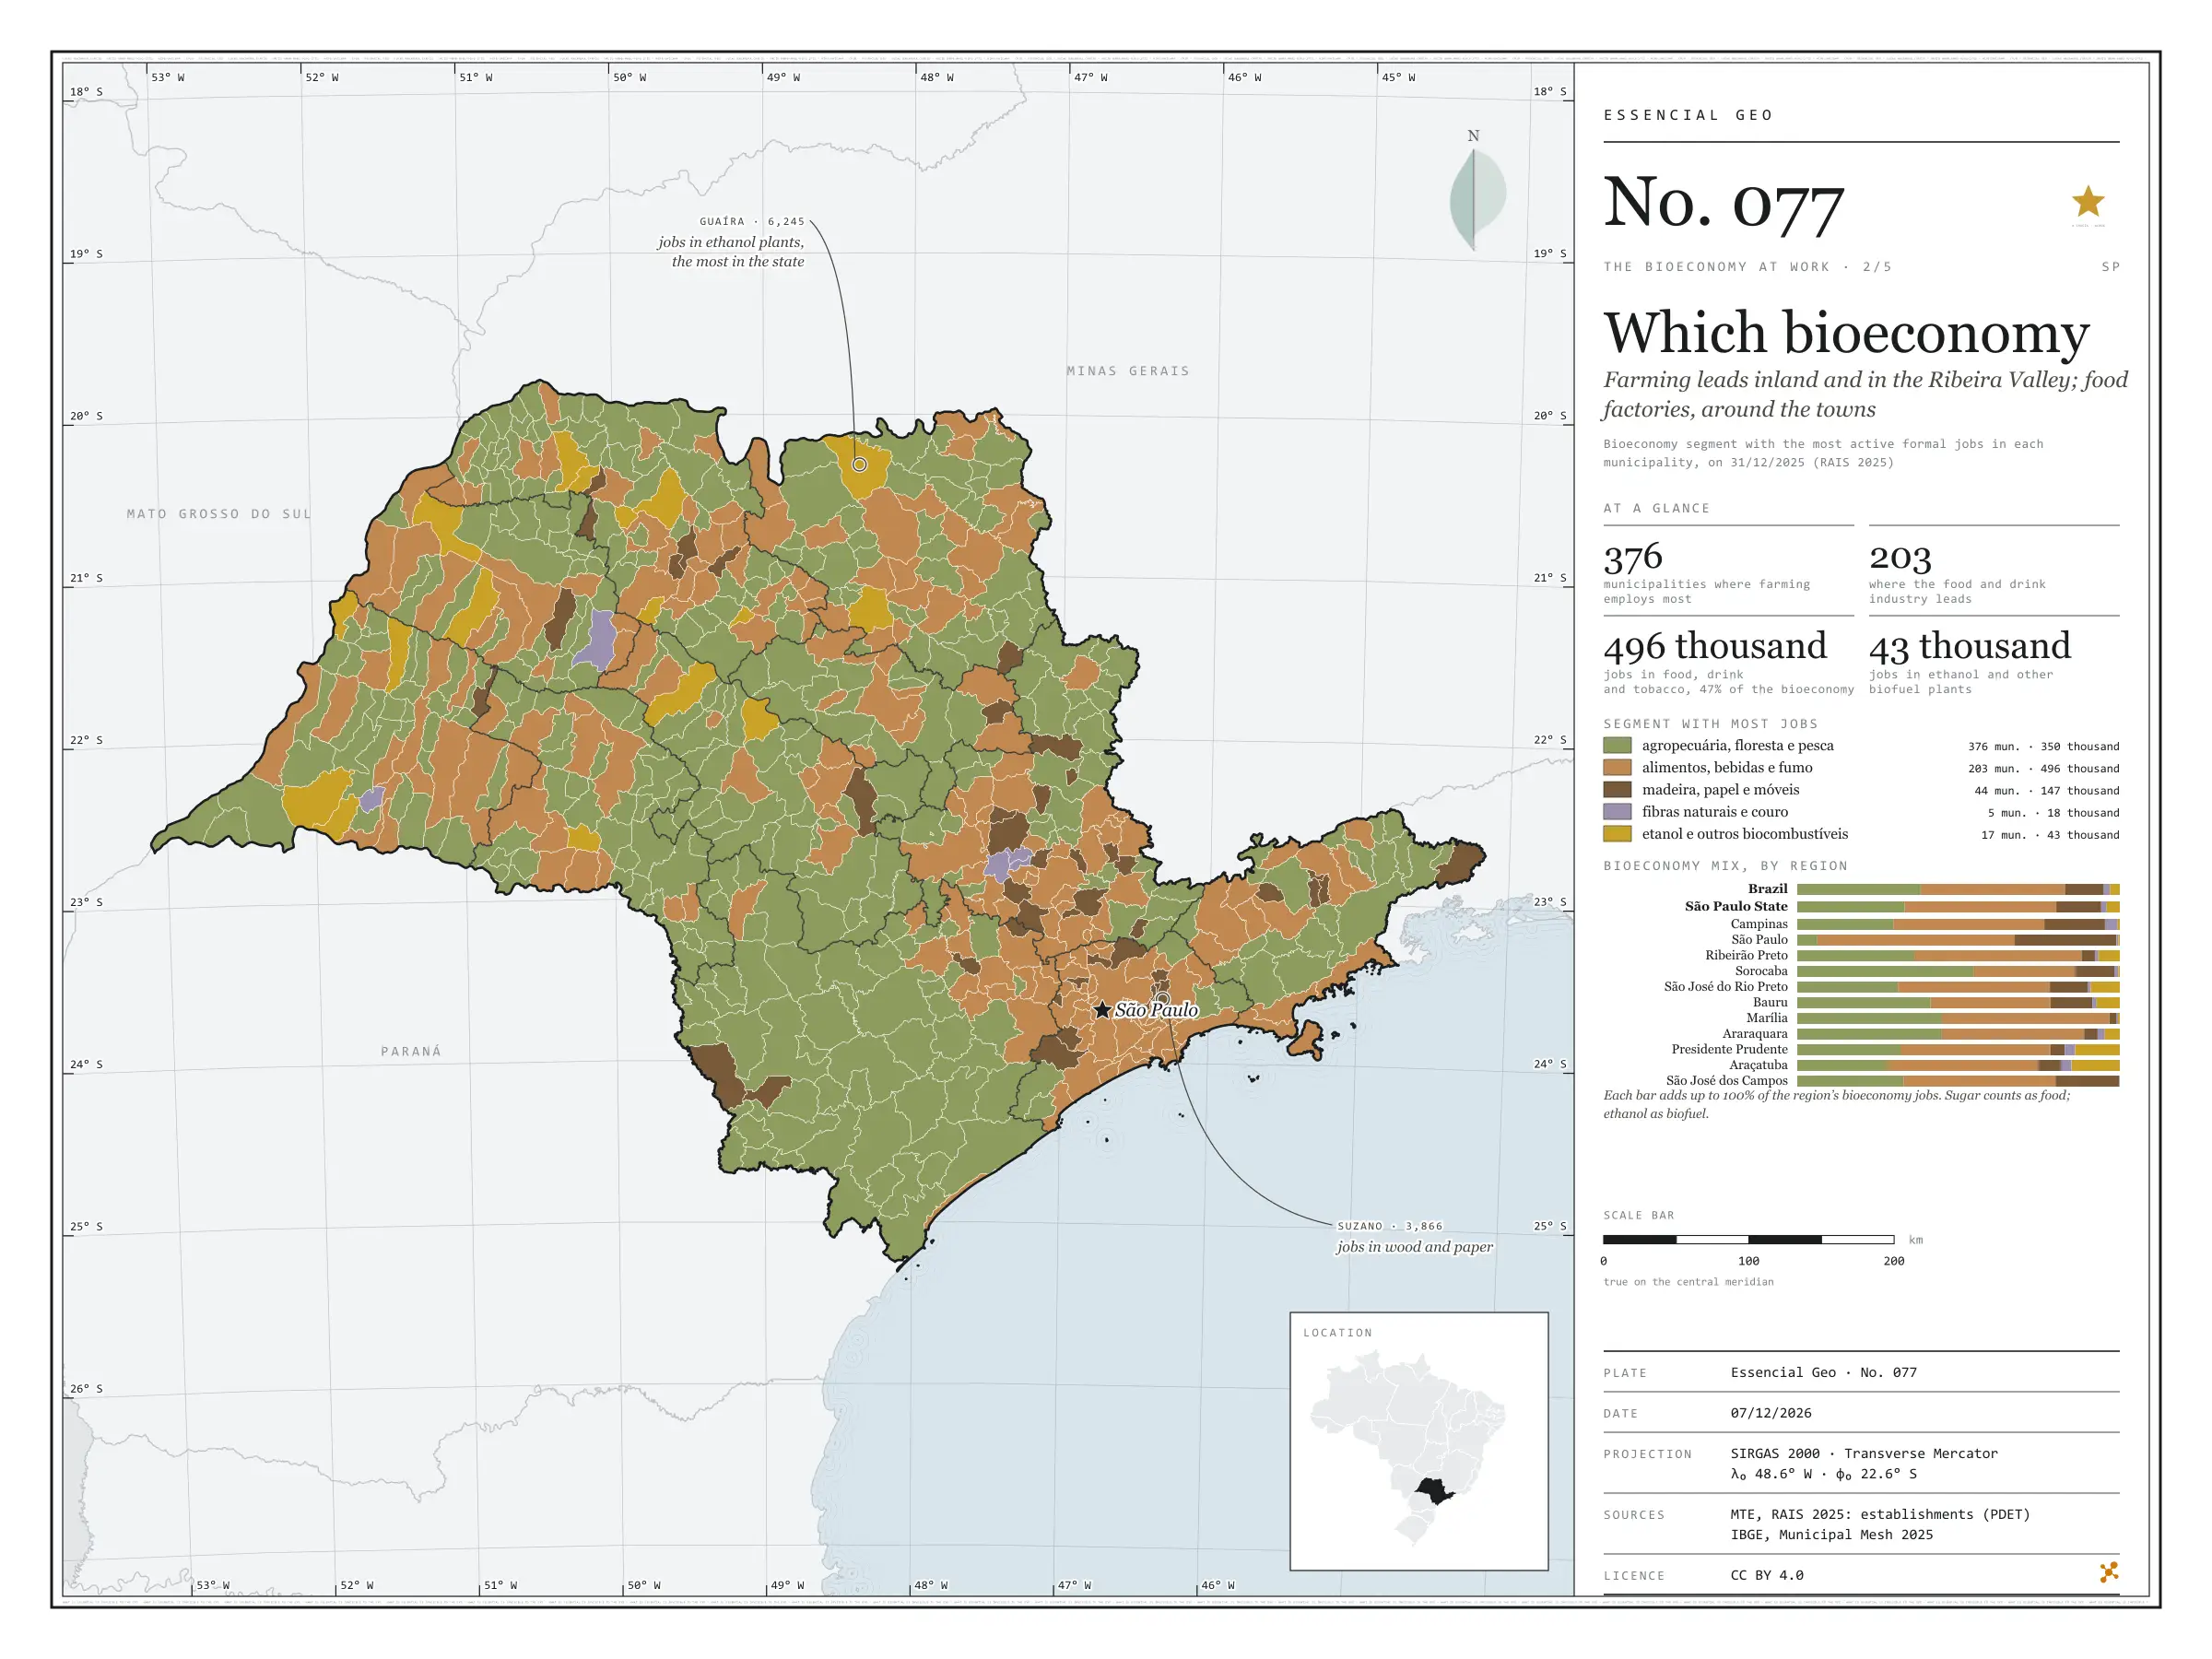
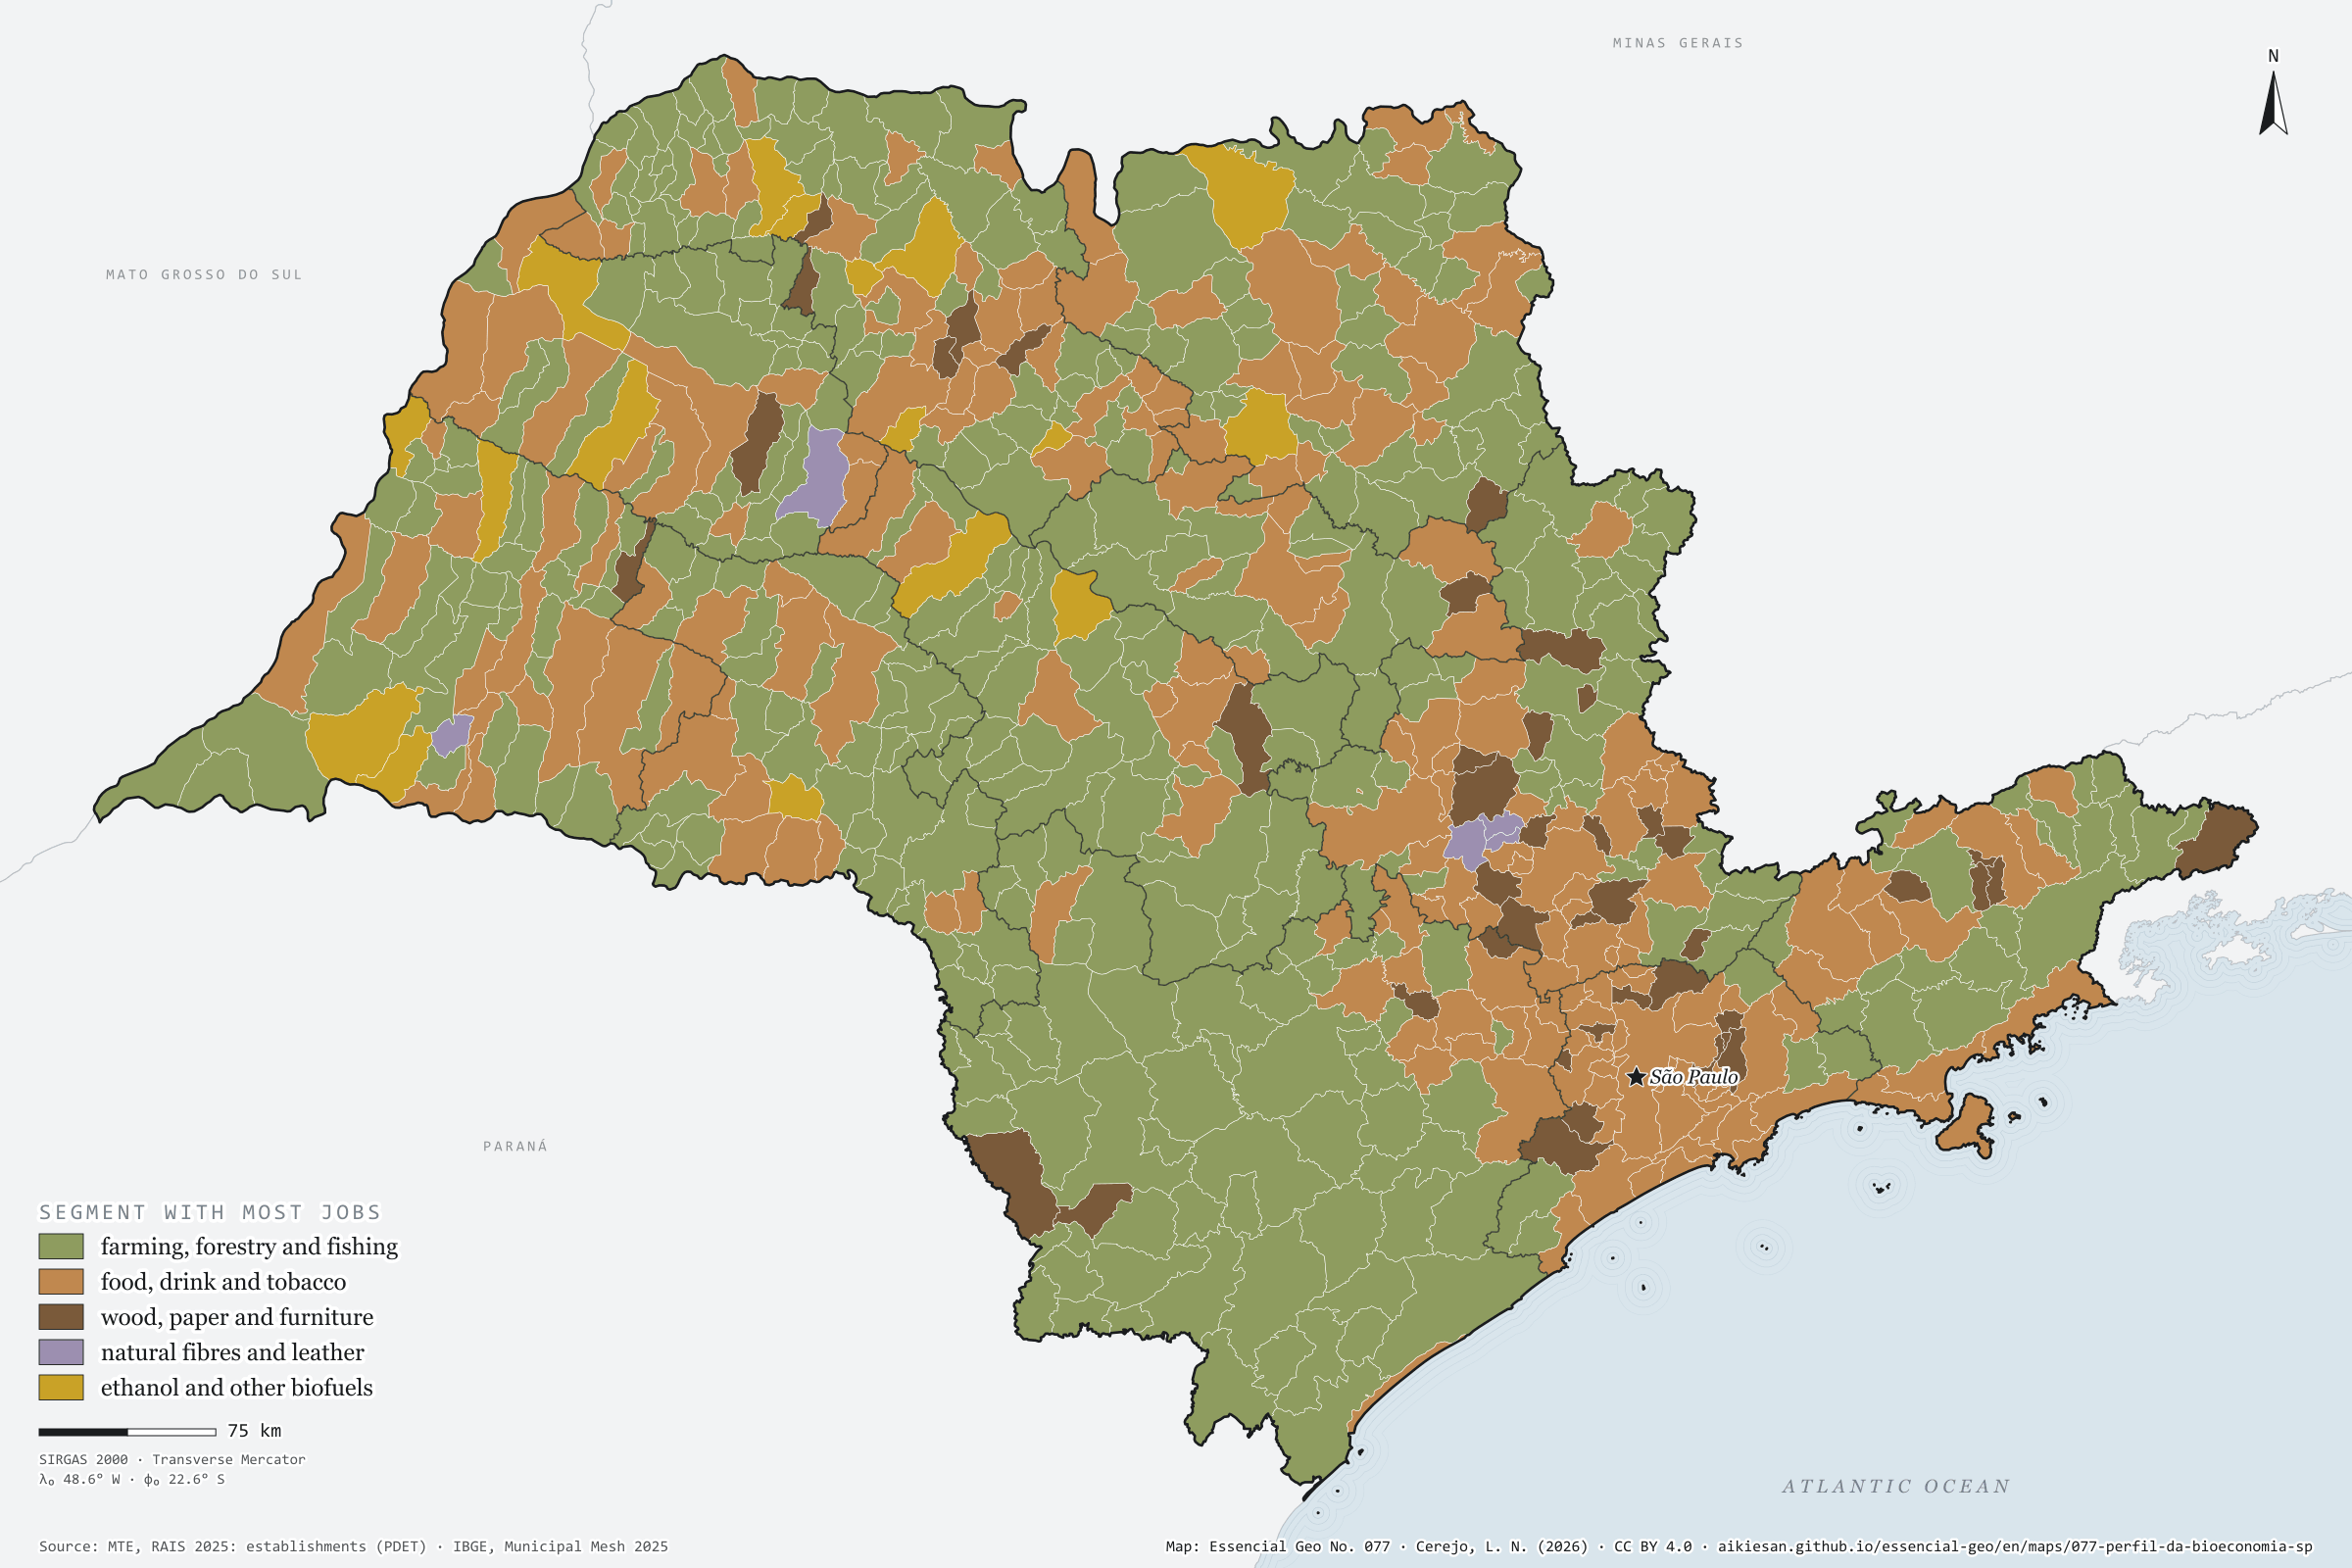
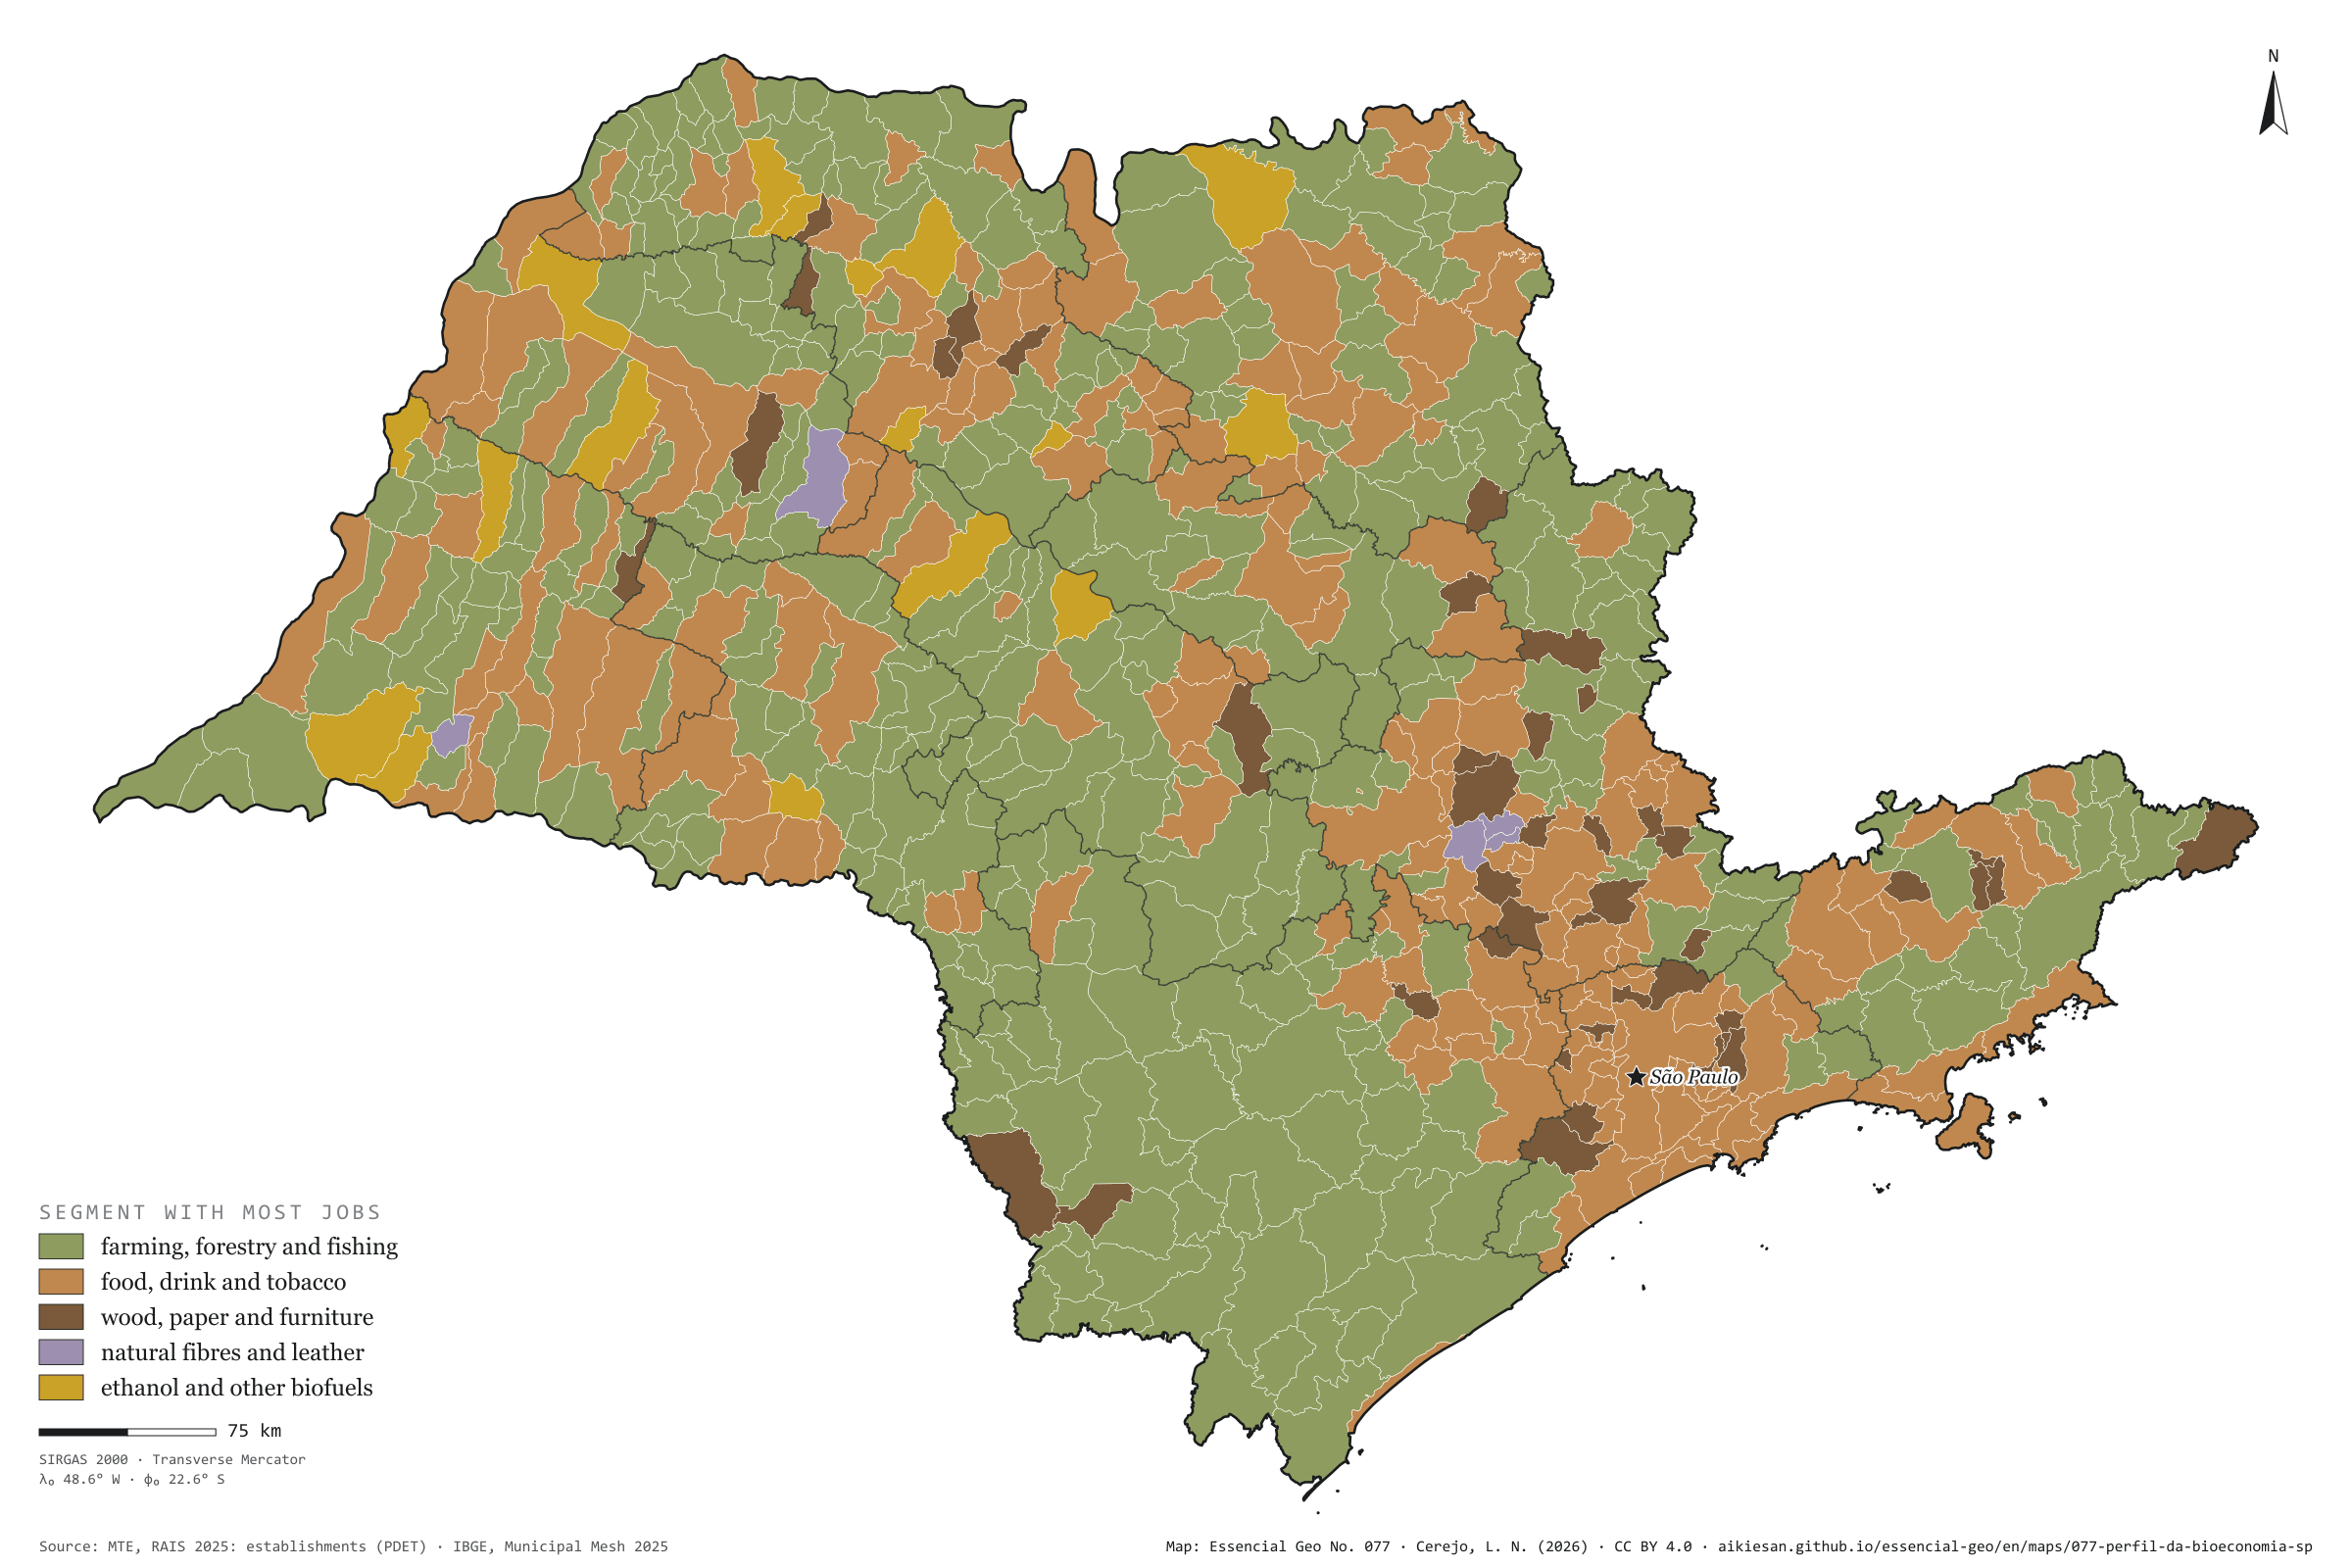
São Paulo’s bioeconomy is, above all, a food factory: food, drink and tobacco account for 496,000 of the 1.05 million formal jobs, 47%, against 45% in Brazil. Farming, fishing and forestry have 350,000, 33%, below the country’s 38%. Wood, paper and wooden furniture have 147,000; biofuels, 43,000; natural fibres and leather, 18,000. By municipality, farming leads in 376 of the 645, nearly all small, in the west and the Ribeira Valley. The food industry leads in 203, around the mid-sized towns and the metropolis. Wood and paper lead in 44, such as Suzano, with 3,866 jobs. Ethanol mills lead in 17, among them Guaíra, with 6,245 jobs in biofuels. Fibres and leather lead in 5. Second plate of the collection “The bioeconomy at work”.
Technical record · downloads · citation
At a glance
Bioeconomy jobs by segment (jobs)
Food, drink and tobacco47.1%
Farming, fishing and forestry33.2%
Wood and paper13.9%
Biofuels4%
Fibres and leather1.7%
Municipalities where farming is the segment with most jobs
376municipalities
of 645; food leads in 203
Layers
municipiospolygon645 municipalities: bioeconomy jobs by segment and dominant segment (same GPKG as plate 076)
regioes_intermediariaspolygon11 intermediate geographic regions
Bioeconomy active jobs on 31/12/2025, within the European JRC scope, split into five segments by CNAE subclass; each municipality takes the colour of the segment with most jobs.
The map without a frame, with legend, scale, reference system and credit written on it: ready for papers, lectures and slides. In two versions: with the basemap (neighbours and sea) or only the mapped area, on white.
CEREJO, Lucas Nakamura. Que bioeconomia: o campo lidera no interior e no Vale do Ribeira; a fábrica de alimentos, em volta das cidades. Versão 1.0.0. [S. l.]: Essencial, 2026. Conjunto de dados. Disponível em: https://aikiesan.github.io/essencial-geo/en/maps/077-perfil-da-bioeconomia-sp/. Acesso em: 10 nov. 2026.
Cerejo, L. N. (2026). Que bioeconomia: o campo lidera no interior e no Vale do Ribeira; a fábrica de alimentos, em volta das cidades [Which bioeconomy: Farming leads inland and in the Ribeira Valley; food factories, around the towns] (Version 1.0.0) [Data set]. Essencial. https://aikiesan.github.io/essencial-geo/en/maps/077-perfil-da-bioeconomia-sp/
@dataset{cerejo2026_perfil_da_bioeconomia_sp,
  author    = {Cerejo, Lucas Nakamura},
  title     = {Que bioeconomia: O campo lidera no interior e no Vale do Ribeira; a fábrica de alimentos, em volta das cidades},
  year      = {2026},
  publisher = {Essencial},
  version   = {1.0.0},
  url       = {https://aikiesan.github.io/essencial-geo/en/maps/077-perfil-da-bioeconomia-sp/},
  language  = {portuguese},
  note      = {English title: Which bioeconomy: Farming leads inland and in the Ribeira Valley; food factories, around the towns. Licence CC BY 4.0}
}
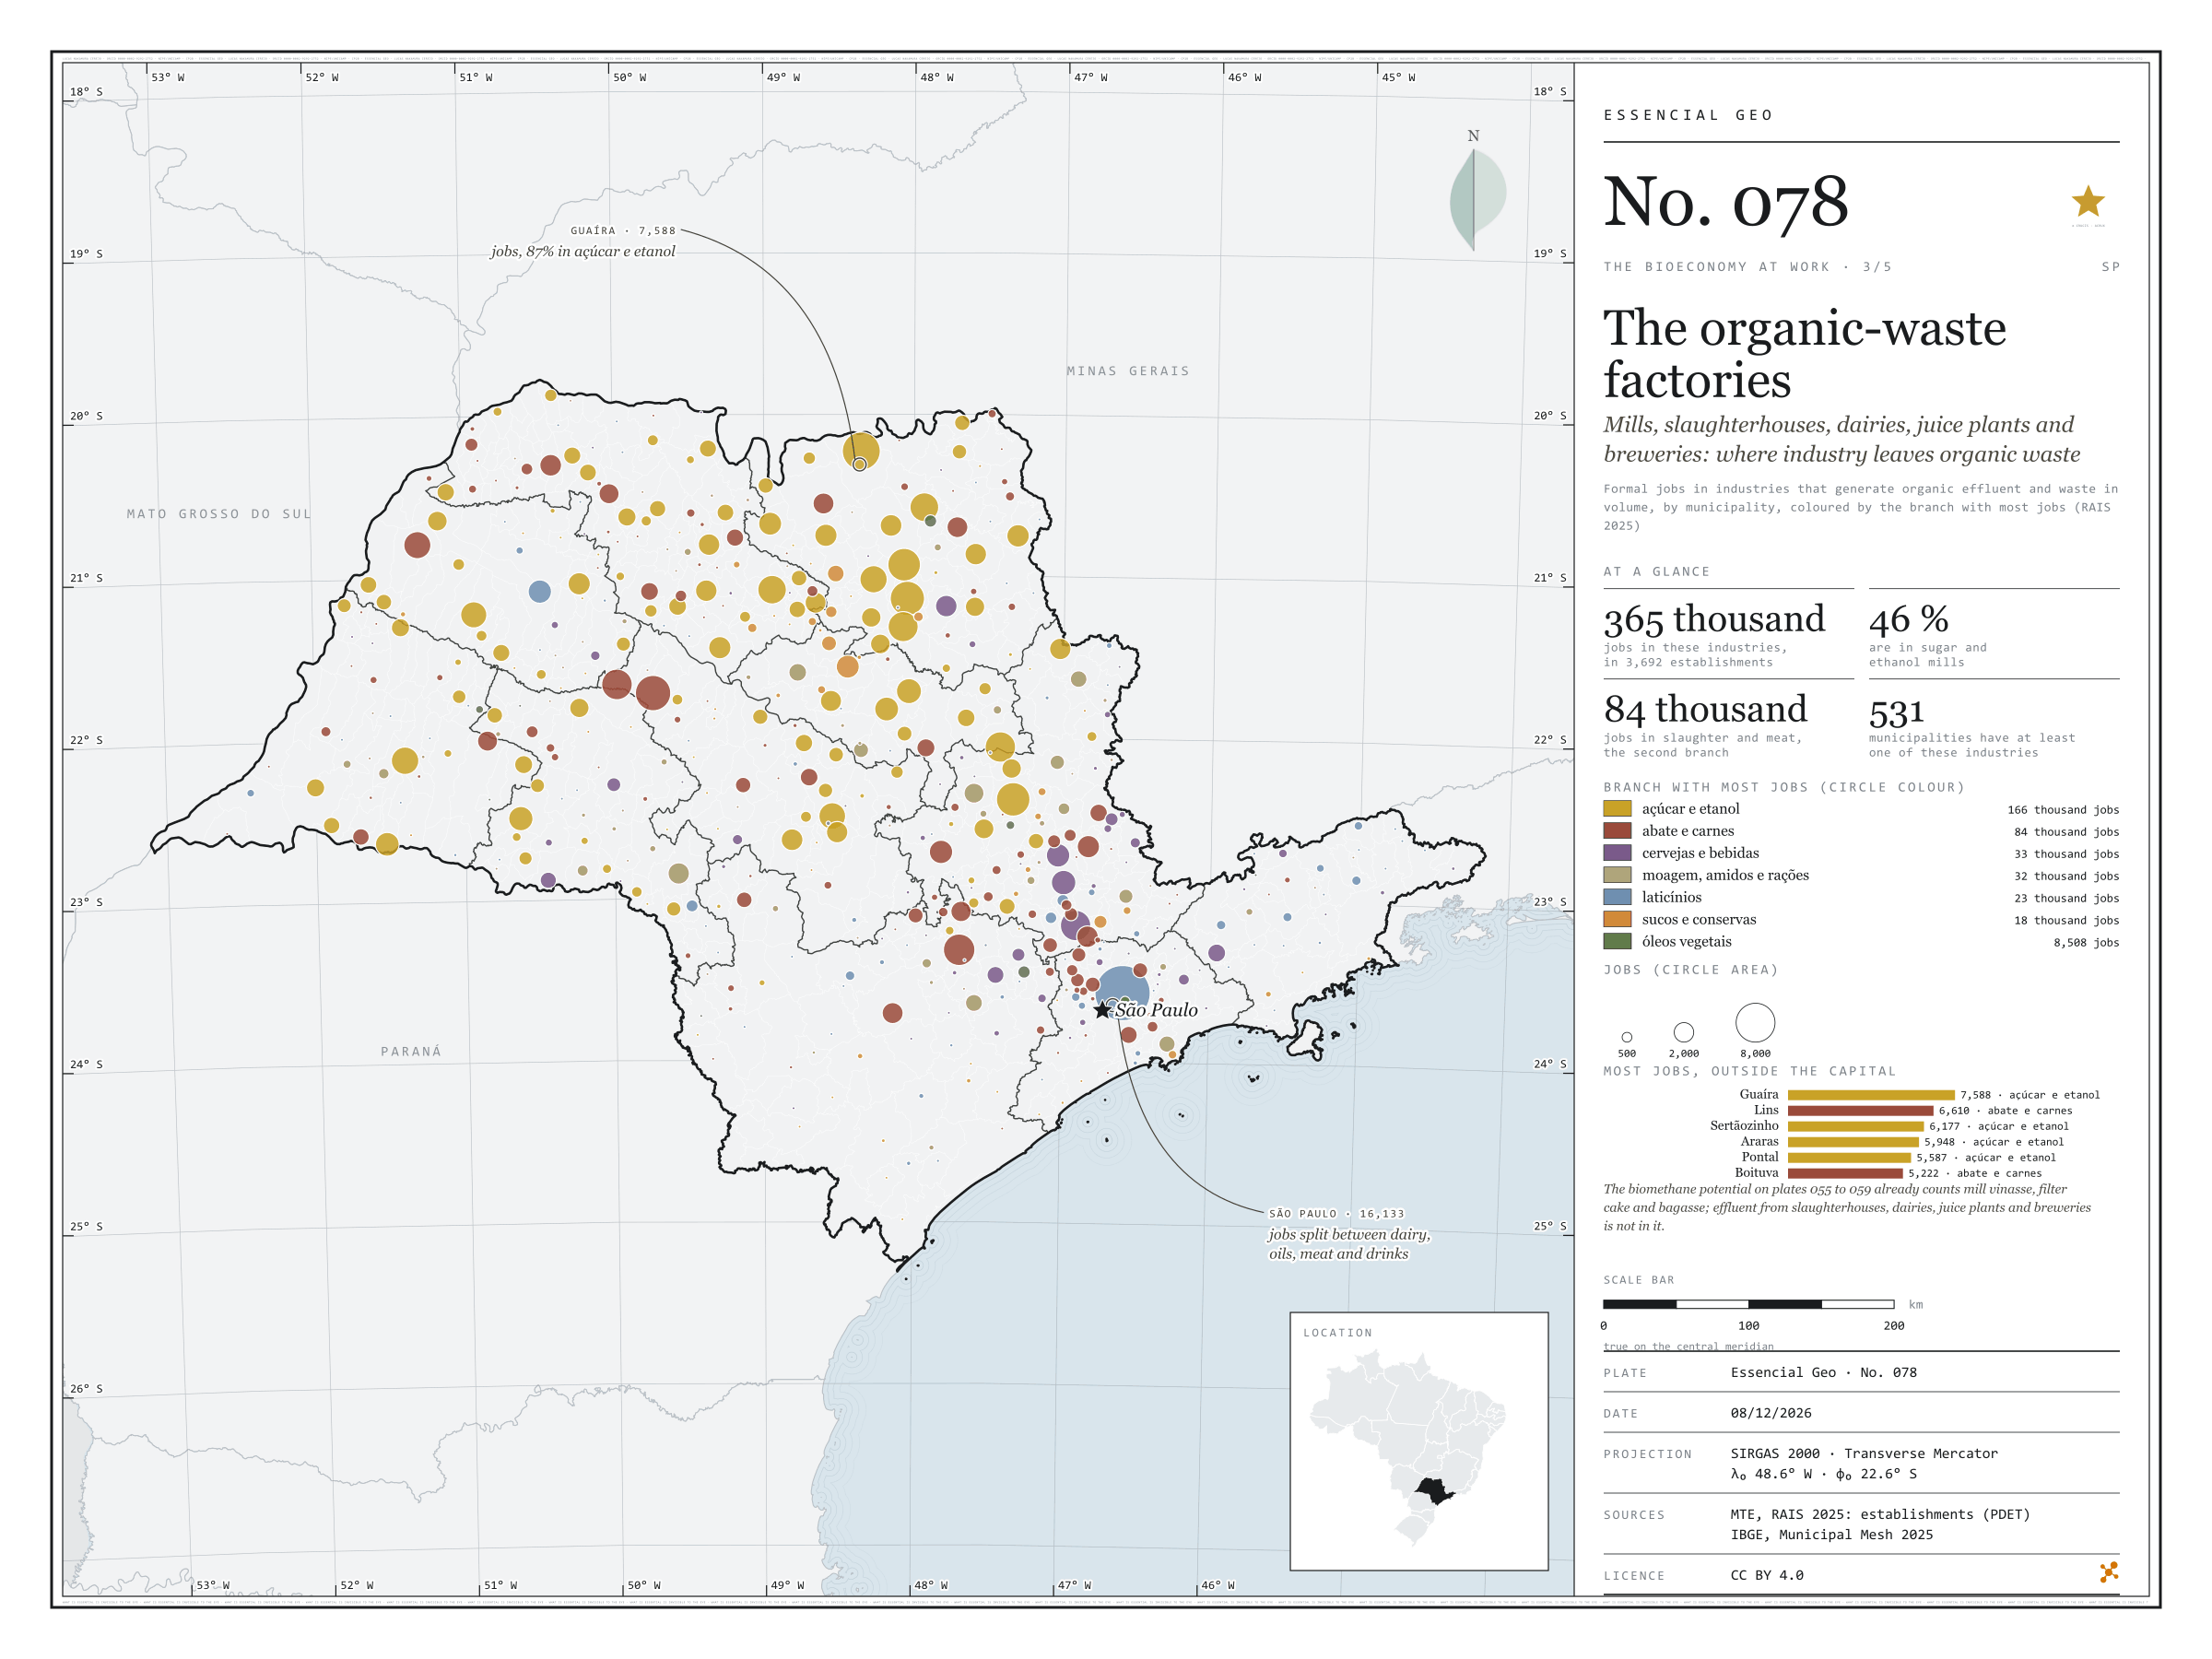
Mills, slaughterhouses, dairies, juice plants and breweries: where industry leaves organic waste
Fig. 078São Paulo State (SP)EPSG:4674Source: MTE/PDET, IBGE
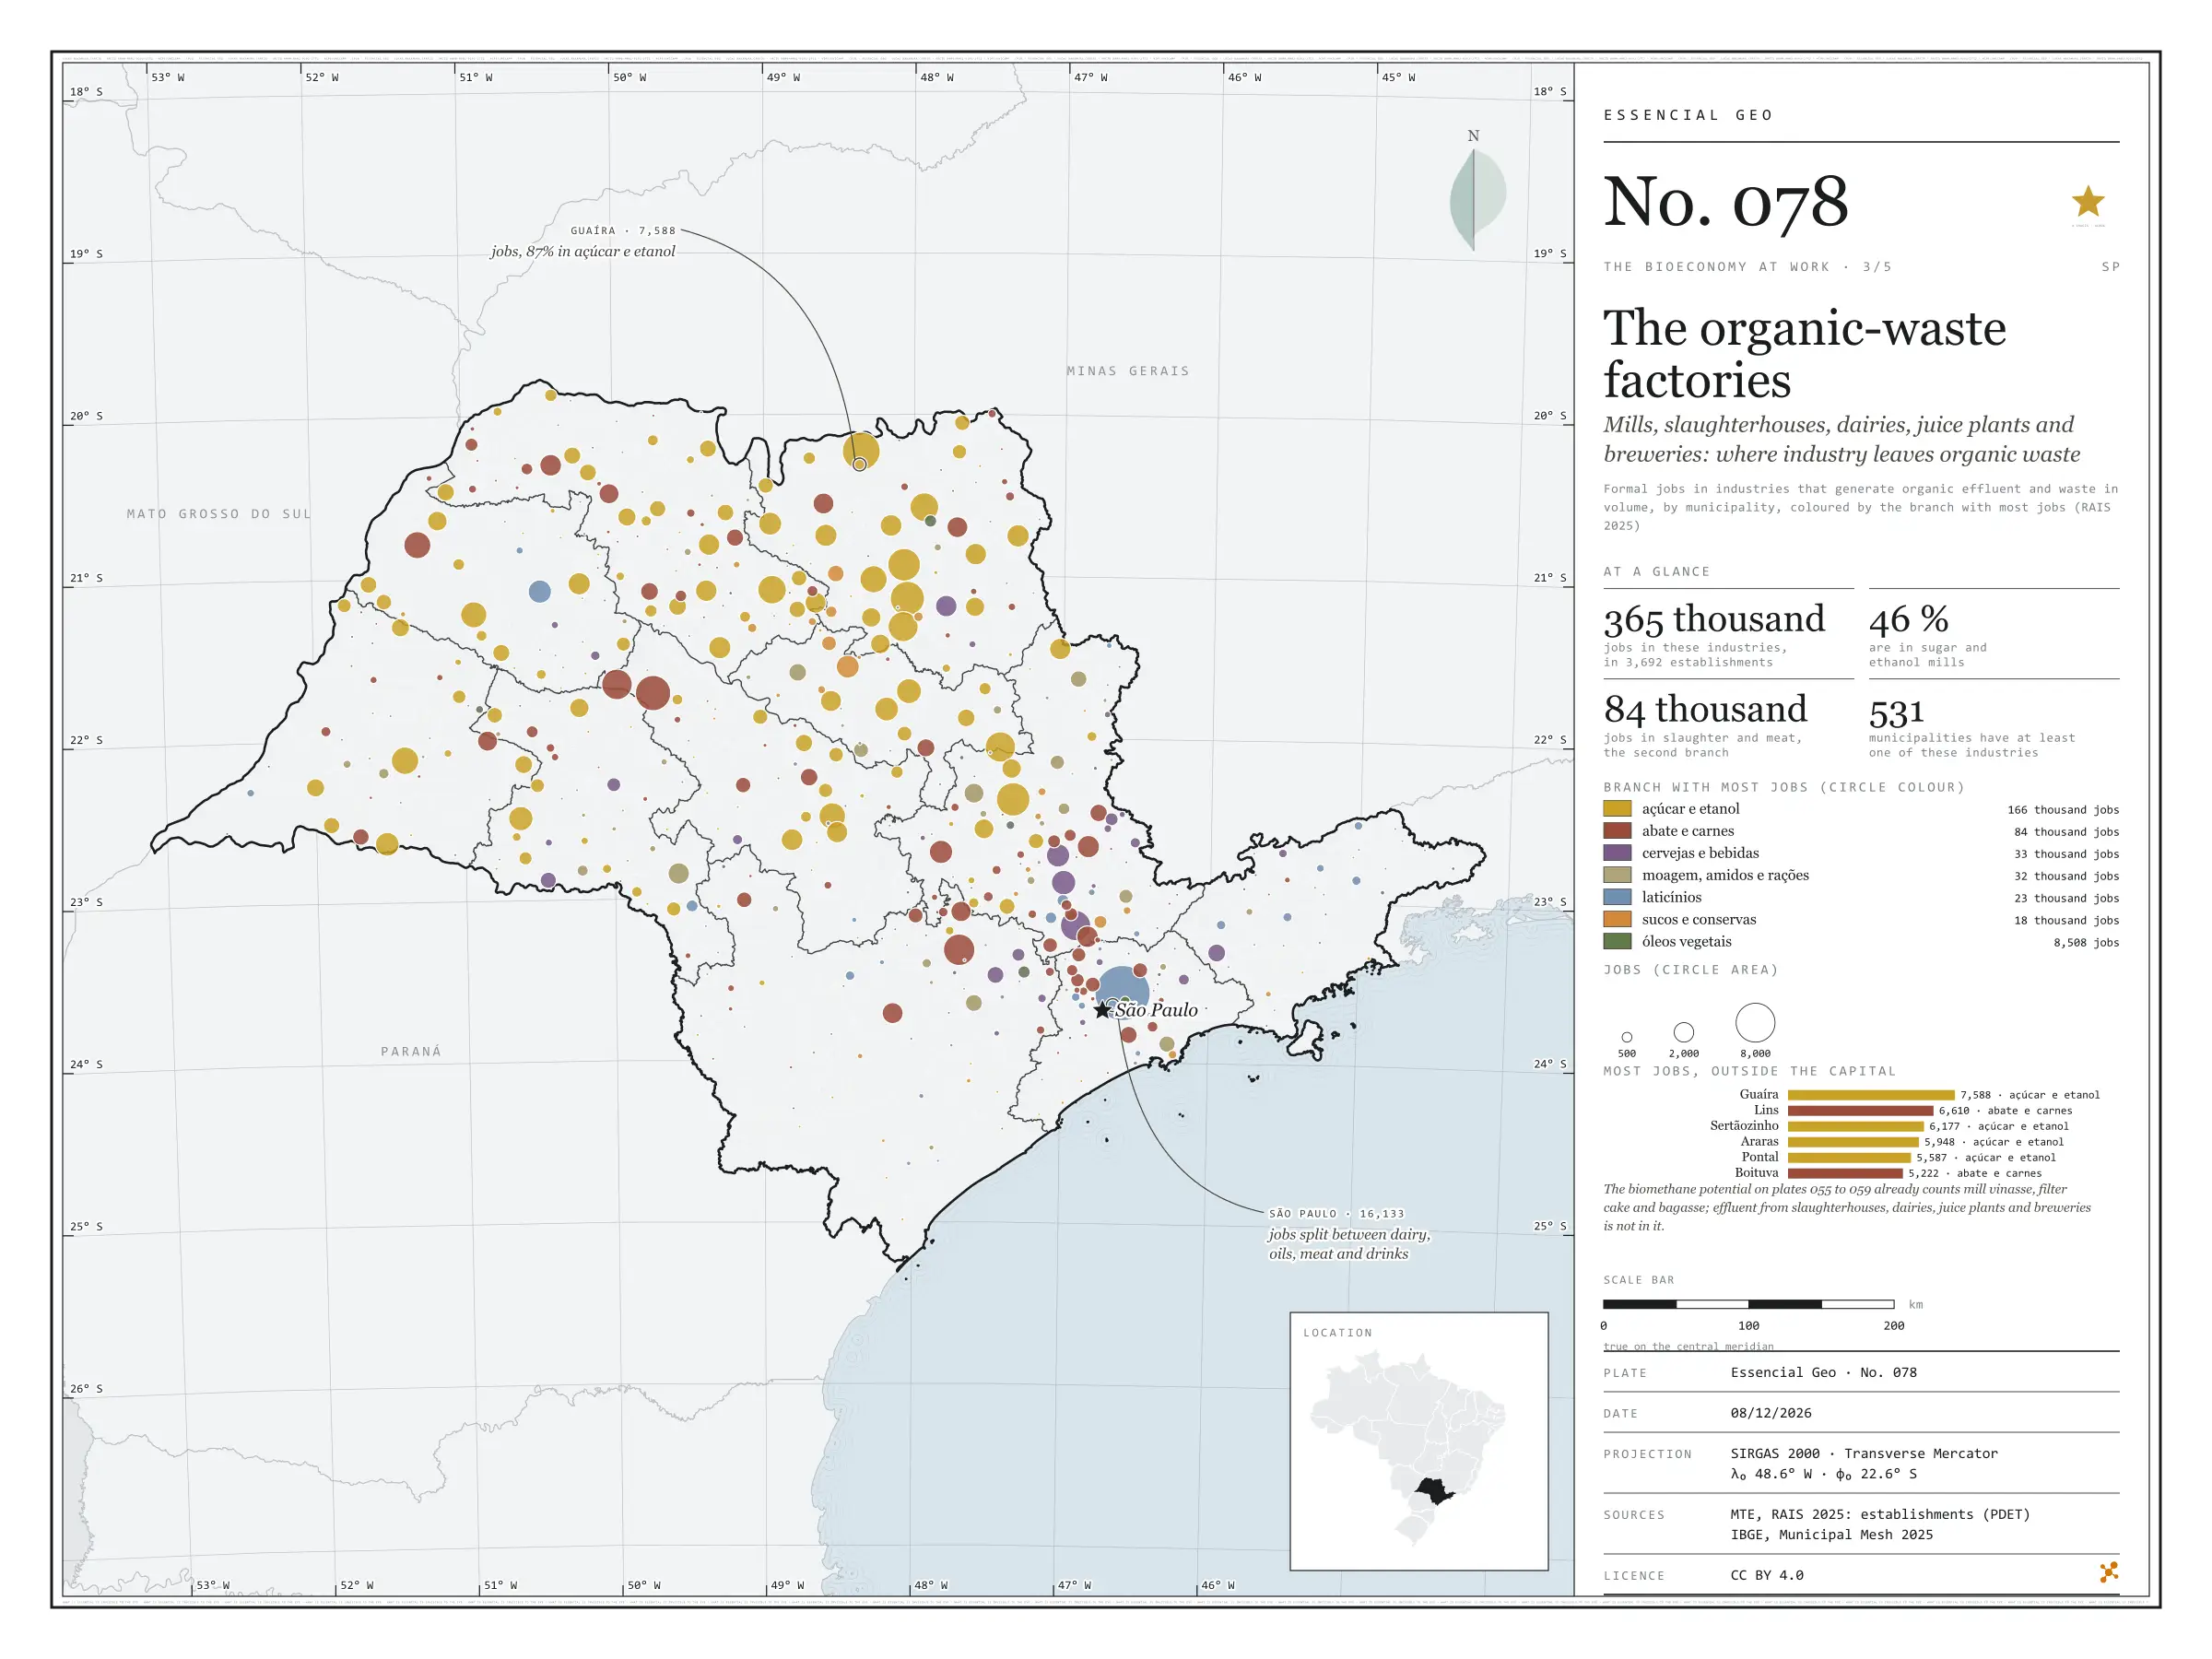
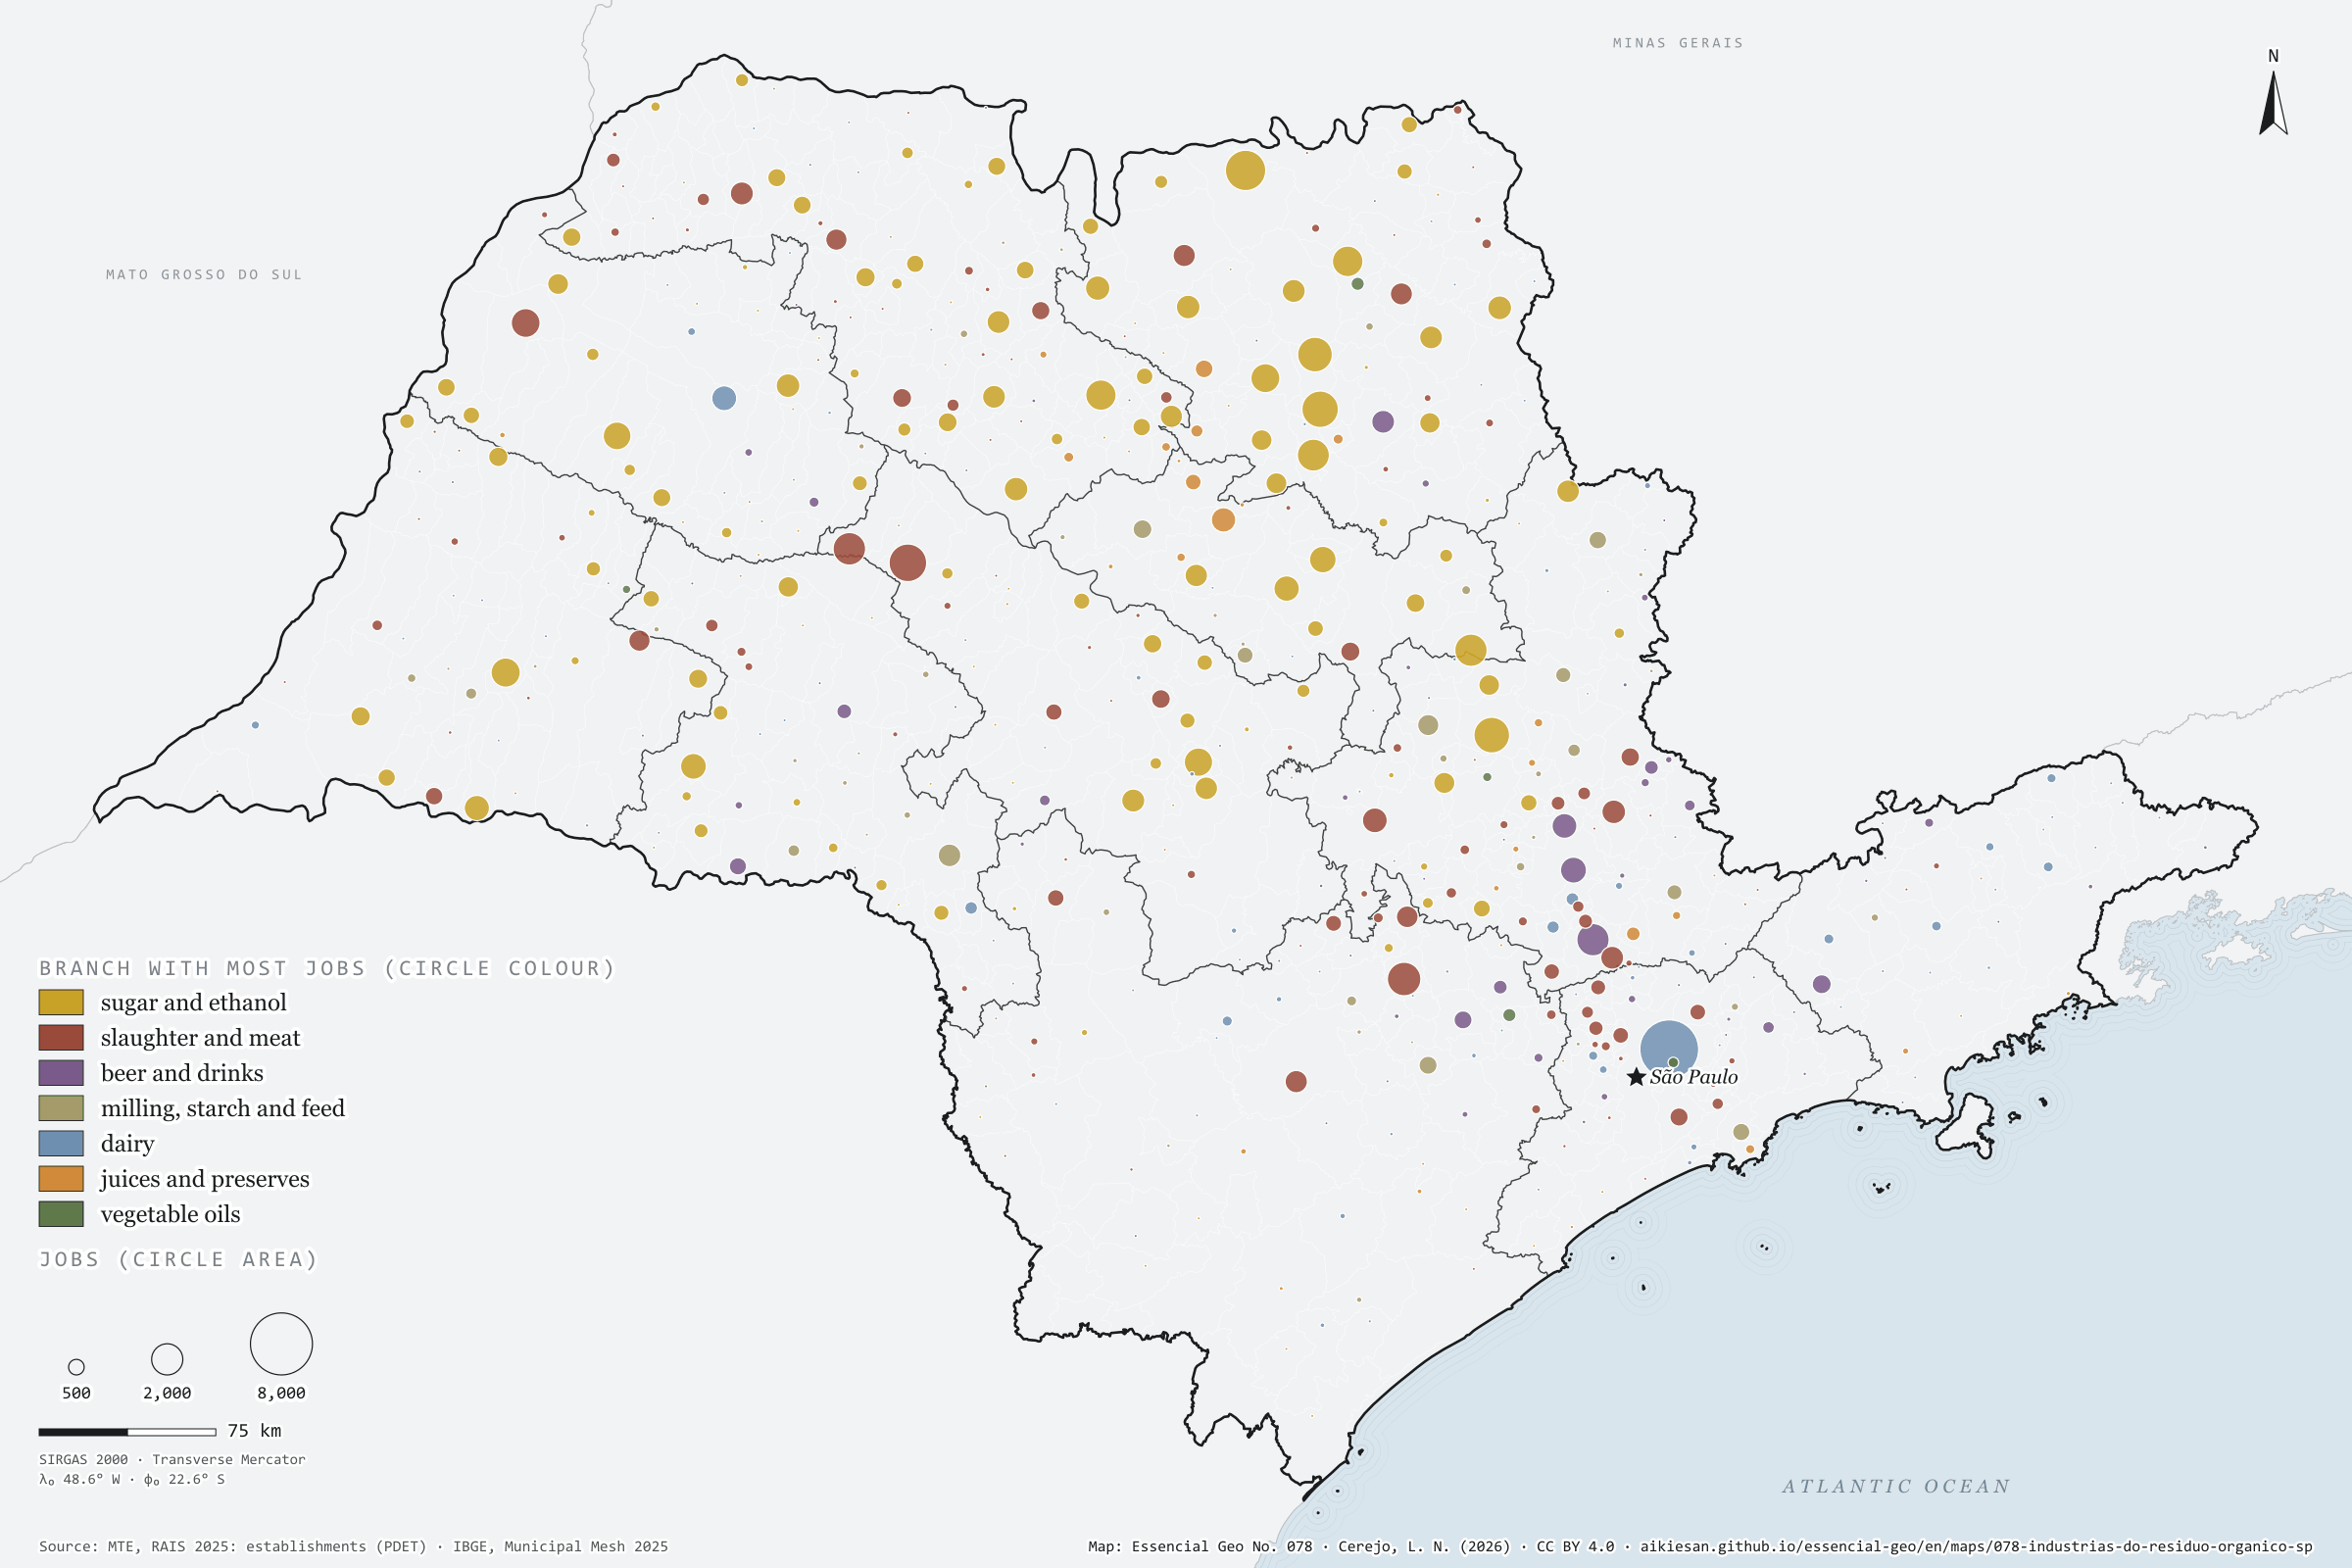
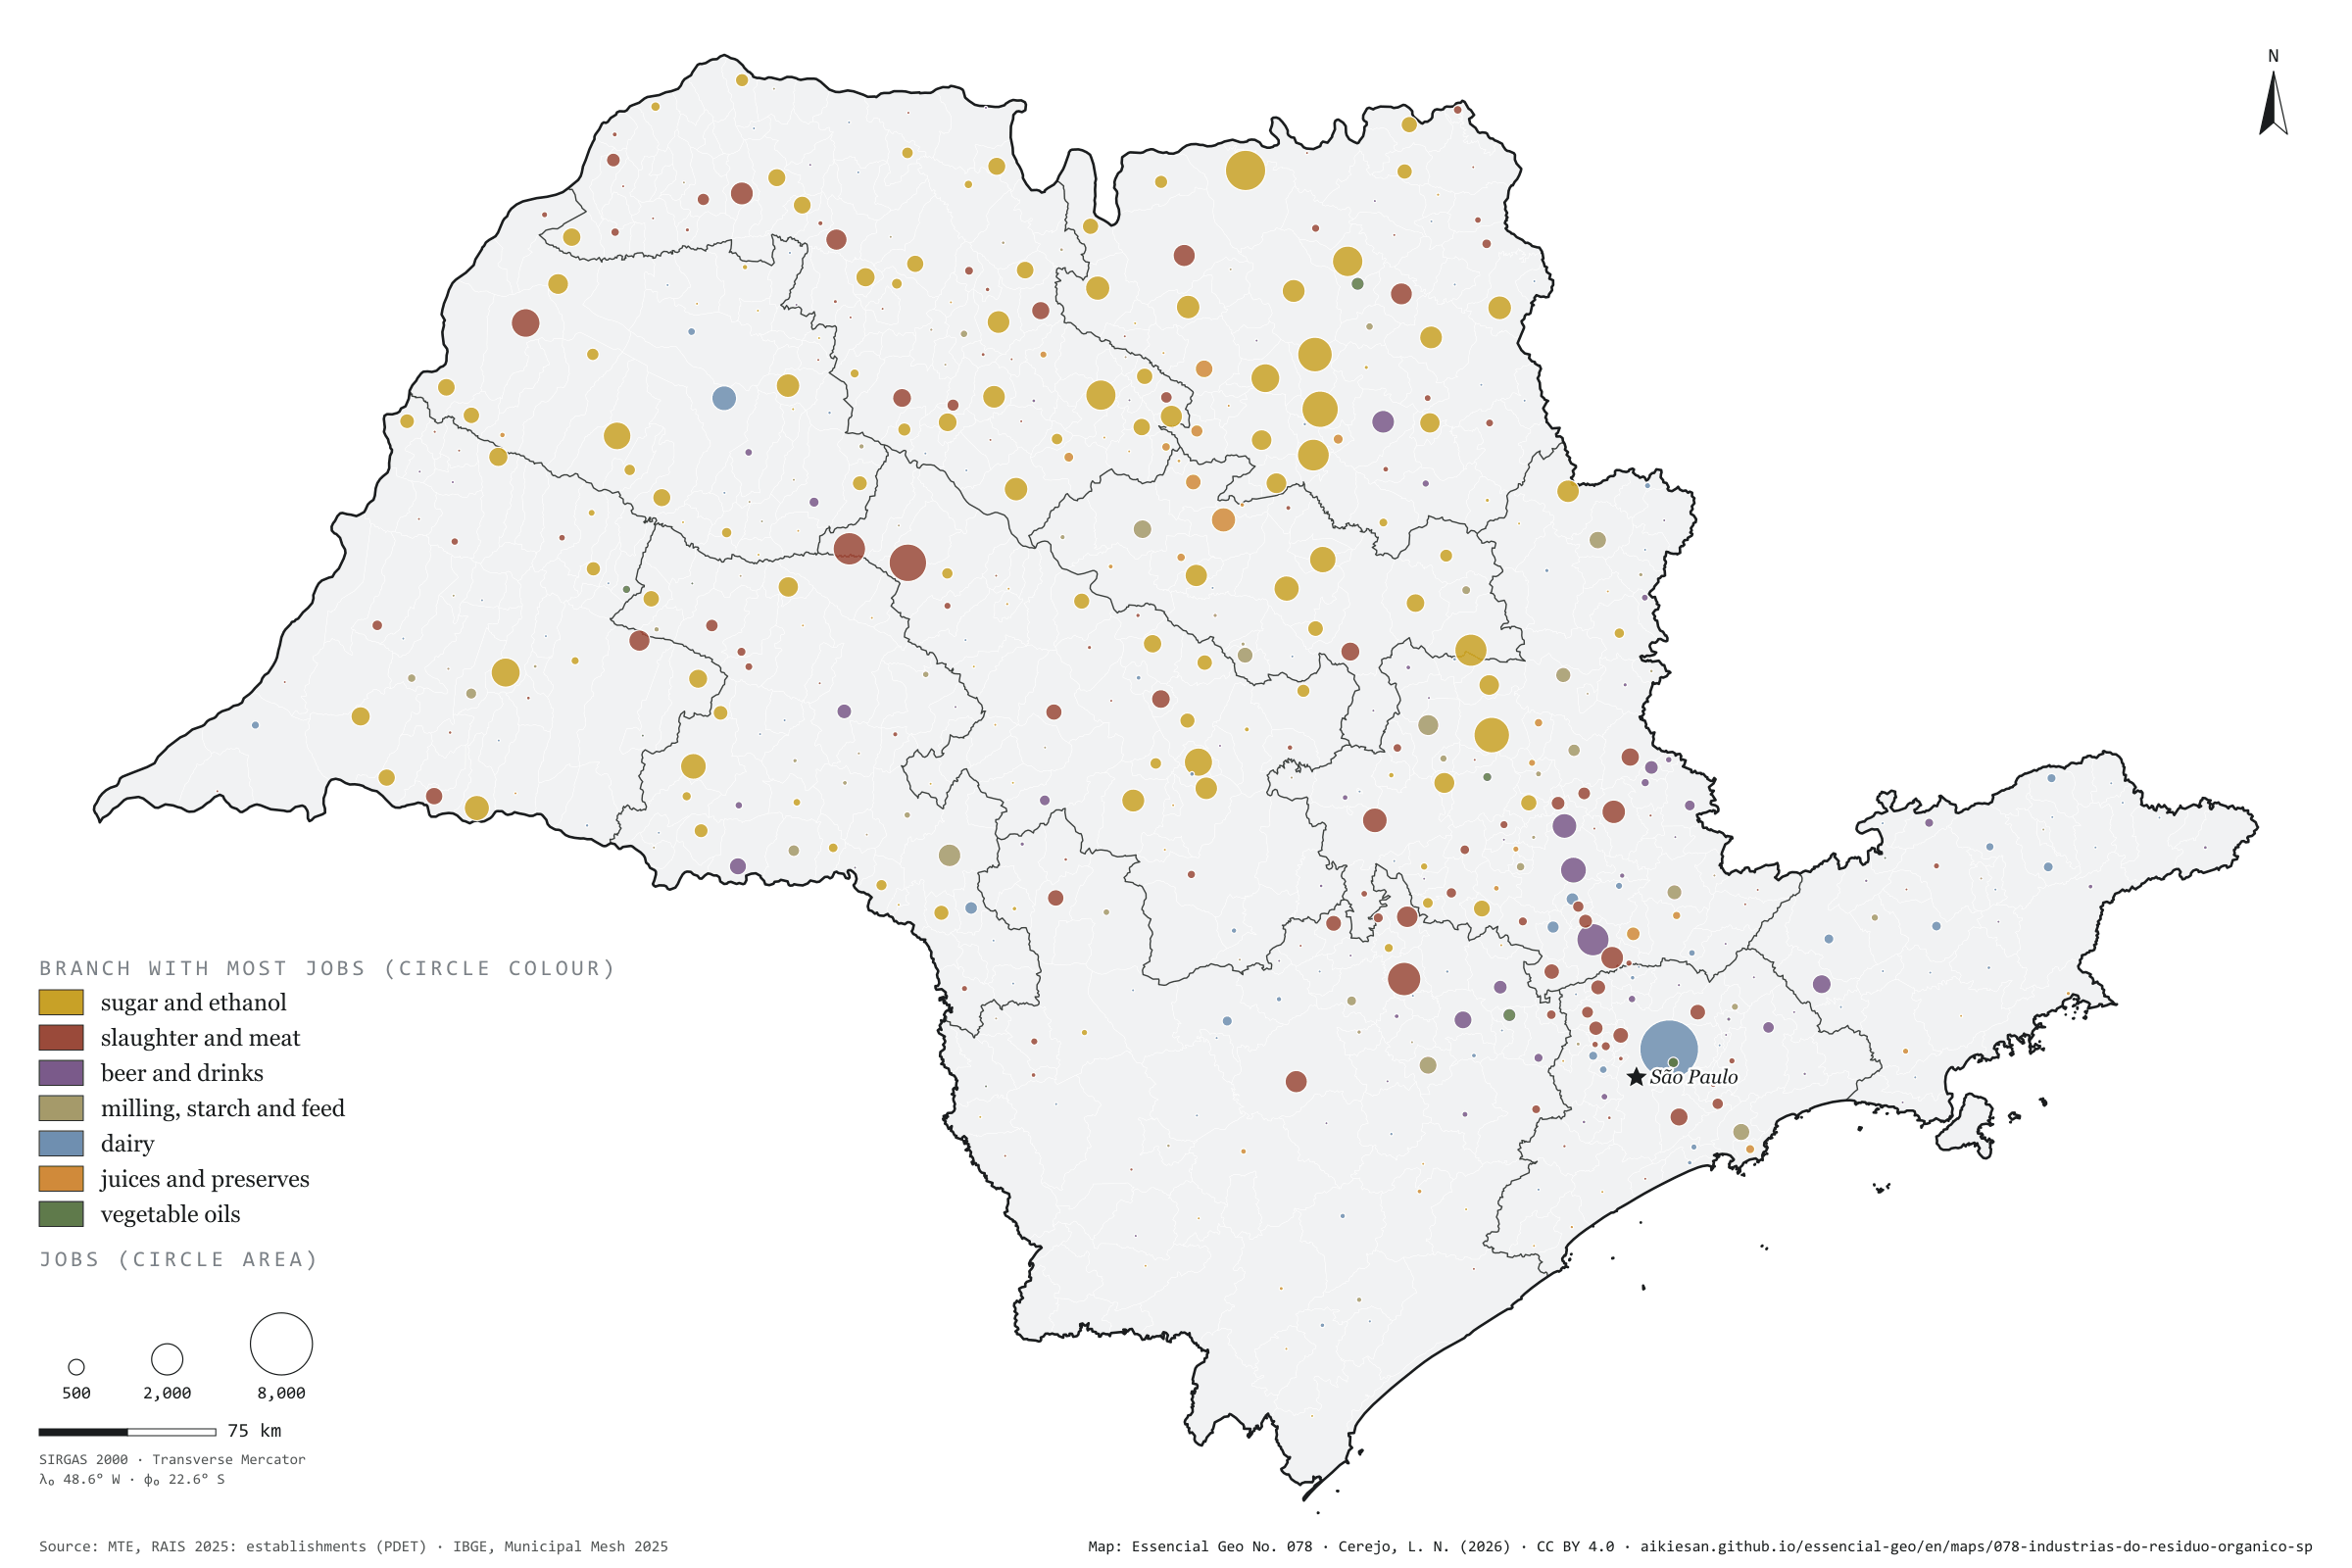
Some industries leave organic waste in volume: vinasse, filter cake and bagasse at the mills; blood, rumen contents and fatty effluent at slaughterhouses; whey at dairies; pulp and peel at juice plants; yeast and spent grain at breweries. In São Paulo, 364,647 formal jobs are in these industries, in 3,692 establishments and 531 municipalities. Sugar and ethanol account for 46%; slaughter, 23%. The capital has the most jobs, 16,133, split between dairy, oils, slaughter and drinks. Inland the mill rules: in Guaíra, 87% of the 7,588 jobs are in sugar and ethanol; Sertãozinho and Araras follow close behind. Slaughter leads in 124 municipalities, the mills in 116 and dairies in 89. CP2B already counts cane residues; the effluent of the other industries is left out. Third plate of the collection “The bioeconomy at work”.
Technical record · downloads · citation
At a glance
Jobs in organic-waste-generating industries, by branch (jobs)
Sugar and ethanol45.5%
Slaughter23%
Drinks9.1%
Grain and feed8.8%
Dairy6.4%
Fruit and juice4.9%
Oils2.3%
Establishments in generating industries
3,692establishments
in 531 municipalities
Layers
municipiospolygon645 municipalities: jobs and establishments in generating industries, by branch, and the dominant branch (same GPKG as plate 076)
regioes_intermediariaspolygon11 intermediate geographic regions
Active jobs on 31/12/2025 in seven industrial branches that generate organic effluent and waste in volume (slaughter, dairy, fruit and juice, sugar and ethanol, oils, drinks, grain and feed), by CNAE class and municipality; circle proportional to the total, coloured by the branch with most jobs.
The map without a frame, with legend, scale, reference system and credit written on it: ready for papers, lectures and slides. In two versions: with the basemap (neighbours and sea) or only the mapped area, on white.
CEREJO, Lucas Nakamura. As fábricas do resíduo orgânico: usinas, frigoríficos, laticínios, sucos e cervejarias: onde a indústria deixa resíduo orgânico. Versão 1.0.0. [S. l.]: Essencial, 2026. Conjunto de dados. Disponível em: https://aikiesan.github.io/essencial-geo/en/maps/078-industrias-do-residuo-organico-sp/. Acesso em: 10 nov. 2026.
Cerejo, L. N. (2026). As fábricas do resíduo orgânico: usinas, frigoríficos, laticínios, sucos e cervejarias: onde a indústria deixa resíduo orgânico [The organic-waste factories: Mills, slaughterhouses, dairies, juice plants and breweries: where industry leaves organic waste] (Version 1.0.0) [Data set]. Essencial. https://aikiesan.github.io/essencial-geo/en/maps/078-industrias-do-residuo-organico-sp/
@dataset{cerejo2026_industrias_do_residuo_organico_sp,
  author    = {Cerejo, Lucas Nakamura},
  title     = {As fábricas do resíduo orgânico: Usinas, frigoríficos, laticínios, sucos e cervejarias: onde a indústria deixa resíduo orgânico},
  year      = {2026},
  publisher = {Essencial},
  version   = {1.0.0},
  url       = {https://aikiesan.github.io/essencial-geo/en/maps/078-industrias-do-residuo-organico-sp/},
  language  = {portuguese},
  note      = {English title: The organic-waste factories: Mills, slaughterhouses, dairies, juice plants and breweries: where industry leaves organic waste. Licence CC BY 4.0}
}
The hubs that already have both residue and industry, and those with only one
Fig. 079São Paulo State (SP)EPSG:4674Source: CP2B (Unicamp), MTE/PDET, IBGE
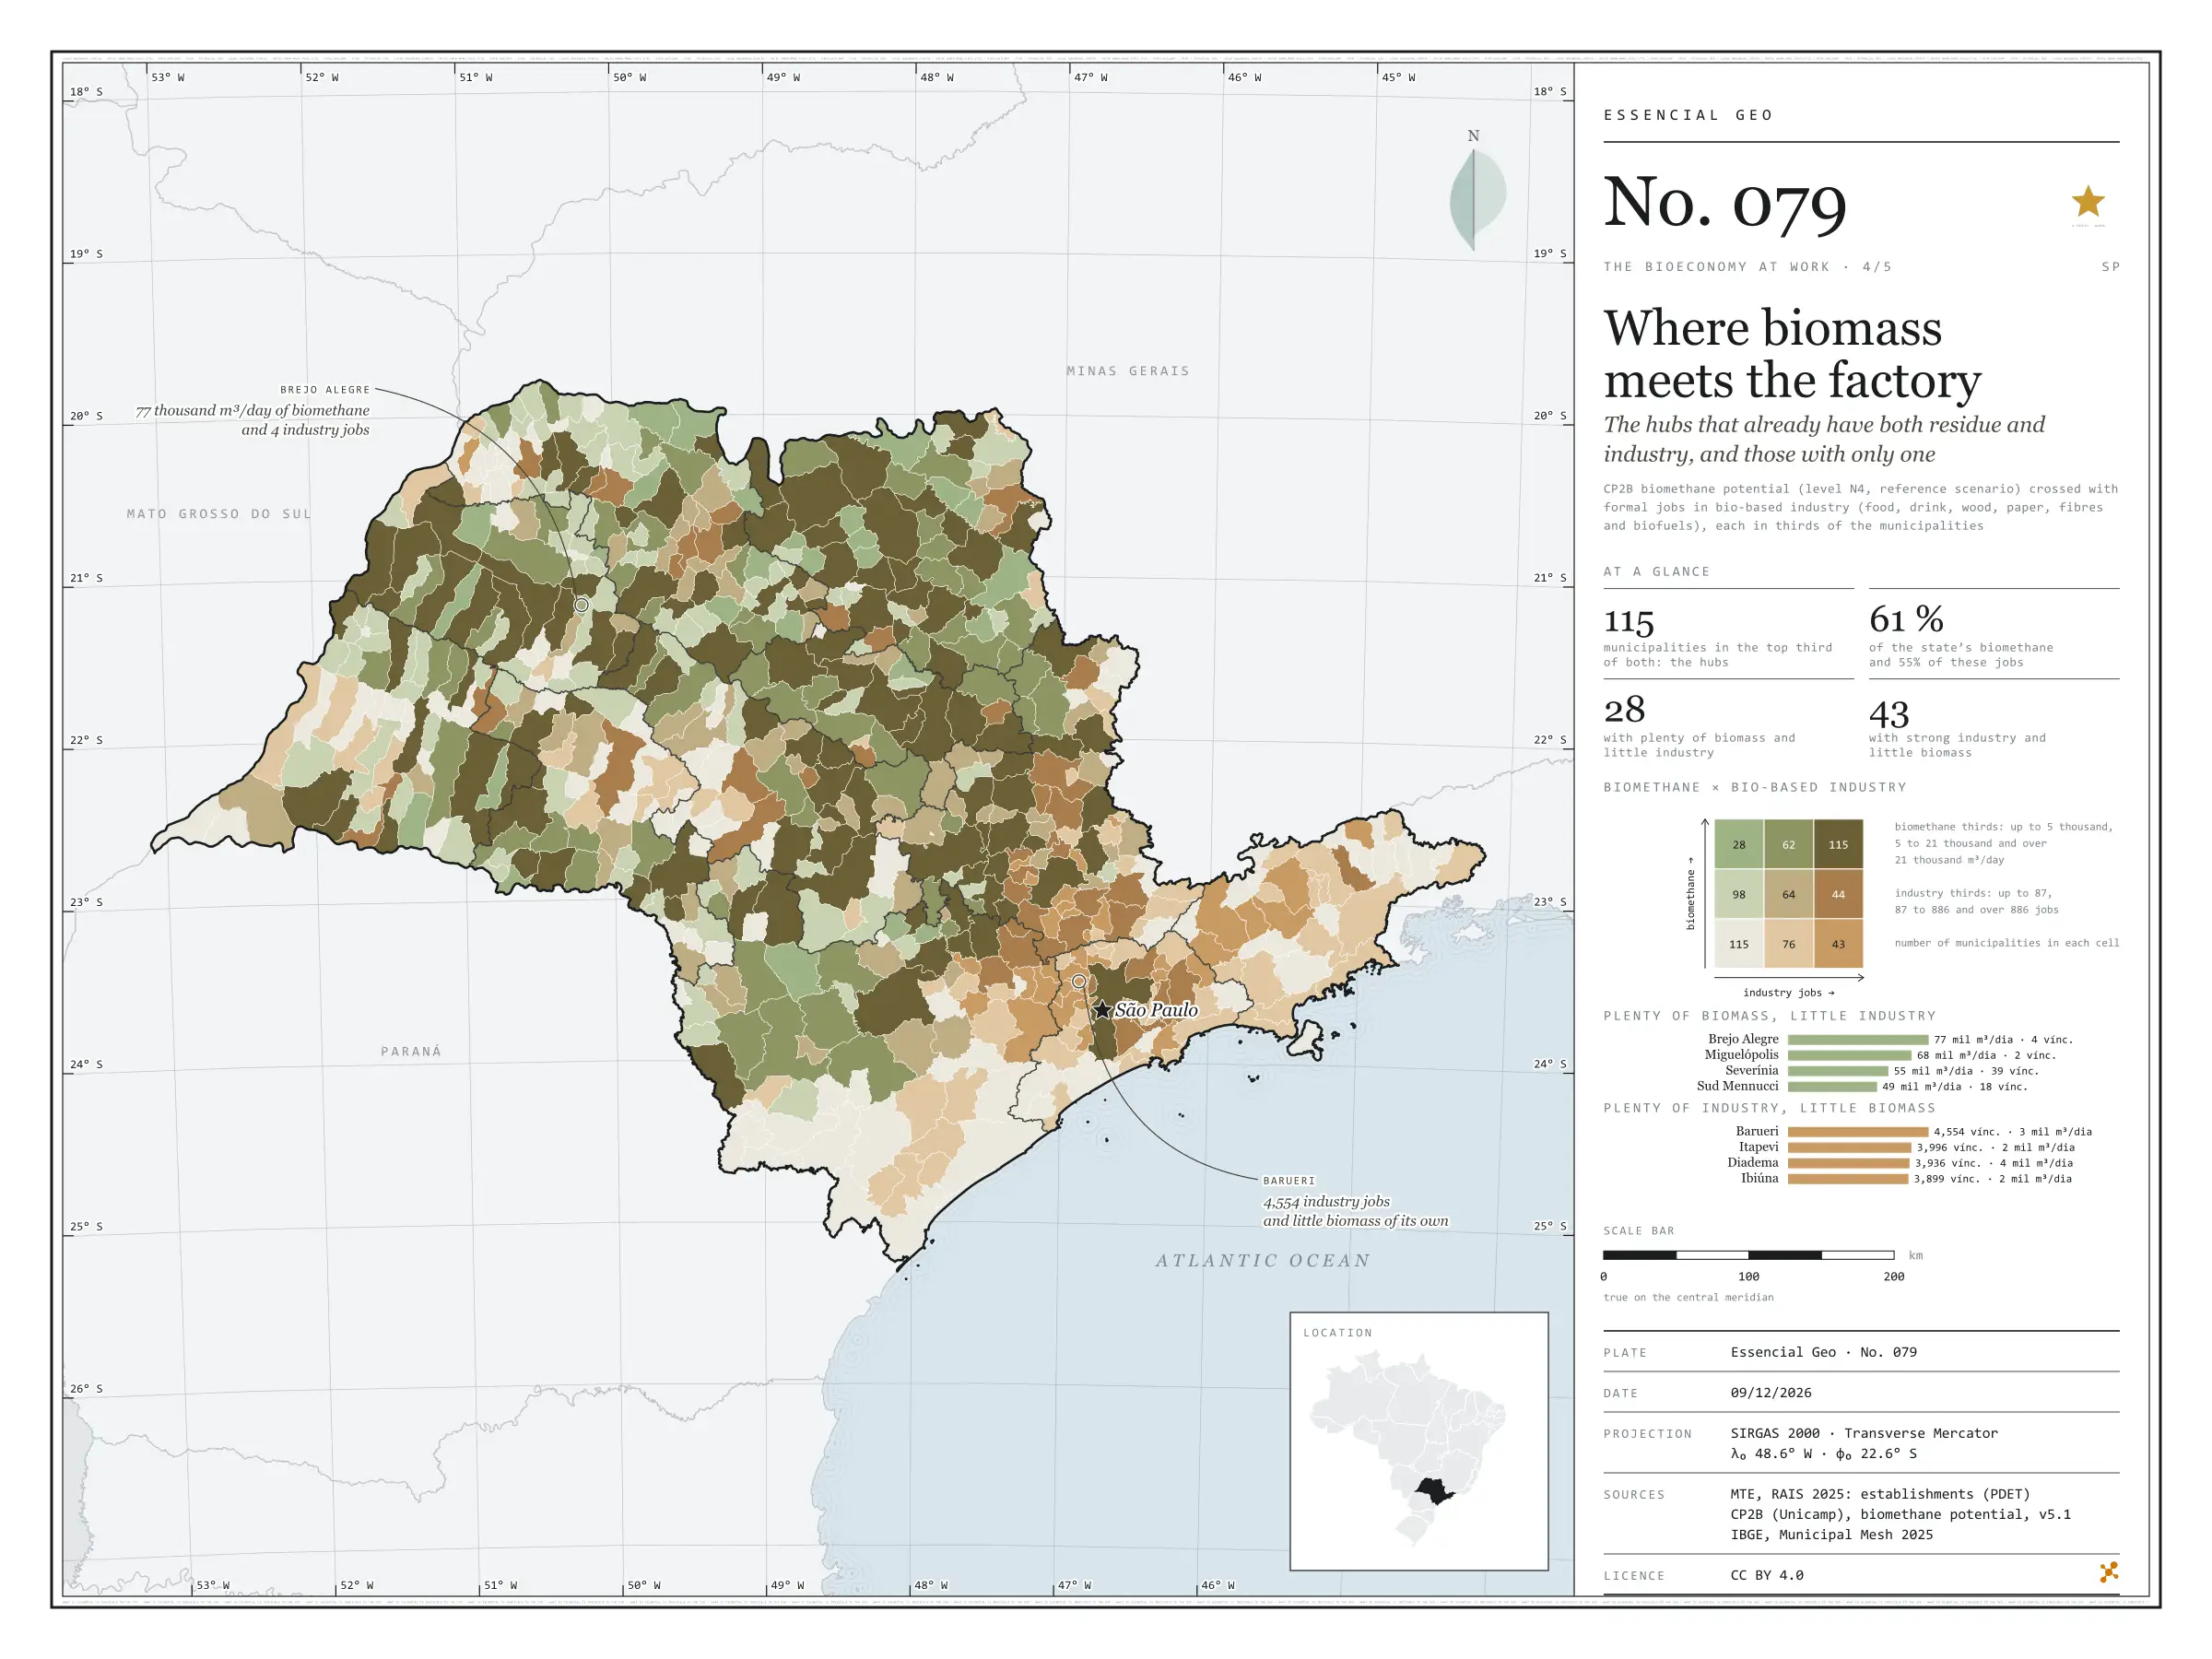
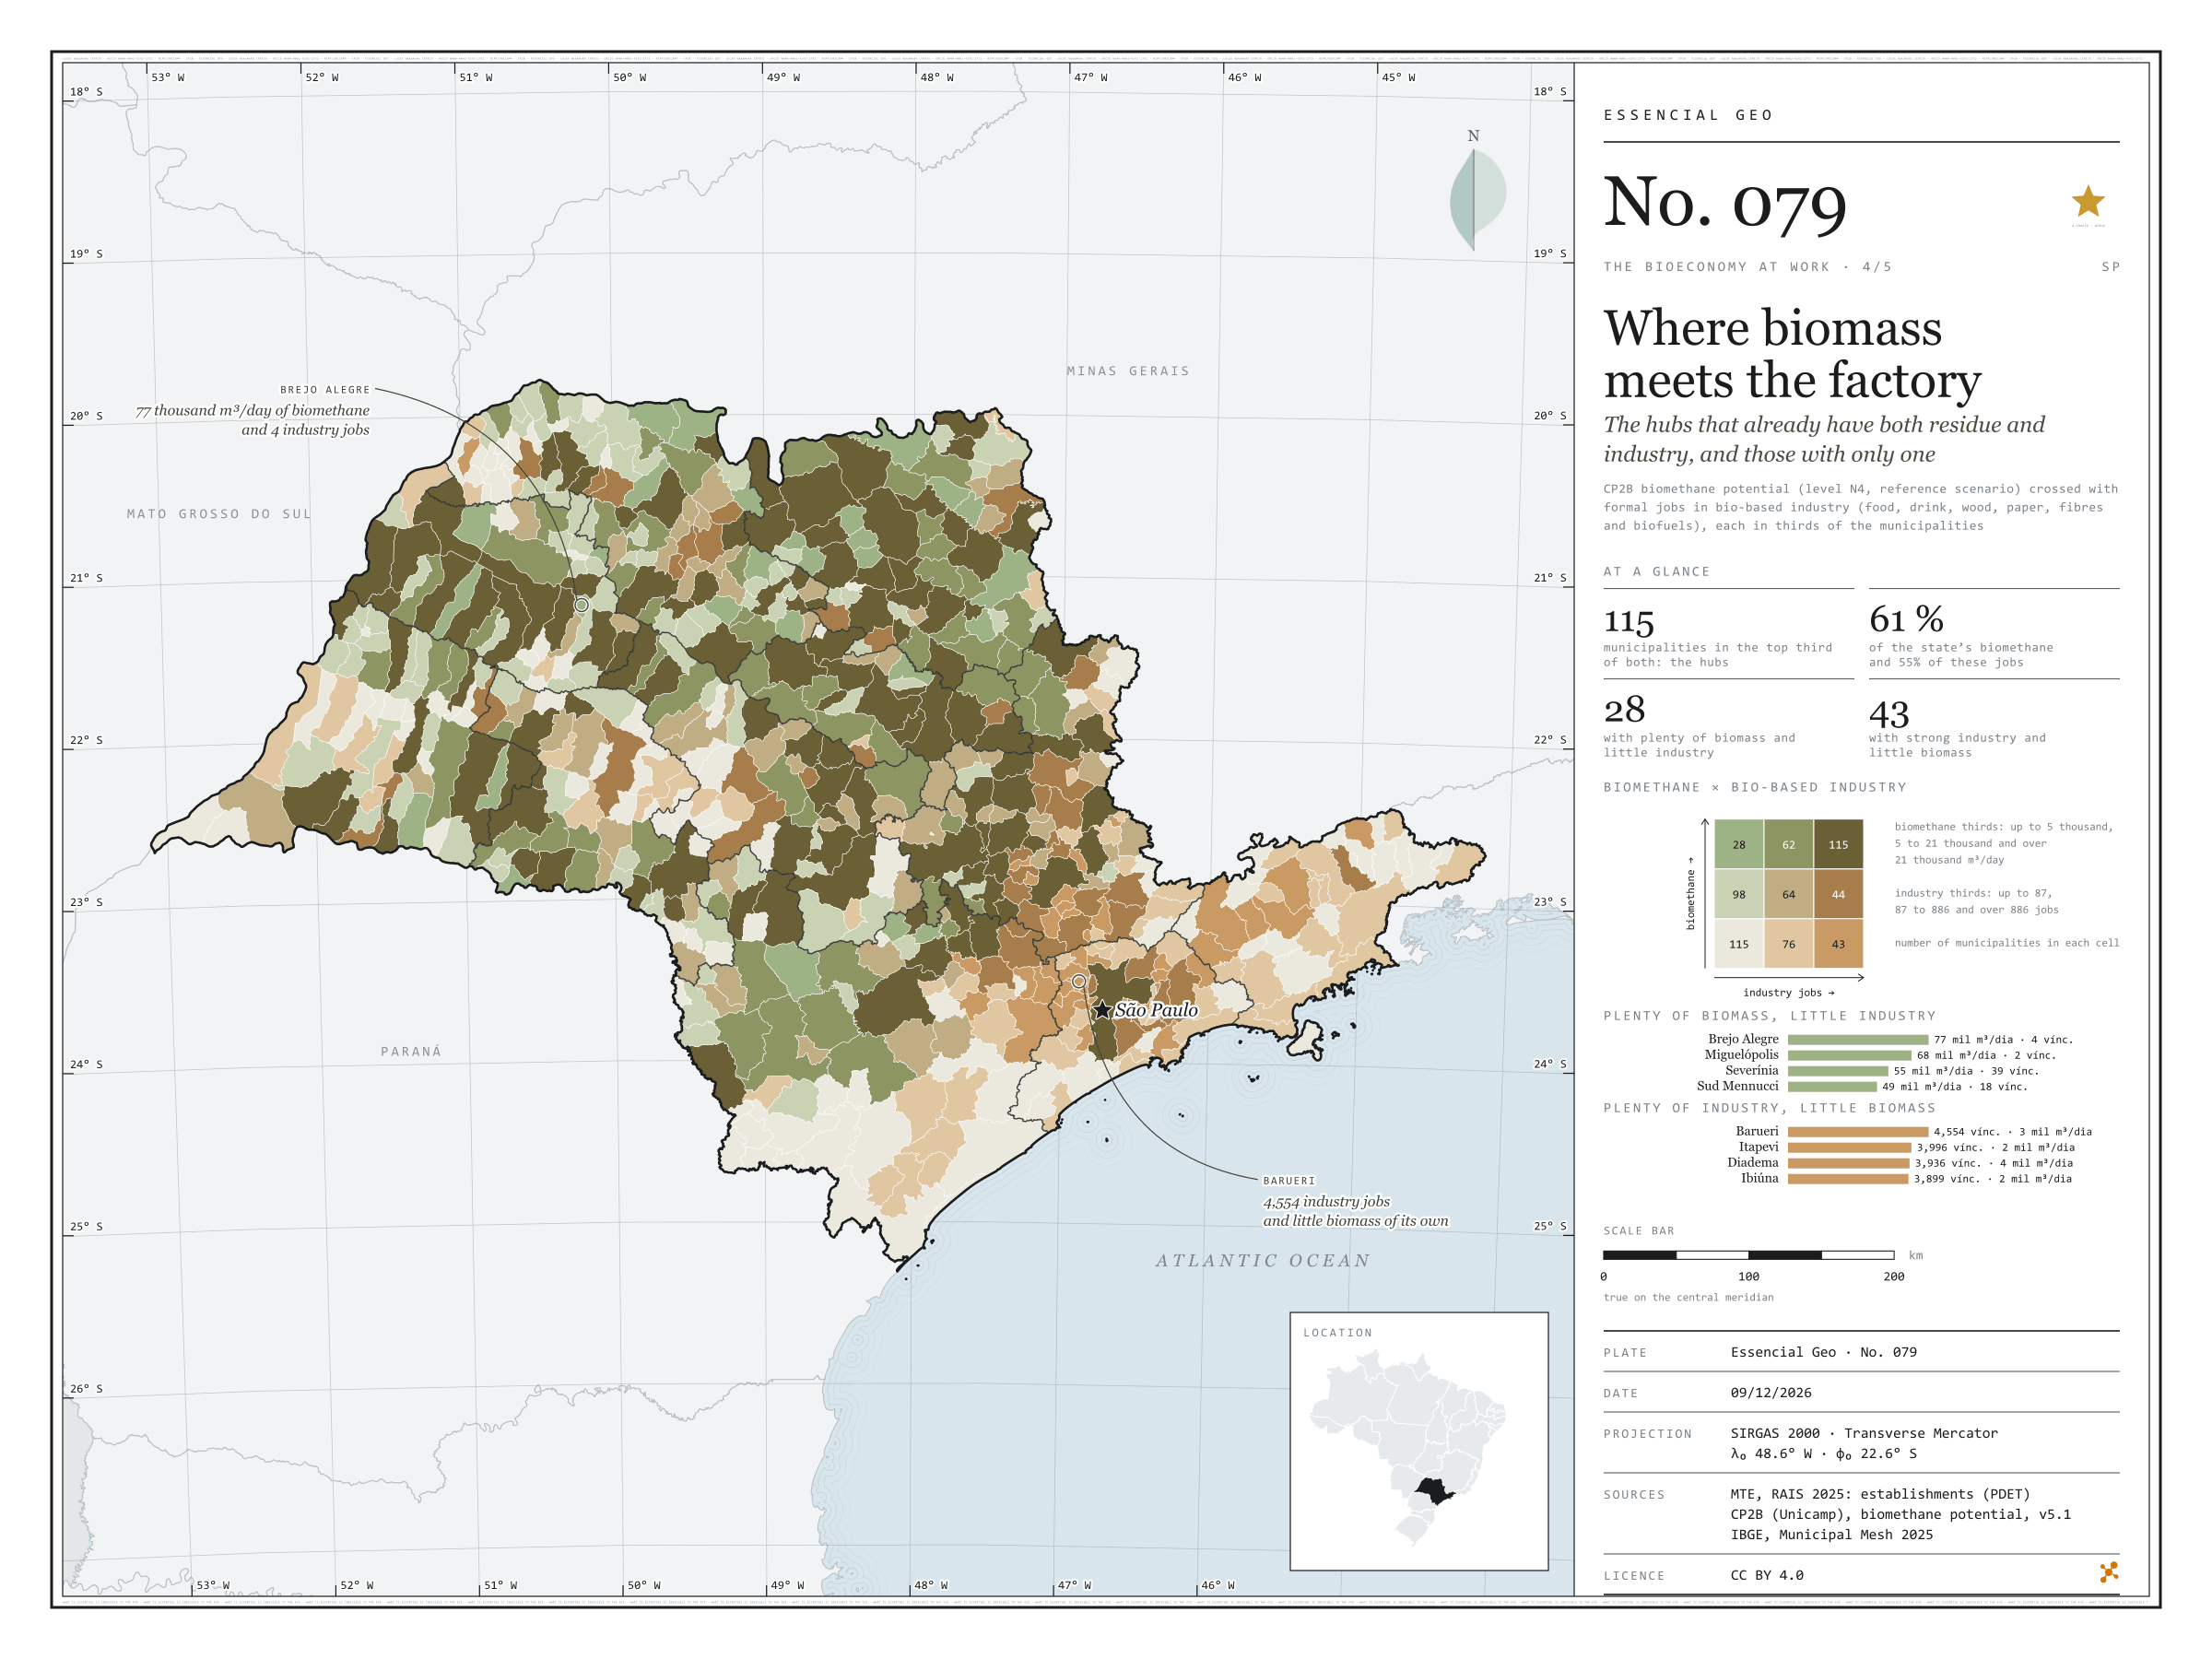
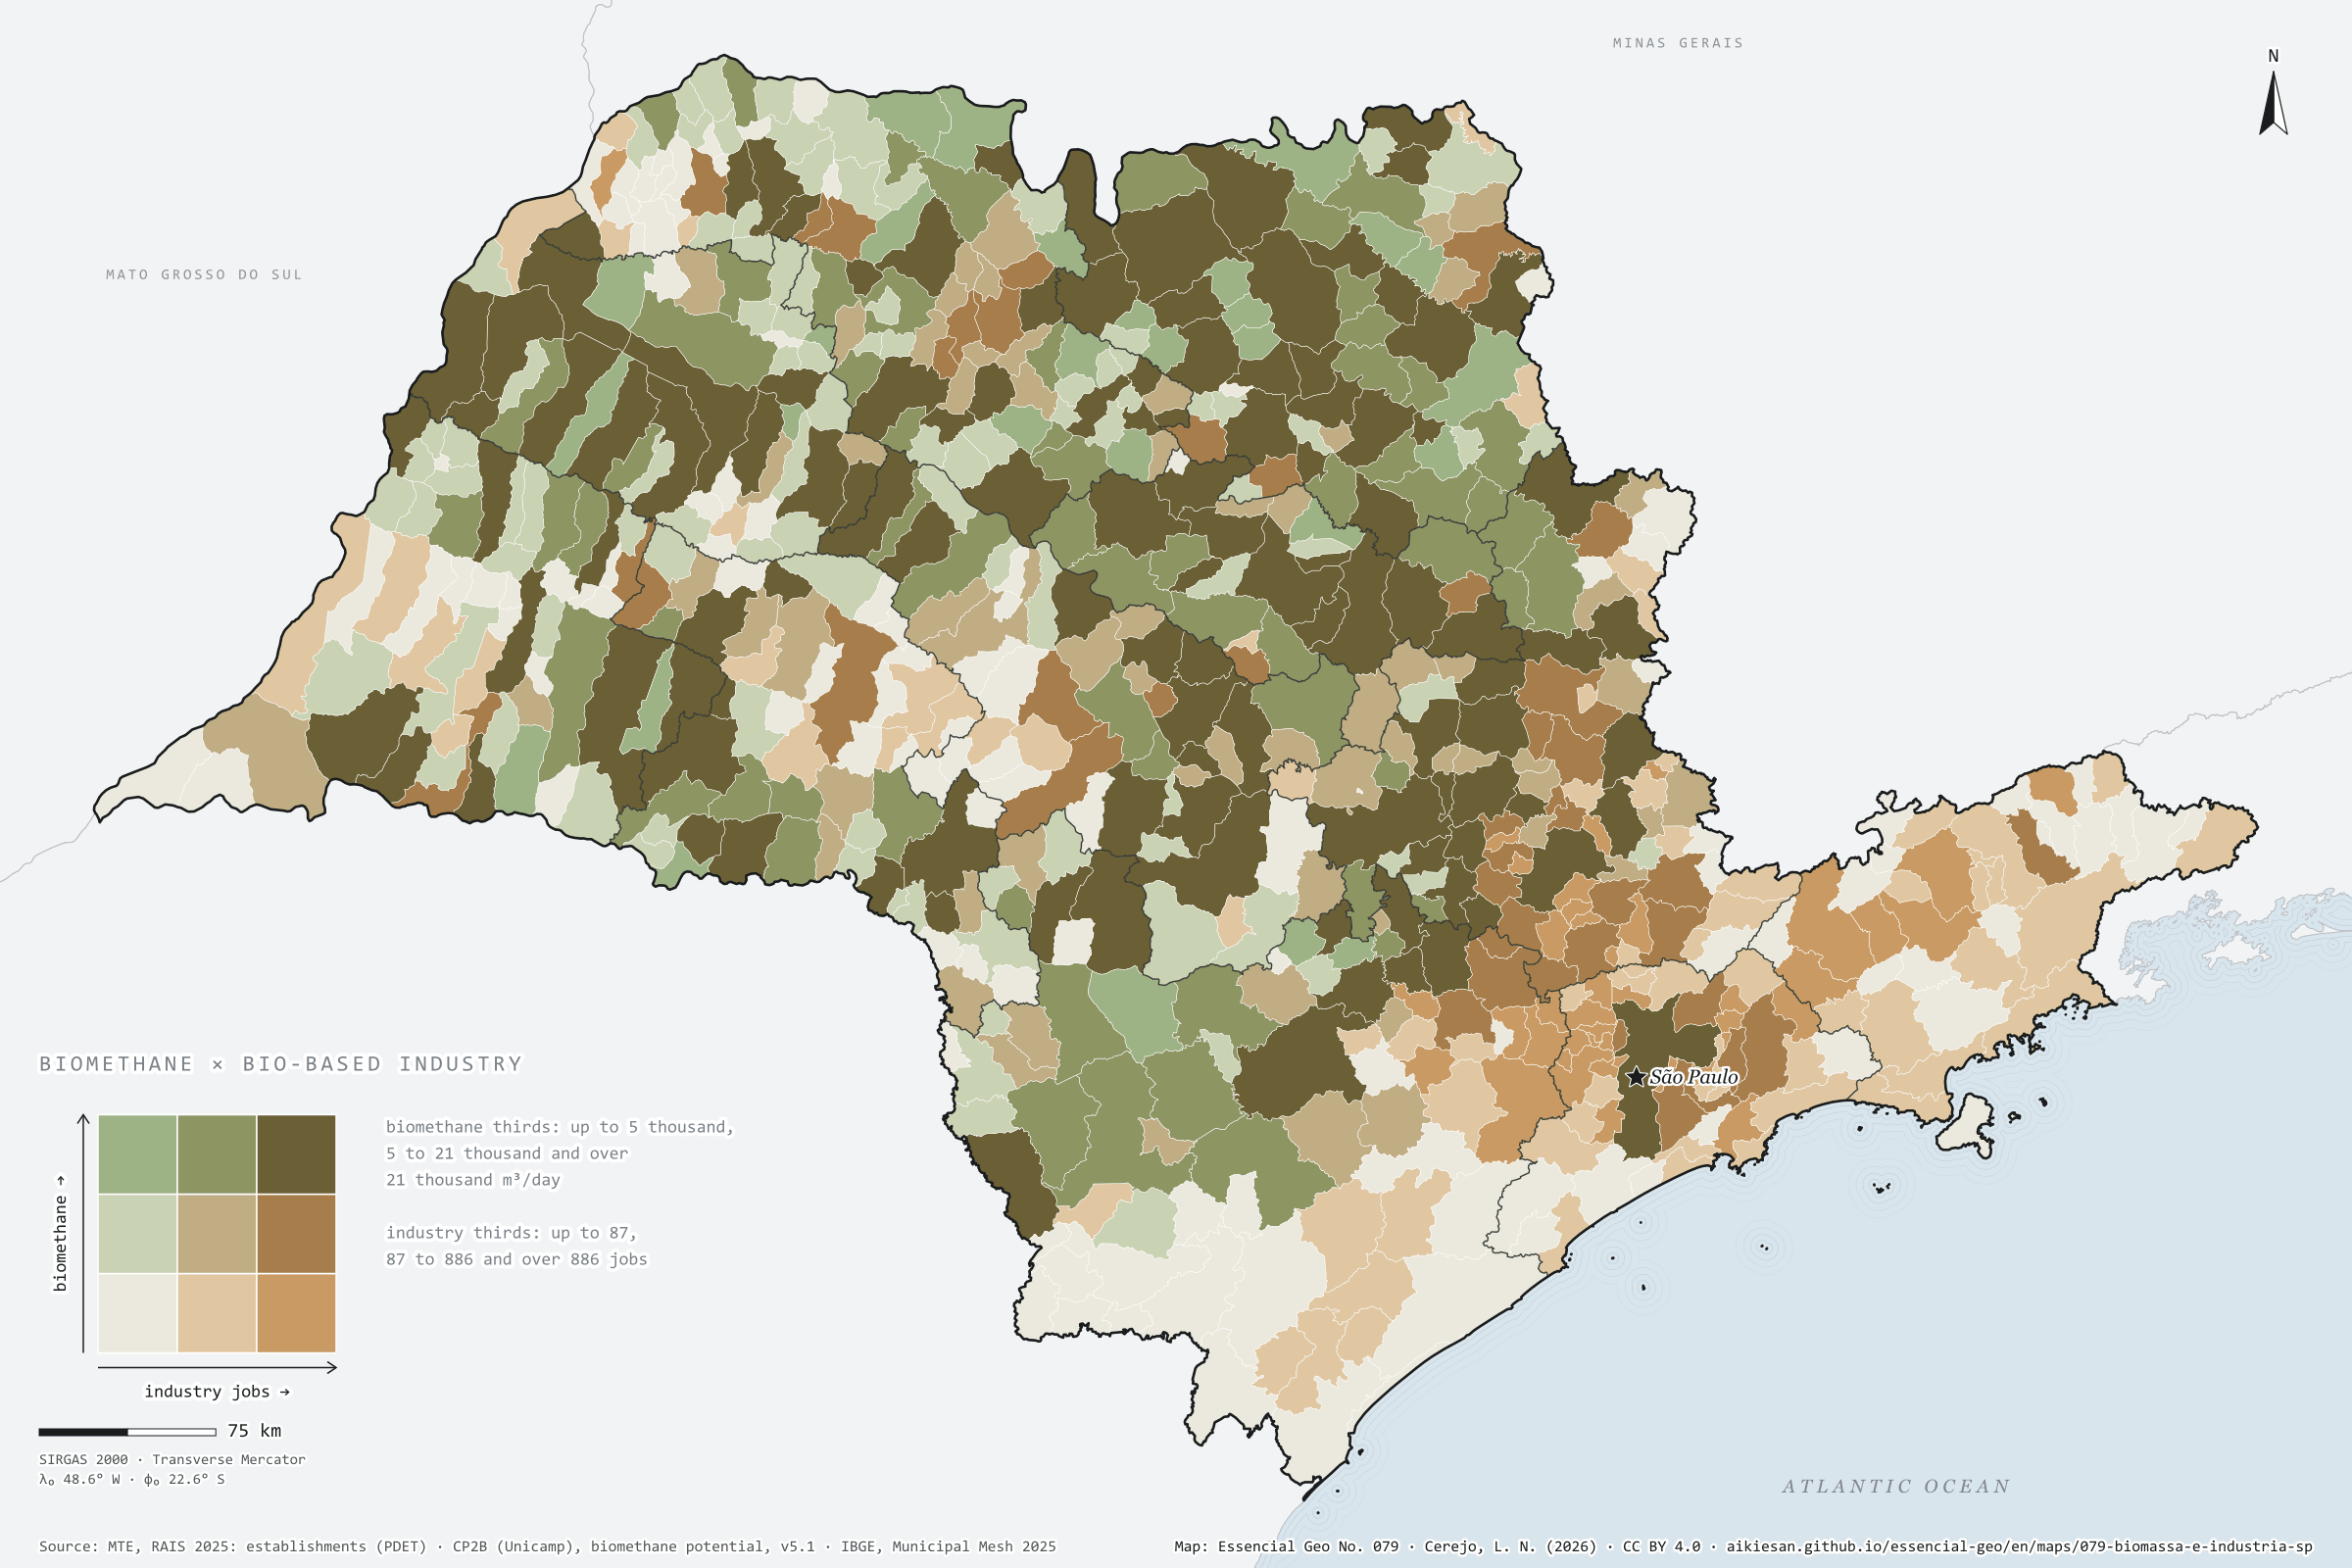
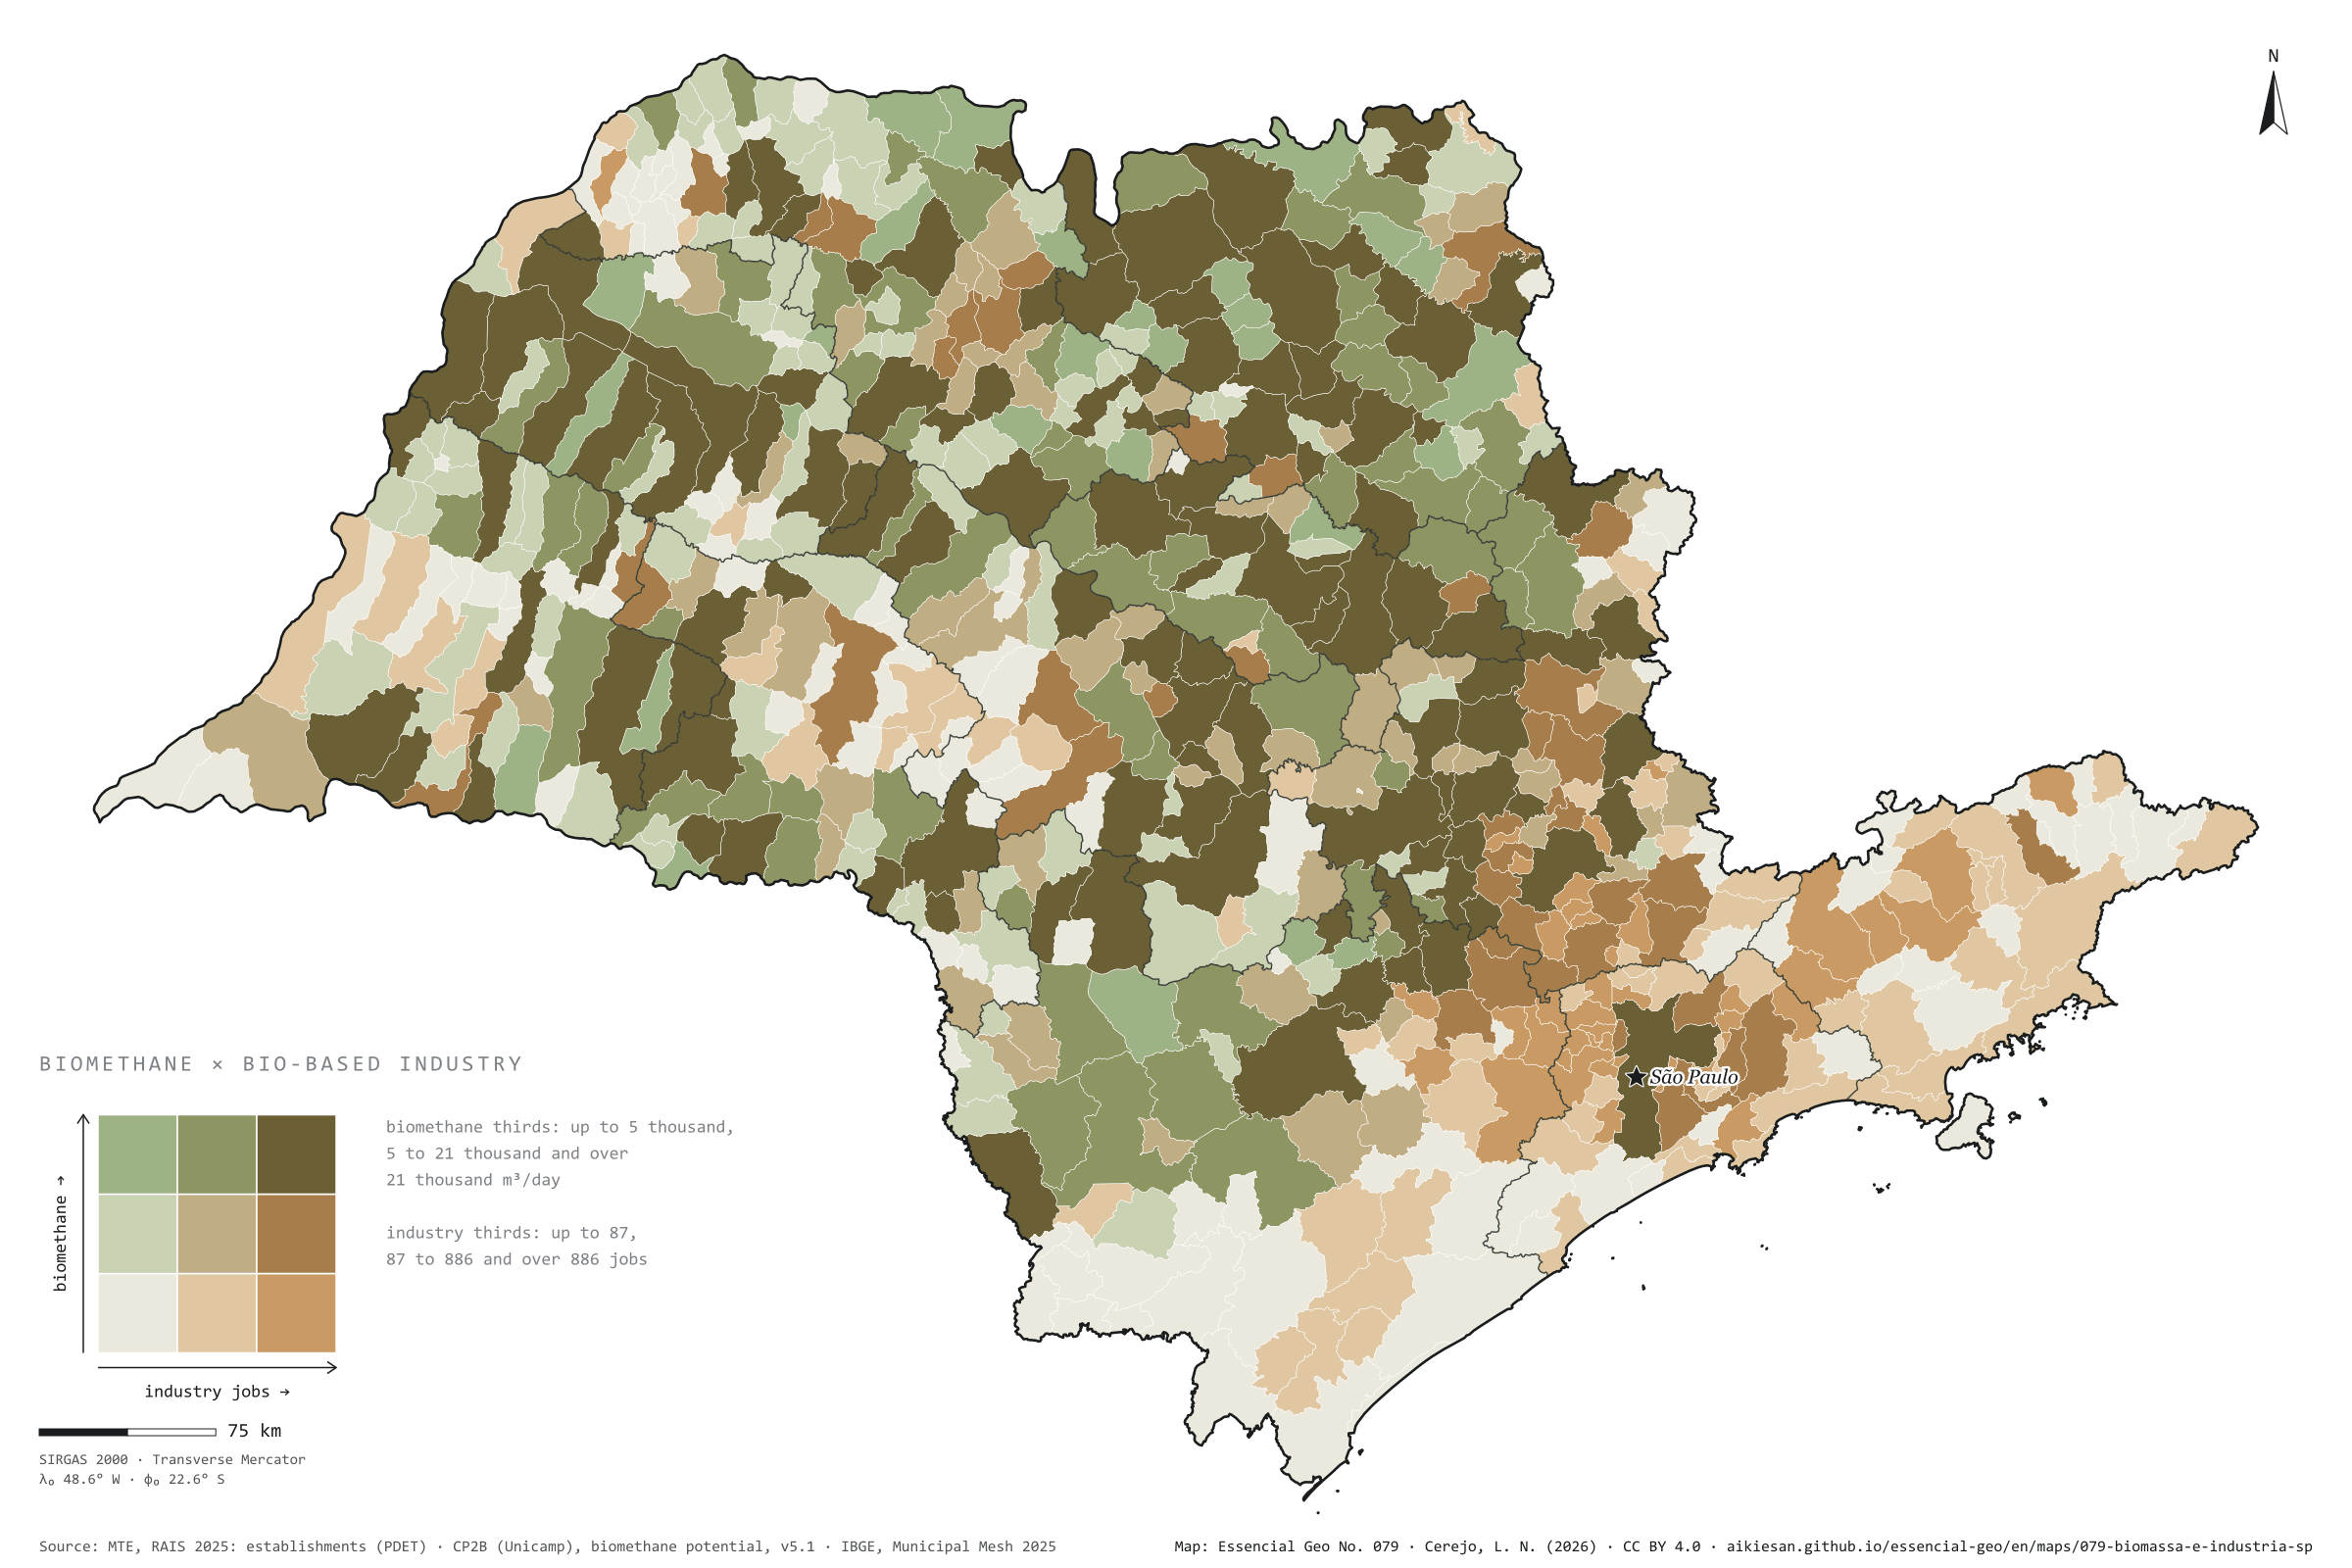
A bioeconomy hub needs two things in the same place: biomass and someone who knows how to convert it. This plate crosses the biomethane potential of residues (CP2B, accessible level, reference scenario) with formal jobs in bio-based industry (food, drink, wood, paper, fibres and biofuels), each split into thirds of the municipalities. In 115 municipalities both are in the top third: these are the hubs, with 61% of the state’s biomethane and 55% of those jobs, nearly all in the cane-growing north and centre. In 28, biomass is plentiful and industry scarce: Brejo Alegre has 77,000 m³ of biomethane a day and 4 industrial jobs. In 43, industry is strong and biomass is scarce, mostly in the metropolis: Barueri has 4,554 jobs and little residue of its own. Fourth plate of the collection “The bioeconomy at work”.
Technical record · downloads · citation
At a glance
Municipalities in the top third for both biomethane and industry
115municipalities
61% of the biomethane and 55% of the industry jobs
Municipalities with plenty of biomass and little industry
28municipalities
Municipalities with strong industry and little biomass
43municipalities
Layers
municipiospolygon645 municipalities: CP2B biomethane potential and bio-based industry jobs by segment (same GPKG as plate 076)
regioes_intermediariaspolygon11 intermediate geographic regions
Biomethane potential by municipality (CP2B v5.1, level N4, reference scenario) and active jobs on 31/12/2025 in bio-based industry (RAIS 2025), each split into thirds of the municipalities with a value; the cross gives nine classes.
The map without a frame, with legend, scale, reference system and credit written on it: ready for papers, lectures and slides. In two versions: with the basemap (neighbours and sea) or only the mapped area, on white.
CEREJO, Lucas Nakamura. Onde a biomassa encontra a fábrica: os polos que já têm resíduo e indústria, e os que só têm um dos dois. Versão 1.0.0. [S. l.]: Essencial, 2026. Conjunto de dados. Disponível em: https://aikiesan.github.io/essencial-geo/en/maps/079-biomassa-e-industria-sp/. Acesso em: 10 nov. 2026.
Cerejo, L. N. (2026). Onde a biomassa encontra a fábrica: os polos que já têm resíduo e indústria, e os que só têm um dos dois [Where biomass meets the factory: The hubs that already have both residue and industry, and those with only one] (Version 1.0.0) [Data set]. Essencial. https://aikiesan.github.io/essencial-geo/en/maps/079-biomassa-e-industria-sp/
@dataset{cerejo2026_biomassa_e_industria_sp,
  author    = {Cerejo, Lucas Nakamura},
  title     = {Onde a biomassa encontra a fábrica: Os polos que já têm resíduo e indústria, e os que só têm um dos dois},
  year      = {2026},
  publisher = {Essencial},
  version   = {1.0.0},
  url       = {https://aikiesan.github.io/essencial-geo/en/maps/079-biomassa-e-industria-sp/},
  language  = {portuguese},
  note      = {English title: Where biomass meets the factory: The hubs that already have both residue and industry, and those with only one. Licence CC BY 4.0}
}
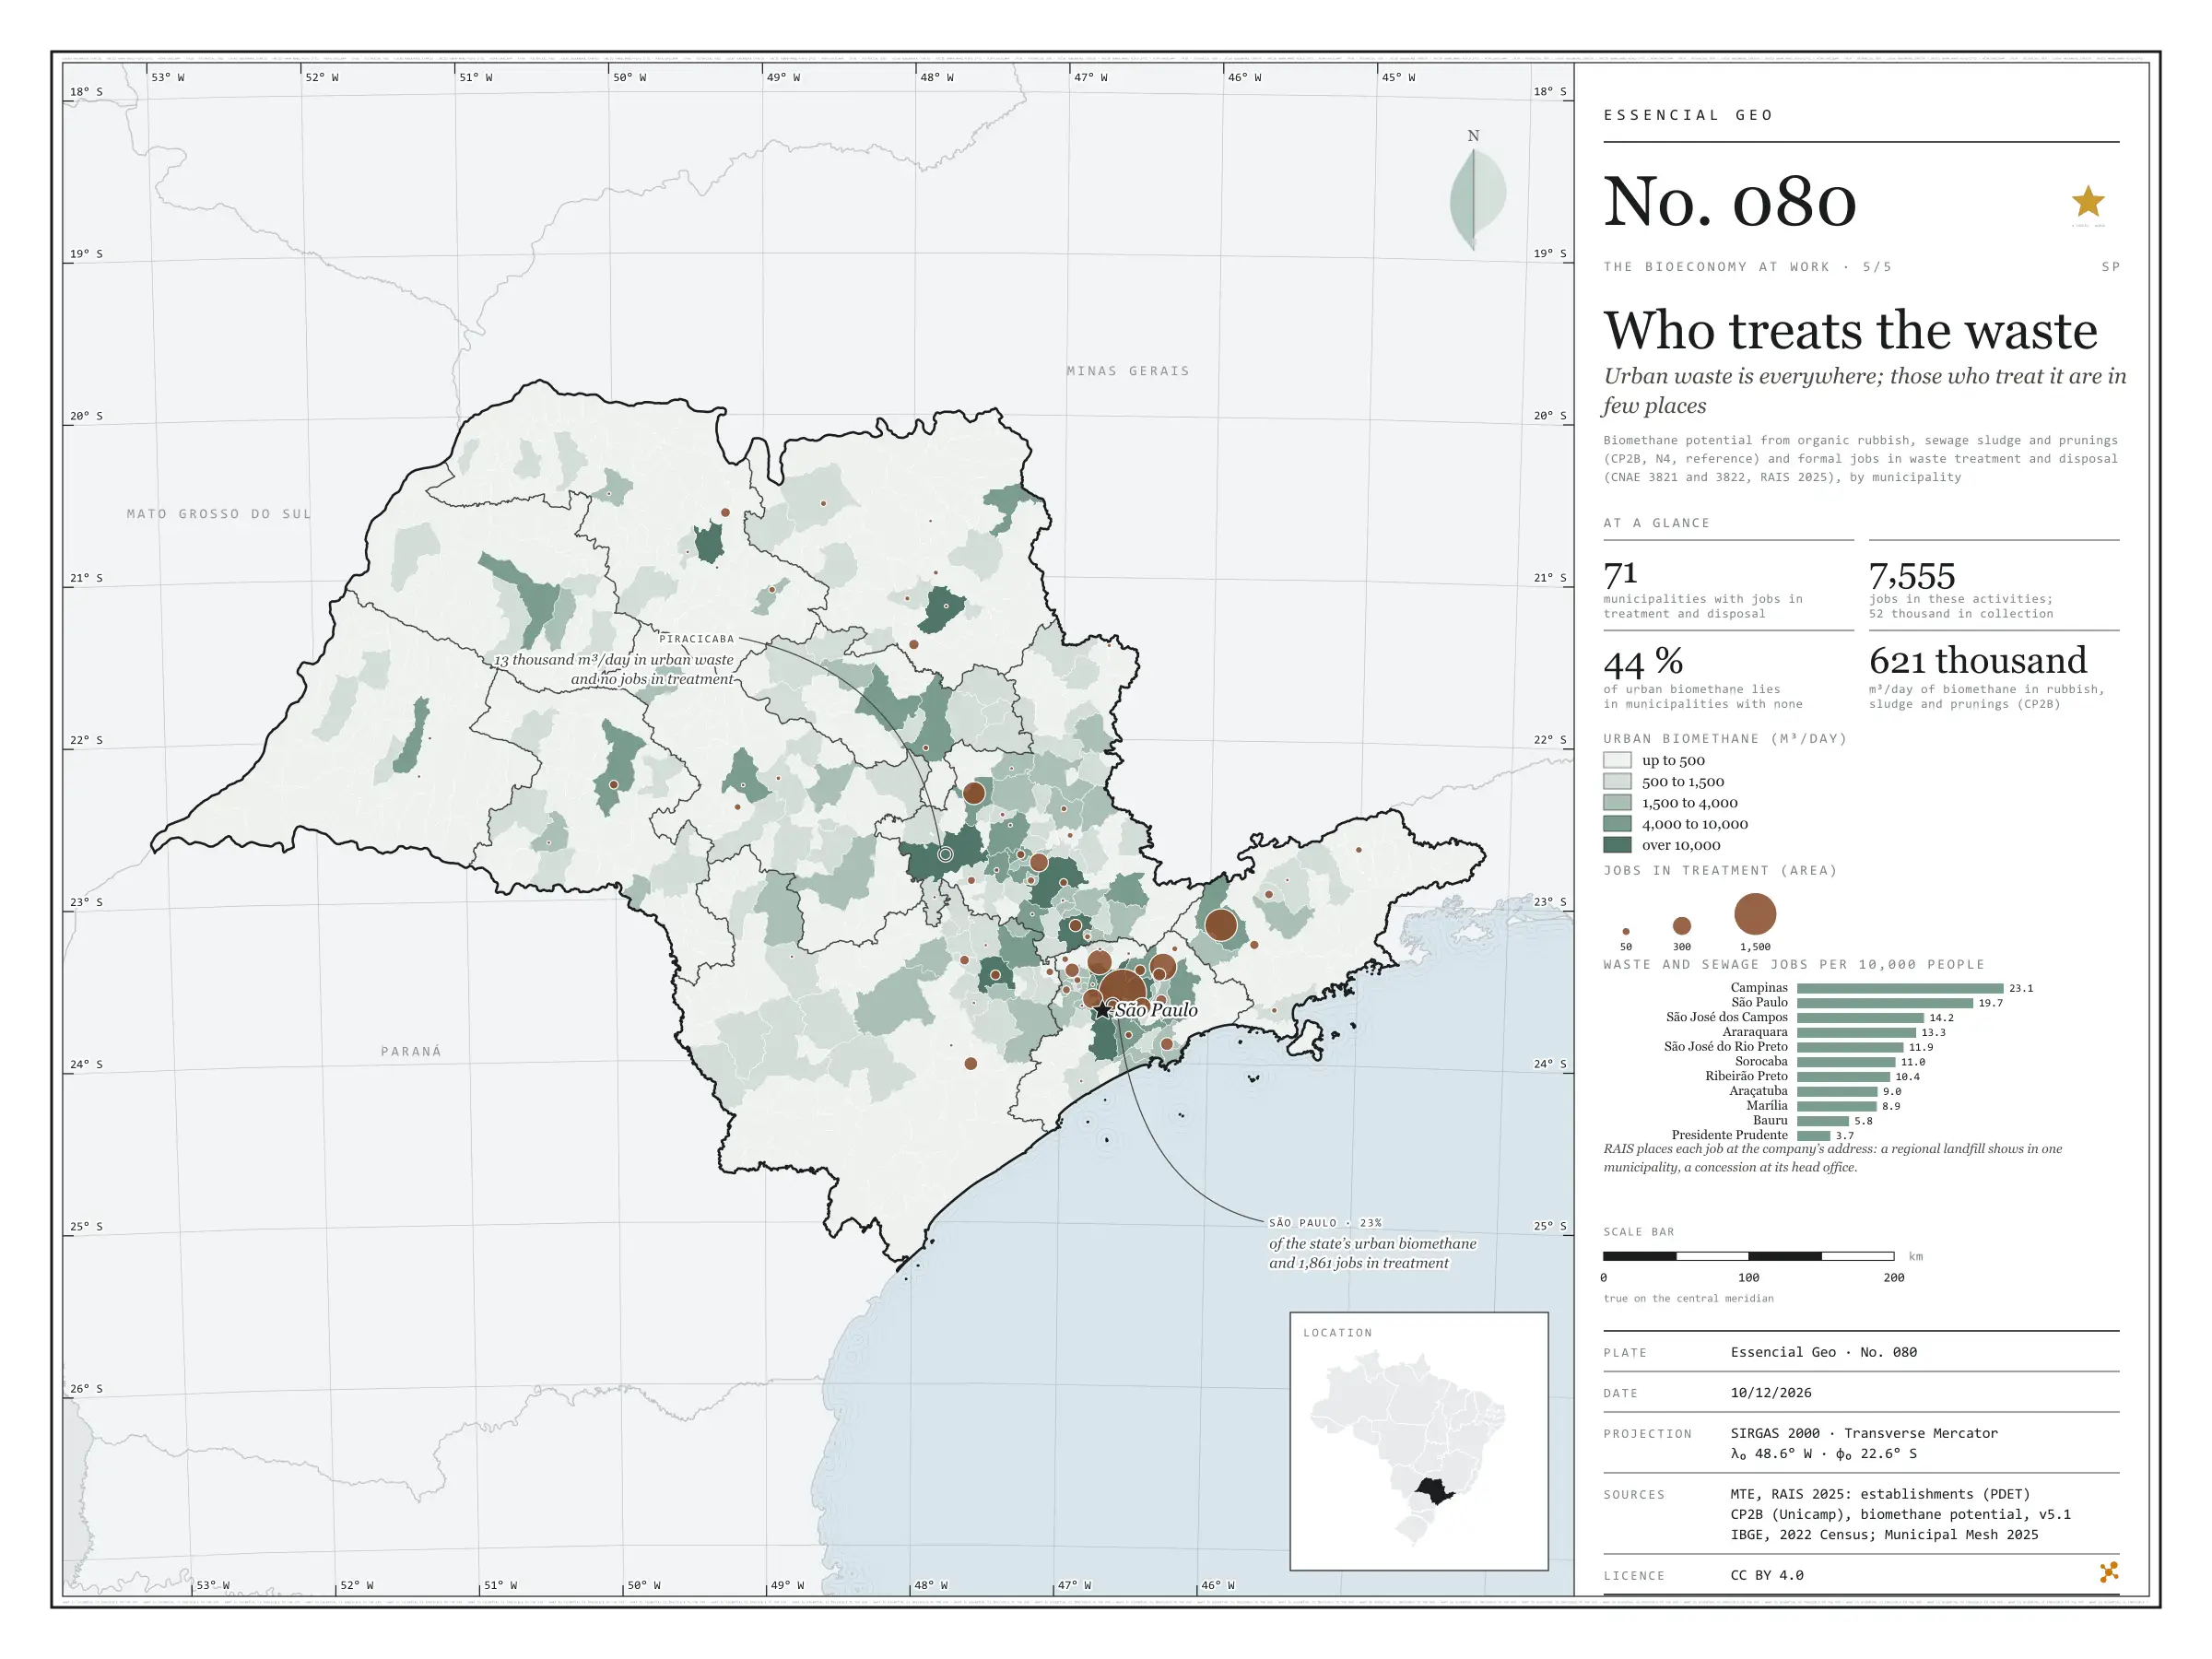
Urban waste is everywhere; those who treat it are in few places
Fig. 080São Paulo State (SP)EPSG:4674Source: MTE/PDET, CP2B (Unicamp), IBGE
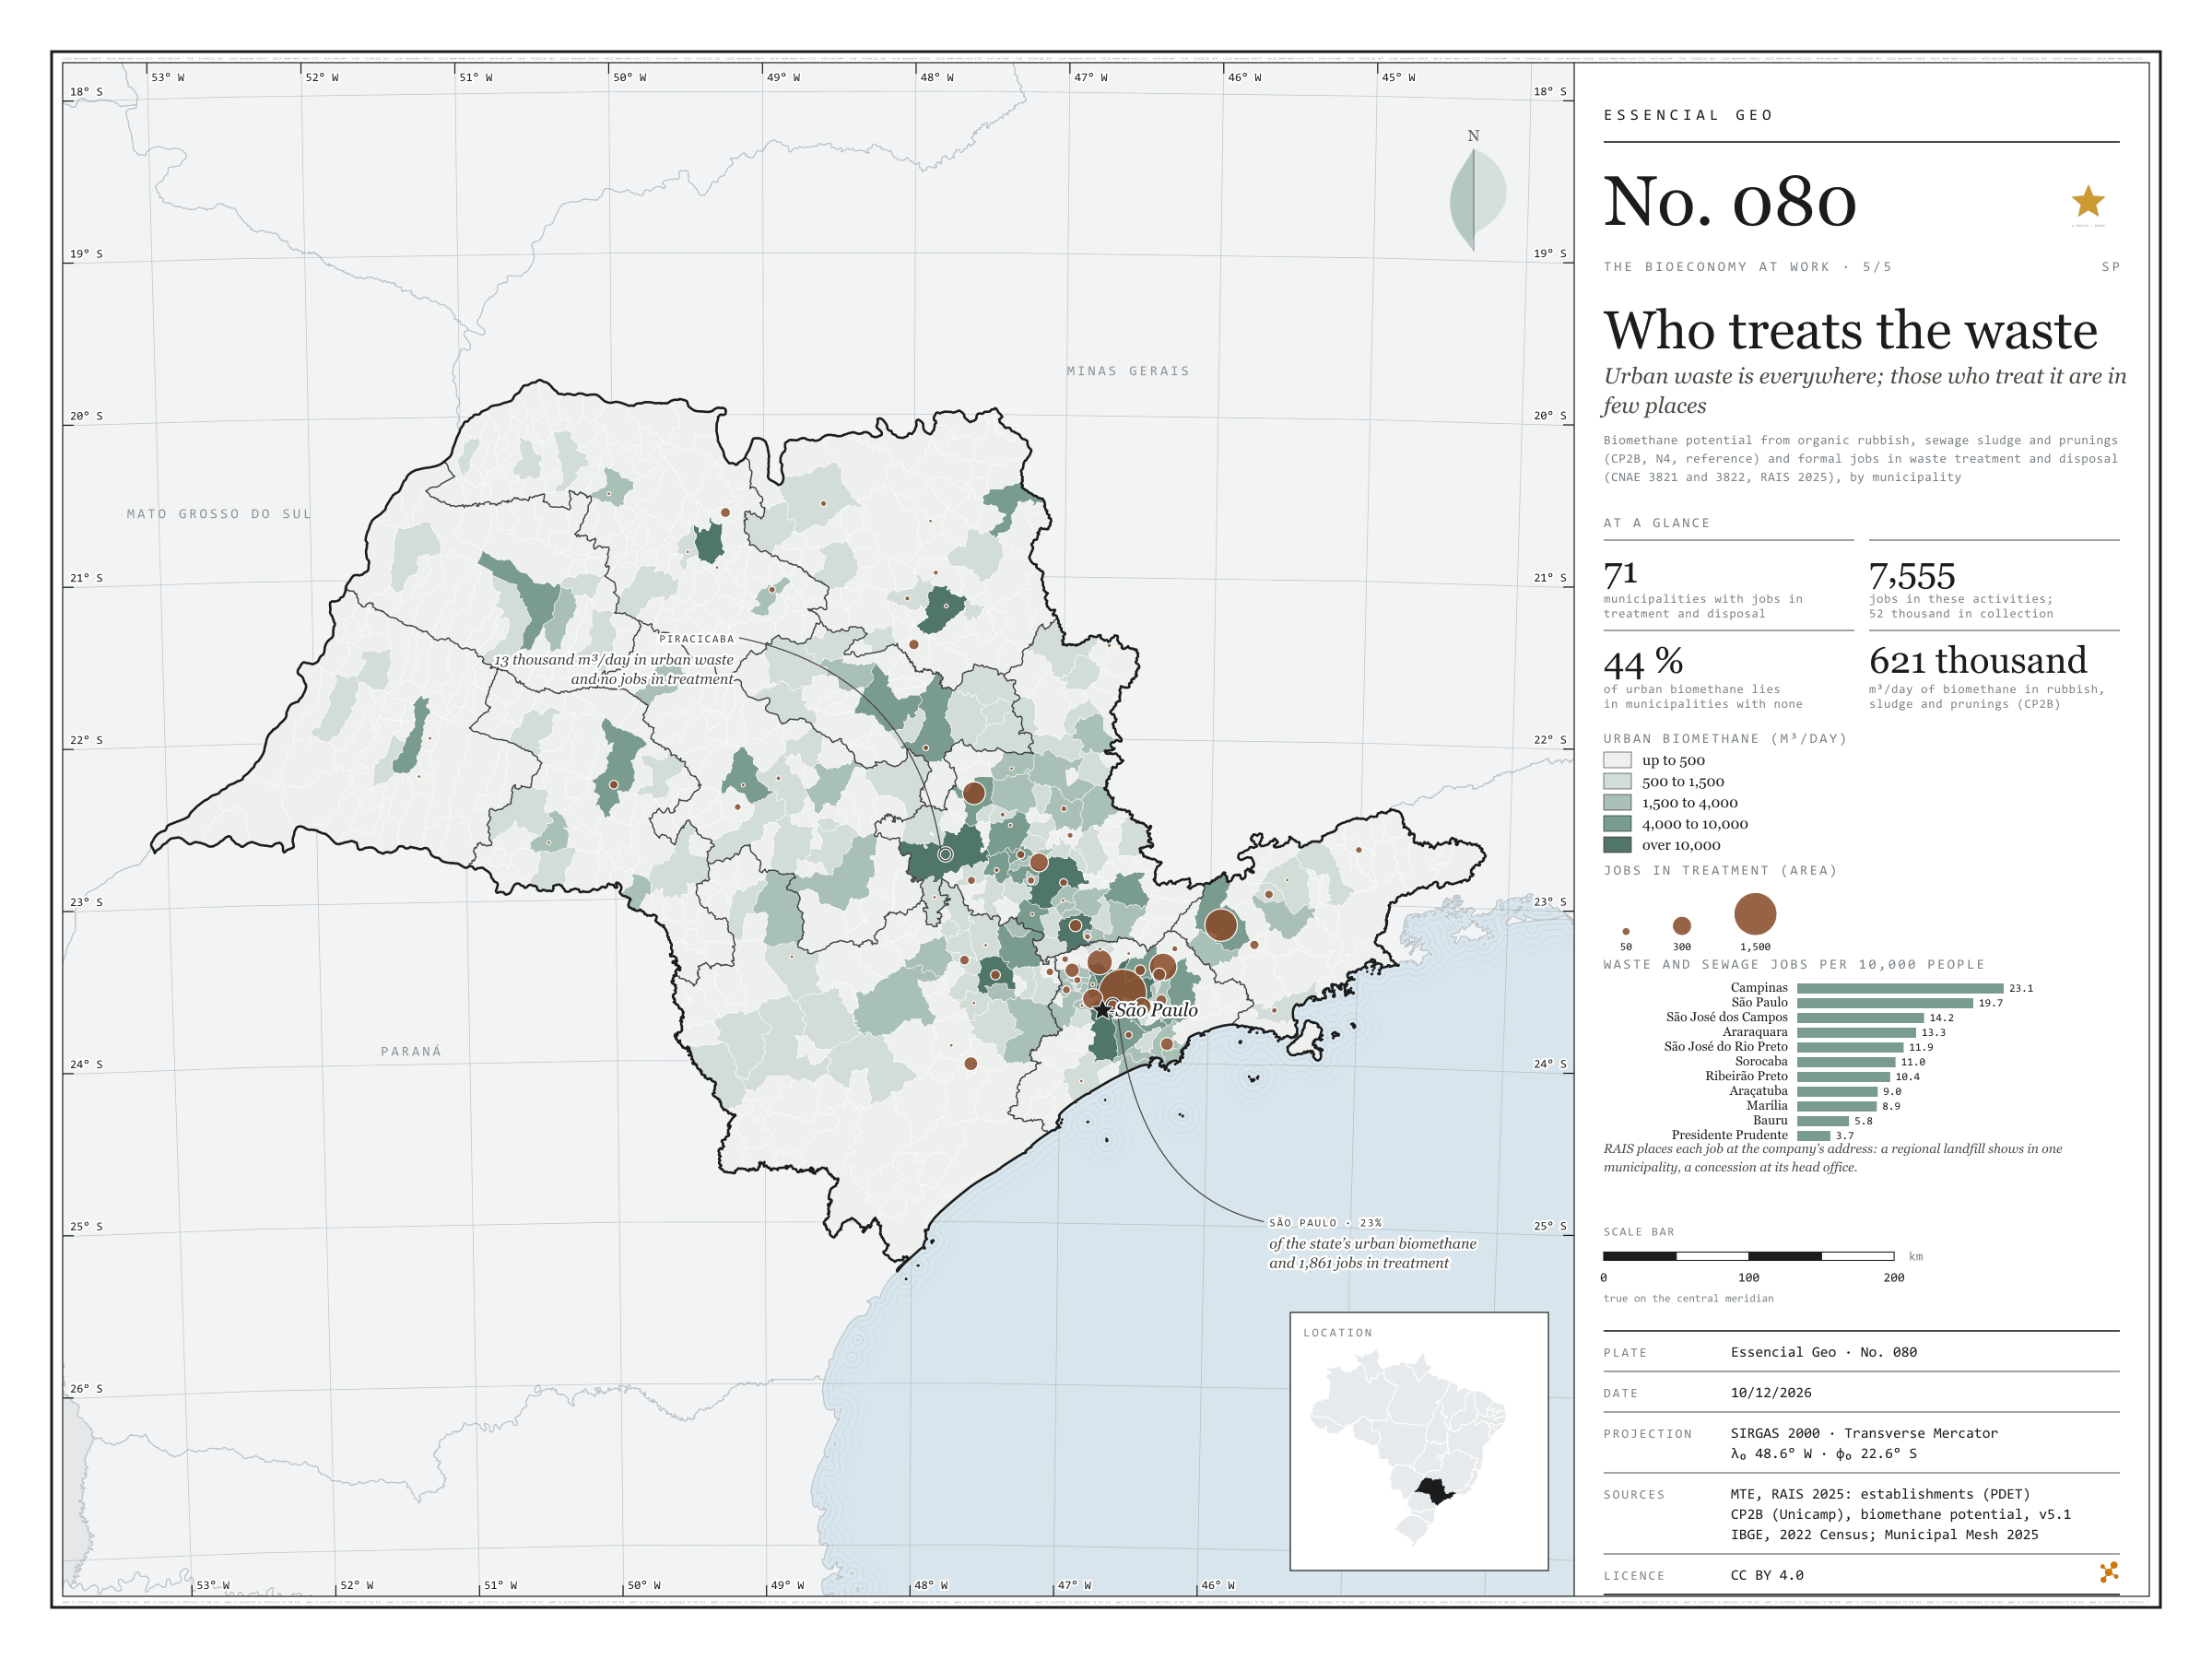
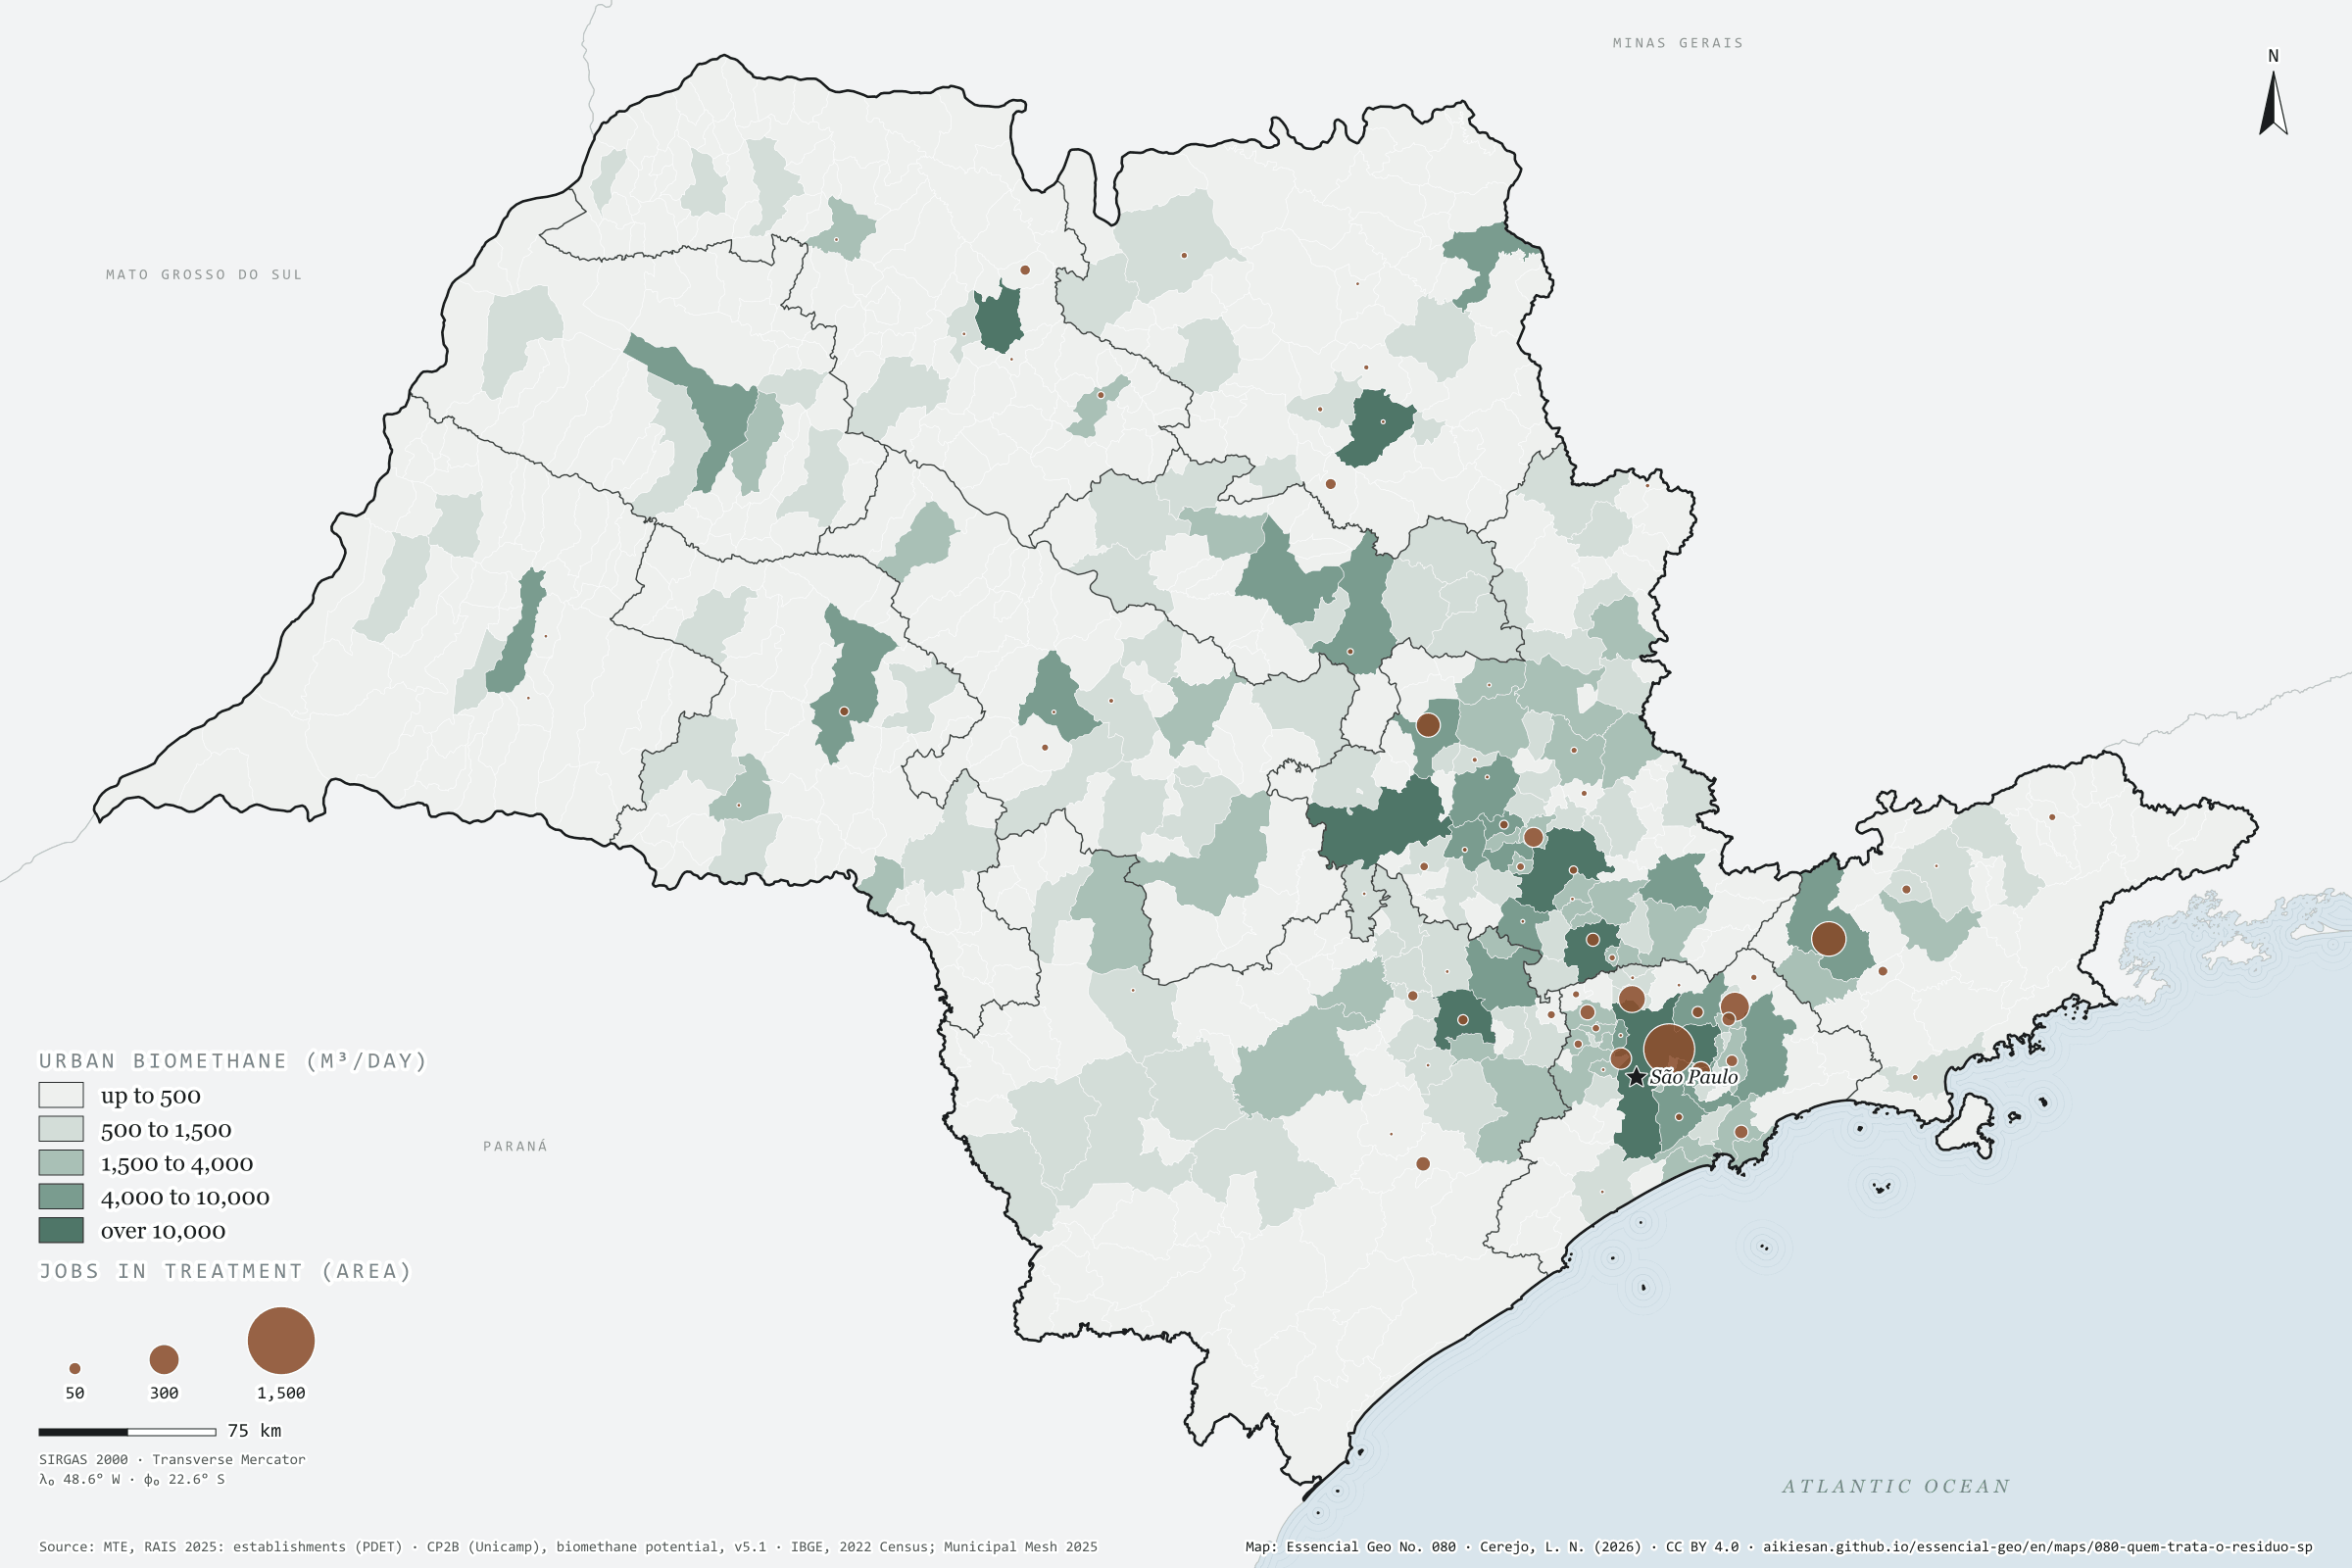
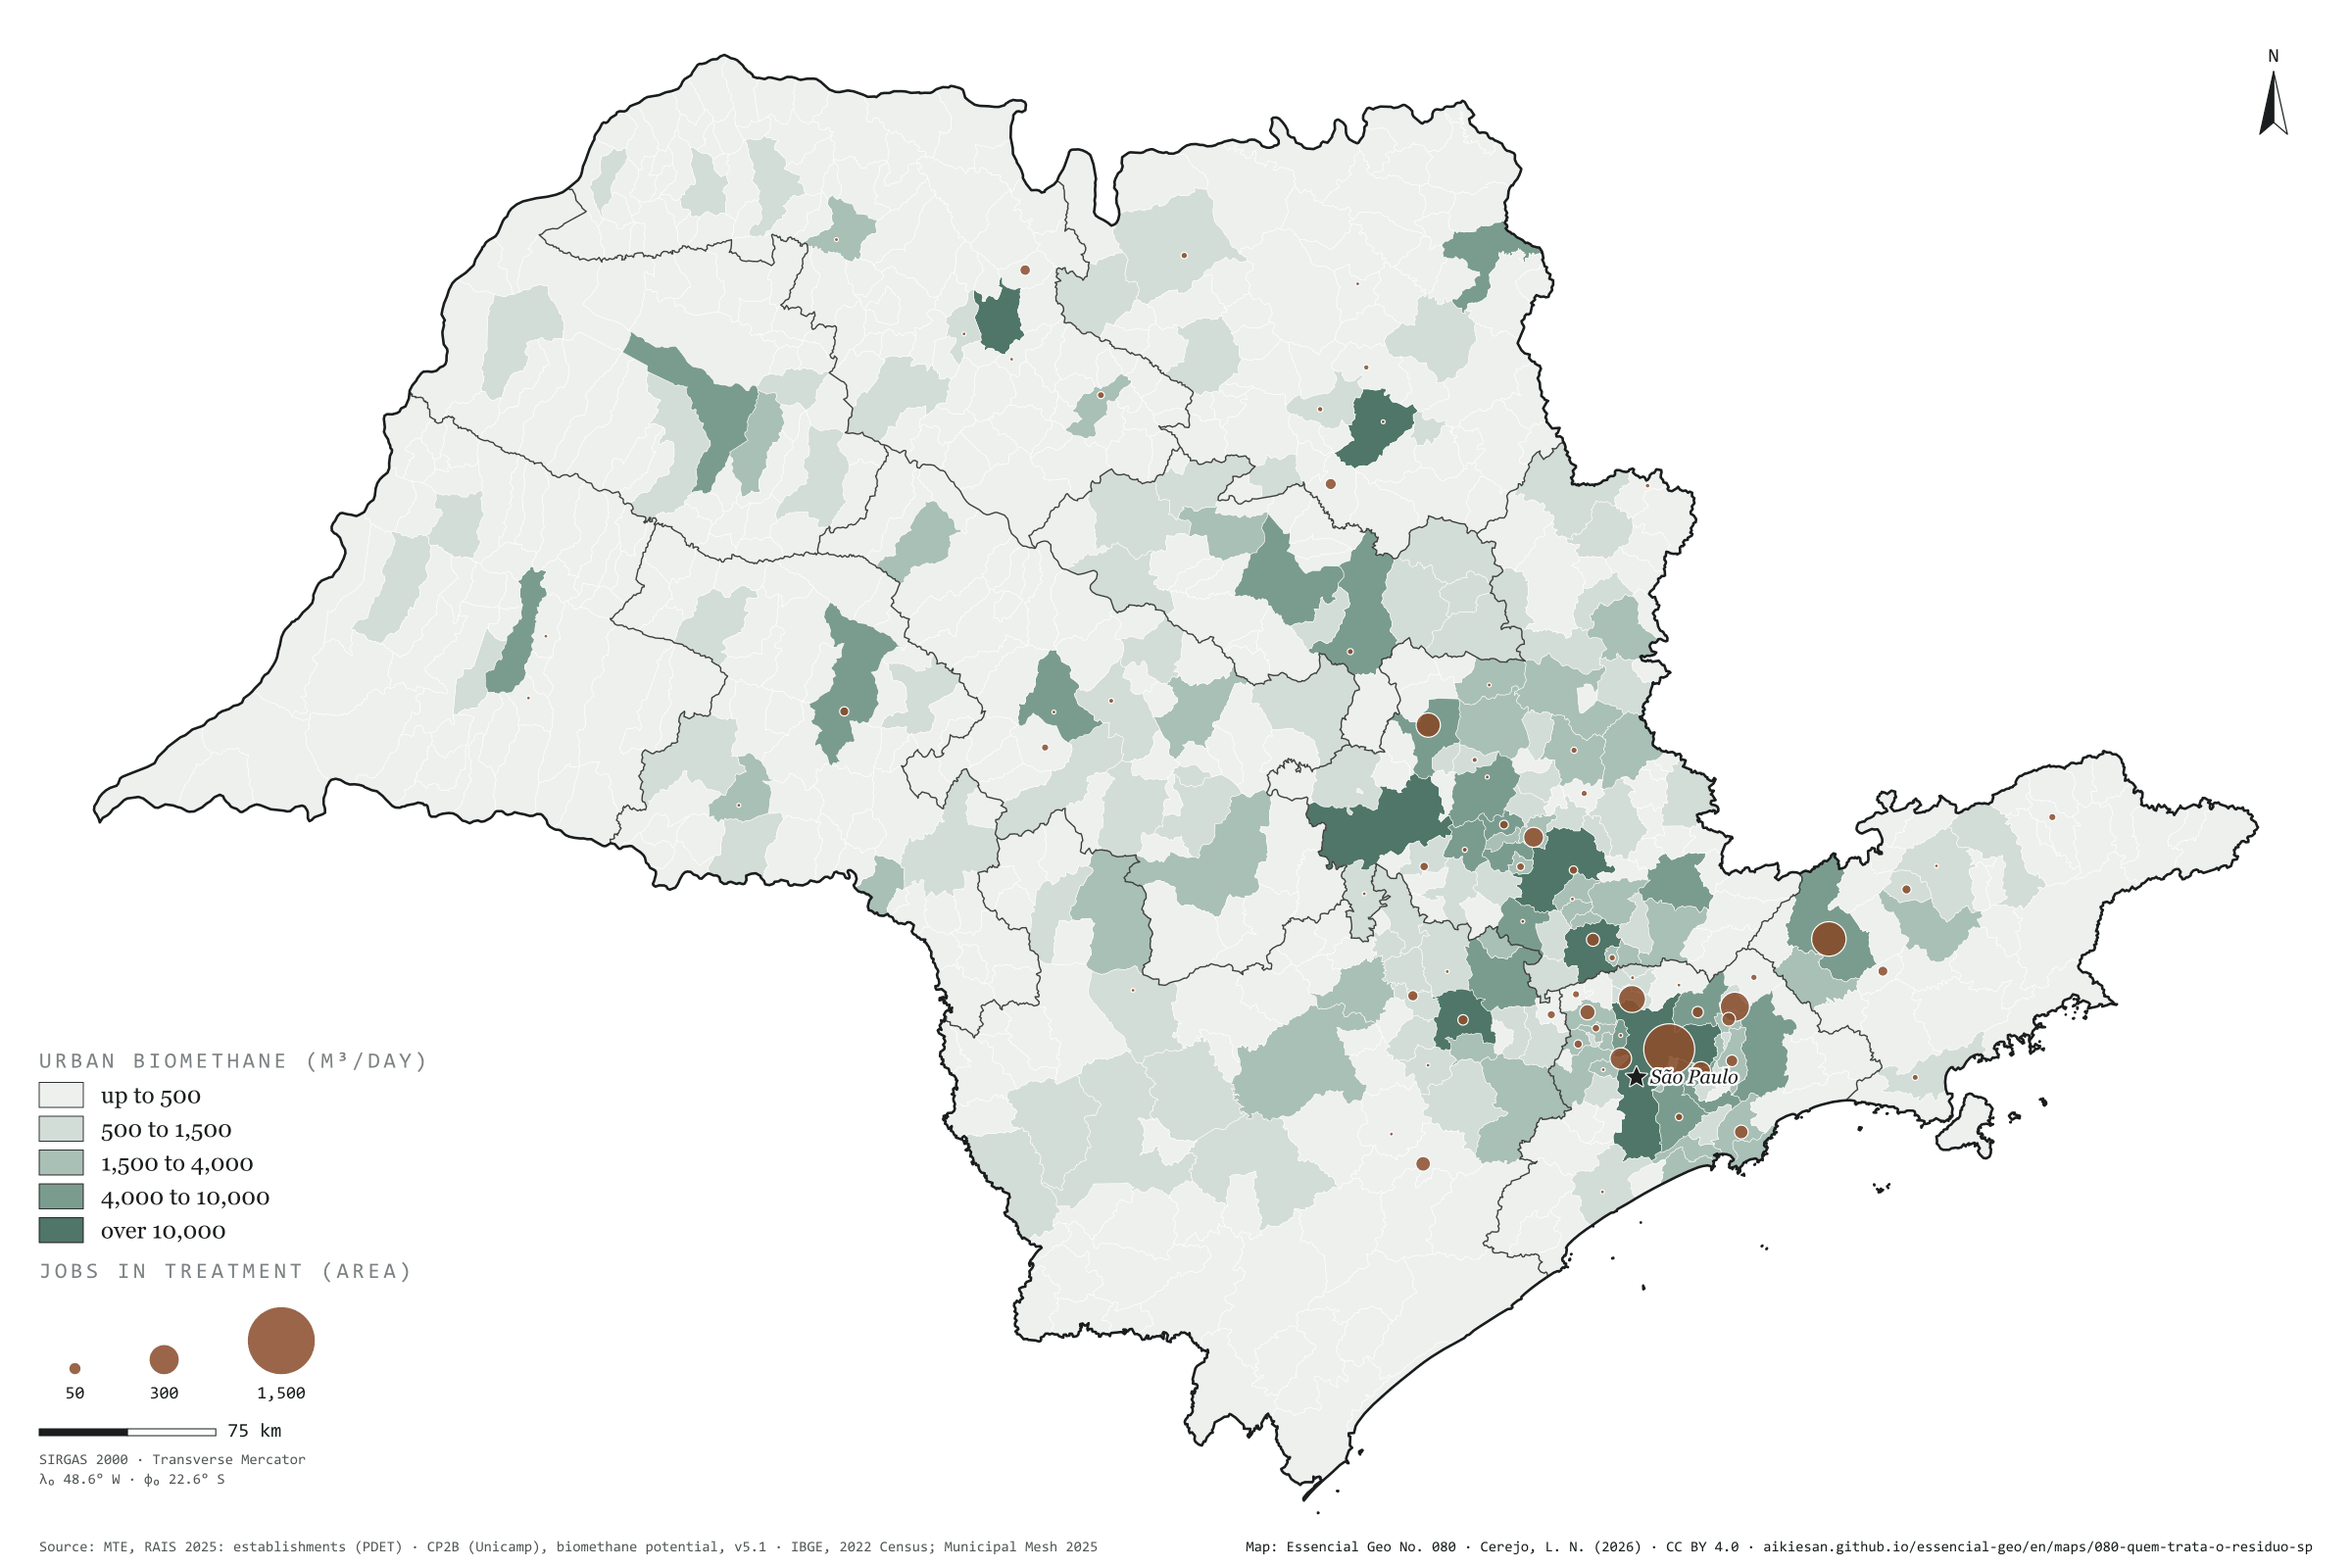
São Paulo’s organic rubbish, sewage sludge and prunings would yield 621,000 m³ of biomethane a day at CP2B’s accessible level, and that matter is in every town. Those who treat it are not. Only 71 of the 645 municipalities have formal jobs in waste treatment and disposal, landfills, composting and biogas plants: 7,555 in the state, against 52,000 in collection. The capital has 23% of urban biomethane and 1,861 of those jobs; São José dos Campos, Arujá and Caieiras come next. Yet 44% of urban biomethane lies in municipalities with no treatment jobs at all: Piracicaba has 13,000 m³ a day and none; São José do Rio Preto, 12,000 and none. There, waste travels to a landfill in another municipality or is handled by the council, outside the private count. Fifth and last plate of the collection “The bioeconomy at work”.
Technical record · downloads · citation
At a glance
Waste and sewage jobs, by activity (jobs)
Collection67.8%
Materials recovery15.8%
Treatment and disposal9.9%
Sewage6.4%
Urban biomethane in municipalities with no treatment jobs
44%
of 621,000 m³/day; 574 municipalities
Layers
municipiospolygon645 municipalities: jobs in sewage, collection, treatment and recovery, jobs per 10,000 people and urban biomethane potential (same GPKG as plate 076)
regioes_intermediariaspolygon11 intermediate geographic regions
Urban-waste biomethane potential by municipality (CP2B v5.1, level N4, reference scenario: organic waste, sewage sludge and prunings), in five classes, and circles proportional to active jobs on 31/12/2025 in waste treatment and disposal (CNAE 38.21 and 38.22, RAIS 2025).
The map without a frame, with legend, scale, reference system and credit written on it: ready for papers, lectures and slides. In two versions: with the basemap (neighbours and sea) or only the mapped area, on white.
CEREJO, Lucas Nakamura. Quem trata o resíduo: o resíduo urbano está em toda parte; quem o trata, em poucos lugares. Versão 1.0.0. [S. l.]: Essencial, 2026. Conjunto de dados. Disponível em: https://aikiesan.github.io/essencial-geo/en/maps/080-quem-trata-o-residuo-sp/. Acesso em: 10 nov. 2026.
Cerejo, L. N. (2026). Quem trata o resíduo: o resíduo urbano está em toda parte; quem o trata, em poucos lugares [Who treats the waste: Urban waste is everywhere; those who treat it are in few places] (Version 1.0.0) [Data set]. Essencial. https://aikiesan.github.io/essencial-geo/en/maps/080-quem-trata-o-residuo-sp/
@dataset{cerejo2026_quem_trata_o_residuo_sp,
  author    = {Cerejo, Lucas Nakamura},
  title     = {Quem trata o resíduo: O resíduo urbano está em toda parte; quem o trata, em poucos lugares},
  year      = {2026},
  publisher = {Essencial},
  version   = {1.0.0},
  url       = {https://aikiesan.github.io/essencial-geo/en/maps/080-quem-trata-o-residuo-sp/},
  language  = {portuguese},
  note      = {English title: Who treats the waste: Urban waste is everywhere; those who treat it are in few places. Licence CC BY 4.0}
}