Which bioeconomy
Farming leads inland and in the Ribeira Valley; food factories, around the towns
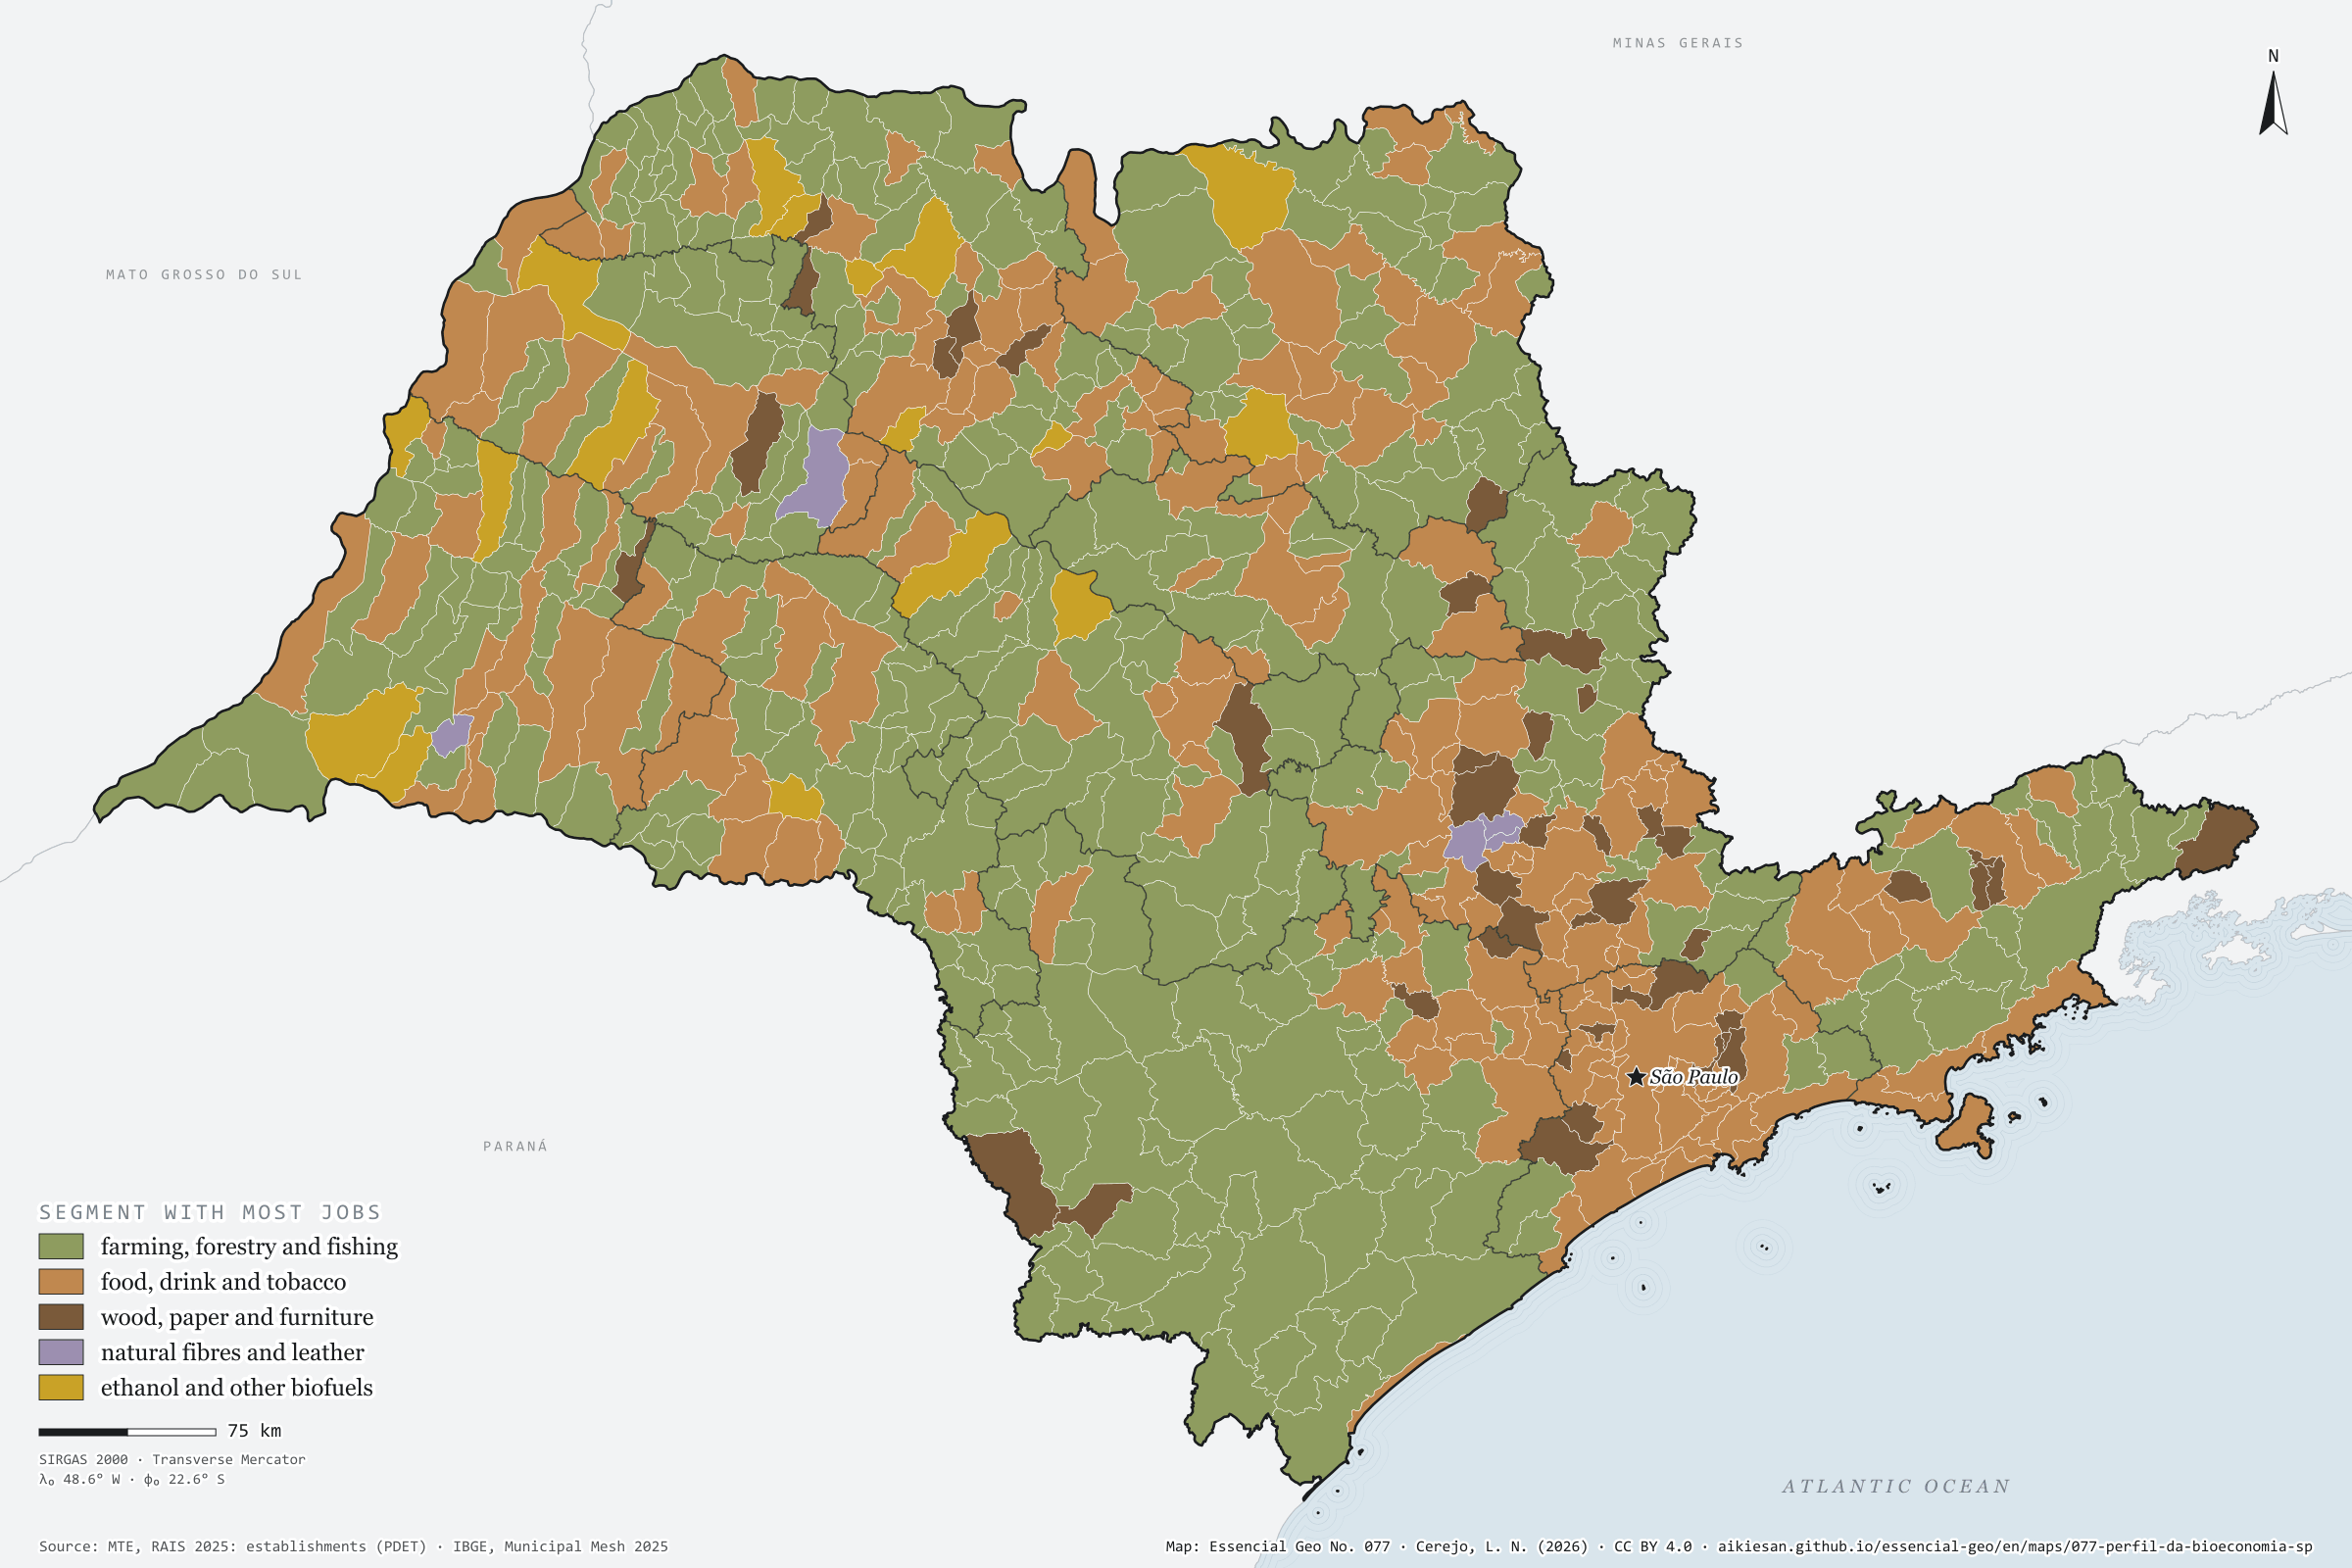
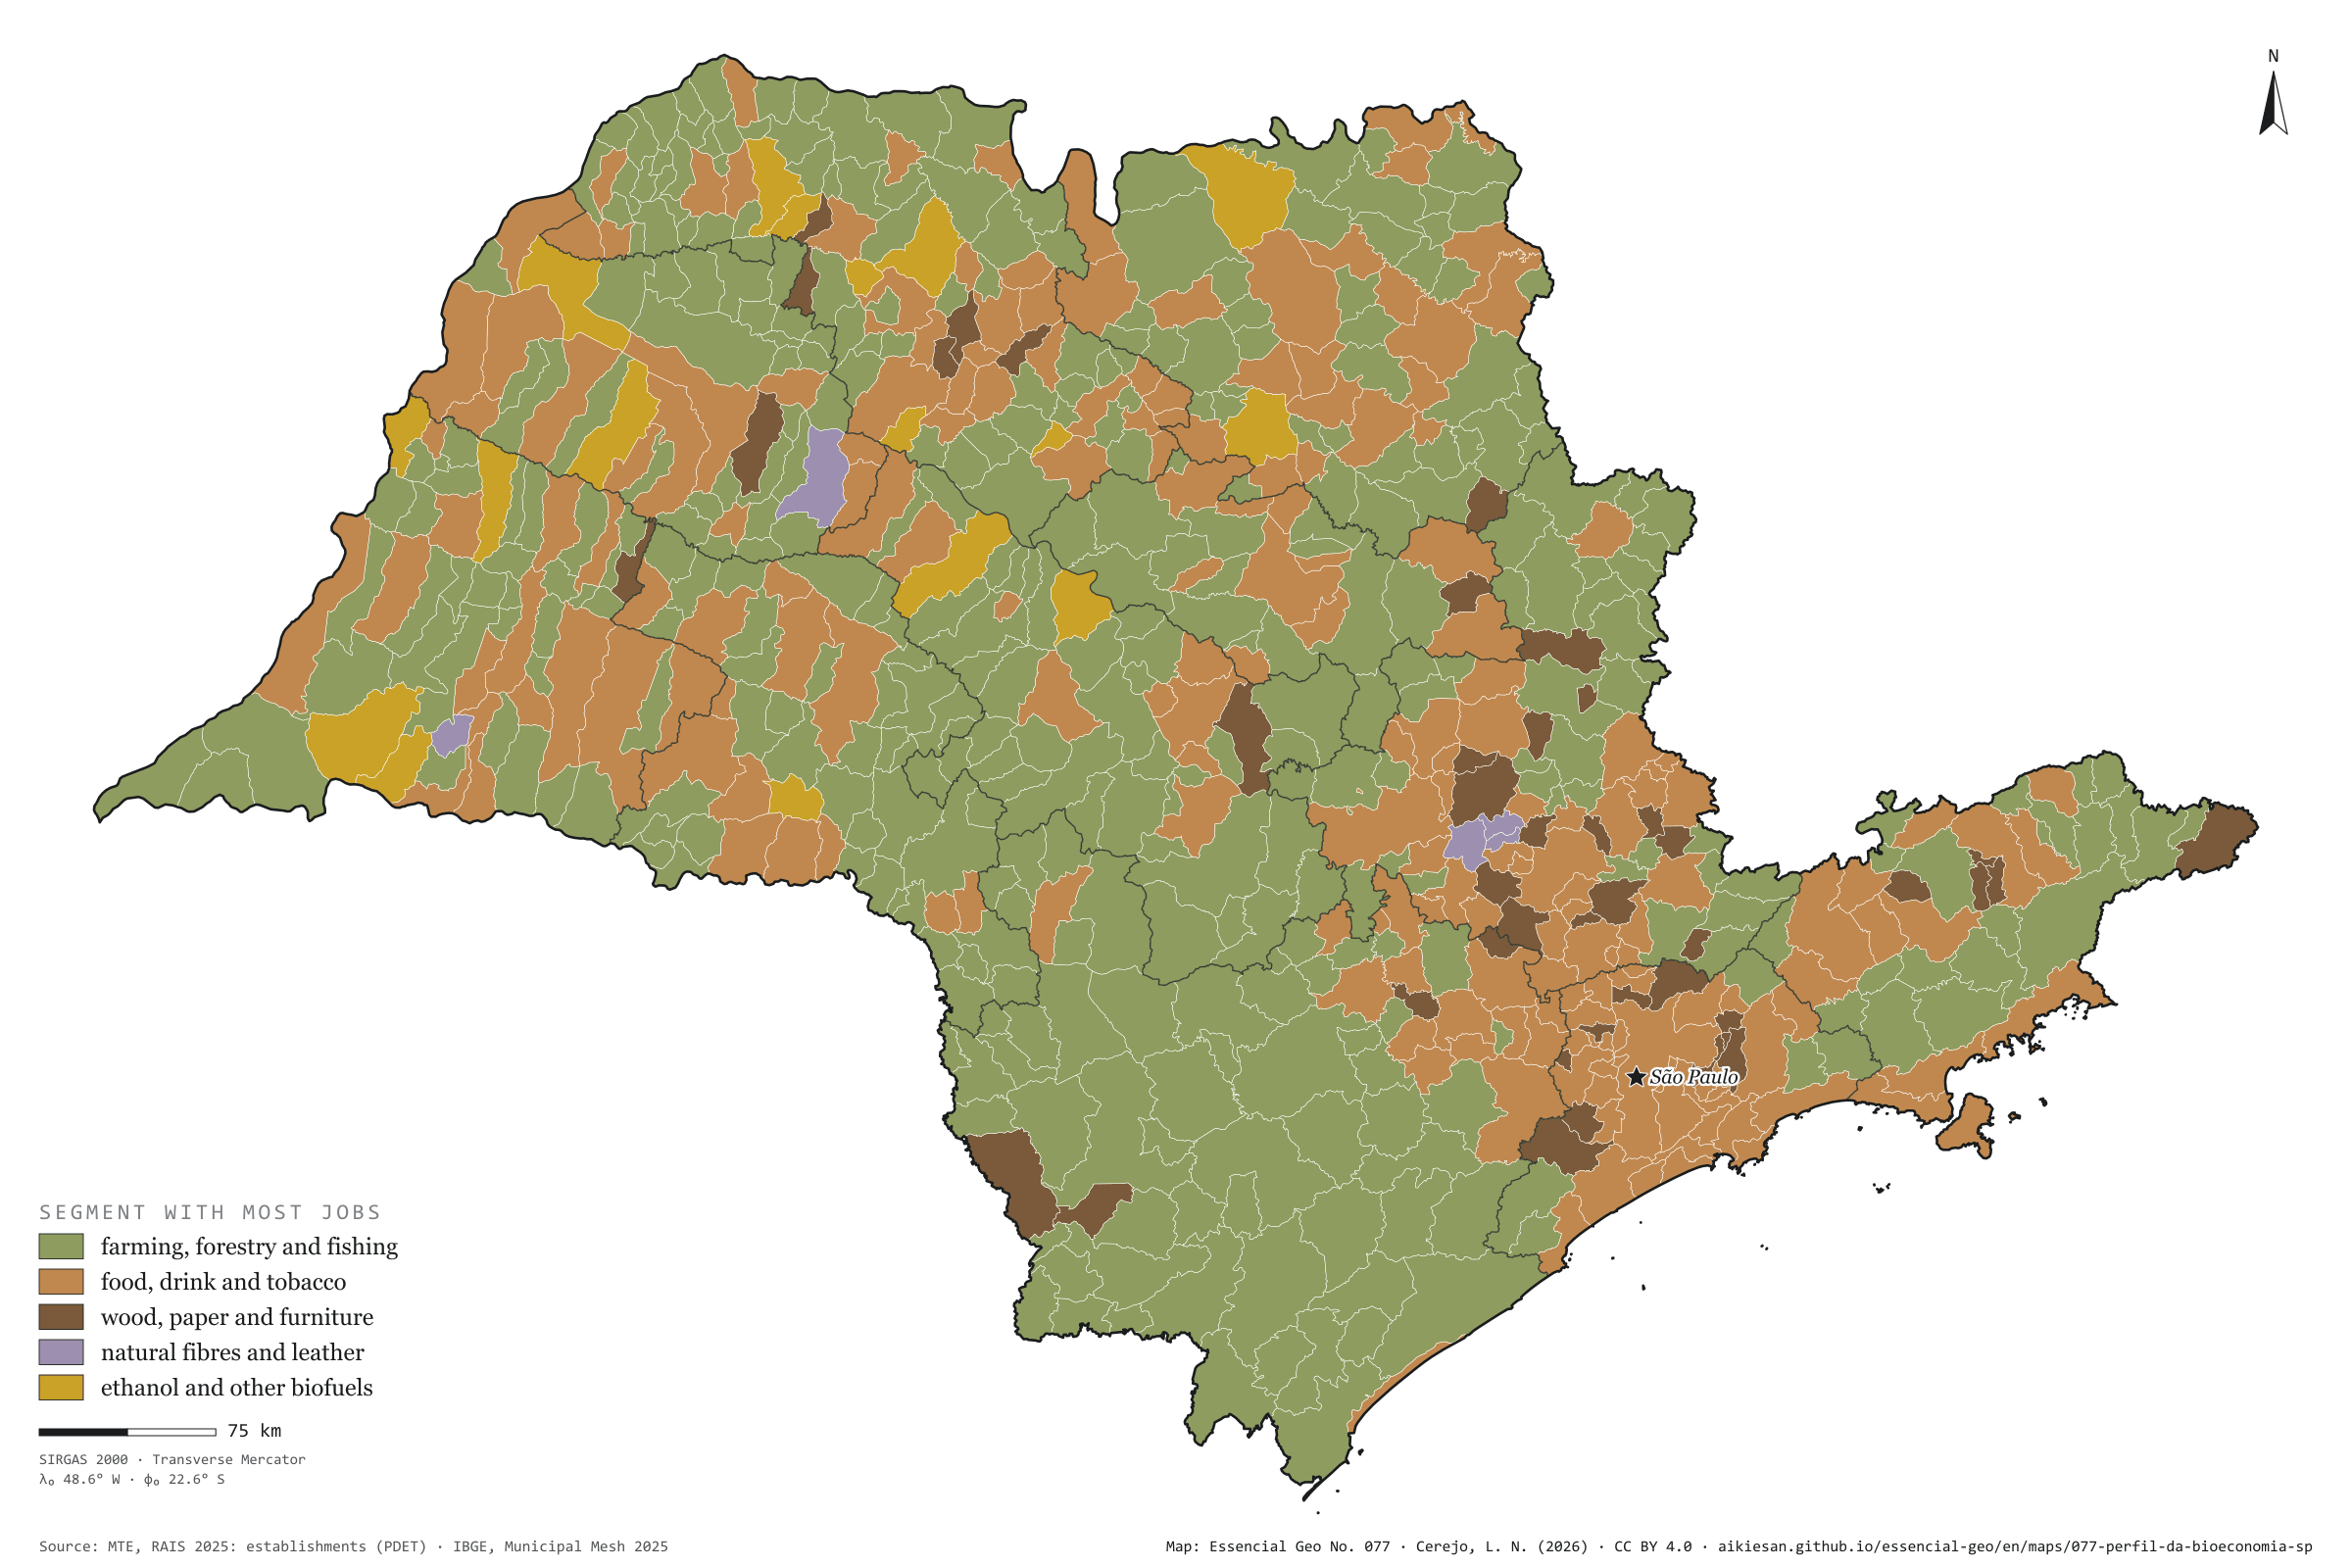
Record, downloads and citationSão Paulo’s bioeconomy is, above all, a food factory: food, drink and tobacco account for 496,000 of the 1.05 million formal jobs, 47%, against 45% in Brazil. Farming, fishing and forestry have 350,000, 33%, below the country’s 38%. Wood, paper and wooden furniture have 147,000; biofuels, 43,000; natural fibres and leather, 18,000. By municipality, farming leads in 376 of the 645, nearly all small, in the west and the Ribeira Valley. The food industry leads in 203, around the mid-sized towns and the metropolis. Wood and paper lead in 44, such as Suzano, with 3,866 jobs. Ethanol mills lead in 17, among them Guaíra, with 6,245 jobs in biofuels. Fibres and leather lead in 5. Second plate of the collection “The bioeconomy at work”.
Technical record · downloads · citation
At a glance
- Food, drink and tobacco 47.1%
- Farming, fishing and forestry 33.2%
- Wood and paper 13.9%
- Biofuels 4%
- Fibres and leather 1.7%
376 municipalities
Layers
- municipios polygon 645 municipalities: bioeconomy jobs by segment and dominant segment (same GPKG as plate 076)
- regioes_intermediarias polygon 11 intermediate geographic regions
- limite_estadual polygon State boundary
Metadata
- Sources
- MTE/PDET — RAIS 2025: establishments (RAIS ESTAB PUB), active jobs on 31/12 by CNAE 2.0 subclass and municipality (2025)
JRC (European Commission) — Jobs and wealth in the European Union bioeconomy: scope of bioeconomy sectors (2024)
IBGE — Municipal Mesh 2025 (2025) - Extent
- São Paulo State (SP)
- CRS / Projection
- SIRGAS 2000 (EPSG:4674)
EPSG:4674 - Software
- Node.js · d3-geo · QGIS
- Method
- Bioeconomy active jobs on 31/12/2025, within the European JRC scope, split into five segments by CNAE subclass; each municipality takes the colour of the segment with most jobs.
- Version
- v1.0.0
- Licence
- CC BY 4.0
- DOI
- being registered on Zenodo
Downloads
- GPKG Municipalities with the RAIS bioeconomy and the CP2B potential, SIRGAS 2000, with QGIS styles (.gpkg) 4.5 MB
- CSV Municipal table (.csv) 90 kB
- SVG Vector plate, for printing (.svg) 2.2 MB
- PNG Plate (PNG, 2400 px) (.png) 0.3 MB

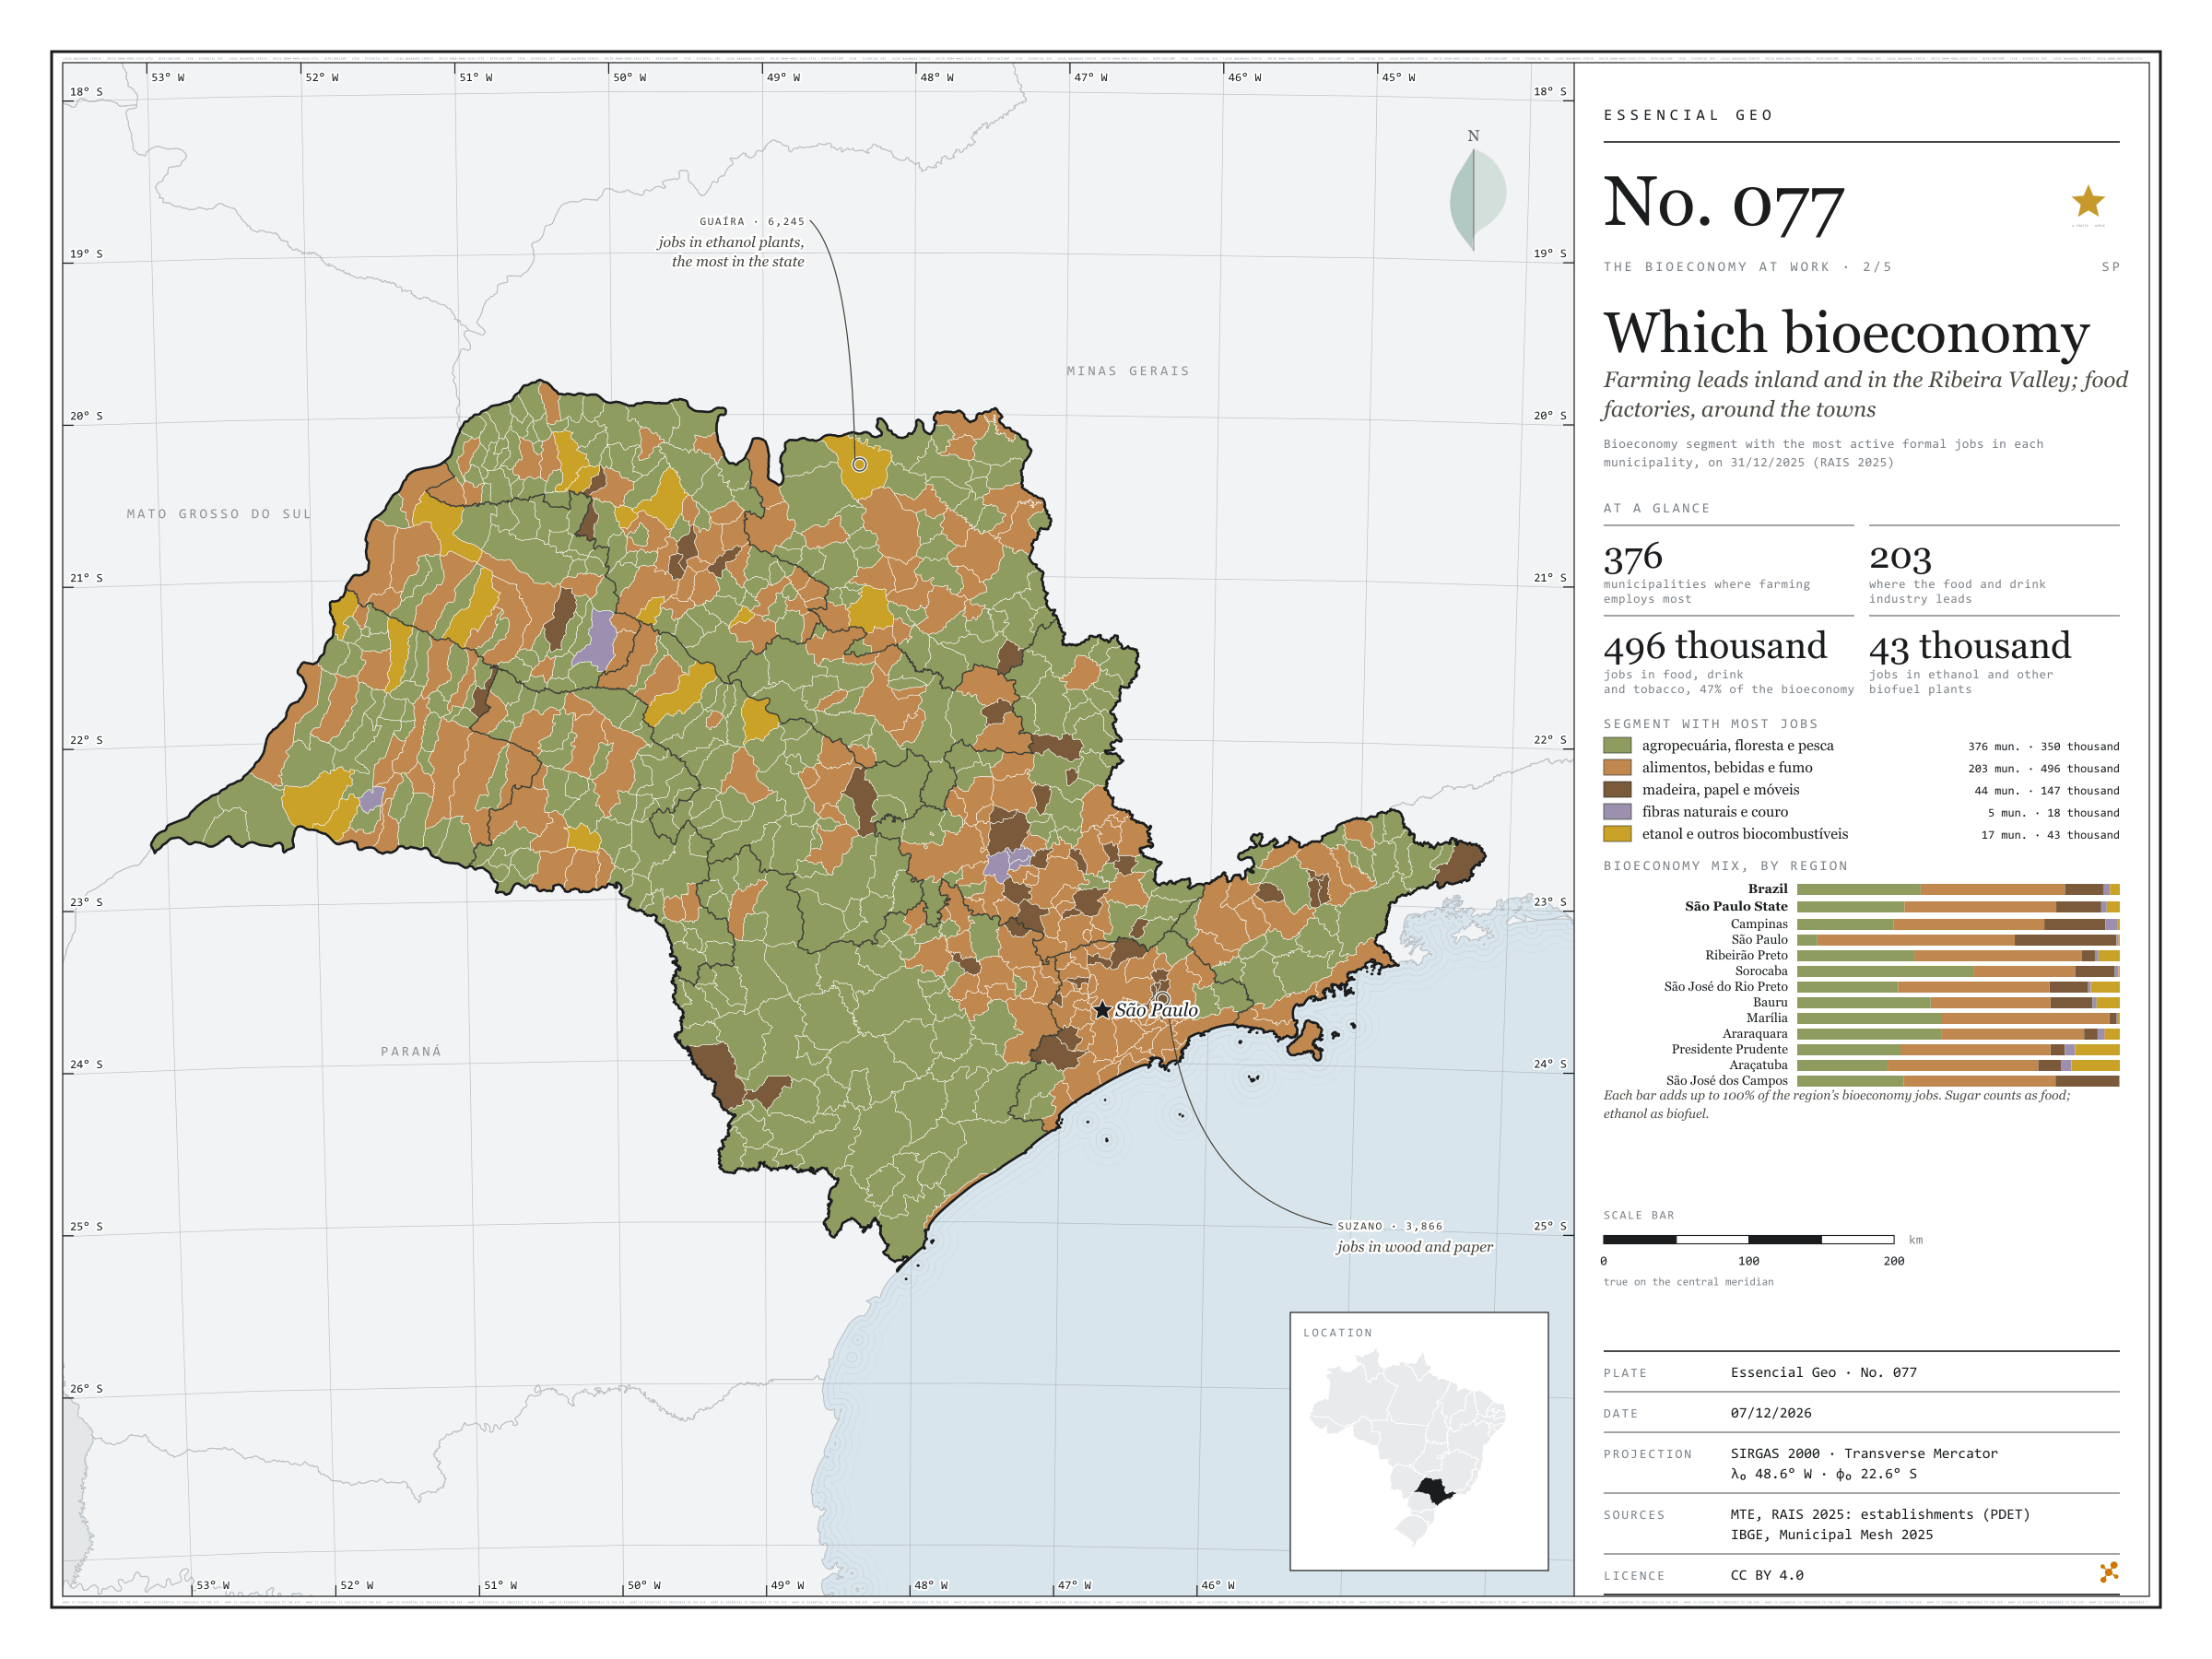
Figure to reuse
The map without a frame, with legend, scale, reference system and credit written on it: ready for papers, lectures and slides. In two versions: with the basemap (neighbours and sea) or only the mapped area, on white.
With basemap (PNG) Without basemap (PNG) QR code (SVG)
Point a camera at it to open this page.
How to cite
CEREJO, Lucas Nakamura. Que bioeconomia: o campo lidera no interior e no Vale do Ribeira; a fábrica de alimentos, em volta das cidades. Versão 1.0.0. [S. l.]: Essencial, 2026. Conjunto de dados. Disponível em: https://aikiesan.github.io/essencial-geo/en/maps/077-perfil-da-bioeconomia-sp/. Acesso em: 10 nov. 2026.
Cerejo, L. N. (2026). Que bioeconomia: o campo lidera no interior e no Vale do Ribeira; a fábrica de alimentos, em volta das cidades [Which bioeconomy: Farming leads inland and in the Ribeira Valley; food factories, around the towns] (Version 1.0.0) [Data set]. Essencial. https://aikiesan.github.io/essencial-geo/en/maps/077-perfil-da-bioeconomia-sp/
@dataset{cerejo2026_perfil_da_bioeconomia_sp,
  author    = {Cerejo, Lucas Nakamura},
  title     = {Que bioeconomia: O campo lidera no interior e no Vale do Ribeira; a fábrica de alimentos, em volta das cidades},
  year      = {2026},
  publisher = {Essencial},
  version   = {1.0.0},
  url       = {https://aikiesan.github.io/essencial-geo/en/maps/077-perfil-da-bioeconomia-sp/},
  language  = {portuguese},
  note      = {English title: Which bioeconomy: Farming leads inland and in the Ribeira Valley; food factories, around the towns. Licence CC BY 4.0}
}