Skip to content
Essencial

Collection · 4 plates

Sanitation and biomethane

São Paulo’s sewage and rubbish tract by tract in the 2022 Census: who is on the mains, where the rest goes, where rubbish burns and how much biomethane sludge could yield.

4 of 4 published

In reading order, from the first to the latest. All collections

The route

Read in order: each plate adds a layer to the one before.

Start with the first plate
  1. Plate 1/4 · No. 051 Sewage on the mains The mains cover the city; the countryside stays on the tank
  2. Plate 2/4 · No. 052 Where the sewage goes Mains in town, pits in the country, rivers at the edge
  3. Plate 3/4 · No. 053 Rubbish outside collection Where the truck does not pass, rubbish burns
  4. Plate 4/4 · No. 054 Sewage, mains and biomethane Sludge gas only exists where sewage reaches the plant
Every plate, in full

No. 051 Census · income Sanitation and biomethane 1/4

Sewage on the mains

The mains cover the city; the countryside stays on the tank

Fig. 051 São Paulo State (SP) EPSG:4674 Source: IBGE

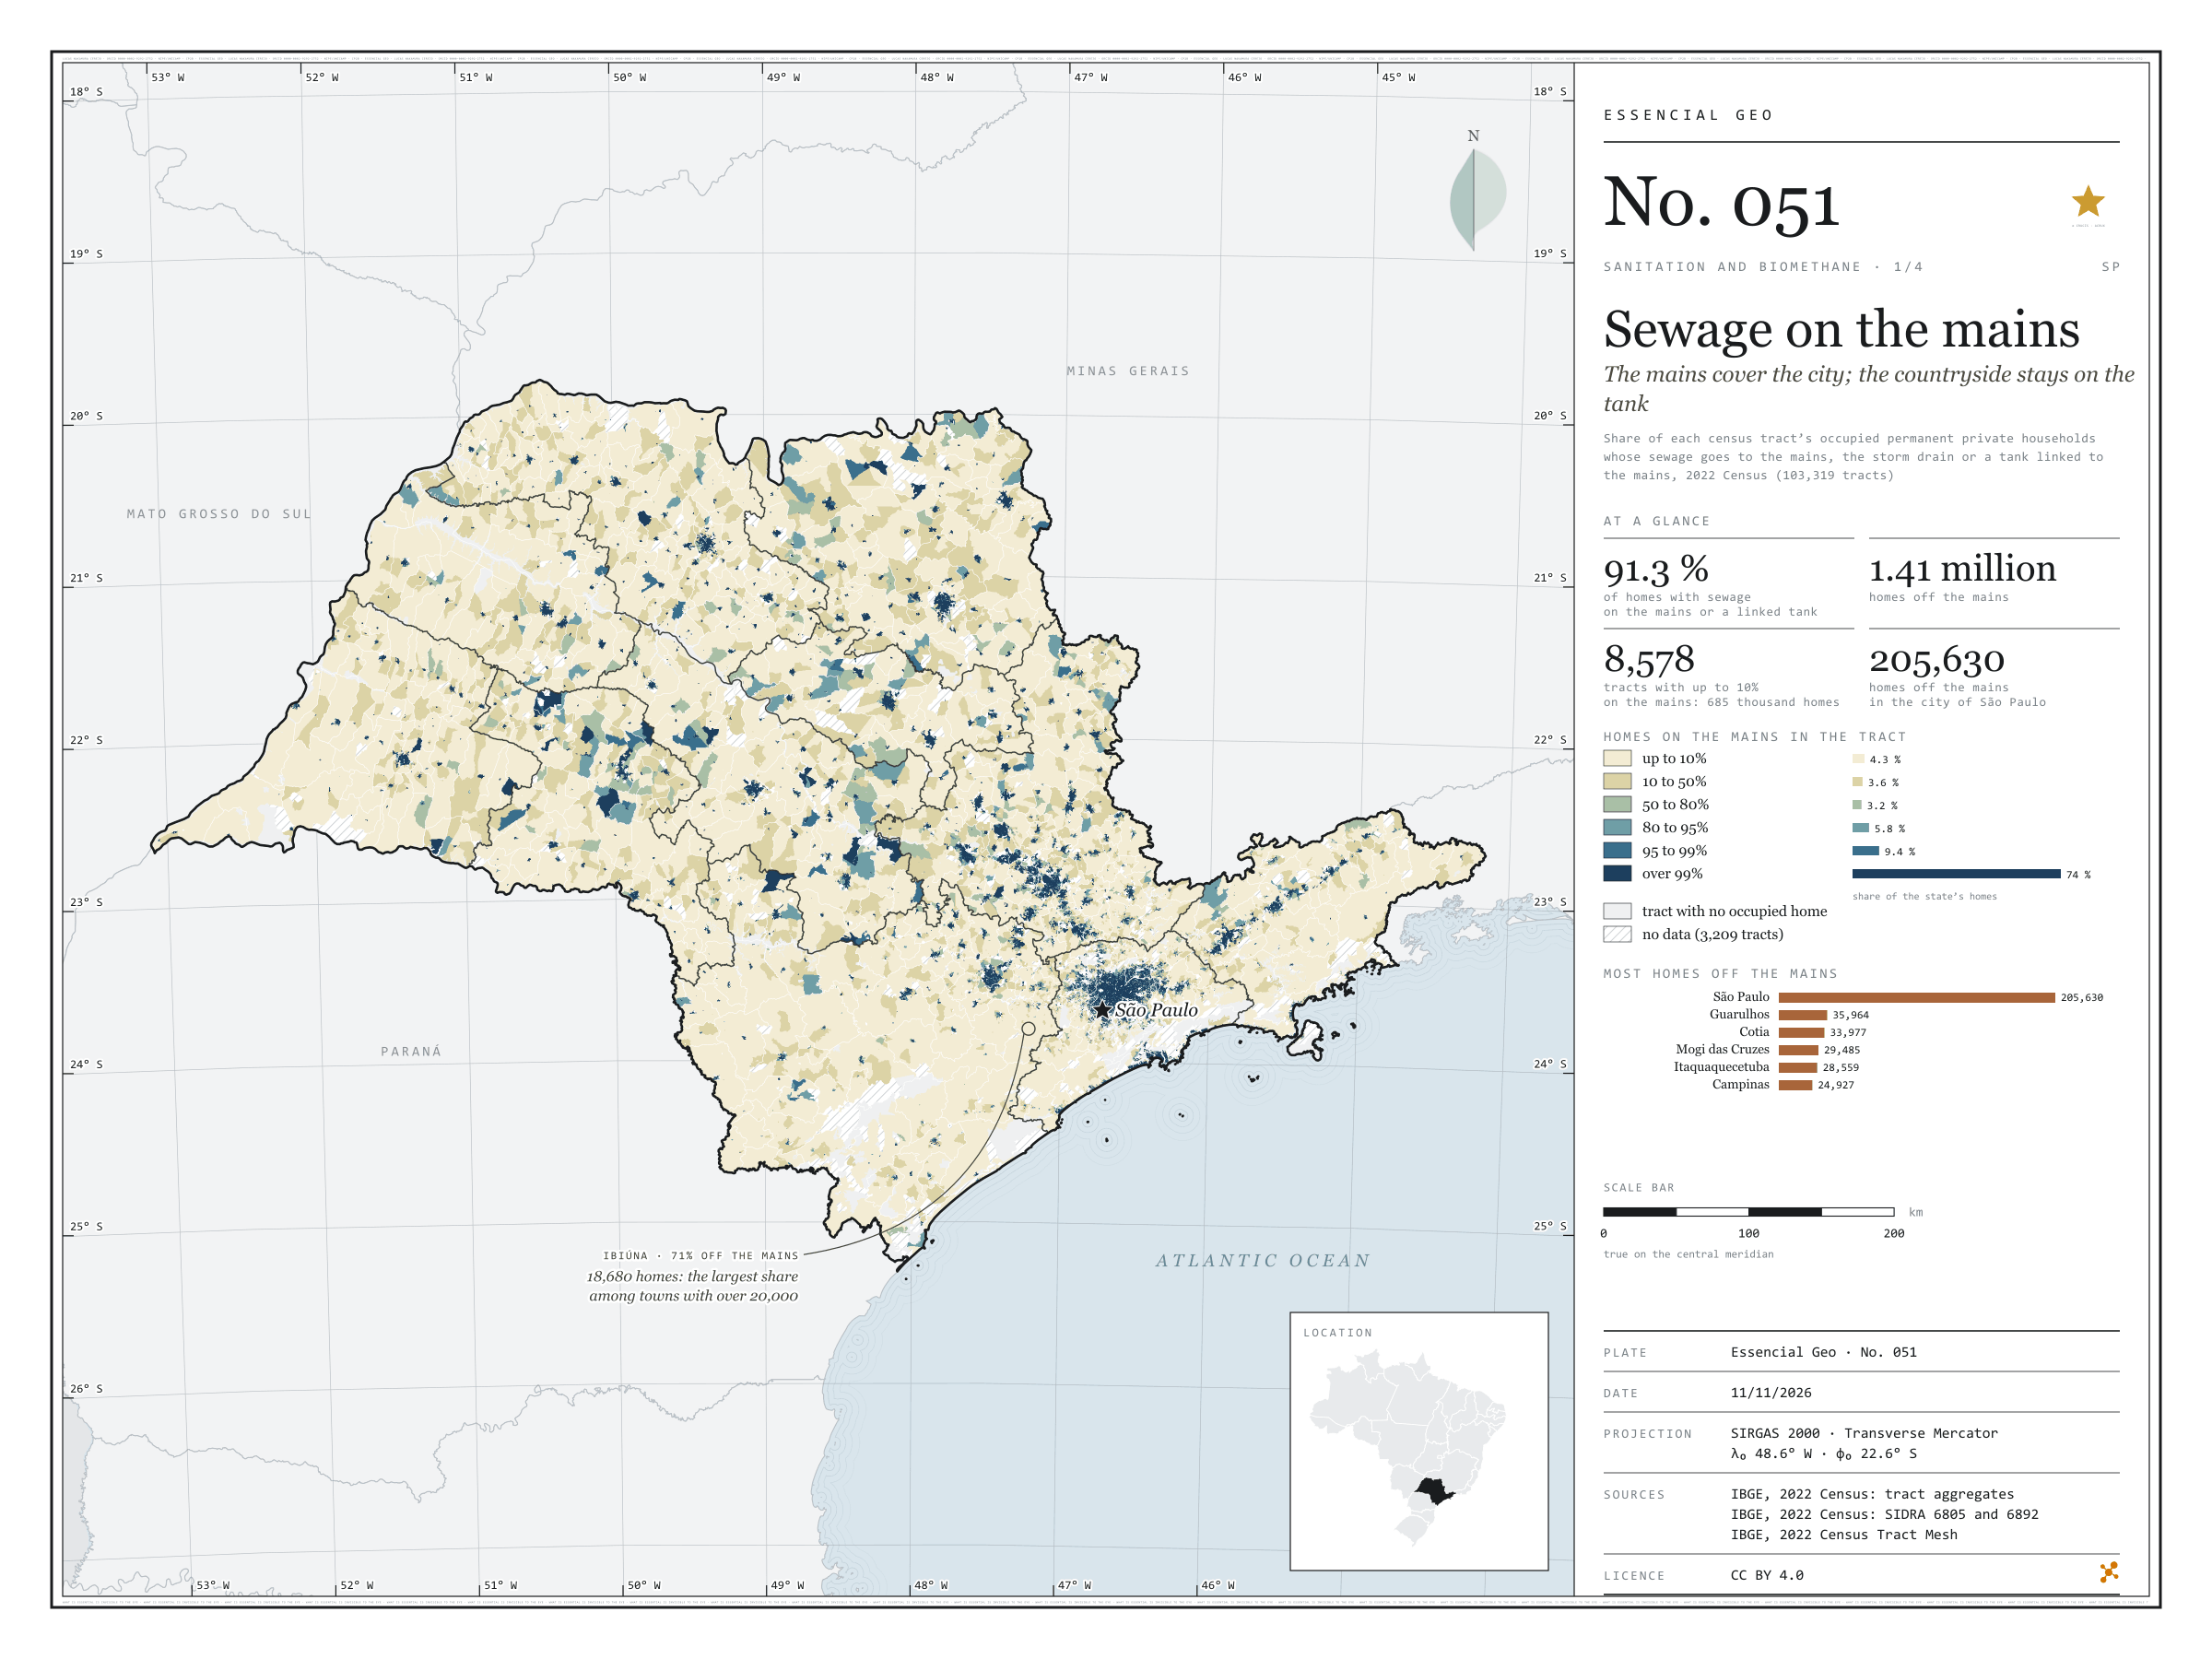
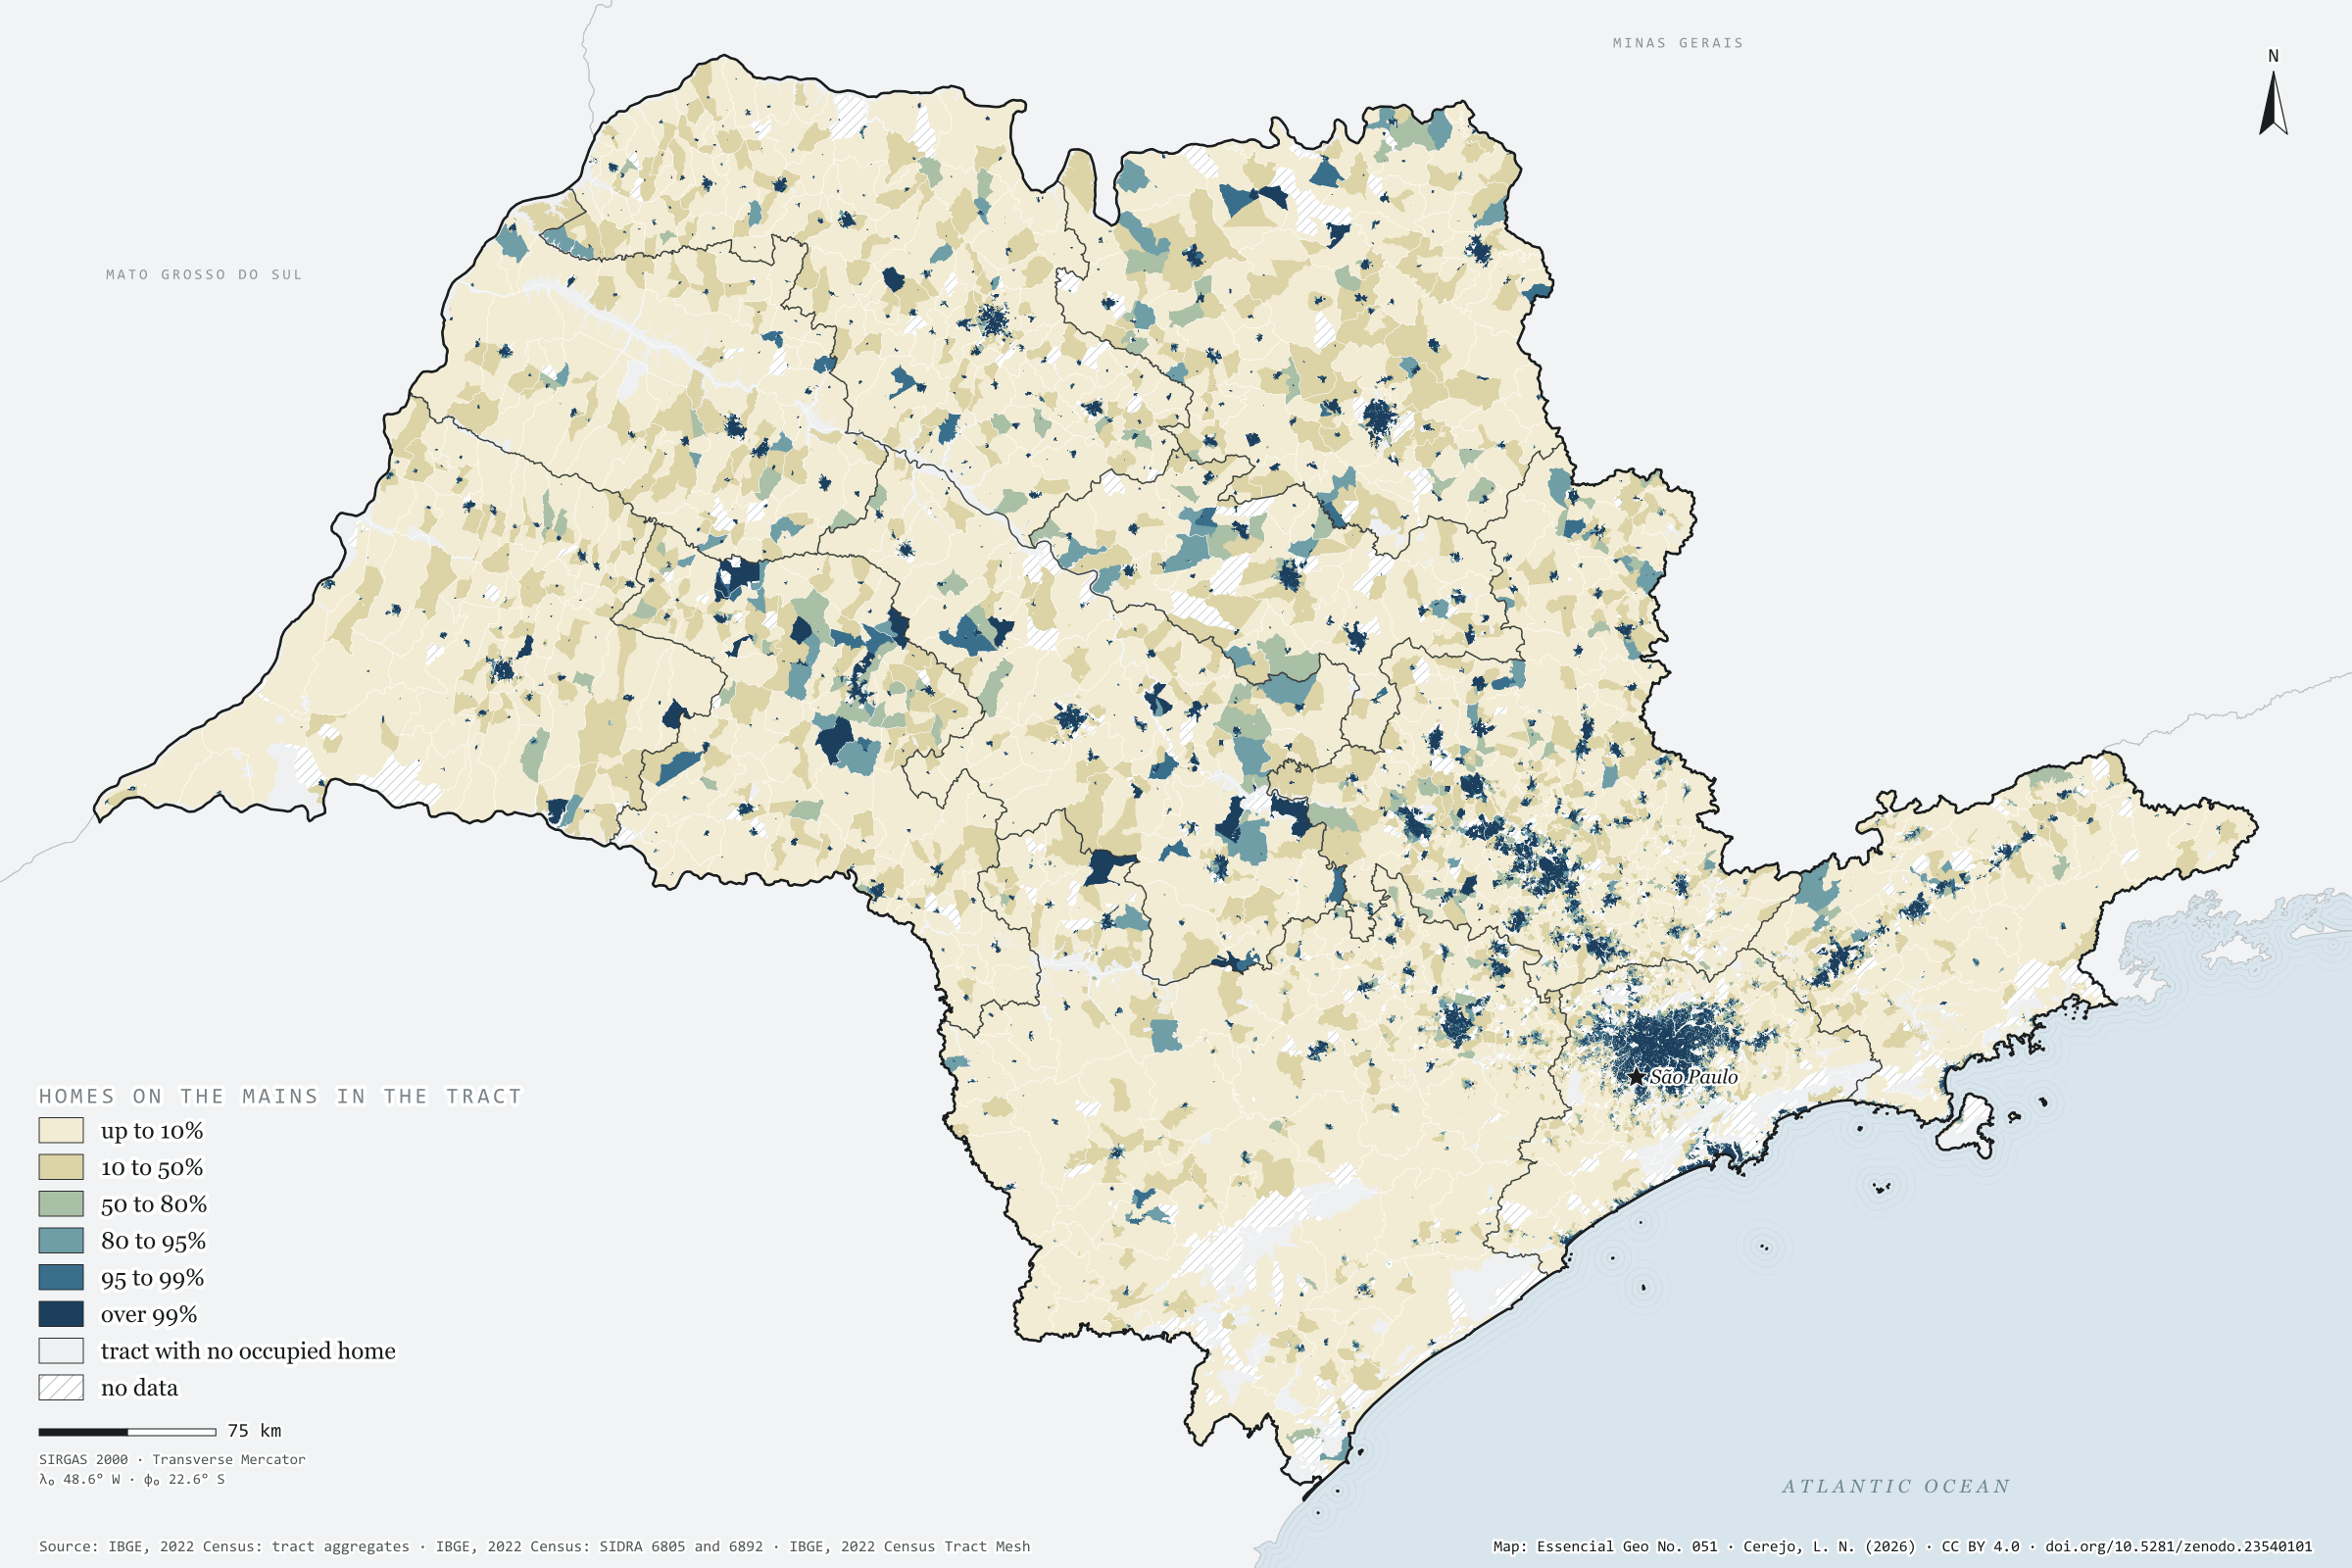
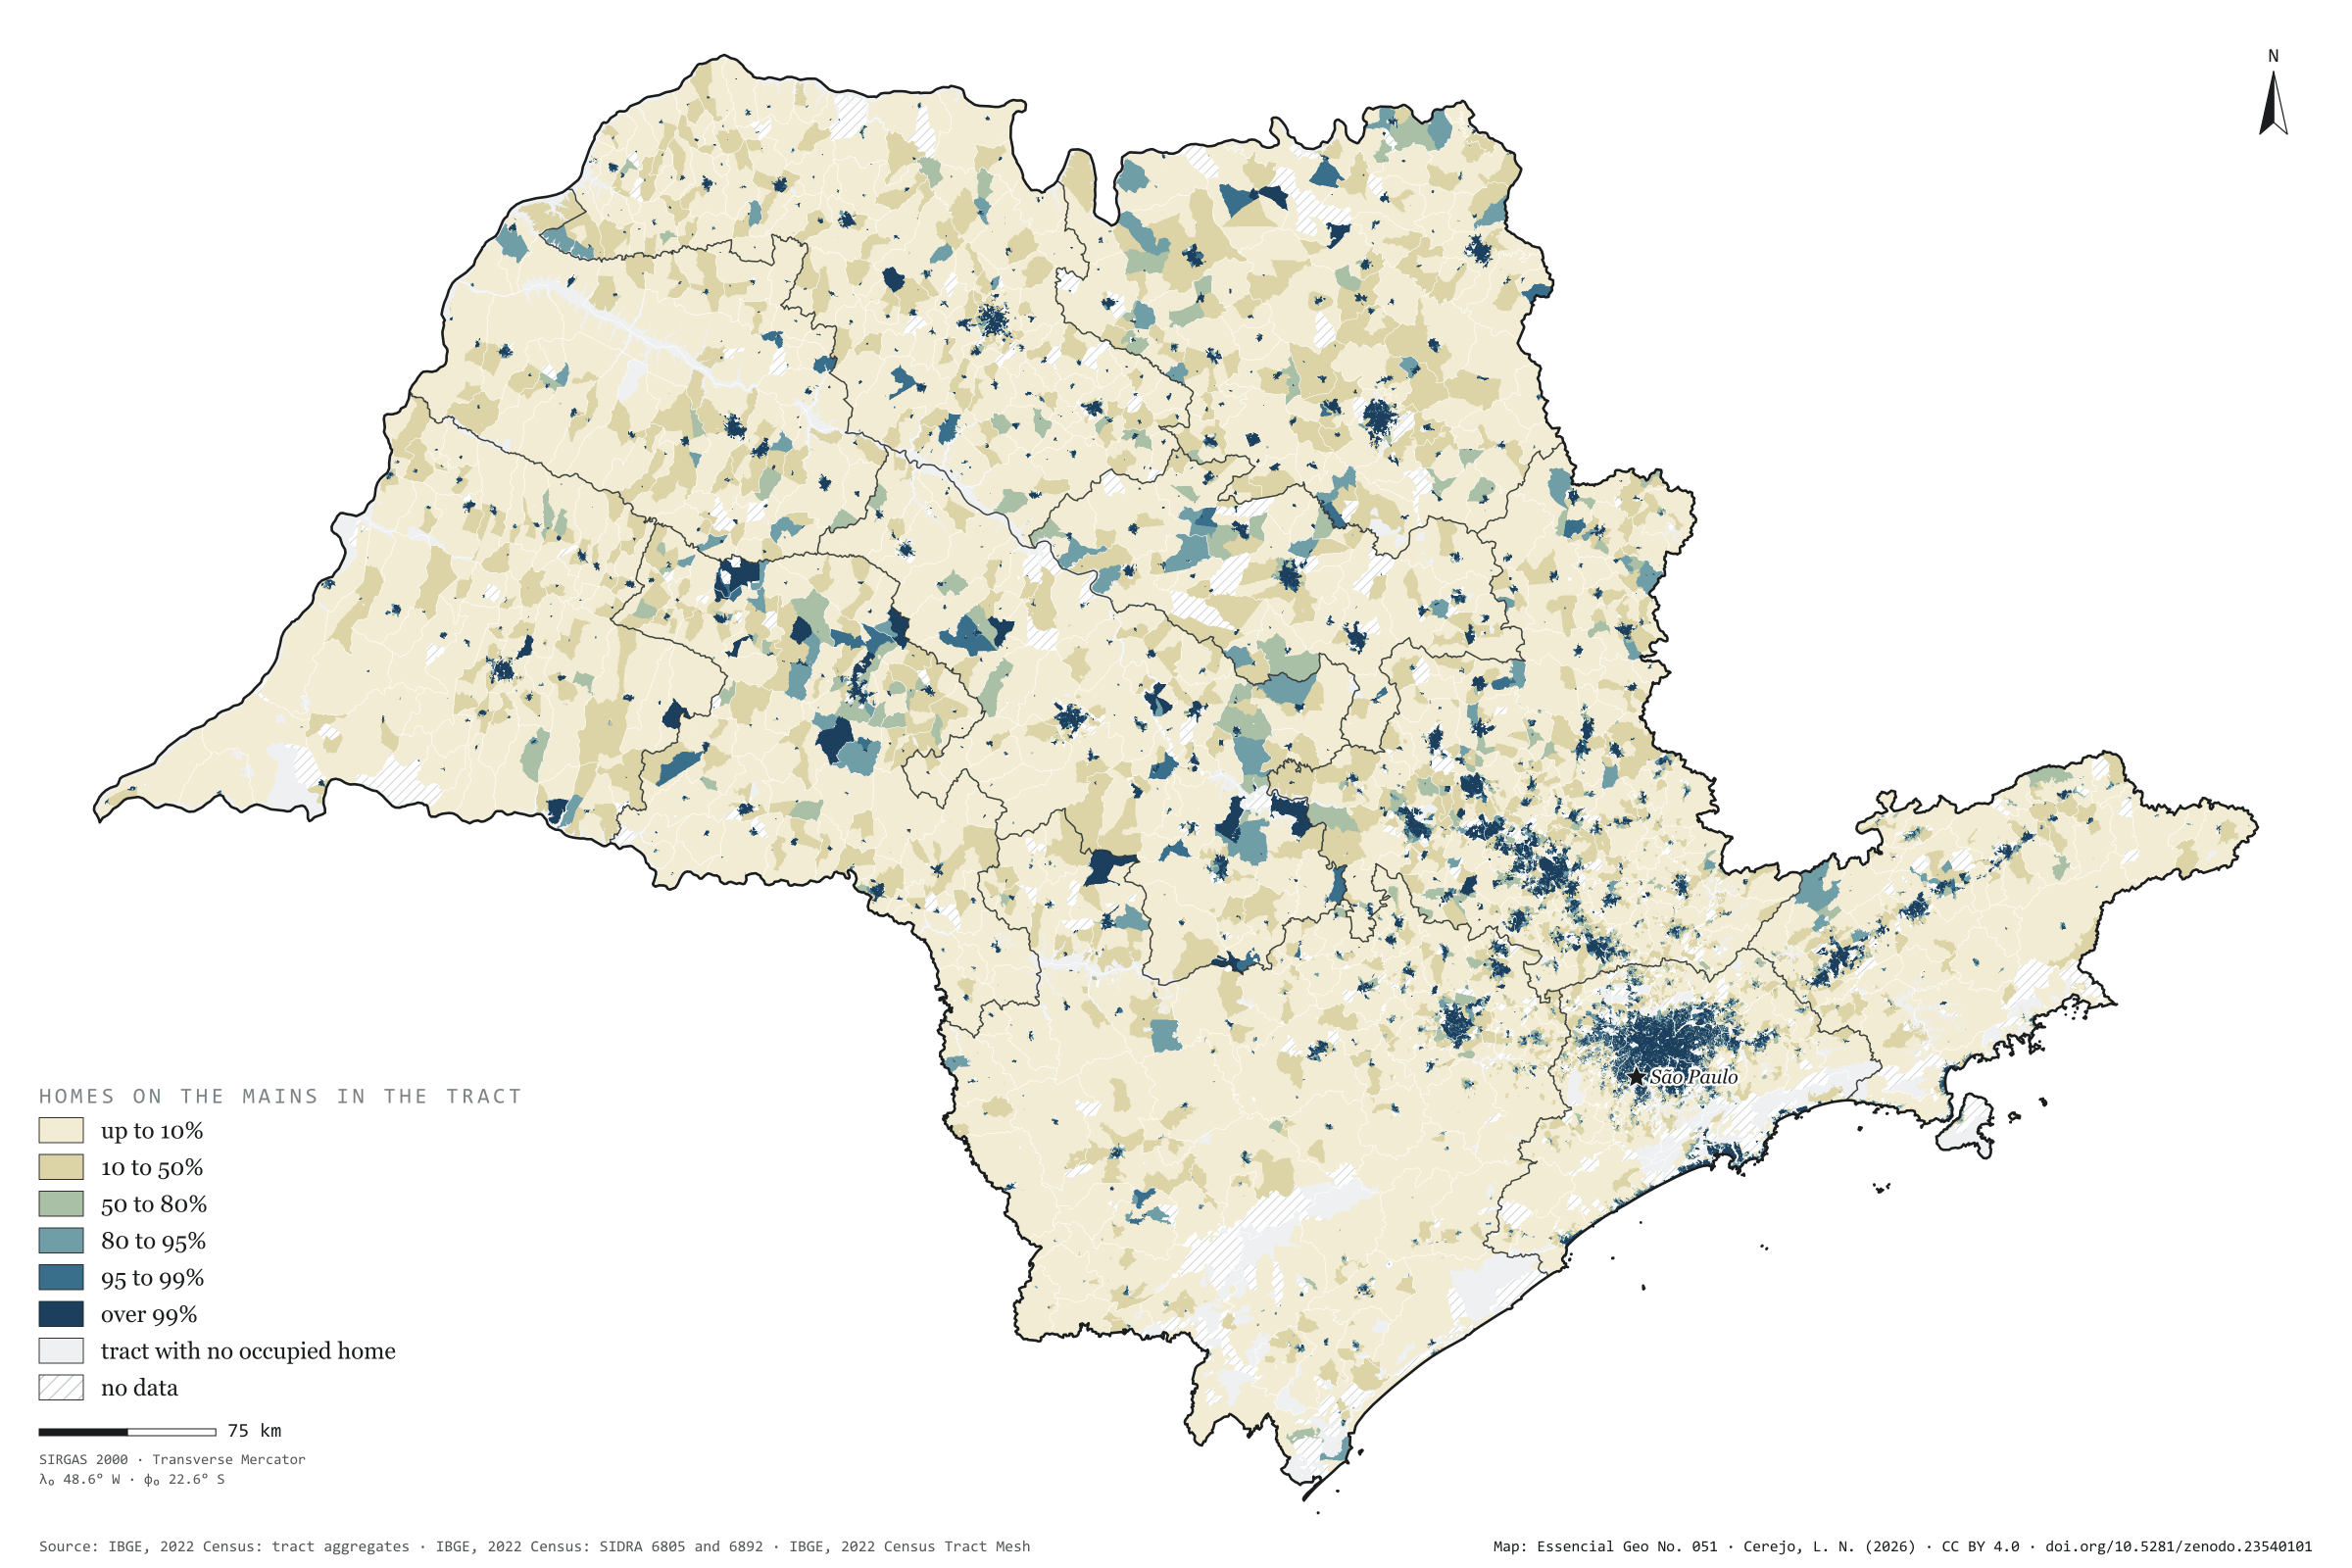
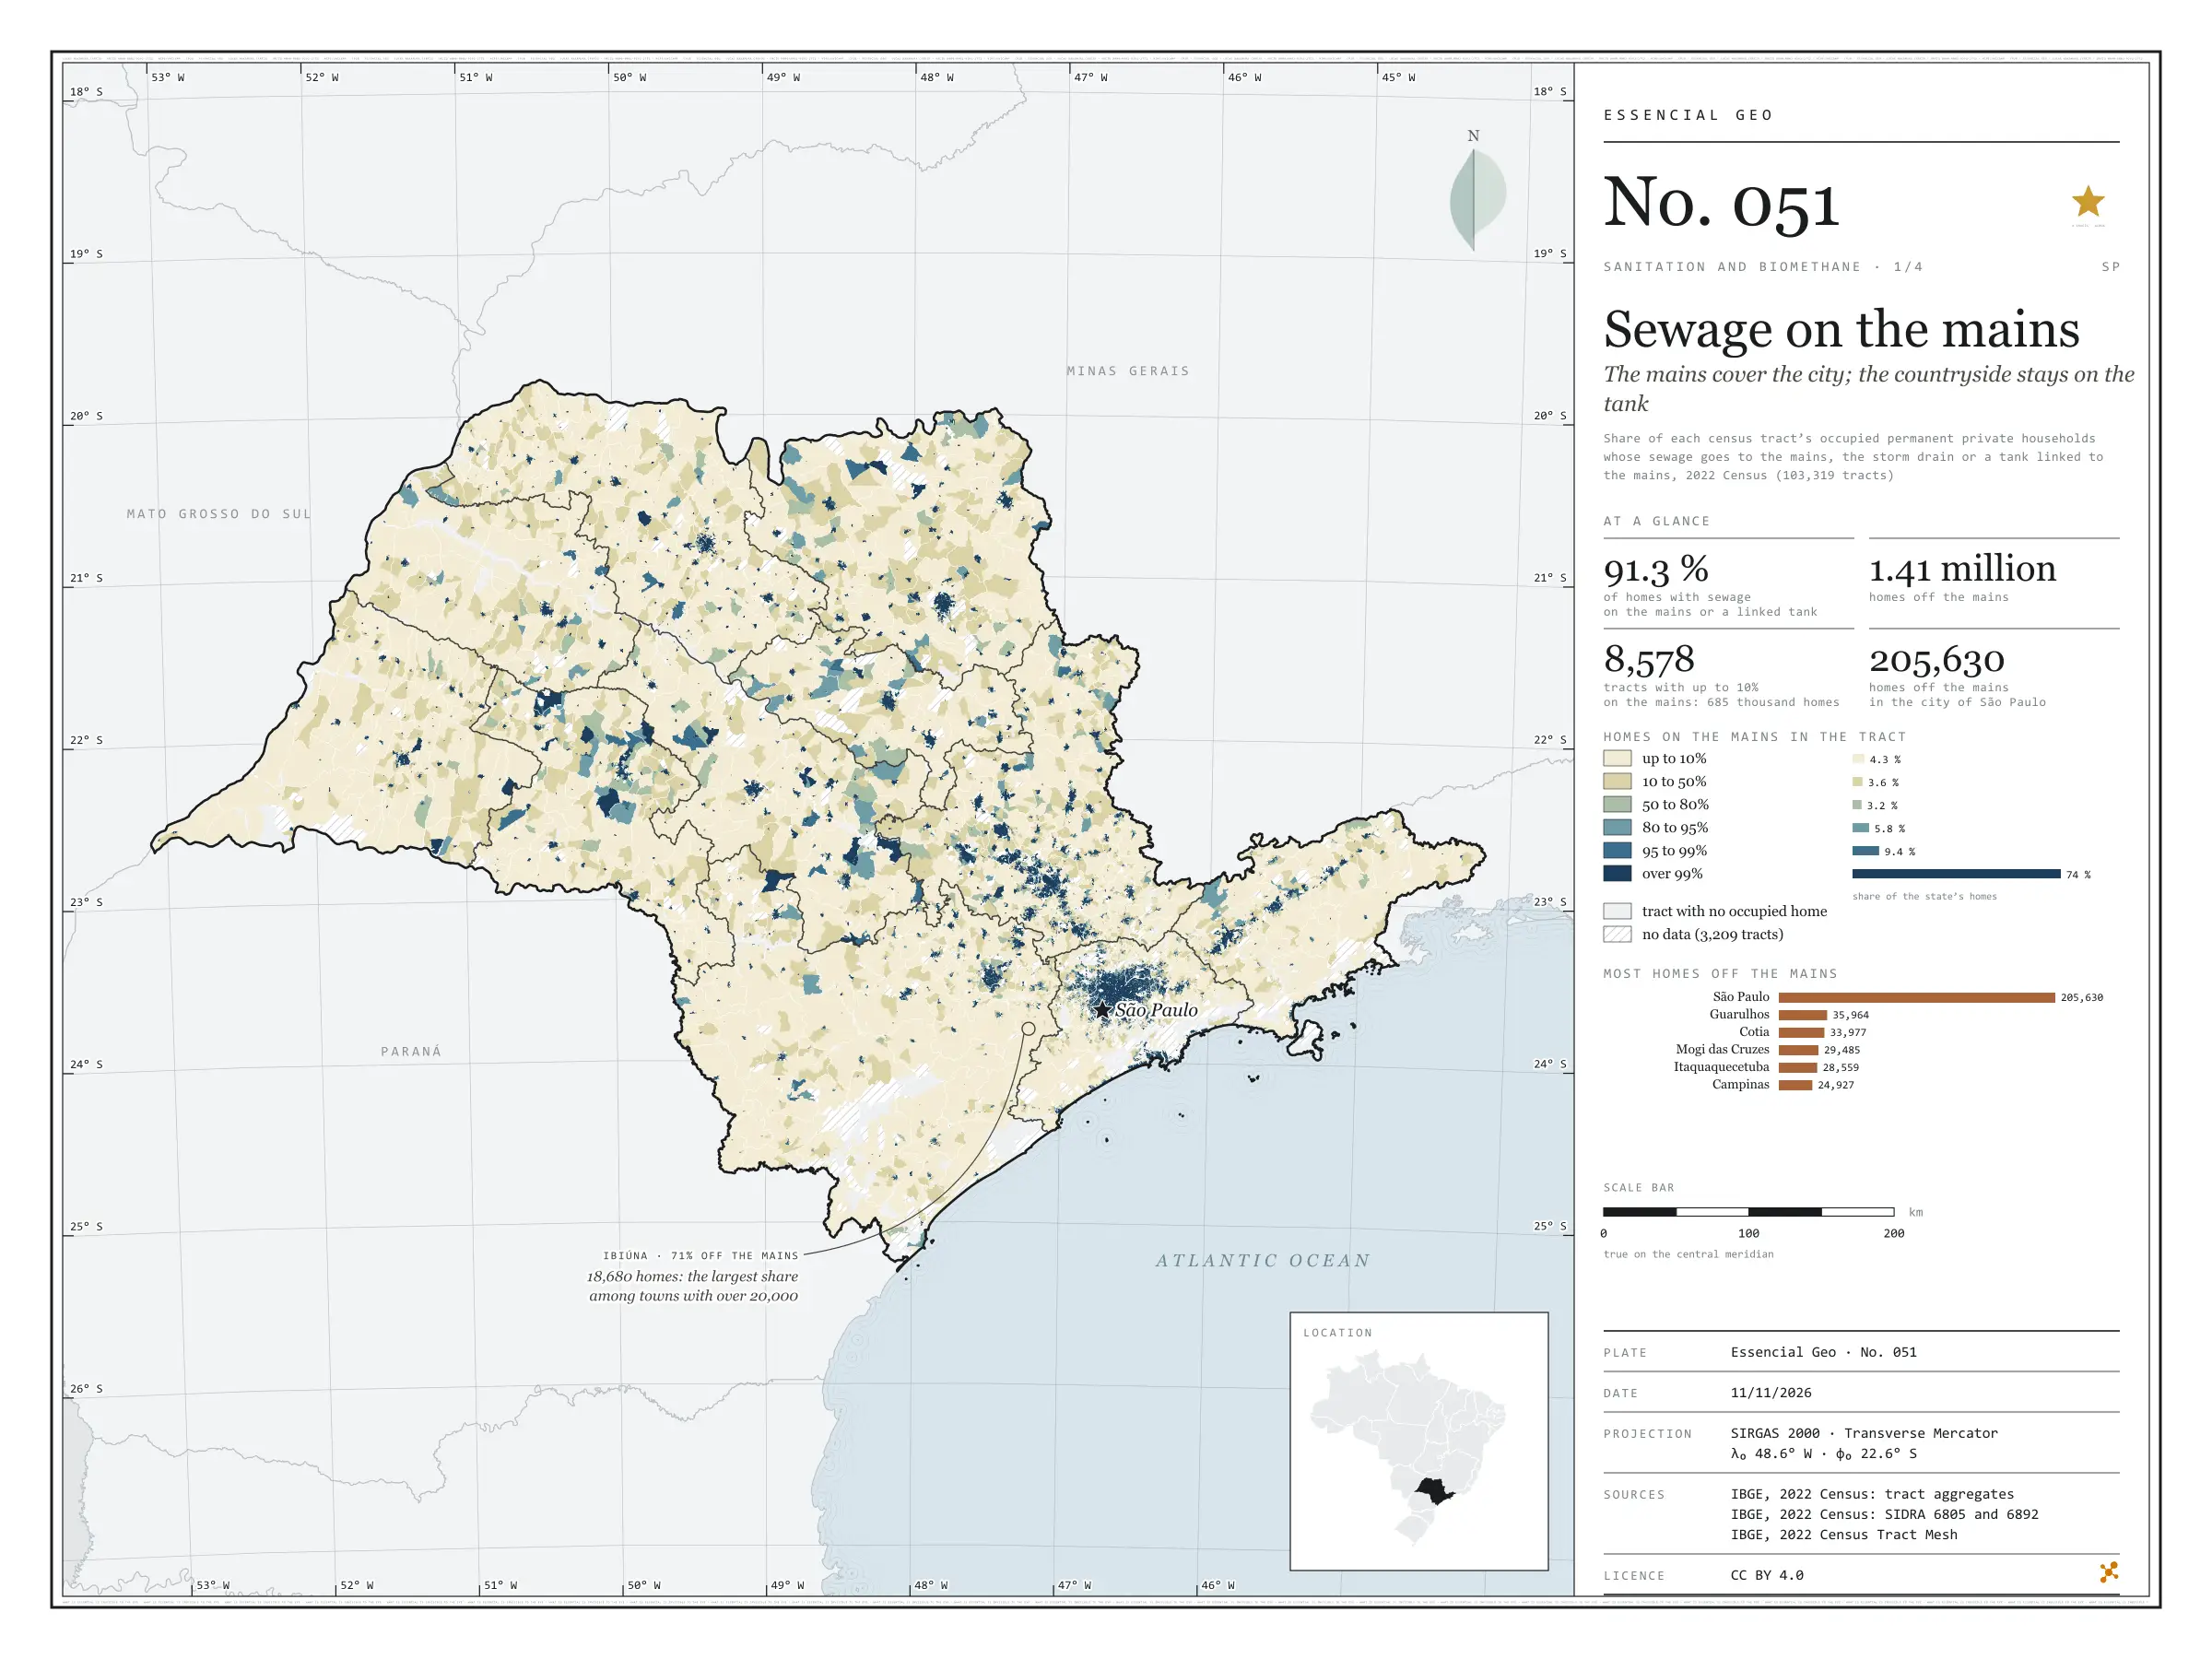
In 2022, 91.3% of households in São Paulo state had their sewage connected to the mains, to the storm drain or to a septic tank linked to the mains: 14.8 million out of 16.2 million. 1.41 million were missing. Painted tract by tract, the map shows the mains as an urban thing: three households in four live in tracts where over 99% are connected, but those tracts are small, and the cream of the rural tracts, where almost no one is on the mains, covers most of the state. The city of São Paulo has 205,630 households off the mains, the largest absolute number; among towns with more than 20,000 households, Ibiúna has the largest share off the mains (71%). First plate of the collection “Sanitation and biomethane”.

Technical record · downloads · citation

At a glance

Households, by the share of their tract connected to the sewer mains (households)
  • up to 10% 4.3%
  • 10 to 50% 3.6%
  • 50 to 80% 3.2%
  • 80 to 95% 5.8%
  • 95 to 99% 9.4%
  • over 99% 73.7%
Households with sewage on the mains or a tank linked to the mains

91 %

14,813,509 of 16,224,248 households (SIDRA 6805)

Households off the mains in the city of São Paulo

205,630 households

4.8% of the capital’s households

Layers

  • setores polygon 103,319 census tracts: households by sewage and rubbish destination, mains-connection class, leading destination and uncollected-rubbish class
  • regioes_intermediarias polygon 11 intermediate geographic regions
  • limite_estadual polygon State boundary

Metadata

Extent
São Paulo State (SP)
CRS / Projection
SIRGAS 2000 (EPSG:4674)
EPSG:4674
Software
Node.js · d3-geo · QGIS
Method
Share of each census tract’s occupied permanent private households whose sewage goes to the mains, the storm drain or a tank linked to the mains, in six classes; tracts with withheld values get a class only when it does not depend on the omitted value.
Version
v1.0.0
Licence
CC BY 4.0

Downloads

Figure to reuse

The map without a frame, with legend, scale, reference system and credit written on it: ready for papers, lectures and slides. In two versions: with the basemap (neighbours and sea) or only the mapped area, on white.

Point a camera at it to open this page.

How to cite

Cerejo, L. N. (2026). Esgoto na rede: a rede cobre a cidade; o campo fica na fossa [Sewage on the mains: The mains cover the city; the countryside stays on the tank] (Version 1.0.0) [Data set]. Zenodo. https://doi.org/10.5281/zenodo.23540101

No. 052 Census · income Sanitation and biomethane 2/4

Where the sewage goes

Mains in town, pits in the country, rivers at the edge

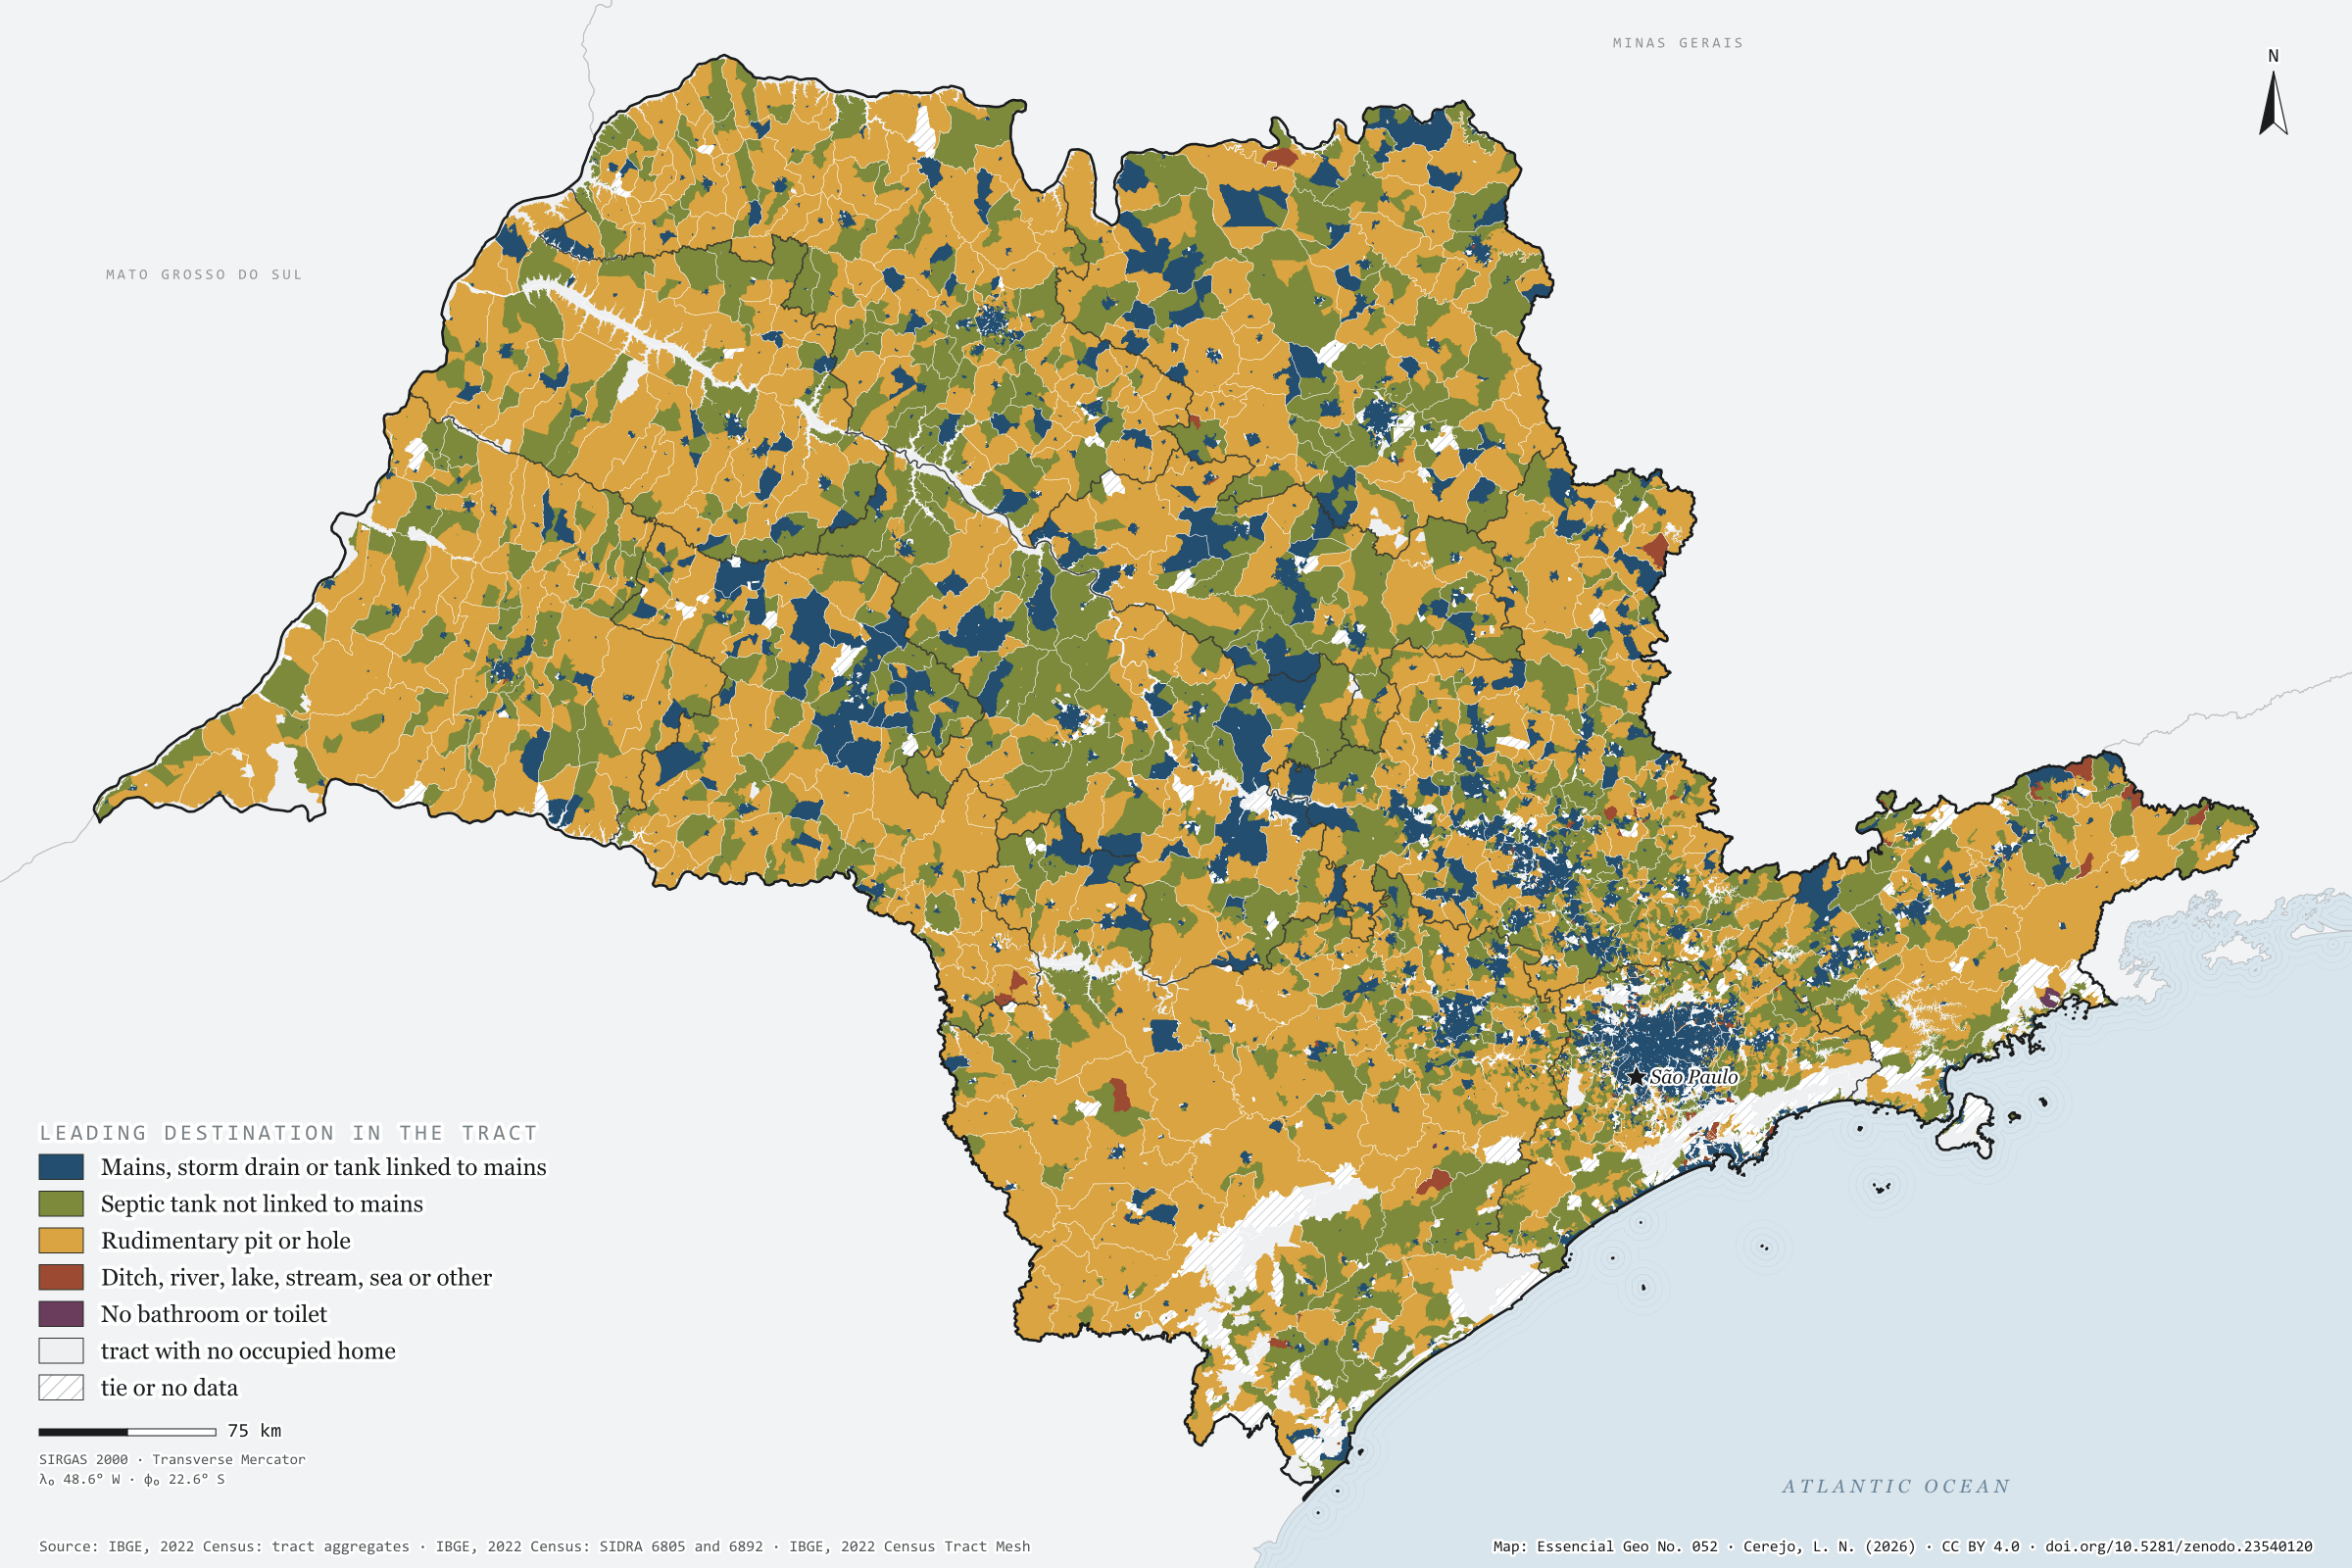
Fig. 052 São Paulo State (SP) EPSG:4674 Source: IBGE

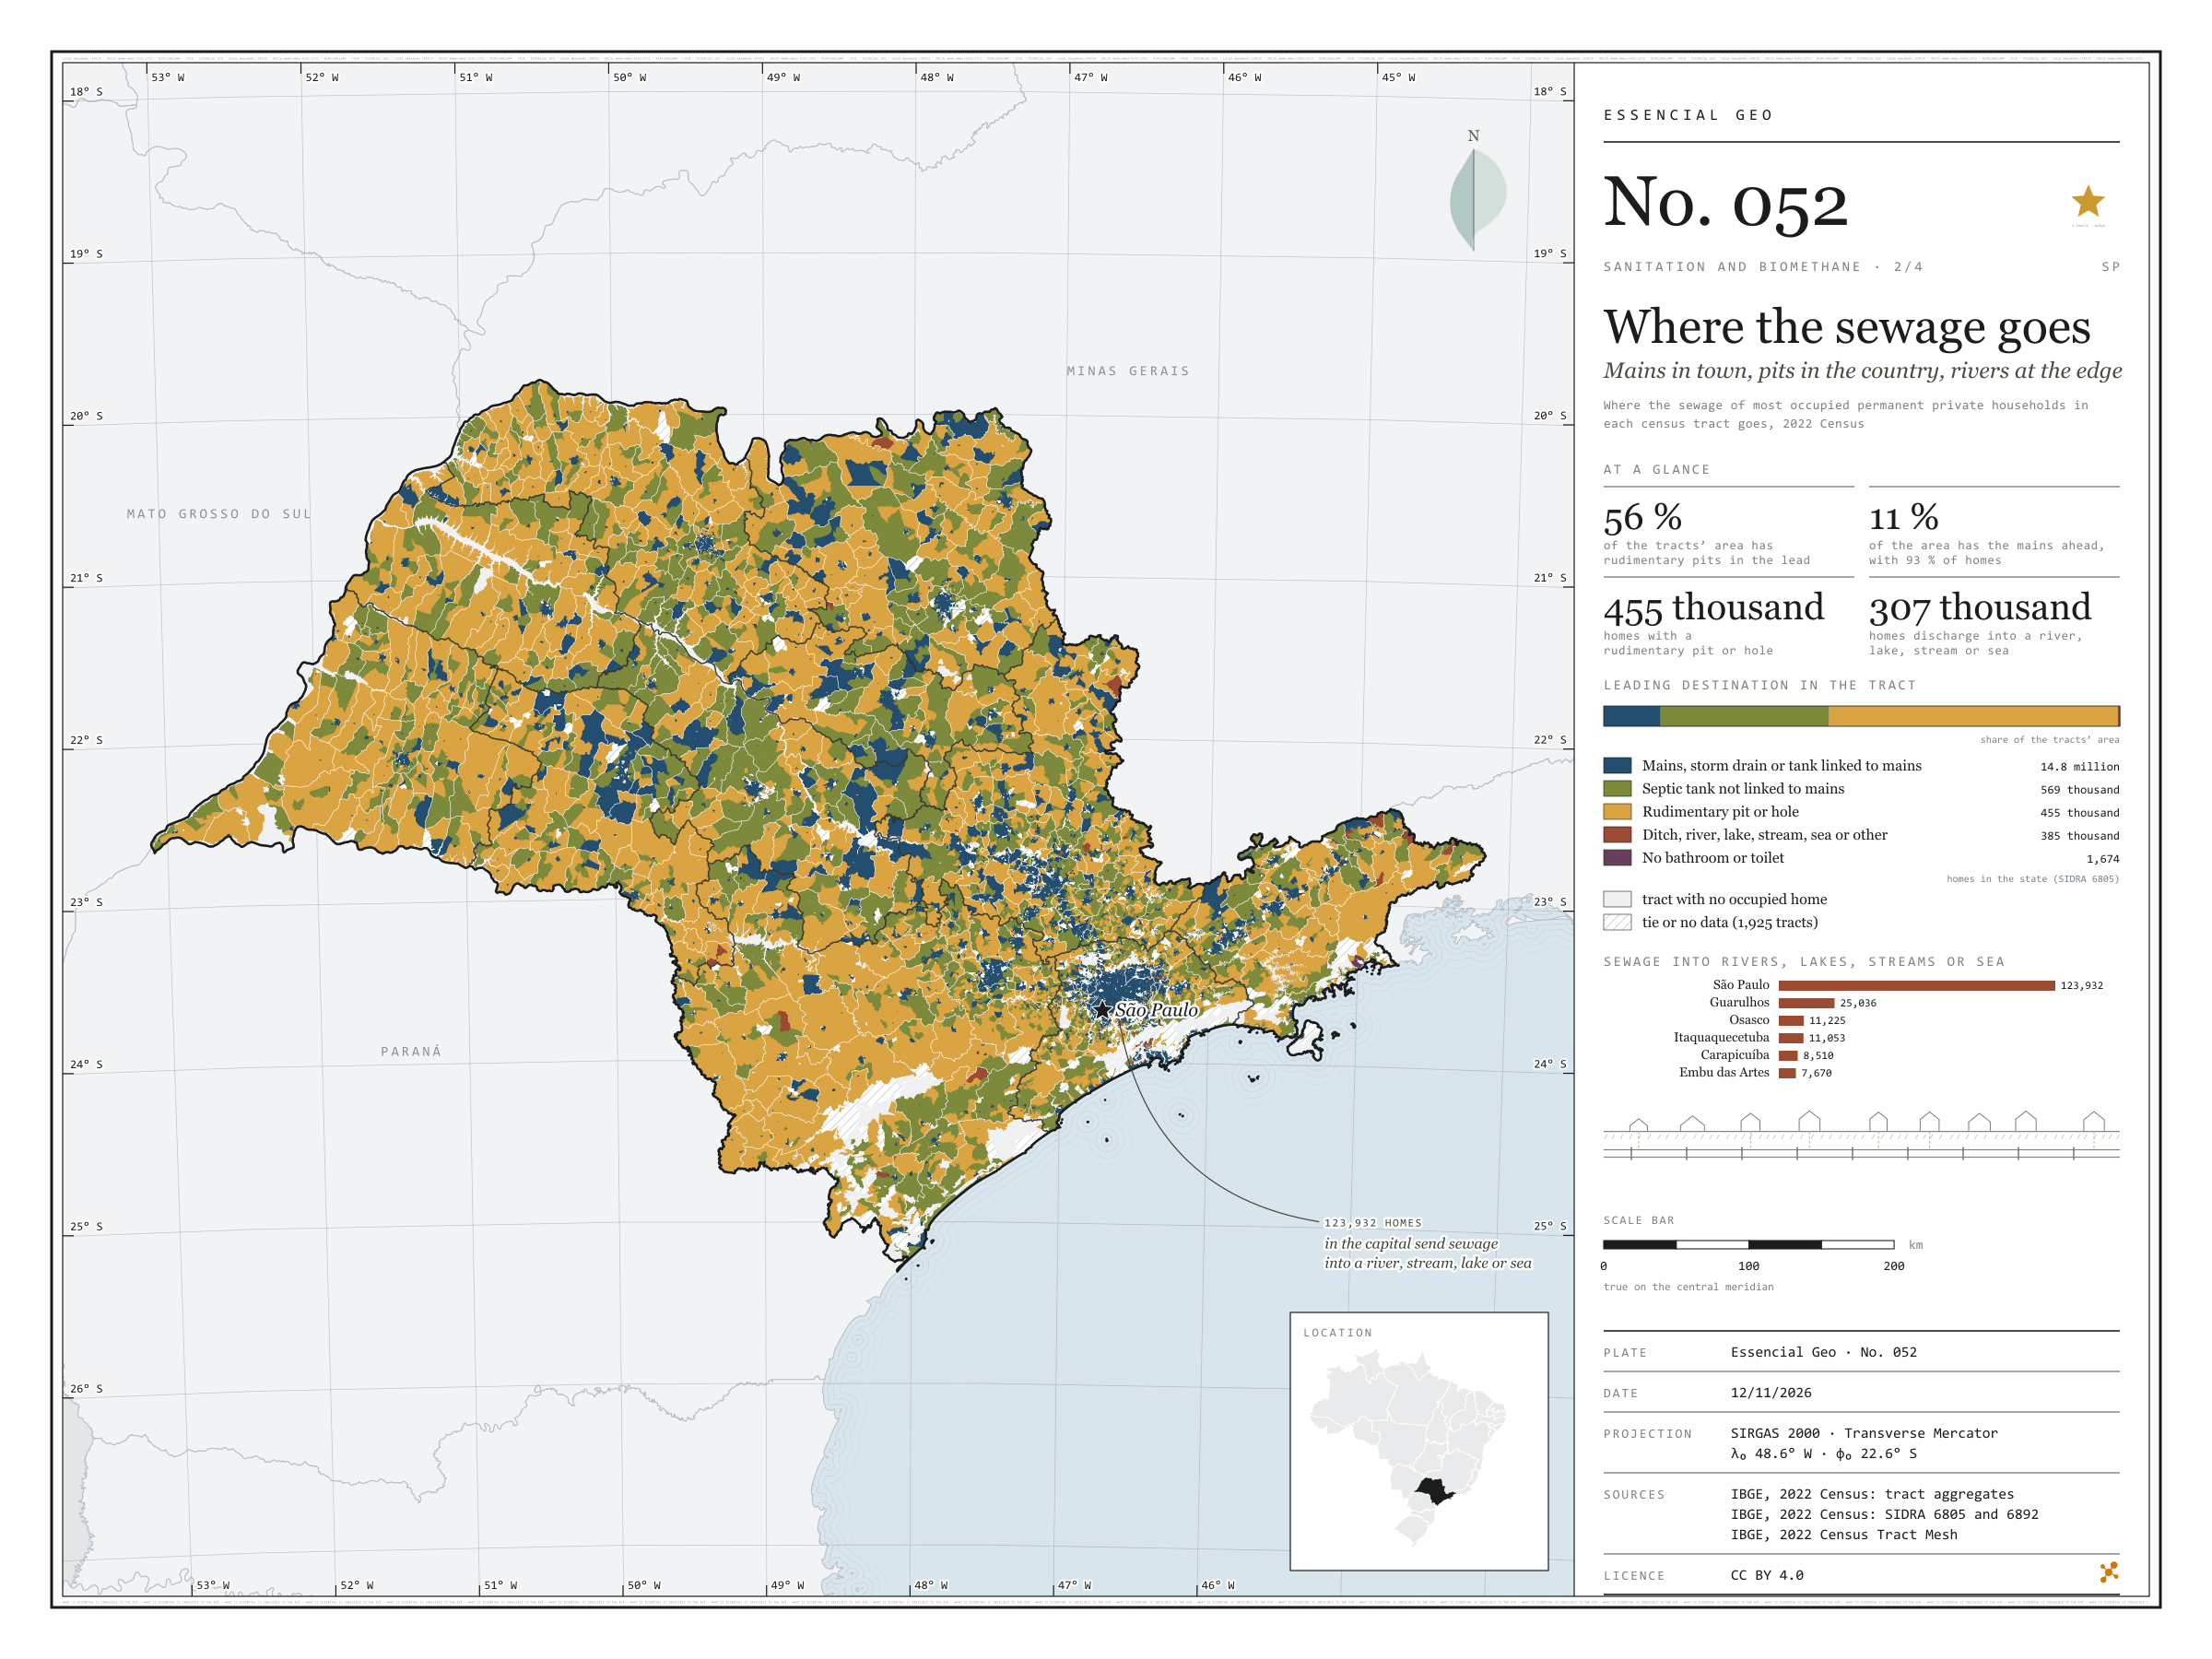
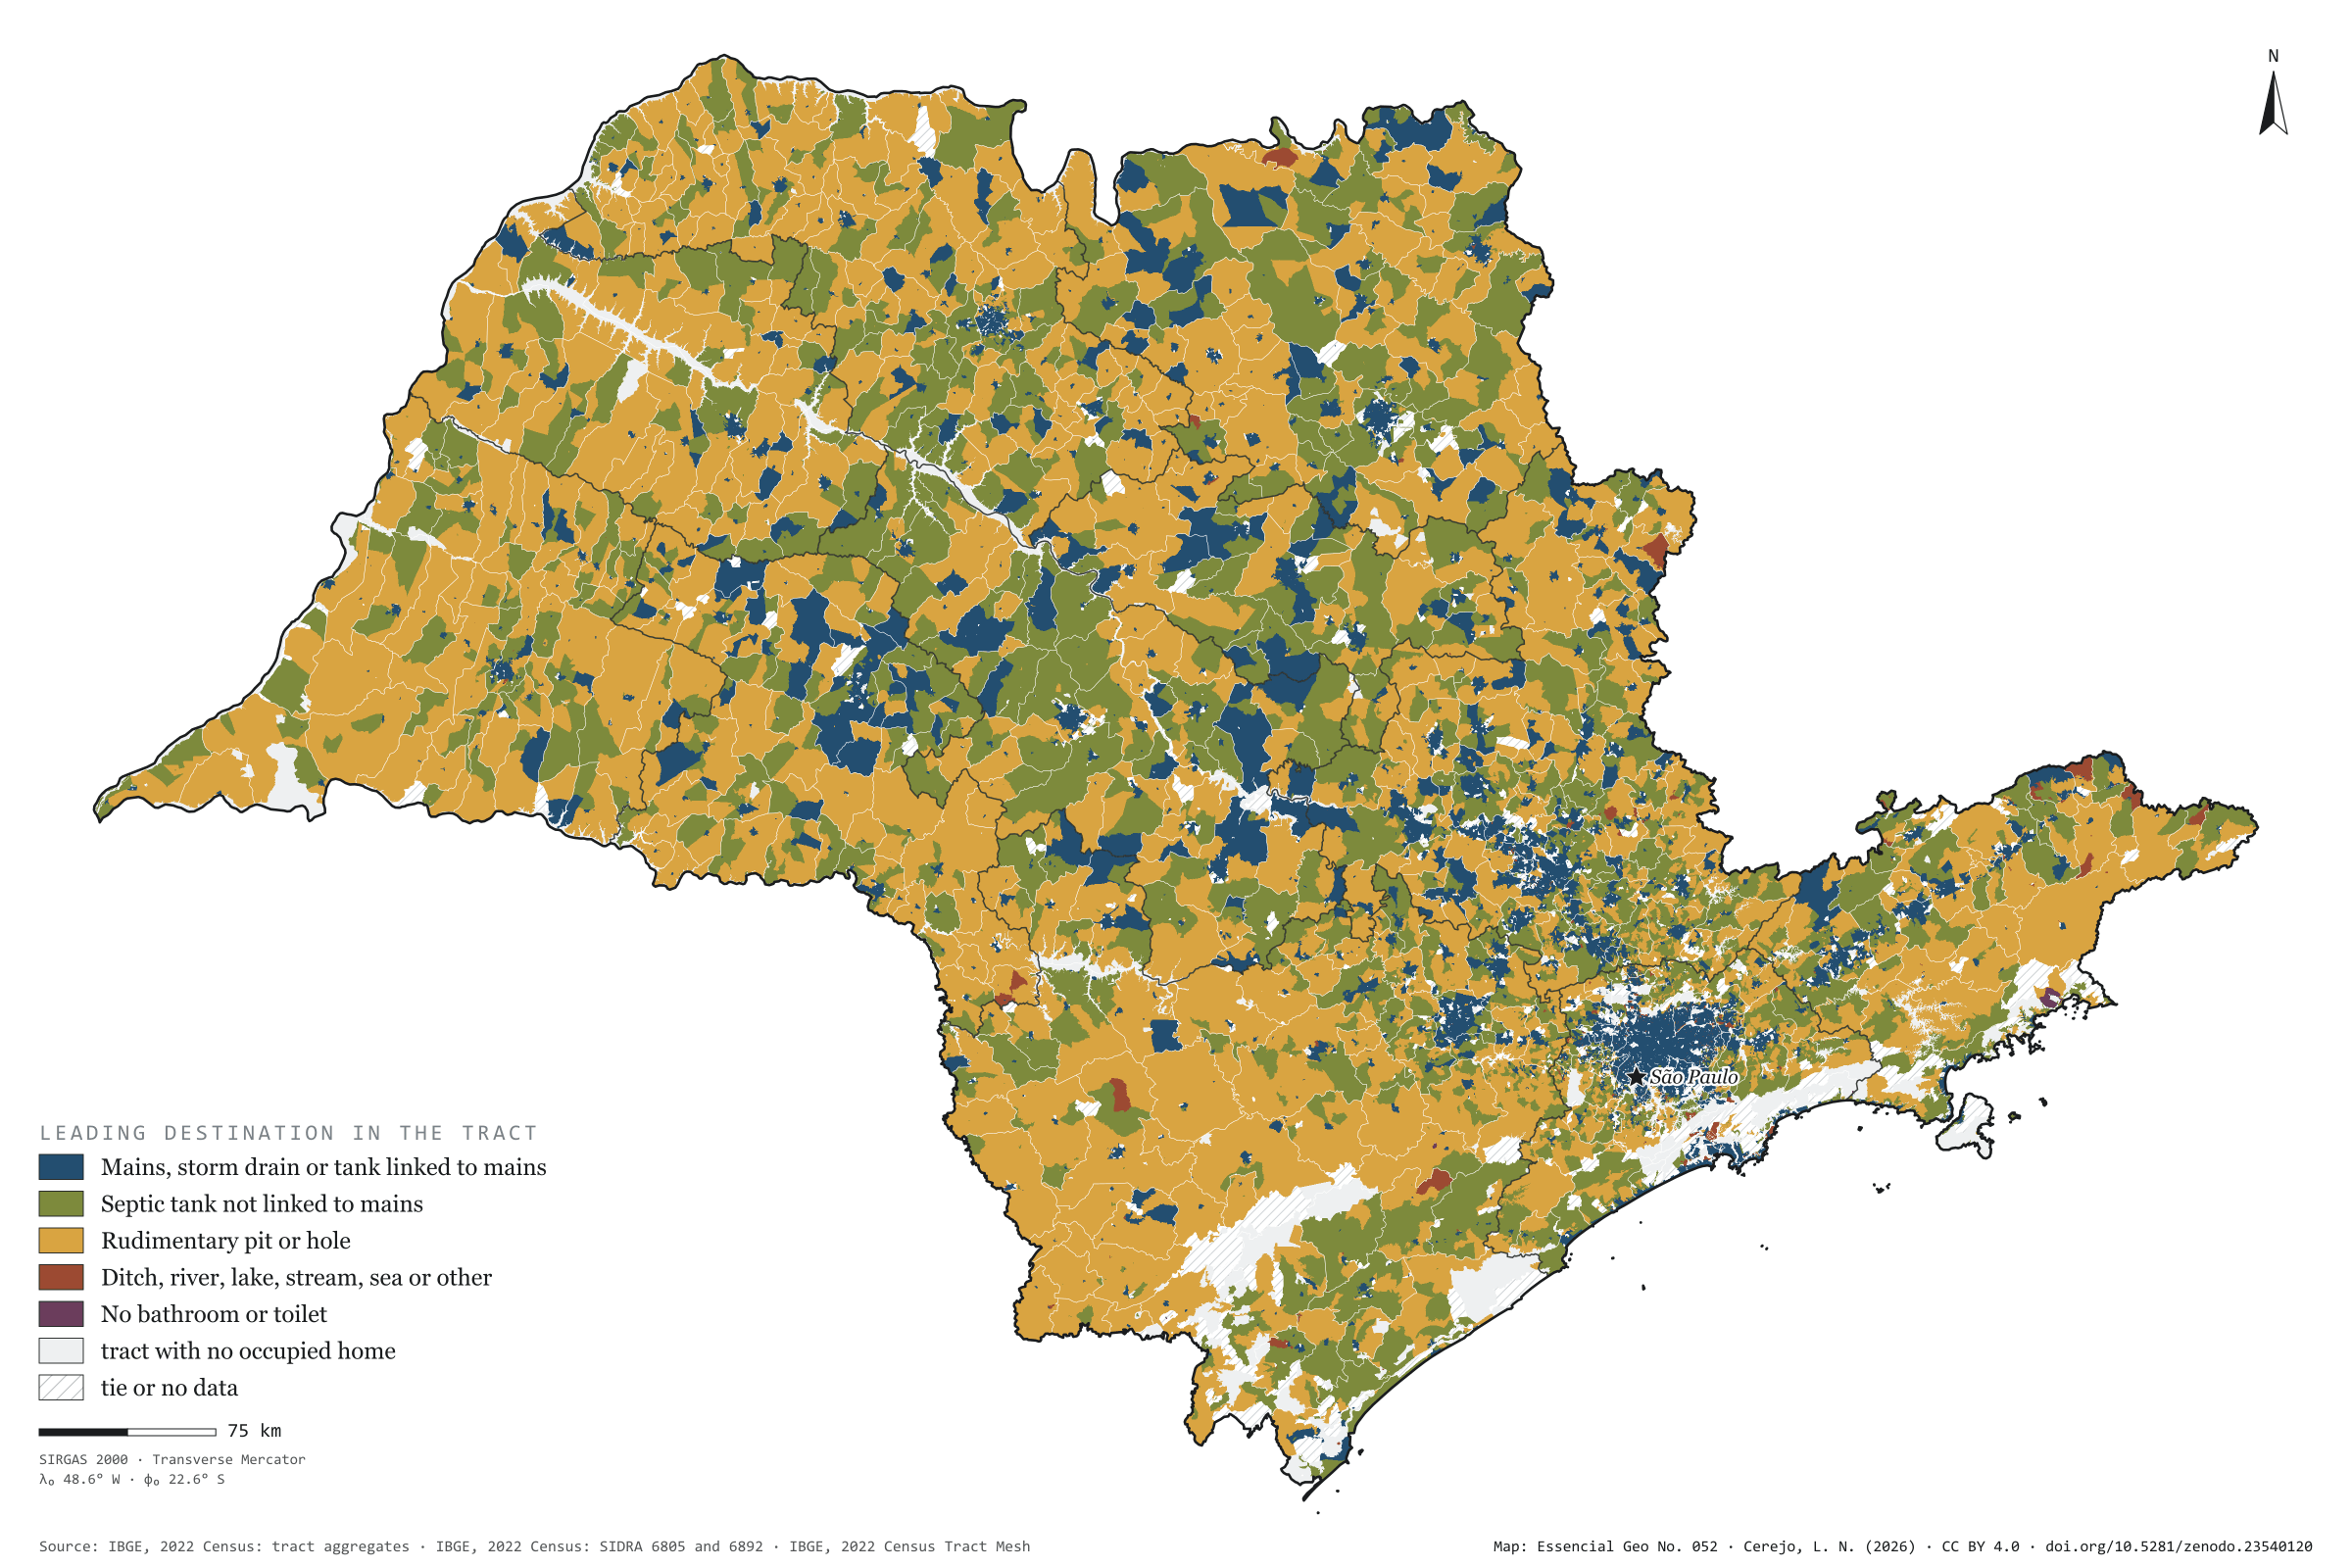
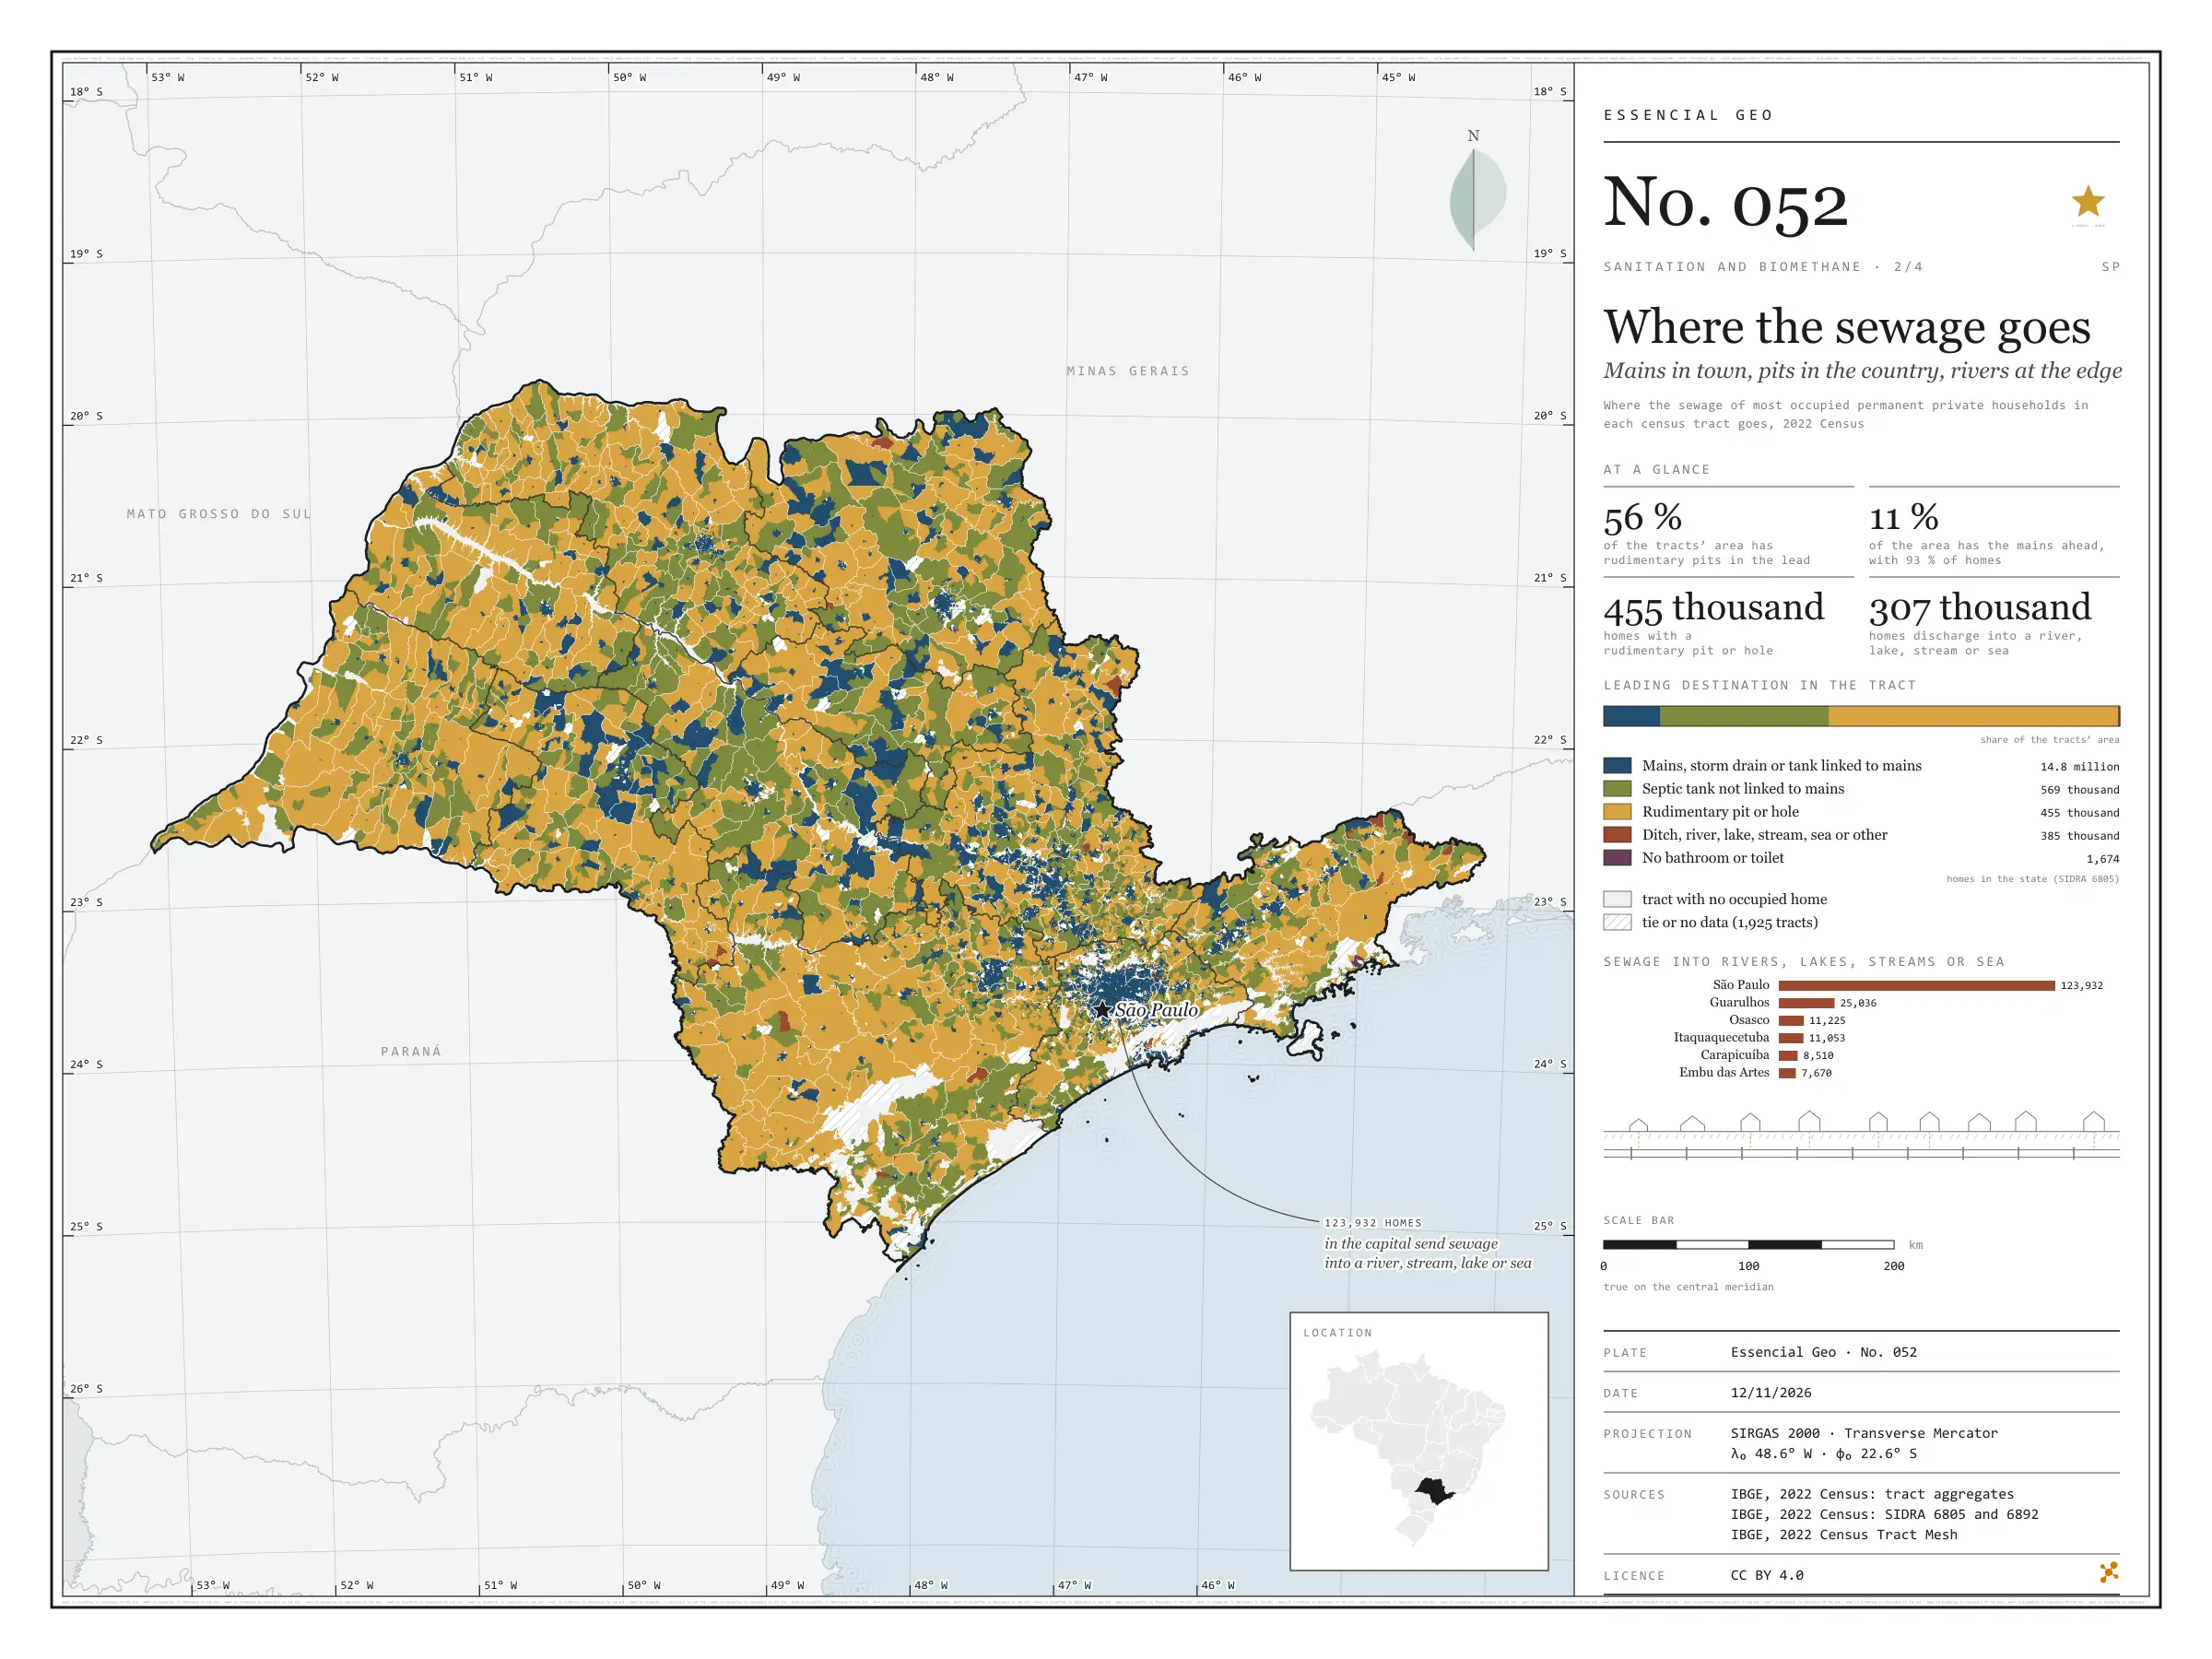
Off the mains, São Paulo’s sewage goes three ways. In 2022, 569,000 households used a septic tank, 455,000 a rudimentary pit or hole, and 385,000 discharged into a ditch, river, lake, stream, the sea or elsewhere. The map colours each census tract by where most of its households send their sewage. The mains lead in only 11% of the area, but 93% of households live there; rudimentary pits lead in 56% of the area and septic tanks in 33%, in a mosaic that covers the interior. Sewage discharged into rivers, lakes, streams or the sea is urban: of the 307,000 households doing so, 124,000 are in the capital and three quarters of the rest in the São Paulo intermediate region. Second plate of the collection “Sanitation and biomethane”.

Technical record · downloads · citation

At a glance

Households by sewage destination in the state (households)
  • Mains, storm drain or linked tank 91.3%
  • Septic tank not linked 3.5%
  • Rudimentary pit or hole 2.8%
  • Ditch, river, lake, stream, sea or other 2.4%
  • No bathroom or toilet 0%
Tract area where rudimentary pits lead

56 %

129,000 km² of 231,000 km² of tracts with a defined leader

Households in the capital discharging sewage into rivers, lakes, streams or the sea

123,932 households

40% of the state’s 306,691

Layers

  • setores polygon 103,319 census tracts: households by sewage destination and leading destination (same GPKG as plate 051)
  • regioes_intermediarias polygon 11 intermediate geographic regions
  • limite_estadual polygon State boundary

Metadata

Extent
São Paulo State (SP)
CRS / Projection
SIRGAS 2000 (EPSG:4674)
EPSG:4674
Software
Node.js · d3-geo · QGIS
Method
Where the sewage of most occupied permanent private households in each census tract goes, in five groups; a group wins only when its minimum exceeds every other group’s maximum, counting withheld values as 1 or 2.
Version
v1.0.0
Licence
CC BY 4.0

Downloads

Figure to reuse

The map without a frame, with legend, scale, reference system and credit written on it: ready for papers, lectures and slides. In two versions: with the basemap (neighbours and sea) or only the mapped area, on white.

Point a camera at it to open this page.

How to cite

Cerejo, L. N. (2026). Para onde vai o esgoto: rede na cidade, fossa no campo, rio na beira [Where the sewage goes: Mains in town, pits in the country, rivers at the edge] (Version 1.0.0) [Data set]. Zenodo. https://doi.org/10.5281/zenodo.23540120

No. 053 Census · income Sanitation and biomethane 3/4

Rubbish outside collection

Where the truck does not pass, rubbish burns

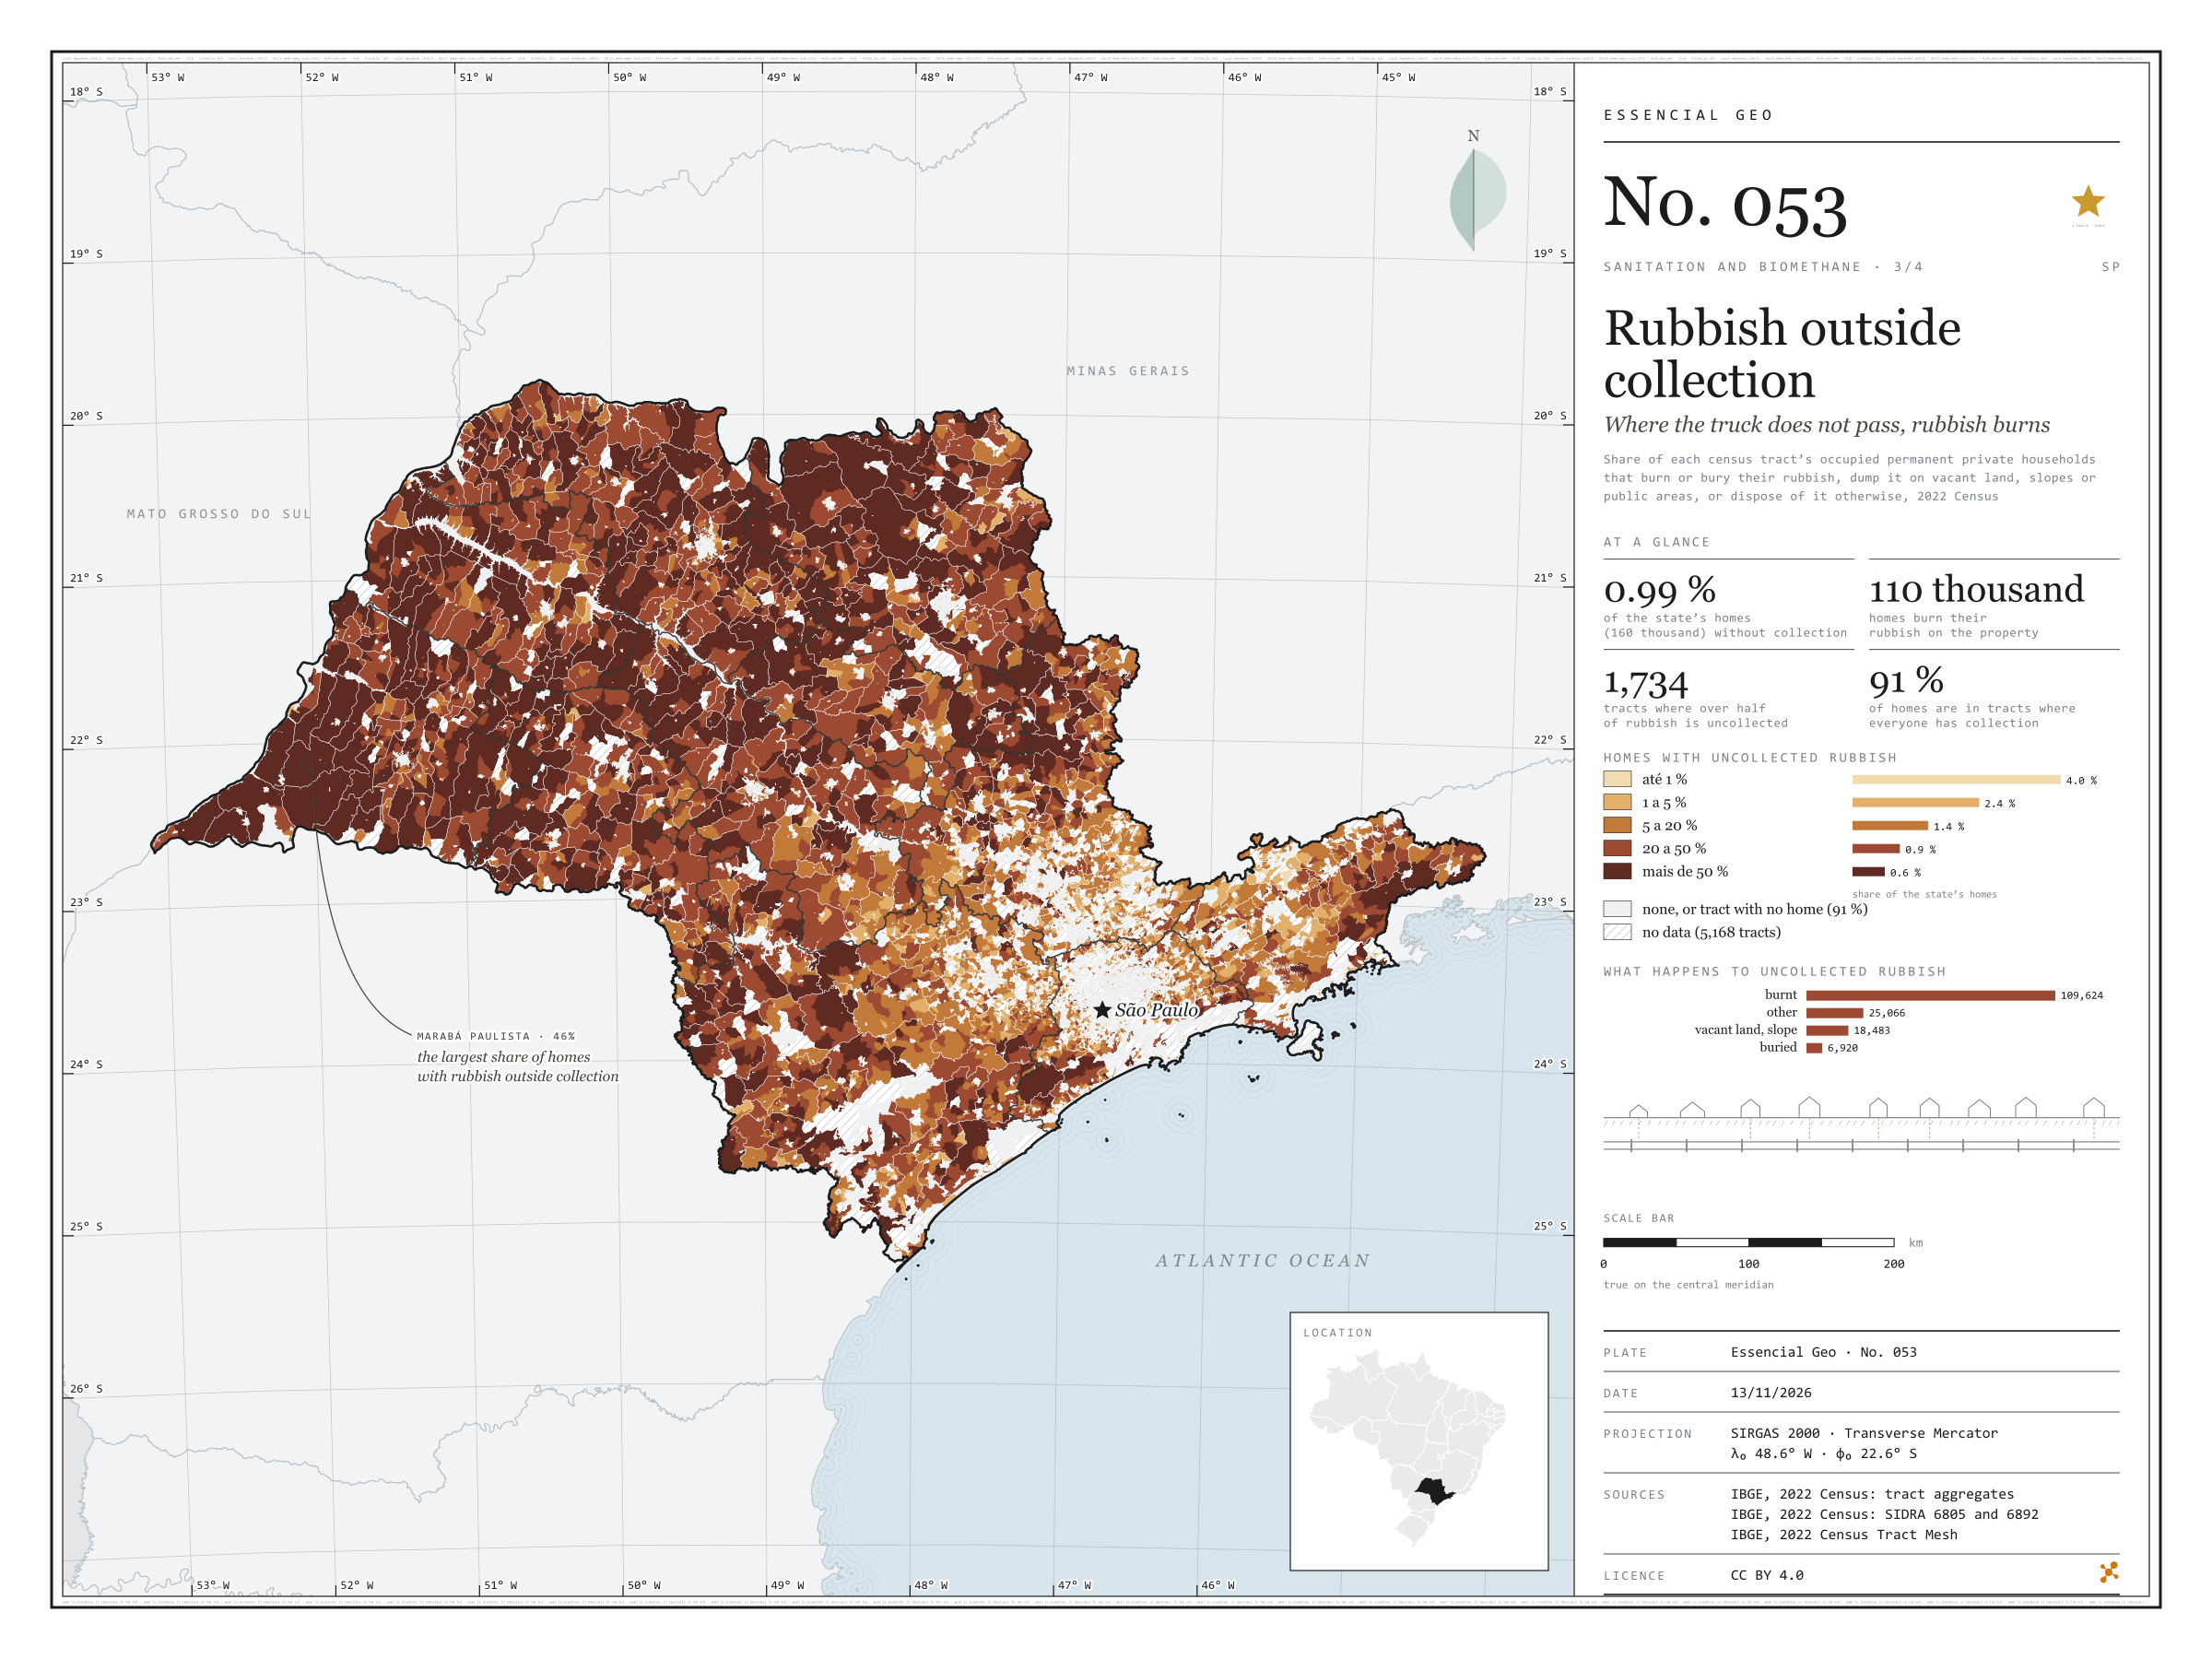
Fig. 053 São Paulo State (SP) EPSG:4674 Source: IBGE

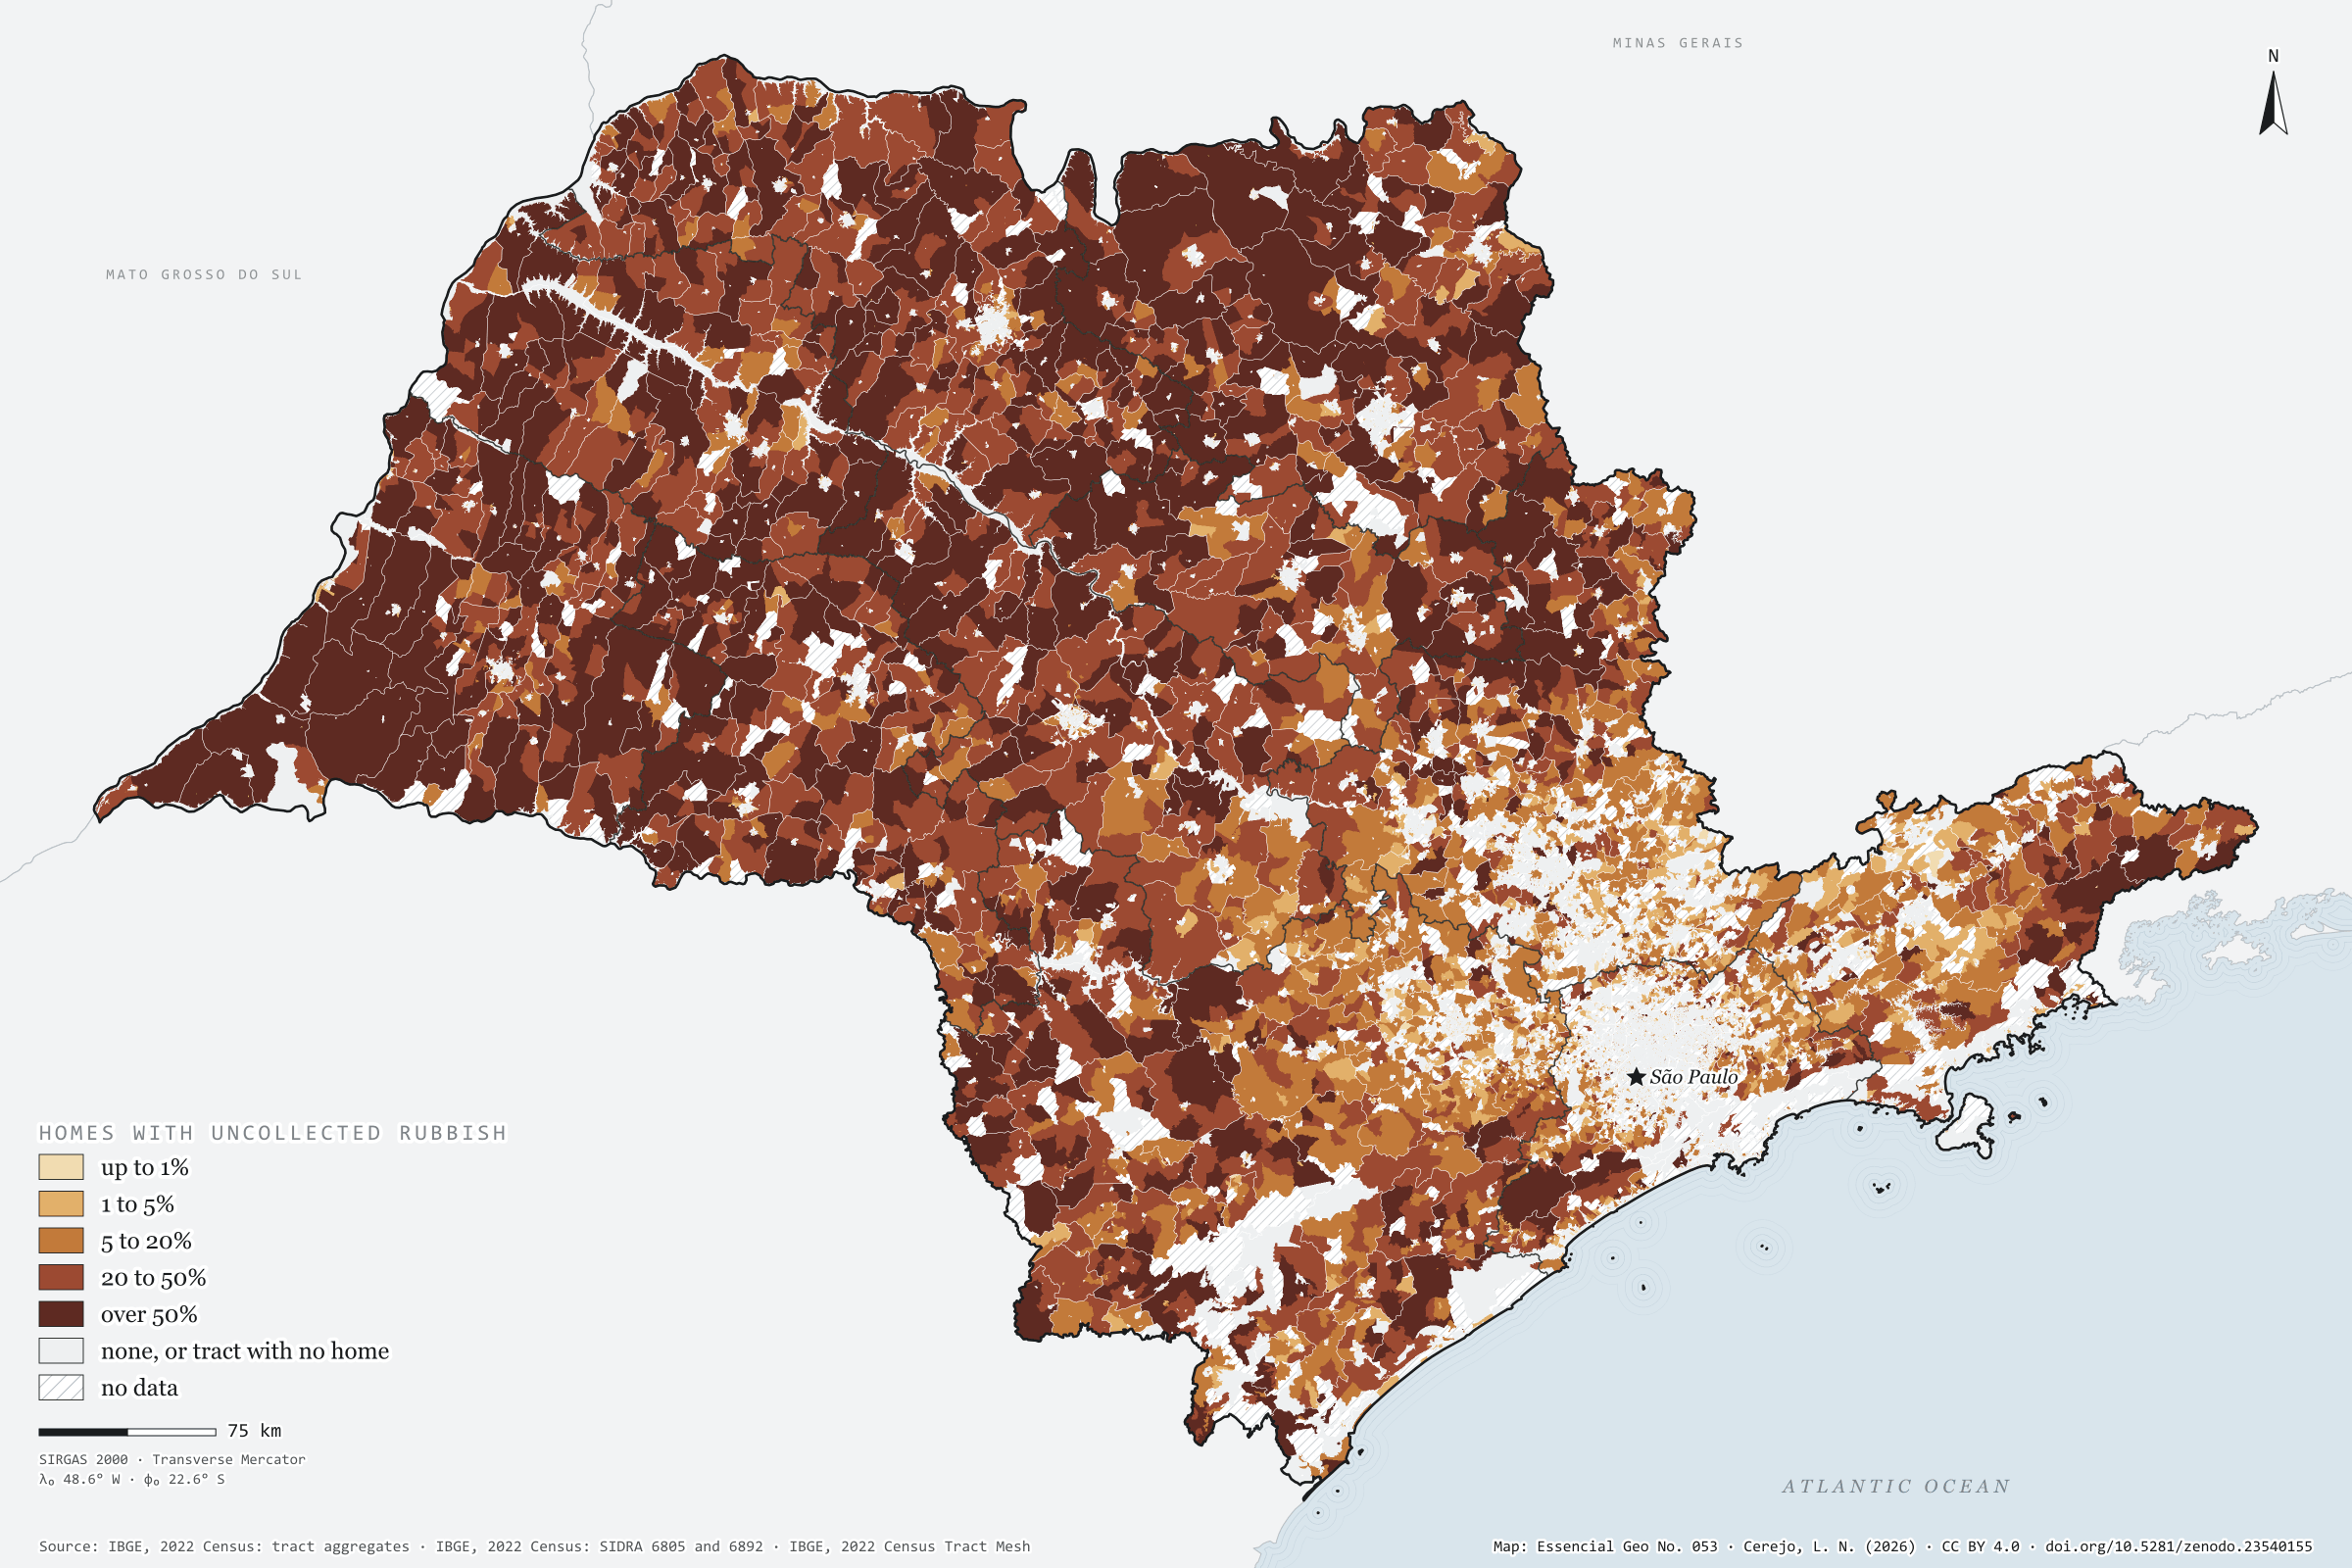
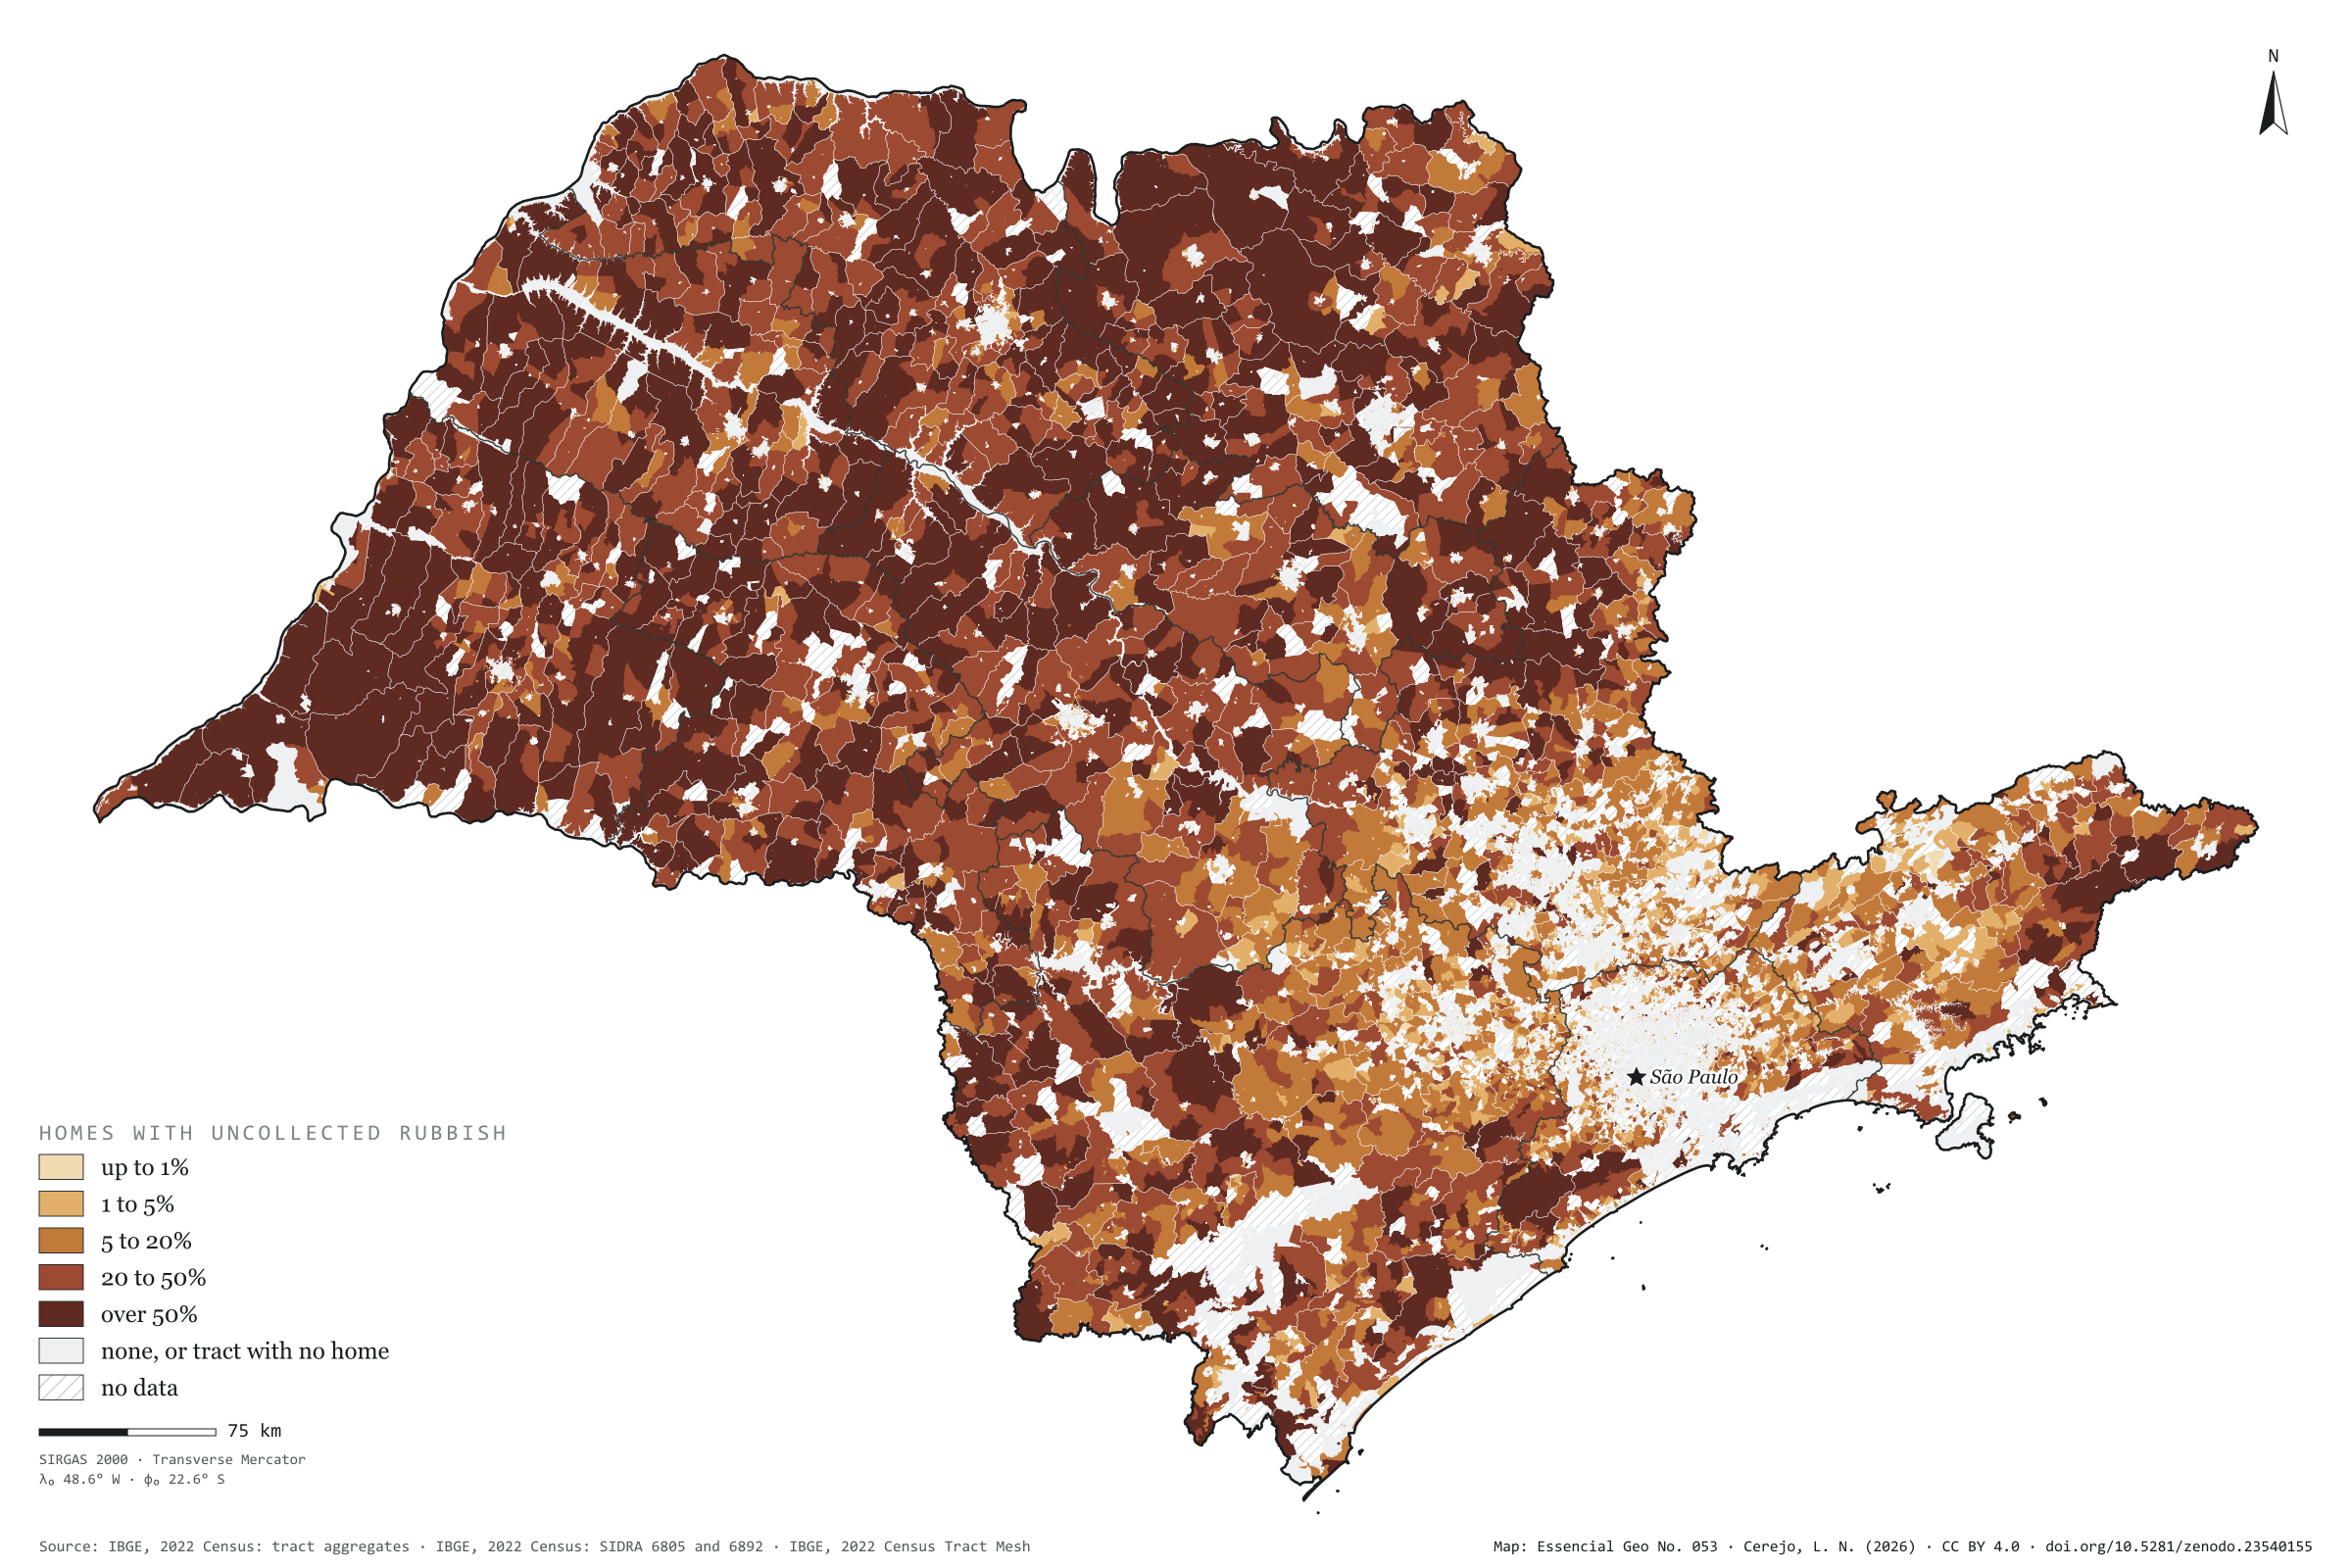
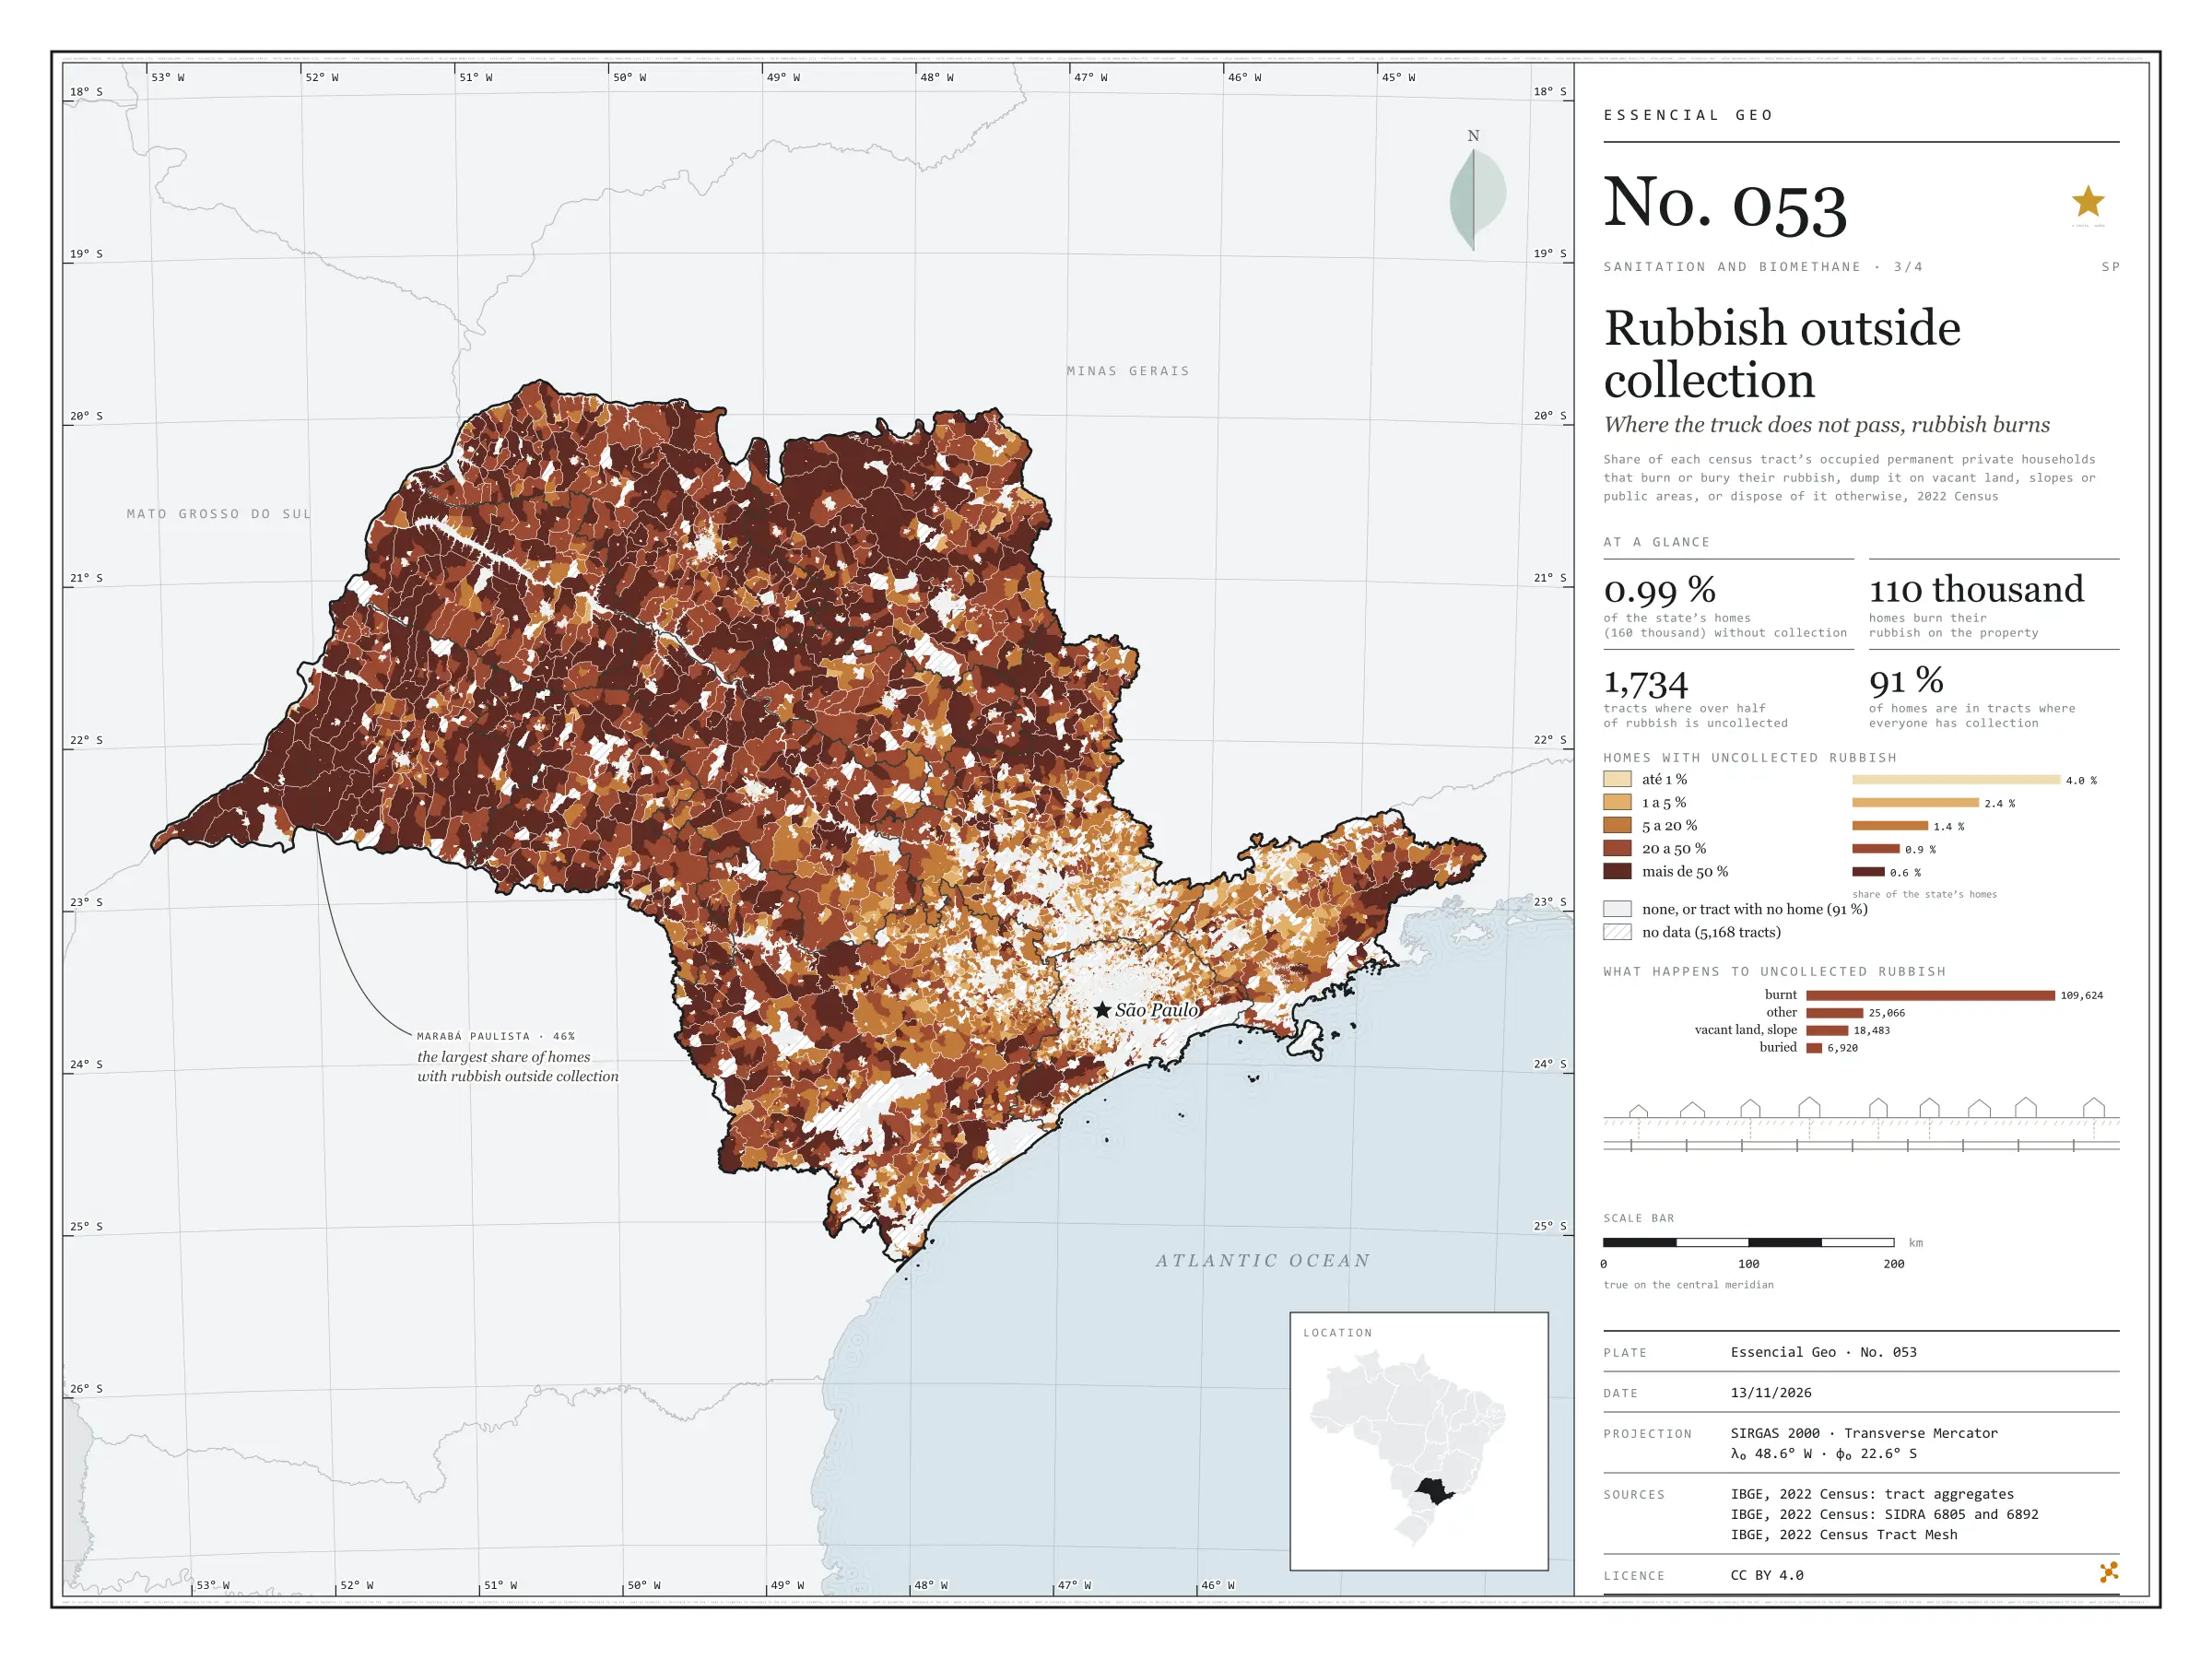
Nearly all of São Paulo’s rubbish is collected: in 2022, only 0.99% of households, 160,000, disposed of it otherwise. But that 1% is not spread out. It is in the countryside, where the truck does not reach, and the most common destination is fire: 110,000 households burnt their rubbish on the property. Painted tract by tract, the map shows the state inside out: the towns are pale, with collection for everyone, and the rural interior darkens. In 1,734 tracts, more than half the households had no collection. Marabá Paulista, in the Pontal do Paranapanema, has the largest share of its households outside collection (46%); the capital has the largest number (12,094). Rubbish that is not collected does not reach a landfill or a digester either. Third plate of the collection “Sanitation and biomethane”.

Technical record · downloads · citation

At a glance

Households, by the share of their tract with uncollected rubbish (households)
  • none 90.7%
  • up to 1% 4%
  • 1 to 5% 2.4%
  • 5 to 20% 1.4%
  • 20 to 50% 0.9%
  • over 50% 0.6%
Households with uncollected rubbish

1 %

160,093 of 16,224,248 (SIDRA 6892)

Households burning rubbish on the property

109,624 households

Layers

  • setores polygon 103,319 census tracts: households by rubbish destination and uncollected-rubbish class (same GPKG as plate 051)
  • regioes_intermediarias polygon 11 intermediate geographic regions
  • limite_estadual polygon State boundary

Metadata

Extent
São Paulo State (SP)
CRS / Projection
SIRGAS 2000 (EPSG:4674)
EPSG:4674
Software
Node.js · d3-geo · QGIS
Method
Share of each census tract’s occupied permanent private households that burn or bury their rubbish, dump it on vacant land, slopes or public areas, or dispose of it otherwise, in five classes and zero; tracts with withheld values get a class only when it does not depend on the omitted value.
Version
v1.0.0
Licence
CC BY 4.0

Downloads

Figure to reuse

The map without a frame, with legend, scale, reference system and credit written on it: ready for papers, lectures and slides. In two versions: with the basemap (neighbours and sea) or only the mapped area, on white.

Point a camera at it to open this page.

How to cite

Cerejo, L. N. (2026). Lixo fora da coleta: onde o caminhão não passa, o lixo queima [Rubbish outside collection: Where the truck does not pass, rubbish burns] (Version 1.0.0) [Data set]. Zenodo. https://doi.org/10.5281/zenodo.23540155

No. 054 Energy · biomass Sanitation and biomethane 4/4

Sewage, mains and biomethane

Sludge gas only exists where sewage reaches the plant

Fig. 054 São Paulo State (SP) EPSG:4674 Source: IBGE, CP2B (Unicamp)

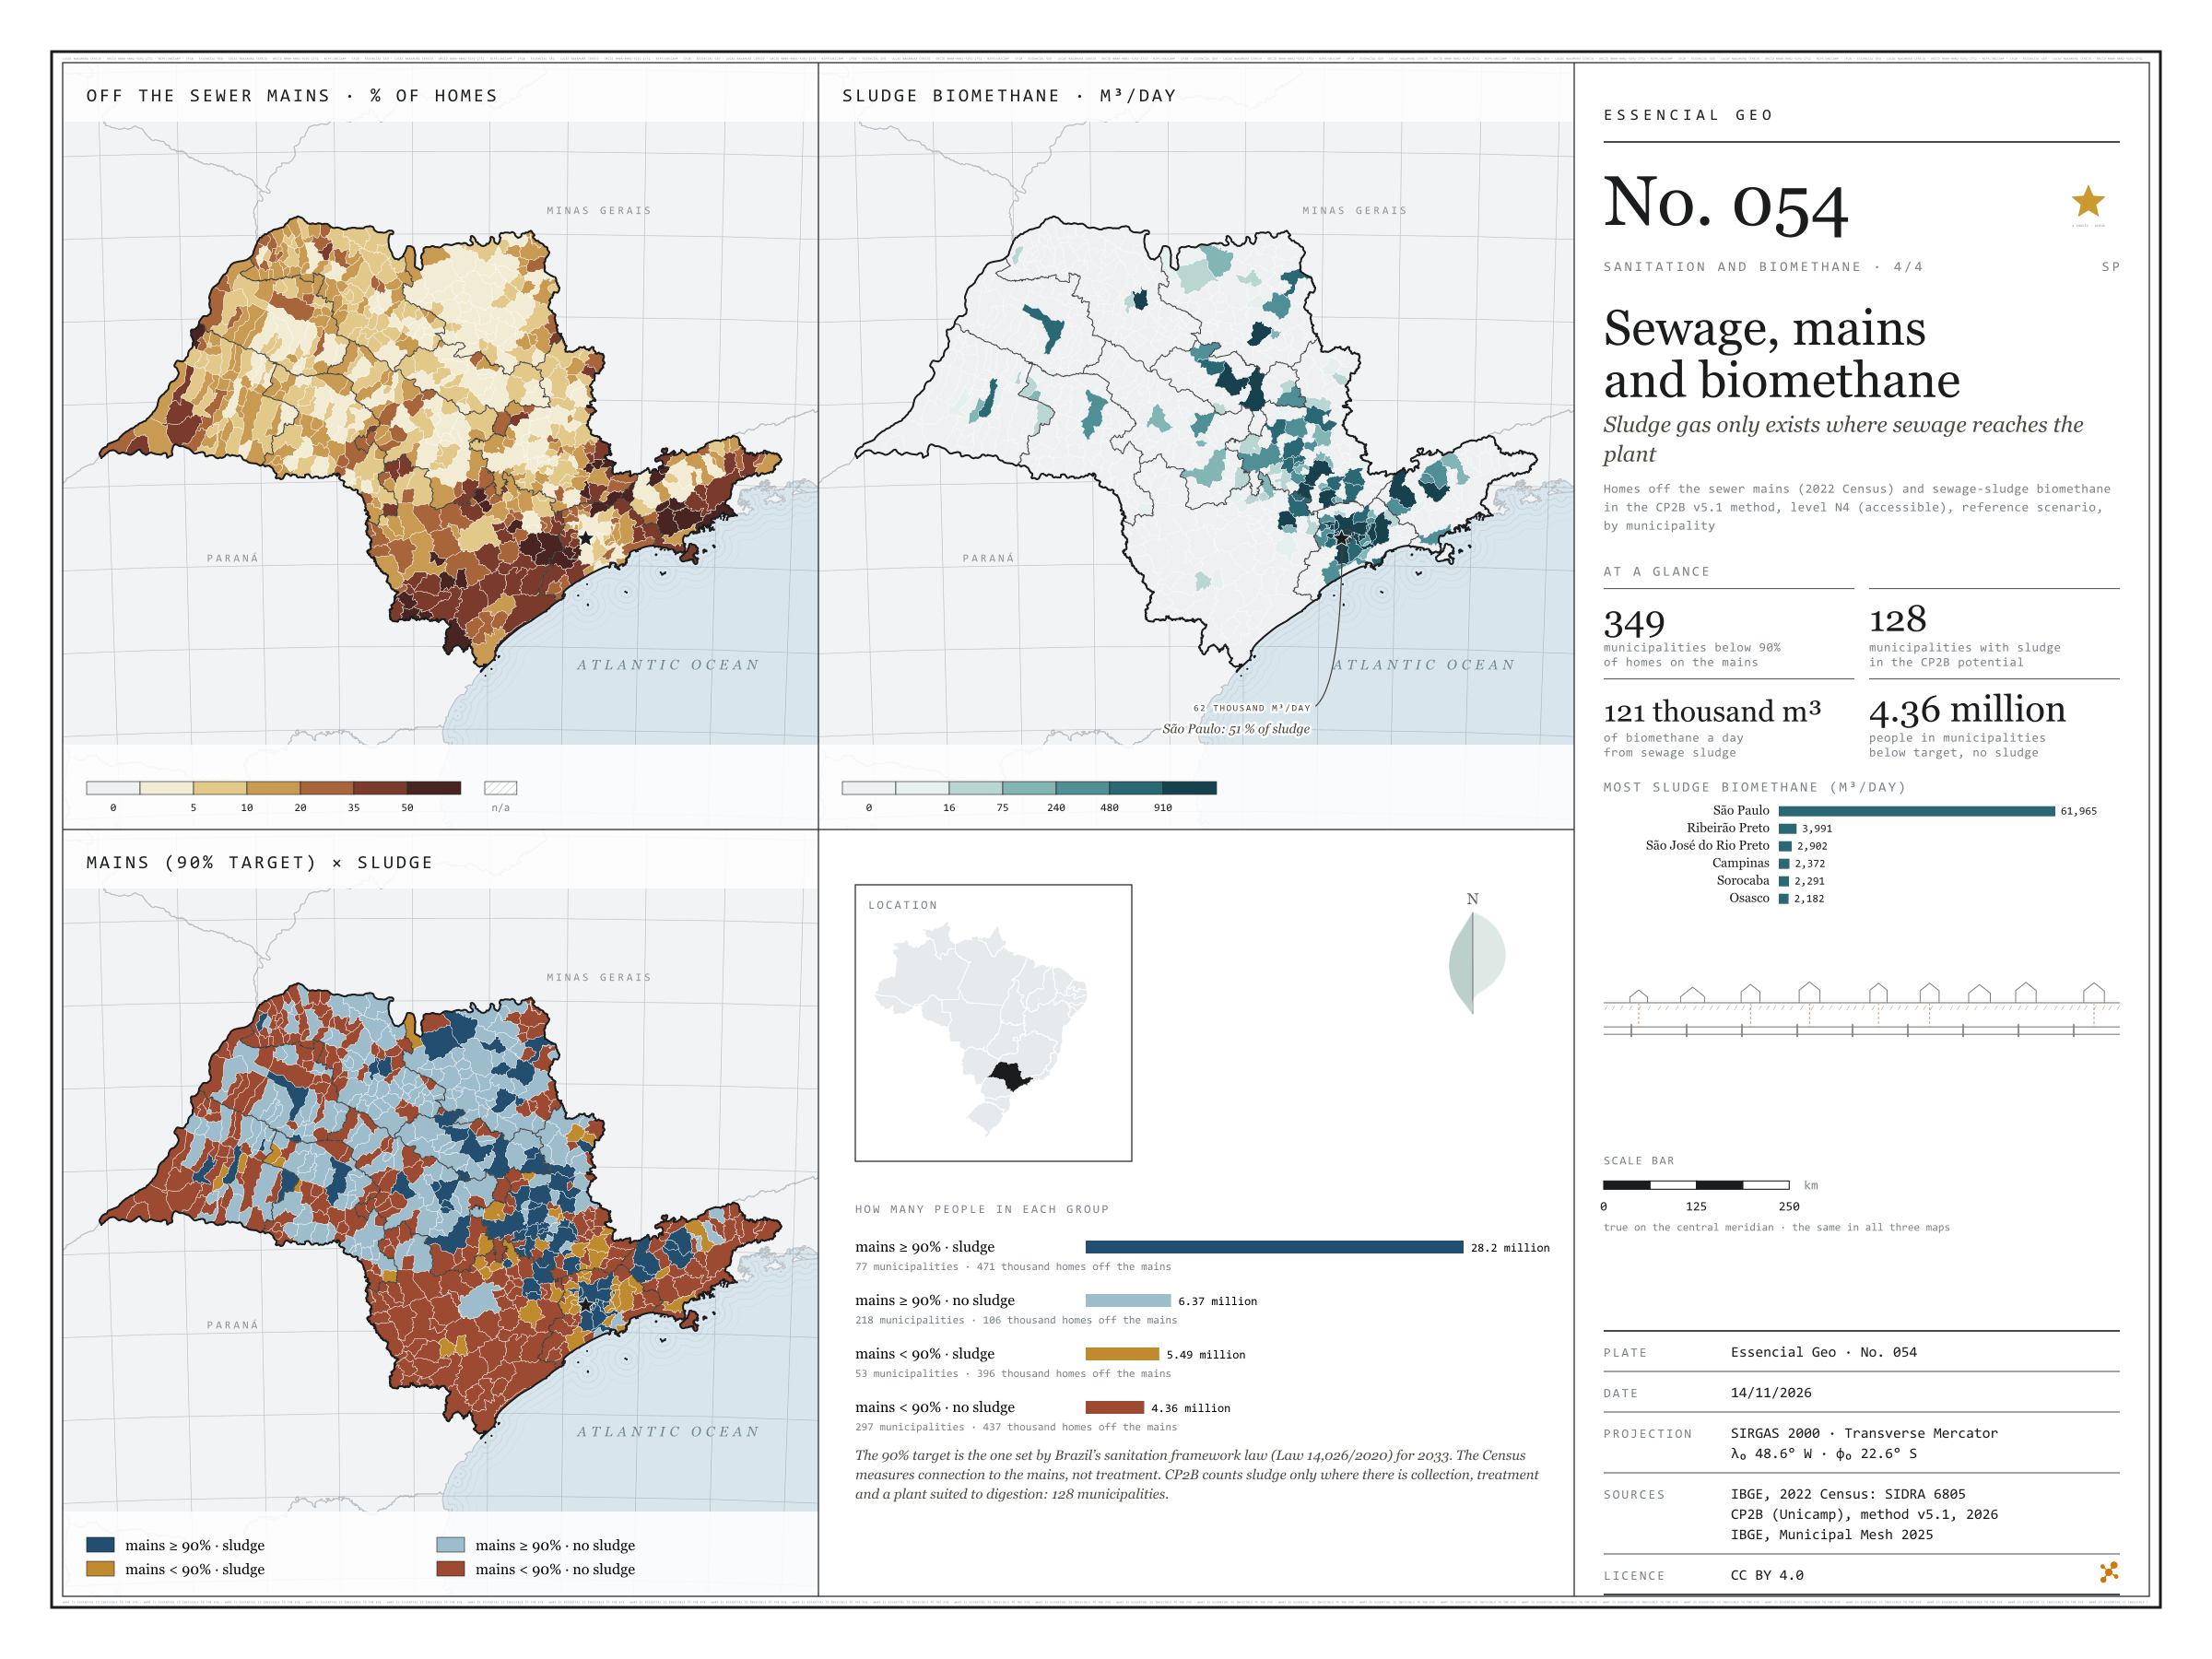
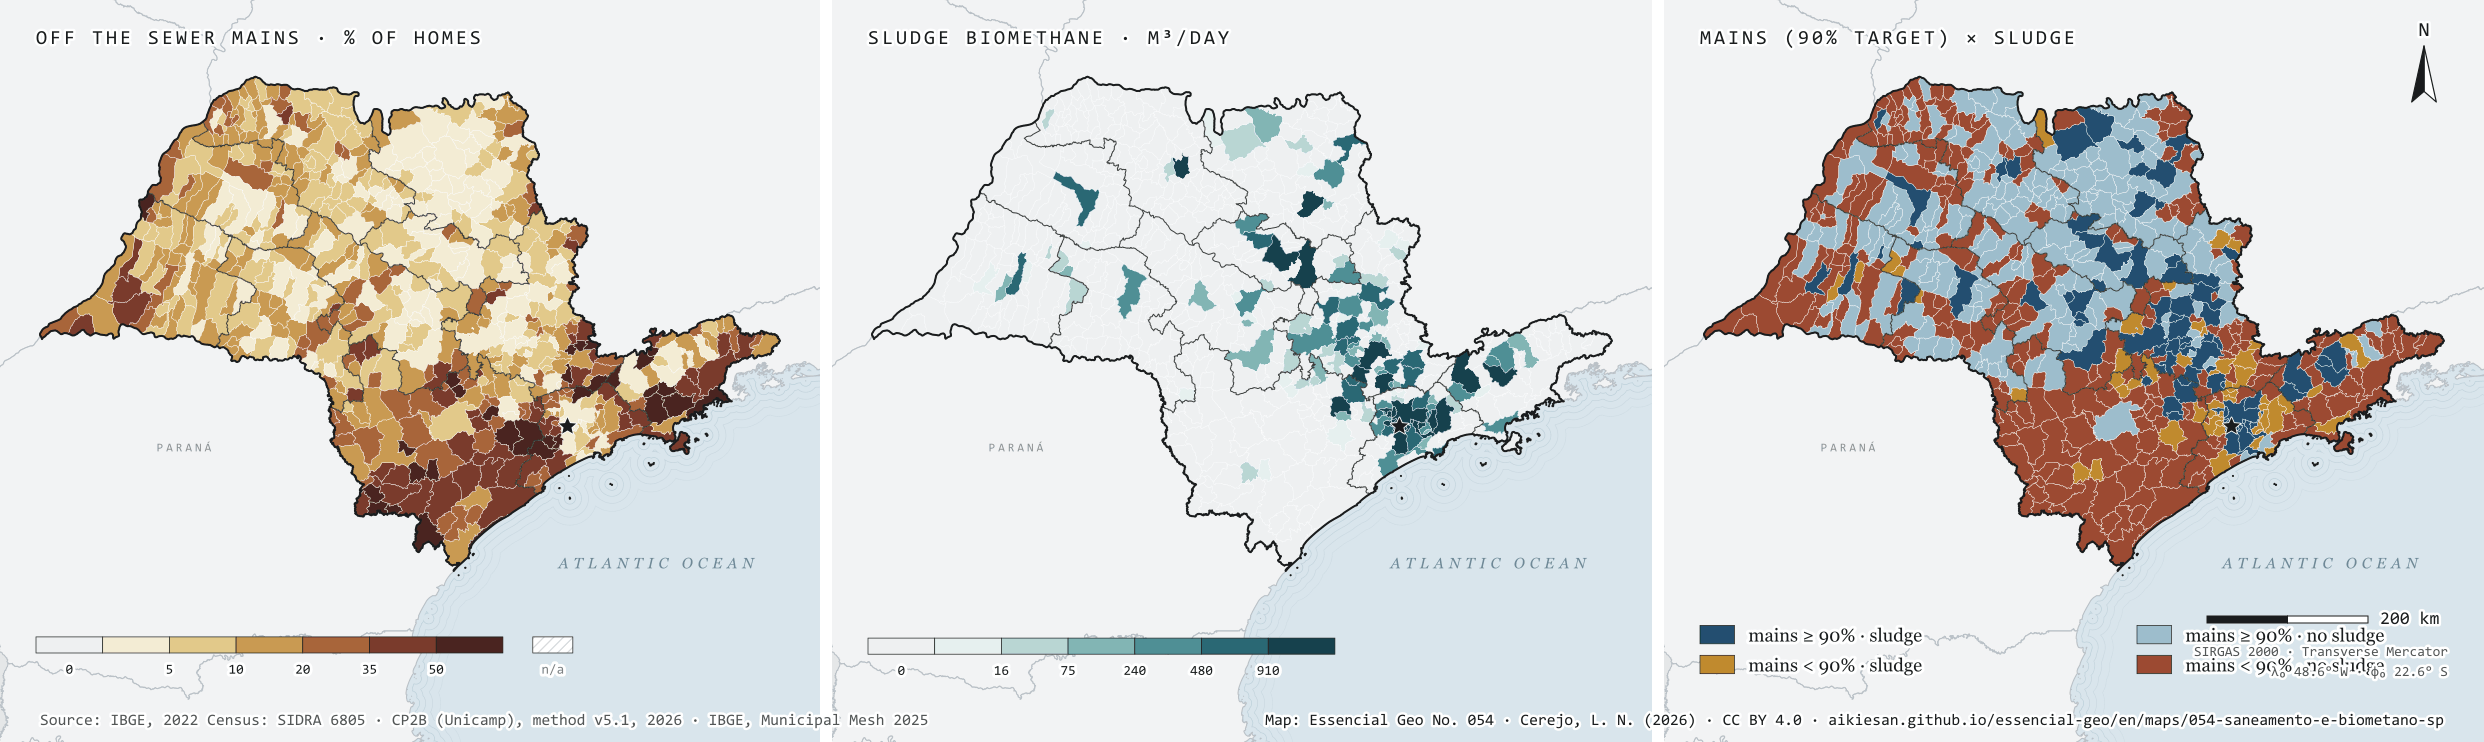
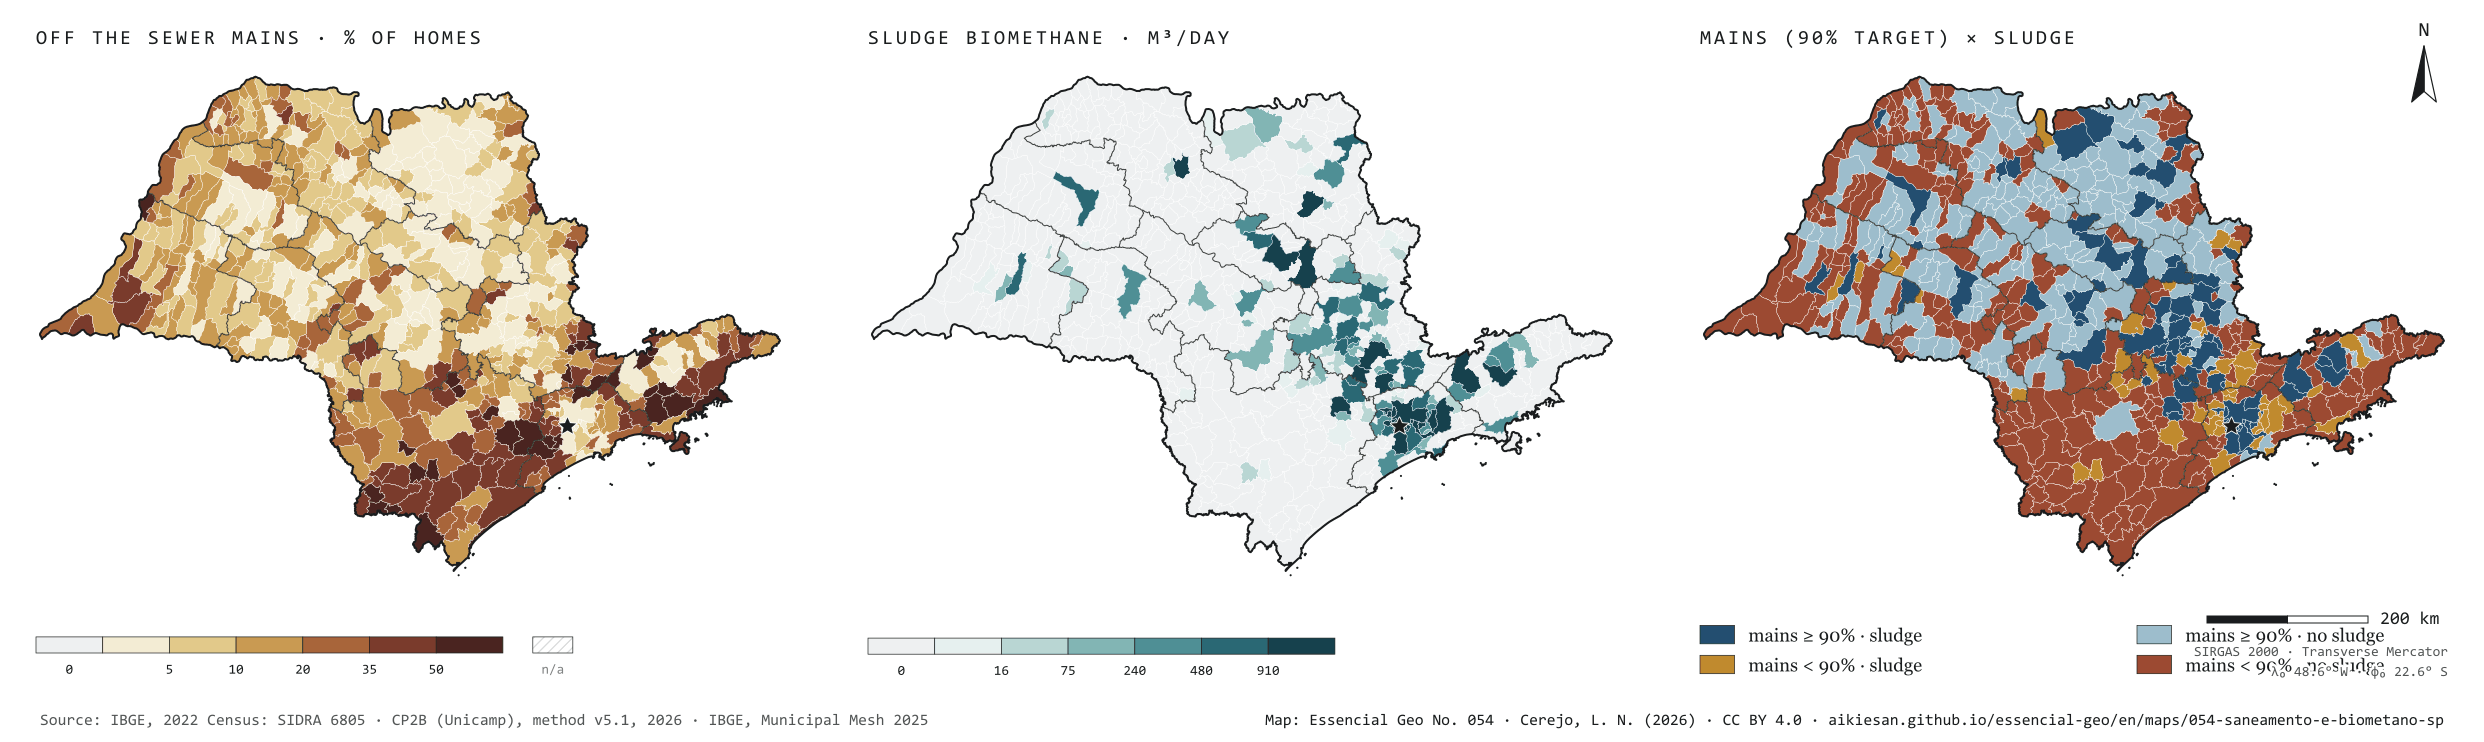
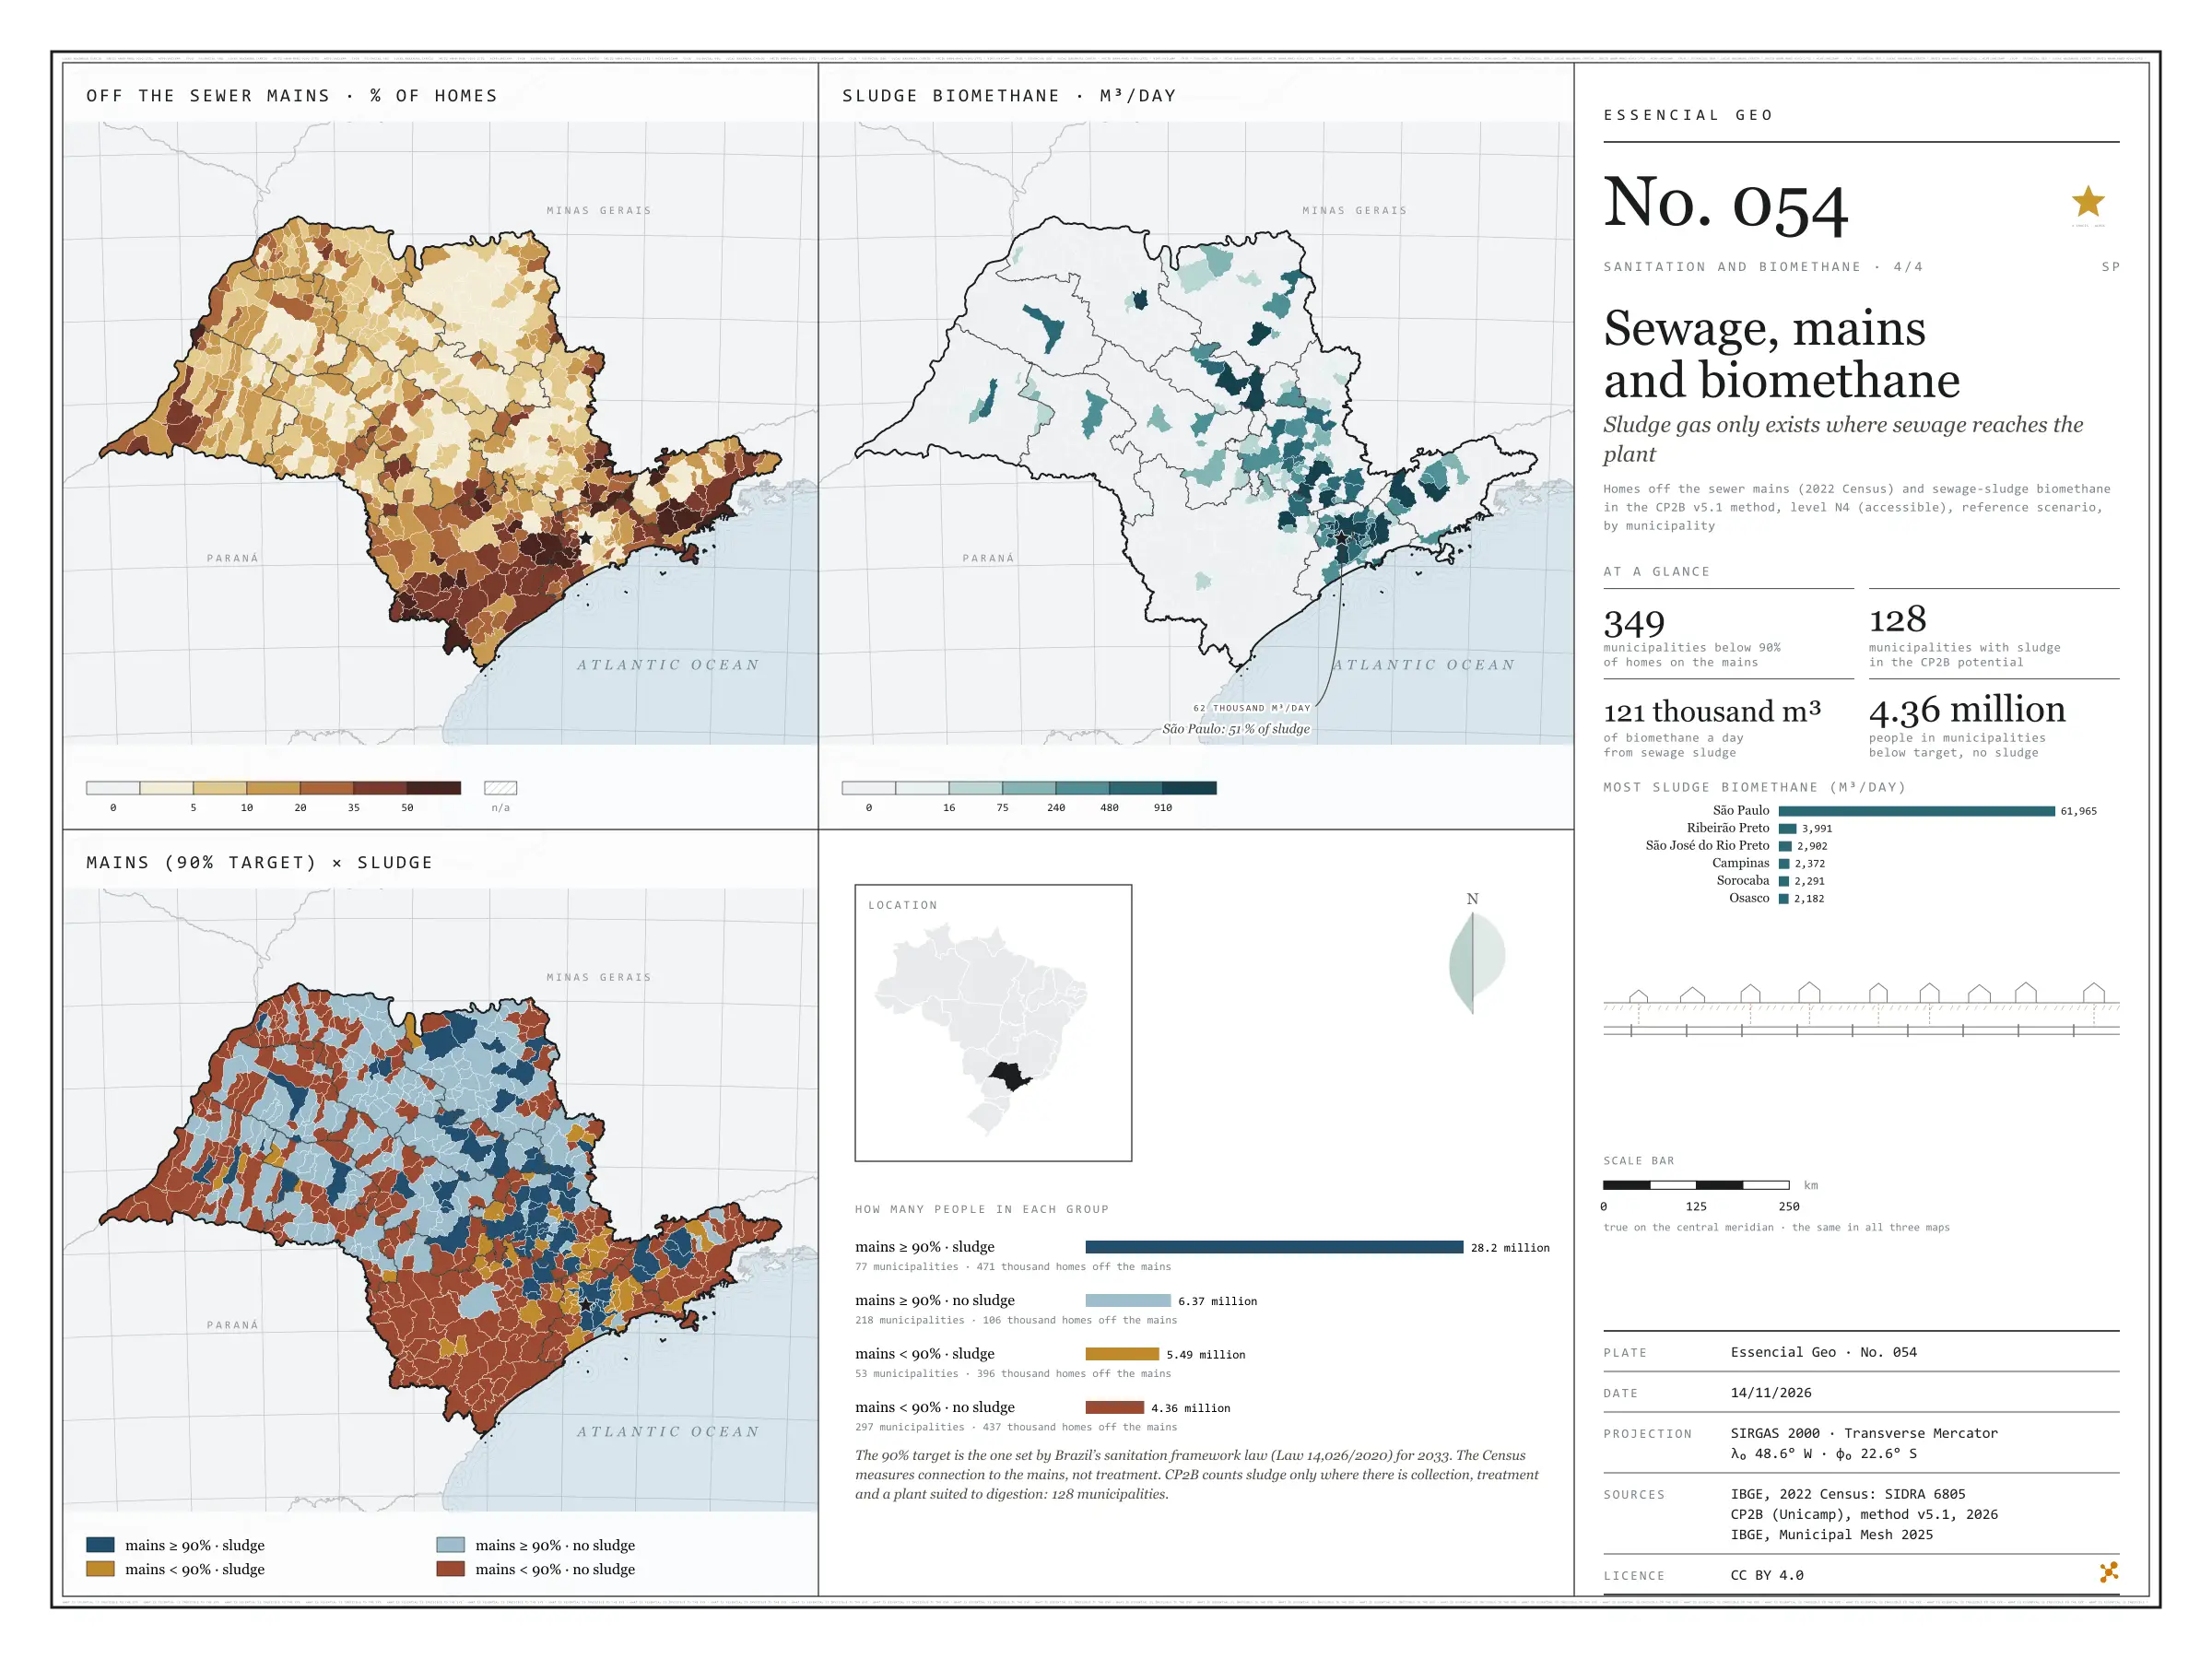
Sludge from sewage plants becomes biomethane, but only where sewage is collected and treated at a plant suited to digestion. Under the CP2B method, that gives São Paulo 121,000 m³ of biomethane a day, in only 128 of its 645 municipalities, and the capital accounts for 51%. Beside it, the 2022 Census: 349 municipalities still have fewer than 90% of households on the mains, the target of the sanitation legal framework for 2033. The crossing separates four groups. 77 municipalities, with 28.2 million people, already pass the target and have sludge; 297, with 4.36 million, are below the target and have no sludge at all, and add up to 437,000 households off the mains. Bringing the mains to those places is the condition for their sewage to count towards the gas. Last plate of the collection “Sanitation and biomethane”.

Technical record · downloads · citation

At a glance

People by mains and sludge group (people)
  • mains ≥ 90% · with sludge 63.5%
  • mains ≥ 90% · no sludge 14.3%
  • mains < 90% · with sludge 12.4%
  • mains < 90% · no sludge 9.8%
Biomethane from sewage sludge

121,403 m³/day

128 municipalities; 61,965 m³/day in the capital

Municipalities below 90% of households on the mains

349 municipalities

9.84 million people

Layers

  • municipios polygon 645 municipalities: people, households, sewage off the mains, uncollected rubbish, biomethane from sludge and rubbish, and crossing group
  • regioes_intermediarias polygon 11 intermediate geographic regions
  • limite_estadual polygon State boundary

Metadata

Extent
São Paulo State (SP)
CRS / Projection
SIRGAS 2000 (EPSG:4674)
EPSG:4674
Software
Node.js · d3-geo · QGIS
Method
Share of households off the sewage mains (SIDRA 6805) and biomethane from sewage sludge under the CP2B v5.1 method, level N4 (accessible), reference scenario, by municipality; municipalities are crossed by the 90% mains target and by whether the potential includes sludge.
Version
v1.0.0
Licence
CC BY 4.0
DOI
being registered on Zenodo

Downloads

Figure to reuse

The map without a frame, with legend, scale, reference system and credit written on it: ready for papers, lectures and slides. In two versions: with the basemap (neighbours and sea) or only the mapped area, on white.

Point a camera at it to open this page.

How to cite

Cerejo, L. N. (2026). Esgoto, rede e biometano: o gás do lodo só existe onde o esgoto chega à estação [Sewage, mains and biomethane: Sludge gas only exists where sewage reaches the plant] (Version 1.0.0) [Data set]. Essencial. https://aikiesan.github.io/essencial-geo/en/maps/054-saneamento-e-biometano-sp/

Technical record

Technical record · No. 051

Sewage on the mains

At a glance

Households, by the share of their tract connected to the sewer mains (households)
  • up to 10% 4.3%
  • 10 to 50% 3.6%
  • 50 to 80% 3.2%
  • 80 to 95% 5.8%
  • 95 to 99% 9.4%
  • over 99% 73.7%
Households with sewage on the mains or a tank linked to the mains

91 %

14,813,509 of 16,224,248 households (SIDRA 6805)

Households off the mains in the city of São Paulo

205,630 households

4.8% of the capital’s households

Layers

  • setores polygon 103,319 census tracts: households by sewage and rubbish destination, mains-connection class, leading destination and uncollected-rubbish class
  • regioes_intermediarias polygon 11 intermediate geographic regions
  • limite_estadual polygon State boundary

Metadata

Extent
São Paulo State (SP)
CRS / Projection
SIRGAS 2000 (EPSG:4674)
EPSG:4674
Software
Node.js · d3-geo · QGIS
Method
Share of each census tract’s occupied permanent private households whose sewage goes to the mains, the storm drain or a tank linked to the mains, in six classes; tracts with withheld values get a class only when it does not depend on the omitted value.
Version
v1.0.0
Licence
CC BY 4.0

Downloads

Figure to reuse

The map without a frame, with legend, scale, reference system and credit written on it: ready for papers, lectures and slides. In two versions: with the basemap (neighbours and sea) or only the mapped area, on white.

Point a camera at it to open this page.

How to cite

Cerejo, L. N. (2026). Esgoto na rede: a rede cobre a cidade; o campo fica na fossa [Sewage on the mains: The mains cover the city; the countryside stays on the tank] (Version 1.0.0) [Data set]. Zenodo. https://doi.org/10.5281/zenodo.23540101

Data and plates under CC BY 4.0: use them in commercial drawings and papers, citing the source.

100%