Skip to content
Essencial

Collection · 3 plates

Electricity in Brazil

Transmission lines and substations, power plants by source and distributed solar generation by municipality.

3 of 3 published

In reading order, from the first to the latest. All collections

The route

Read in order: each plate adds a layer to the one before.

Start with the first plate
  1. Plate 1/3 · No. 042 Transmission lines The wires that stitch the country together
  2. Plate 2/3 · No. 043 Power plants by source Water, wind, sun and fire
  3. Plate 3/3 · No. 044 Distributed solar generation The sun that lives on the rooftops
Every plate, in full

No. 042 Energy · biomass Electricity in Brazil 1/3

Transmission lines

The wires that stitch the country together

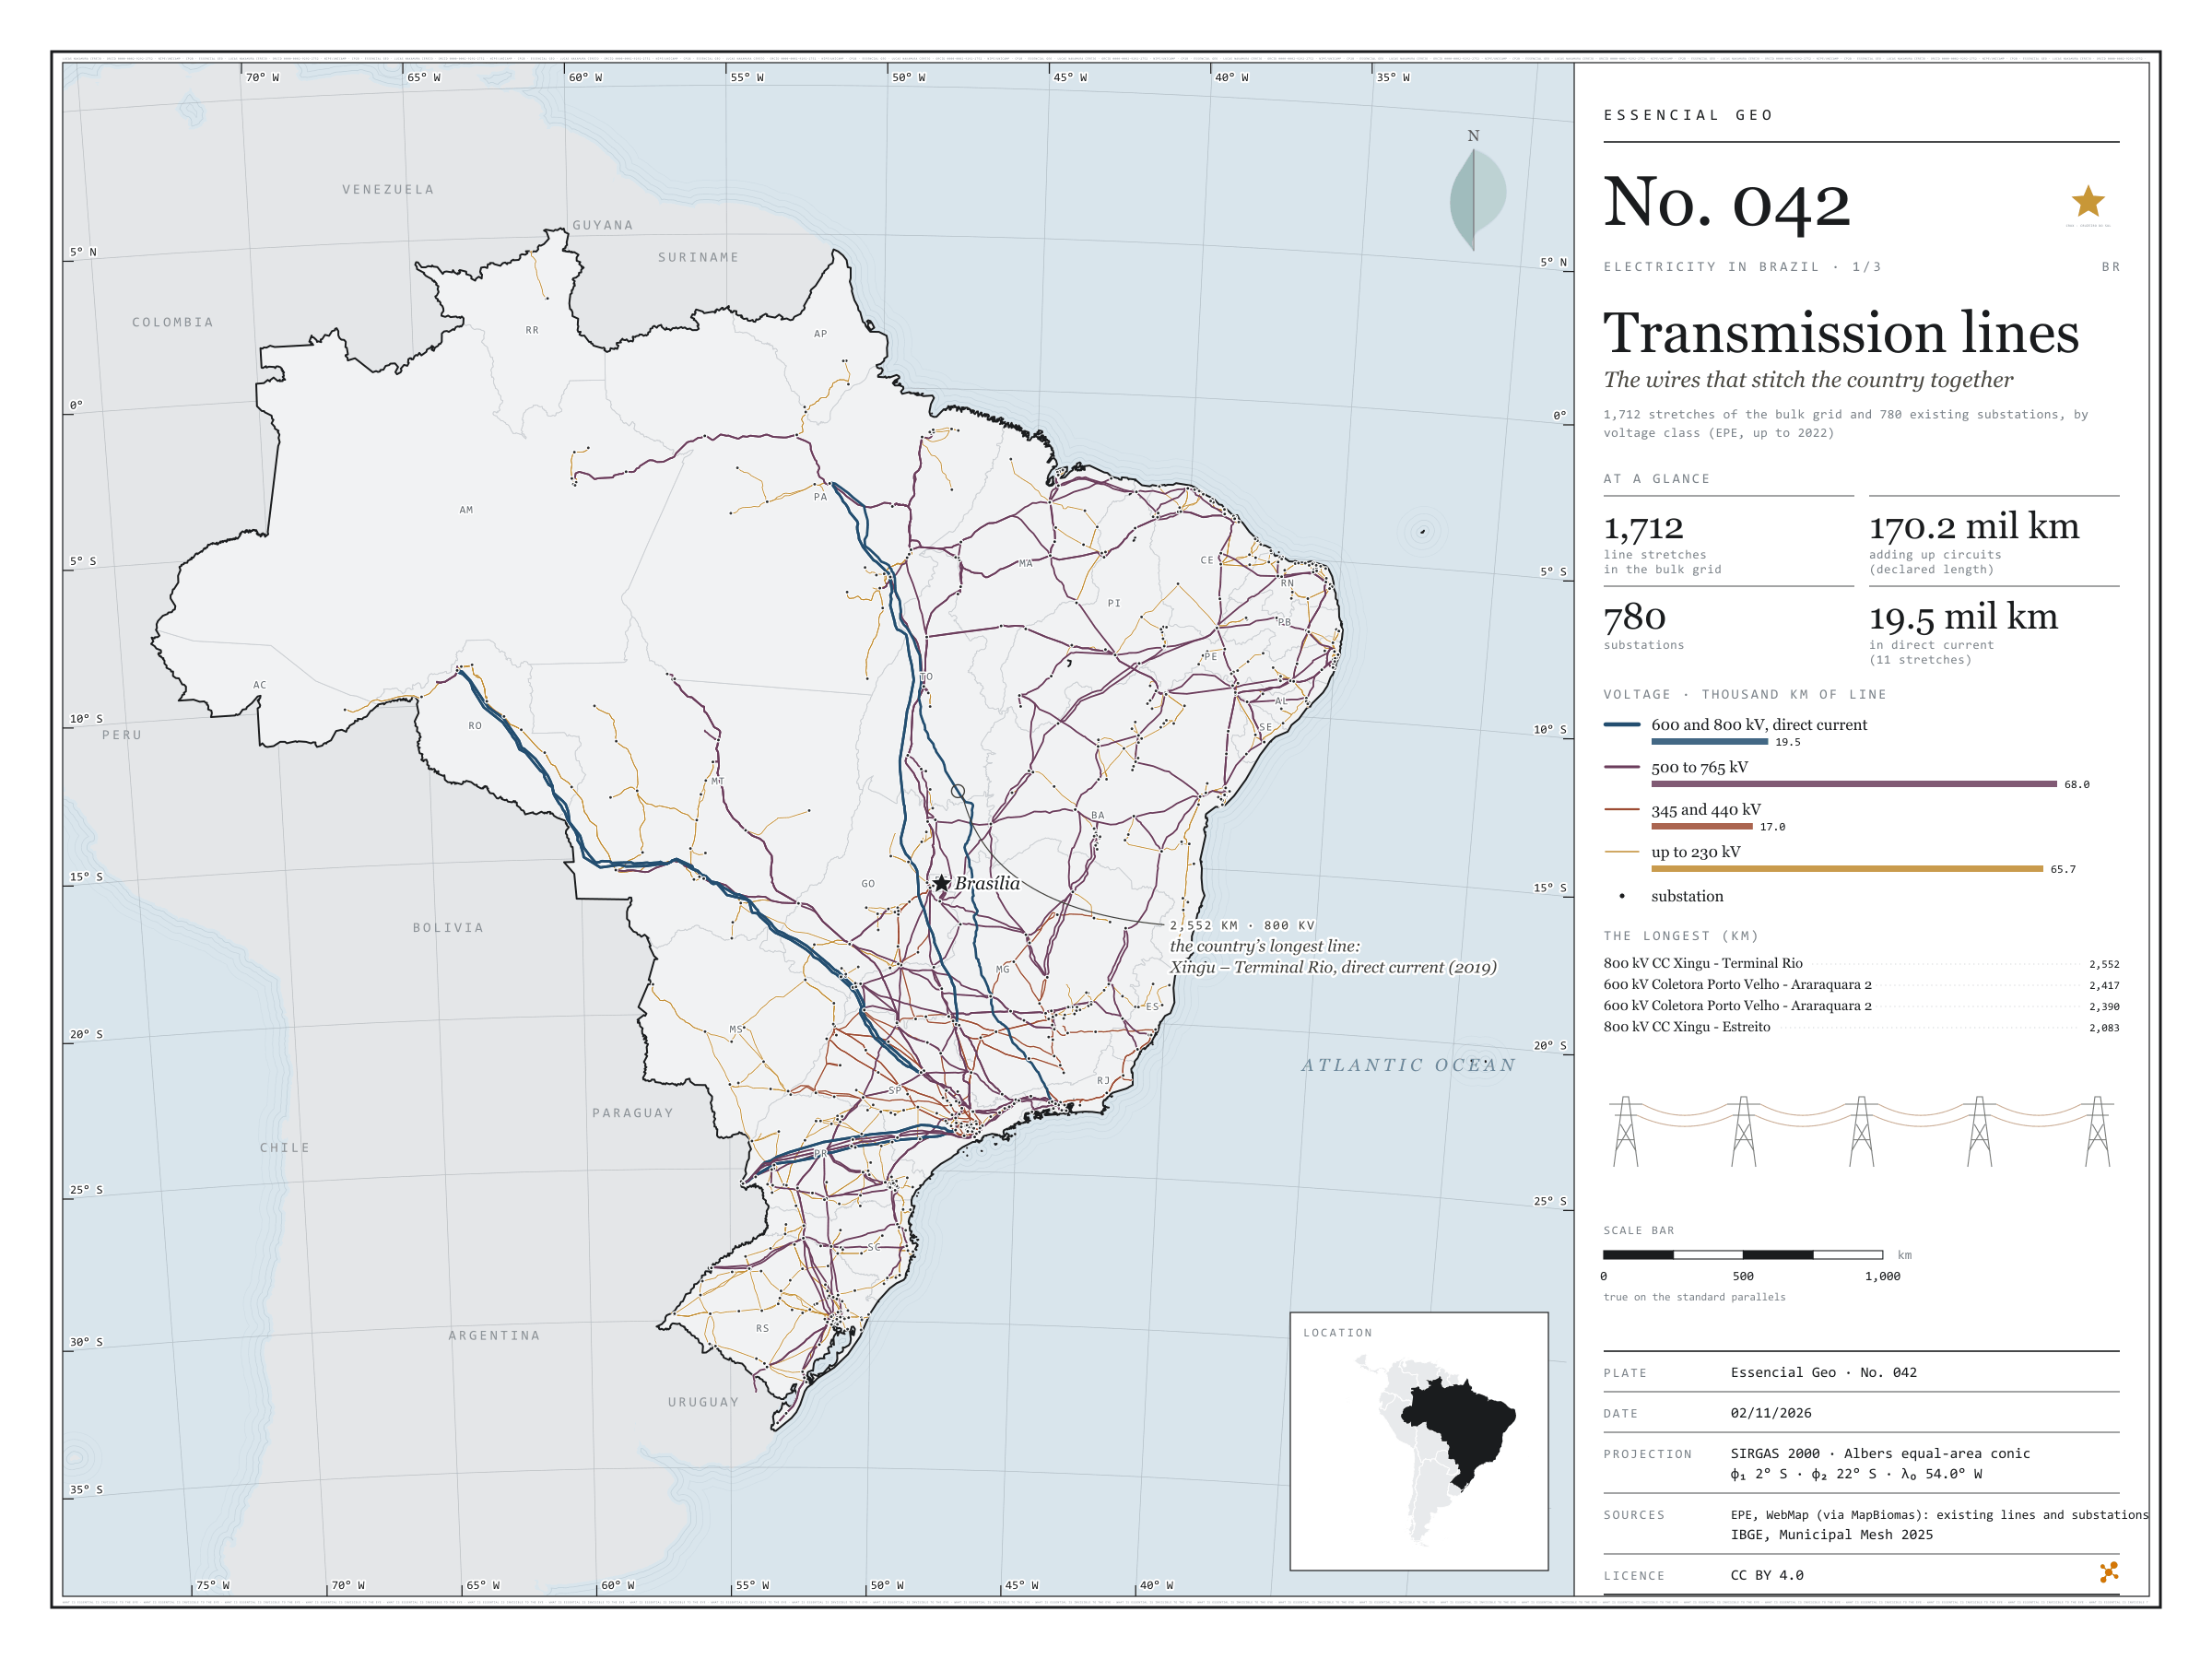
Fig. 042 Brazil EPSG:4674 Source: EPE, IBGE, Natural Earth

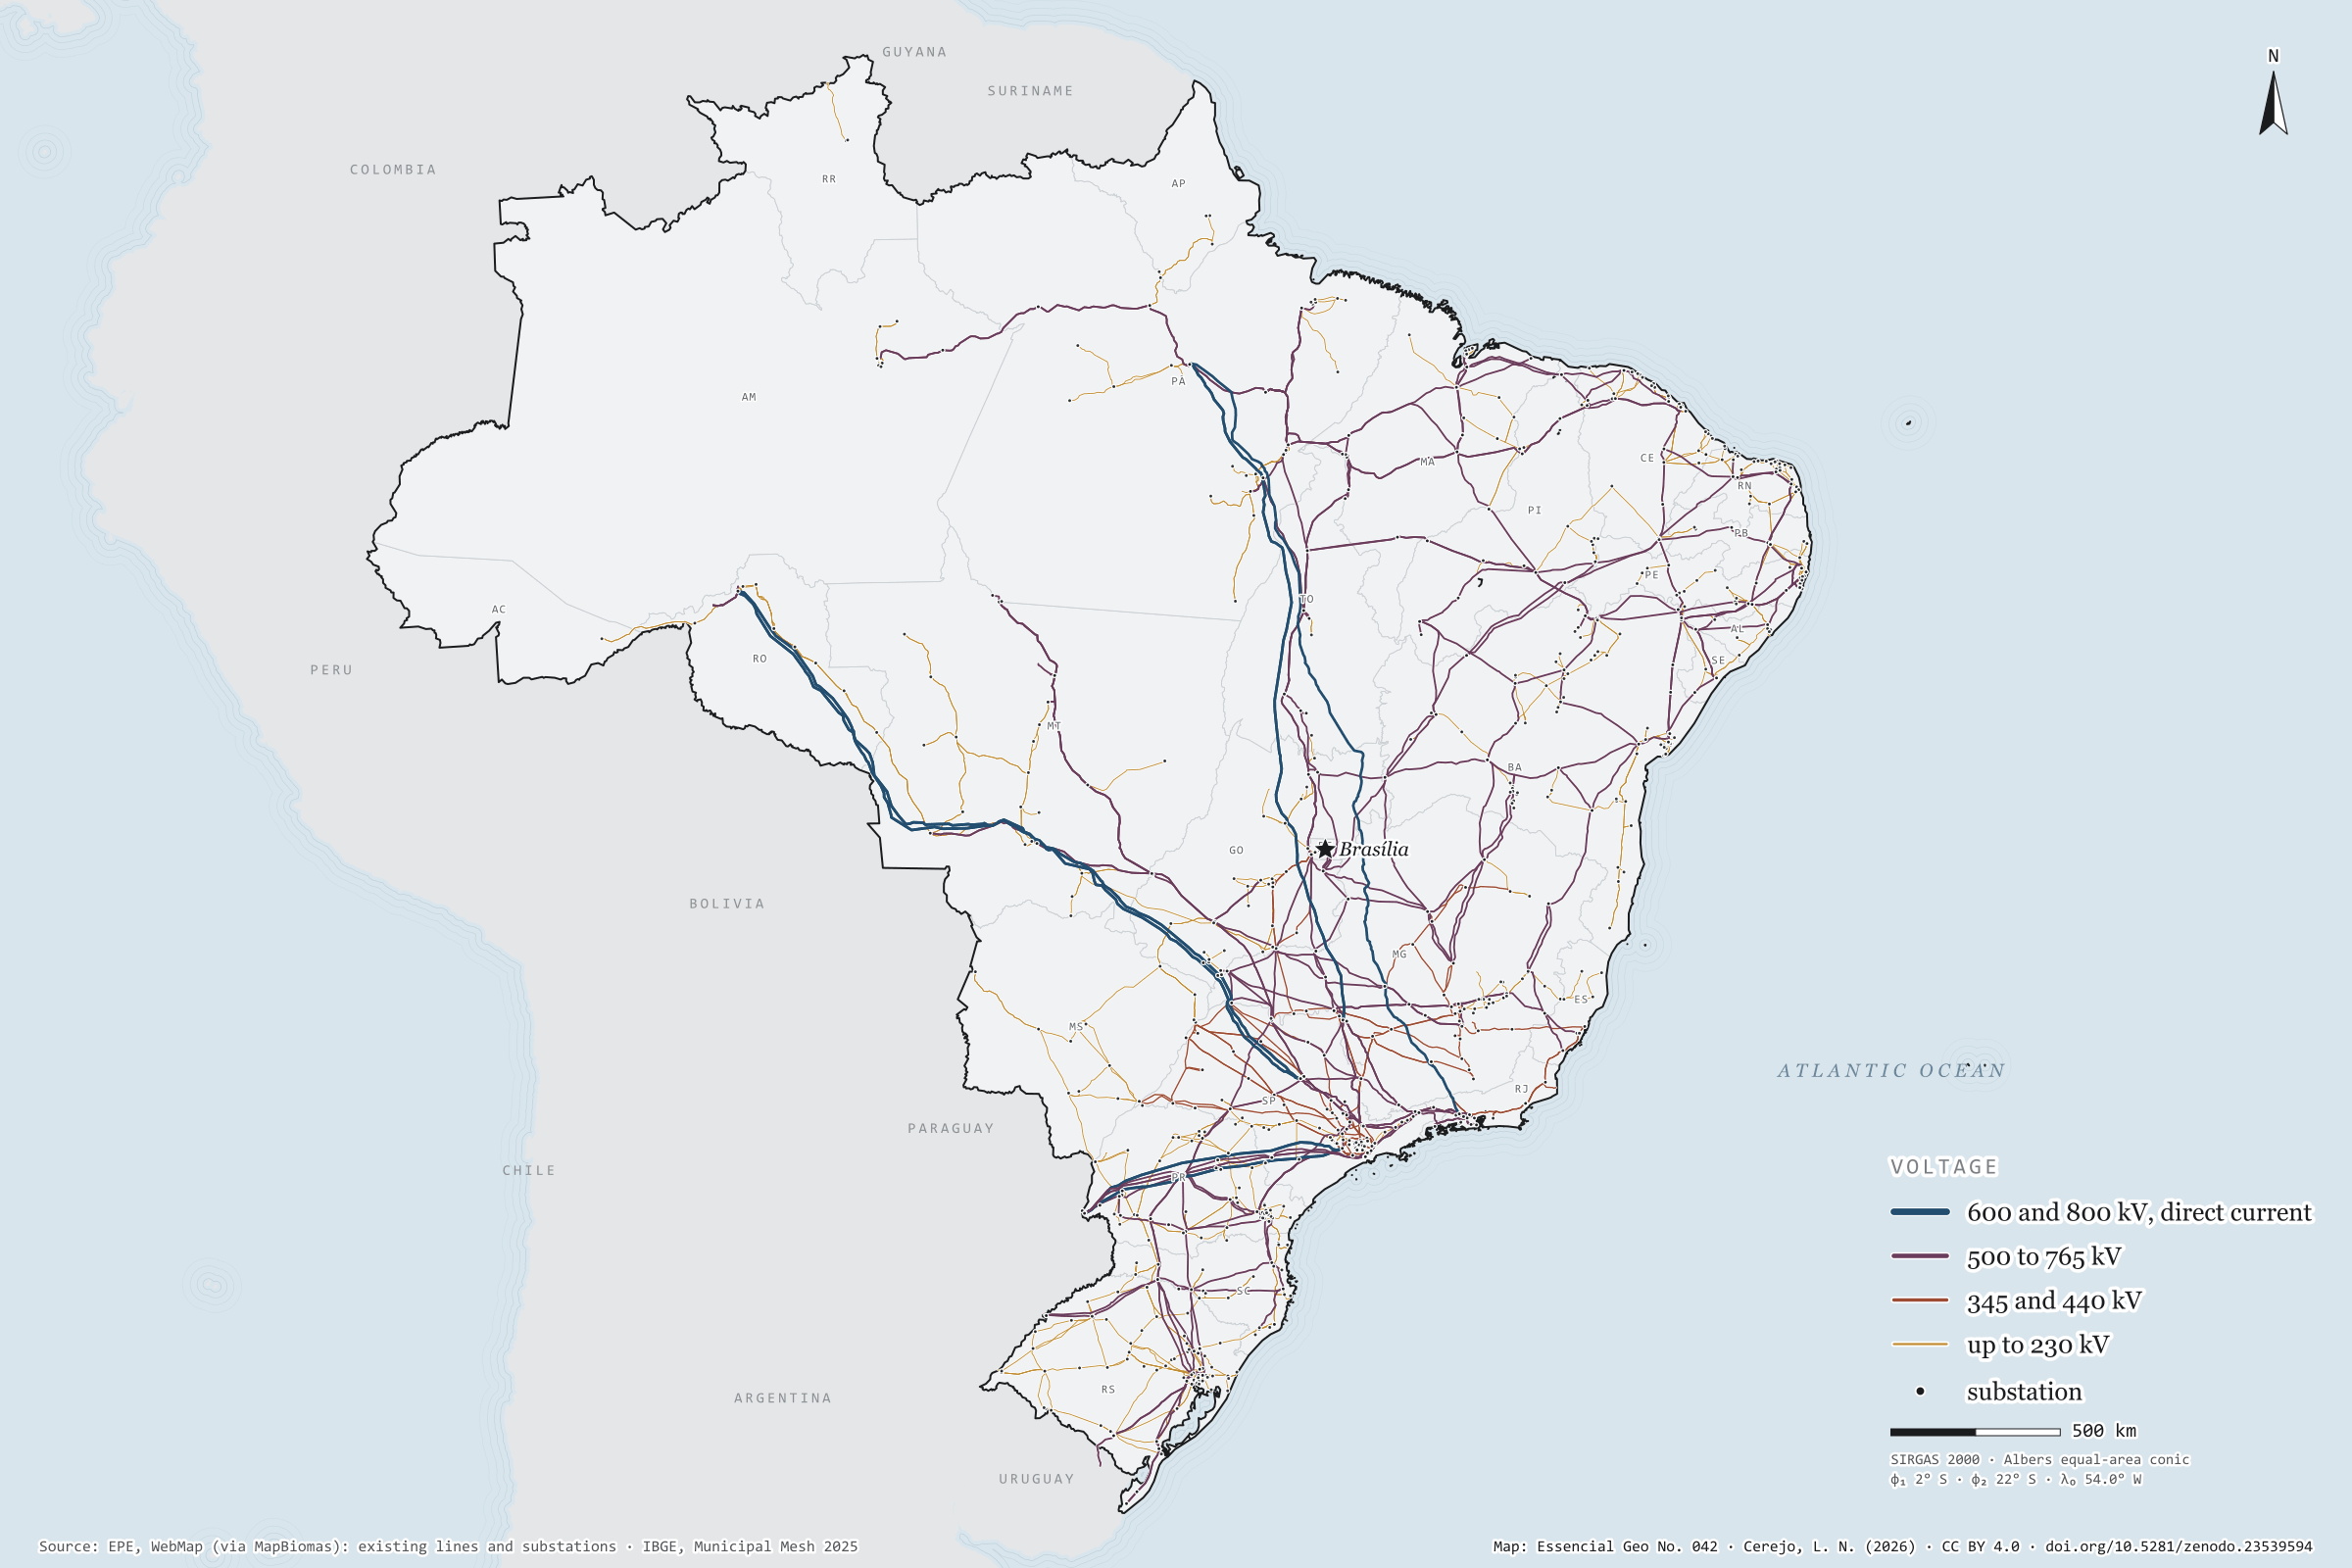
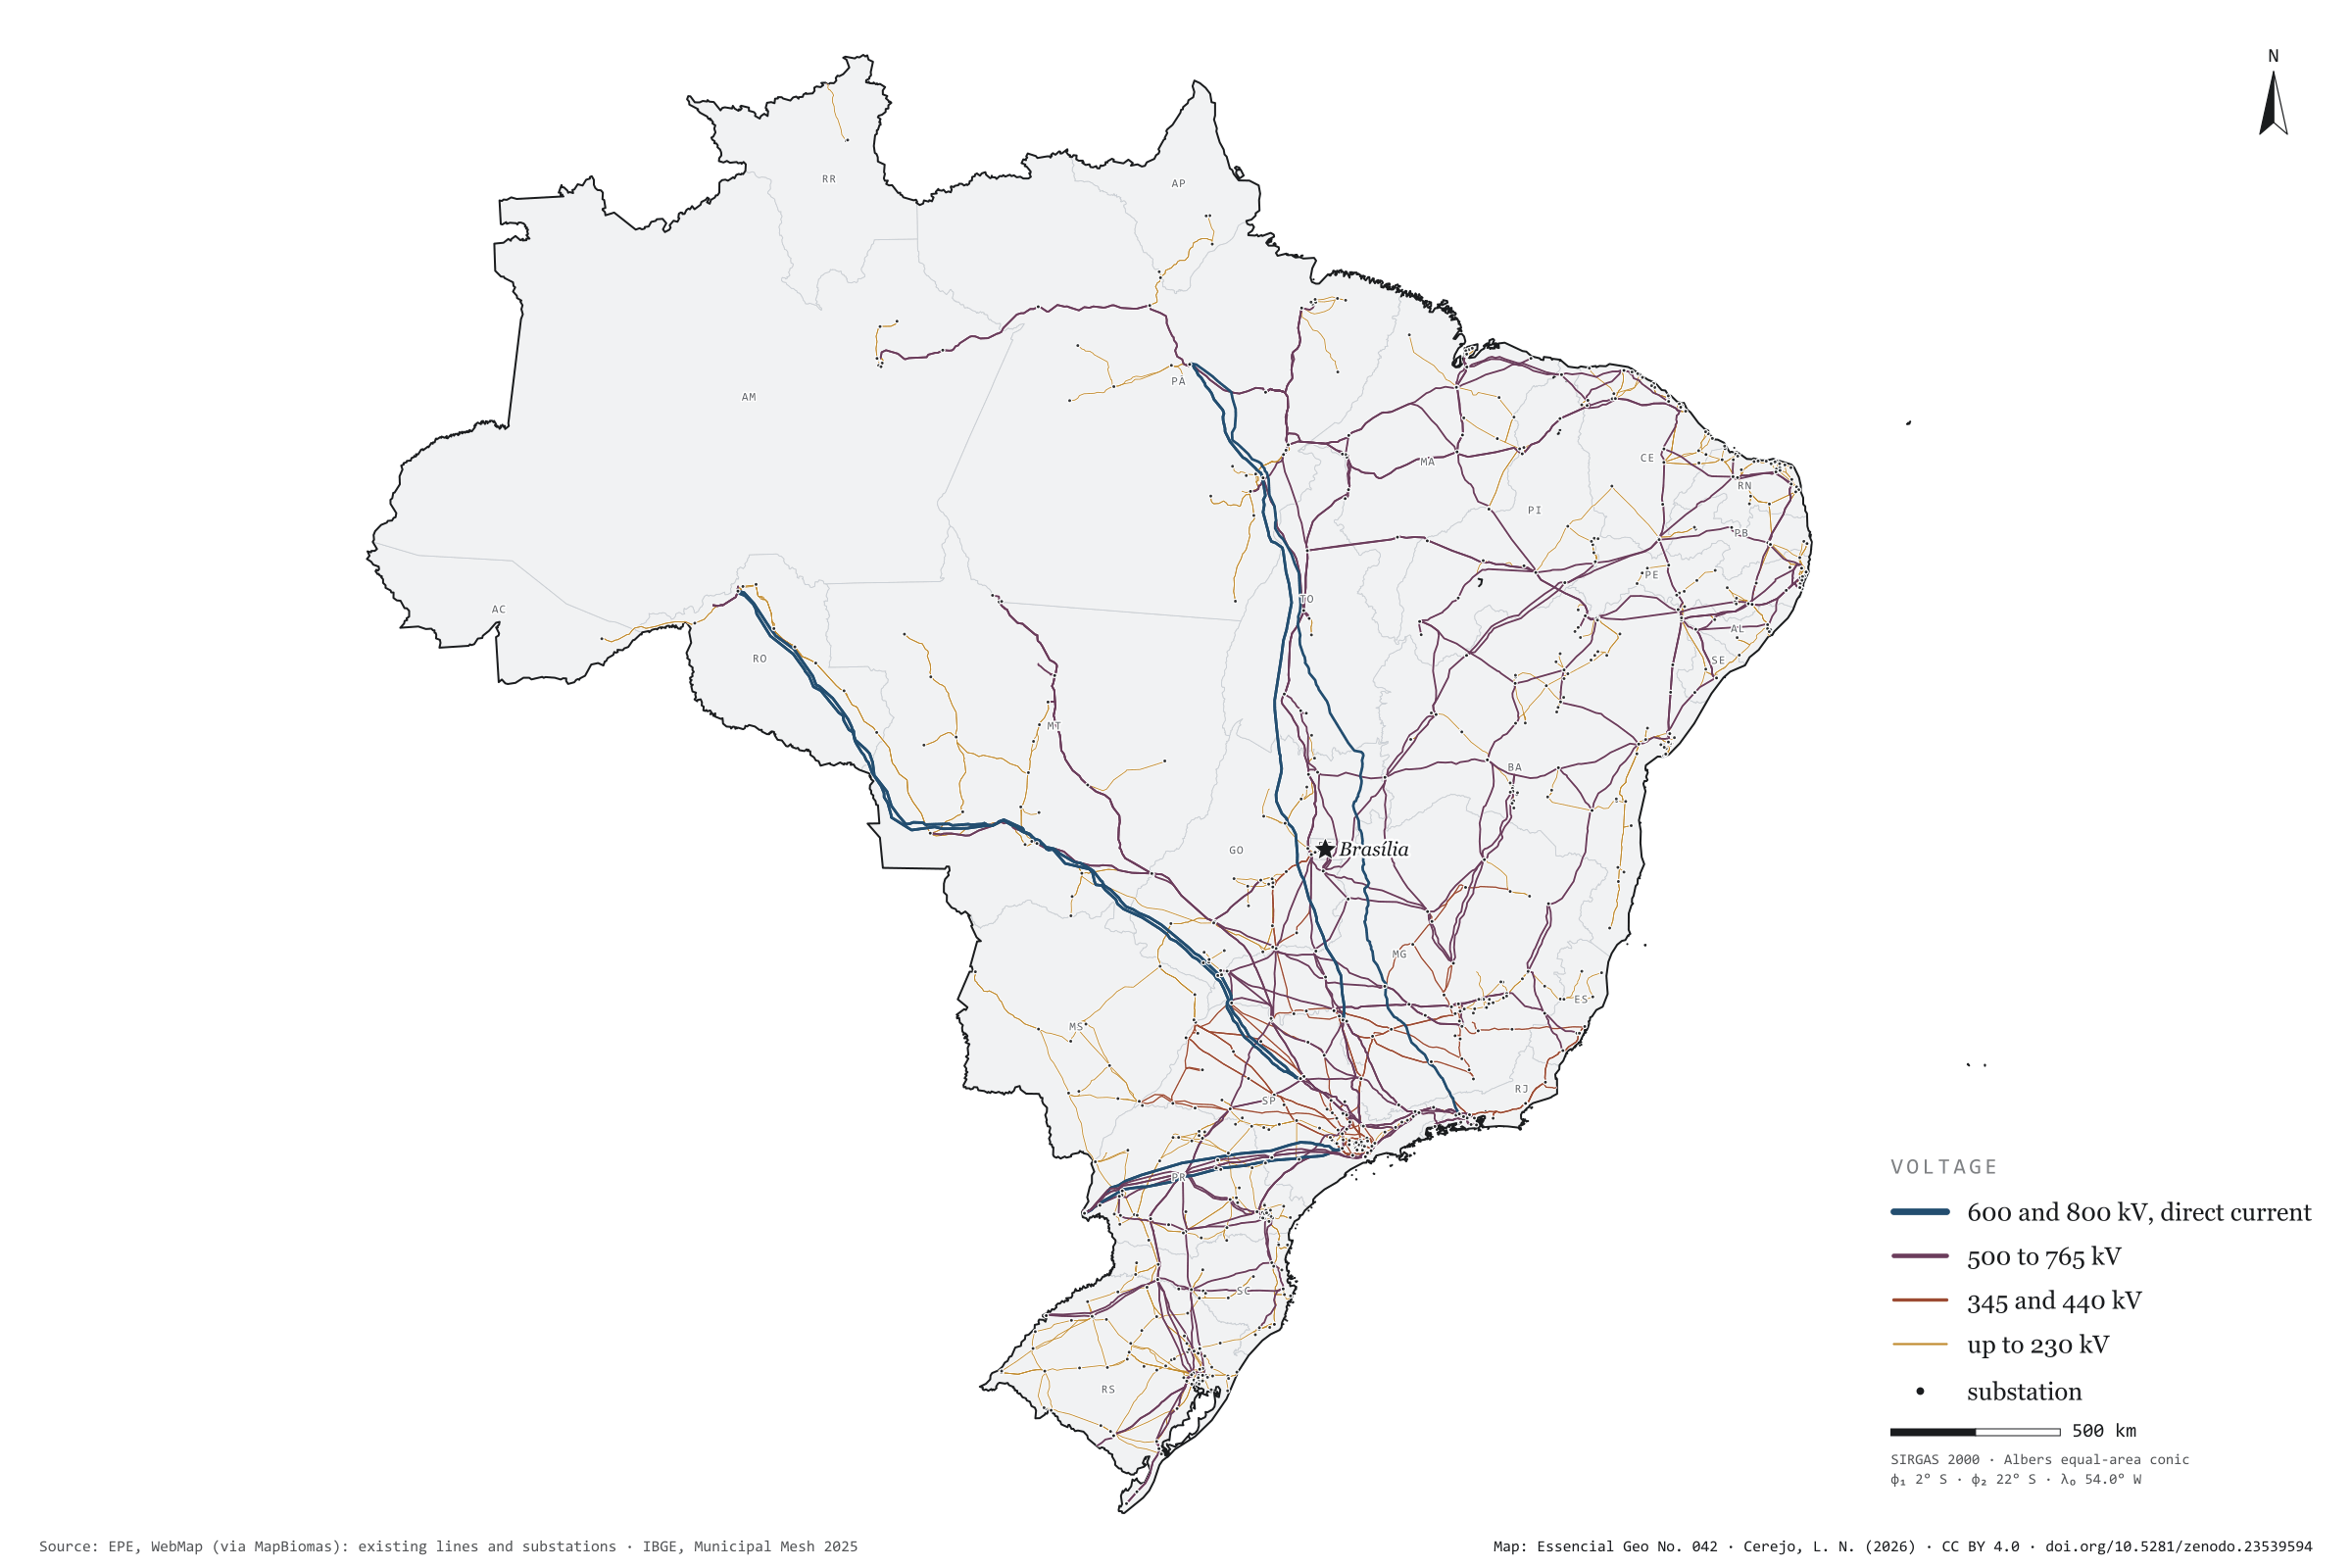
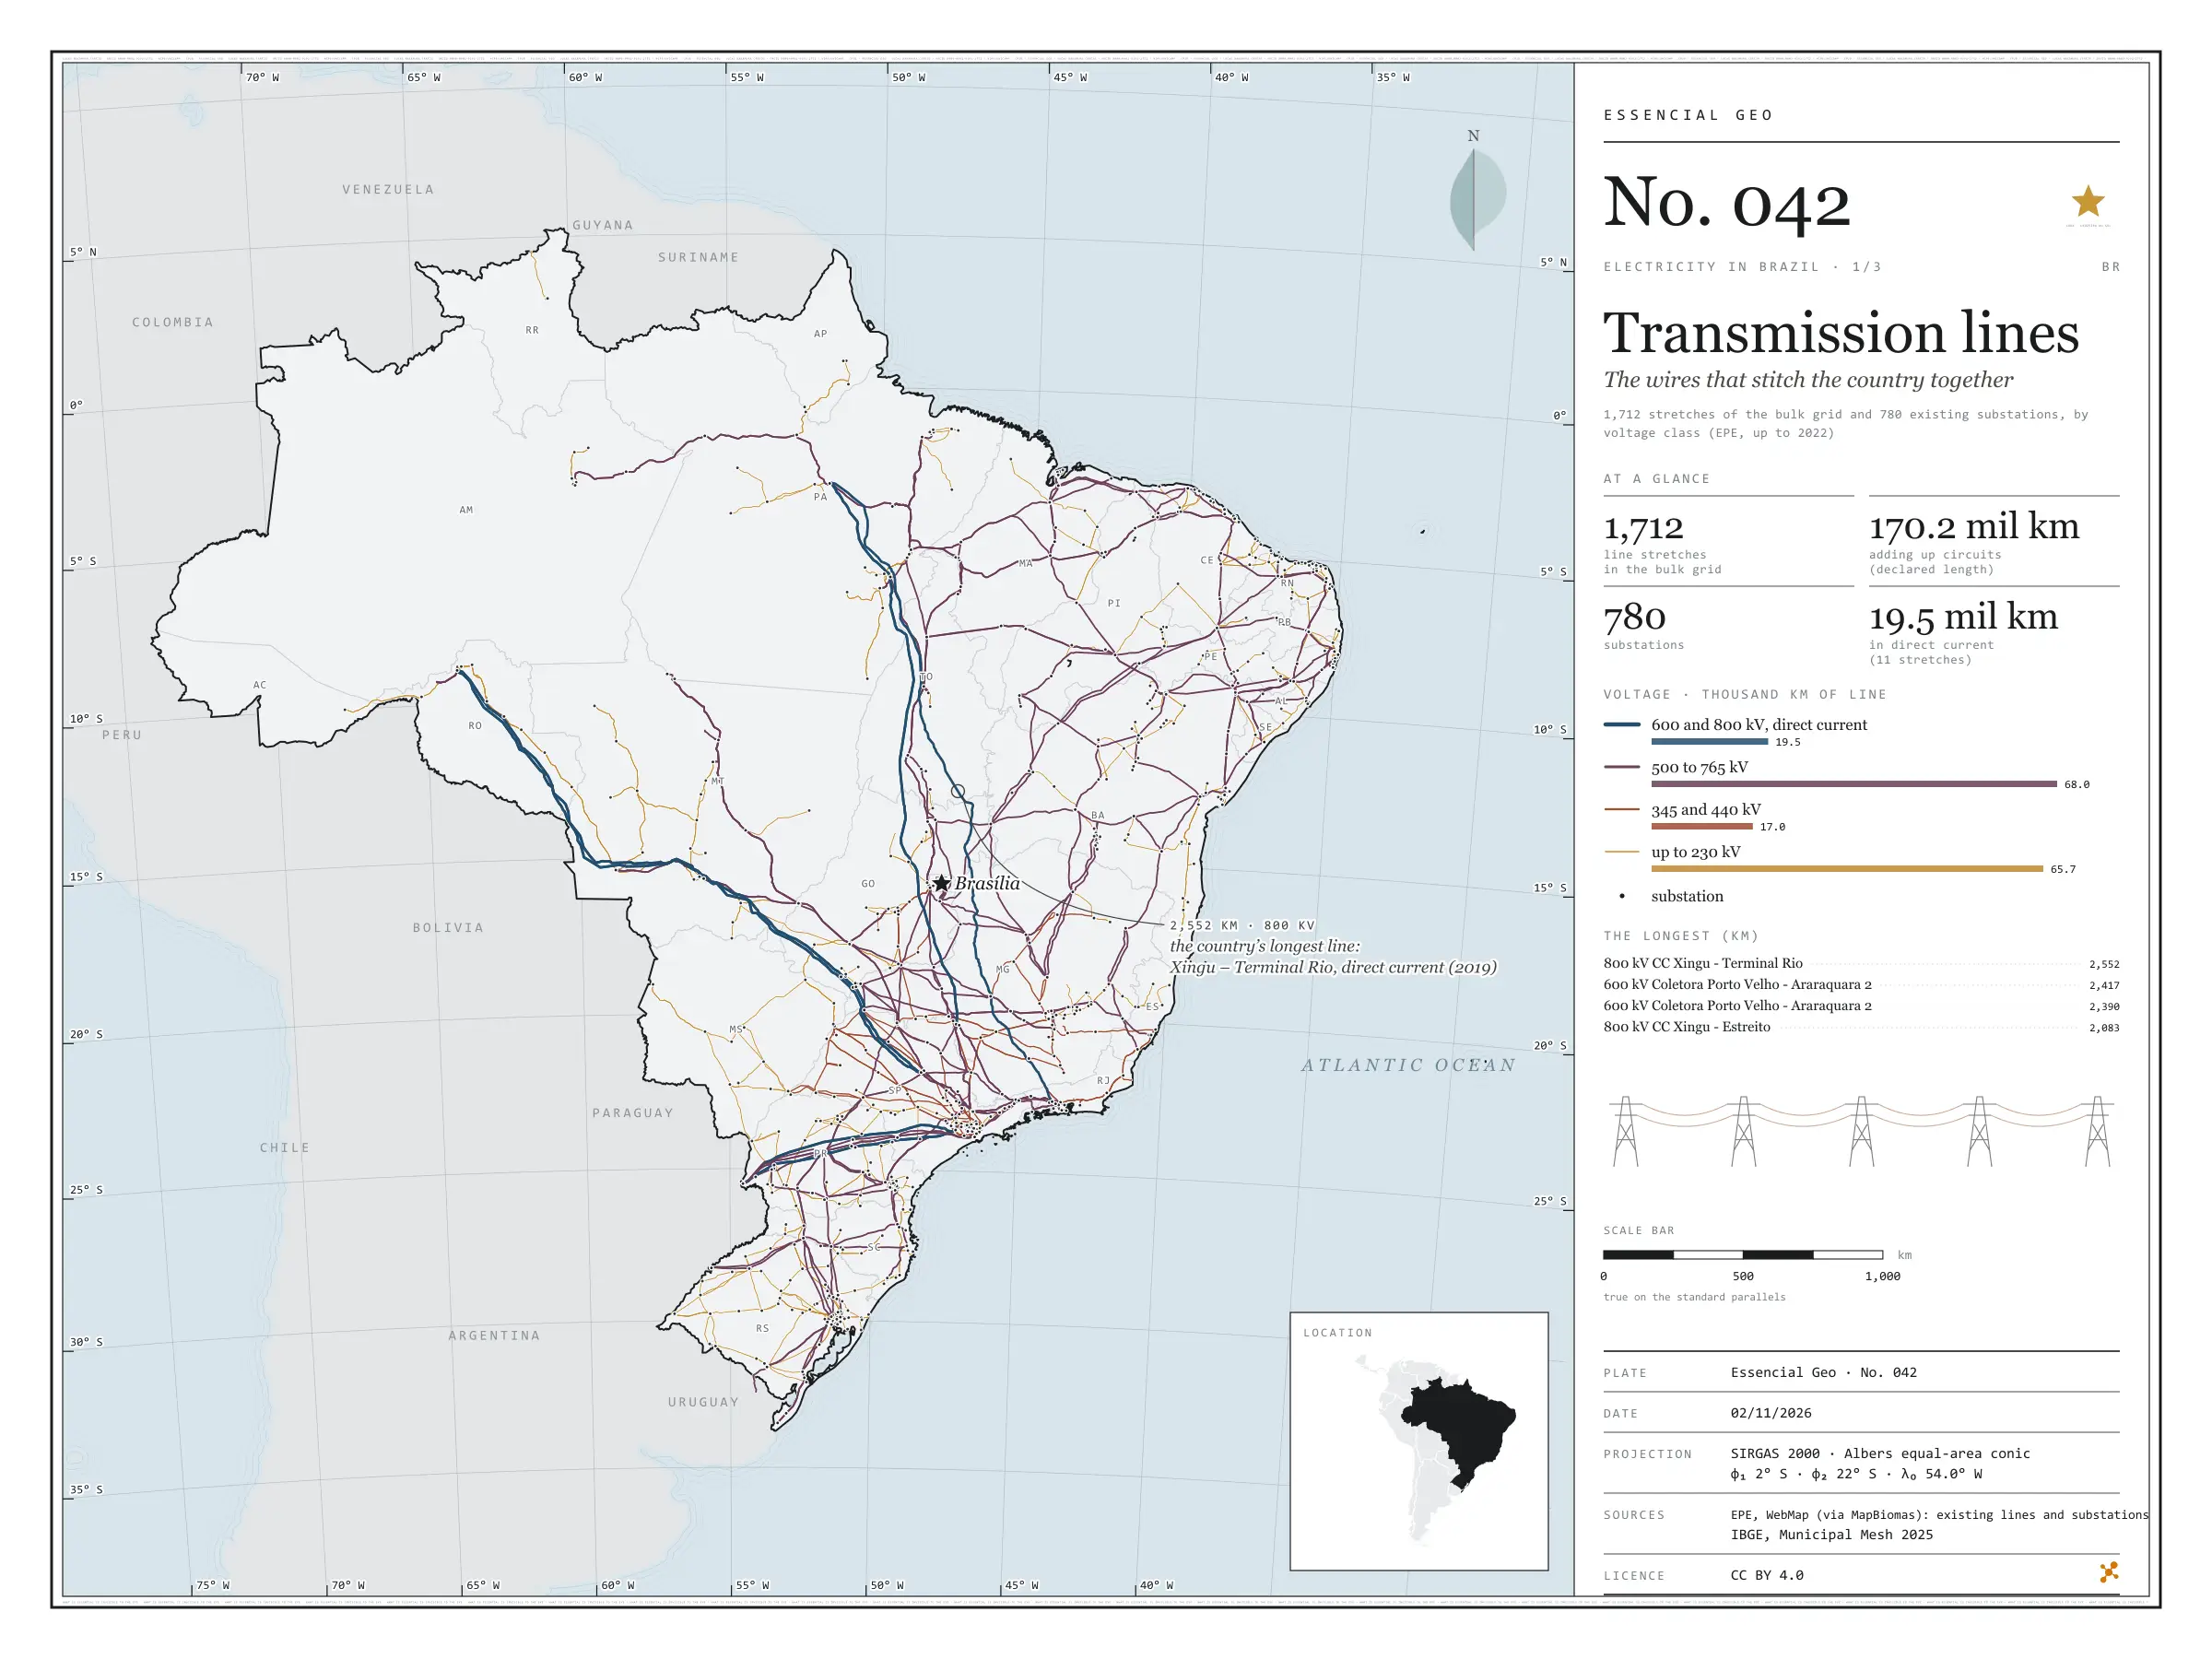
From the Xingu to Rio de Janeiro, an 800 kV direct-current line runs 2,552 km to carry Belo Monte’s power to the South-East: it is the longest of the 1,712 existing transmission lines mapped by EPE. Adding up circuits, they come to 170.2 thousand km of lines and 780 substations. Lines of 500 to 765 kV make up most of the length, 68.0 thousand km; the eleven direct-current lines, 19.5 thousand km, bring the power of Itaipu, the Madeira plants and Belo Monte to the South-East. On the map, the grid thickens in the South-East, the South and along the north-eastern coast, and reaches the Amazon through a handful of wires. First plate of the collection “Electricity in Brazil”.

Technical record · downloads · citation

At a glance

Length by voltage class (thousand km, adding up circuits) (mil km)
  • até 230 kV 66
  • 345 e 440 kV 17
  • 500 a 765 kV 68
  • 600 e 800 kV, corrente contínua 20
The longest line: Xingu – Terminal Rio, 800 kV direct current

2,552 km

in service since 2019

Layers

  • linhas_transmissao line 1,712 lines: voltage, length, year in service, concession holder and voltage class
  • subestacoes point 780 substations: voltages, year in service, concession holder and state
  • ufs polygon 27 states
  • limite_nacional polygon National boundary

Metadata

Extent
Brazil
CRS / Projection
SIRGAS 2000 (EPSG:4674)
EPSG:4674
Software
Python · GeoPandas · GDAL · QGIS · Node.js · d3-geo
Method
EPE’s existing transmission lines and substations, grouped into four voltage classes; length as declared by EPE and checked against the geodesic measurement.
Version
v1.0.0
Licence
CC BY 4.0

Downloads

Figure to reuse

The map without a frame, with legend, scale, reference system and credit written on it: ready for papers, lectures and slides. In two versions: with the basemap (neighbours and sea) or only the mapped area, on white.

Point a camera at it to open this page.

How to cite

Cerejo, L. N. (2026). Linhas de transmissão: os fios que costuram o país [Transmission lines: The wires that stitch the country together] (Version 1.0.0) [Data set]. Zenodo. https://doi.org/10.5281/zenodo.23539594

No. 043 Energy · biomass Electricity in Brazil 2/3

Power plants by source

Water, wind, sun and fire

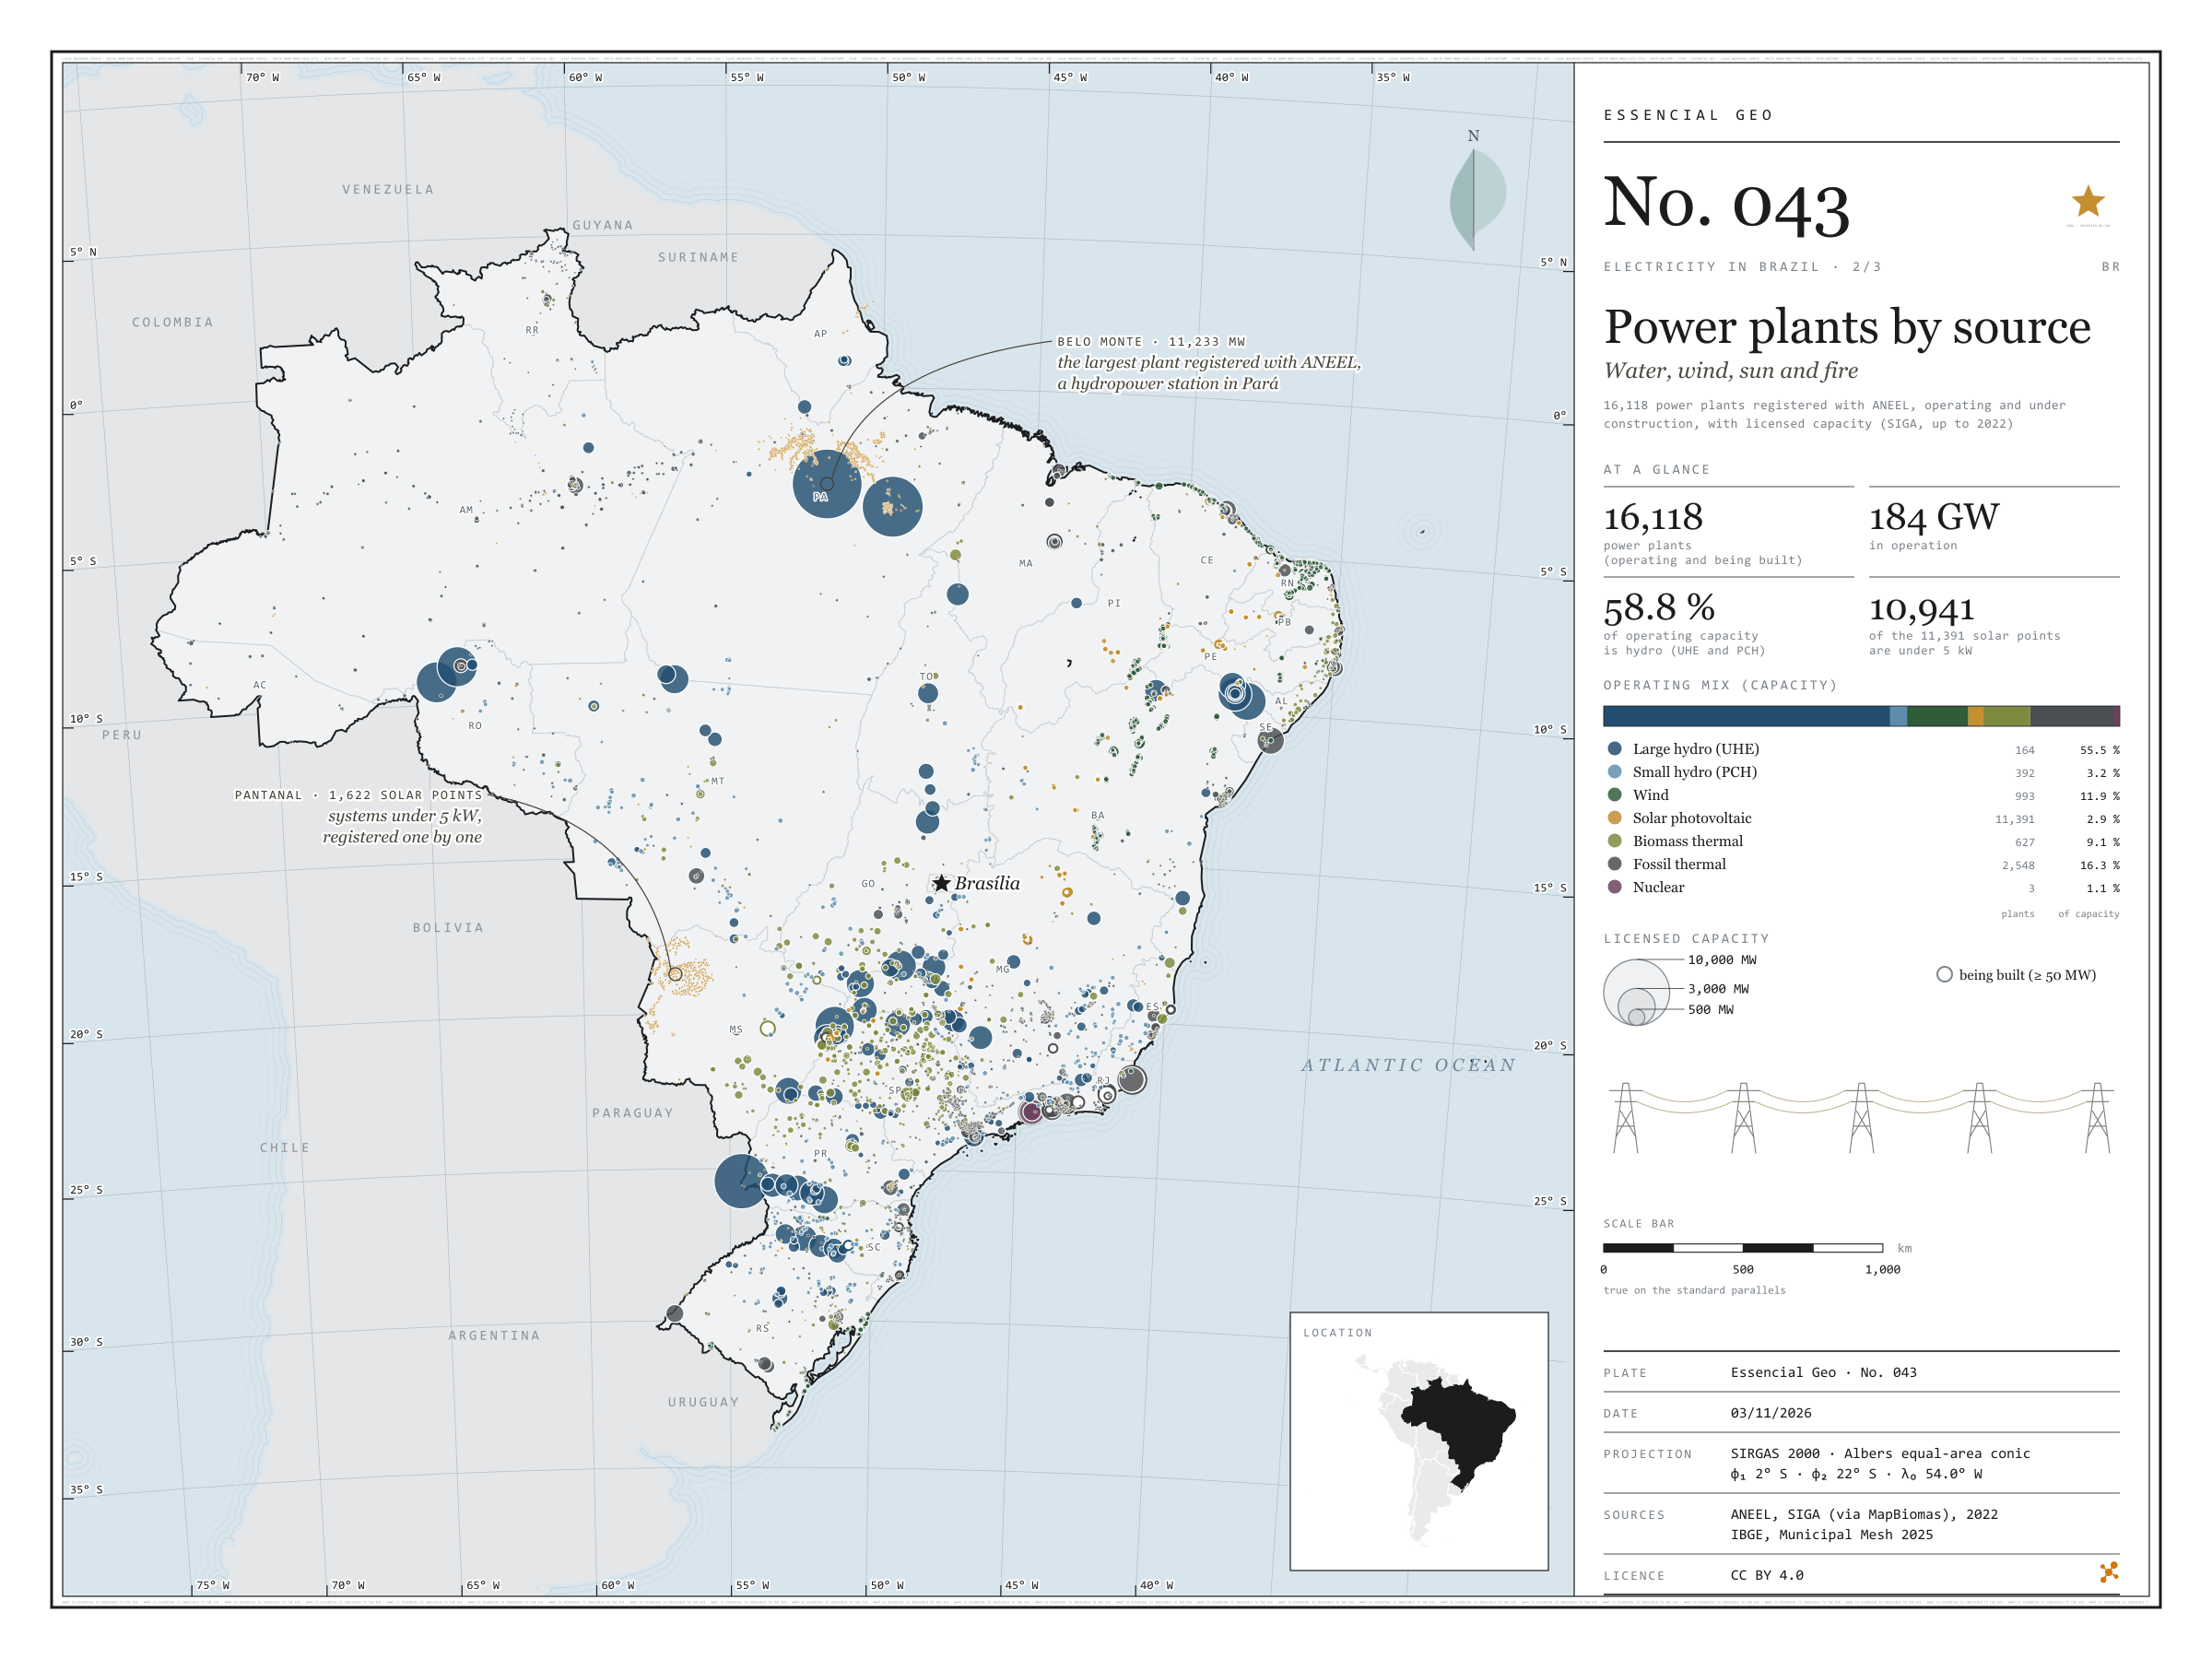
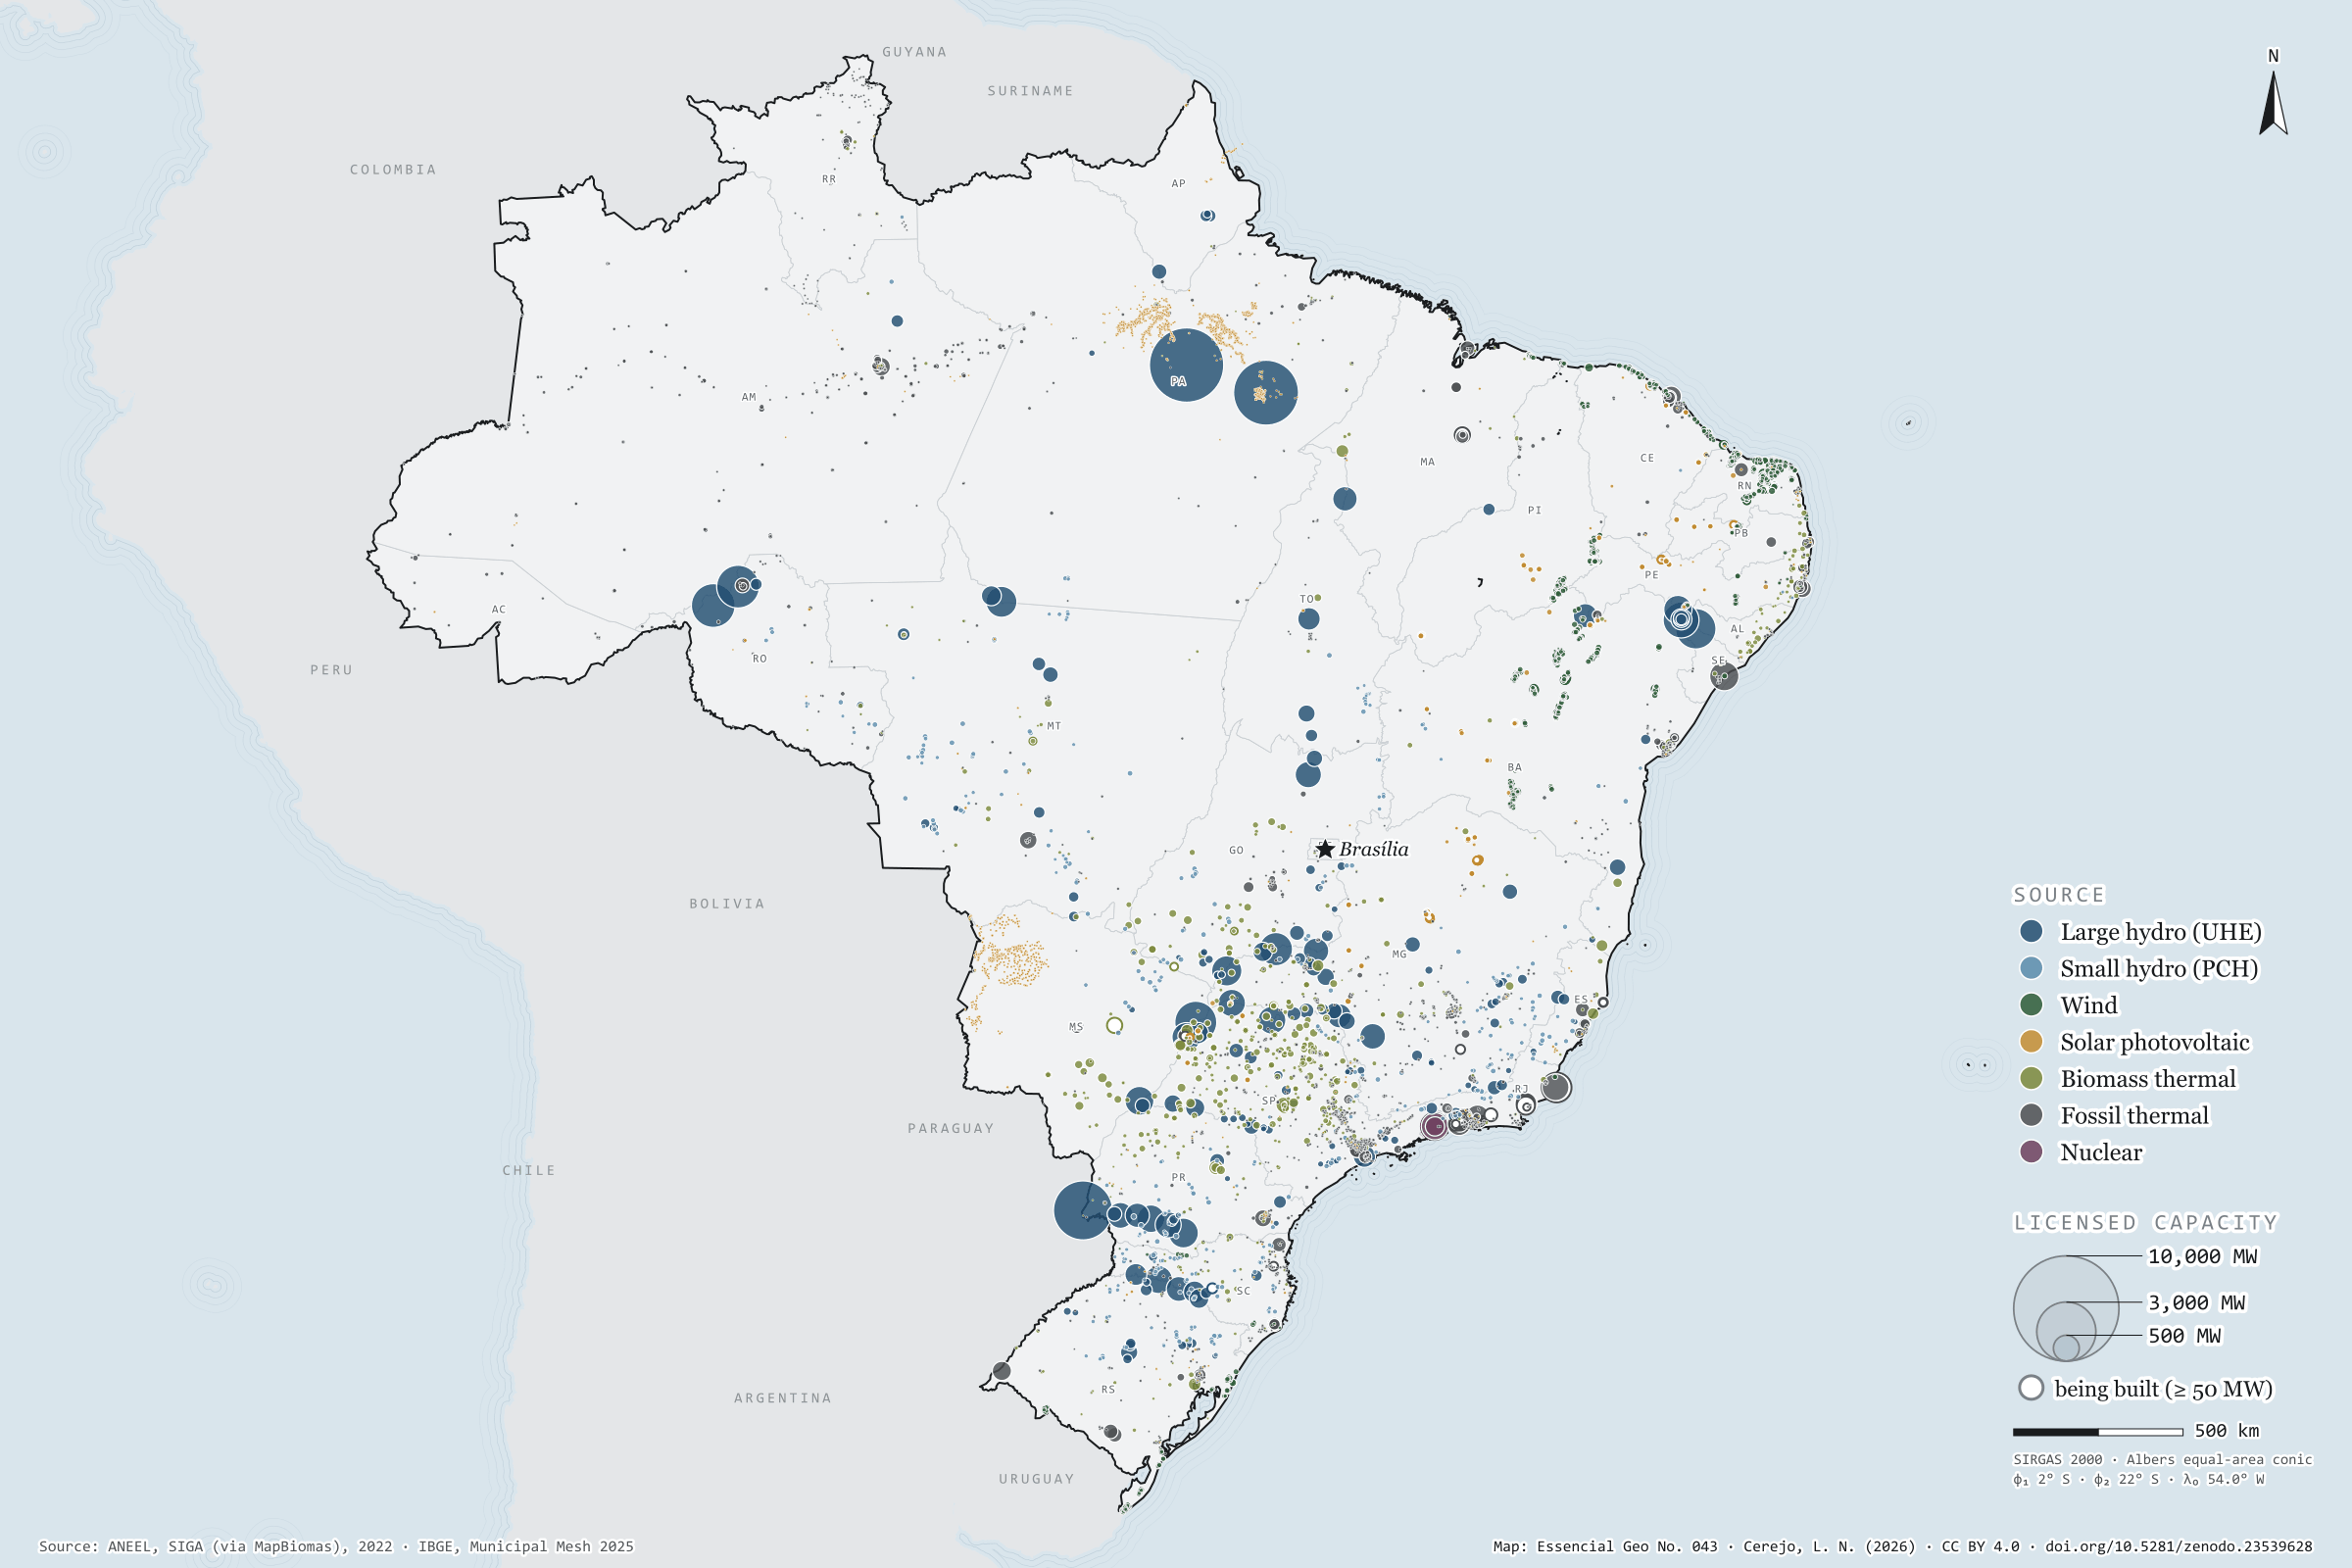
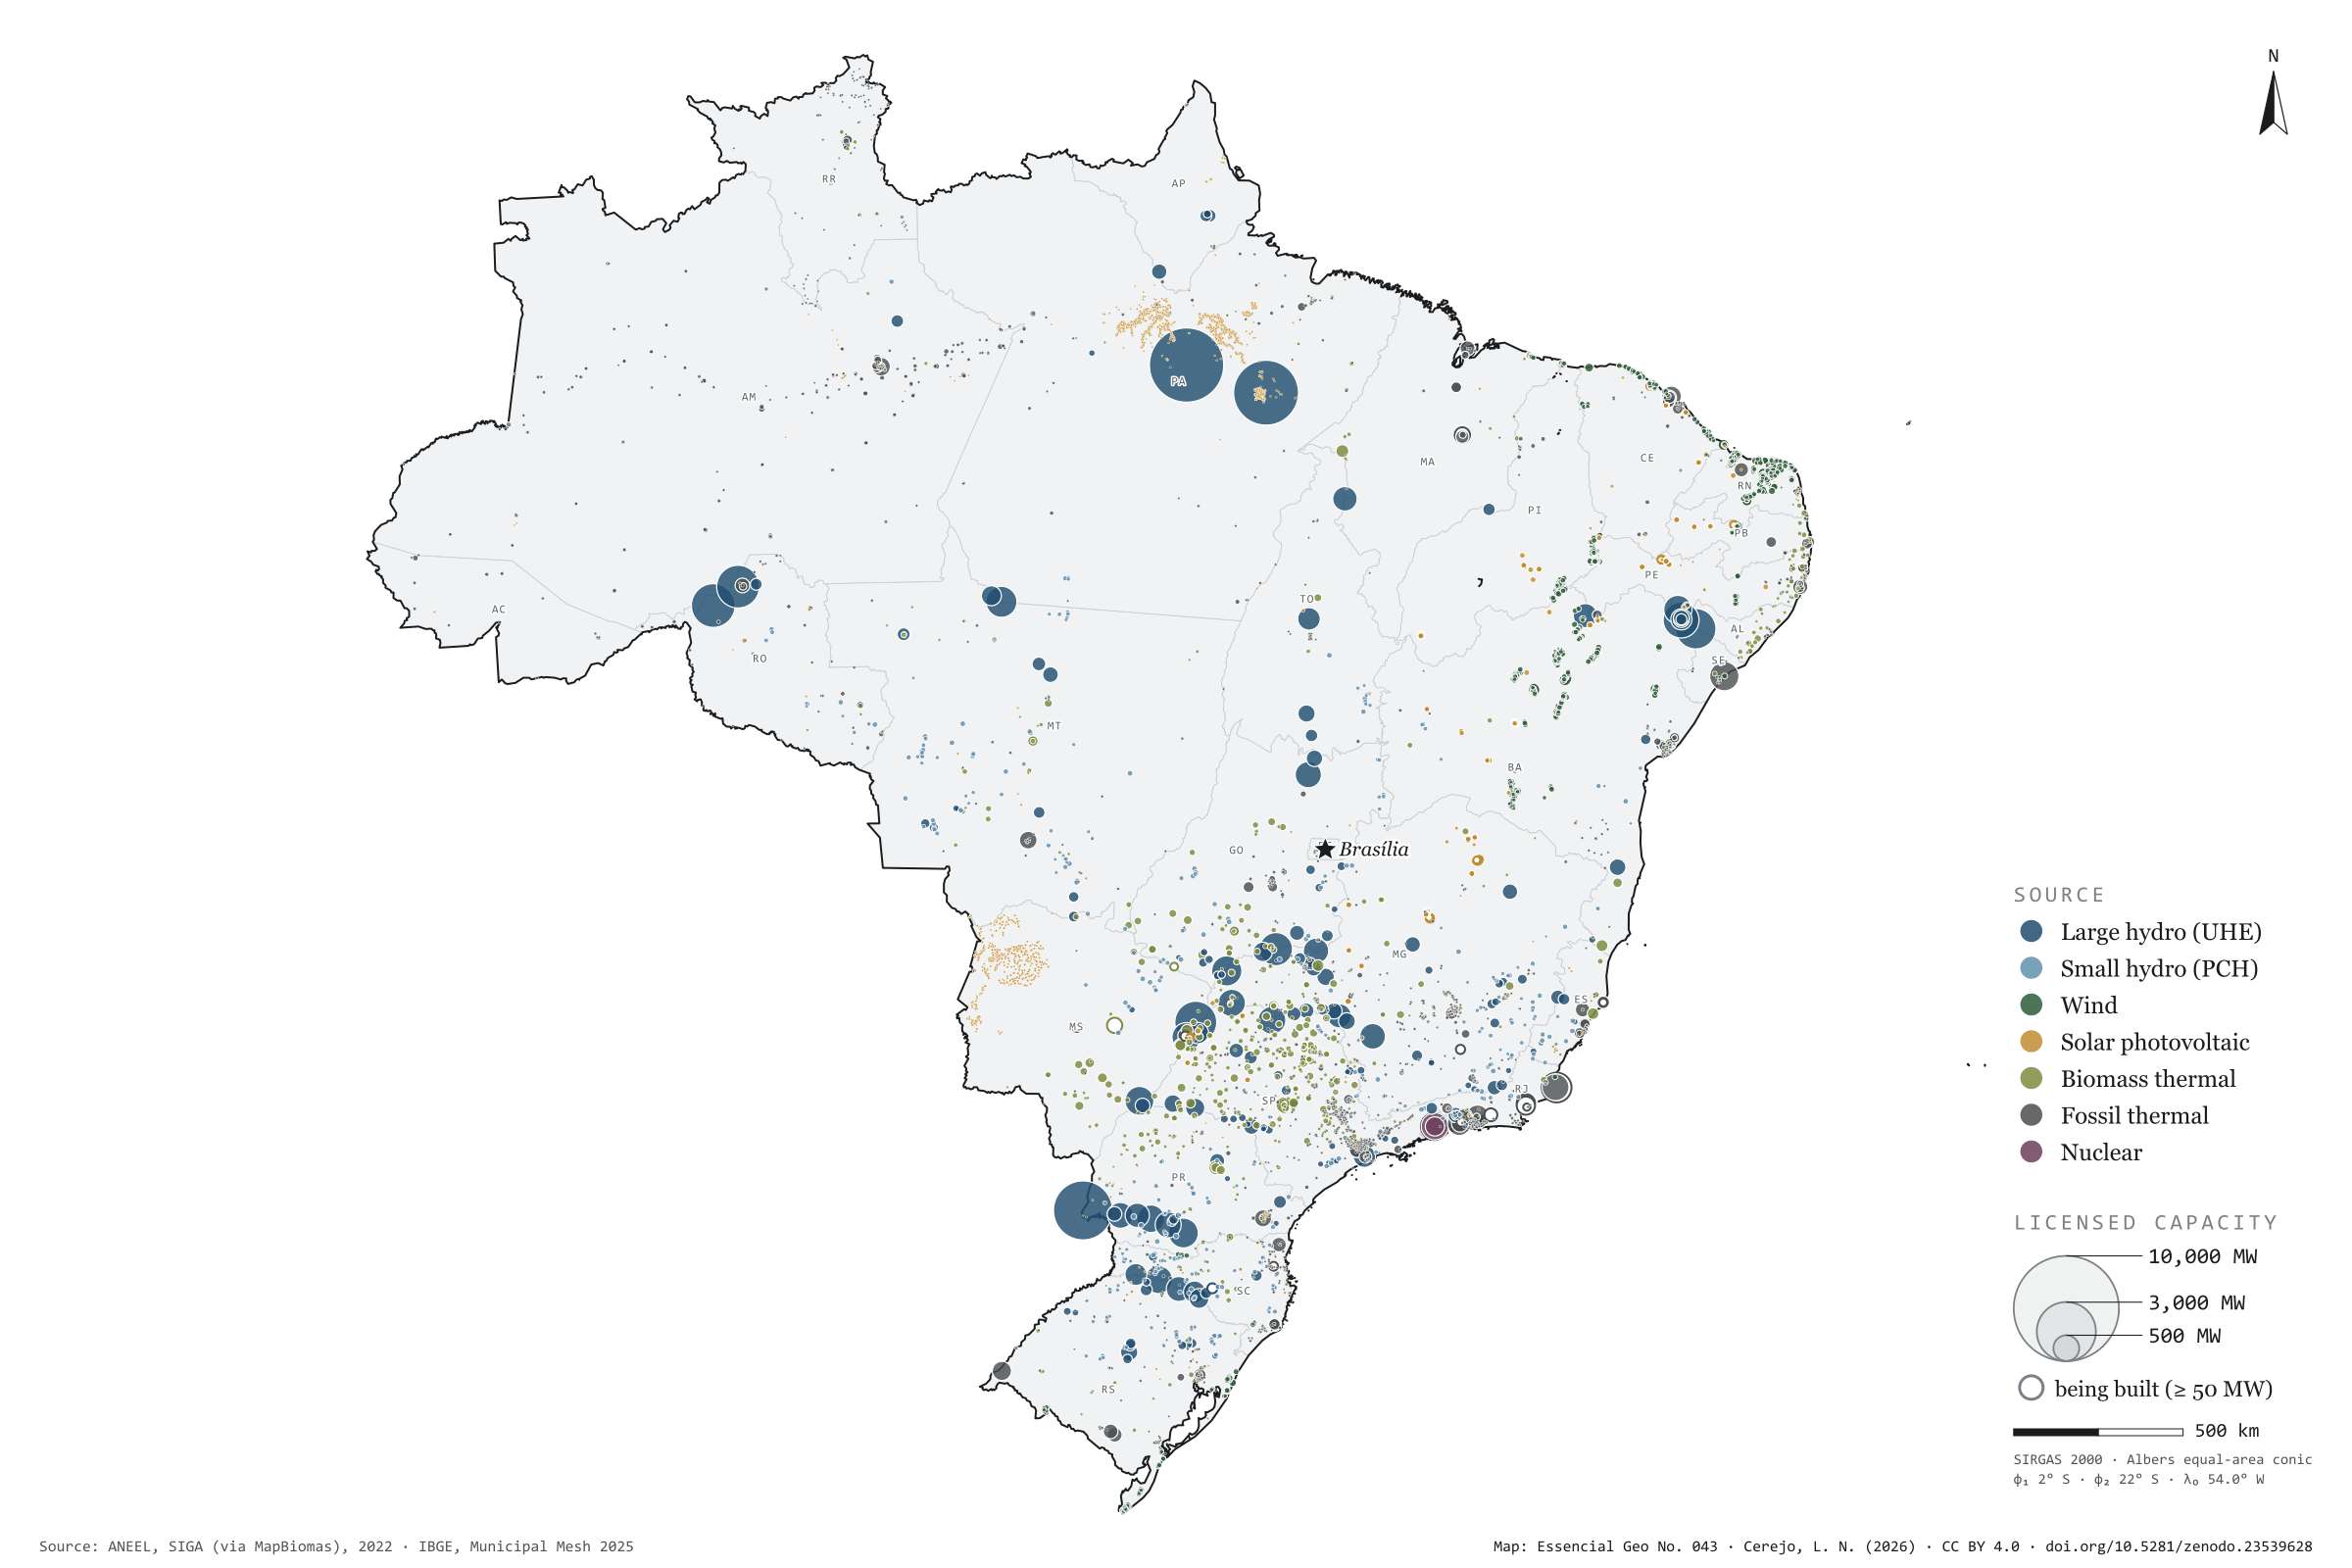
Fig. 043 Brazil EPSG:4674 Source: ANEEL, IBGE, Natural Earth

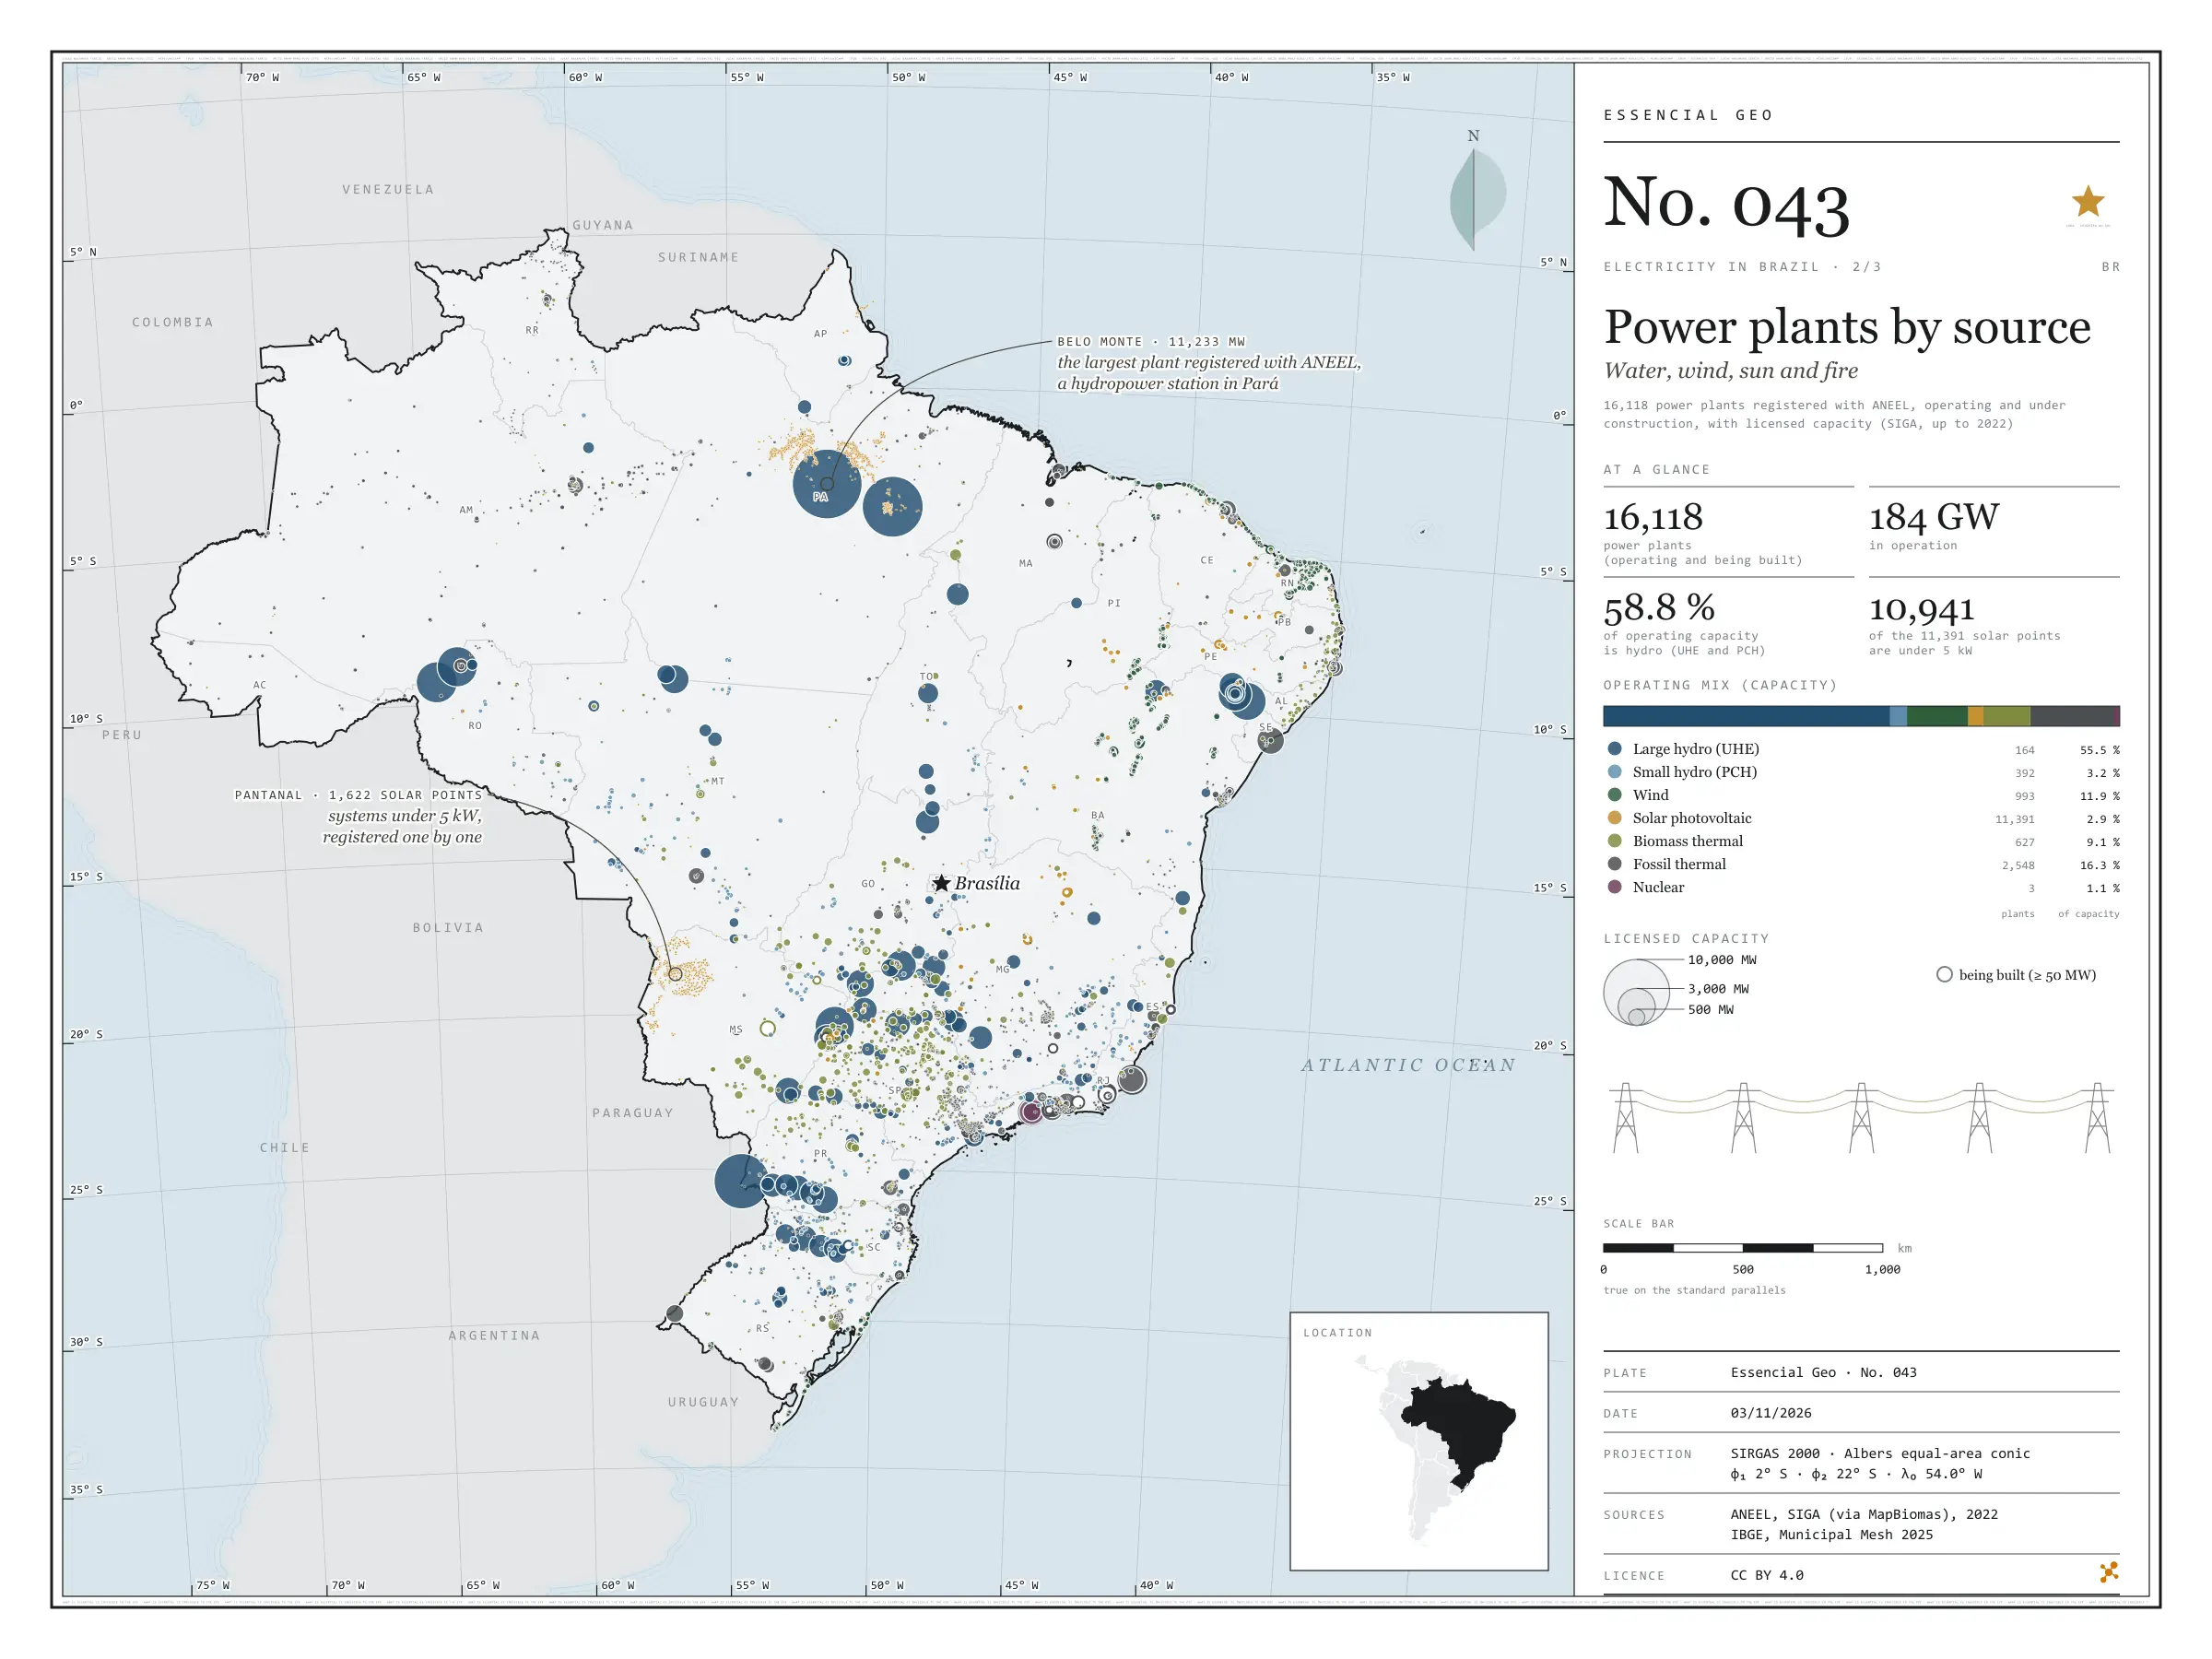
Belo Monte, on the Xingu, has 11,233 MW of licensed capacity: it is the largest of the 16,118 power plants registered with ANEEL, operating or under construction. Water still dominates: large and small hydro add up to 58.8% of the 184 GW in operation. In the smaller circles, the map tells other stories. The wind lines up 89% of the 993 wind farms in the North-East; sugarcane bagasse fires 427 of the 627 biomass power stations, 237 of them in São Paulo; and Angra 3 is still being built beside the other two. Of the 11,391 solar plants, 10,941 are under 5 kW: individual systems registered one by one by the distribution companies, nearly all in Pará and in the Pantanal of Mato Grosso do Sul. Second plate of the collection “Electricity in Brazil”.

Technical record · downloads · citation

At a glance

Operating mix, by licensed capacity (GW) (GW)
  • Hidrelétrica (UHE) 55.5%
  • Pequena central hidrelétrica 3.2%
  • Eólica 11.9%
  • Solar fotovoltaica 2.9%
  • Termelétrica a biomassa 9.1%
  • Termelétrica fóssil 16.3%
  • Termonuclear 1.1%
Belo Monte, the largest registered plant

11,233 MW

followed by Tucuruí (8,535 MW) and the Brazilian share of Itaipu (7,000 MW)

Layers

  • usinas point 16,118 power plants: source, fuel, phase, licensed and inspected capacity (kW), start of operations, owner and state
  • ufs polygon 27 states
  • limite_nacional polygon National boundary

Metadata

Extent
Brazil
CRS / Projection
SIRGAS 2000 (EPSG:4674)
EPSG:4674
Software
Python · GeoPandas · GDAL · QGIS · Node.js · d3-geo
Method
SIGA power plants operating and under construction, grouped into seven sources, with circles whose area is proportional to licensed capacity.
Version
v1.0.0
Licence
CC BY 4.0

Downloads

Figure to reuse

The map without a frame, with legend, scale, reference system and credit written on it: ready for papers, lectures and slides. In two versions: with the basemap (neighbours and sea) or only the mapped area, on white.

Point a camera at it to open this page.

How to cite

Cerejo, L. N. (2026). Usinas por fonte: água, vento, sol e fogo [Power plants by source: Water, wind, sun and fire] (Version 1.0.0) [Data set]. Zenodo. https://doi.org/10.5281/zenodo.23539628

No. 044 Energy · biomass Electricity in Brazil 3/3

Distributed solar generation

The sun that lives on the rooftops

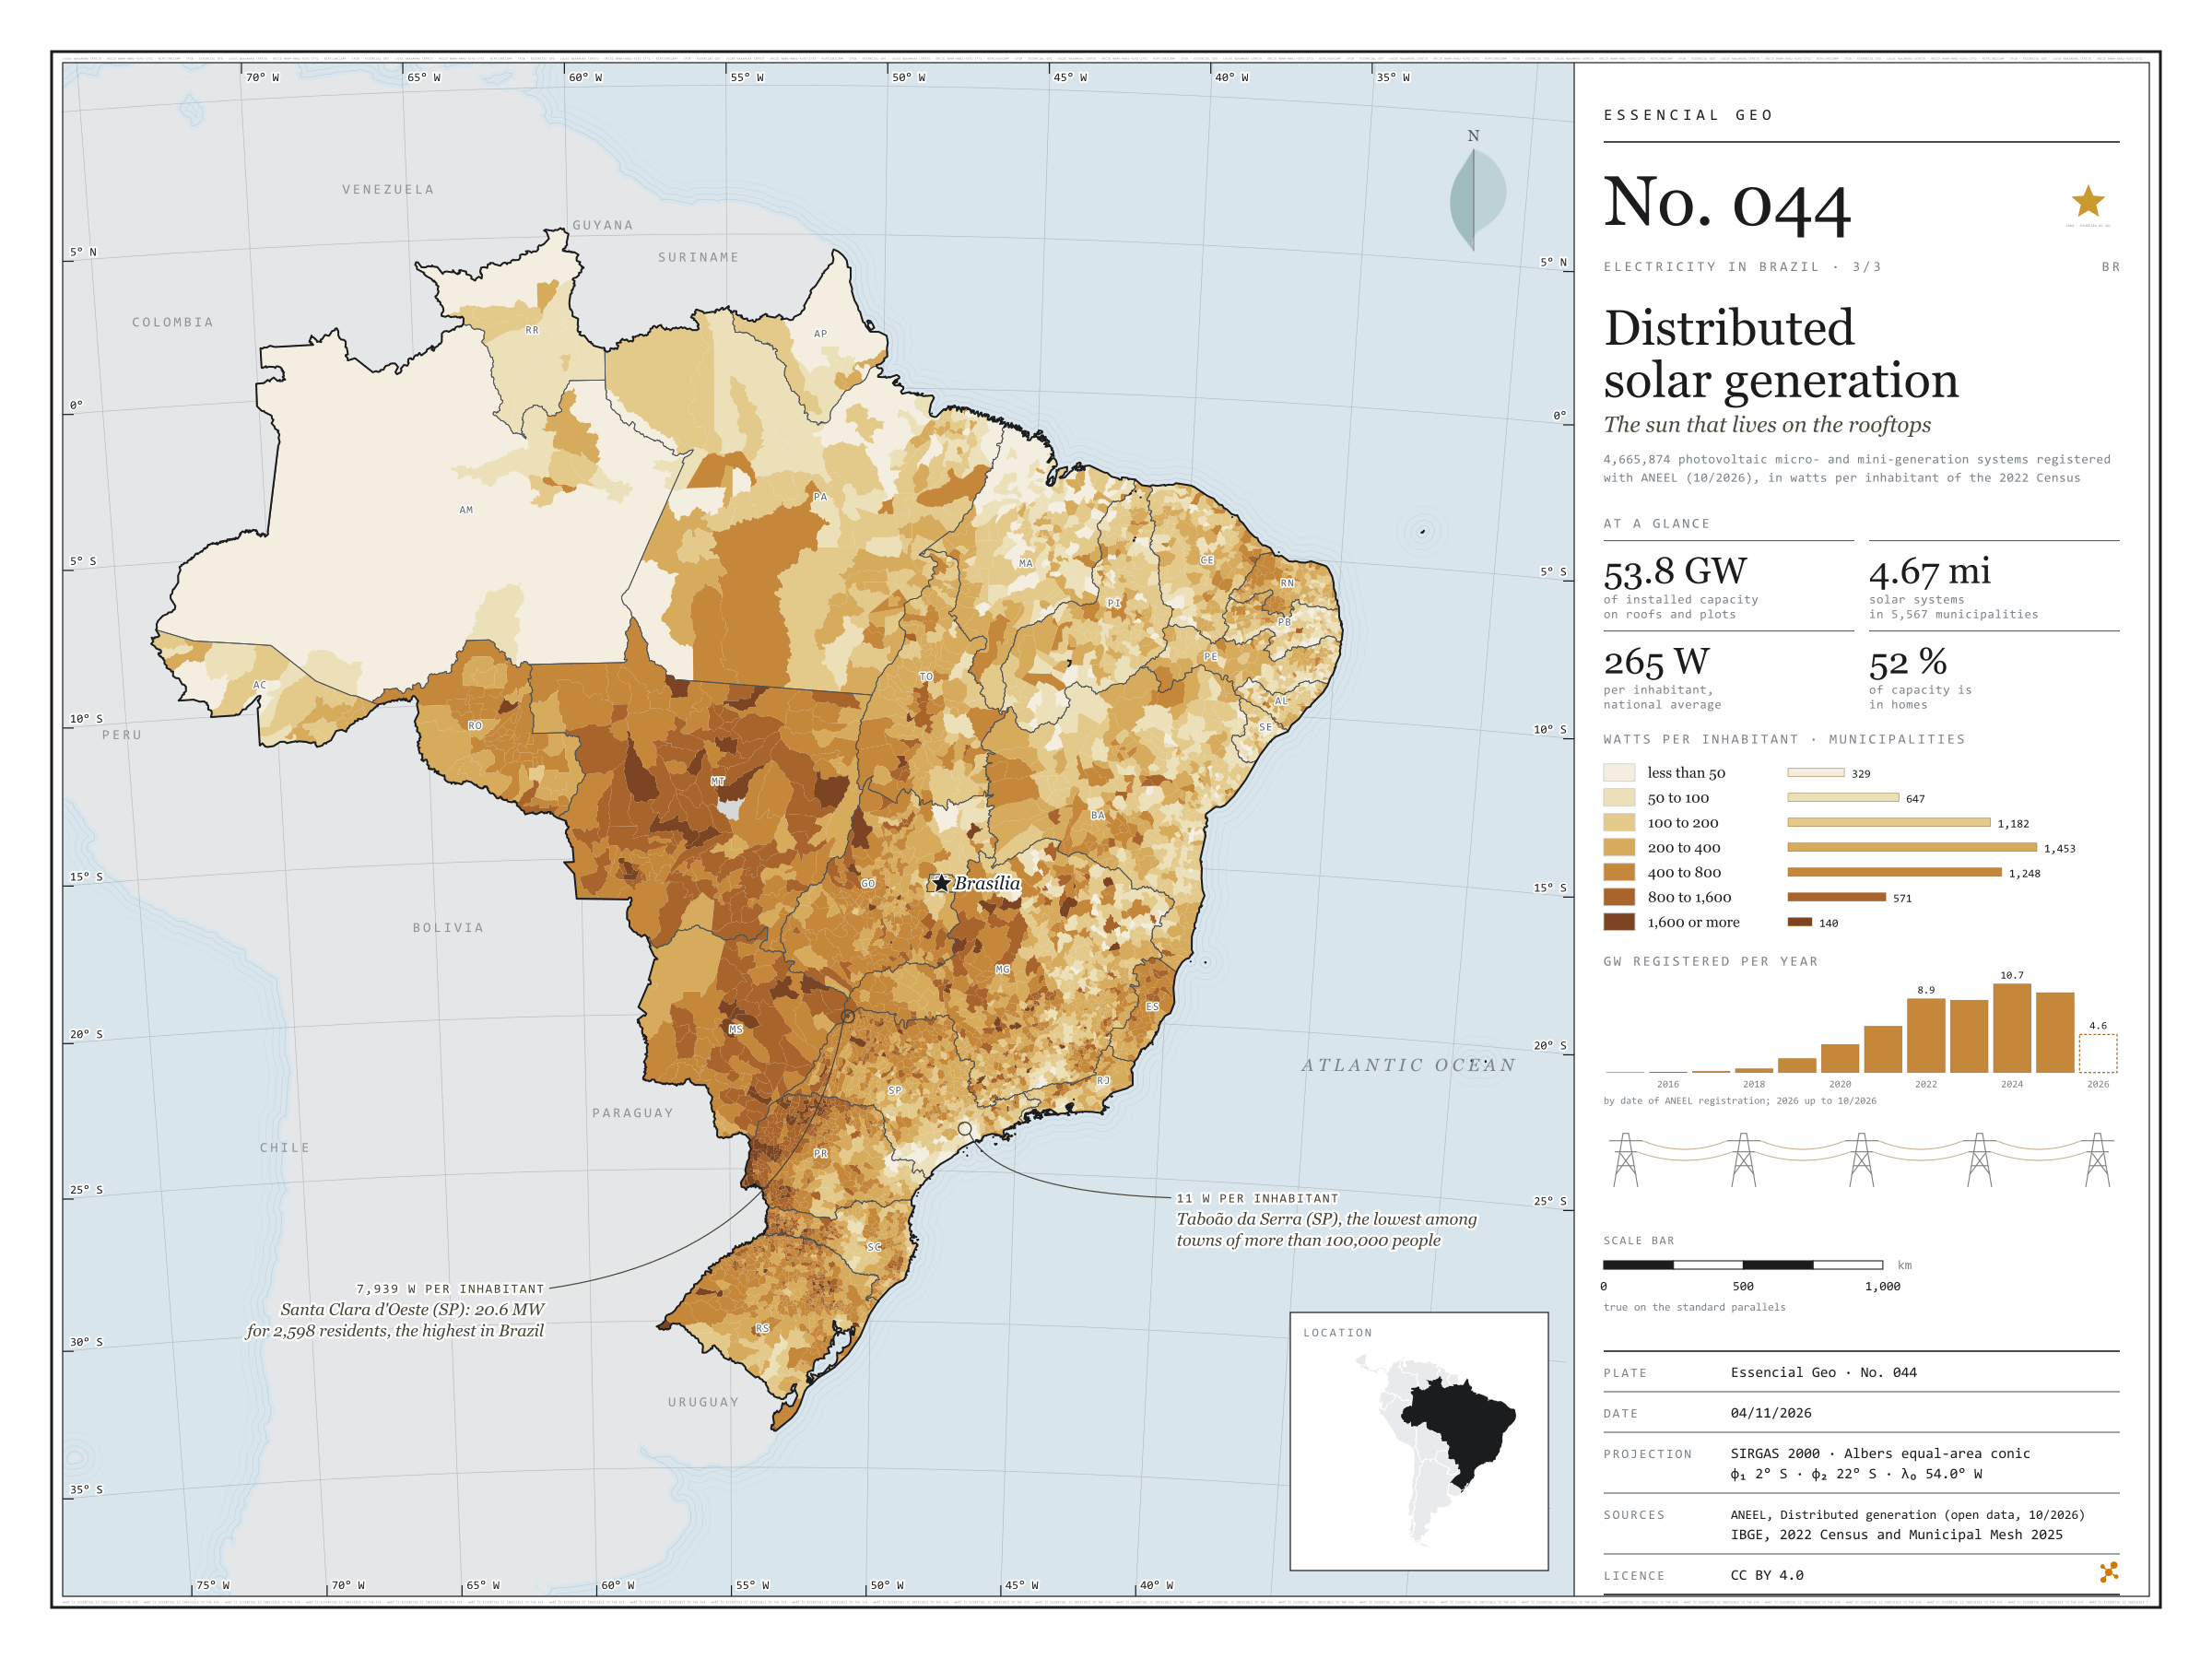
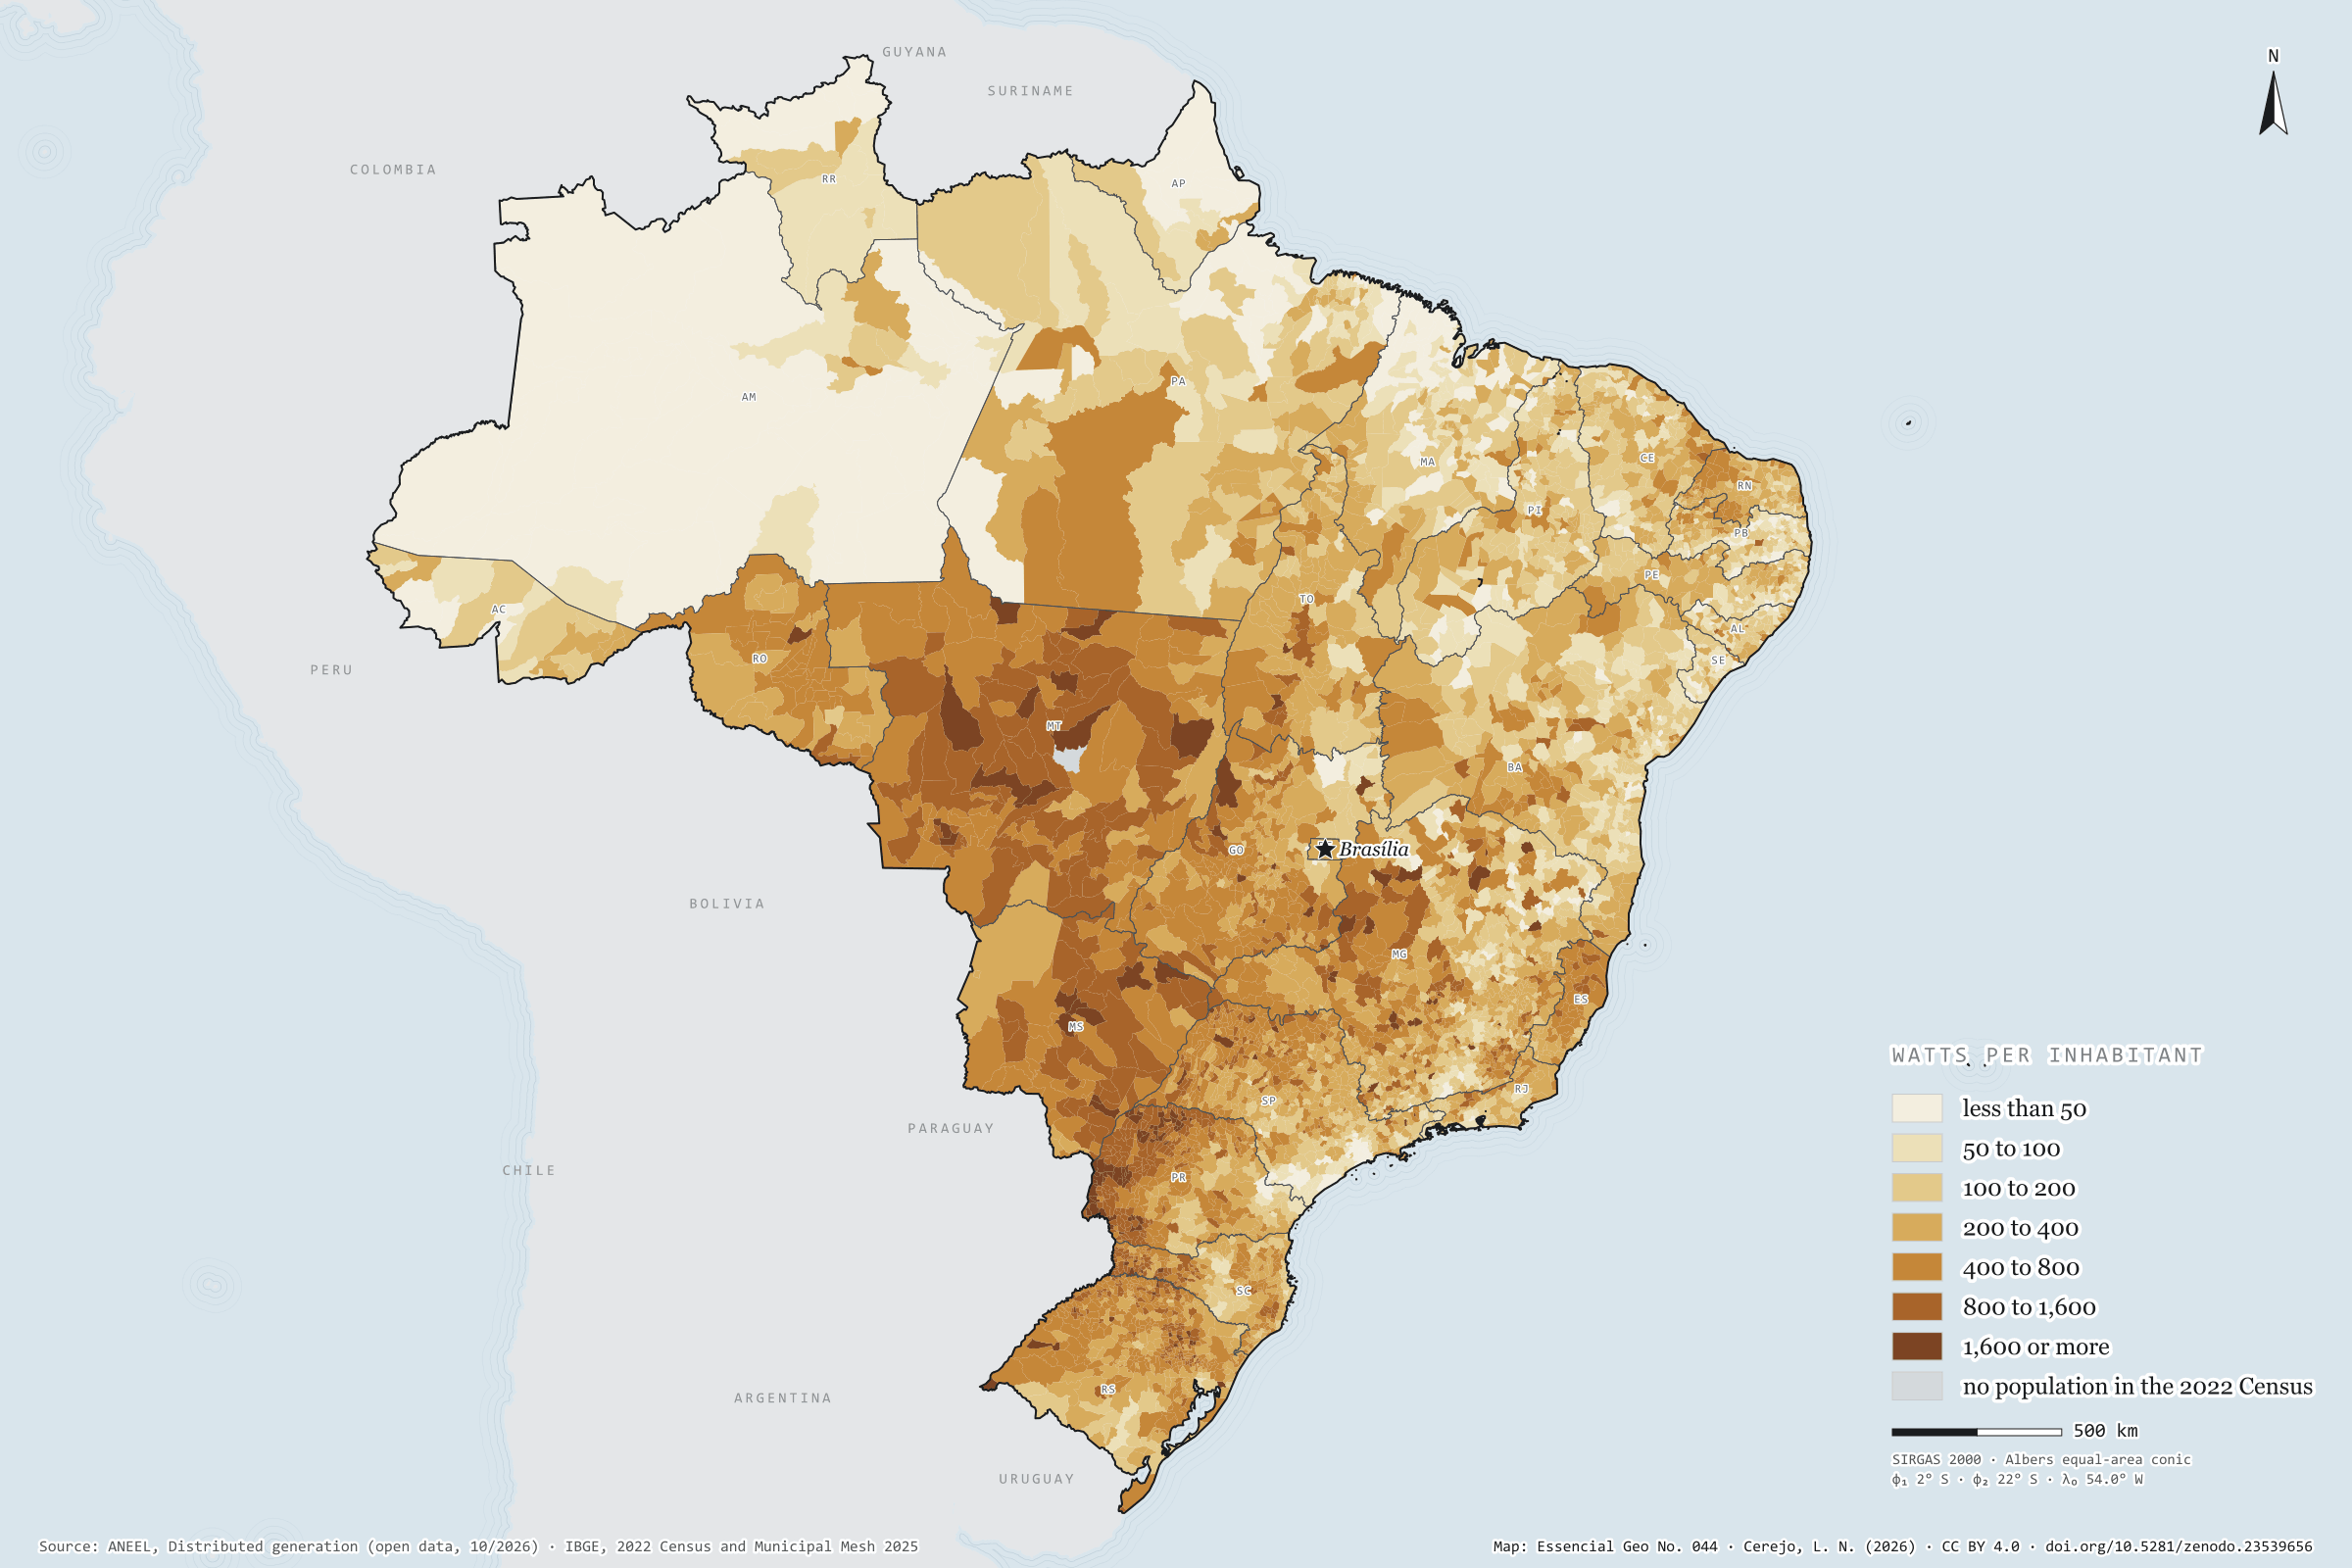
Fig. 044 Brazil EPSG:4674 Source: ANEEL, IBGE, Natural Earth

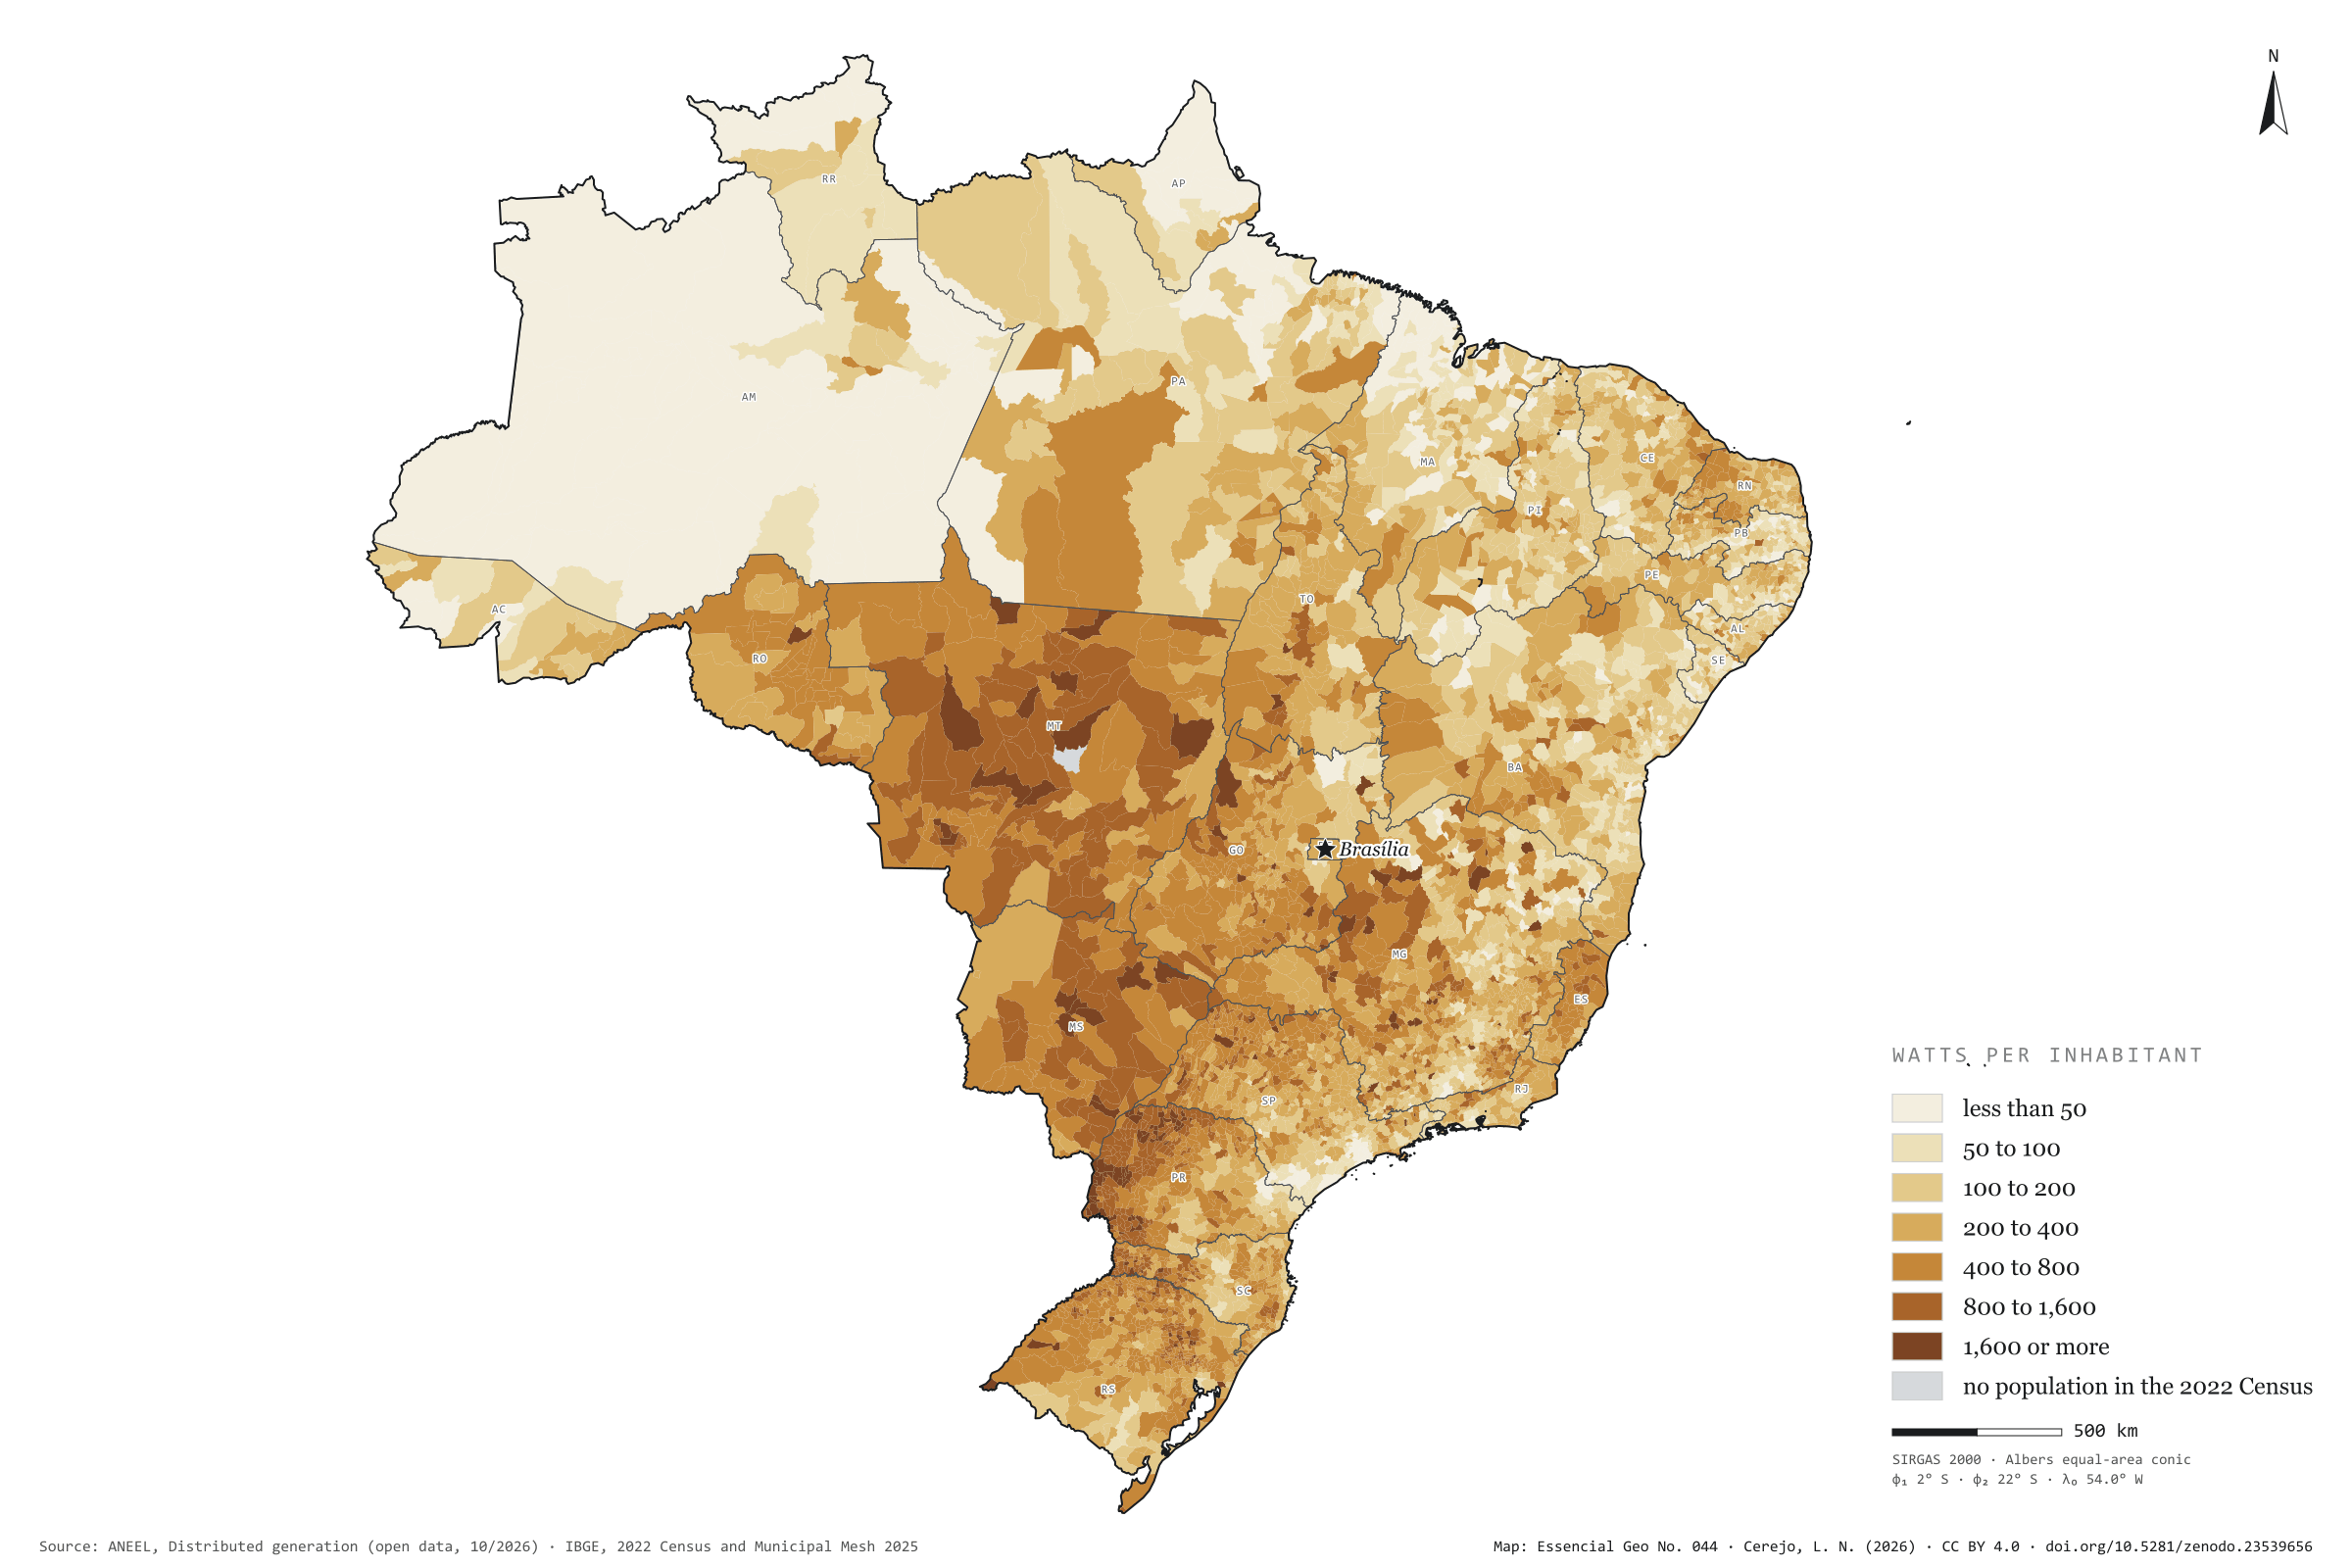
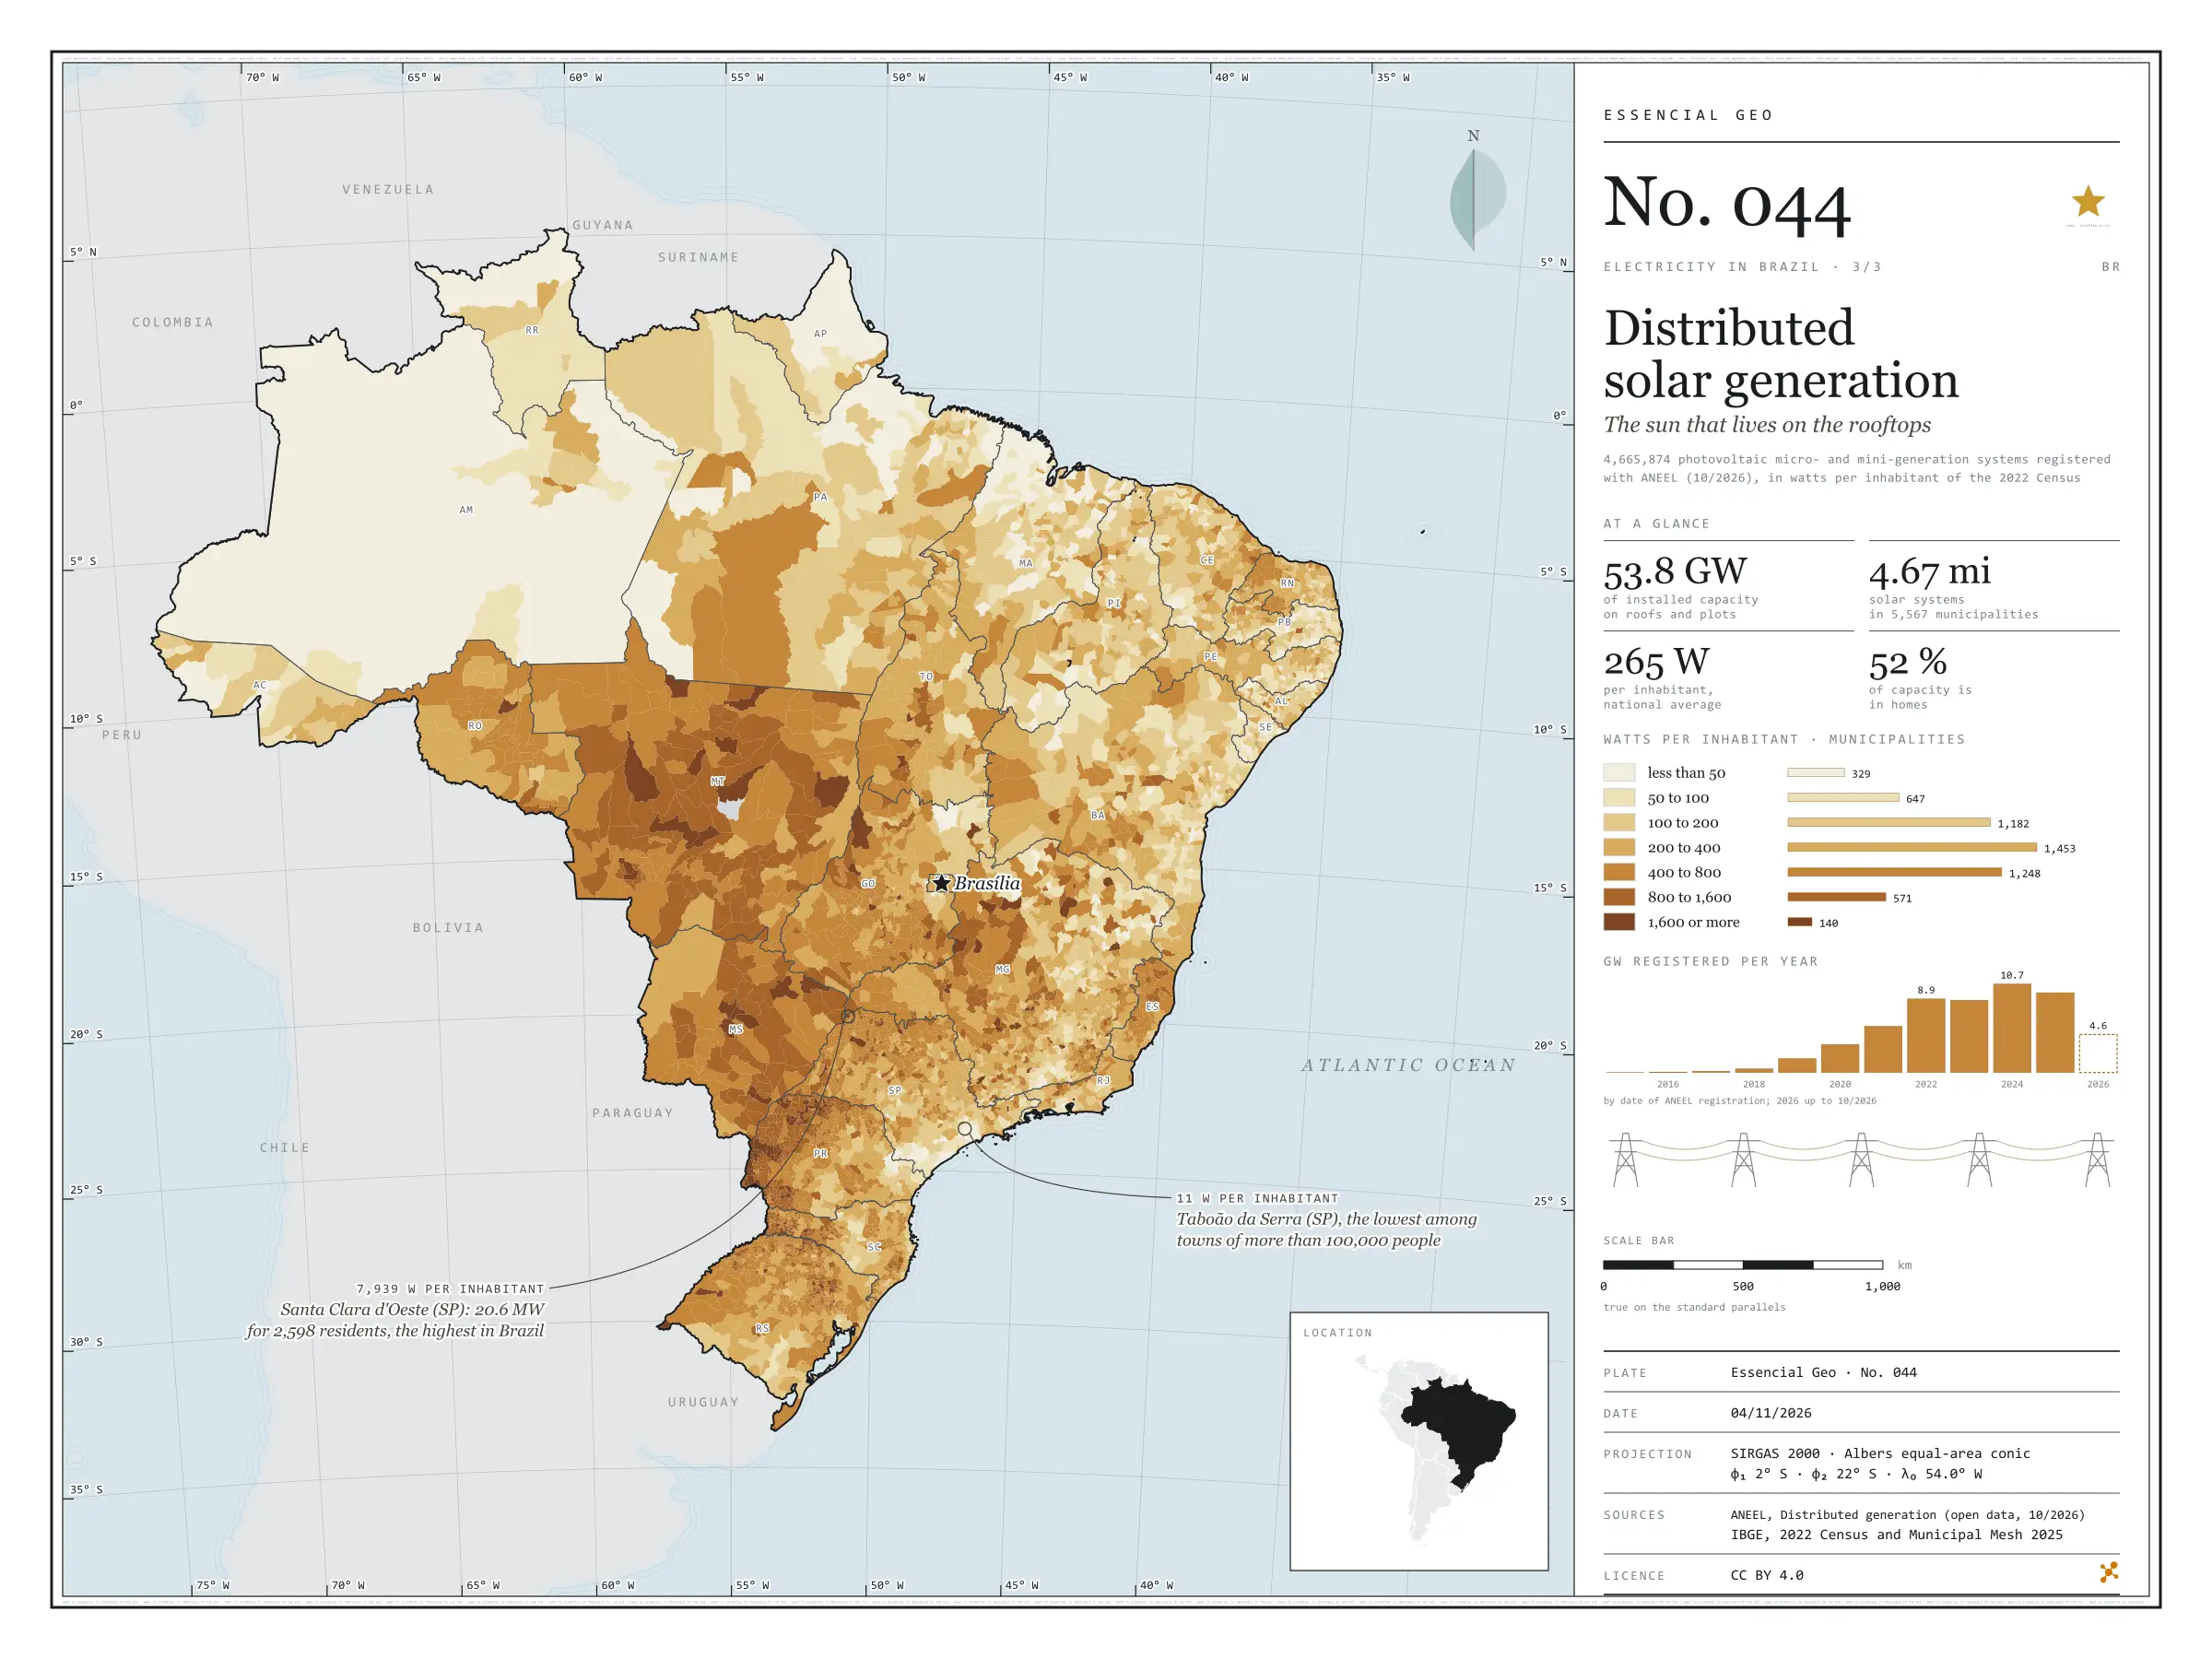
There are 4.67 million photovoltaic systems in 5,567 municipalities: panels on the roofs of homes, shops and smallholdings, and small plants of up to 5 MW that cut their owners’ electricity bills. They add up to 53.8 GW, 265 W per inhabitant, 52% of it in homes. Rooftop sun is strongest in the Centre-West and western Paraná: Mato Grosso has 872 W per inhabitant, and Foz do Iguaçu, with 1,408 W, leads among towns of more than 100,000 people. São Paulo has the largest capacity, 7.6 GW, but only 170 W per inhabitant; Taboão da Serra stands at 11 W. At the other extreme, the 20.6 MW of Santa Clara d’Oeste give 7,939 W to each of its 2,598 residents. Last plate of the collection “Electricity in Brazil”.

Technical record · downloads · citation

At a glance

Solar capacity in distributed generation

54 GW

4,665,874 systems, 265 W per inhabitant

Capacity by consumer class (GW) (GW)
  • Residencial 52.3%
  • Comercial 26.6%
  • Rural 12.4%
  • Industrial 6.8%
  • Poder público 1.2%
  • Outras 0.8%
Watts per inhabitant, the five highest and five lowest states (W)
  • MT 872
  • MS 700
  • PR 600
  • TO 503
  • RO 492
  • PB 165
  • MA 164
  • SE 144
  • RJ 128
  • AM 115

Layers

  • municipios polygon 5,571 municipalities: population, number of solar systems, total capacity, by size, residential and remote self-consumption (kW), units receiving credit, watts per inhabitant and class
  • ufs polygon 27 states
  • limite_nacional polygon National boundary

Metadata

Extent
Brazil
CRS / Projection
SIRGAS 2000 (EPSG:4674)
EPSG:4674
Software
Python · pandas · GeoPandas · GDAL · QGIS · Node.js · d3-geo
Method
Capacity of photovoltaic micro- and mini-generation systems summed by municipality, divided by the 2022 Census population and grouped into seven classes of watts per inhabitant.
Version
v1.0.0
Licence
CC BY 4.0

Downloads

Figure to reuse

The map without a frame, with legend, scale, reference system and credit written on it: ready for papers, lectures and slides. In two versions: with the basemap (neighbours and sea) or only the mapped area, on white.

Point a camera at it to open this page.

How to cite

Cerejo, L. N. (2026). Geração solar distribuída: o sol que mora nos telhados [Distributed solar generation: The sun that lives on the rooftops] (Version 1.0.0) [Data set]. Zenodo. https://doi.org/10.5281/zenodo.23539656

Technical record

Technical record · No. 042

Transmission lines

At a glance

Length by voltage class (thousand km, adding up circuits) (mil km)
  • até 230 kV 66
  • 345 e 440 kV 17
  • 500 a 765 kV 68
  • 600 e 800 kV, corrente contínua 20
The longest line: Xingu – Terminal Rio, 800 kV direct current

2,552 km

in service since 2019

Layers

  • linhas_transmissao line 1,712 lines: voltage, length, year in service, concession holder and voltage class
  • subestacoes point 780 substations: voltages, year in service, concession holder and state
  • ufs polygon 27 states
  • limite_nacional polygon National boundary

Metadata

Extent
Brazil
CRS / Projection
SIRGAS 2000 (EPSG:4674)
EPSG:4674
Software
Python · GeoPandas · GDAL · QGIS · Node.js · d3-geo
Method
EPE’s existing transmission lines and substations, grouped into four voltage classes; length as declared by EPE and checked against the geodesic measurement.
Version
v1.0.0
Licence
CC BY 4.0

Downloads

Figure to reuse

The map without a frame, with legend, scale, reference system and credit written on it: ready for papers, lectures and slides. In two versions: with the basemap (neighbours and sea) or only the mapped area, on white.

Point a camera at it to open this page.

How to cite

Cerejo, L. N. (2026). Linhas de transmissão: os fios que costuram o país [Transmission lines: The wires that stitch the country together] (Version 1.0.0) [Data set]. Zenodo. https://doi.org/10.5281/zenodo.23539594

Data and plates under CC BY 4.0: use them in commercial drawings and papers, citing the source.

100%