Skip to content
Essencial

No. 044 Energy · biomass Electricity in Brazil 3/3

Distributed solar generation

The sun that lives on the rooftops

Record, downloads and citation
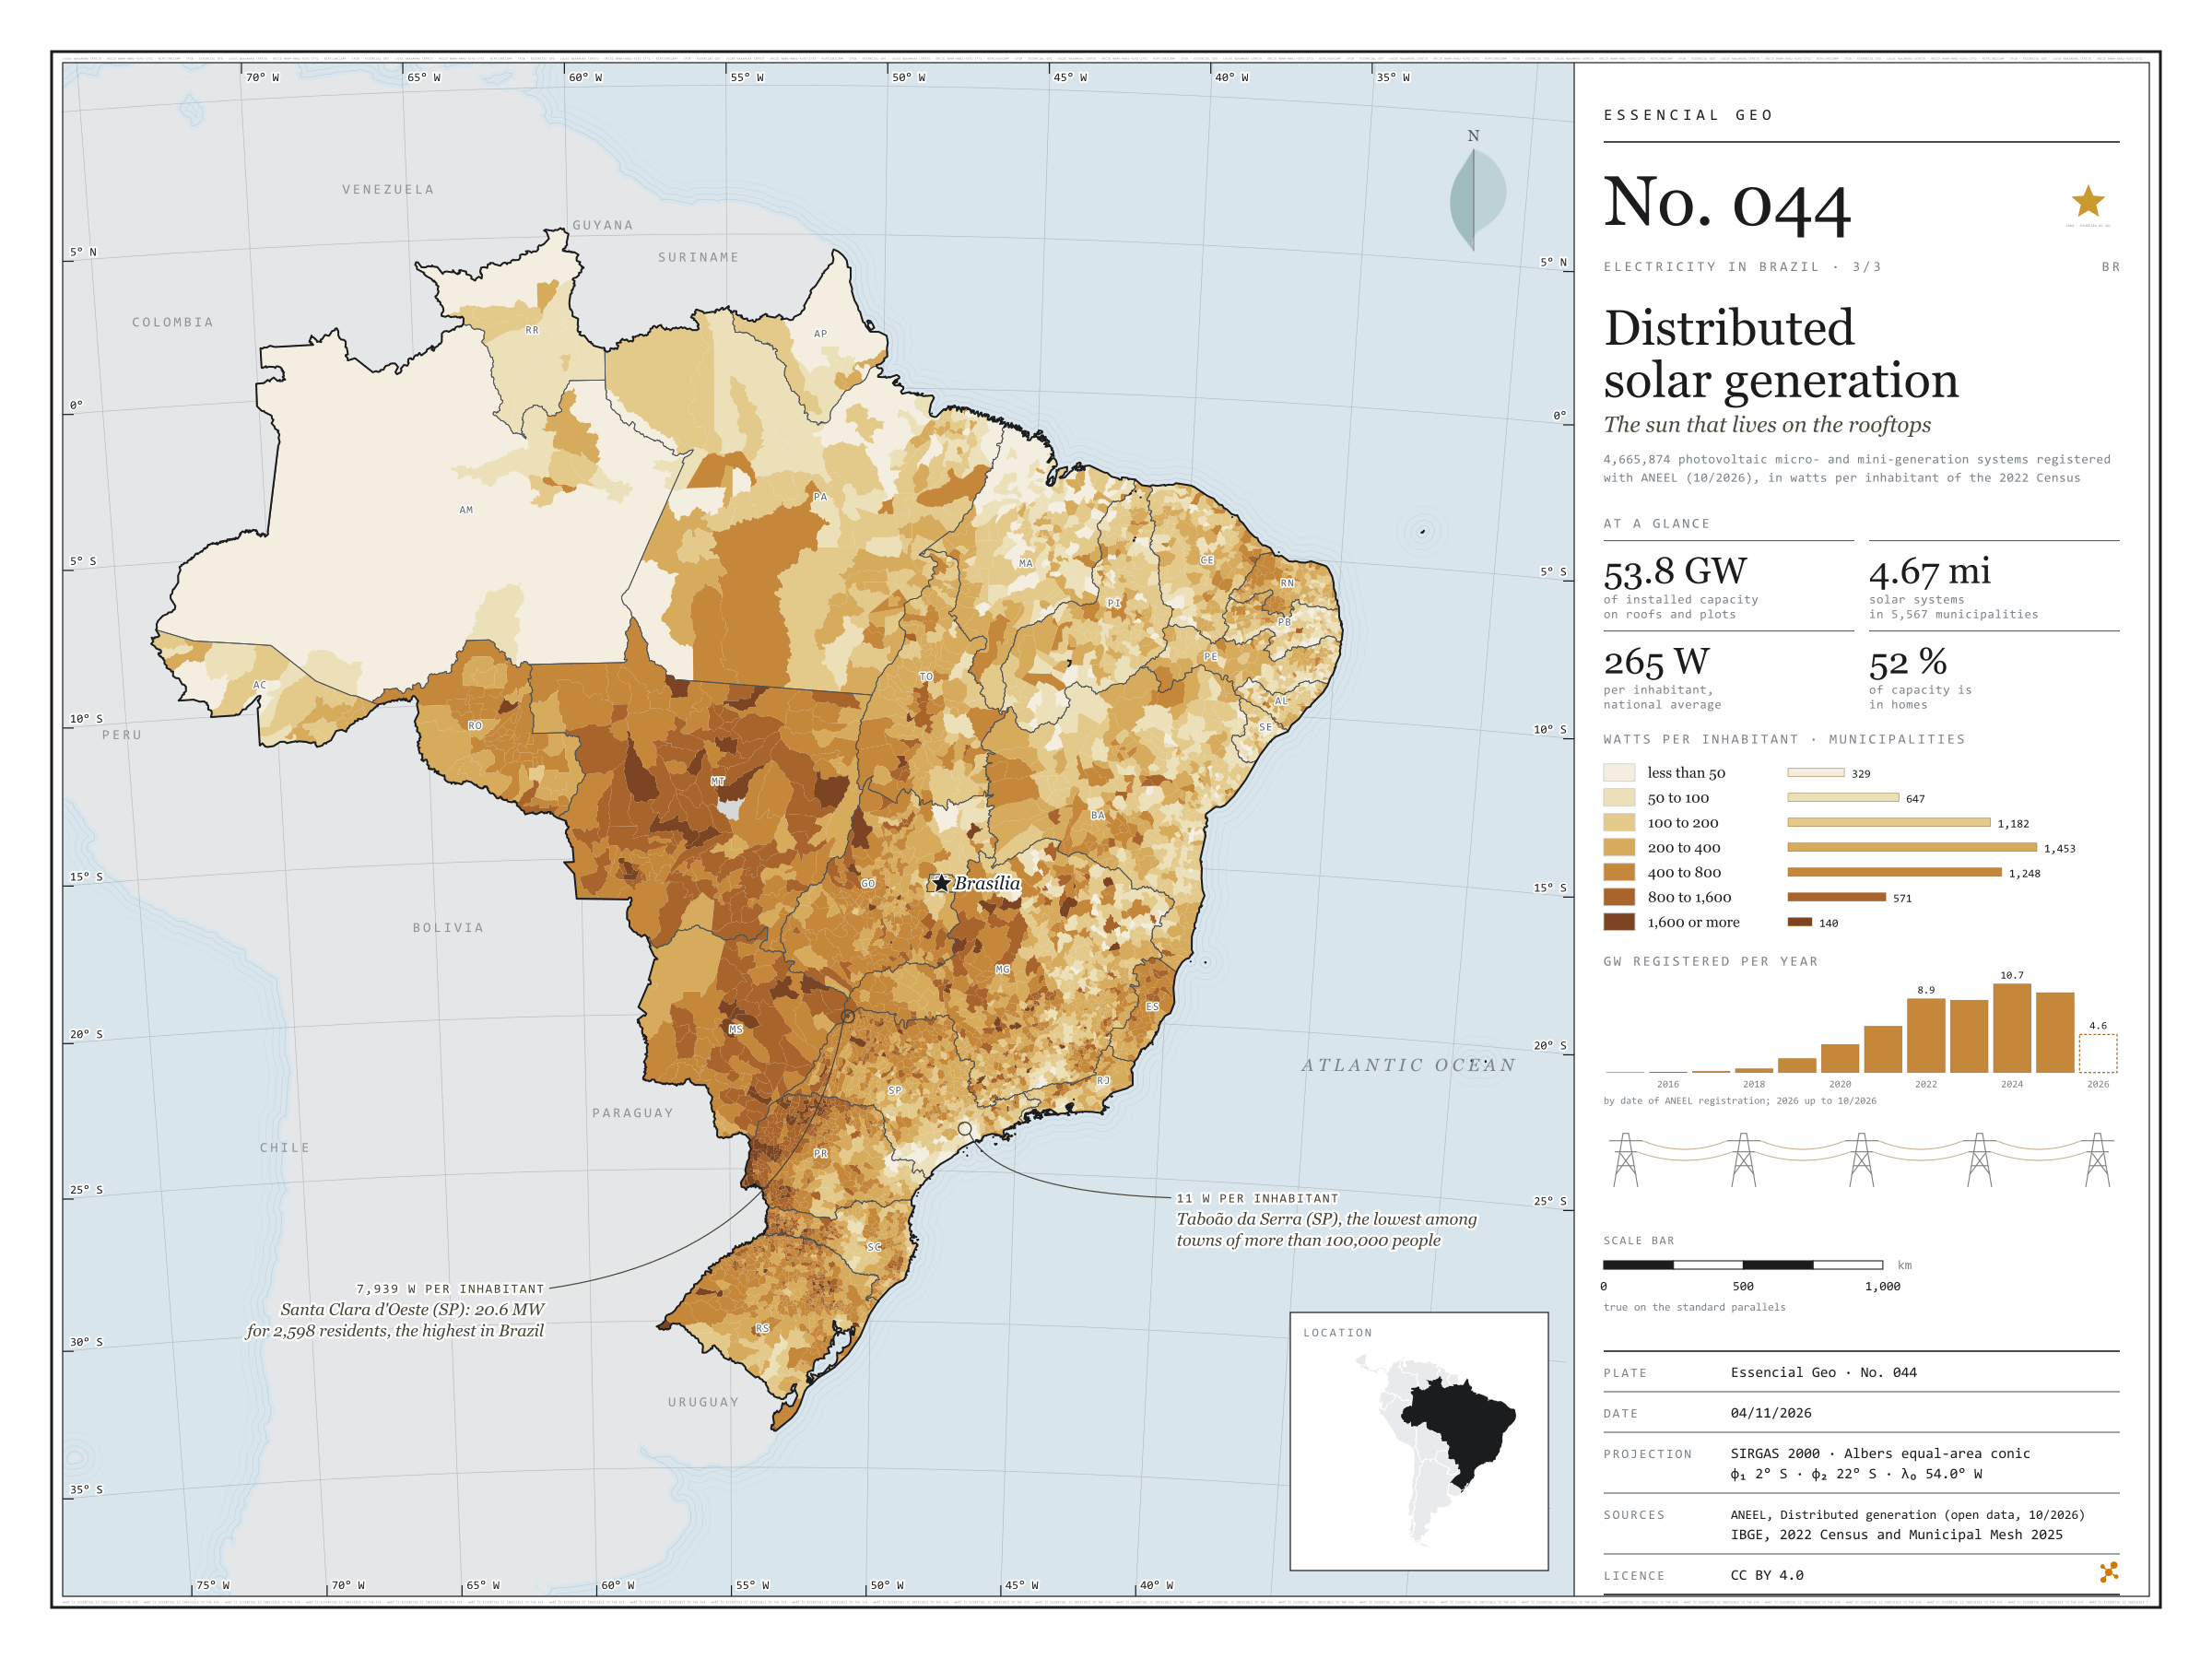
Fig. 044 Brazil EPSG:4674 Source: ANEEL, IBGE, Natural Earth

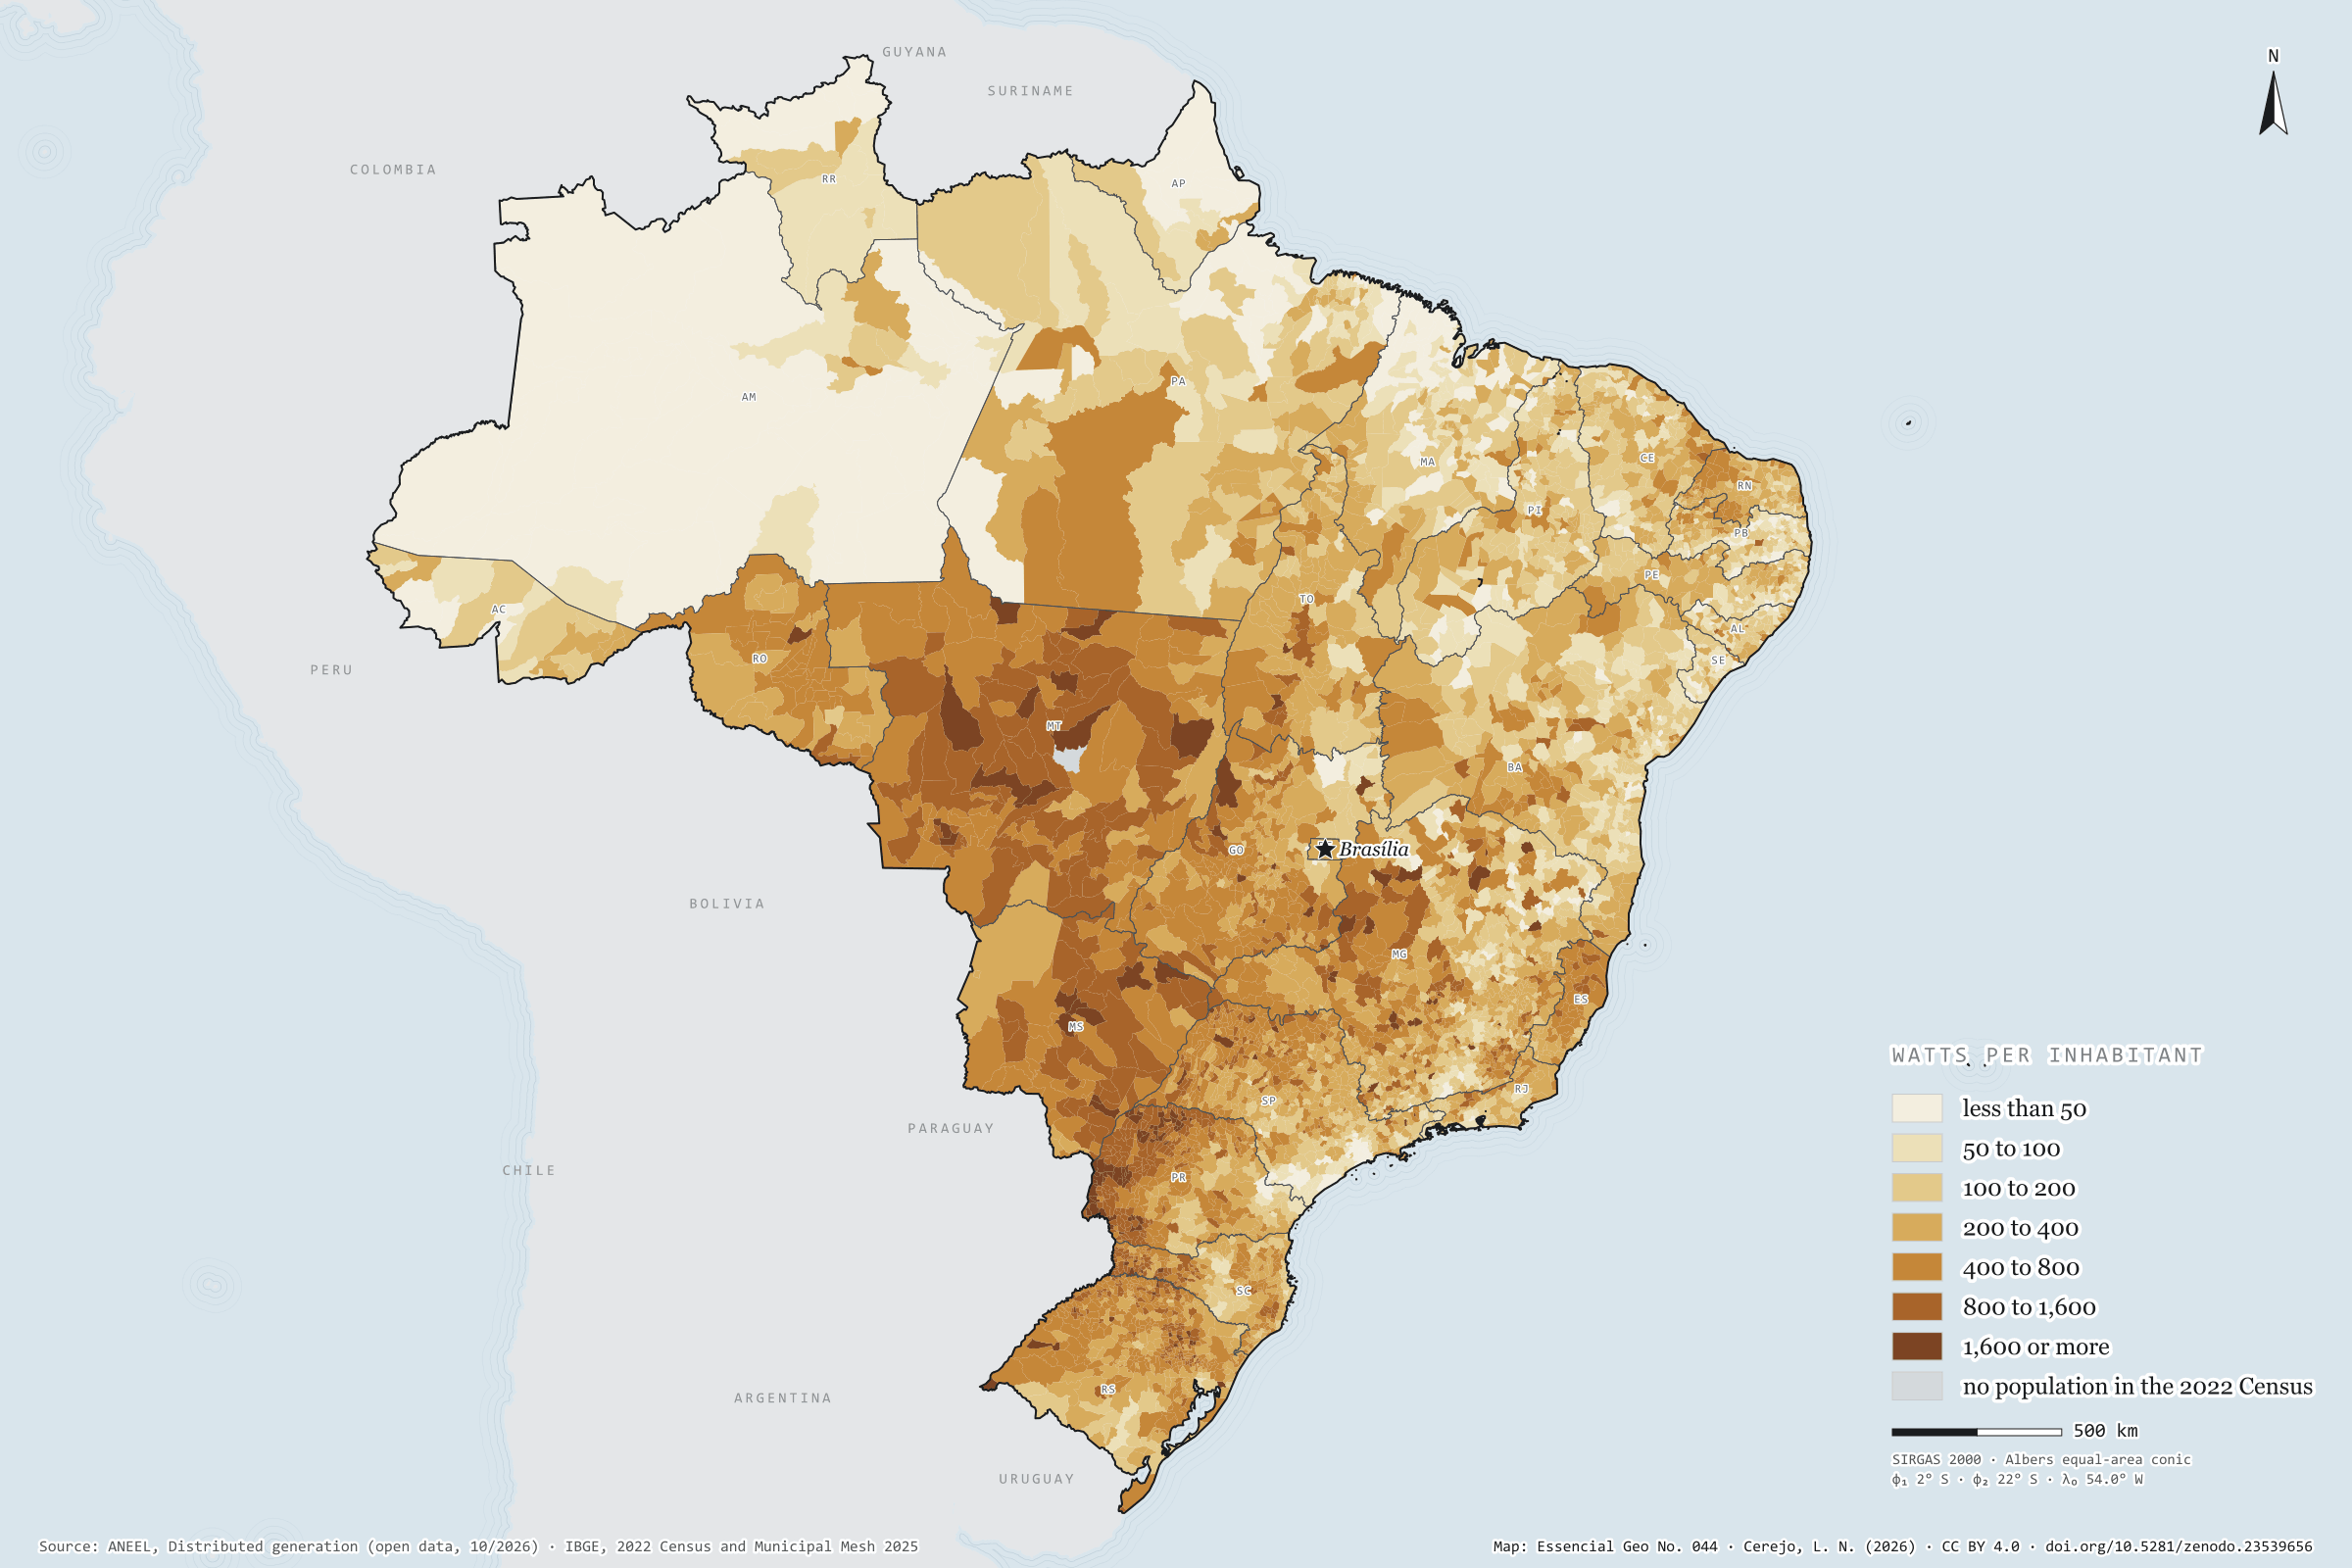
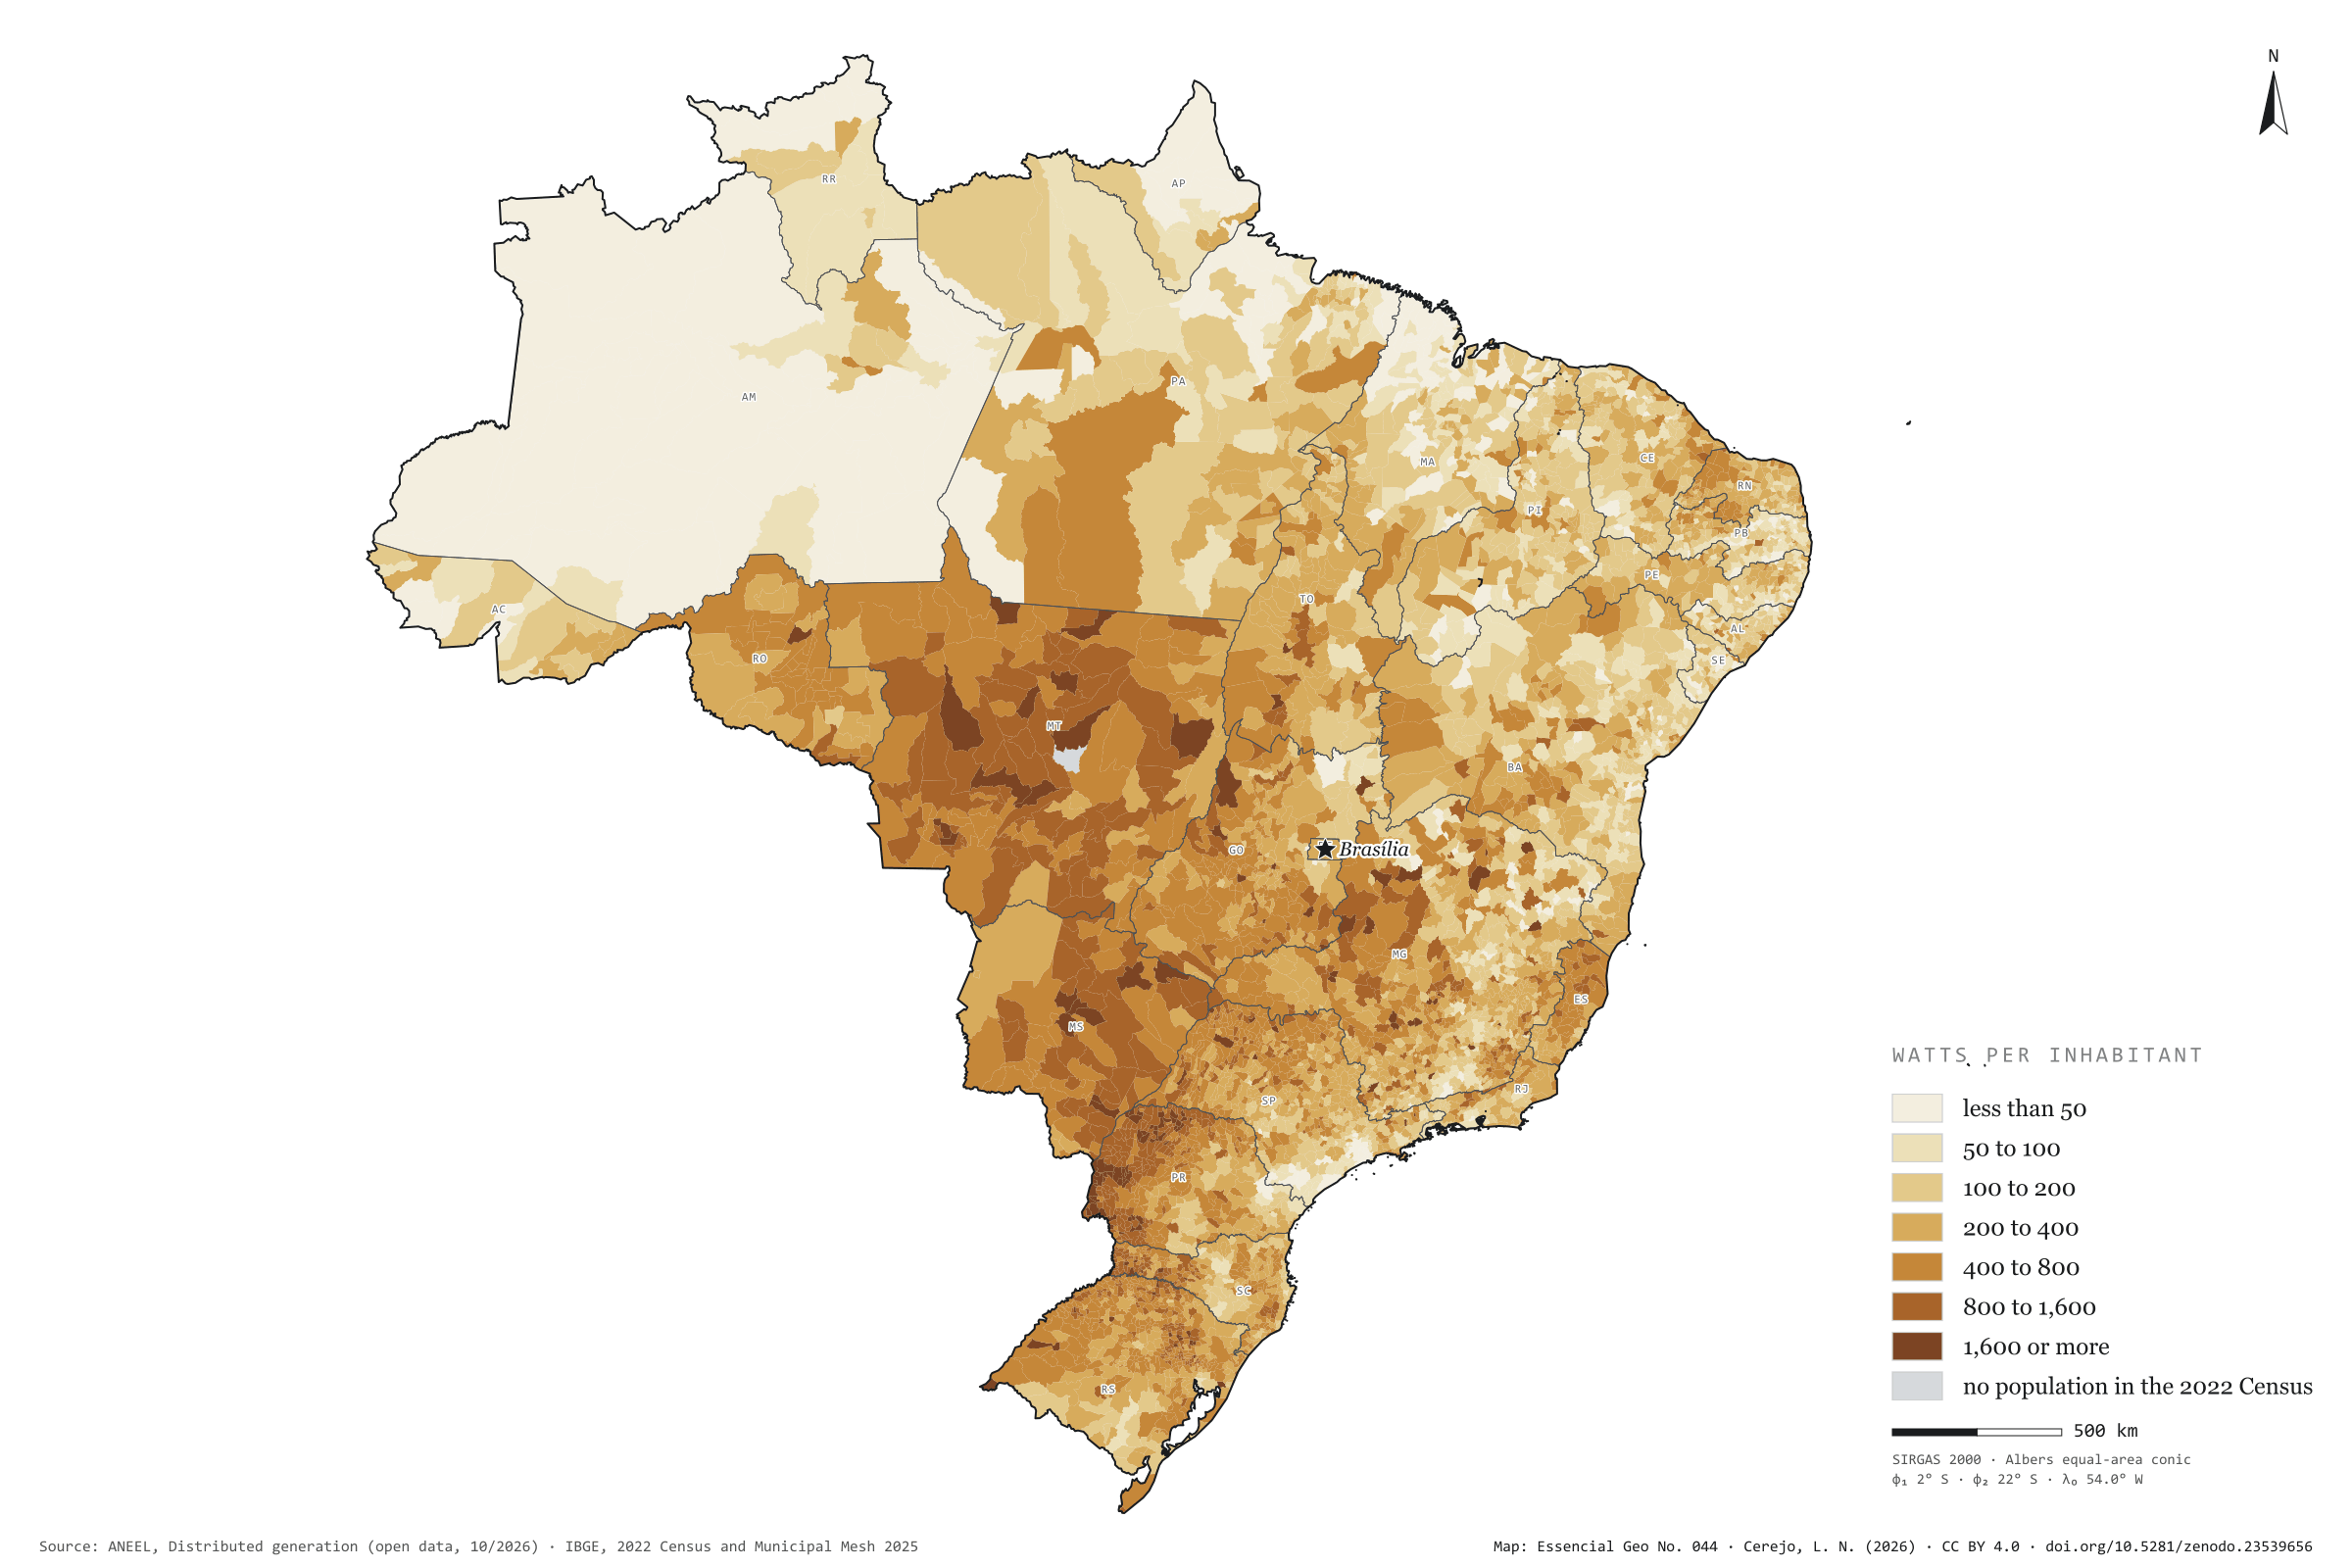
There are 4.67 million photovoltaic systems in 5,567 municipalities: panels on the roofs of homes, shops and smallholdings, and small plants of up to 5 MW that cut their owners’ electricity bills. They add up to 53.8 GW, 265 W per inhabitant, 52% of it in homes. Rooftop sun is strongest in the Centre-West and western Paraná: Mato Grosso has 872 W per inhabitant, and Foz do Iguaçu, with 1,408 W, leads among towns of more than 100,000 people. São Paulo has the largest capacity, 7.6 GW, but only 170 W per inhabitant; Taboão da Serra stands at 11 W. At the other extreme, the 20.6 MW of Santa Clara d’Oeste give 7,939 W to each of its 2,598 residents. Last plate of the collection “Electricity in Brazil”.

Technical record · downloads · citation

At a glance

Solar capacity in distributed generation

54 GW

4,665,874 systems, 265 W per inhabitant

Capacity by consumer class (GW) (GW)
  • Residencial 52.3%
  • Comercial 26.6%
  • Rural 12.4%
  • Industrial 6.8%
  • Poder público 1.2%
  • Outras 0.8%
Watts per inhabitant, the five highest and five lowest states (W)
  • MT 872
  • MS 700
  • PR 600
  • TO 503
  • RO 492
  • PB 165
  • MA 164
  • SE 144
  • RJ 128
  • AM 115

Layers

  • municipios polygon 5,571 municipalities: population, number of solar systems, total capacity, by size, residential and remote self-consumption (kW), units receiving credit, watts per inhabitant and class
  • ufs polygon 27 states
  • limite_nacional polygon National boundary

Metadata

Extent
Brazil
CRS / Projection
SIRGAS 2000 (EPSG:4674)
EPSG:4674
Software
Python · pandas · GeoPandas · GDAL · QGIS · Node.js · d3-geo
Method
Capacity of photovoltaic micro- and mini-generation systems summed by municipality, divided by the 2022 Census population and grouped into seven classes of watts per inhabitant.
Version
v1.0.0
Licence
CC BY 4.0

Downloads

Figure to reuse

The map without a frame, with legend, scale, reference system and credit written on it: ready for papers, lectures and slides. In two versions: with the basemap (neighbours and sea) or only the mapped area, on white.

Point a camera at it to open this page.

How to cite

Cerejo, L. N. (2026). Geração solar distribuída: o sol que mora nos telhados [Distributed solar generation: The sun that lives on the rooftops] (Version 1.0.0) [Data set]. Zenodo. https://doi.org/10.5281/zenodo.23539656

How to read this plate area, projection, scale, legend and source · 3 terms
1 Area
Brazil The area the plate covers. Outside it, neighbours and sea are drawn in grey, just for orientation.
2 Coordinates and projection
SIRGAS 2000 (EPSG:4674) Drawn in Albers, which preserves areas, so the size of patches can be compared. The layers are in SIRGAS 2000; the drawing’s projection is written in the colophon at the foot of the panel.
3 Scale
Graphic scale bar in the panel The scale bar is true on the central meridian; away from it, measured distances vary a little.
4 Legend and layers
3 layers in the GeoPackage · polygon Read the legend before the map: it tells you whether a colour is a rate or a class, and whether a circle is a total.
5 Sources
ANEEL (2026); IBGE (2022); IBGE (2025); Natural Earth Every figure comes from a public source, with its year. The data sheet gives each one’s address.

Terms on this plate

Albers projection
An equal-area conic projection: it flattens the Earth onto paper without changing areas. A municipality twice as large takes up twice as much paper, which is why it is used to compare quantities across the whole of Brazil.
Choropleth map
Each area (municipality, census tract) takes the colour of its value’s class. The colour gives the band, not the total, which is why the plates use rates such as per km², per person or per household.
2022 Census
IBGE’s door-to-door count. Results by census tract give residents, age, household-head income, water, sewerage and rubbish.

Download

Layers, table and figures, under CC BY 4.0. Cite with the DOI.

Full record and citation

Method notes · No. 044

Distributed solar generation in Brazil, by municipality

Português · English

Plate No. 044, the last of three in the collection Electricity in Brazil: after the wires and the large power plants, the energy that is born close to those who use it.

What the files contain

Layer (GPKG)GeometryContents
municipiospolygon5,571 municipalities: CD_MUN, NM_MUN, SIGLA_UF, pop_2022, n_sistemas, kw_total, kw_micro (up to 75 kW), kw_mini (above 75 kW), kw_residencial, kw_remoto (remote self-consumption, shared and condominium schemes), uc_credito (consumer units receiving the credits), w_hab, classe, faixa_w_hab
ufspolygon27 states, with their region
limite_nacionalpolygonoutline of the country

The GPKG is zipped and attached to the energia-eletrica-2026 release. The municipios layer carries the plate’s QGIS style, with the seven classes of watts per inhabitant. The CSV sits in this folder, in UTF-8, with the same table without geometry.

ANEEL’s dataset has one record per system, with data on individuals and companies; only municipal totals are used here.

Method

  1. All micro- and mini-generation units in ANEEL’s open dataset, reference October 2026, filtered to solar photovoltaic plants (UFV). The other sources (biogas, small hydro, wind) add up to 0.3 GW and are left out.
  2. Installed capacity summed by the IBGE code of the municipality where the system is connected. In remote self-consumption schemes the credit may go to bills elsewhere; the map shows where the panels are.
  3. Watts per inhabitant: the municipality’s capacity divided by its 2022 Census population. Class limits at 50, 100, 200, 400, 800 and 1,600 W, doubling at each step.
  4. Boa Esperança do Norte (MT), created after the Census, has no population and is shown in grey.
  5. The panel’s columns add up capacity by the year of each system’s latest registration update, from 2015 to 2026.

Limitations

  • The date used in the columns is that of the latest registration update, which for most systems matches the connection but may be later. 2026 runs only to August.
  • Watts per inhabitant inflate small municipalities: a single 5 MW plant in a town of 2,000 people already exceeds 2,000 W. In large cities, blocks of flats leave little roof area per resident.
  • Capacity is the nominal value declared at connection, not the energy generated, which depends on the sunshine in each place.
  • Population is from 2022, capacity from 2026.

Data licence

Open data from ANEEL and IBGE, free to use with attribution.

View this map’s folder on GitHub

Technical record

Technical record · No. 044

Distributed solar generation

At a glance

Solar capacity in distributed generation

54 GW

4,665,874 systems, 265 W per inhabitant

Capacity by consumer class (GW) (GW)
  • Residencial 52.3%
  • Comercial 26.6%
  • Rural 12.4%
  • Industrial 6.8%
  • Poder público 1.2%
  • Outras 0.8%
Watts per inhabitant, the five highest and five lowest states (W)
  • MT 872
  • MS 700
  • PR 600
  • TO 503
  • RO 492
  • PB 165
  • MA 164
  • SE 144
  • RJ 128
  • AM 115

Layers

  • municipios polygon 5,571 municipalities: population, number of solar systems, total capacity, by size, residential and remote self-consumption (kW), units receiving credit, watts per inhabitant and class
  • ufs polygon 27 states
  • limite_nacional polygon National boundary

Metadata

Extent
Brazil
CRS / Projection
SIRGAS 2000 (EPSG:4674)
EPSG:4674
Software
Python · pandas · GeoPandas · GDAL · QGIS · Node.js · d3-geo
Method
Capacity of photovoltaic micro- and mini-generation systems summed by municipality, divided by the 2022 Census population and grouped into seven classes of watts per inhabitant.
Version
v1.0.0
Licence
CC BY 4.0

Downloads

Figure to reuse

The map without a frame, with legend, scale, reference system and credit written on it: ready for papers, lectures and slides. In two versions: with the basemap (neighbours and sea) or only the mapped area, on white.

Point a camera at it to open this page.

How to cite

Cerejo, L. N. (2026). Geração solar distribuída: o sol que mora nos telhados [Distributed solar generation: The sun that lives on the rooftops] (Version 1.0.0) [Data set]. Zenodo. https://doi.org/10.5281/zenodo.23539656

100%