48 towns of under 20,000 people hold 21% of the biomethane potential and lie far from the pipeline
Fig. 115São Paulo State (SP)EPSG:4674Source: CP2B (Unicamp), IBGE, EPE, SEMIL/SP, Municipal Energy Yearbook 2025 (base year 2024): sales of hydrous ethanol, petrol C, diesel oil and piped natural gas by municipality
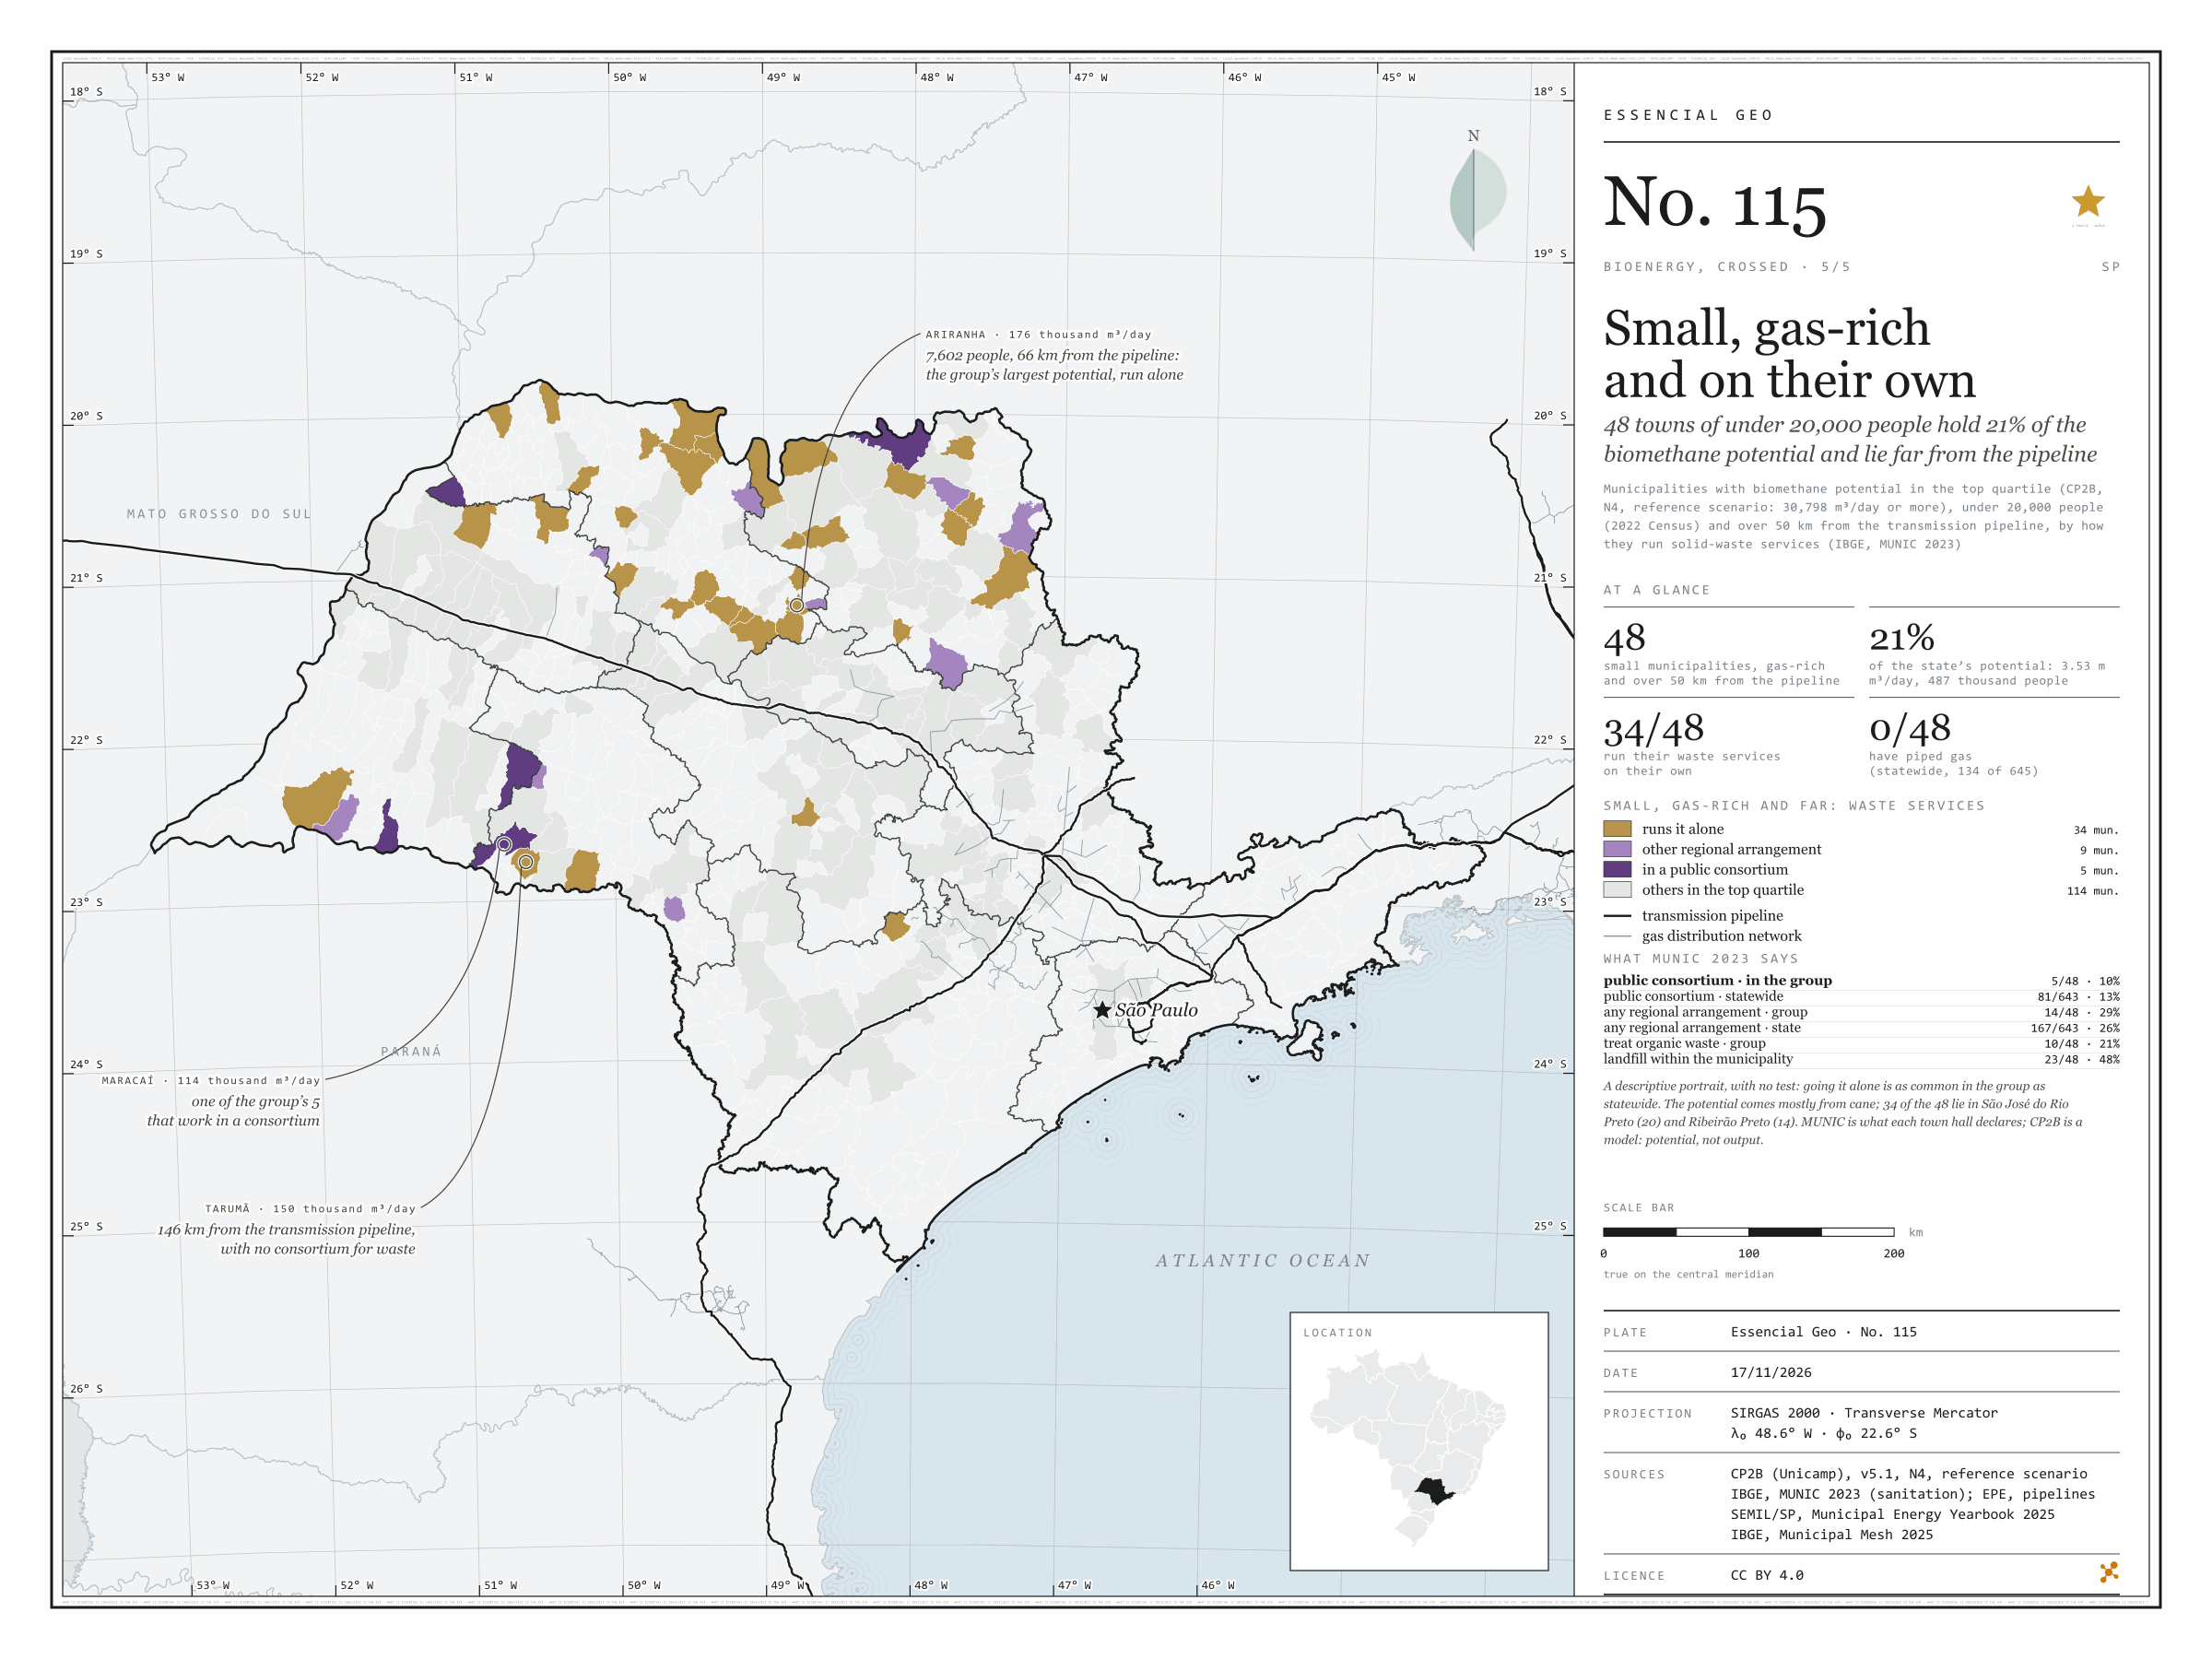
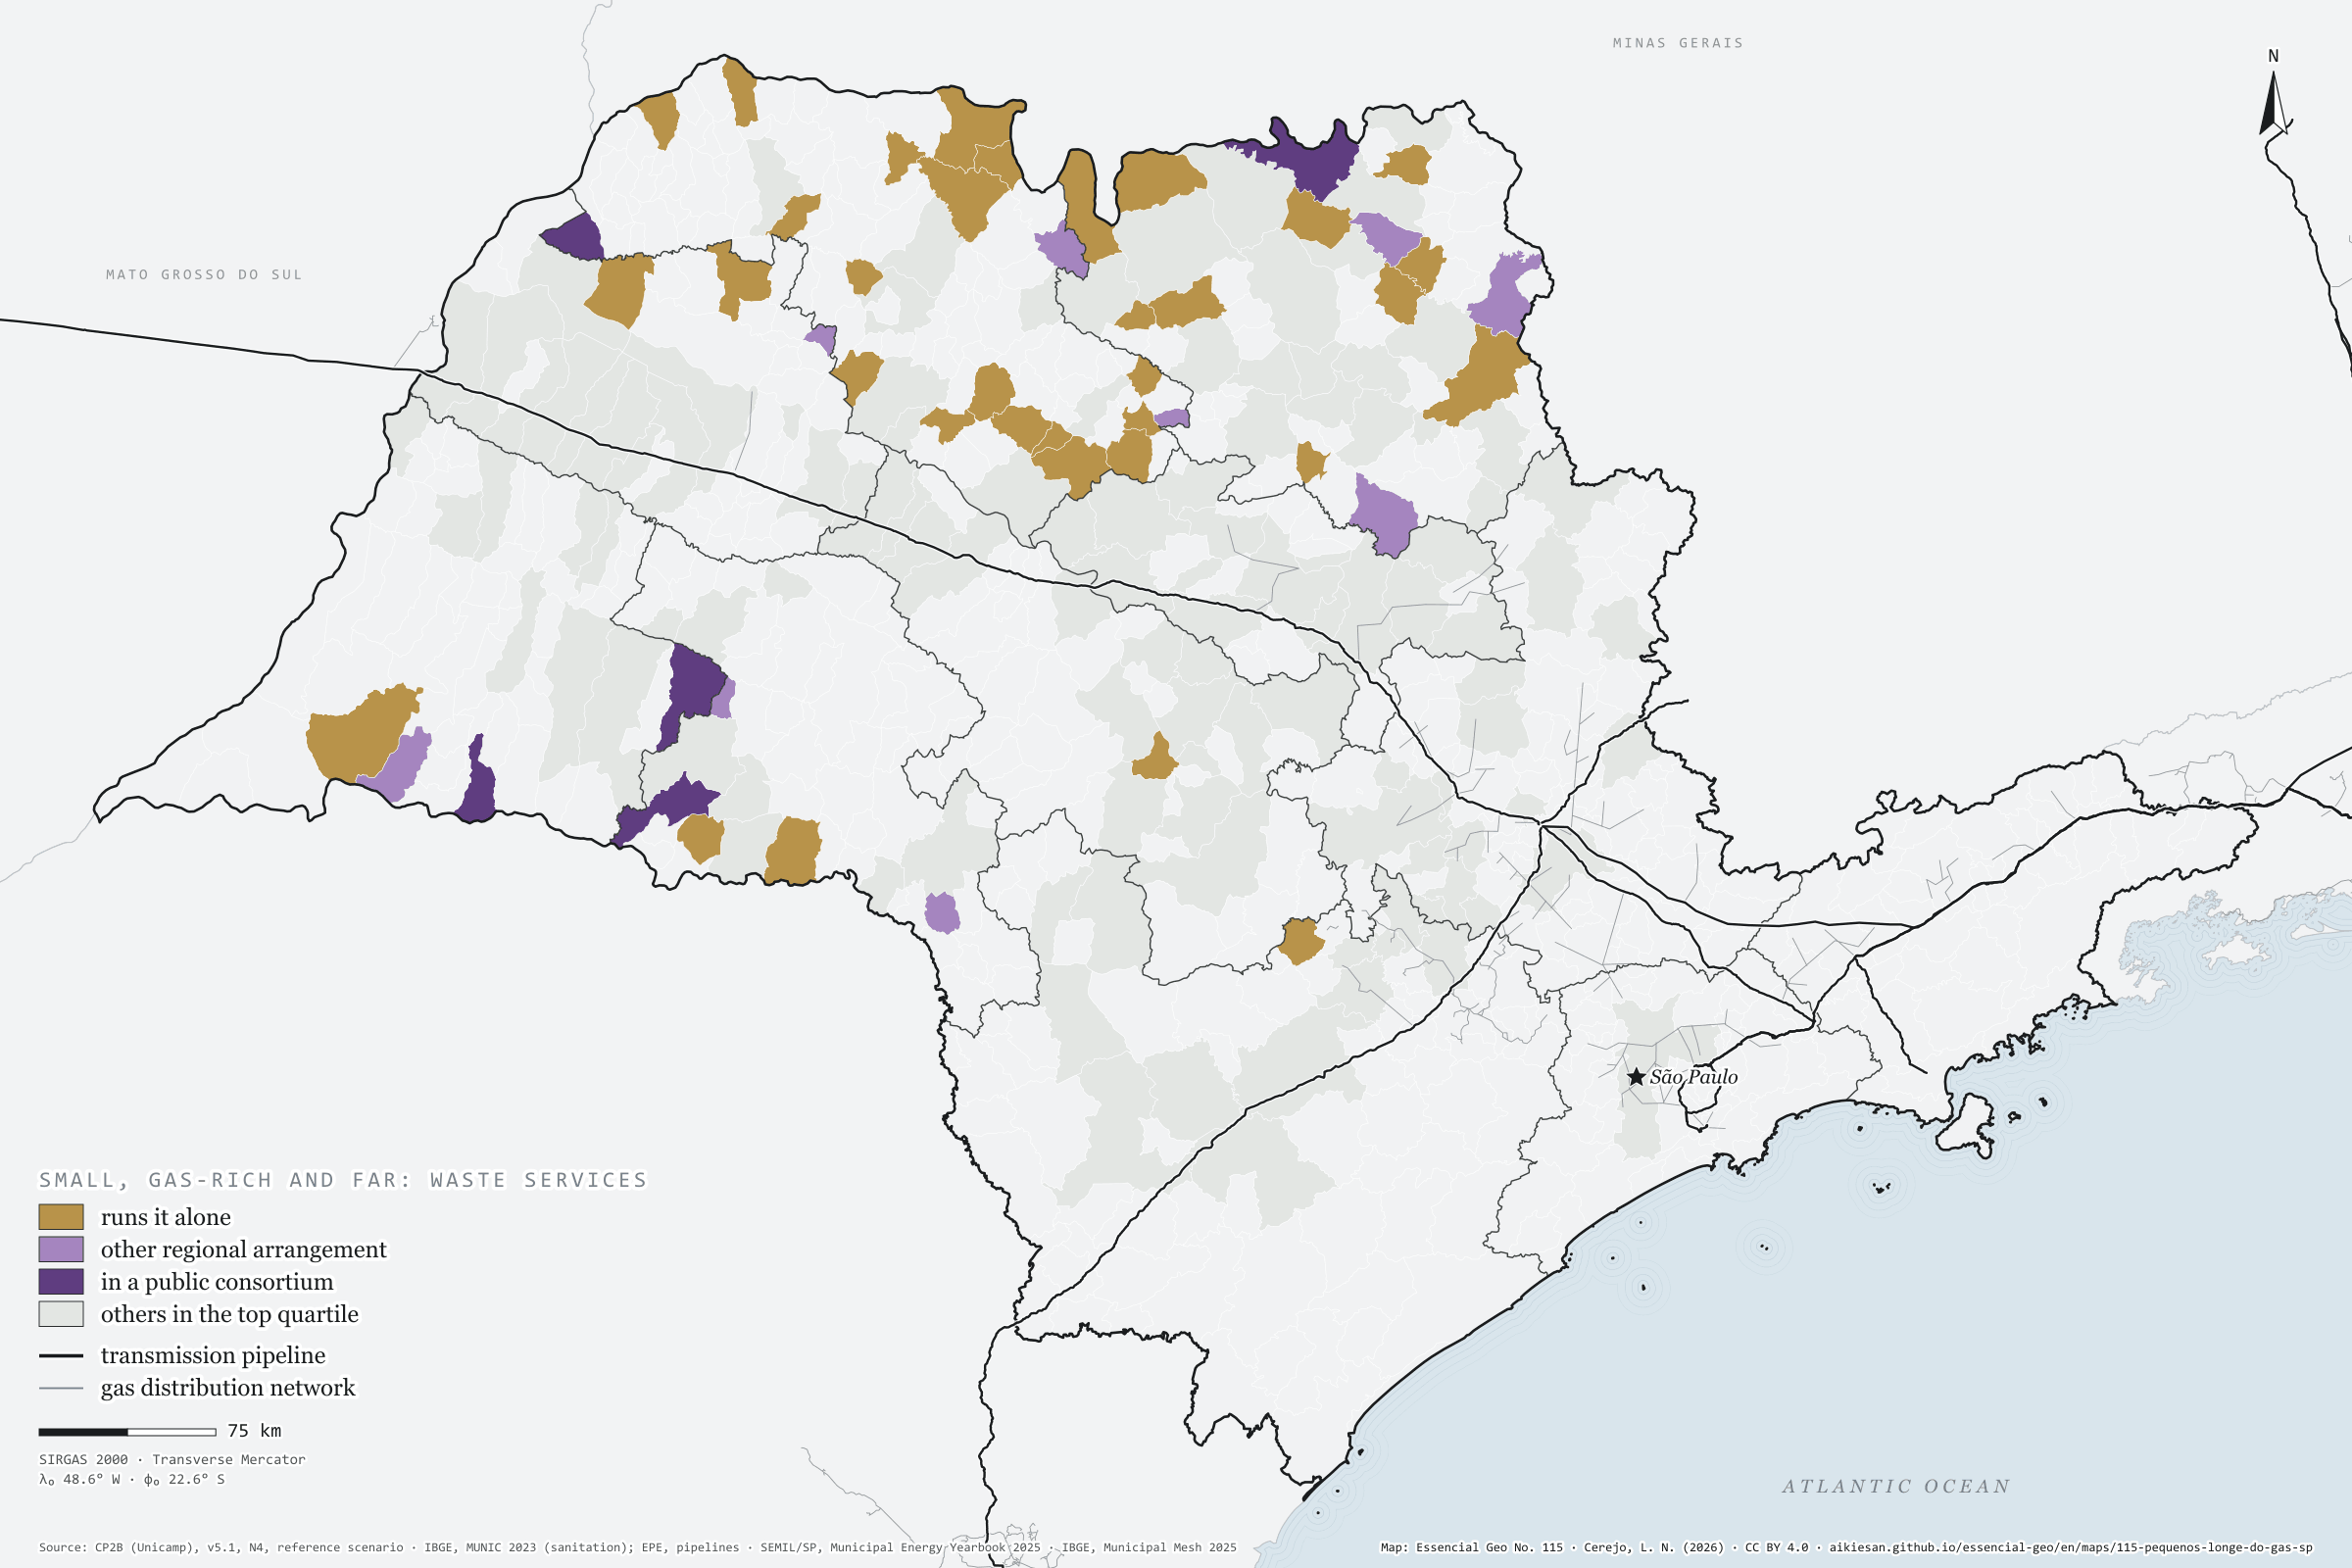
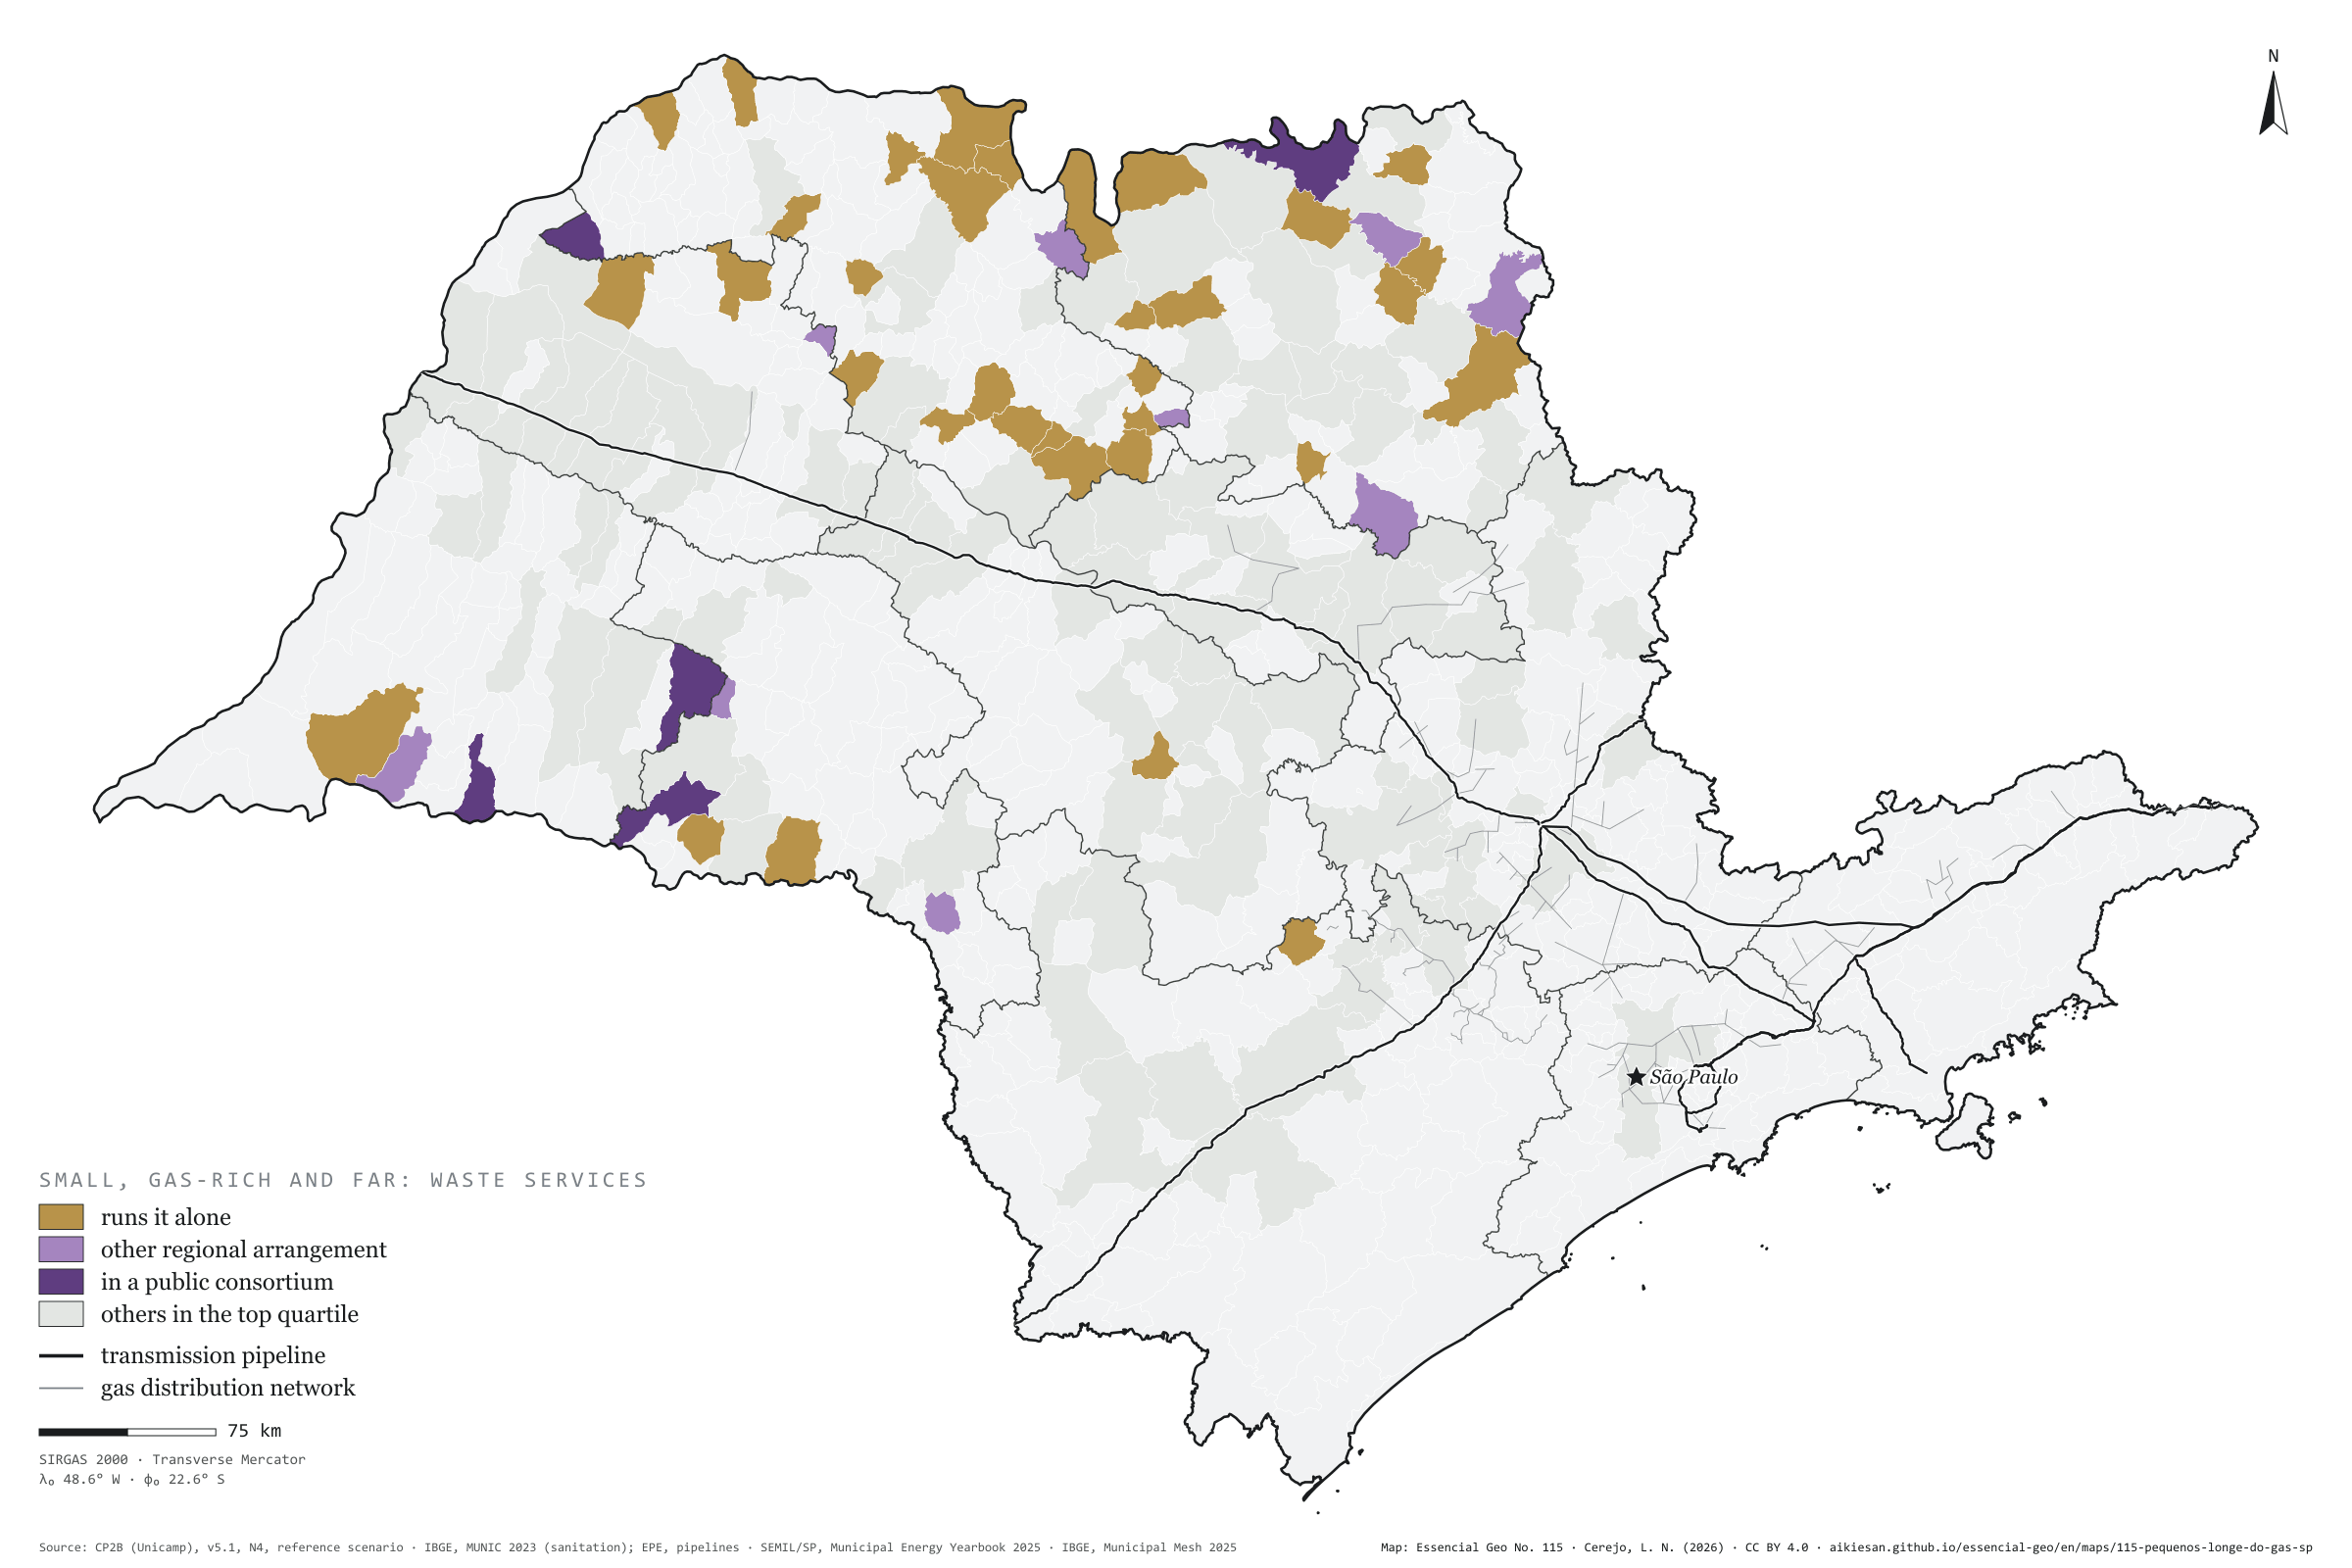
48 São Paulo municipalities combine three things: biomethane potential in the state’s top quarter, fewer than 20,000 people and over 50 km from the transmission pipeline. Together they hold 21% of the state’s accessible potential, 3.53 million m³ a day, for 487 thousand people, mostly from cane. According to MUNIC 2023, 34 of them run solid-waste services on their own, 9 have another regional arrangement and 5 are in a public consortium; none uses piped gas. Going it alone is as common in the group as statewide: this is a descriptive portrait, with no test. Ariranha, with 7,602 people, has the group’s largest potential, 176 thousand m³/day. Fifth plate of the collection “Bioenergy, crossed”.
Technical record · downloads · citation
At a glance
Small, high-potential municipalities far from the pipeline
48municipalities
of 162 in the top quarter of potential
Share of the state’s accessible potential
21%
3.53 million m³/day
Run waste services on their own
34municipalities
of 48; 5 in a public consortium
Layers
municipiospolygon645 municipalities with the variables of all five plates, the bivariate classes and the LISA clusters (same GPKG as plates 111 to 115)
gasodutoslineGas transmission pipelines and distribution network (EPE)
regioes_intermediariaspolygon11 intermediate geographic regions
Municipalities with CP2B biomethane potential (v5.1, N4, reference scenario) in the state’s top quarter (30,798 m³/day or more), fewer than 20,000 people (2022 Census) and over 50 km in a straight line from the transmission pipeline (EPE), classified by how they run solid-waste management as declared in MUNIC 2023; no statistical test.
The map without a frame, with legend, scale, reference system and credit written on it: ready for papers, lectures and slides. In two versions: with the basemap (neighbours and sea) or only the mapped area, on white.
CEREJO, Lucas Nakamura. Pequenos, cheios de gás e sozinhos: 48 municípios de menos de 20 mil habitantes têm 21 % do potencial de biometano e ficam longe do gasoduto. Versão 1.0.0. [S. l.]: Essencial, 2026. Conjunto de dados. Disponível em: https://aikiesan.github.io/essencial-geo/en/maps/115-pequenos-longe-do-gas-sp/. Acesso em: 10 nov. 2026.
Cerejo, L. N. (2026). Pequenos, cheios de gás e sozinhos: 48 municípios de menos de 20 mil habitantes têm 21 % do potencial de biometano e ficam longe do gasoduto [Small, gas-rich and on their own: 48 towns of under 20,000 people hold 21% of the biomethane potential and lie far from the pipeline] (Version 1.0.0) [Data set]. Essencial. https://aikiesan.github.io/essencial-geo/en/maps/115-pequenos-longe-do-gas-sp/
@dataset{cerejo2026_pequenos_longe_do_gas_sp,
  author    = {Cerejo, Lucas Nakamura},
  title     = {Pequenos, cheios de gás e sozinhos: 48 municípios de menos de 20 mil habitantes têm 21 % do potencial de biometano e ficam longe do gasoduto},
  year      = {2026},
  publisher = {Essencial},
  version   = {1.0.0},
  url       = {https://aikiesan.github.io/essencial-geo/en/maps/115-pequenos-longe-do-gas-sp/},
  language  = {portuguese},
  note      = {English title: Small, gas-rich and on their own: 48 towns of under 20,000 people hold 21% of the biomethane potential and lie far from the pipeline. Licence CC BY 4.0}
}
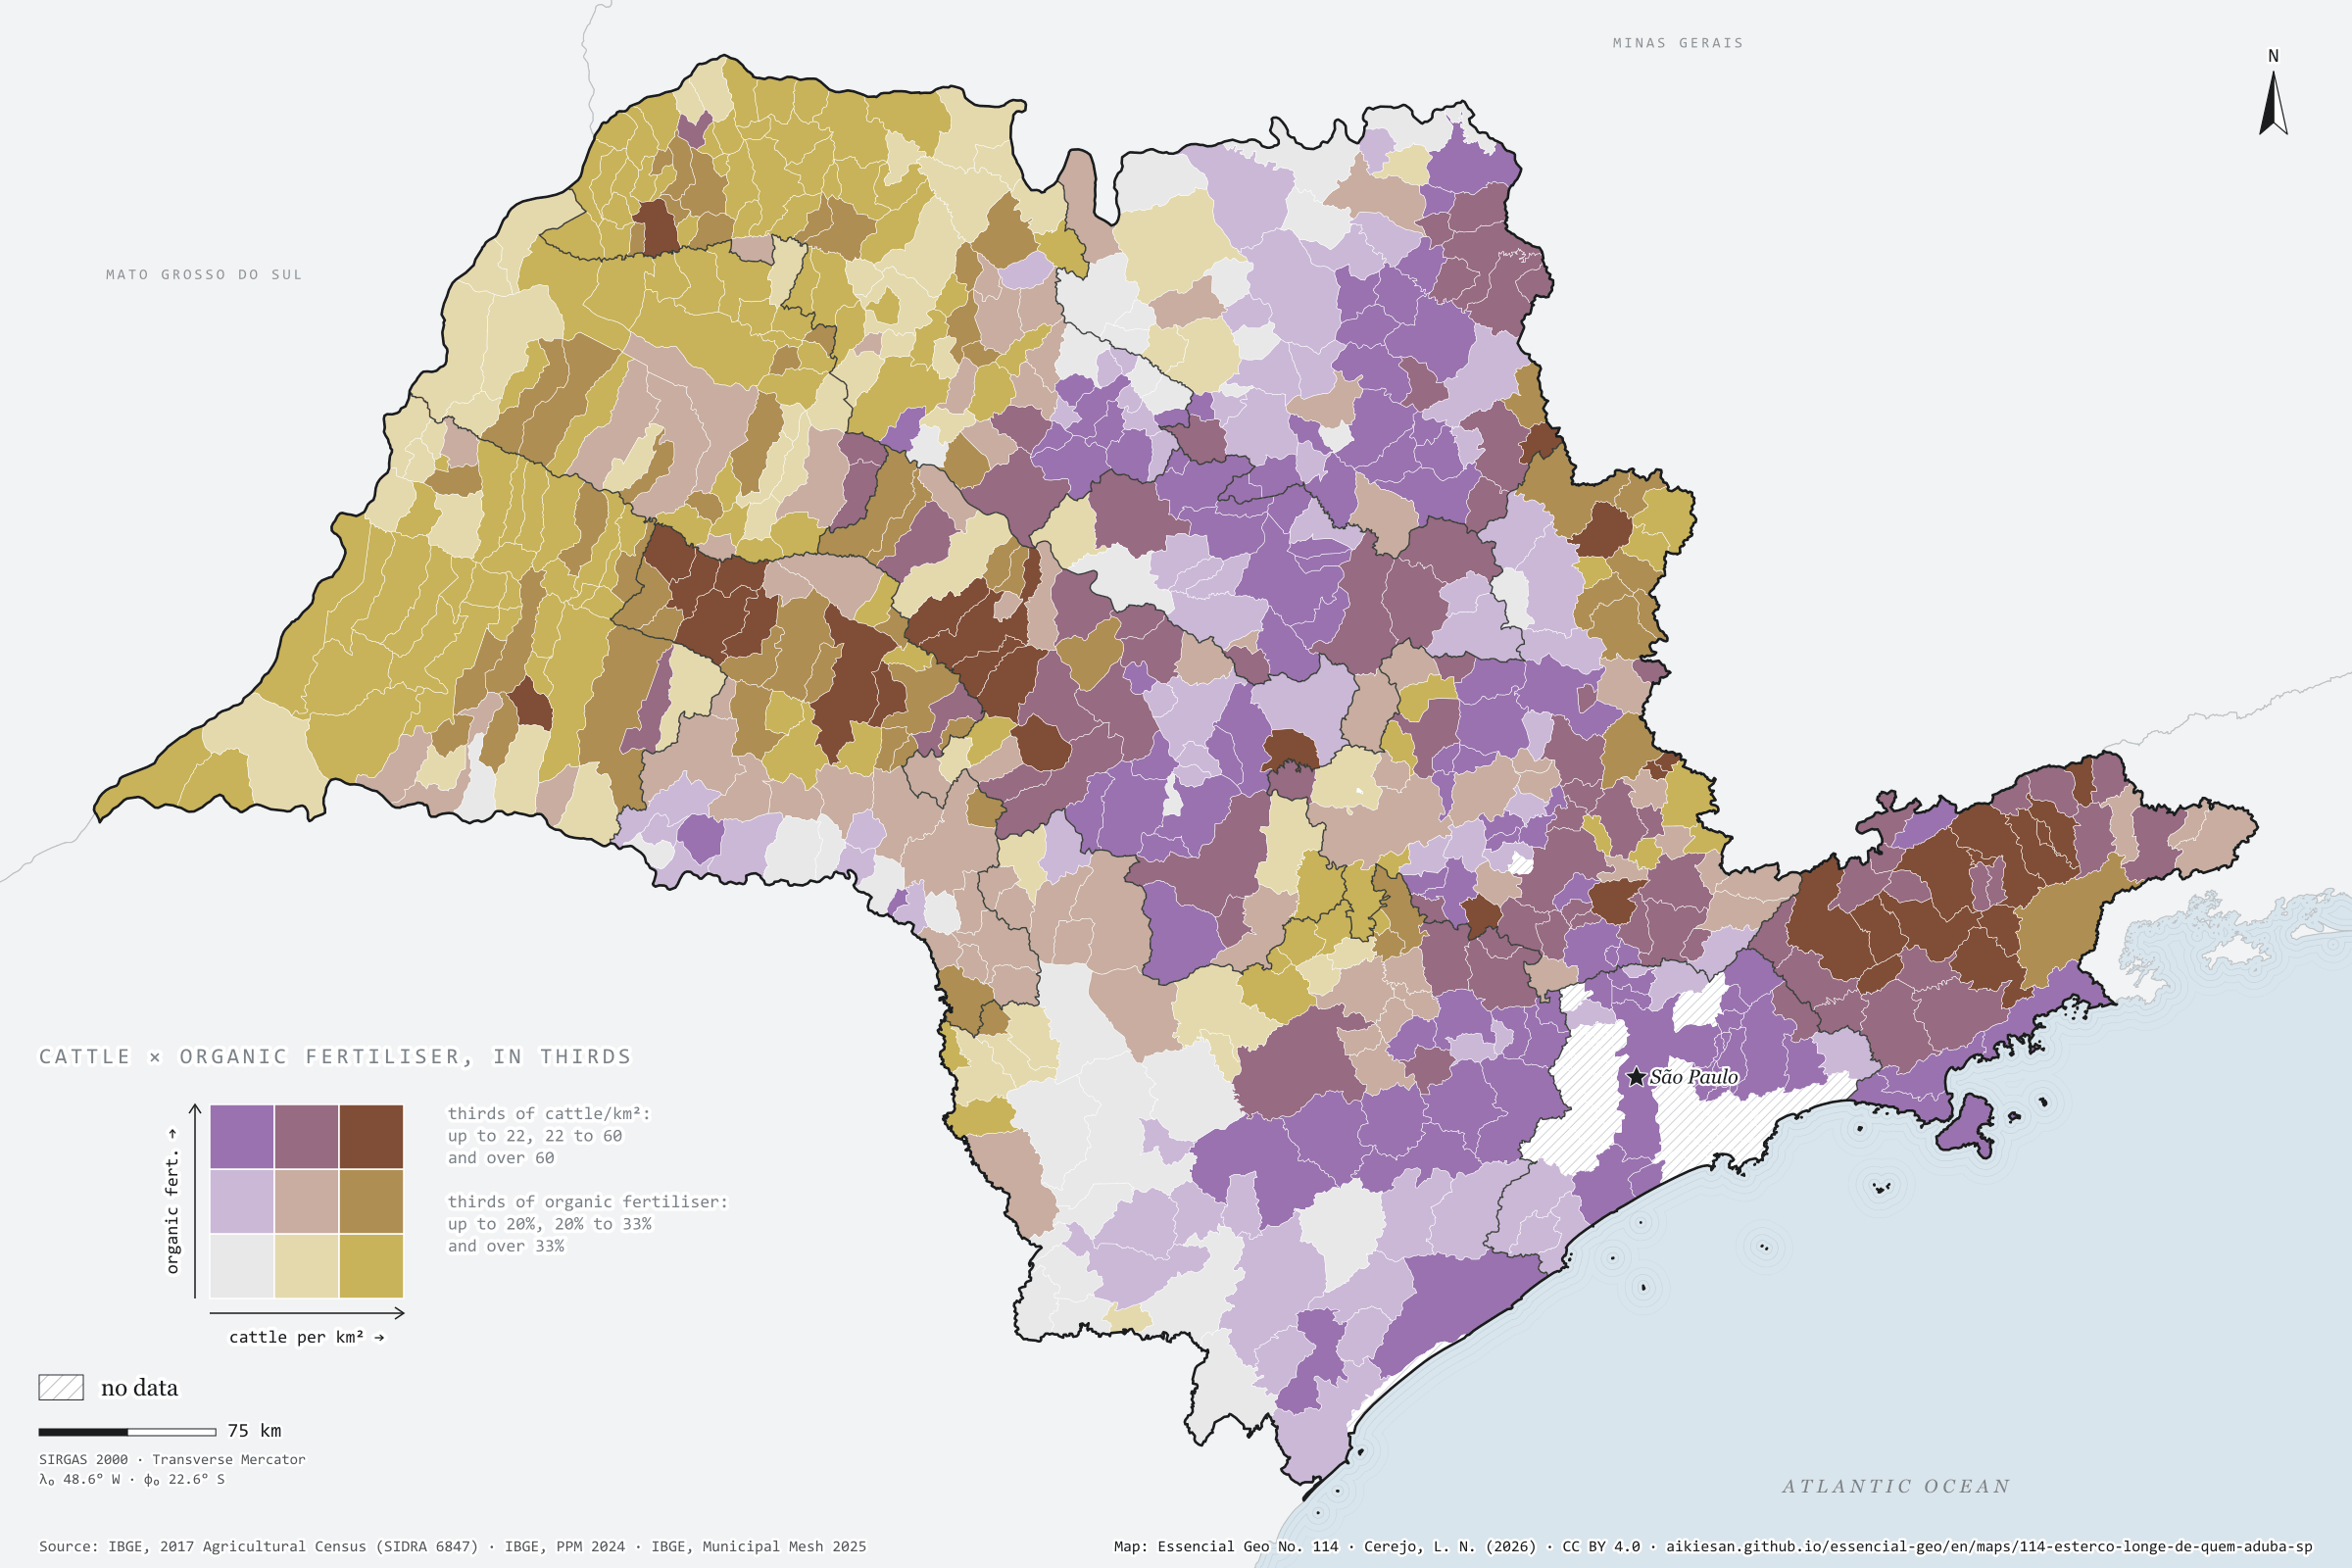
Where there are more cattle per km², fewer farms use organic fertiliser
Fig. 114São Paulo State (SP)EPSG:4674Source: IBGE
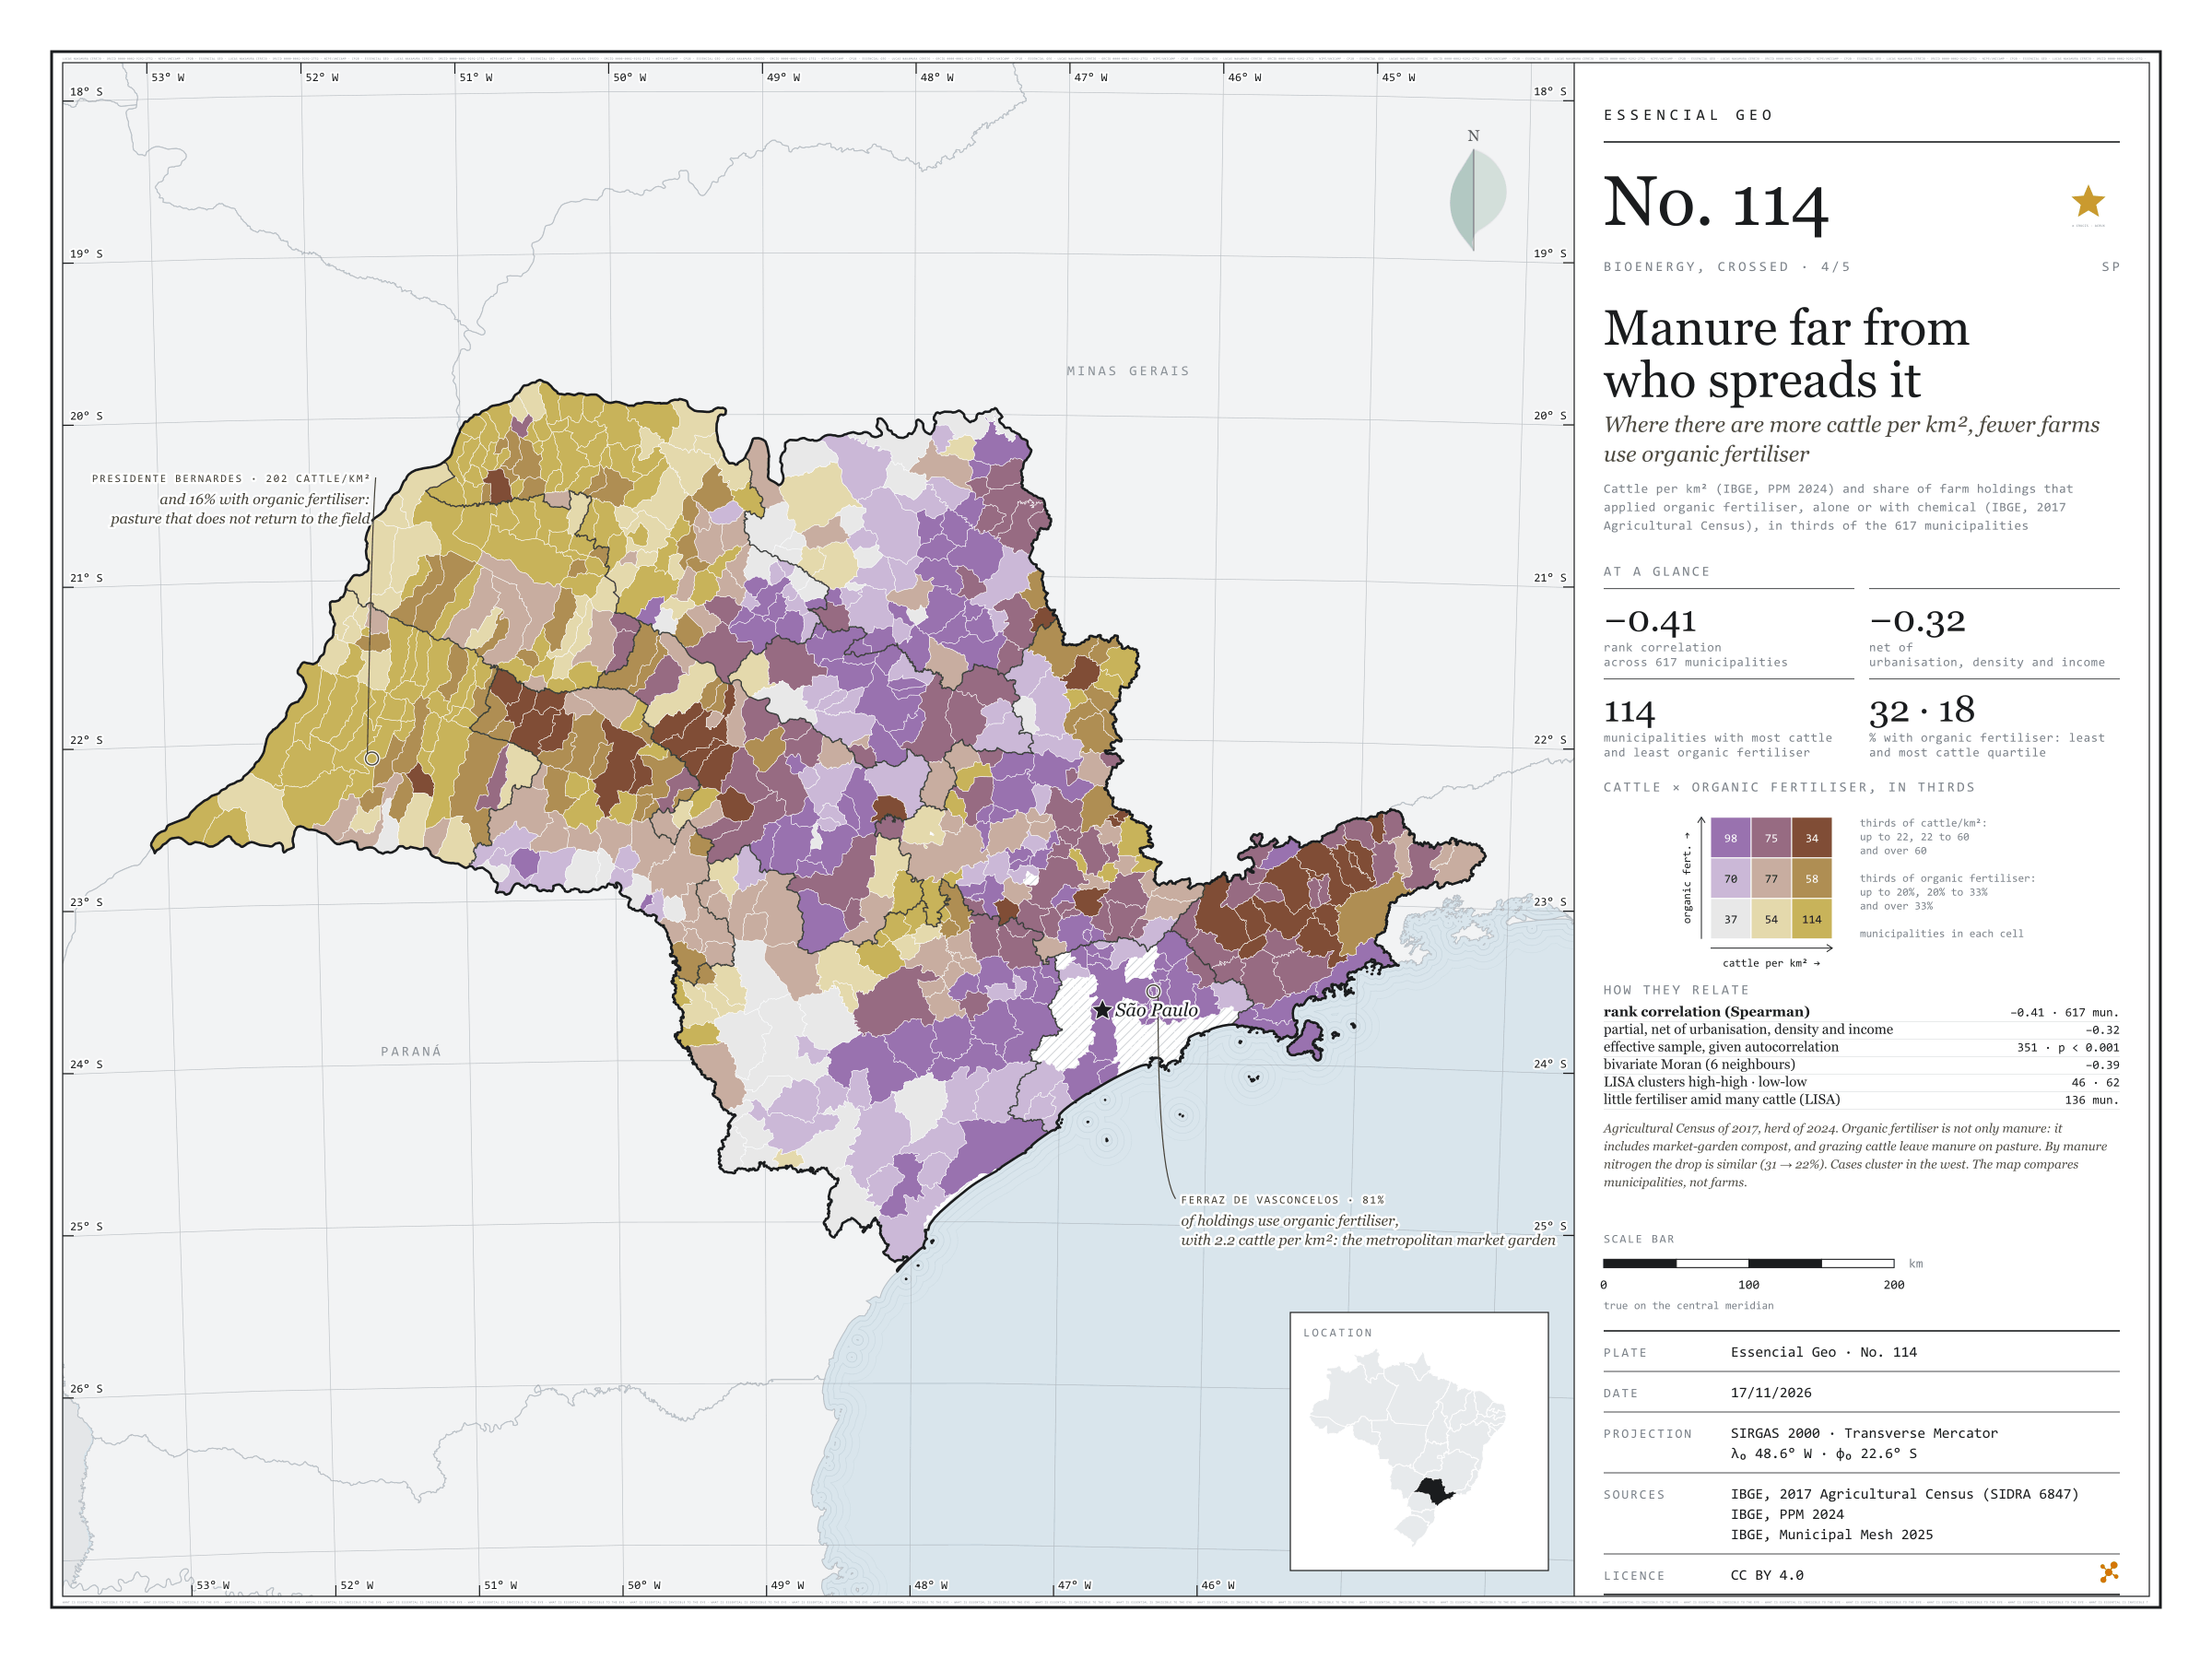
Where there are more cattle per km², fewer farm holdings use organic fertiliser. Across the 617 São Paulo municipalities with data, the rank correlation between the 2024 cattle herd and the share of holdings that applied organic fertiliser in the 2017 Agricultural Census is −0.41, and −0.32 net of urbanisation, density and income. In the quarter of municipalities with fewest cattle, the median is 32%; in the quarter with most, 18%. Grazing cattle leave their manure on pasture, and organic fertiliser includes compost from market gardens near towns: Ferraz de Vasconcelos, with 2.2 cattle per km², has 81%; Presidente Bernardes, with 202, 16%. Fourth plate of the collection “Bioenergy, crossed”.
Technical record · downloads · citation
At a glance
Rank correlation between cattle and organic fertiliser
-0.4
partial −0.32; 617 municipalities
Holdings using organic fertiliser, most-cattle quarter (median)
18%
32% in the fewest-cattle quarter
Municipalities with little fertiliser amid many cattle (LISA)
136municipalities
mostly in São José do Rio Preto (50) and Presidente Prudente (36)
Layers
municipiospolygon645 municipalities with the variables of all five plates, the bivariate classes and the LISA clusters (same GPKG as plates 111 to 115)
gasodutoslineGas transmission pipelines and distribution network (EPE)
regioes_intermediariaspolygon11 intermediate geographic regions
Cattle per km² (IBGE, PPM 2024) and share of farm holdings that applied organic fertiliser, alone or with chemical (IBGE, 2017 Agricultural Census), each in thirds of municipalities, crossed in a 3 × 3 bivariate map; Spearman rank correlations, raw and partial, and bivariate LISA.
The map without a frame, with legend, scale, reference system and credit written on it: ready for papers, lectures and slides. In two versions: with the basemap (neighbours and sea) or only the mapped area, on white.
CEREJO, Lucas Nakamura. O esterco longe de quem aduba: onde há mais boi por km², menos estabelecimentos usam adubo orgânico. Versão 1.0.0. [S. l.]: Essencial, 2026. Conjunto de dados. Disponível em: https://aikiesan.github.io/essencial-geo/en/maps/114-esterco-longe-de-quem-aduba-sp/. Acesso em: 10 nov. 2026.
Cerejo, L. N. (2026). O esterco longe de quem aduba: onde há mais boi por km², menos estabelecimentos usam adubo orgânico [Manure far from who spreads it: Where there are more cattle per km², fewer farms use organic fertiliser] (Version 1.0.0) [Data set]. Essencial. https://aikiesan.github.io/essencial-geo/en/maps/114-esterco-longe-de-quem-aduba-sp/
@dataset{cerejo2026_esterco_longe_de_quem_aduba_sp,
  author    = {Cerejo, Lucas Nakamura},
  title     = {O esterco longe de quem aduba: Onde há mais boi por km², menos estabelecimentos usam adubo orgânico},
  year      = {2026},
  publisher = {Essencial},
  version   = {1.0.0},
  url       = {https://aikiesan.github.io/essencial-geo/en/maps/114-esterco-longe-de-quem-aduba-sp/},
  language  = {portuguese},
  note      = {English title: Manure far from who spreads it: Where there are more cattle per km², fewer farms use organic fertiliser. Licence CC BY 4.0}
}
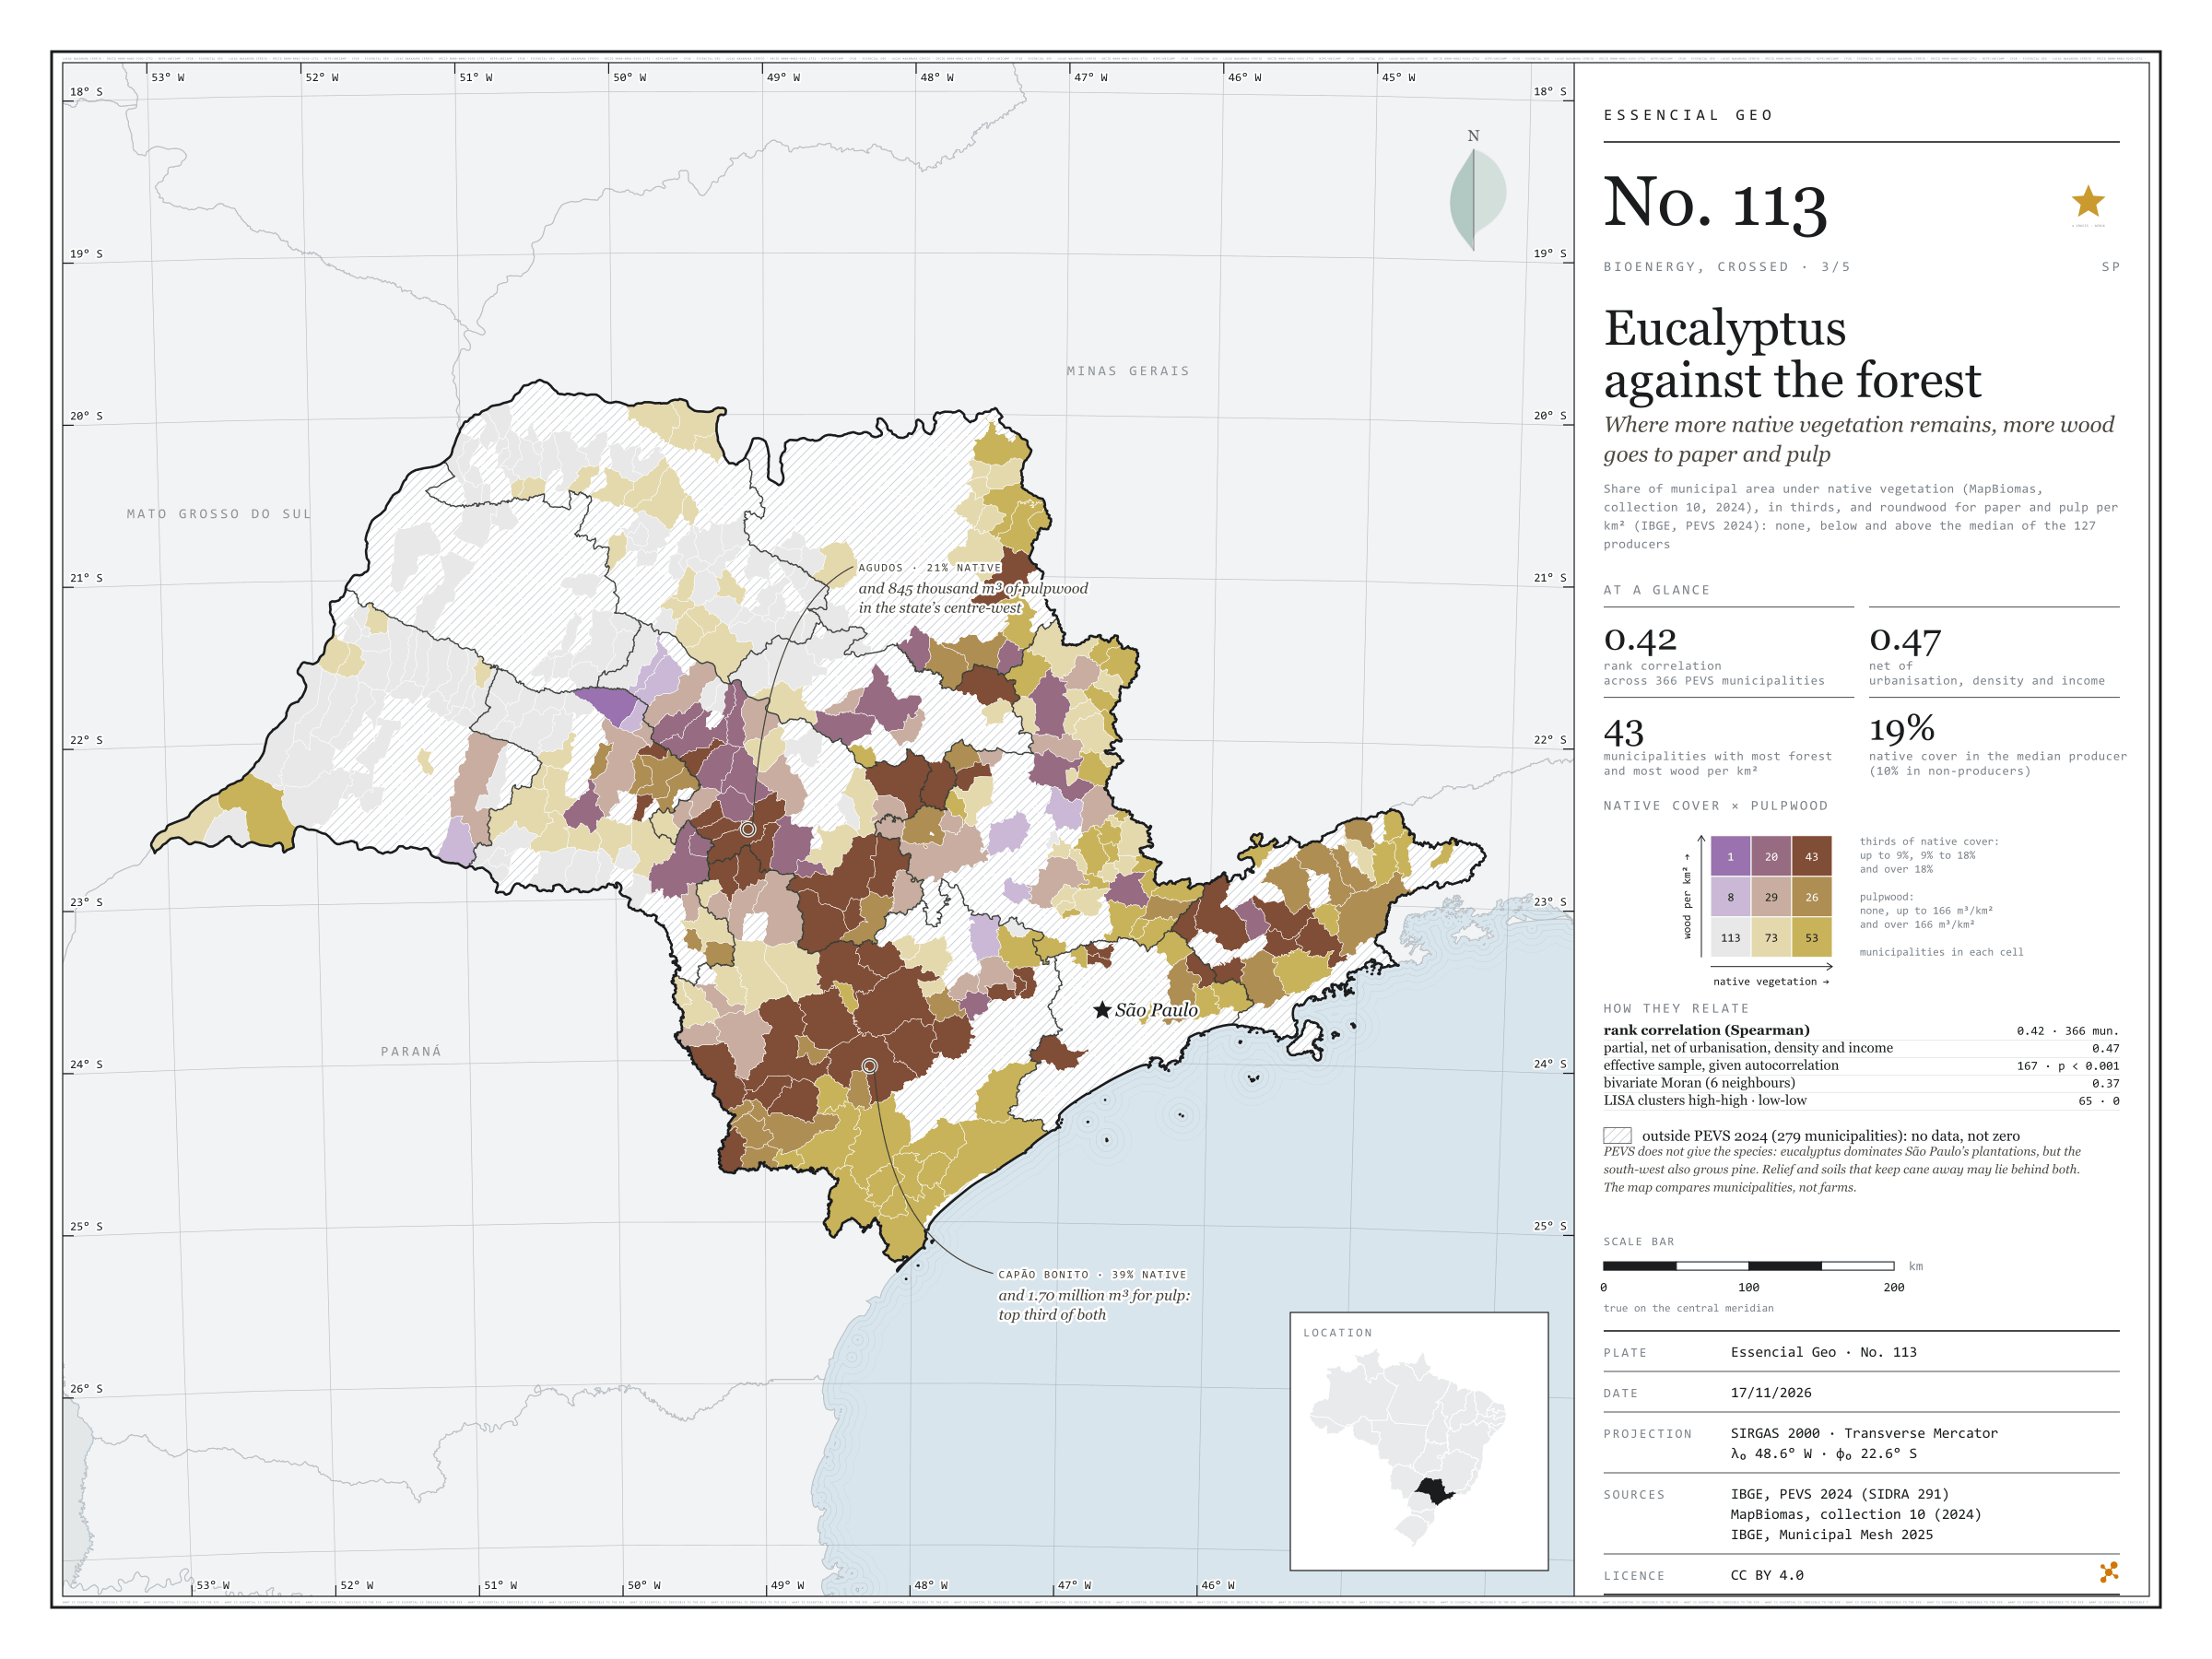
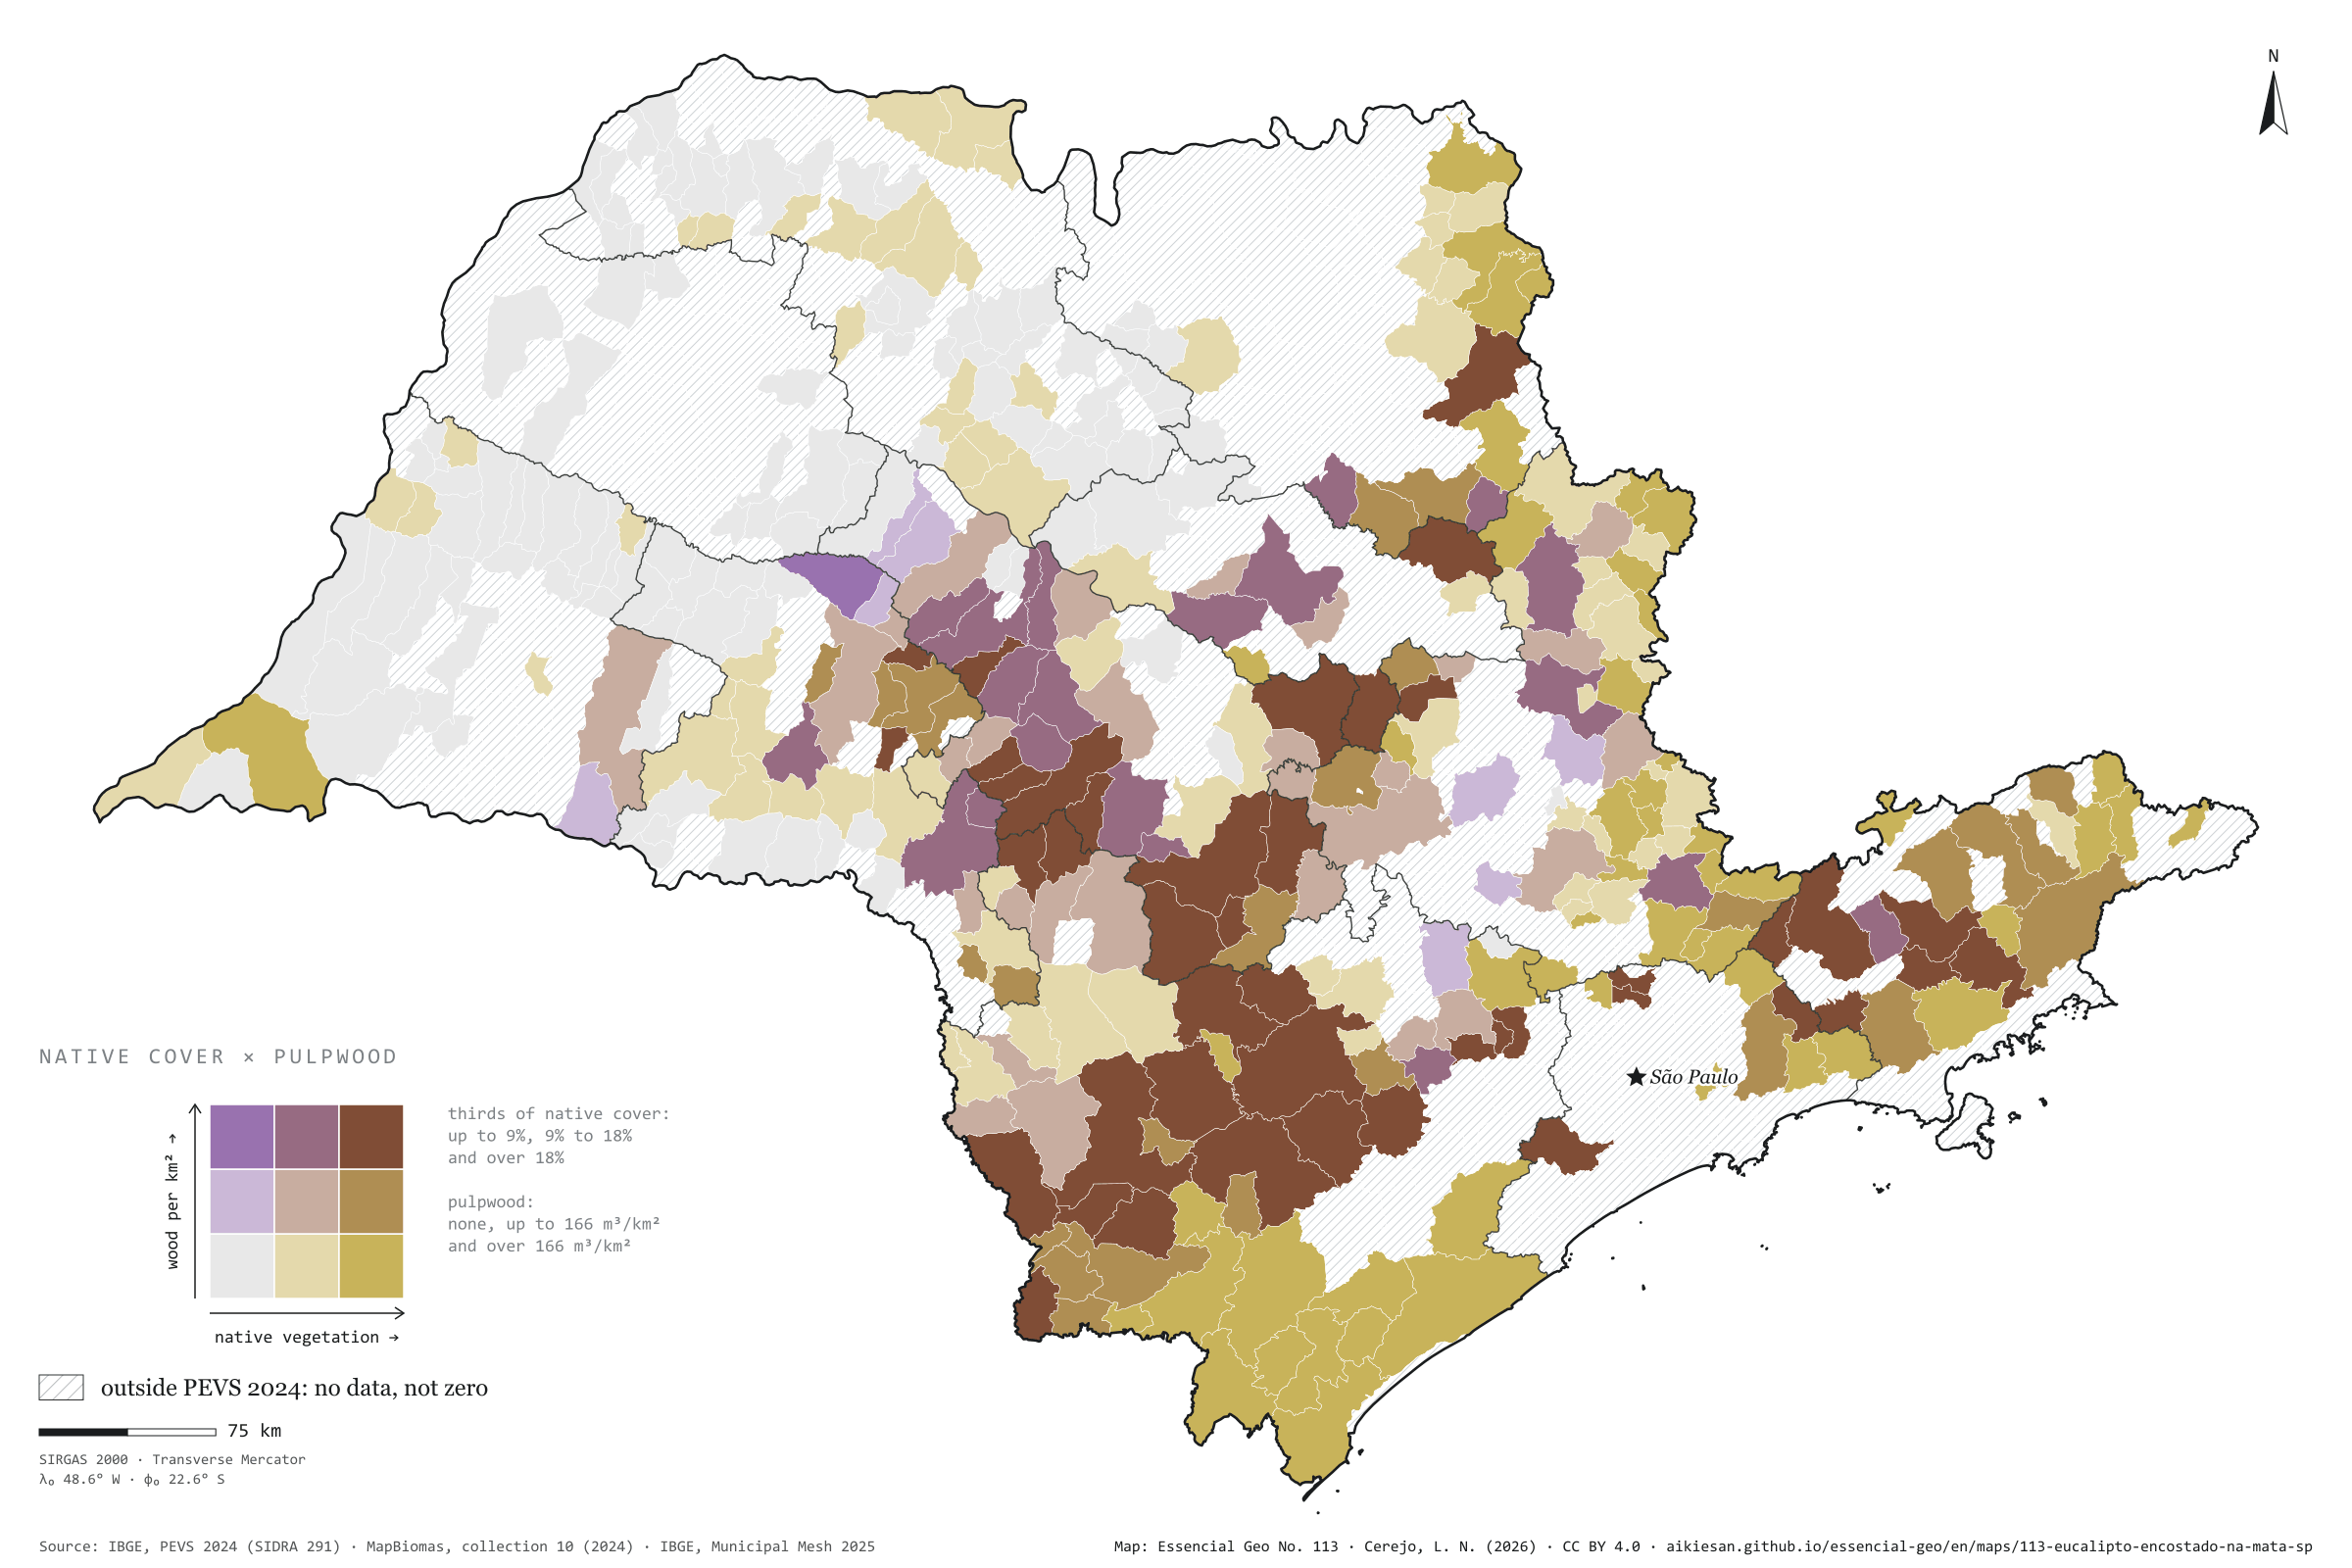
Where more native vegetation remains, more wood goes to paper and pulp
Fig. 113São Paulo State (SP)EPSG:4674Source: IBGE, MapBiomas
In São Paulo municipalities that harvest plantation wood for paper and pulp, the more native vegetation remains, the more wood comes out per km². Across the 366 municipalities in PEVS 2024, the rank correlation is 0.42, and 0.47 net of urbanisation, density and income. The median producer has 18.7% of its area under native vegetation; surveyed municipalities that do not produce, 9.8%. The 127 producers harvested 24.8 million m³, mostly in the south-west, around Sorocaba, and the centre-west, around Bauru. Capão Bonito combines 39% native cover with 1.70 million m³. Relief and soils that keep cane away may lie behind both. Third plate of the collection “Bioenergy, crossed”.
Technical record · downloads · citation
At a glance
Rank correlation between native cover and pulpwood
0.4
partial 0.47; 366 PEVS municipalities
Native cover in the median producer
19%
9.8% in non-producers
Pulpwood in 2024
25million m³
127 producing municipalities
Layers
municipiospolygon645 municipalities with the variables of all five plates, the bivariate classes and the LISA clusters (same GPKG as plates 111 to 115)
gasodutoslineGas transmission pipelines and distribution network (EPE)
regioes_intermediariaspolygon11 intermediate geographic regions
Share of municipal area under native vegetation (MapBiomas, collection 10, 2024), in thirds, crossed with plantation roundwood for paper and pulp per km² (IBGE, PEVS 2024): none, below and above the producers’ median; 3 × 3 bivariate map only in PEVS municipalities; Spearman rank correlations, raw and partial, and bivariate LISA.
The map without a frame, with legend, scale, reference system and credit written on it: ready for papers, lectures and slides. In two versions: with the basemap (neighbours and sea) or only the mapped area, on white.
CEREJO, Lucas Nakamura. Eucalipto encostado na mata: onde sobra mais vegetação nativa, mais madeira sai para o papel e a celulose. Versão 1.0.0. [S. l.]: Essencial, 2026. Conjunto de dados. Disponível em: https://aikiesan.github.io/essencial-geo/en/maps/113-eucalipto-encostado-na-mata-sp/. Acesso em: 10 nov. 2026.
Cerejo, L. N. (2026). Eucalipto encostado na mata: onde sobra mais vegetação nativa, mais madeira sai para o papel e a celulose [Eucalyptus against the forest: Where more native vegetation remains, more wood goes to paper and pulp] (Version 1.0.0) [Data set]. Essencial. https://aikiesan.github.io/essencial-geo/en/maps/113-eucalipto-encostado-na-mata-sp/
@dataset{cerejo2026_eucalipto_encostado_na_mata_sp,
  author    = {Cerejo, Lucas Nakamura},
  title     = {Eucalipto encostado na mata: Onde sobra mais vegetação nativa, mais madeira sai para o papel e a celulose},
  year      = {2026},
  publisher = {Essencial},
  version   = {1.0.0},
  url       = {https://aikiesan.github.io/essencial-geo/en/maps/113-eucalipto-encostado-na-mata-sp/},
  language  = {portuguese},
  note      = {English title: Eucalyptus against the forest: Where more native vegetation remains, more wood goes to paper and pulp. Licence CC BY 4.0}
}
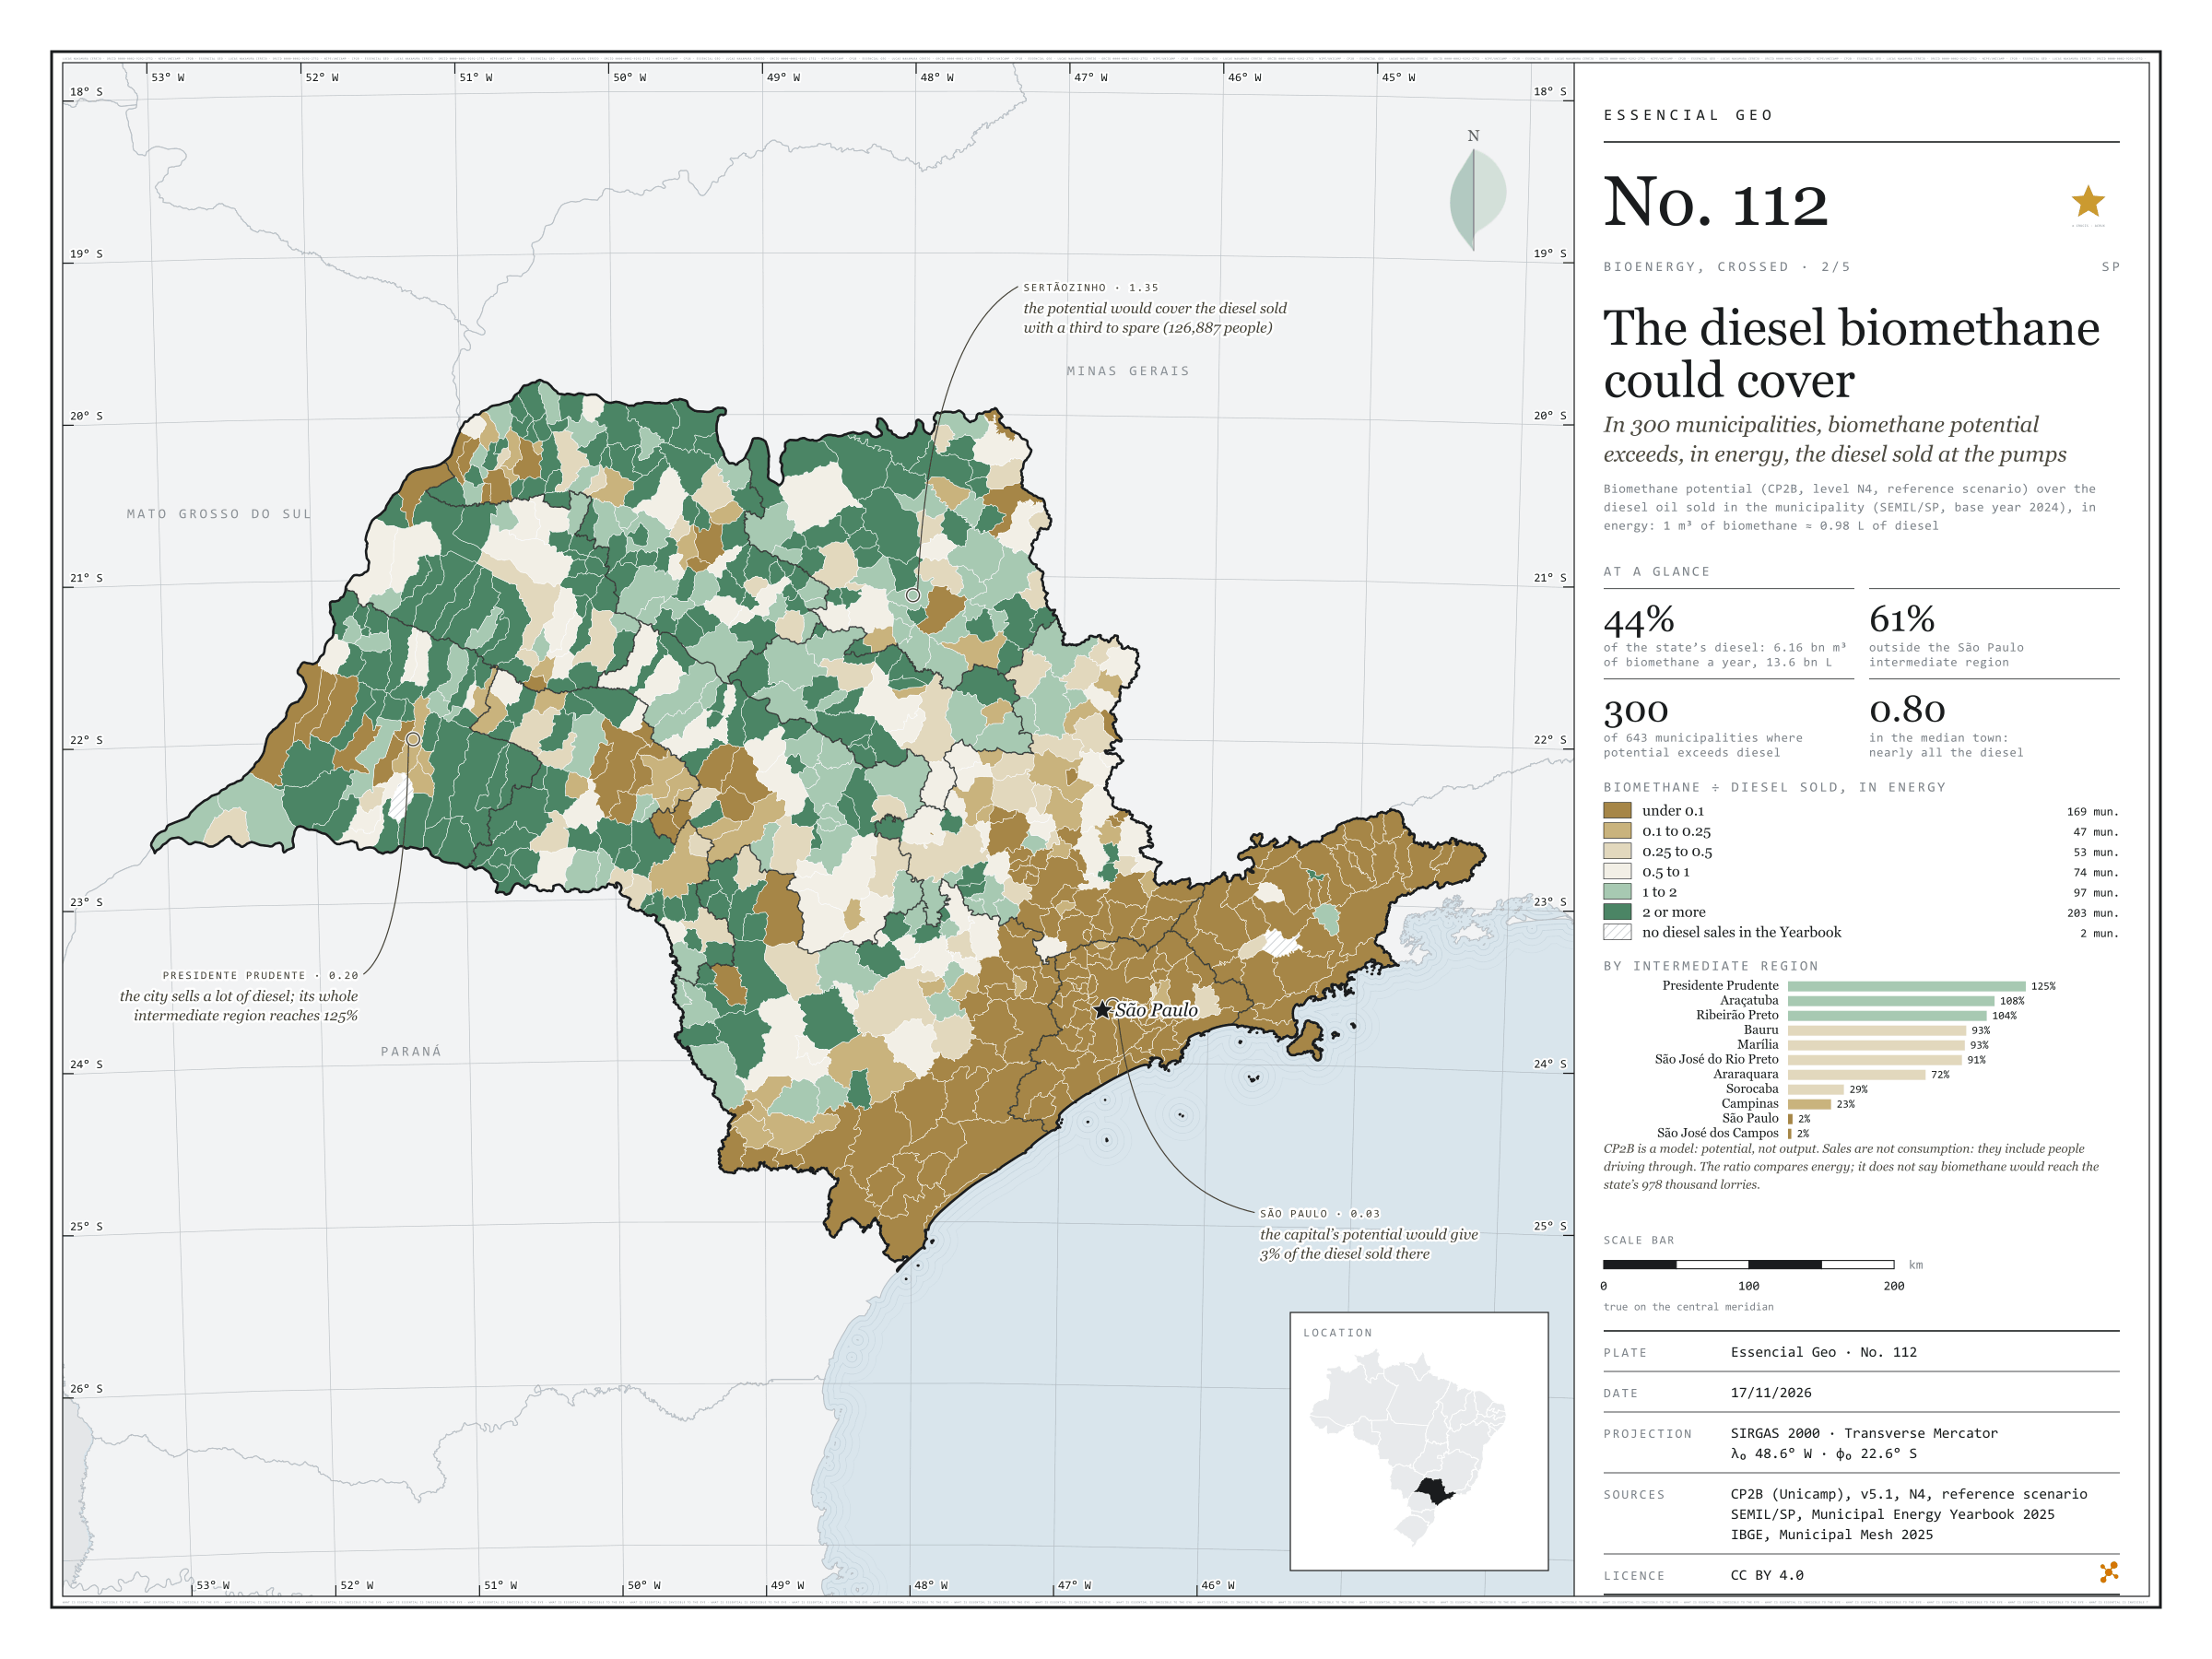
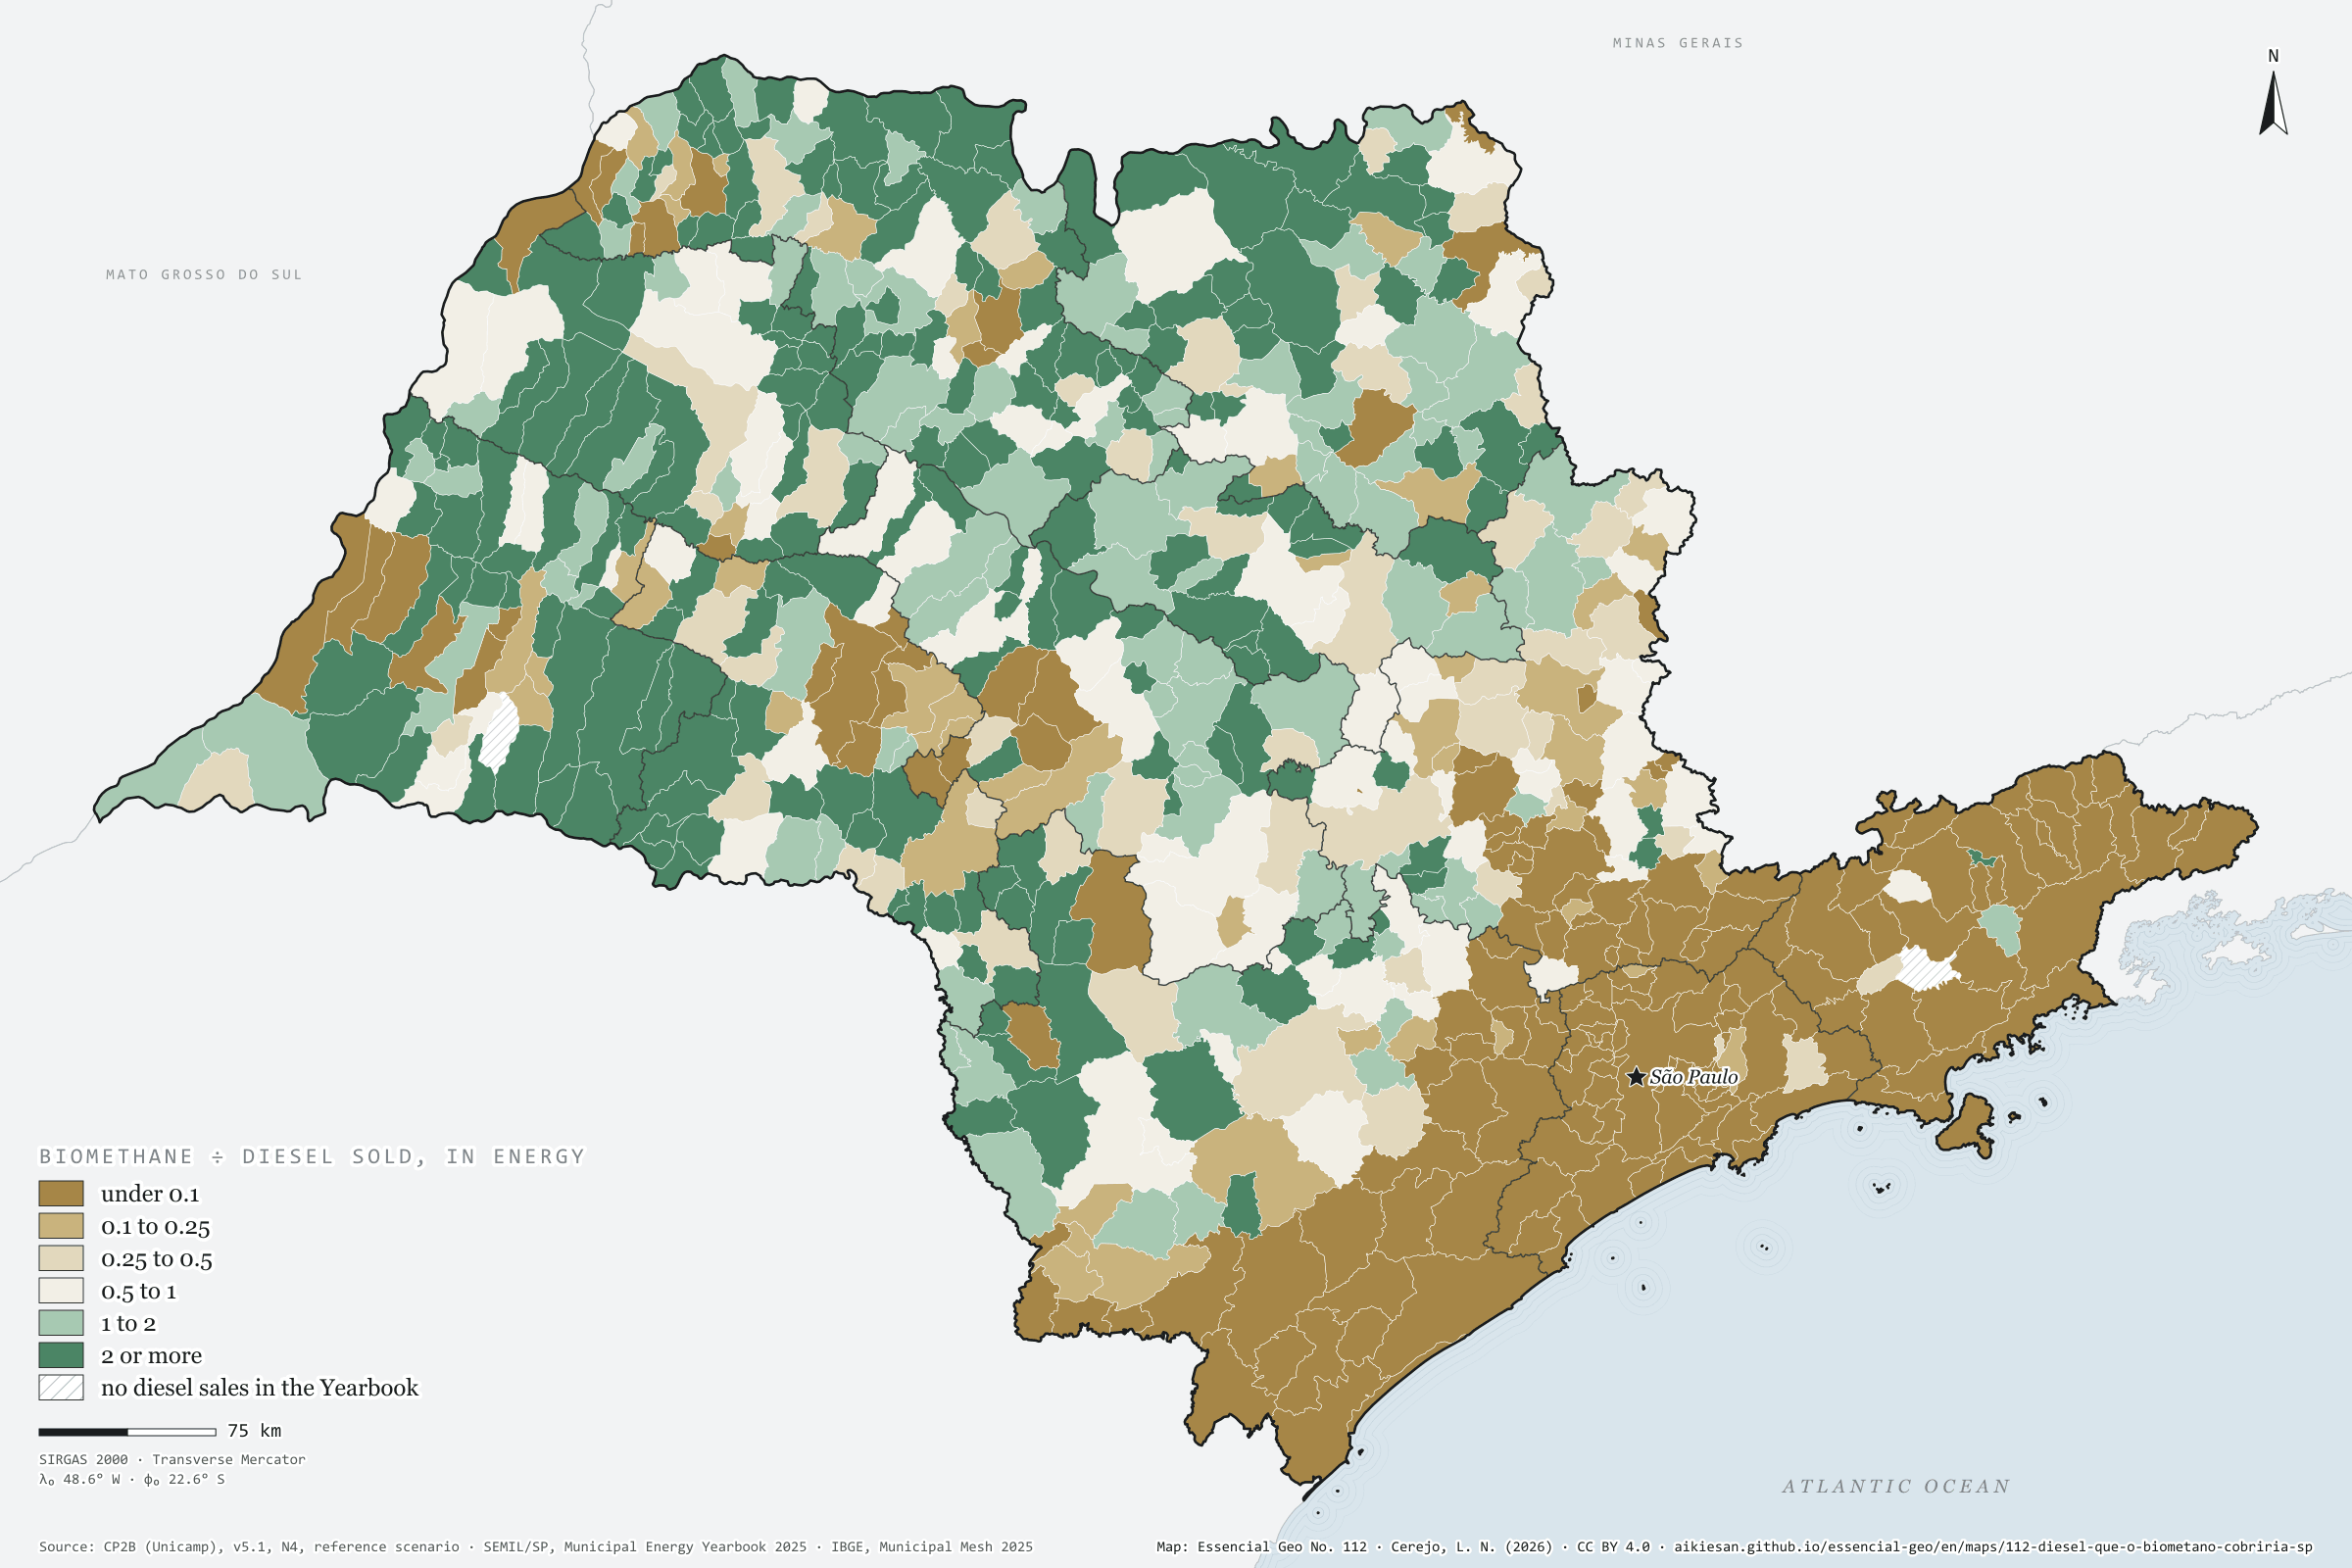
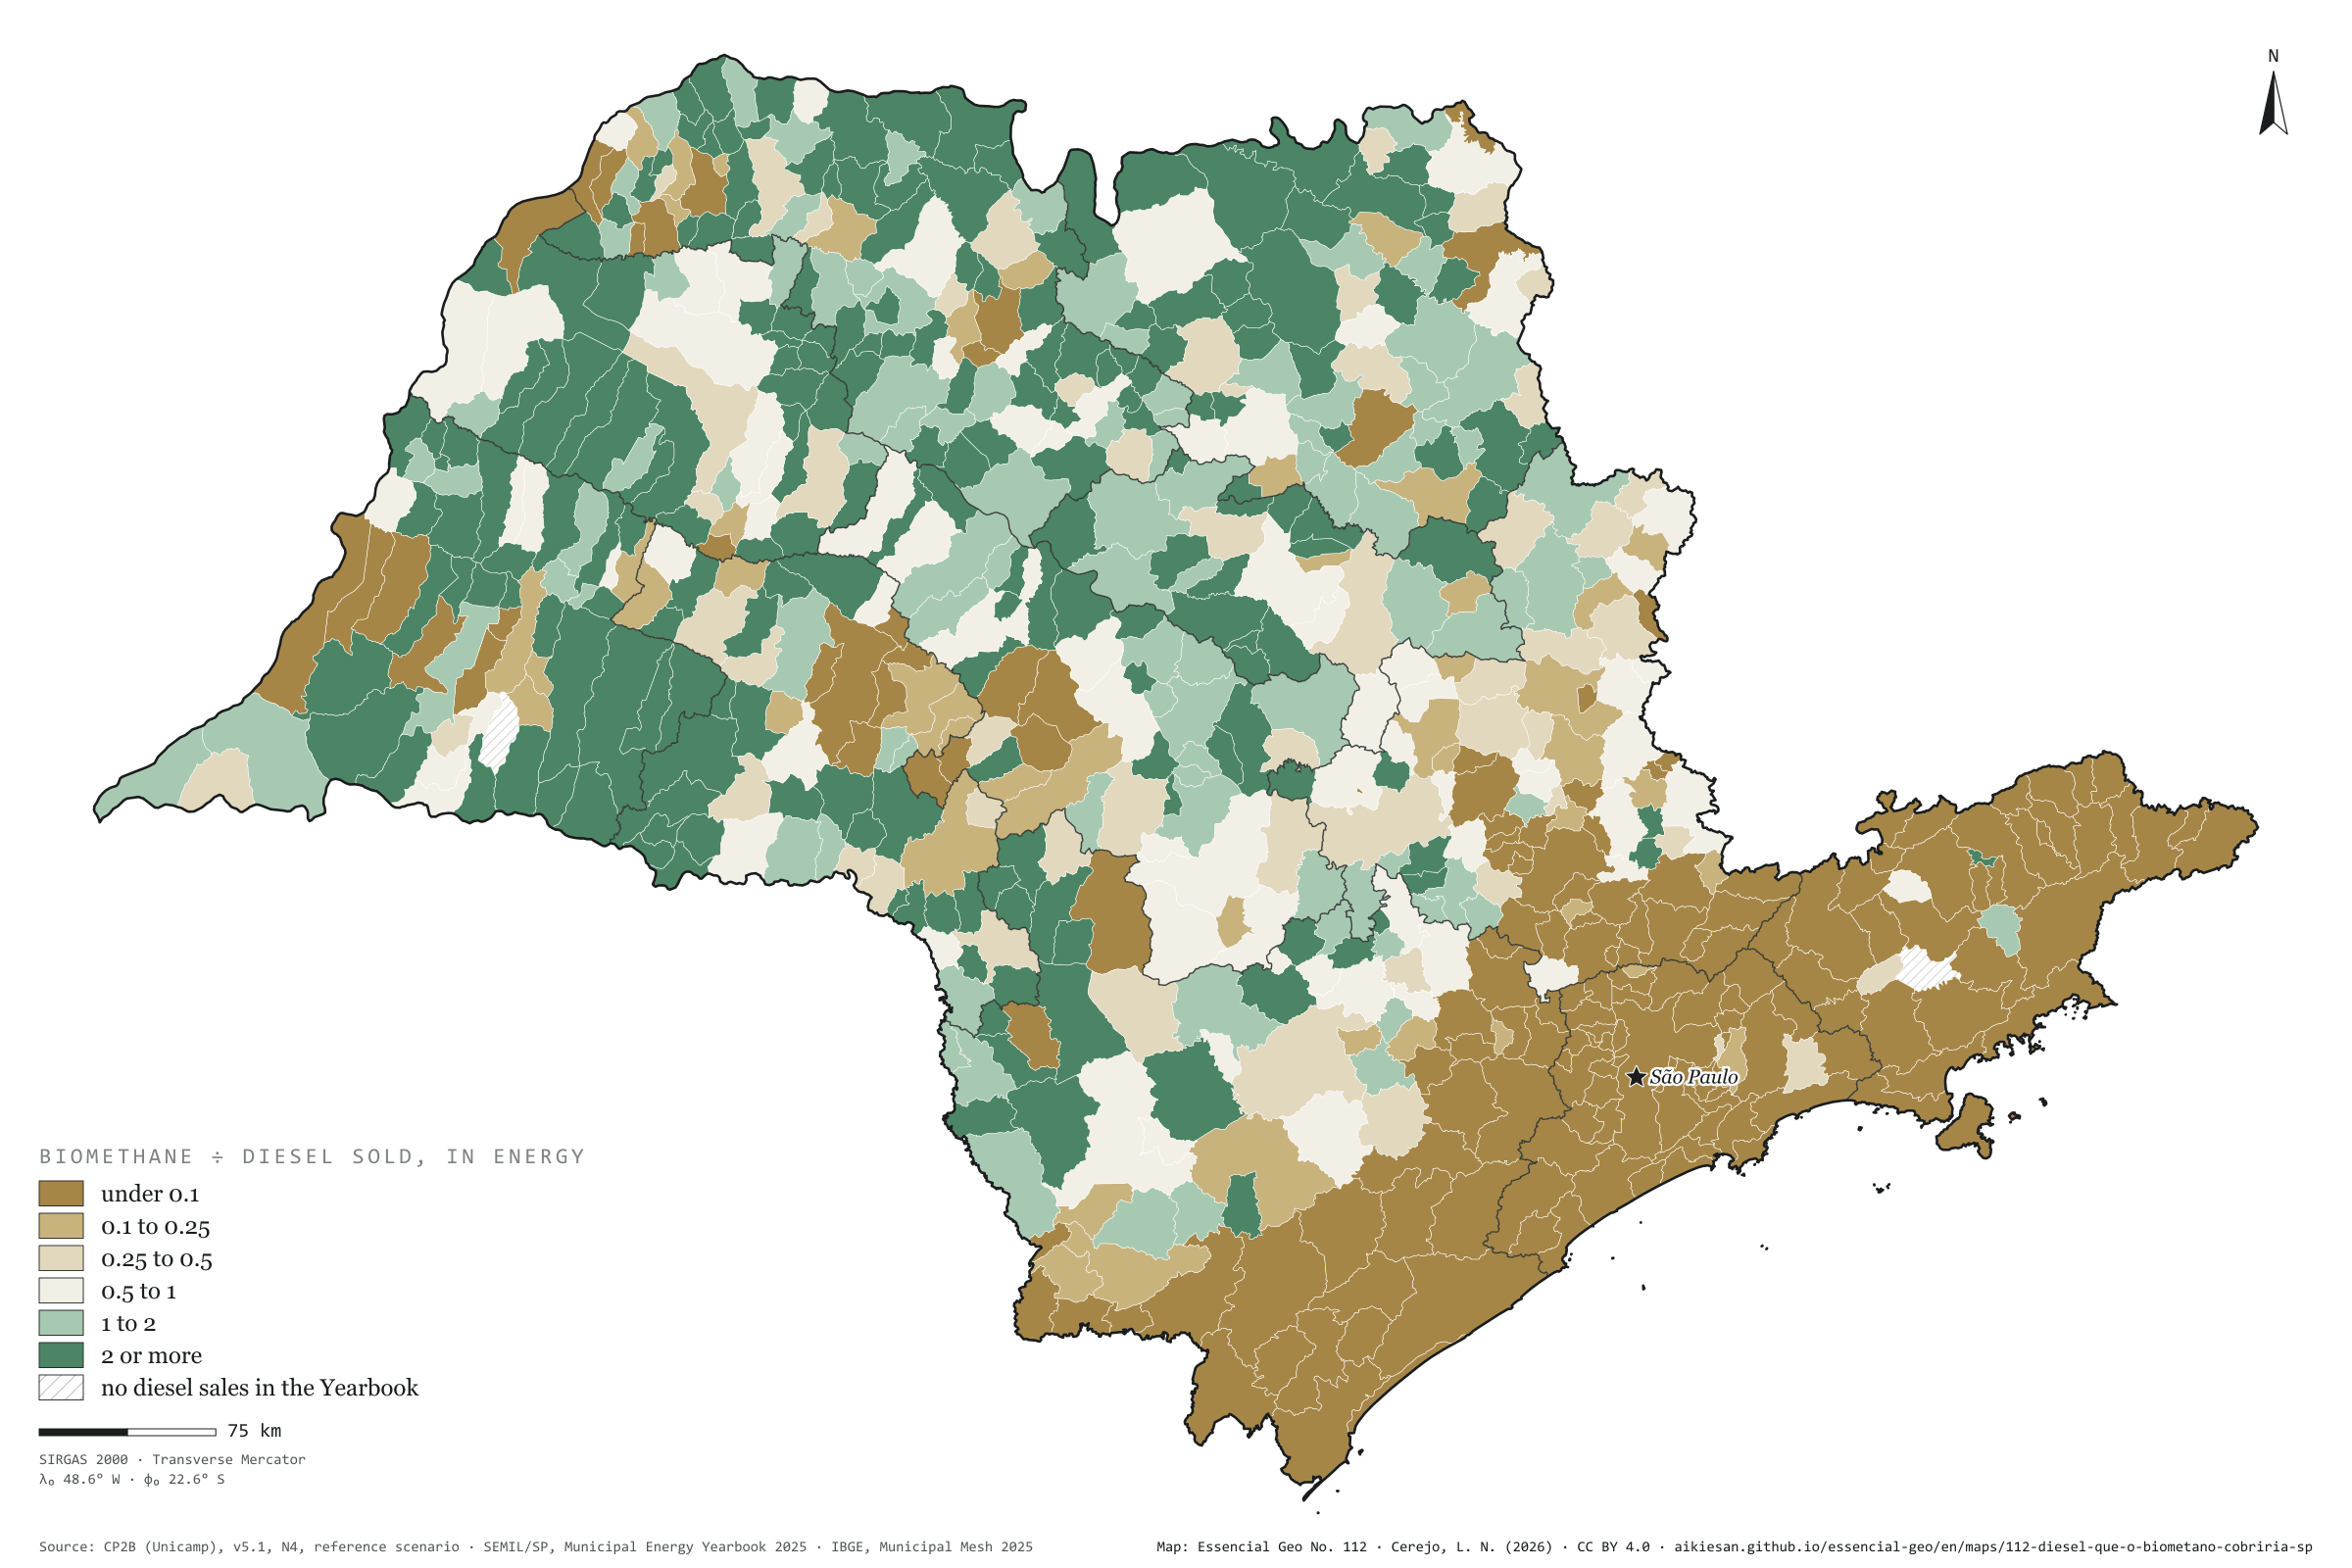
In 300 municipalities, biomethane potential exceeds, in energy, the diesel sold at the pumps
Fig. 112São Paulo State (SP)EPSG:4674Source: CP2B (Unicamp), SEMIL/SP, Municipal Energy Yearbook 2025 (base year 2024): sales of hydrous ethanol, petrol C, diesel oil and piped natural gas by municipality, SENATRAN, IBGE
If all of São Paulo’s accessible biomethane potential became fuel, 6.16 billion m³ a year, it would cover in energy 44% of the 13.6 billion litres of diesel sold in the state in 2024; outside the São Paulo intermediate region, 61%. In 300 of the 643 municipalities the potential exceeds the diesel sold, and in the median municipality it reaches 80%. Sertãozinho would cover its own diesel with a third to spare; the whole Presidente Prudente region reaches 125%; the capital, 3%. It is an energy sum, not a plan: CP2B is a model, and diesel sales are not consumption. Second plate of the collection “Bioenergy, crossed”.
Technical record · downloads · citation
At a glance
State diesel that biomethane could cover, in energy
44%
61% outside the São Paulo region
Municipalities where potential exceeds diesel sold
300municipalities
out of 643
Ratio in the median municipality
0.8
Layers
municipiospolygon645 municipalities with the variables of all five plates, the bivariate classes and the LISA clusters (same GPKG as plates 111 to 115)
gasodutoslineGas transmission pipelines and distribution network (EPE)
regioes_intermediariaspolygon11 intermediate geographic regions
CP2B biomethane potential (v5.1, level N4, reference scenario) in m³ a year, converted into energy-equivalent litres of diesel (1 m³ ≈ 0.98 L), over the diesel oil sold in the municipality (SEMIL/SP, base year 2024); six classes of the ratio; sums by intermediate region.
The map without a frame, with legend, scale, reference system and credit written on it: ready for papers, lectures and slides. In two versions: with the basemap (neighbours and sea) or only the mapped area, on white.
CEREJO, Lucas Nakamura. O diesel que o biometano cobriria: em 300 municípios, o potencial de biometano passa, em energia, do diesel que os postos vendem. Versão 1.0.0. [S. l.]: Essencial, 2026. Conjunto de dados. Disponível em: https://aikiesan.github.io/essencial-geo/en/maps/112-diesel-que-o-biometano-cobriria-sp/. Acesso em: 10 nov. 2026.
Cerejo, L. N. (2026). O diesel que o biometano cobriria: em 300 municípios, o potencial de biometano passa, em energia, do diesel que os postos vendem [The diesel biomethane could cover: In 300 municipalities, biomethane potential exceeds, in energy, the diesel sold at the pumps] (Version 1.0.0) [Data set]. Essencial. https://aikiesan.github.io/essencial-geo/en/maps/112-diesel-que-o-biometano-cobriria-sp/
@dataset{cerejo2026_diesel_que_o_biometano_cobriria_sp,
  author    = {Cerejo, Lucas Nakamura},
  title     = {O diesel que o biometano cobriria: Em 300 municípios, o potencial de biometano passa, em energia, do diesel que os postos vendem},
  year      = {2026},
  publisher = {Essencial},
  version   = {1.0.0},
  url       = {https://aikiesan.github.io/essencial-geo/en/maps/112-diesel-que-o-biometano-cobriria-sp/},
  language  = {portuguese},
  note      = {English title: The diesel biomethane could cover: In 300 municipalities, biomethane potential exceeds, in energy, the diesel sold at the pumps. Licence CC BY 4.0}
}
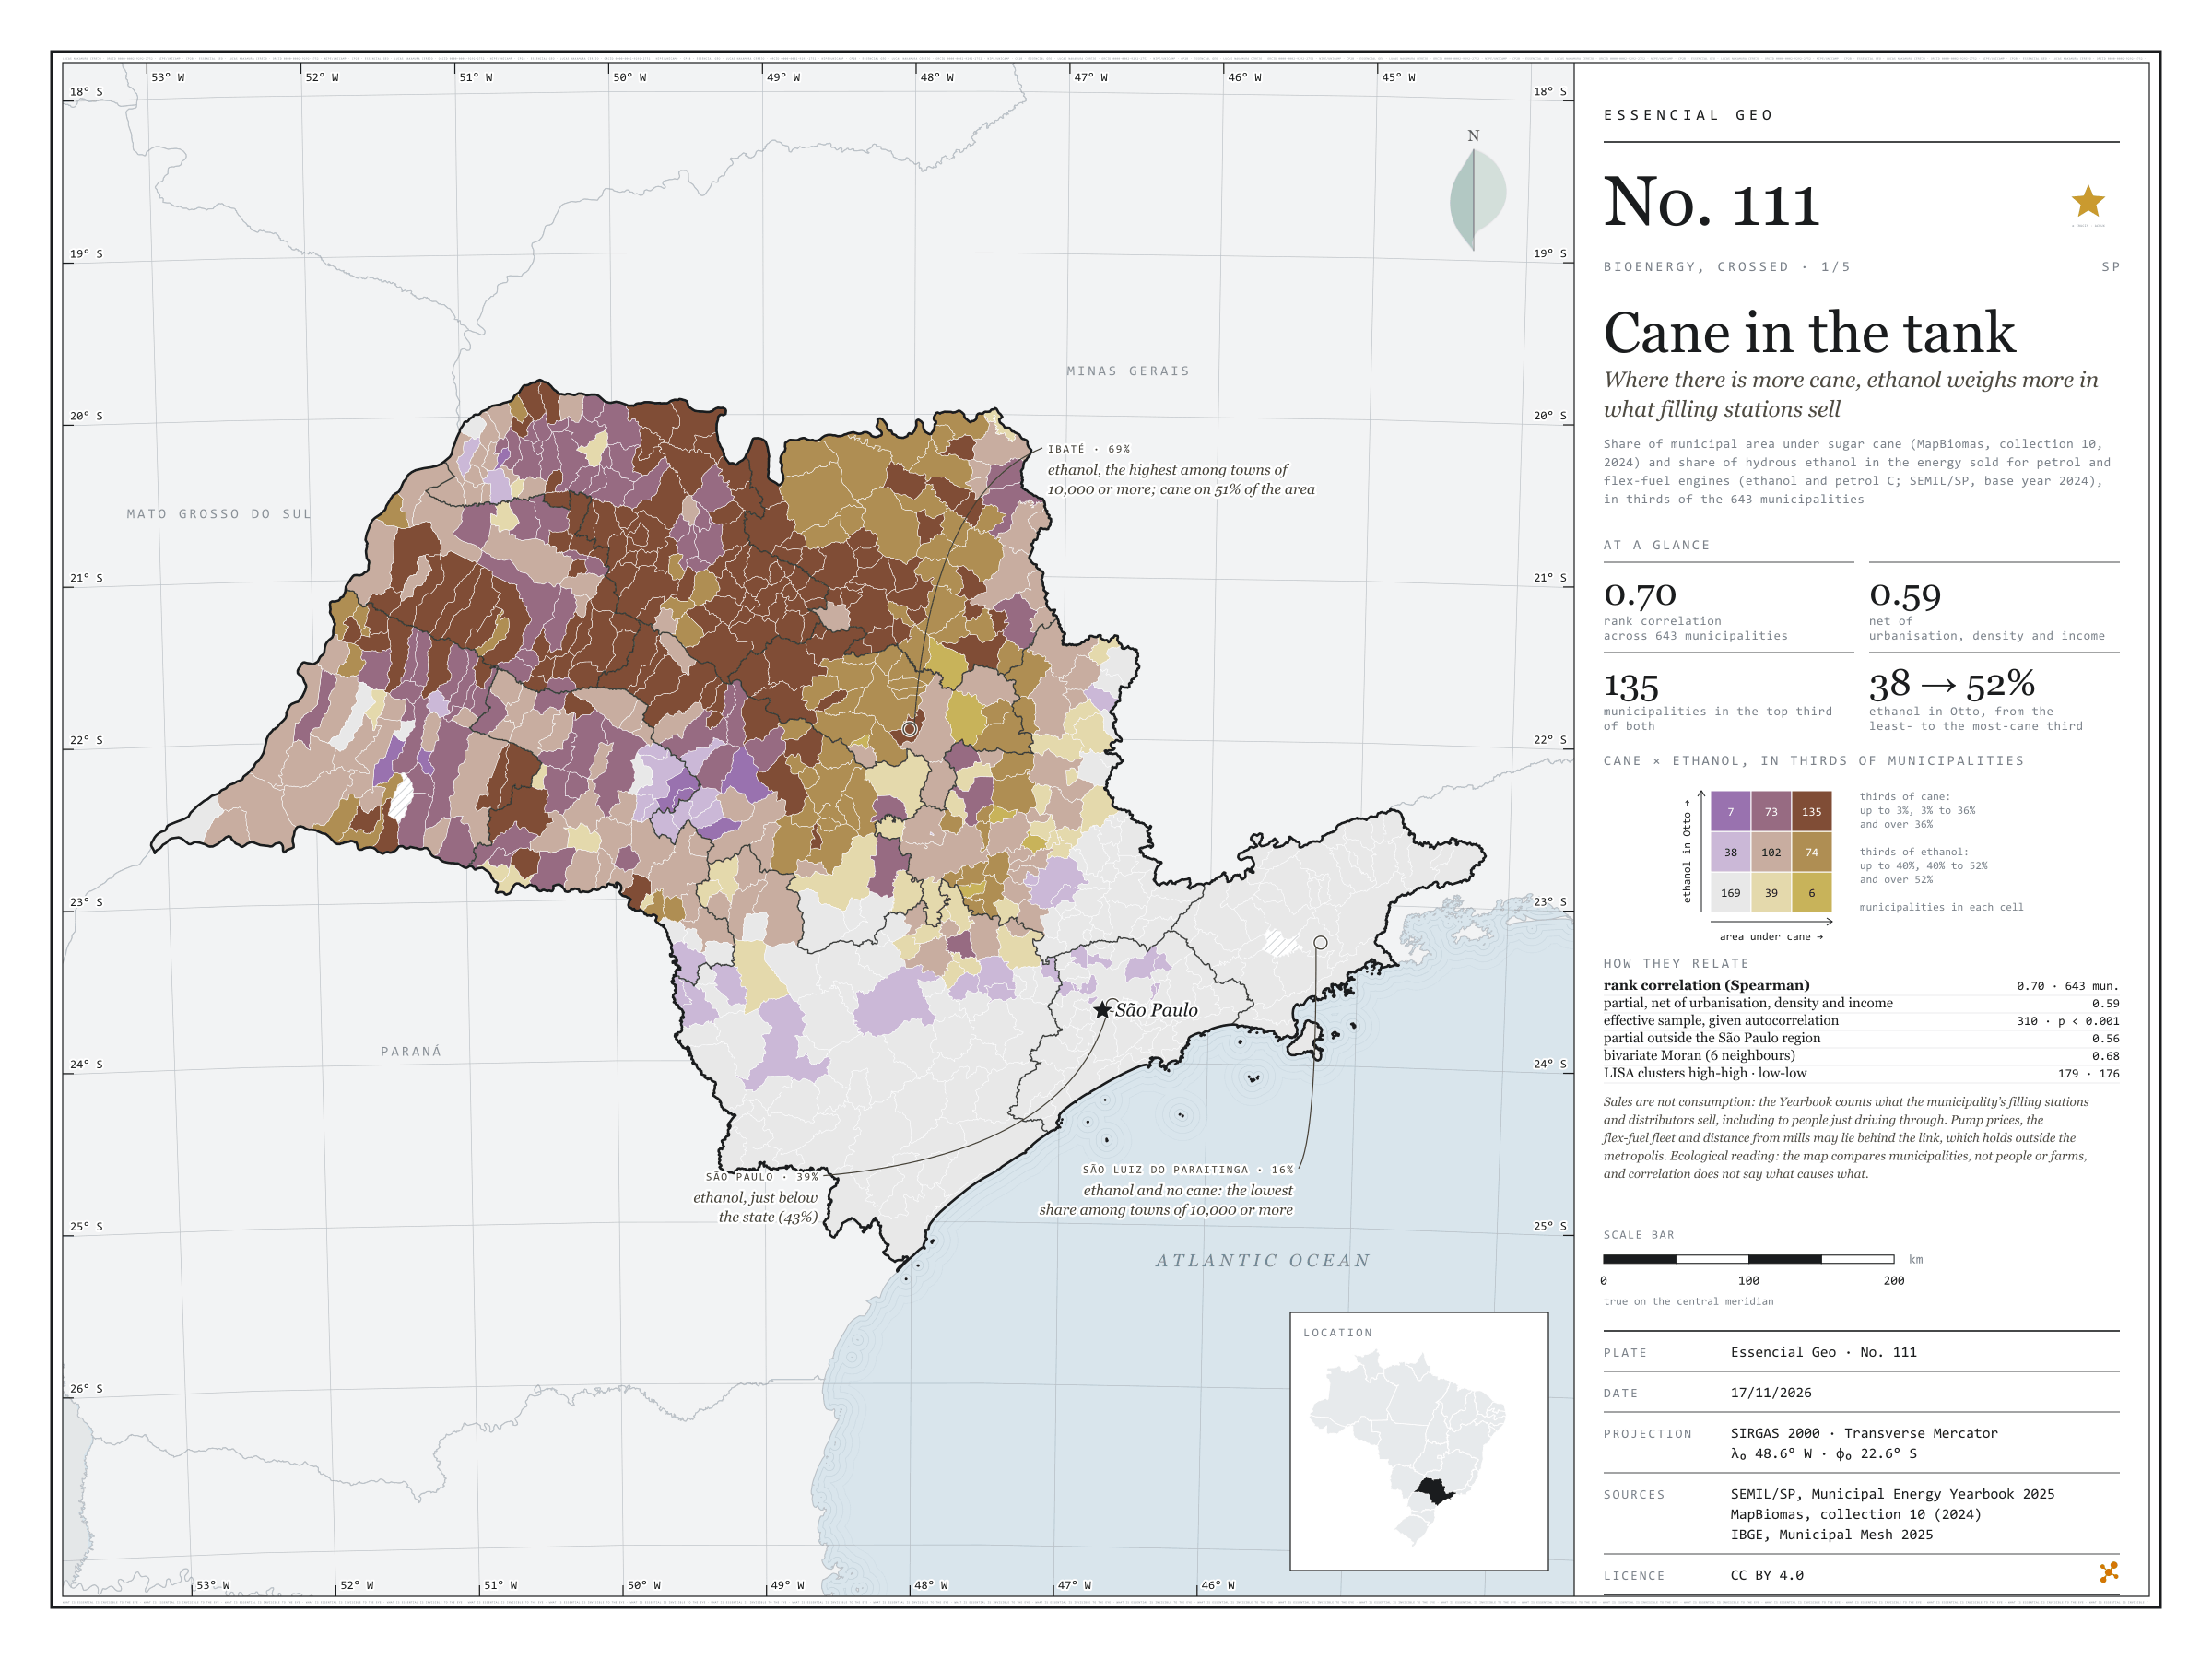
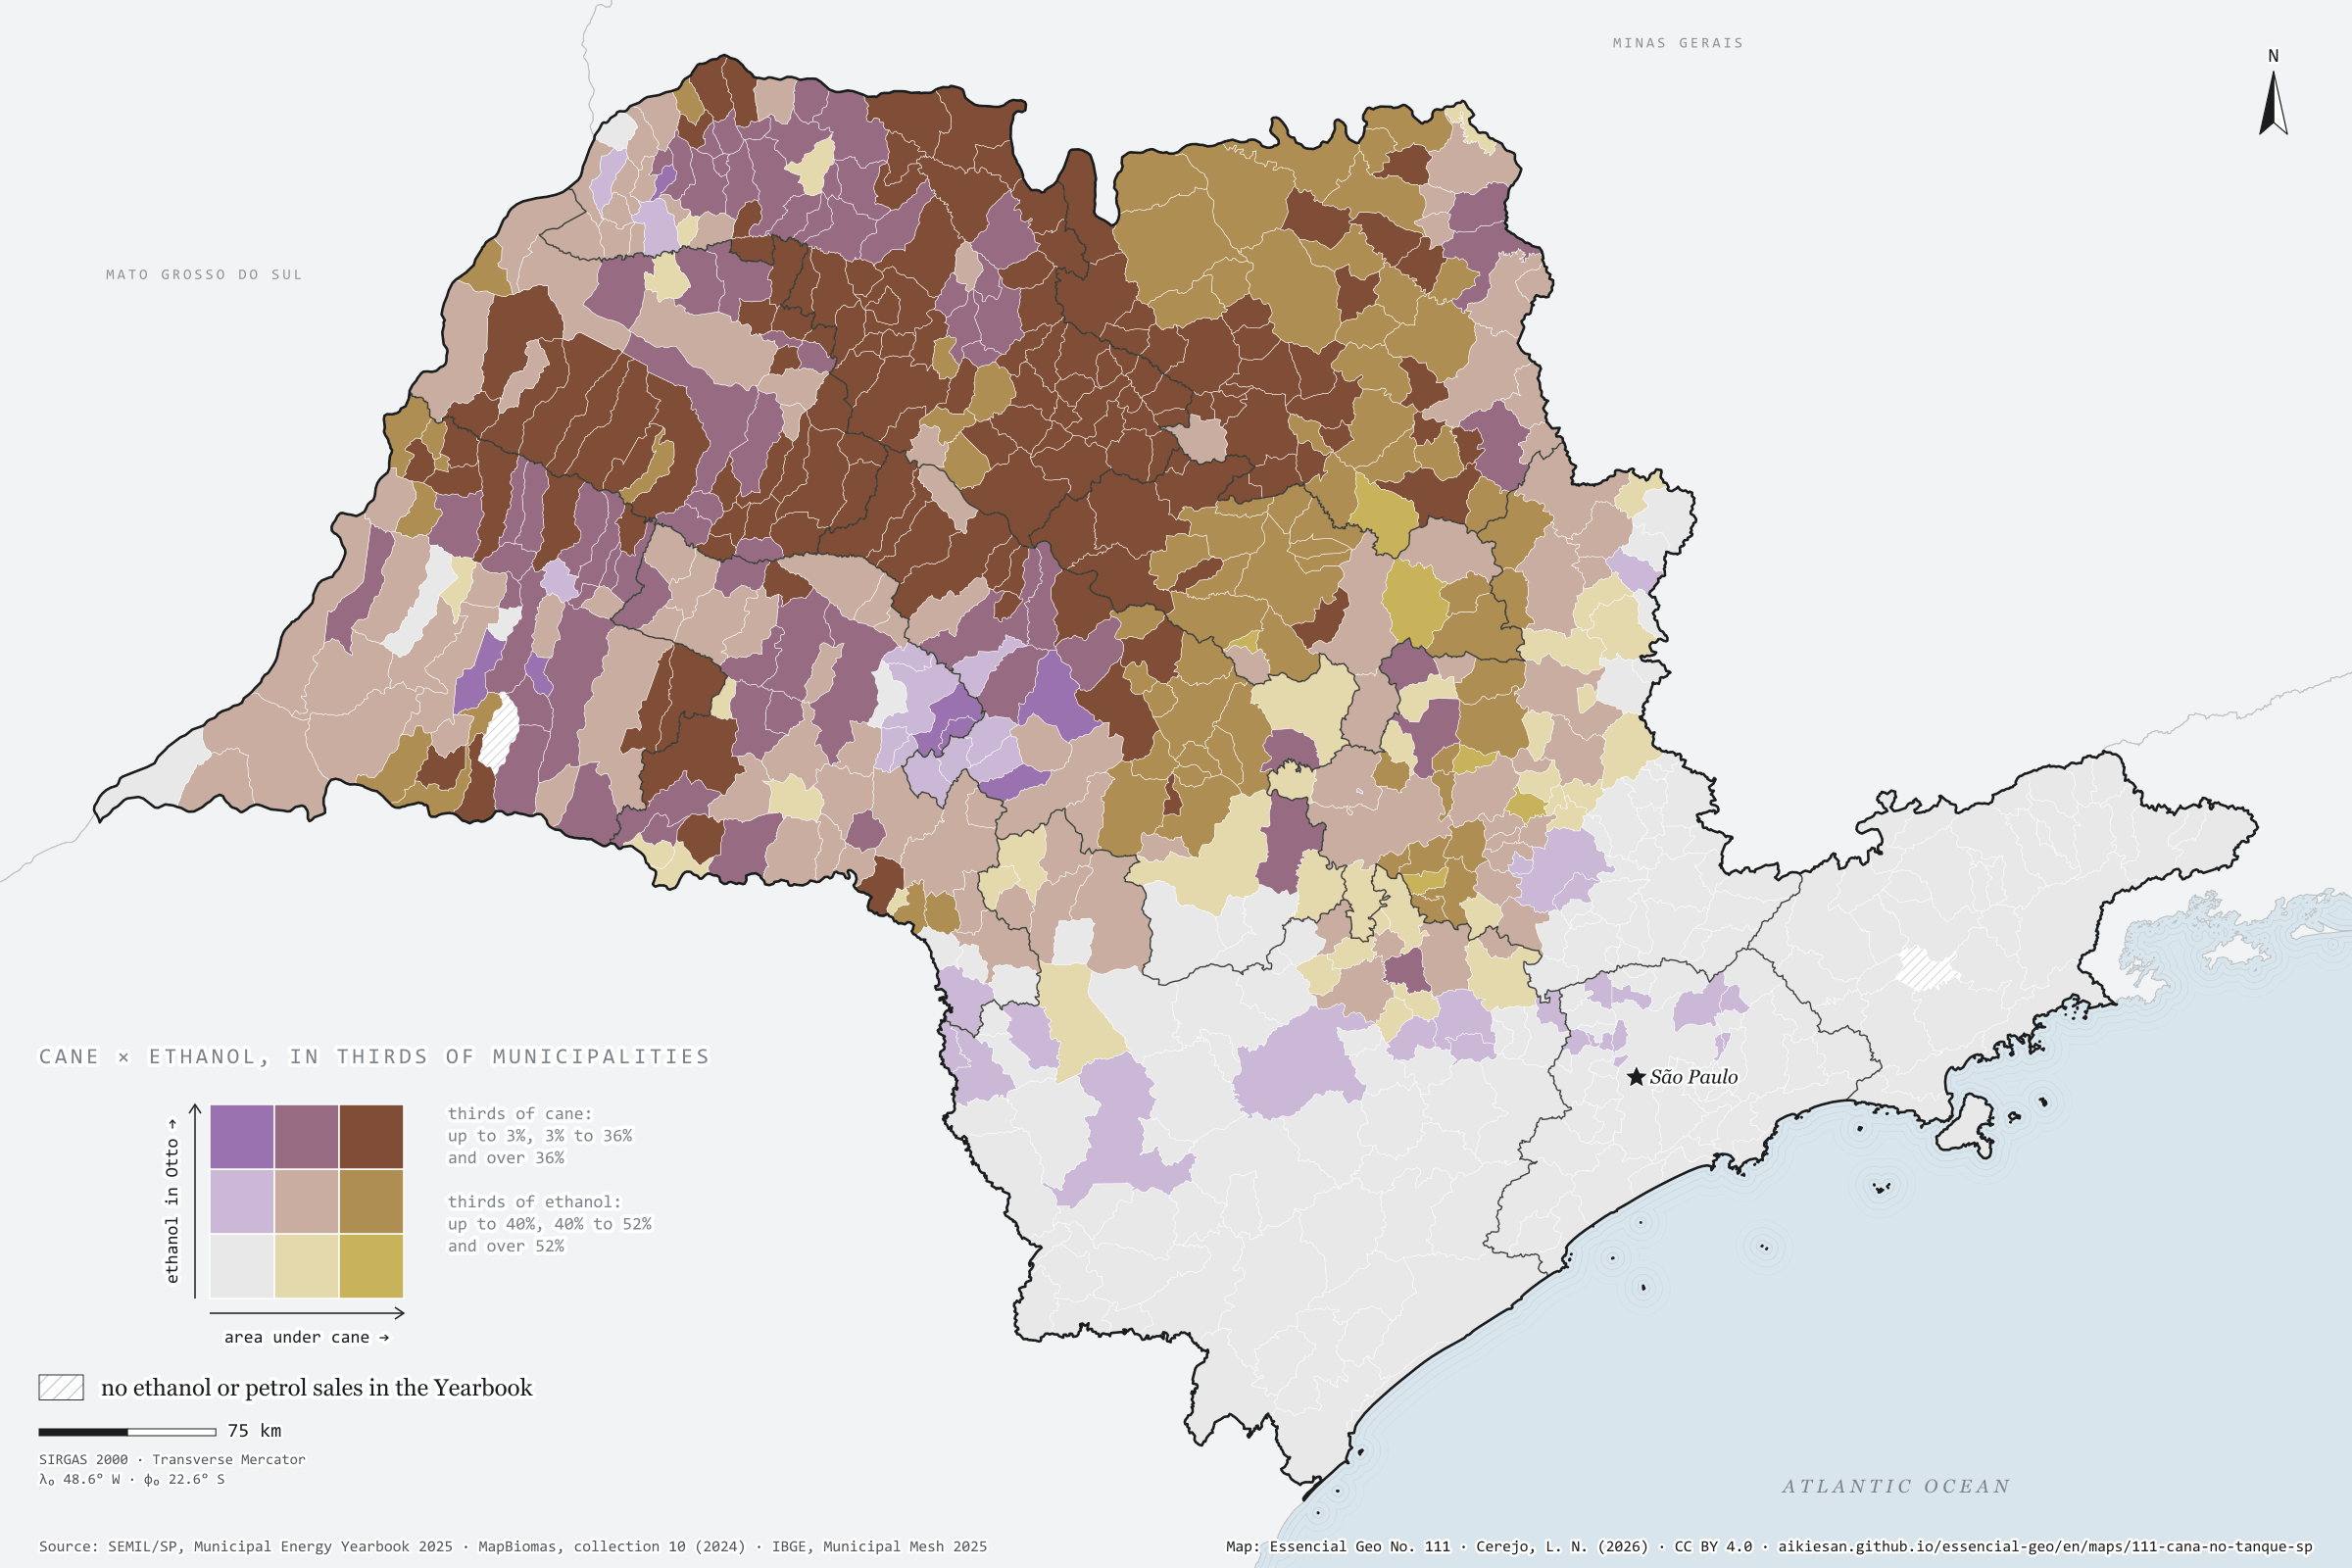
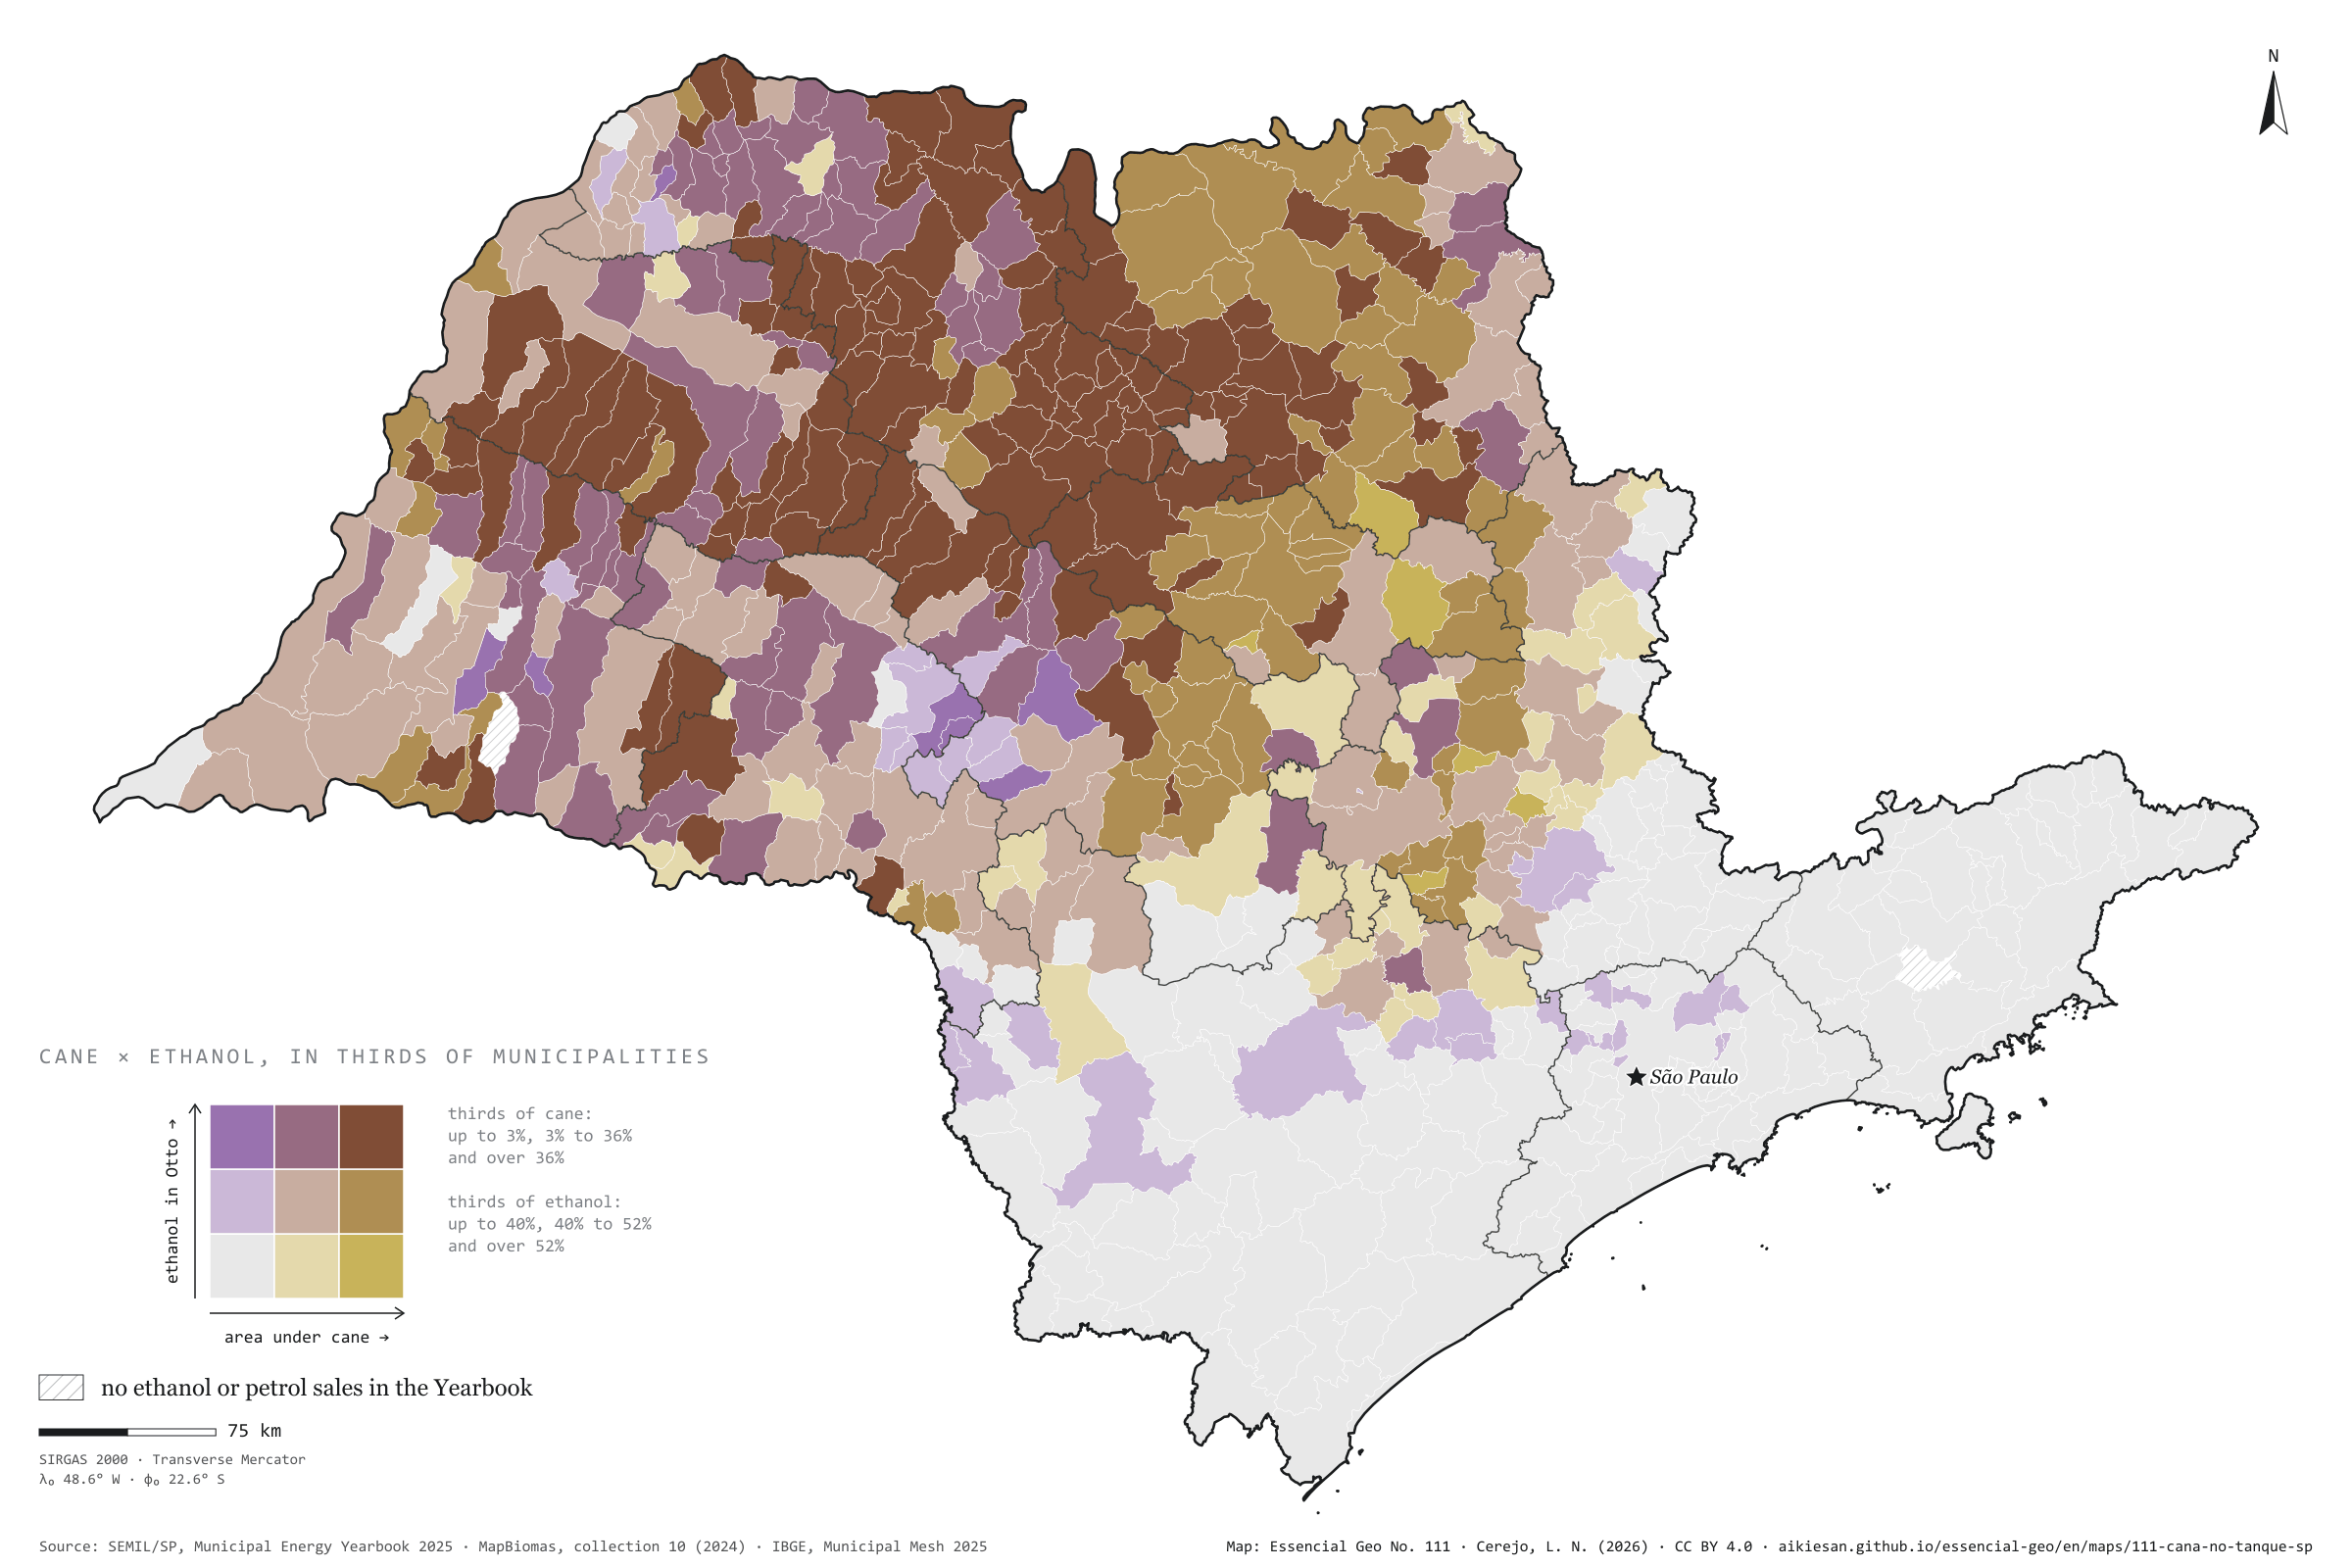
Where there is more cane, ethanol weighs more in what filling stations sell
Fig. 111São Paulo State (SP)EPSG:4674Source: SEMIL/SP, Municipal Energy Yearbook 2025 (base year 2024): sales of hydrous ethanol, petrol C, diesel oil and piped natural gas by municipality, MapBiomas, IBGE
In São Paulo municipalities with more cane, ethanol weighs more in the fuel sold for petrol and flex-fuel engines. In energy, hydrous ethanol was 43% of Otto-cycle sales statewide in 2024; in the third of municipalities with least cane, 38%; in the third with most, 52%. The rank correlation is 0.70 and stays at 0.59 net of urbanisation, density and income. In Ibaté, with cane on 51% of its area, ethanol reaches 69%; in São Luiz do Paraitinga, with no cane, it is 16%. Sales are not consumption, and prices, the fleet and distance from mills may lie behind it. First plate of the collection “Bioenergy, crossed”.
Technical record · downloads · citation
At a glance
Rank correlation between cane and ethanol
0.7
partial 0.59; 643 municipalities
Ethanol in Otto-cycle sales, most-cane third
52%
38% in the least-cane third; 43% statewide
Municipalities in the top third of both
135municipalities
Layers
municipiospolygon645 municipalities with the variables of all five plates, the bivariate classes and the LISA clusters (same GPKG as plates 111 to 115)
gasodutoslineGas transmission pipelines and distribution network (EPE)
regioes_intermediariaspolygon11 intermediate geographic regions
Share of municipal area under sugar cane (MapBiomas, collection 10, 2024) and hydrous ethanol’s share of the energy sold in the Otto cycle (ethanol and petrol C, SEMIL/SP, base year 2024), each in thirds of municipalities, crossed in a 3 × 3 bivariate map; Spearman rank correlations, raw and partial, and bivariate LISA.
The map without a frame, with legend, scale, reference system and credit written on it: ready for papers, lectures and slides. In two versions: with the basemap (neighbours and sea) or only the mapped area, on white.
CEREJO, Lucas Nakamura. Cana no tanque: onde há mais canavial, o etanol pesa mais no que os postos vendem. Versão 1.0.0. [S. l.]: Essencial, 2026. Conjunto de dados. Disponível em: https://aikiesan.github.io/essencial-geo/en/maps/111-cana-no-tanque-sp/. Acesso em: 10 nov. 2026.
Cerejo, L. N. (2026). Cana no tanque: onde há mais canavial, o etanol pesa mais no que os postos vendem [Cane in the tank: Where there is more cane, ethanol weighs more in what filling stations sell] (Version 1.0.0) [Data set]. Essencial. https://aikiesan.github.io/essencial-geo/en/maps/111-cana-no-tanque-sp/
@dataset{cerejo2026_cana_no_tanque_sp,
  author    = {Cerejo, Lucas Nakamura},
  title     = {Cana no tanque: Onde há mais canavial, o etanol pesa mais no que os postos vendem},
  year      = {2026},
  publisher = {Essencial},
  version   = {1.0.0},
  url       = {https://aikiesan.github.io/essencial-geo/en/maps/111-cana-no-tanque-sp/},
  language  = {portuguese},
  note      = {English title: Cane in the tank: Where there is more cane, ethanol weighs more in what filling stations sell. Licence CC BY 4.0}
}
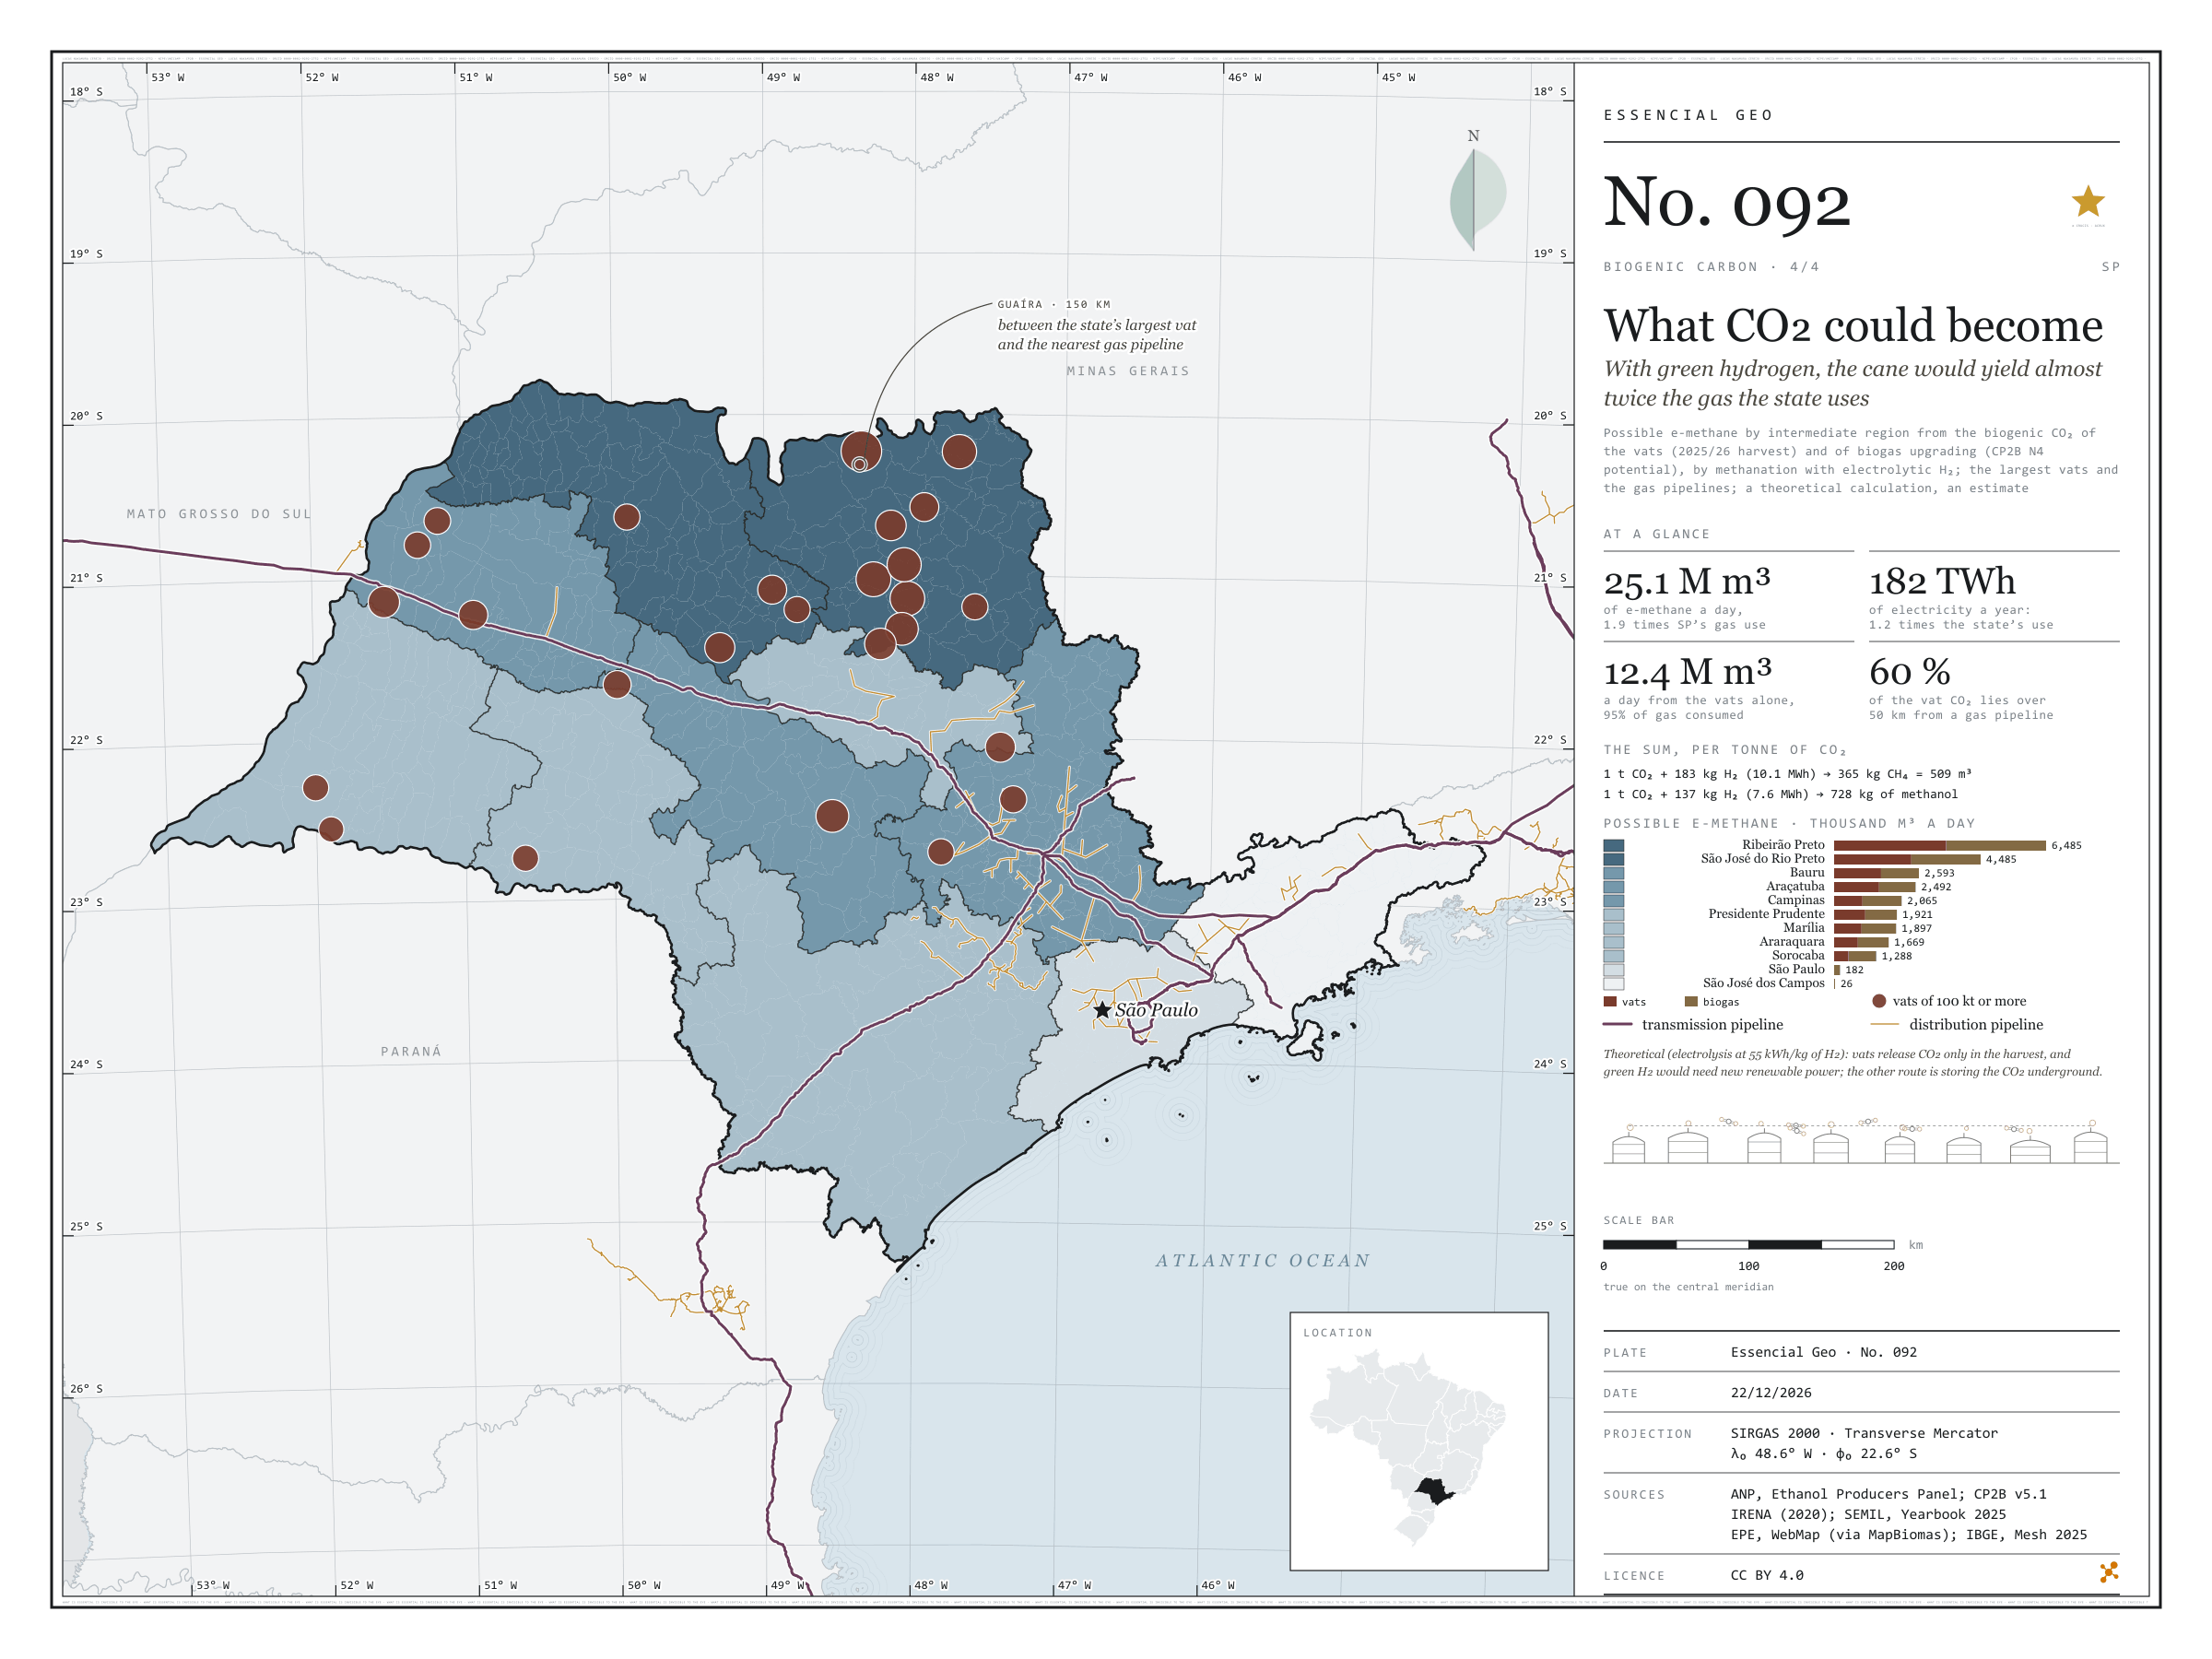
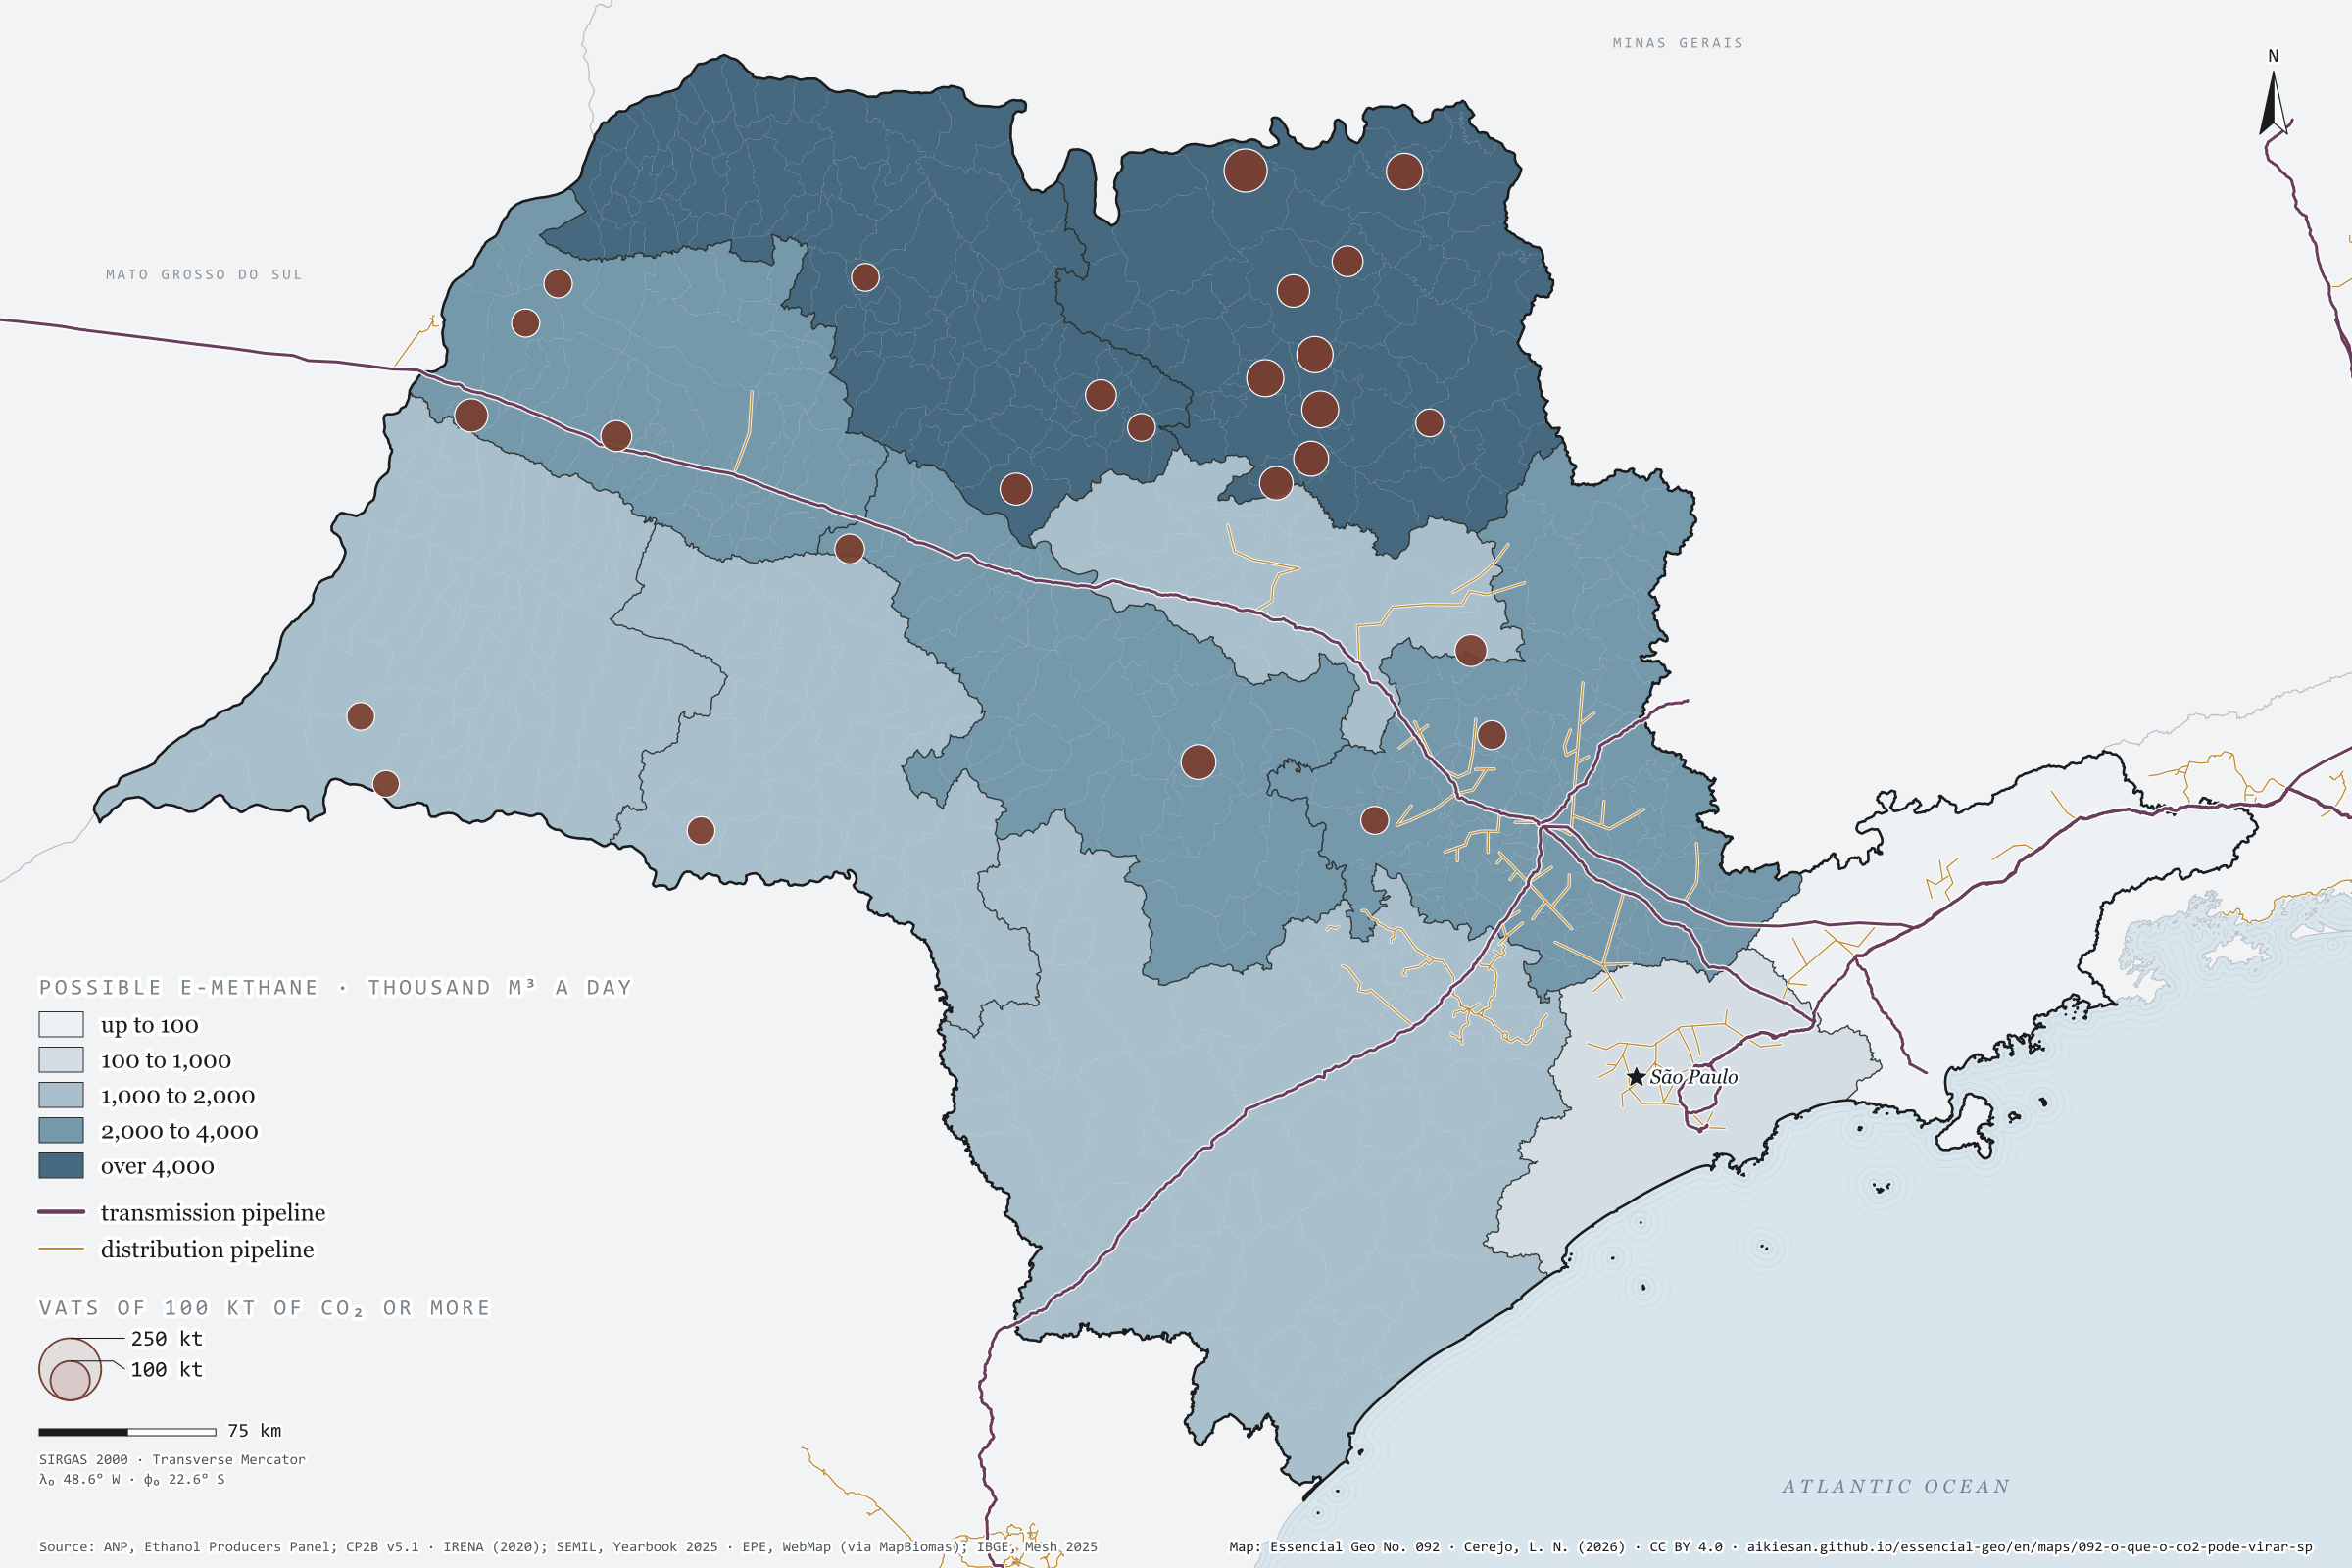
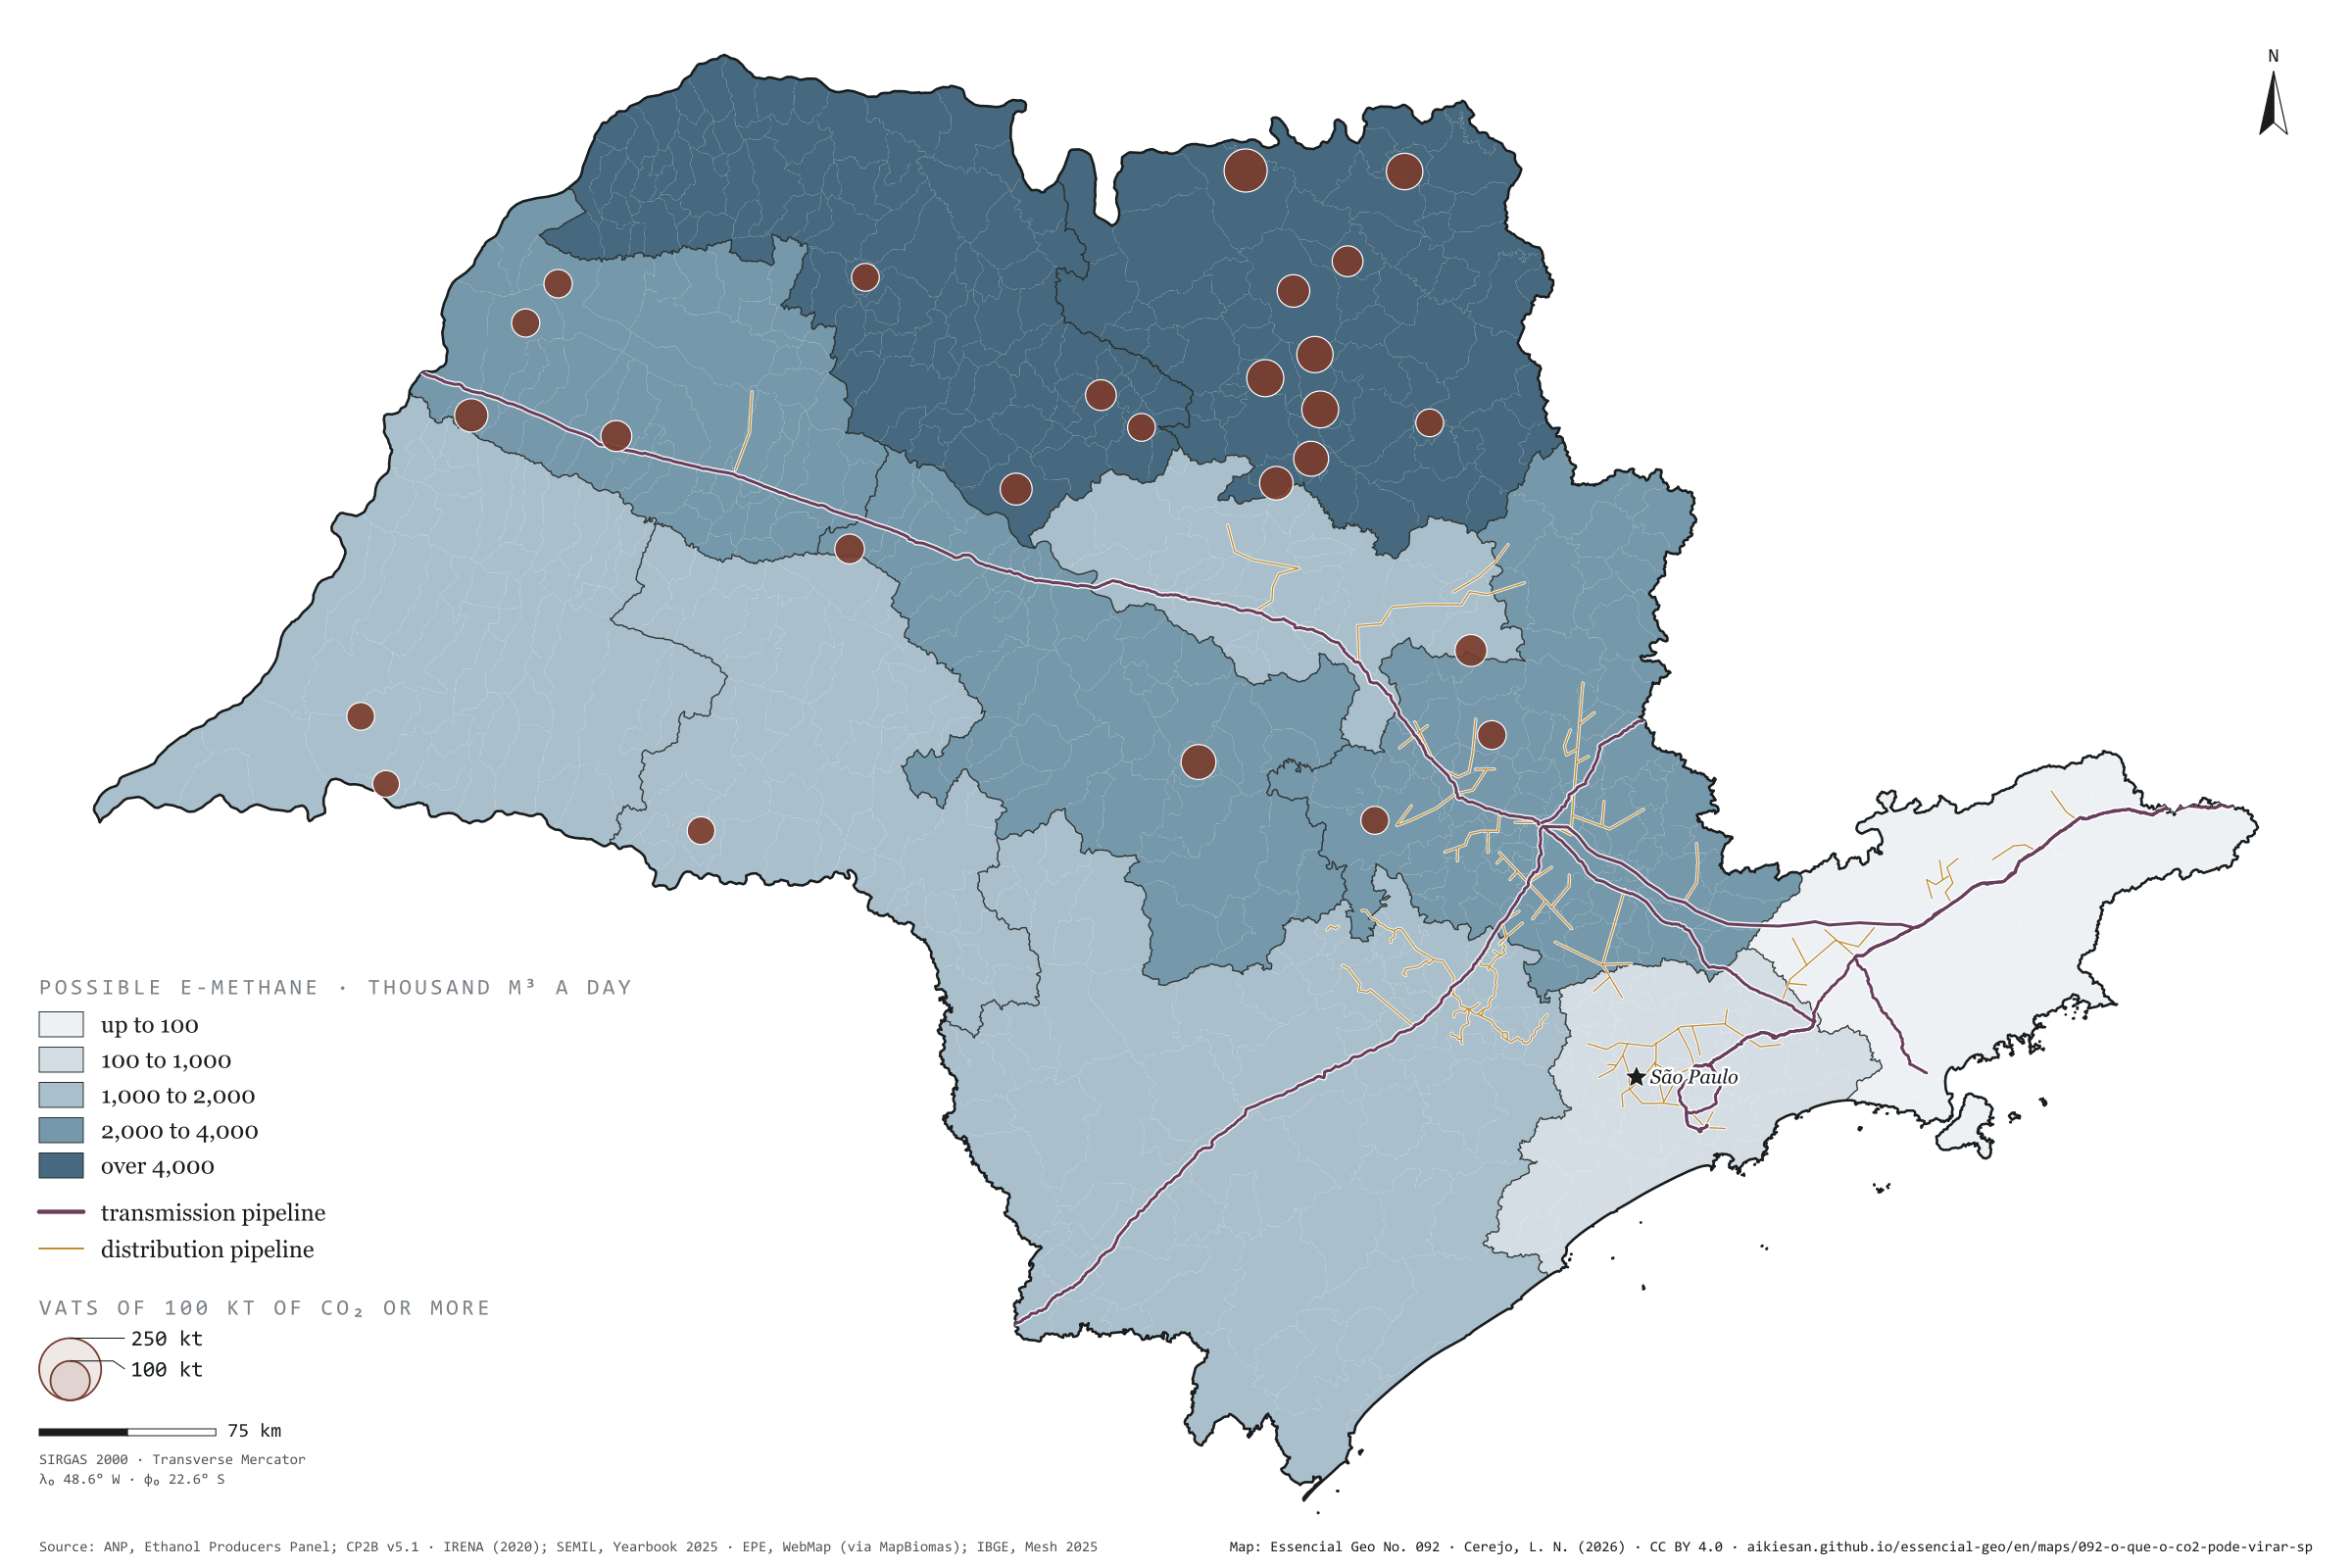
With green hydrogen, the cane would yield almost twice the gas the state uses
Fig. 092São Paulo State (SP)EPSG:4674Source: ANP, CP2B (Unicamp), IRENA (2020), SEMIL (SP), EPE, IBGE
With hydrogen, biogenic CO₂ can become fuel. One tonne of CO₂ plus 183 kg of H₂ gives 365 kg of methane, about 509 m³; with 137 kg of H₂, it gives 728 kg of methanol. Adding the vat CO₂ of the 2025/26 harvest (8.9 million t) to what upgrading the possible biogas would separate (9.1 million), São Paulo would have 18 million t a year: enough for 25 million m³ of e-methane a day, almost twice the natural gas the state used in 2024, or for 13 million t of methanol. But the sum calls for 3.3 million t of green hydrogen and 182 TWh of electricity, 1.2 times the state’s use. The Ribeirão Preto region holds 26% of the total, and 60% of the vat CO₂ lies over 50 km from a gas pipeline. It is a theoretical calculation and an estimate. Last plate of the collection “Biogenic carbon”.
Technical record · downloads · citation
At a glance
Possible e-methane by region (thousand m³ a day)
Ribeirão Preto6,485
São José do Rio Preto4,485
Bauru2,593
Araçatuba2,492
Campinas2,065
Presidente Prudente1,921
Marília1,897
Araraquara1,669
Sorocaba1,288
São Paulo182
São José dos Campos26
Vat CO₂ by distance to the gas pipeline (t a harvest)
up to 10 km13.5%
10 to 25 km12.4%
25 to 50 km13.9%
over 50 km60.2%
Layers
regioes_carbonopolygon11 intermediate regions: biogenic CO₂, H₂, electricity, possible e-methane and e-methanol, and the largest source
usinas_etanolpoint145 ethanol mills, with estimated CO₂ (plate 089)
gasodutos_transportelineExisting transmission pipelines (same database as plate 057)
gasodutos_distribuicaolinePiped gas distribution networks
Biogenic CO₂ by intermediate region (vats in the 2025/26 harvest, plate 089, plus upgrading of the possible biogas, plate 090), converted into e-methane (CO₂ + 4 H₂ → CH₄ + 2 H₂O) and e-methanol (CO₂ + 3 H₂ → CH₃OH + H₂O) at full conversion, with the hydrogen turned into electricity at 55 kWh per kg (electrolysis); distance from each municipality to the nearest gas pipeline.
The map without a frame, with legend, scale, reference system and credit written on it: ready for papers, lectures and slides. In two versions: with the basemap (neighbours and sea) or only the mapped area, on white.
CEREJO, Lucas Nakamura. O que o CO₂ poderia virar: com hidrogênio verde, a cana renderia quase duas vezes o gás consumido no estado. Versão 1.0.0. [S. l.]: Essencial, 2026. Conjunto de dados. Disponível em: https://aikiesan.github.io/essencial-geo/en/maps/092-o-que-o-co2-pode-virar-sp/. Acesso em: 10 nov. 2026.
Cerejo, L. N. (2026). O que o CO₂ poderia virar: com hidrogênio verde, a cana renderia quase duas vezes o gás consumido no estado [What CO₂ could become: With green hydrogen, the cane would yield almost twice the gas the state uses] (Version 1.0.0) [Data set]. Essencial. https://aikiesan.github.io/essencial-geo/en/maps/092-o-que-o-co2-pode-virar-sp/
@dataset{cerejo2026_o_que_o_co2_pode_virar_sp,
  author    = {Cerejo, Lucas Nakamura},
  title     = {O que o CO₂ poderia virar: Com hidrogênio verde, a cana renderia quase duas vezes o gás consumido no estado},
  year      = {2026},
  publisher = {Essencial},
  version   = {1.0.0},
  url       = {https://aikiesan.github.io/essencial-geo/en/maps/092-o-que-o-co2-pode-virar-sp/},
  language  = {portuguese},
  note      = {English title: What CO₂ could become: With green hydrogen, the cane would yield almost twice the gas the state uses. Licence CC BY 4.0}
}
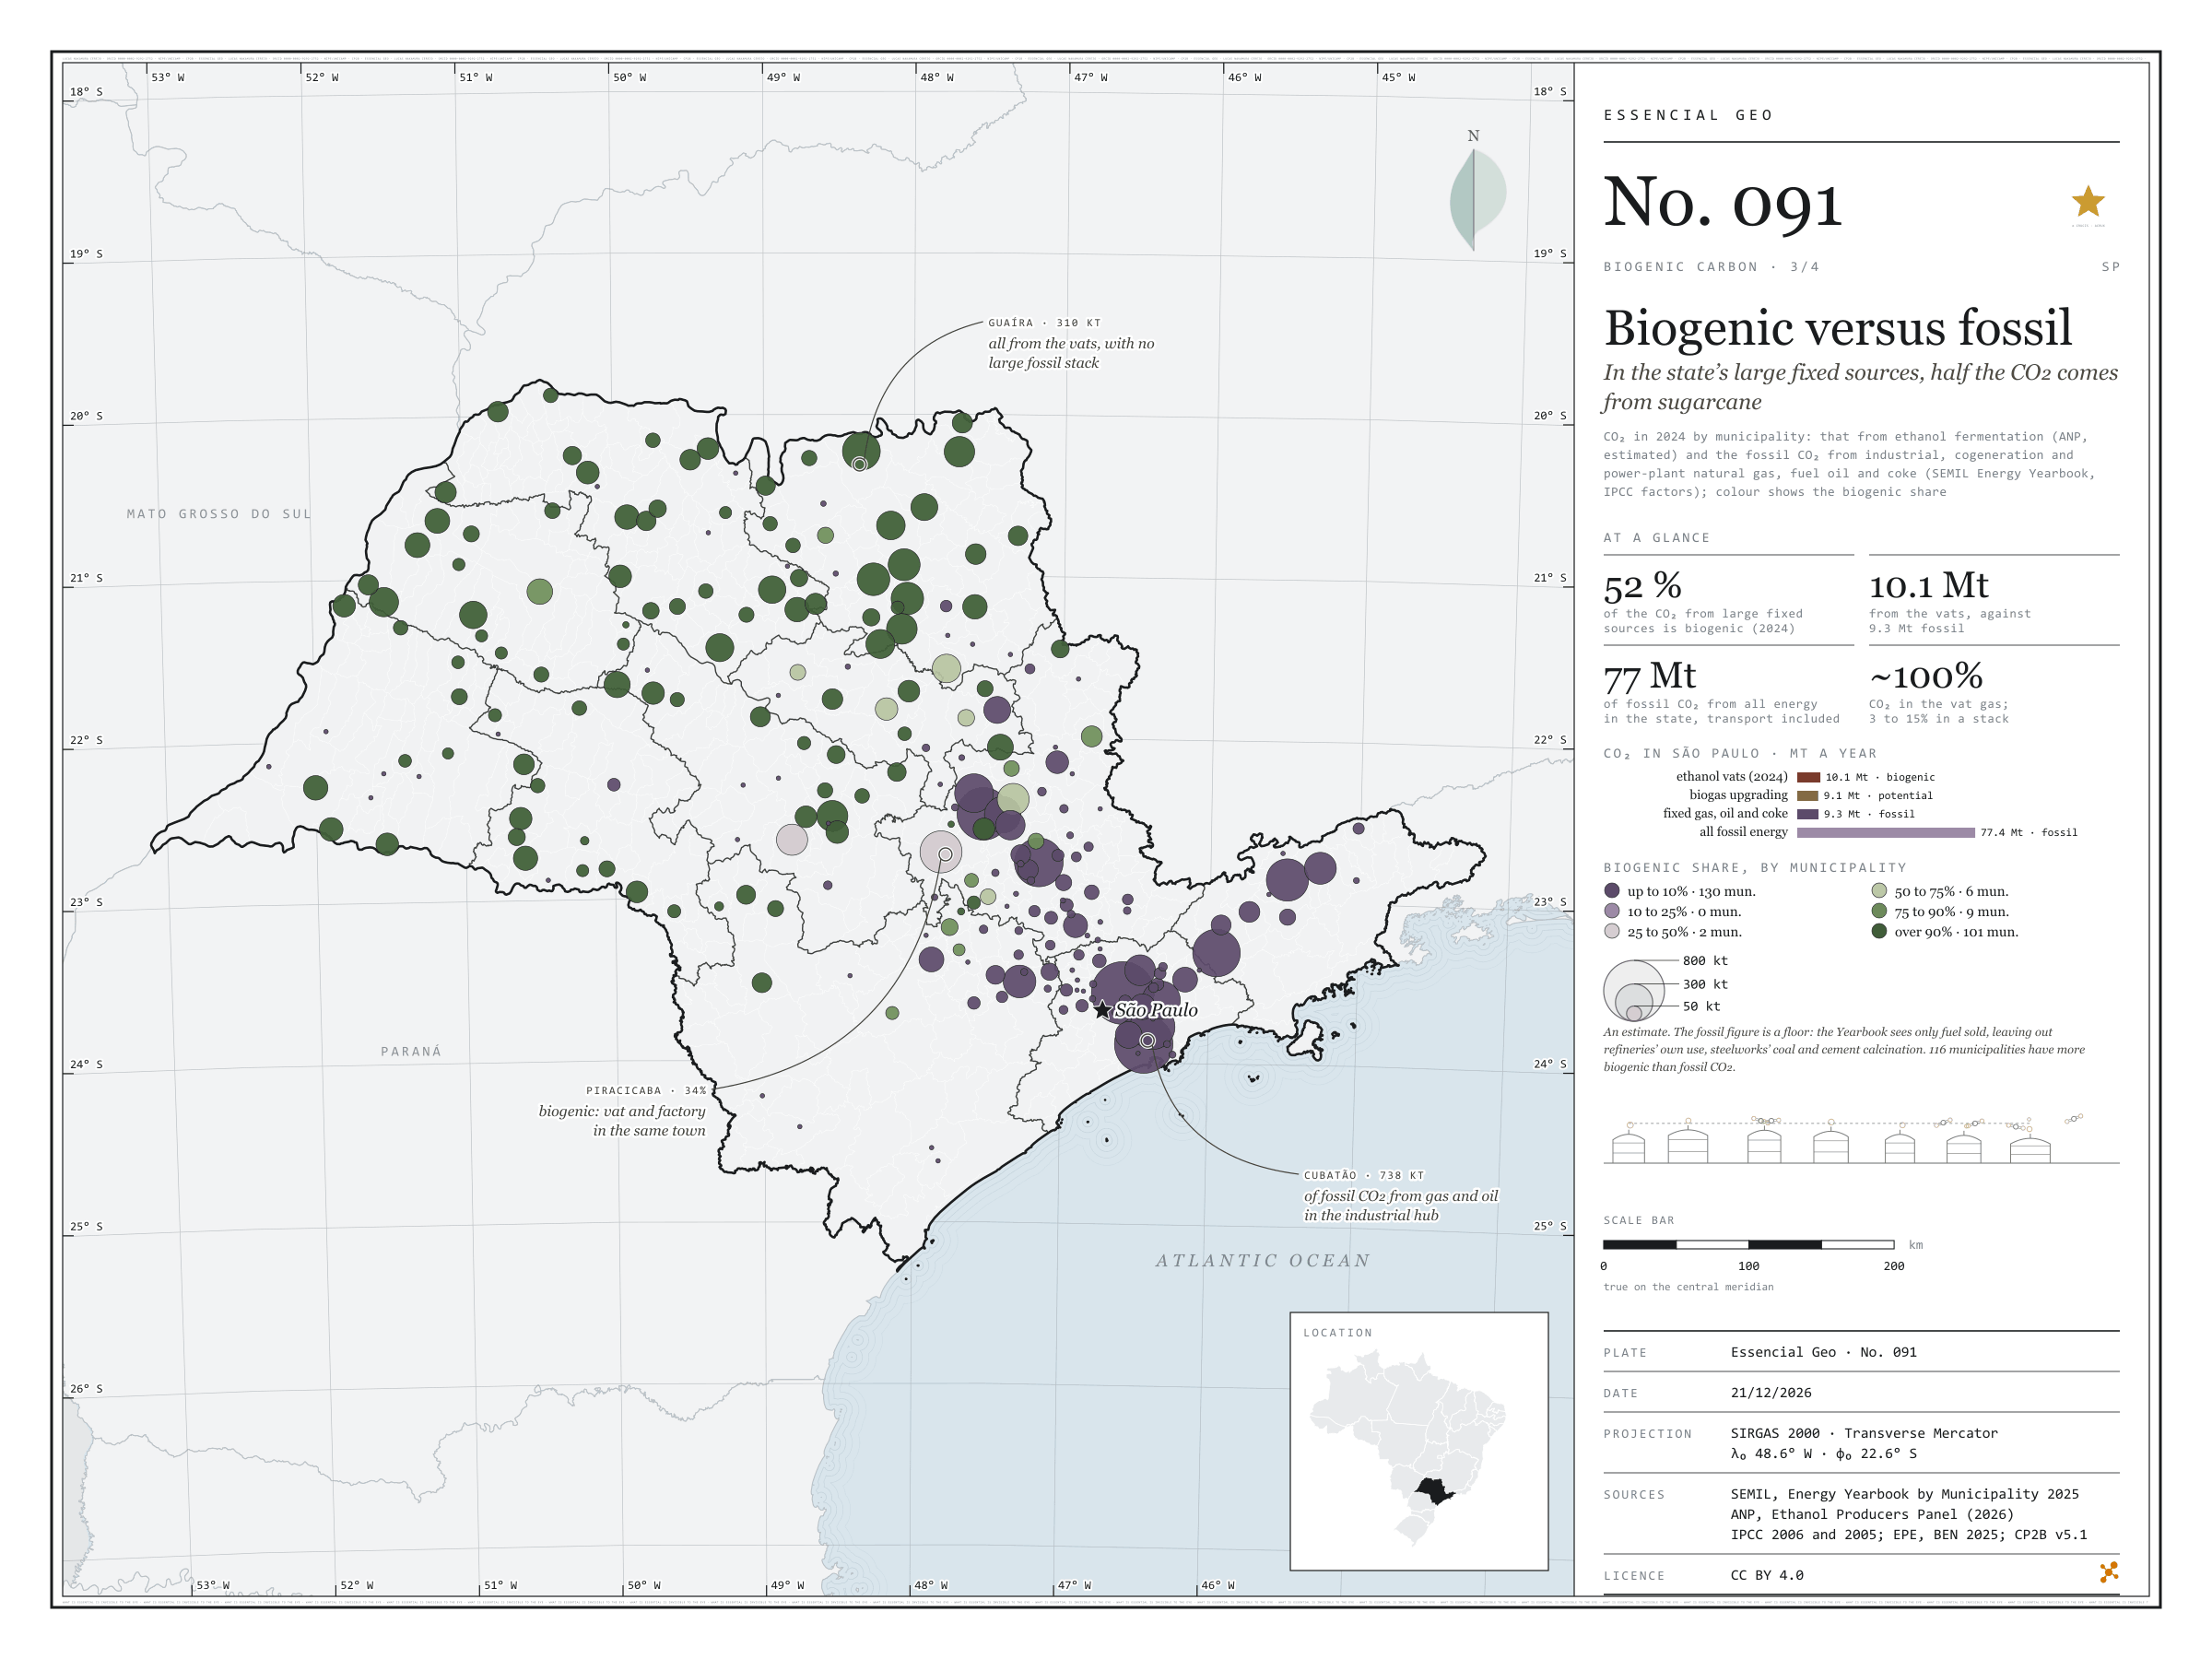
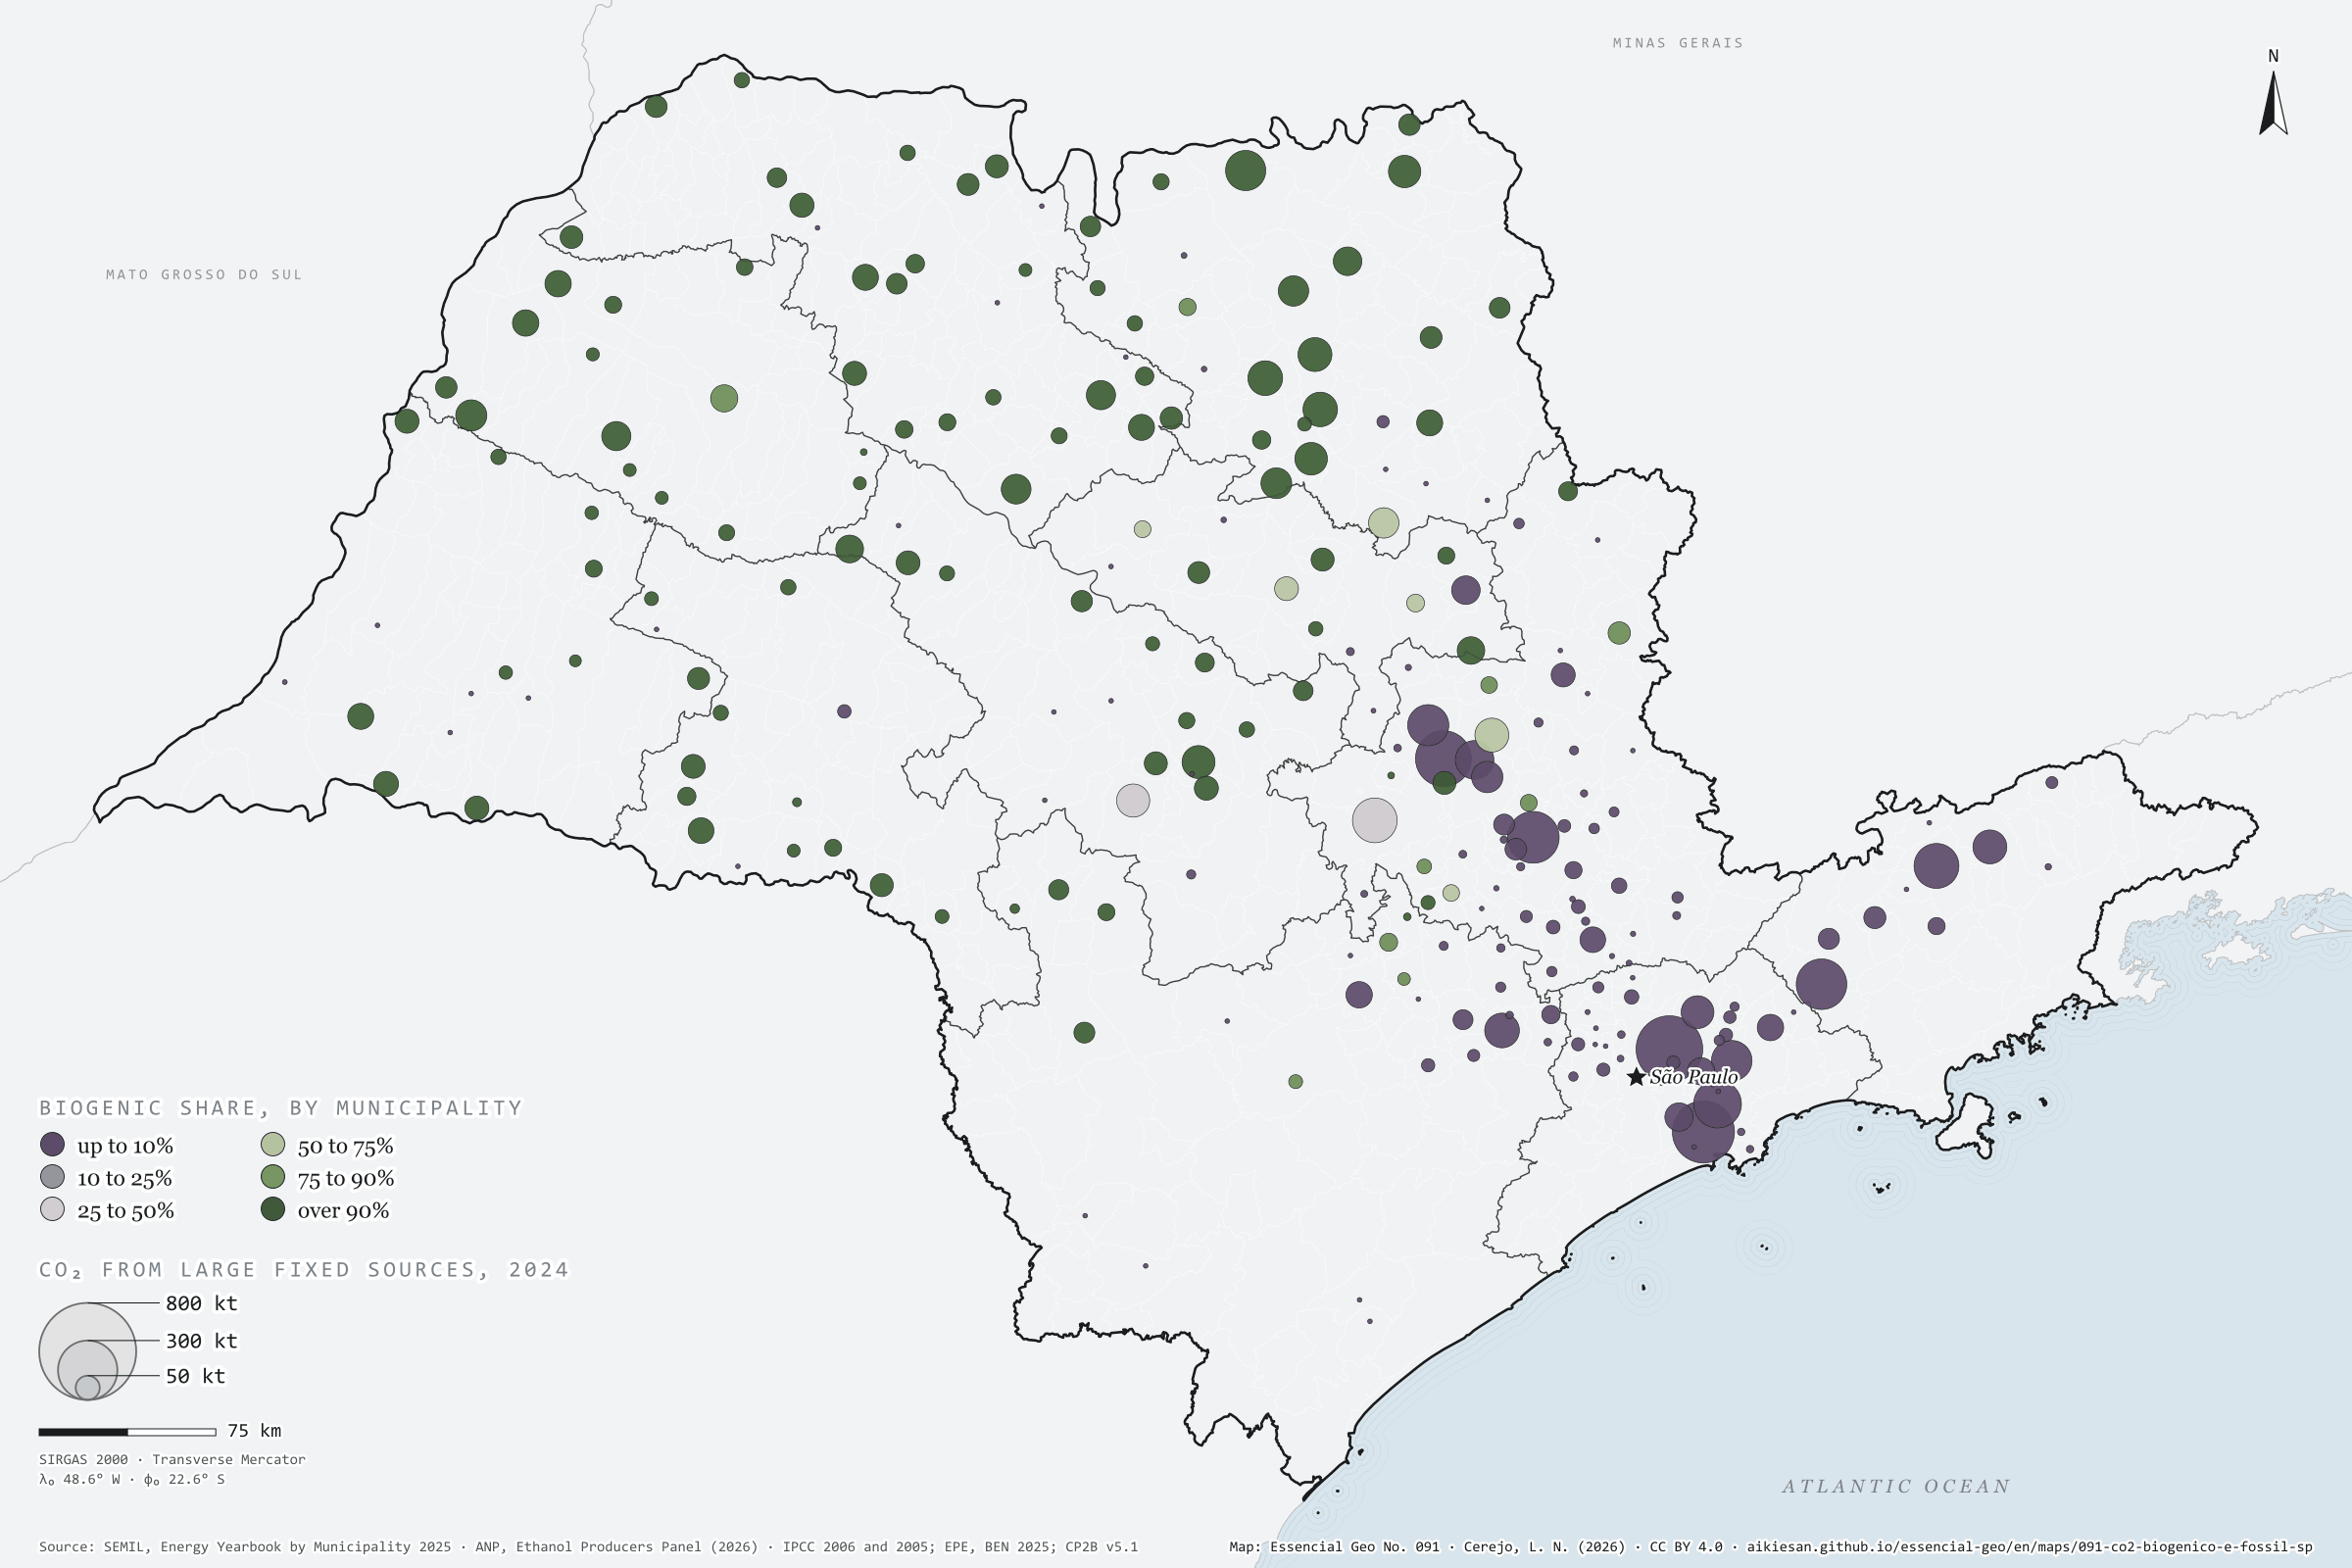
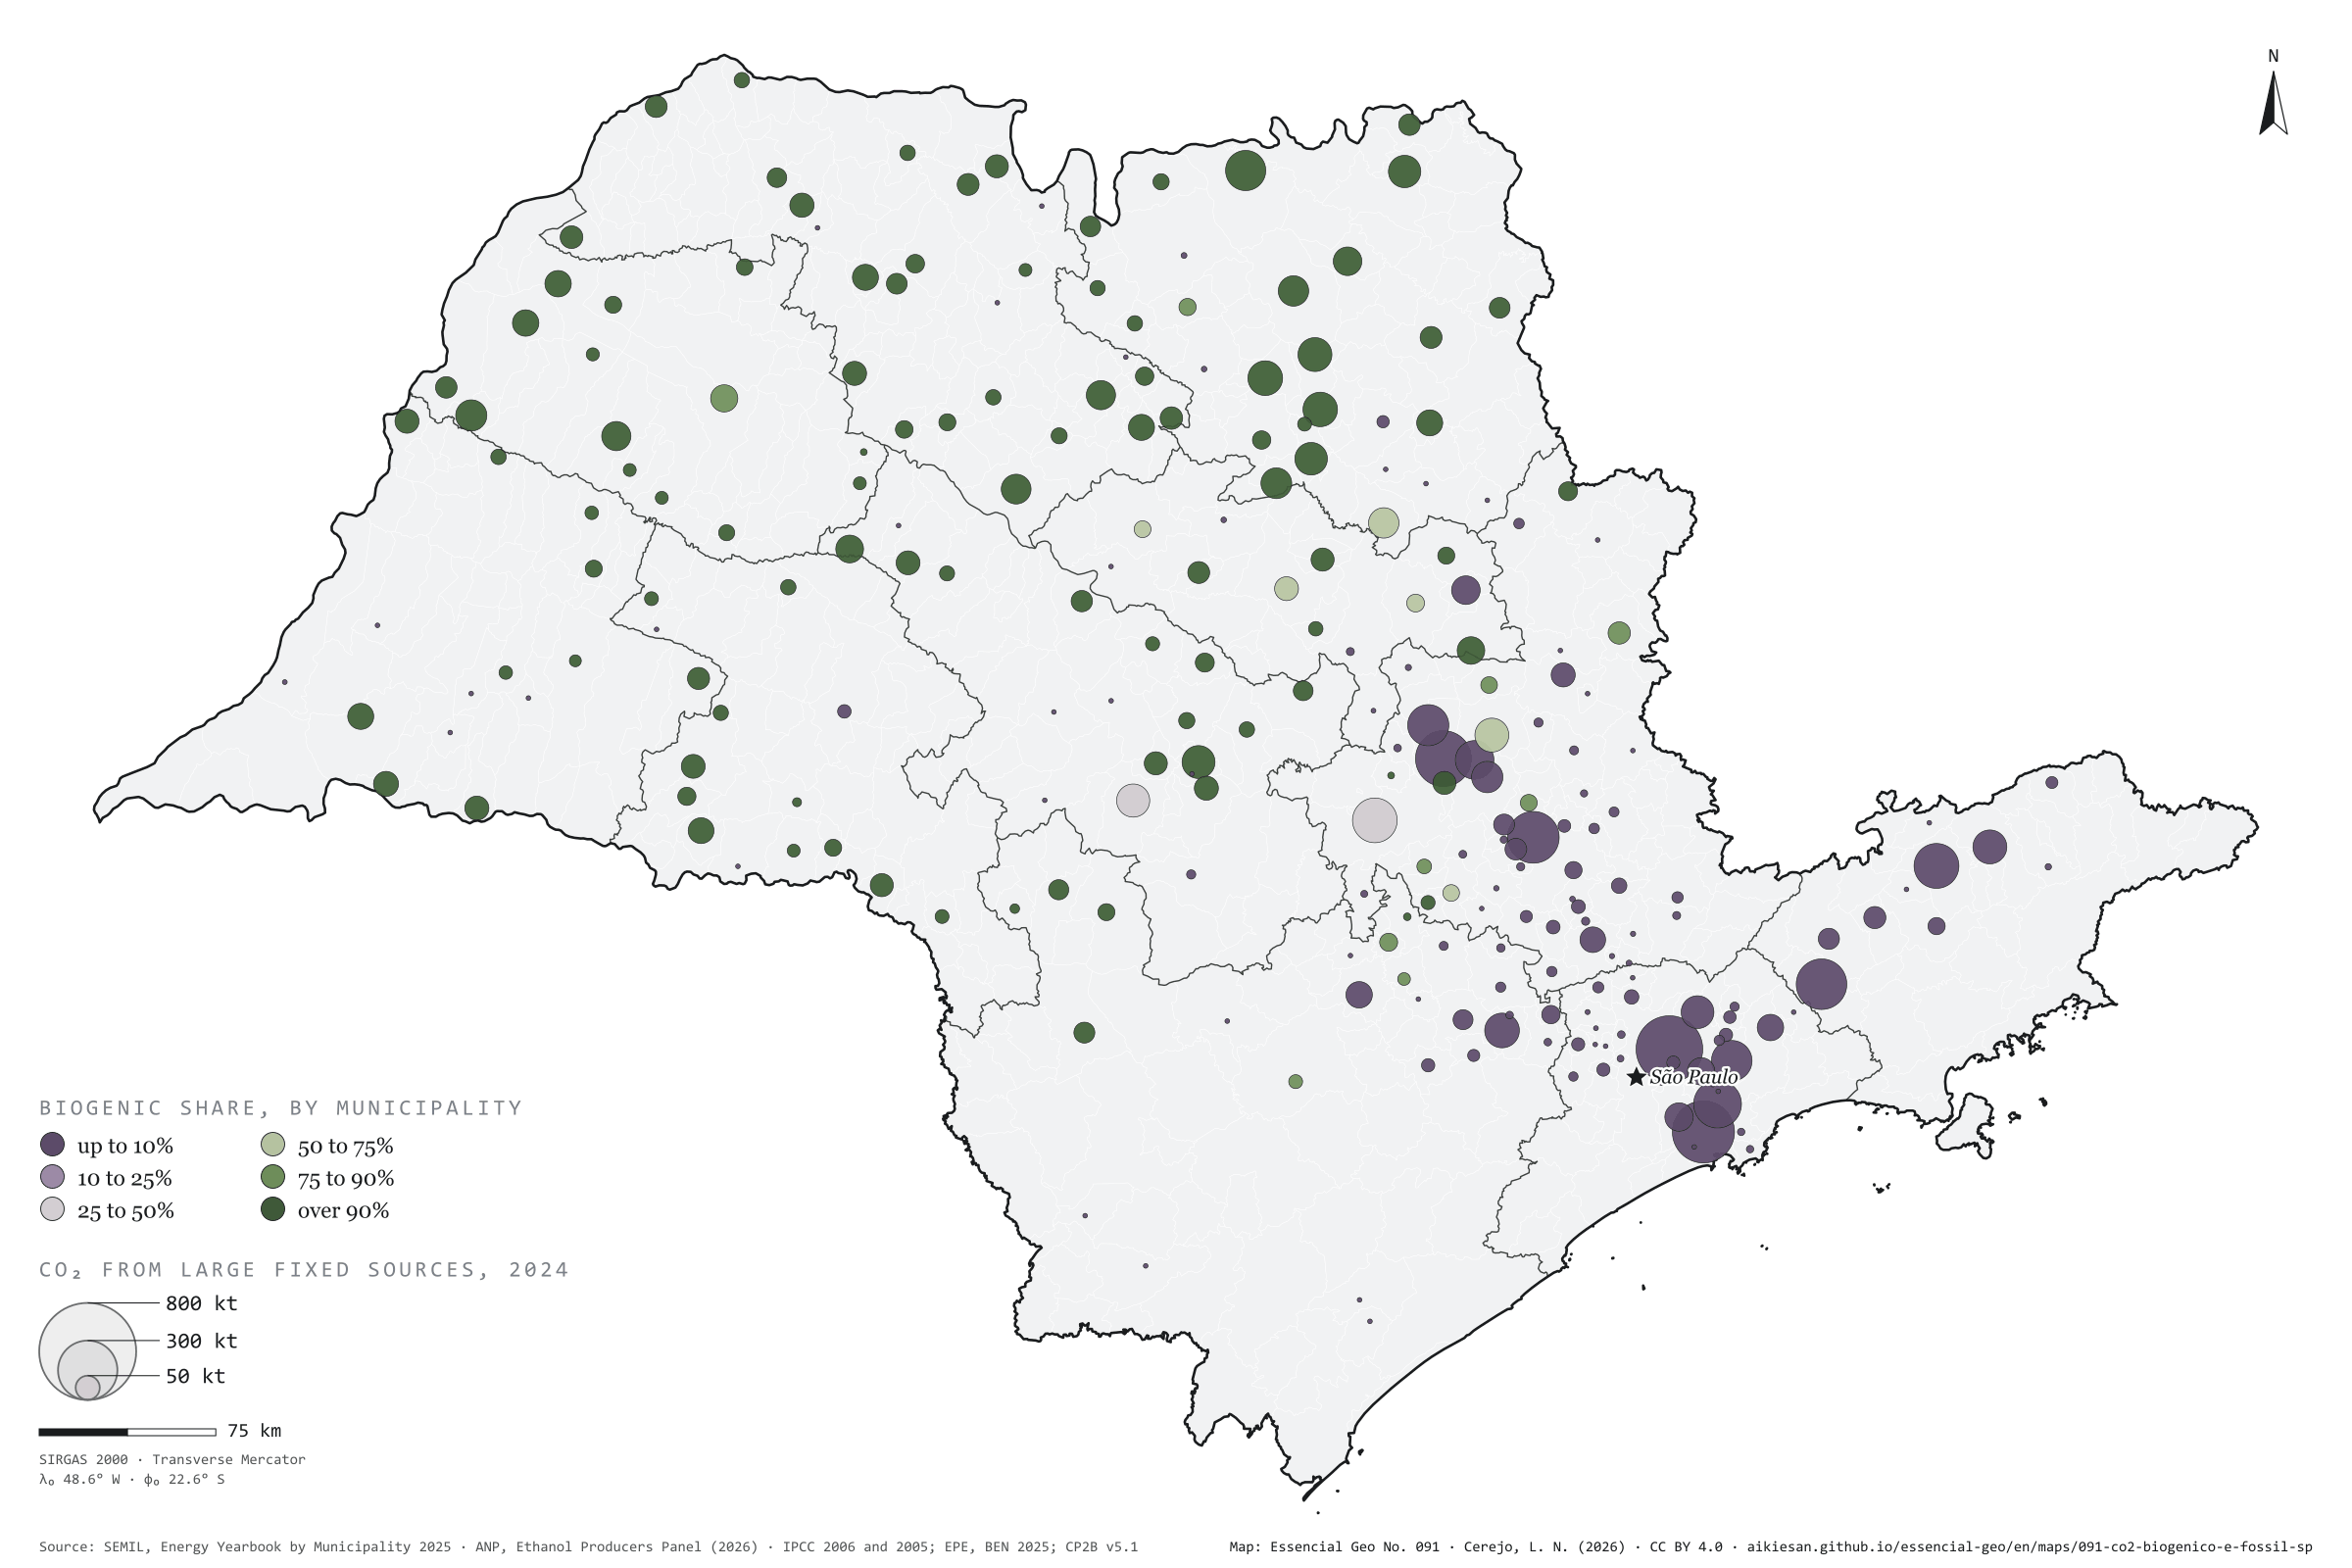
In the state’s large fixed sources, half the CO₂ comes from sugarcane
Fig. 091São Paulo State (SP)EPSG:4674Source: SEMIL (SP), ANP, IPCC (2006), IPCC (2005), EPE, IBGE
The gas leaving an ethanol vat is almost 100% CO₂; a combustion stack carries 3% to 15%. That is why mills are among the easiest sources to capture. In 2024, São Paulo’s vats released about 10.1 million t of biogenic CO₂. Natural gas burnt by industry, cogeneration and power plants, fuel oil and coke added up to 9.3 million t of fossil CO₂, on the SEMIL Energy Yearbook and IPCC factors. In these large fixed sources, 52% of the CO₂ comes from sugarcane. The map splits: across the cane-growing interior, 116 municipalities have more biogenic than fossil CO₂; fossil CO₂ concentrates in the capital (850,000 t), Cubatão (738,000), Santa Gertrudes, Paulínia and Jacareí. In Piracicaba the two mix: 34% is biogenic. The fossil figure here is a floor. Third plate of the collection “Biogenic carbon”.
Technical record · downloads · citation
At a glance
CO₂ from large fixed sources in 2024 (t)
ethanol vats (biogenic)52.1%
gas, oil and coke (fossil)47.9%
Largest fixed fossil sources (t of CO₂ in 2024)
São Paulo849,580
Cubatão738,384
Santa Gertrudes597,415
Paulínia513,832
Jacareí489,794
Layers
municipiospolygon645 municipalities: fossil CO₂ (gas, oil, coke and all energy), vat CO₂ in 2024 and biogenic share (same GPKG as plate 089)
Fossil CO₂ in 2024 by municipality: industrial, cogeneration and power-generation natural gas use and fuel oil and petroleum coke use (SEMIL Energy Yearbook), times the BEN net calorific value and the IPCC 2006 emission factor; biogenic CO₂ in 2024: ethanol fermentation estimated as in plate 089; biogenic share = biogenic ÷ (biogenic + fossil).
The map without a frame, with legend, scale, reference system and credit written on it: ready for papers, lectures and slides. In two versions: with the basemap (neighbours and sea) or only the mapped area, on white.
CEREJO, Lucas Nakamura. Biogênico contra fóssil: nas grandes fontes fixas do estado, metade do CO₂ vem da cana. Versão 1.0.0. [S. l.]: Essencial, 2026. Conjunto de dados. Disponível em: https://aikiesan.github.io/essencial-geo/en/maps/091-co2-biogenico-e-fossil-sp/. Acesso em: 10 nov. 2026.
Cerejo, L. N. (2026). Biogênico contra fóssil: nas grandes fontes fixas do estado, metade do CO₂ vem da cana [Biogenic versus fossil: In the state’s large fixed sources, half the CO₂ comes from sugarcane] (Version 1.0.0) [Data set]. Essencial. https://aikiesan.github.io/essencial-geo/en/maps/091-co2-biogenico-e-fossil-sp/
@dataset{cerejo2026_co2_biogenico_e_fossil_sp,
  author    = {Cerejo, Lucas Nakamura},
  title     = {Biogênico contra fóssil: Nas grandes fontes fixas do estado, metade do CO₂ vem da cana},
  year      = {2026},
  publisher = {Essencial},
  version   = {1.0.0},
  url       = {https://aikiesan.github.io/essencial-geo/en/maps/091-co2-biogenico-e-fossil-sp/},
  language  = {portuguese},
  note      = {English title: Biogenic versus fossil: In the state’s large fixed sources, half the CO₂ comes from sugarcane. Licence CC BY 4.0}
}
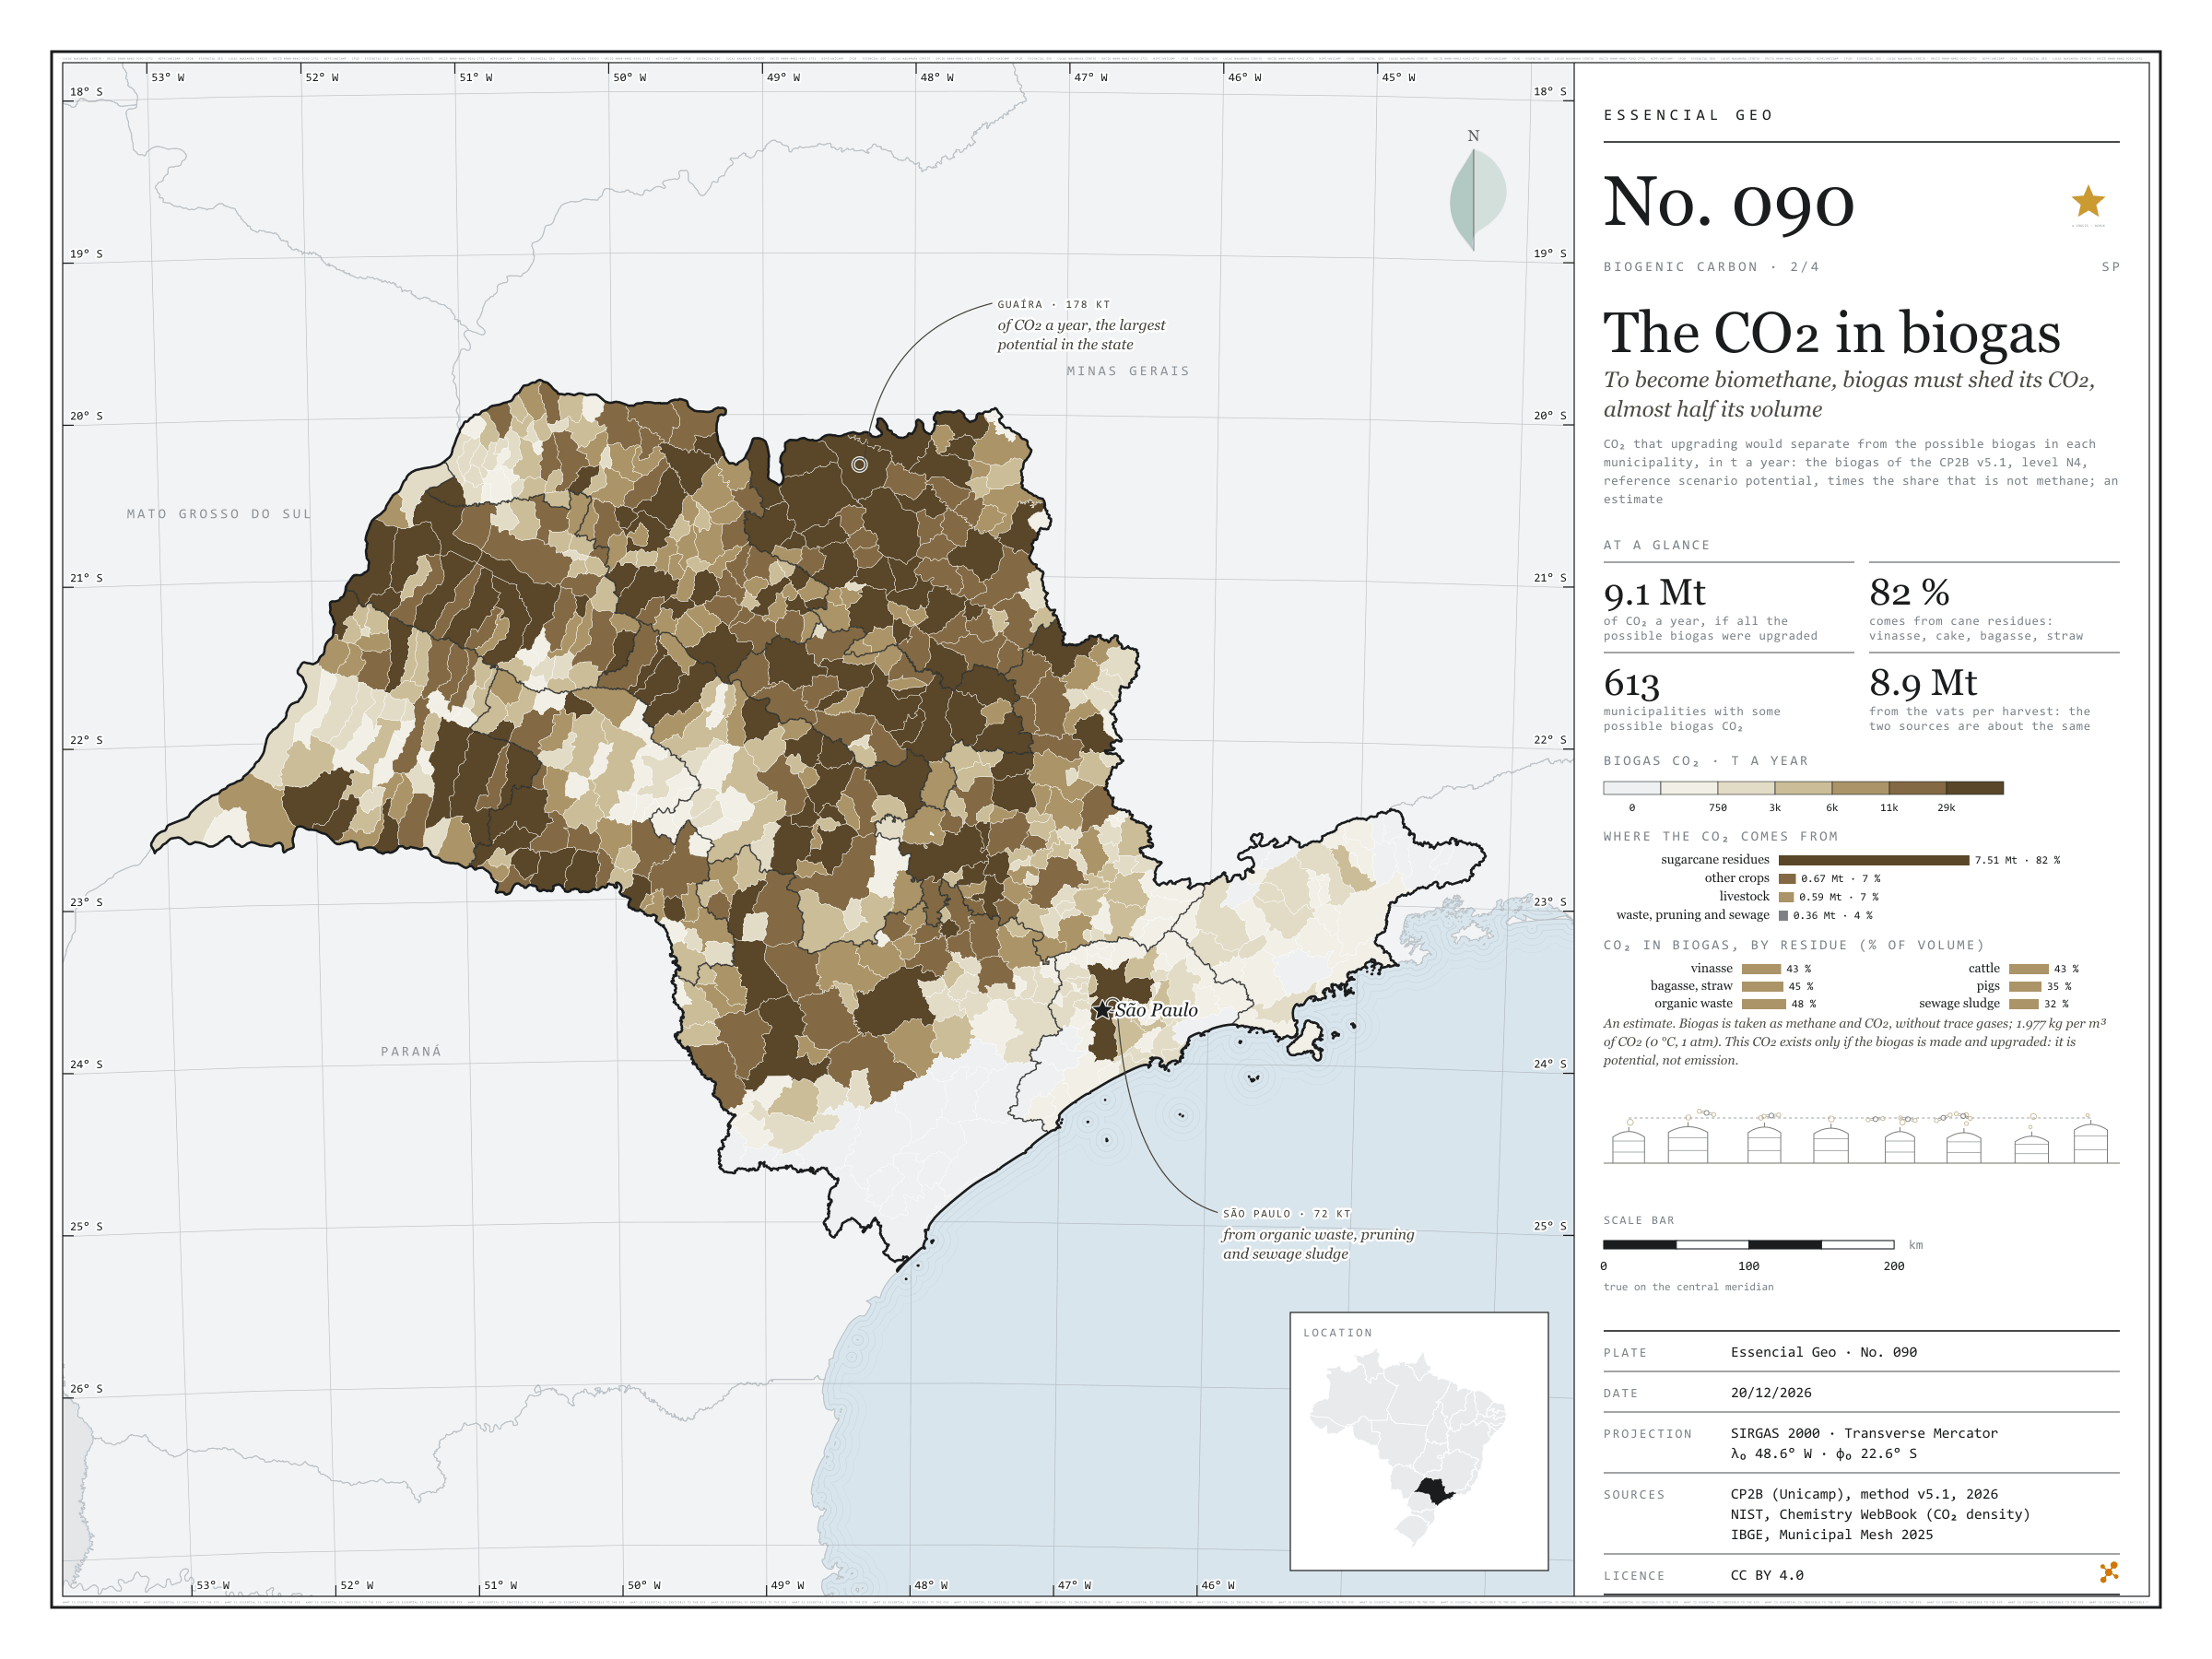
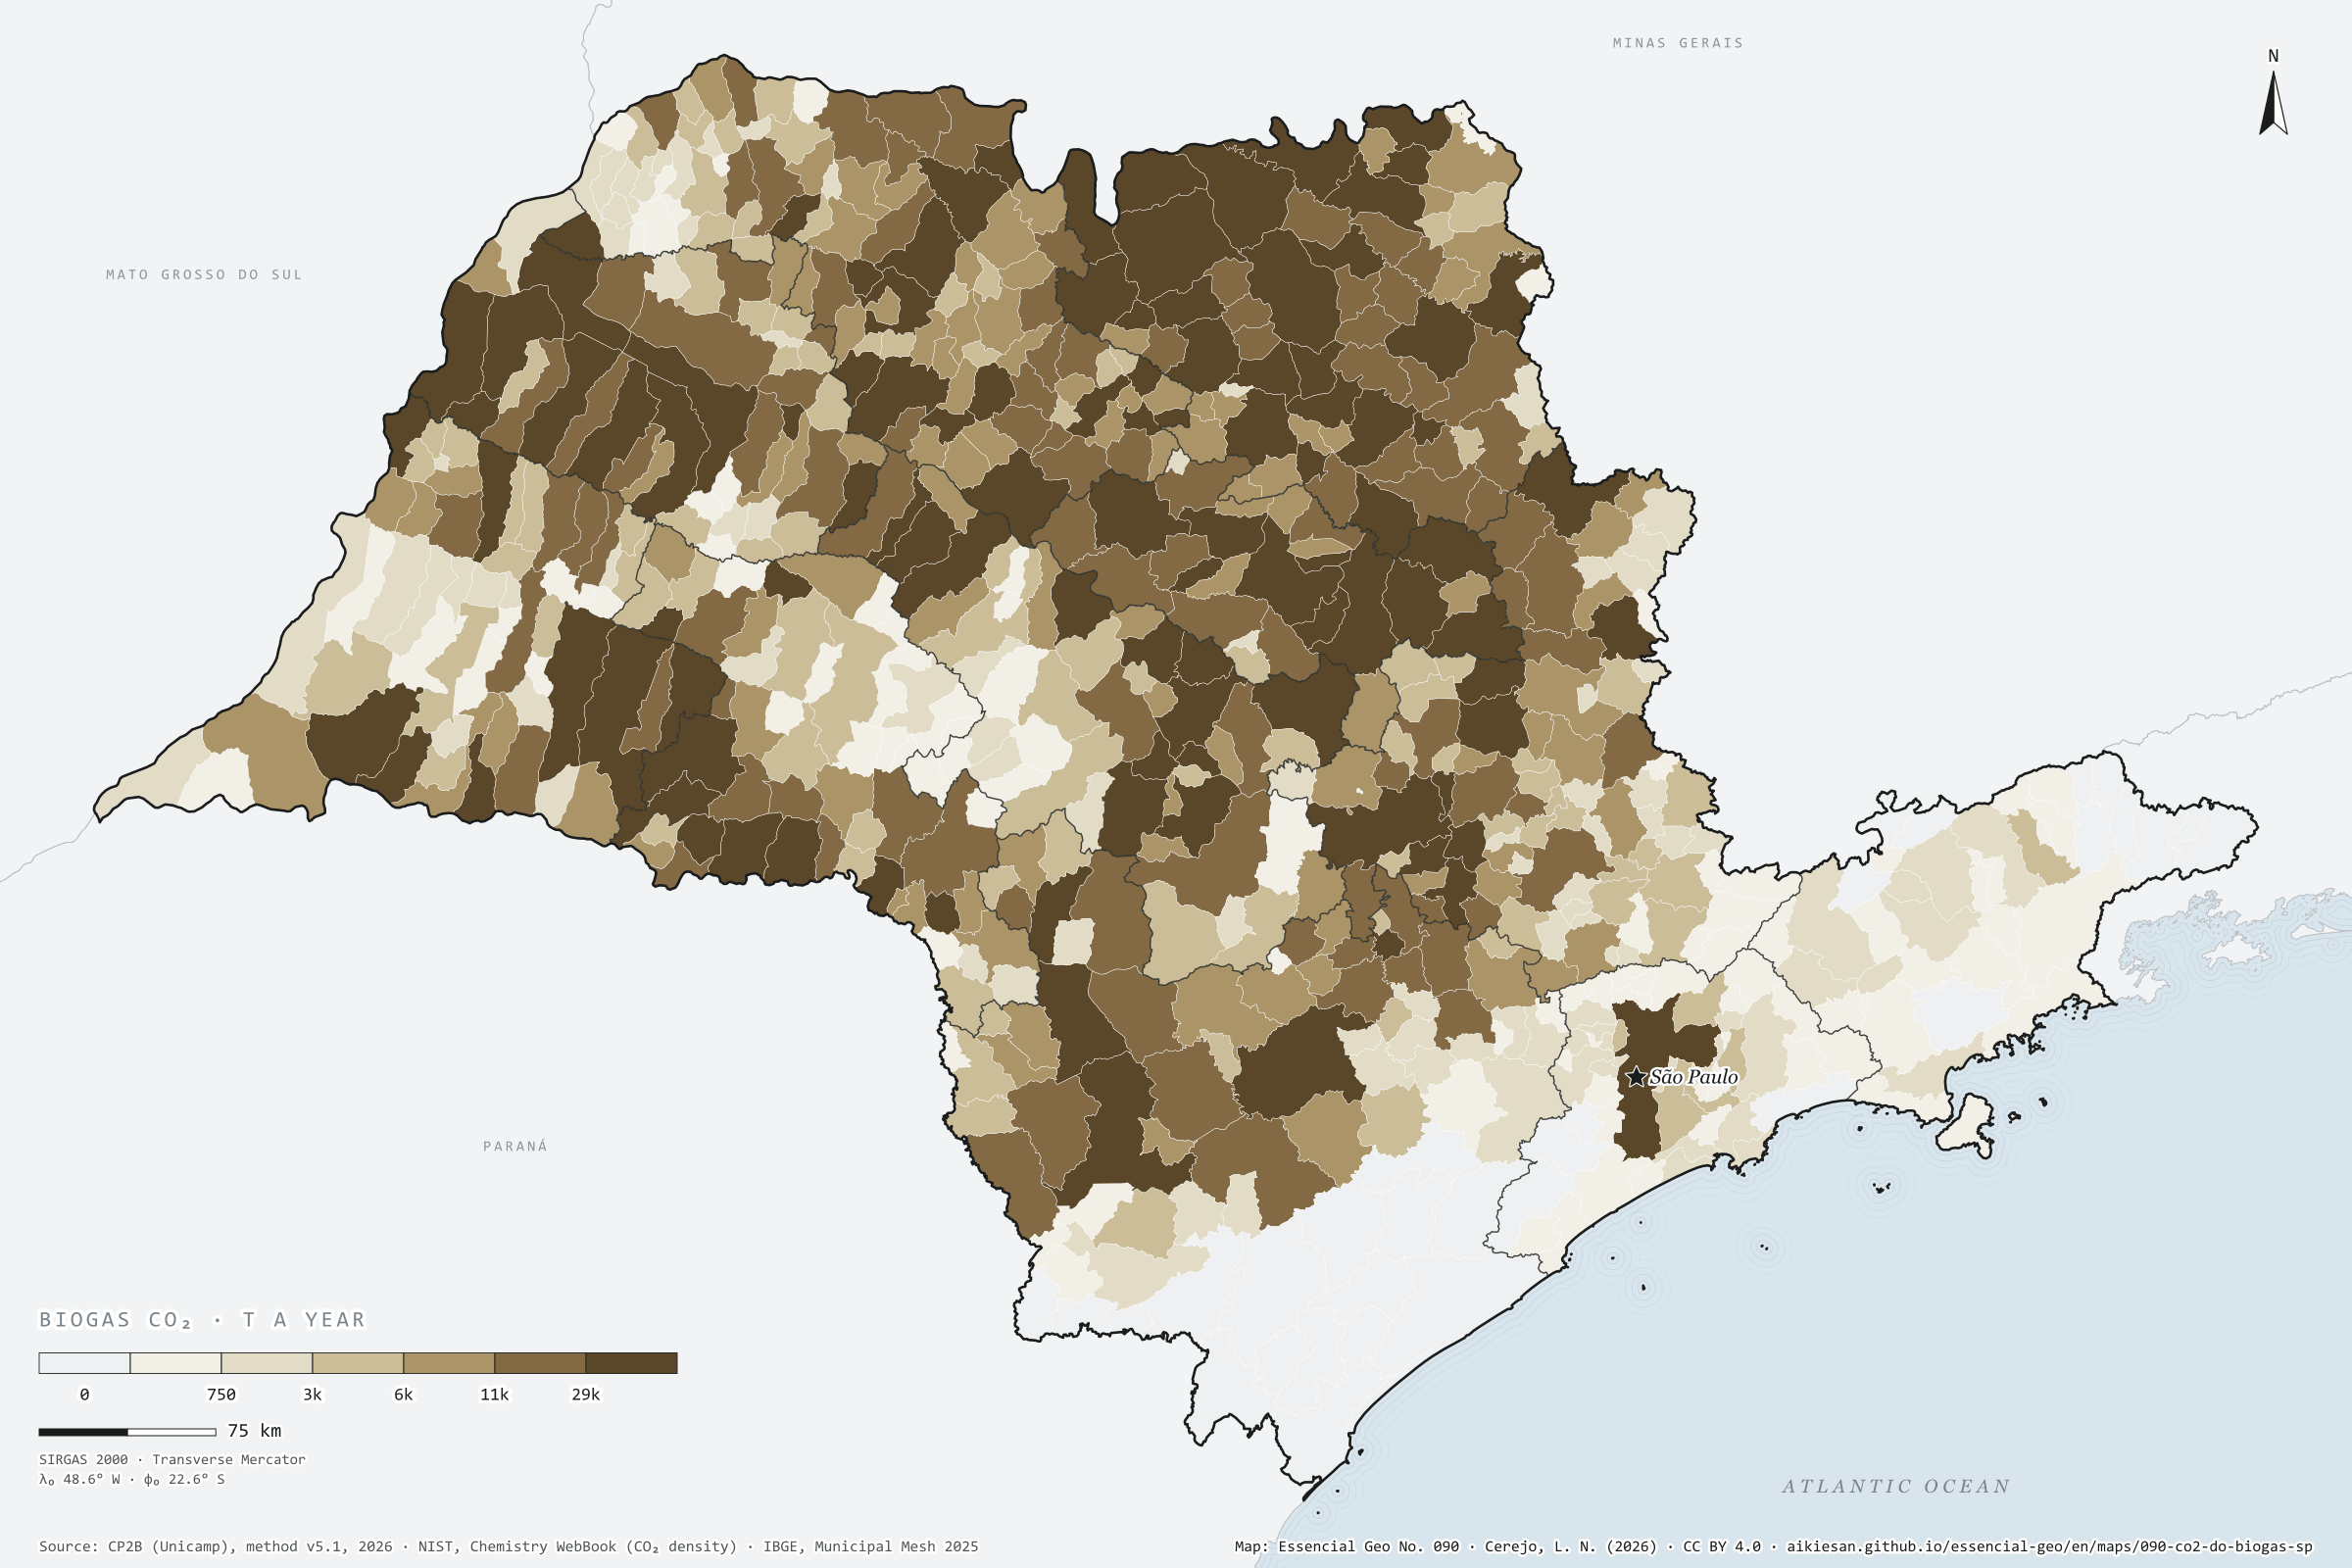
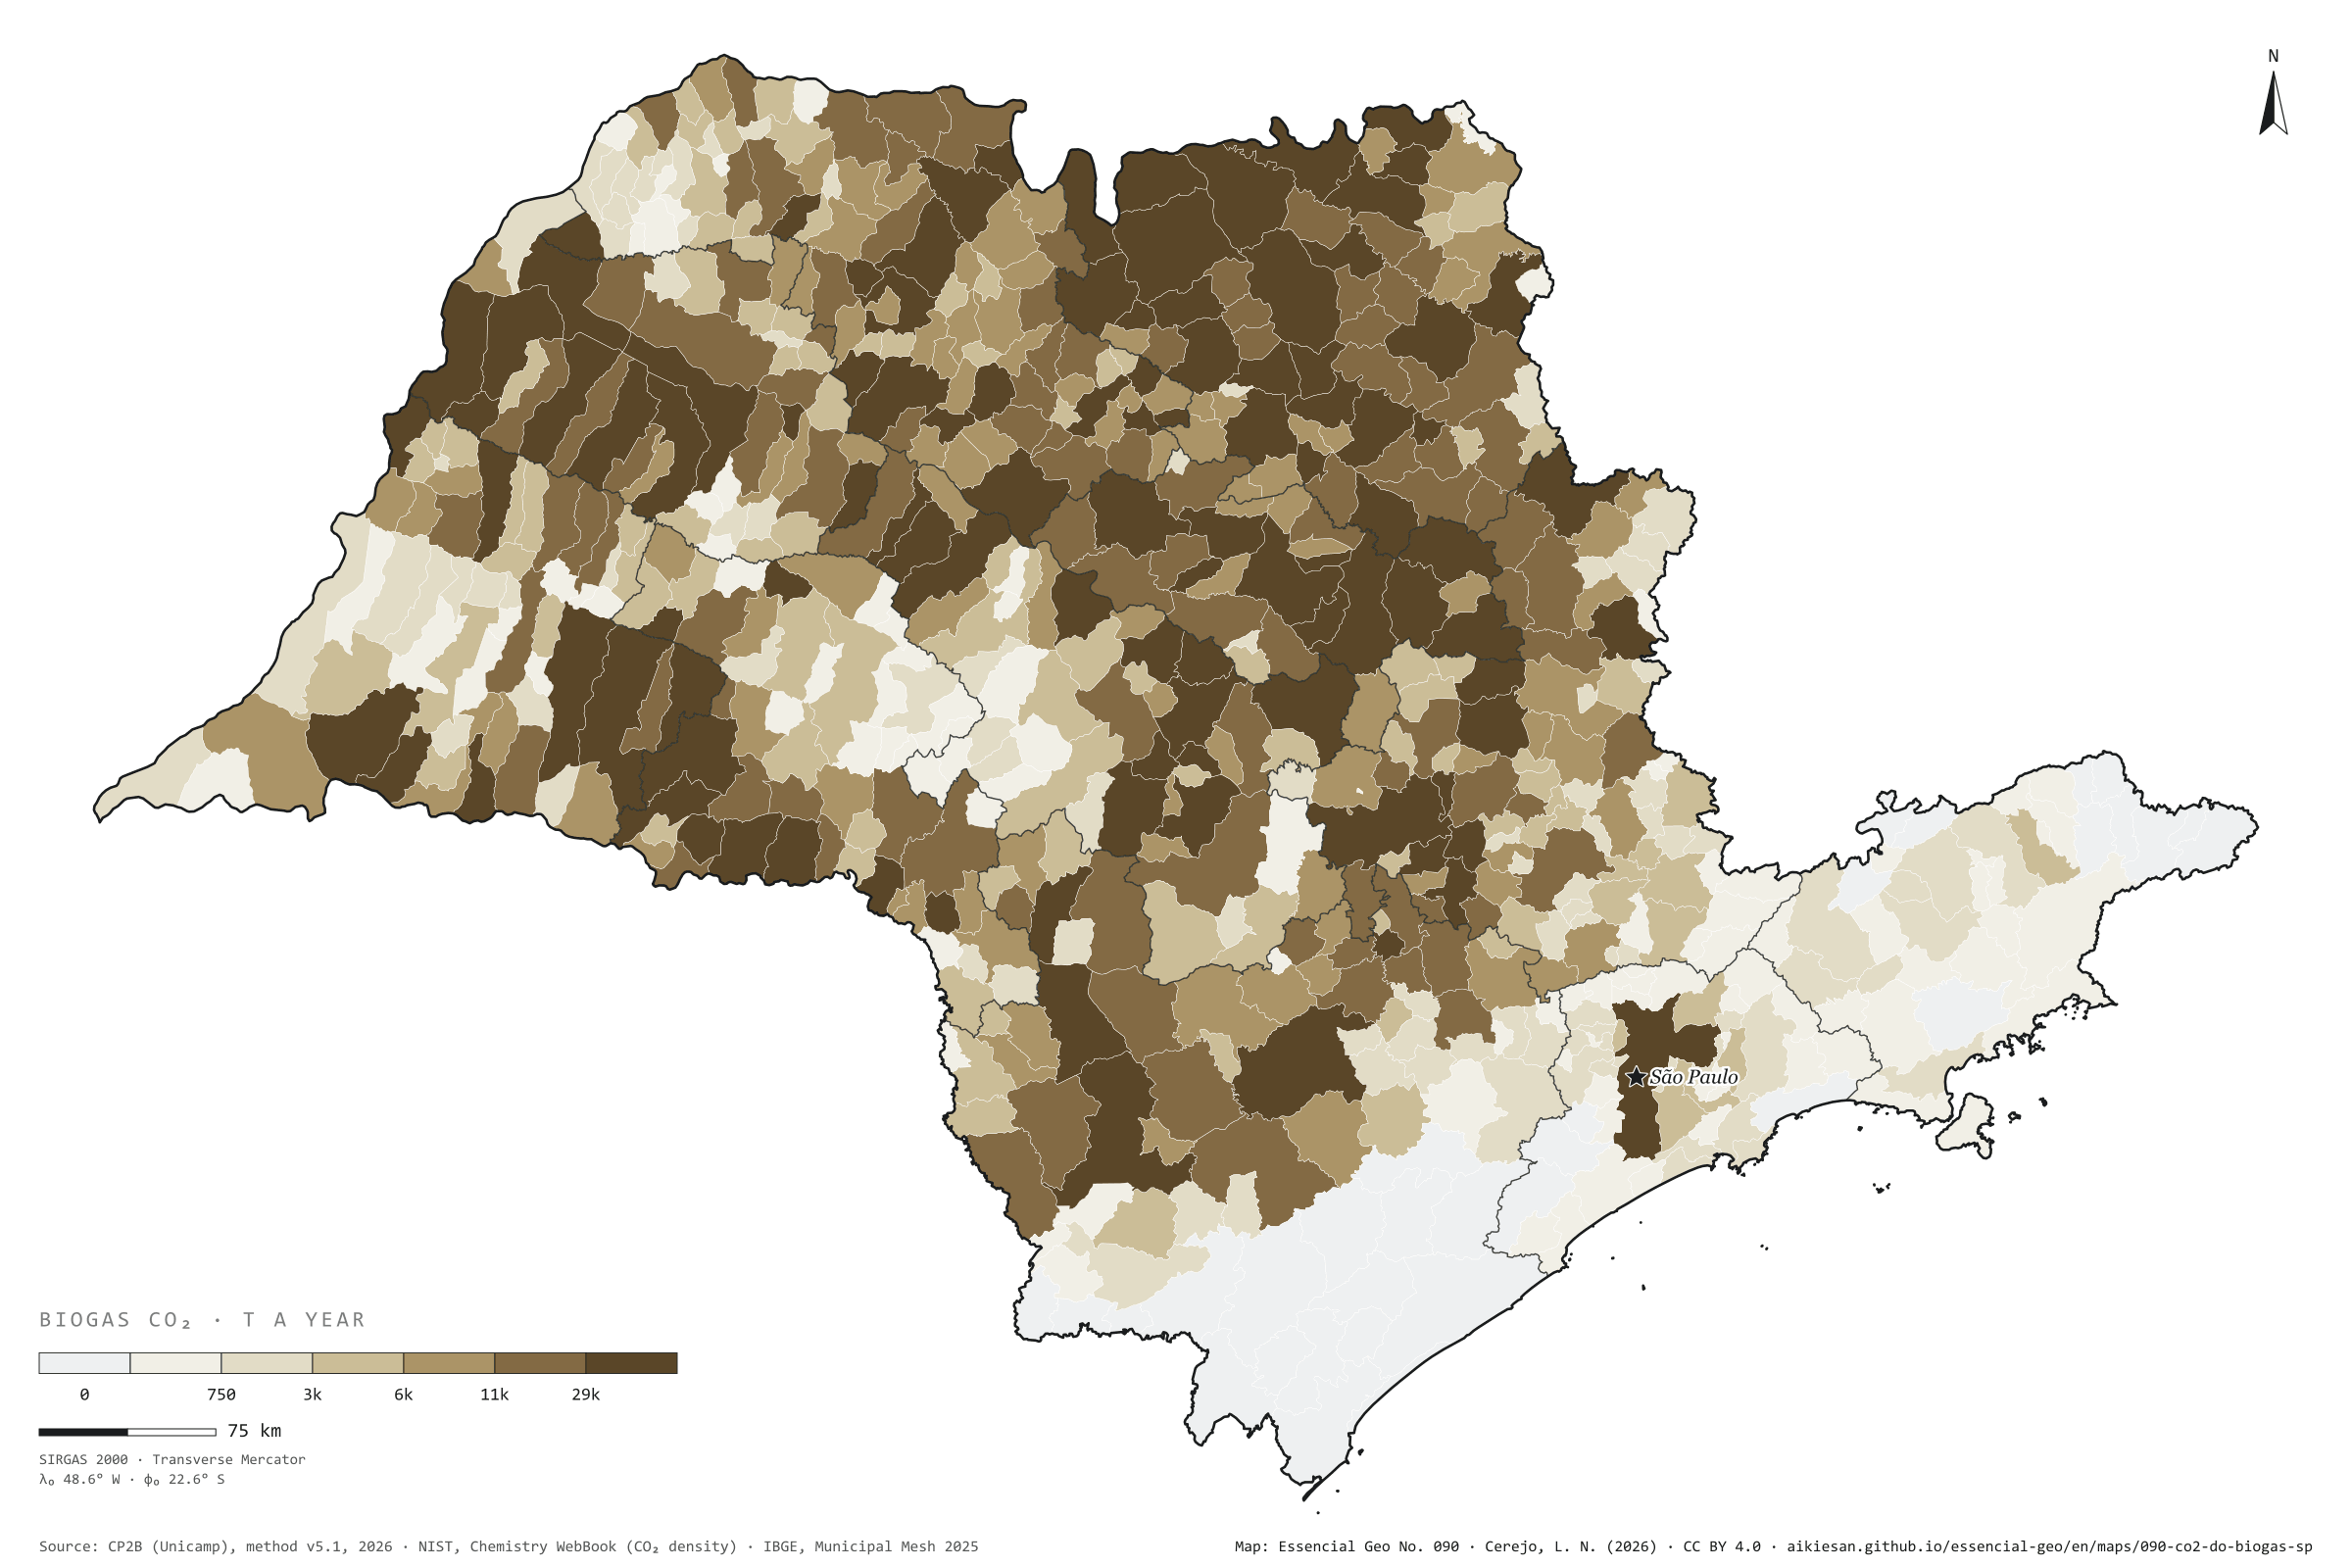
To become biomethane, biogas must shed its CO₂, almost half its volume
Fig. 090São Paulo State (SP)EPSG:4674Source: CP2B (Unicamp), NIST, IBGE
Biogas leaves the digester as methane and CO₂; the CO₂ takes up 32% to 48% of the volume, depending on the residue. To become biomethane, which can enter the gas grid, biogas goes through upgrading, which separates out this CO₂, a concentrated, biogenic gas. If all the possible biogas in São Paulo were made and upgraded, on the CP2B potential (level N4, reference scenario), about 9.1 million t of CO₂ a year would come out, almost as much as the ethanol vats release in a harvest. 82% would come from cane residues: vinasse, filter cake, bagasse and straw. Guaíra leads with 178,000 t, followed by Morro Agudo with 154,000 and Sertãozinho with 136,000; the capital reaches 72,000 t from organic waste, pruning and sewage sludge. It is a potential, not a current emission, and an estimate. Second plate of the collection “Biogenic carbon”.
Technical record · downloads · citation
At a glance
Where the biogas CO₂ would come from (t a year)
sugarcane residues82.2%
other crops7.4%
livestock6.5%
waste, pruning and sewage3.9%
Largest municipalities (t of CO₂ a year)
Guaíra177,918
Morro Agudo154,321
Sertãozinho136,382
Pontal119,943
Pitangueiras112,591
Layers
municipiospolygon645 municipalities: biogas upgrading CO₂, total and by group (cane, crops, livestock, urban), and N4 biogas (same GPKG as plate 089)
For each municipality and residue, the biogas of the CP2B v5.1 potential (level N4, reference scenario) times the share of the volume that is not methane (1 − the residue’s CH₄ fraction), converted to mass at 1.977 kg of CO₂ per normal m³; summed by municipality and by residue group.
The map without a frame, with legend, scale, reference system and credit written on it: ready for papers, lectures and slides. In two versions: with the basemap (neighbours and sea) or only the mapped area, on white.
CEREJO, Lucas Nakamura. O CO₂ do biogás: para virar biometano, o biogás solta o CO₂, quase metade do volume. Versão 1.0.0. [S. l.]: Essencial, 2026. Conjunto de dados. Disponível em: https://aikiesan.github.io/essencial-geo/en/maps/090-co2-do-biogas-sp/. Acesso em: 10 nov. 2026.
Cerejo, L. N. (2026). O CO₂ do biogás: para virar biometano, o biogás solta o CO₂, quase metade do volume [The CO₂ in biogas: To become biomethane, biogas must shed its CO₂, almost half its volume] (Version 1.0.0) [Data set]. Essencial. https://aikiesan.github.io/essencial-geo/en/maps/090-co2-do-biogas-sp/
@dataset{cerejo2026_co2_do_biogas_sp,
  author    = {Cerejo, Lucas Nakamura},
  title     = {O CO₂ do biogás: Para virar biometano, o biogás solta o CO₂, quase metade do volume},
  year      = {2026},
  publisher = {Essencial},
  version   = {1.0.0},
  url       = {https://aikiesan.github.io/essencial-geo/en/maps/090-co2-do-biogas-sp/},
  language  = {portuguese},
  note      = {English title: The CO₂ in biogas: To become biomethane, biogas must shed its CO₂, almost half its volume. Licence CC BY 4.0}
}
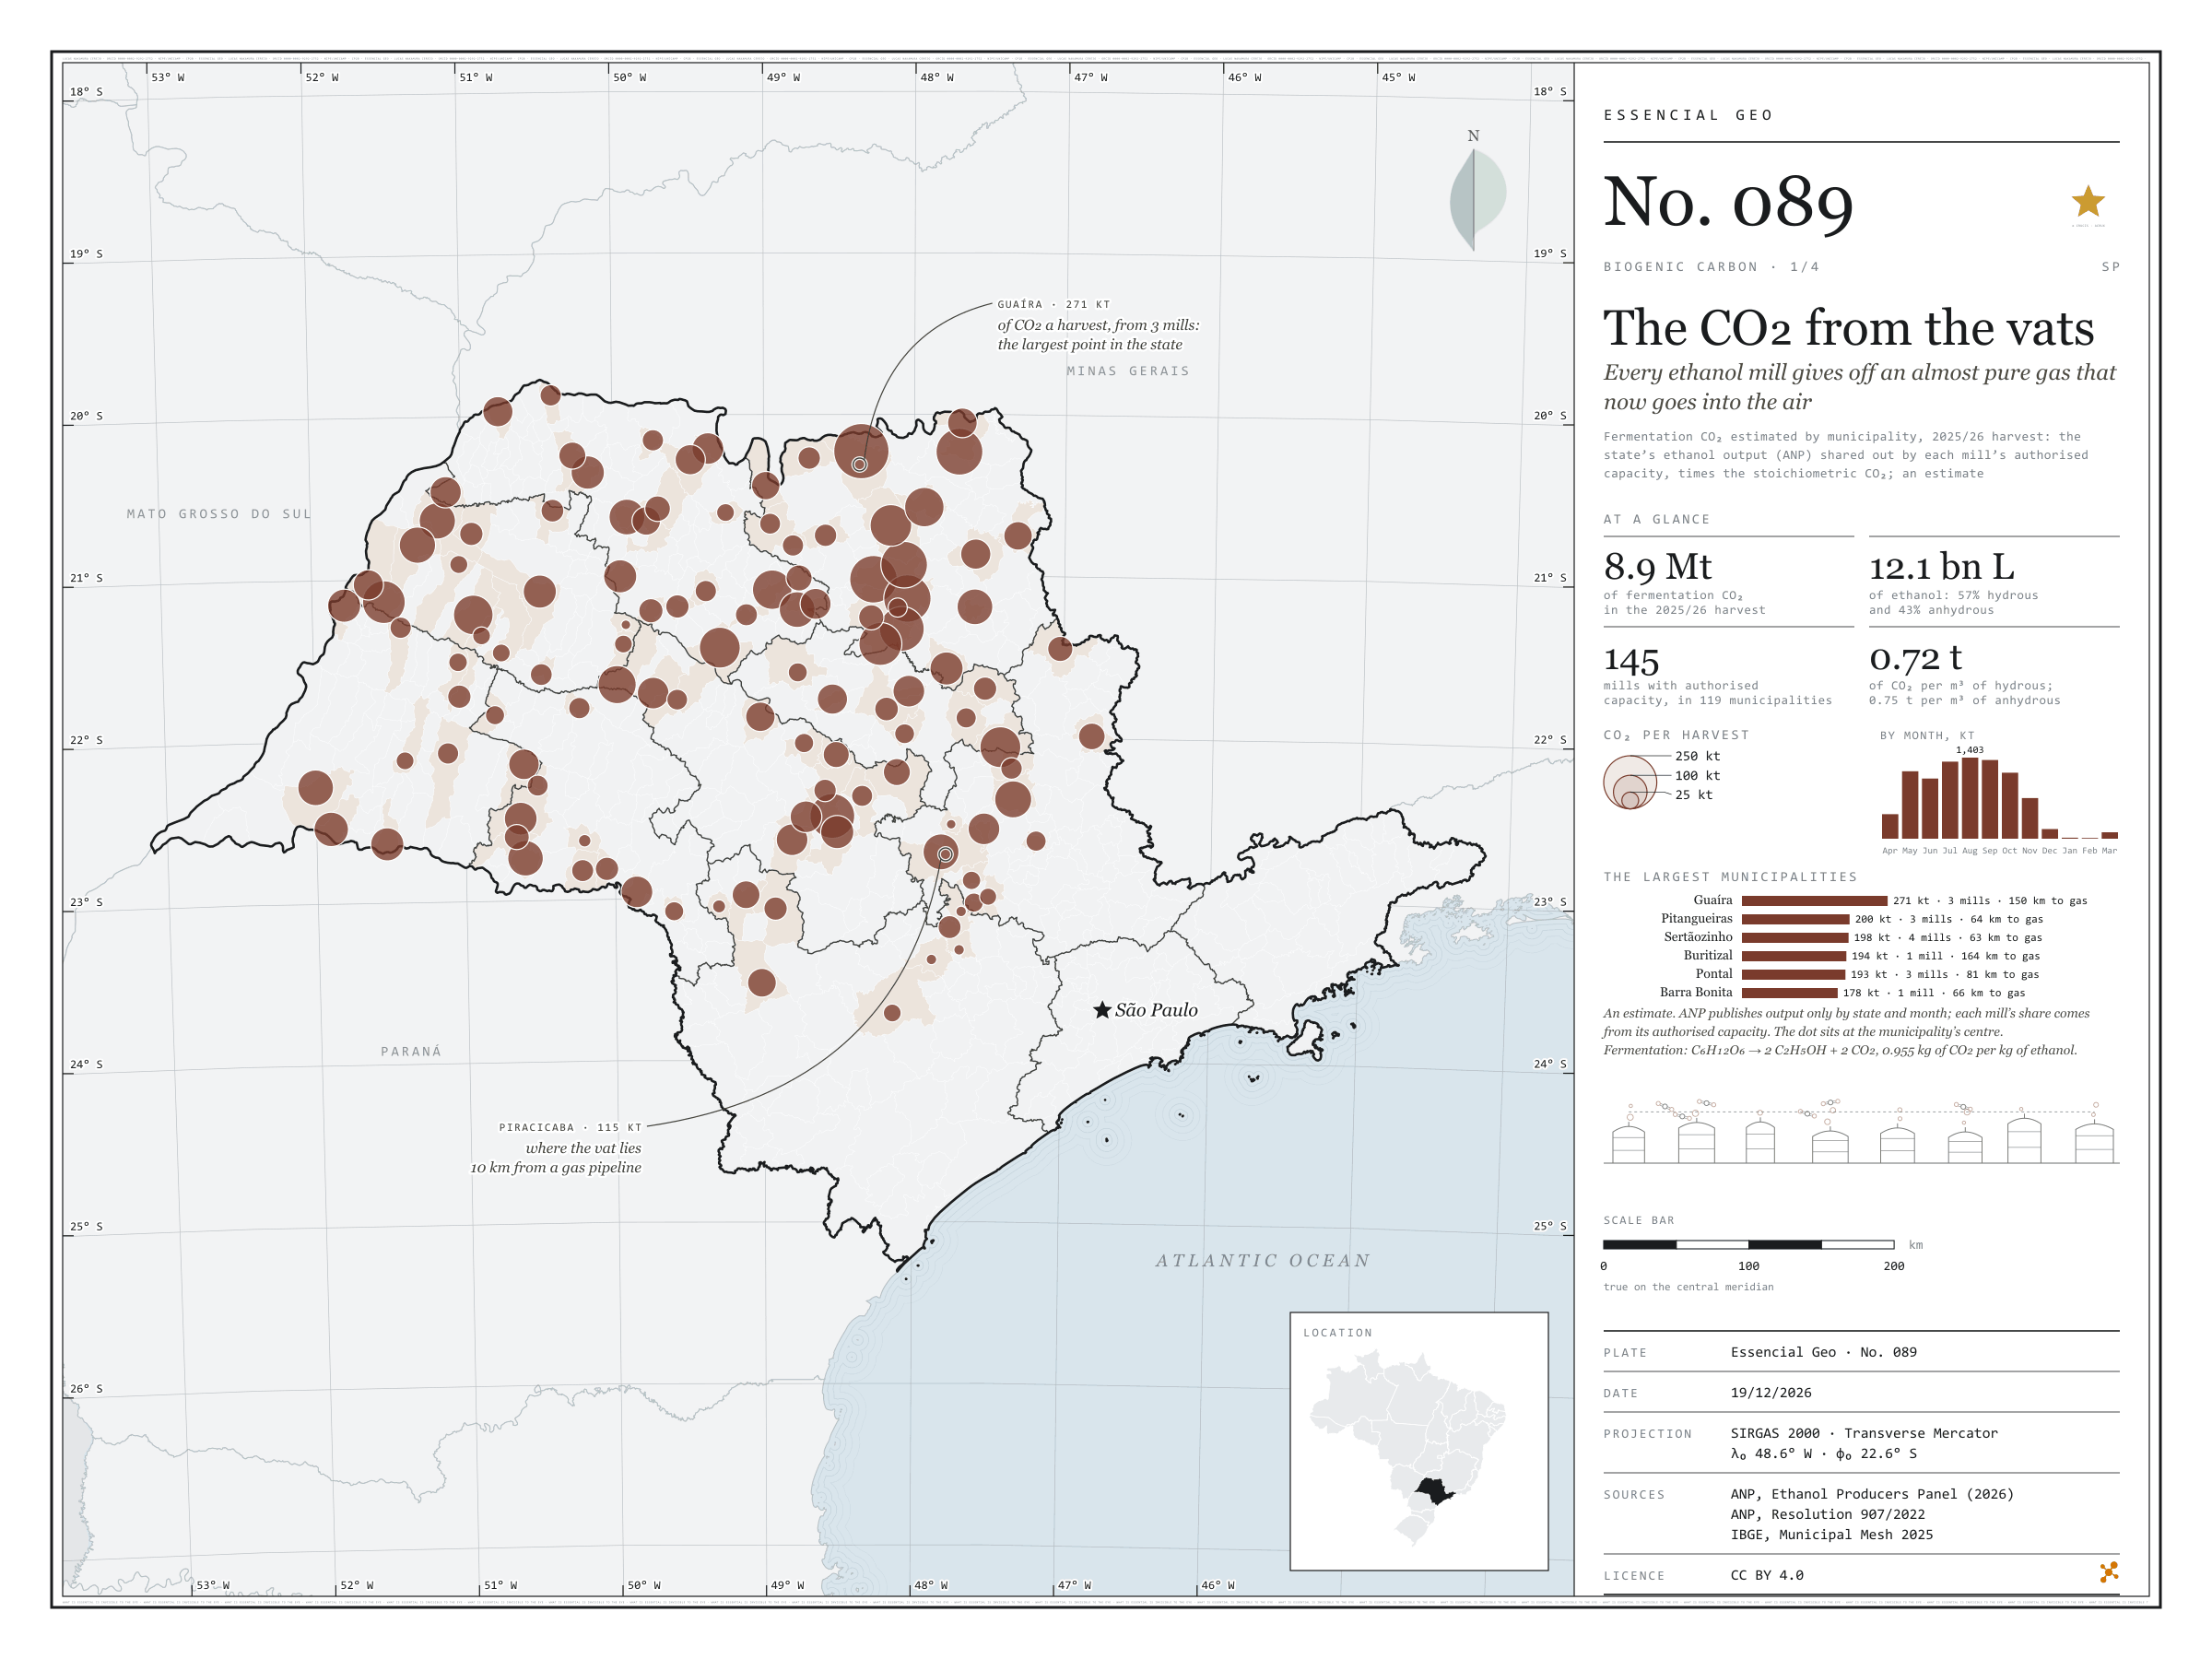
Every ethanol mill gives off an almost pure gas that now goes into the air
Fig. 089São Paulo State (SP)EPSG:4674Source: ANP, Kheshgi, H. S. and Prince, R. C. (2005). Sequestration of fermentation CO₂ from ethanol production. Energy, 30, 1865–1871, EPE, IBGE
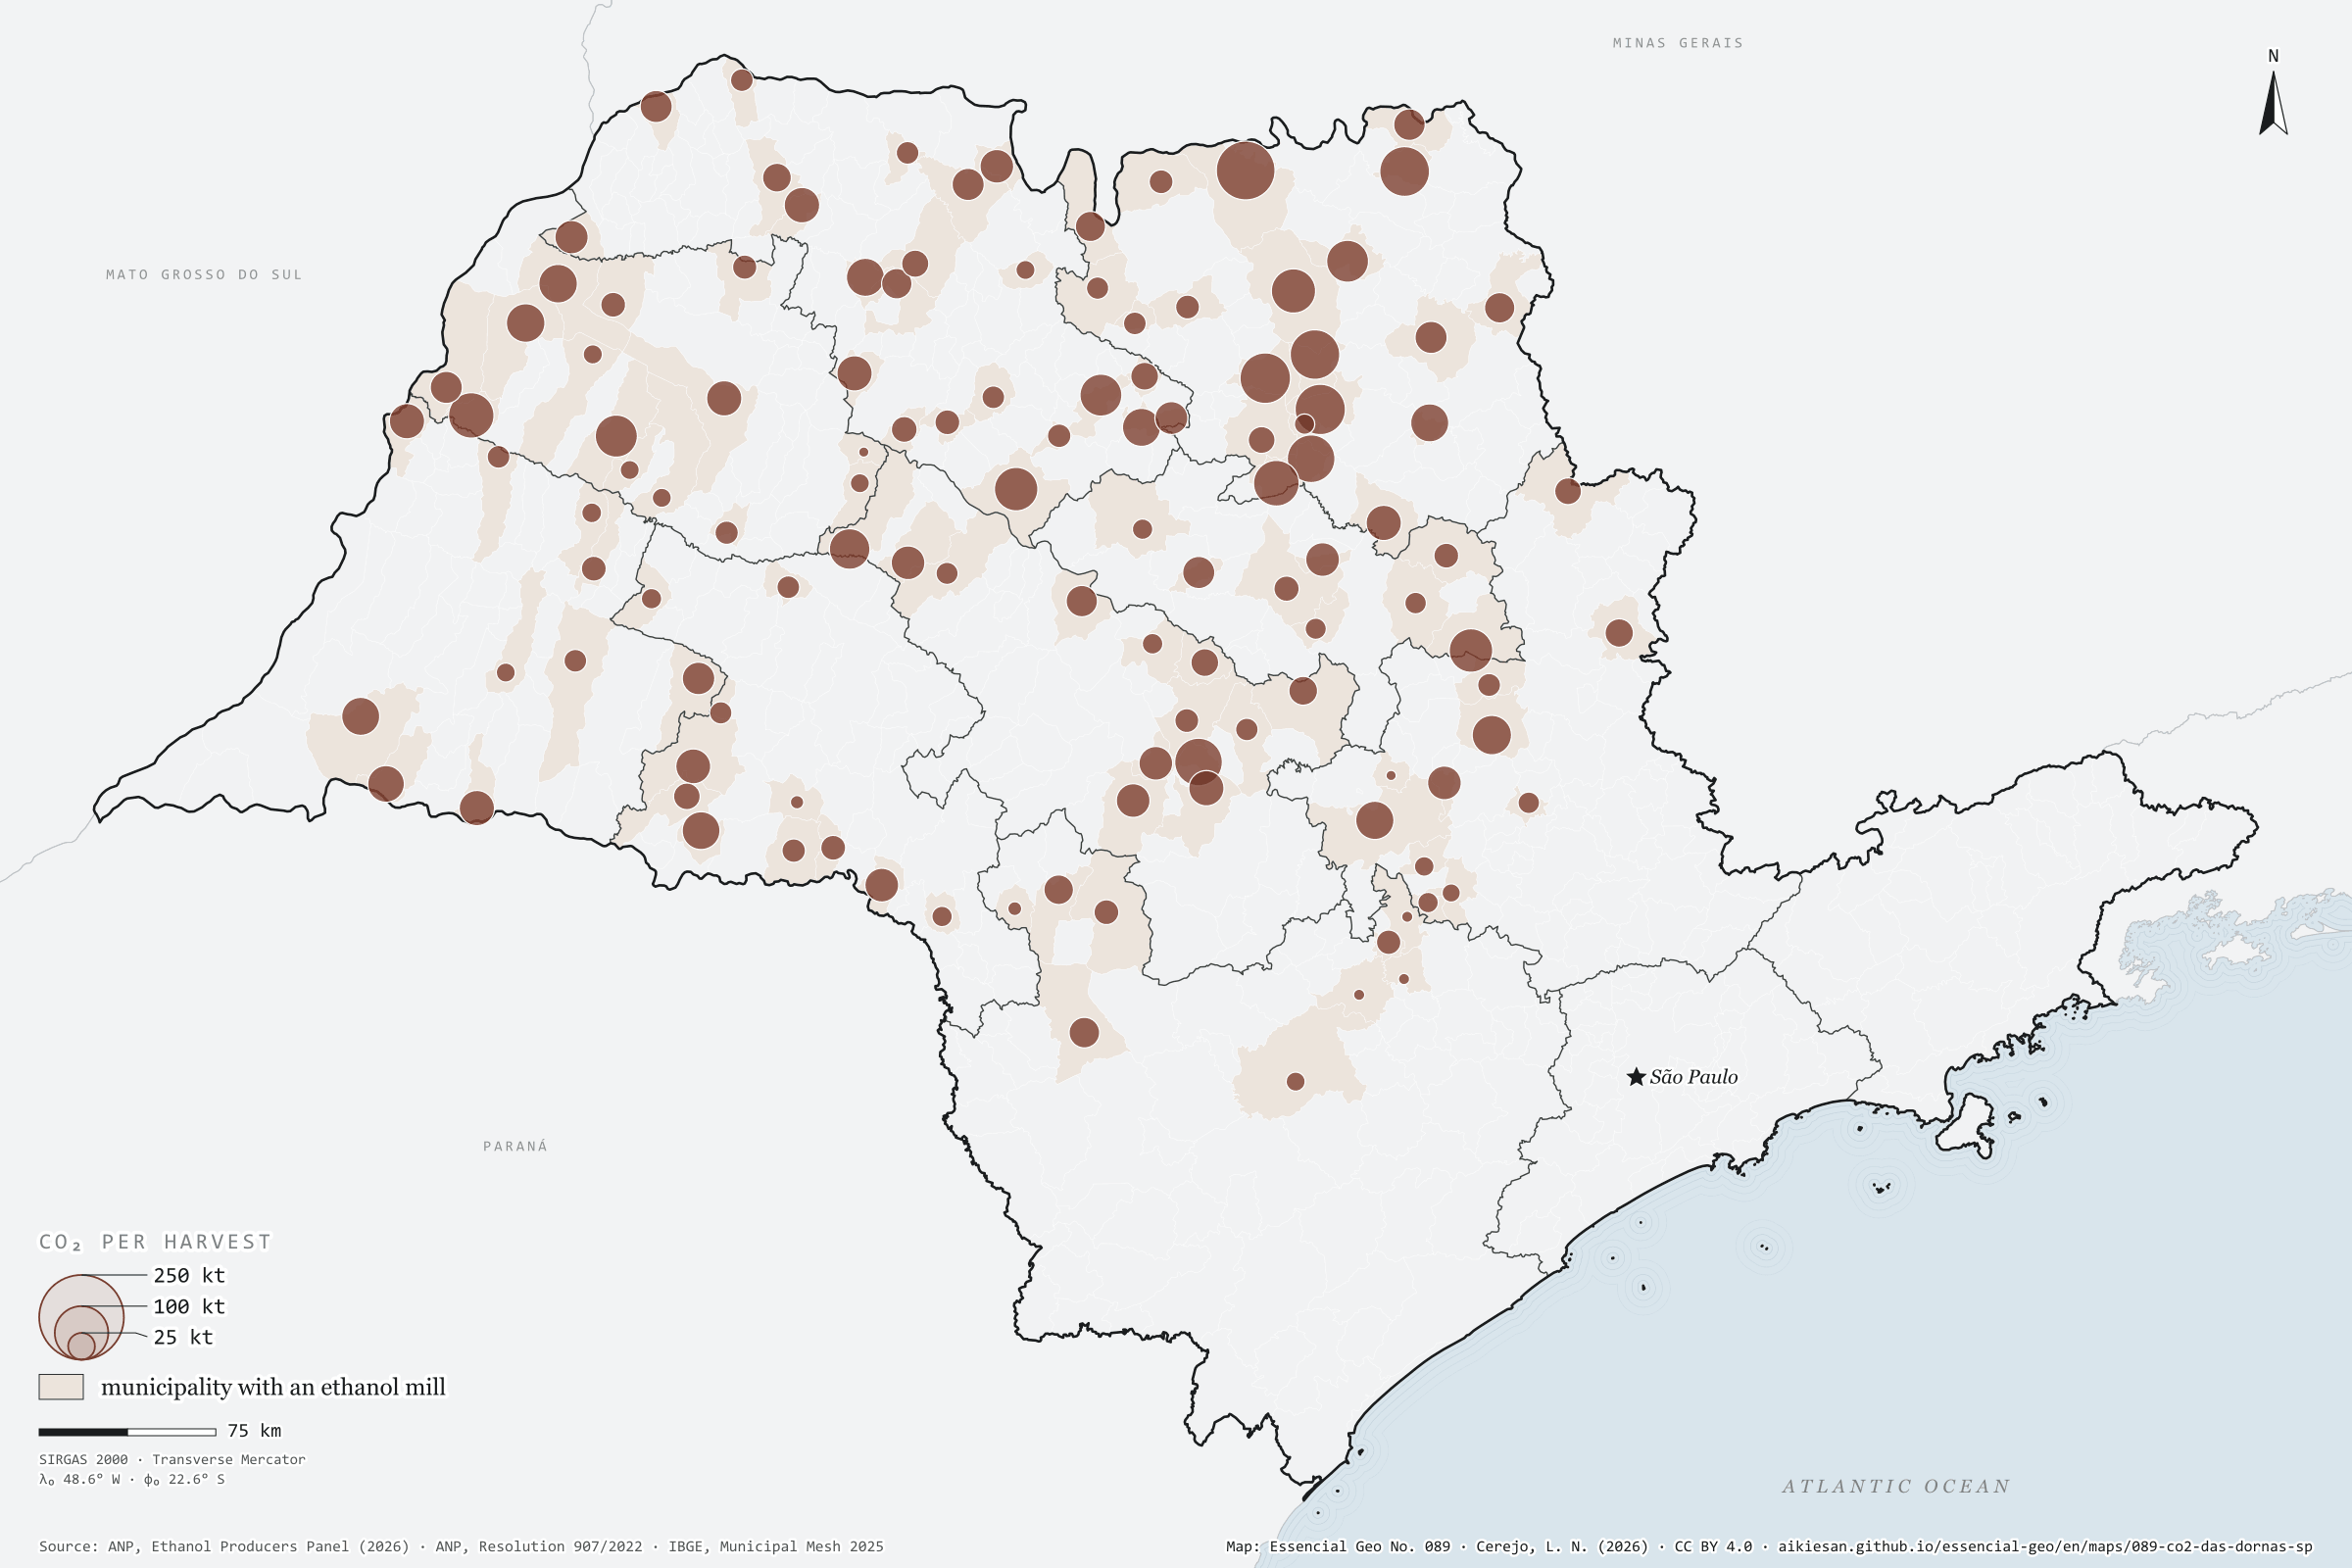
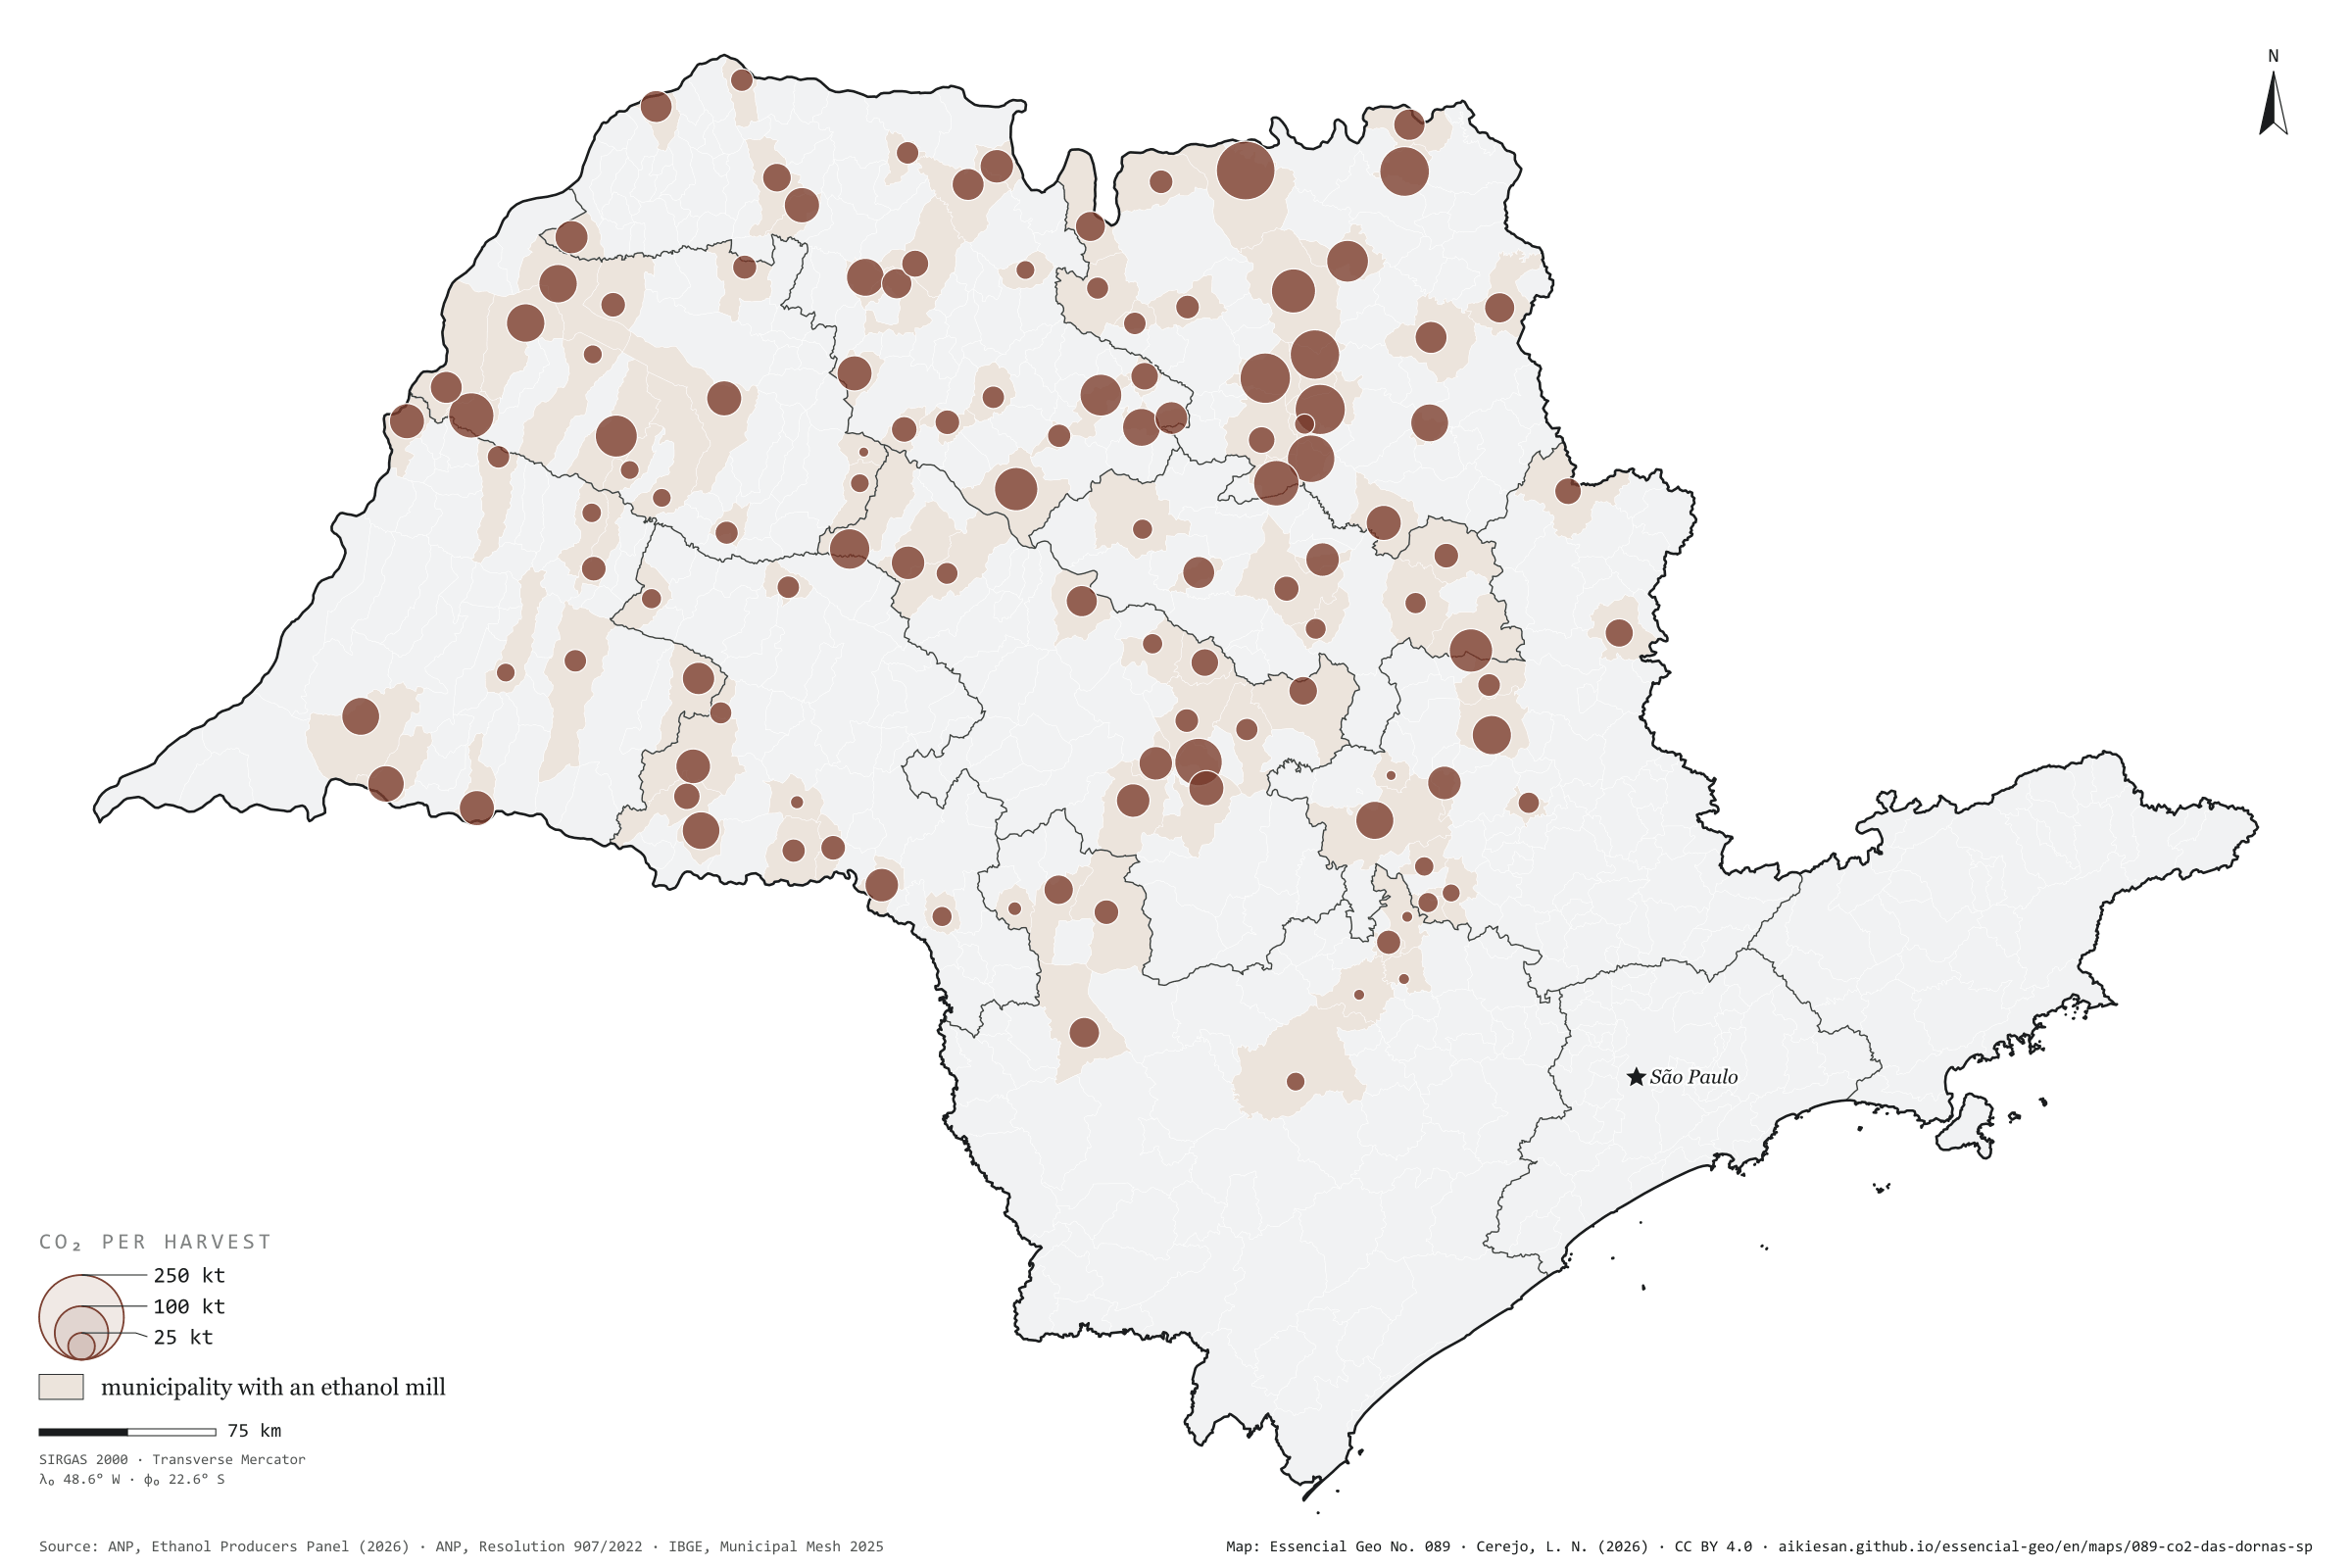
In the fermentation vat, yeast turns cane sugar into ethanol and releases CO₂ in step: 0.955 kg of gas per kg of alcohol, about 0.75 t per m³. It is almost pure CO₂, of biological origin, and today it goes into the air. In the 2025/26 harvest, São Paulo’s mills made 12.1 billion litres of ethanol; by stoichiometry, about 8.9 million tonnes of CO₂ left the vats, from 145 mills in 119 municipalities. Guaíra, with three mills, leads with about 271,000 t; Pitangueiras, Sertãozinho and Buritizal each pass 190,000. The gas follows the crushing season: 1.4 million t in August and almost nothing from December to March. As ANP publishes output only by state, each mill’s share is estimated from its authorised capacity; everything here is an estimate. First plate of the collection “Biogenic carbon”.
Technical record · downloads · citation
At a glance
Fermentation CO₂ in the 2025/26 harvest
8.9million t
Largest municipalities (t of CO₂ a harvest)
Guaíra271,110
Pitangueiras200,298
Sertãozinho198,274
Buritizal194,228
Pontal192,609
Barra Bonita178,042
Layers
usinas_etanolpoint145 SP mills with authorised capacity in the harvest: estimated ethanol and CO₂, at the municipality’s interior point
municipiospolygon645 municipalities: fermentation CO₂ (2025/26 harvest and 2024), biogas, fossil and possible e-methane
São Paulo’s anhydrous and hydrous ethanol output in the 2025/26 harvest (ANP, by month) shared out among mills by their authorised capacity in each month, converted to mass by the density in the ANP specification and to CO₂ by the stoichiometry of alcoholic fermentation (0.955 kg of CO₂ per kg of ethanol); summed by municipality.
The map without a frame, with legend, scale, reference system and credit written on it: ready for papers, lectures and slides. In two versions: with the basemap (neighbours and sea) or only the mapped area, on white.
CEREJO, Lucas Nakamura. O CO₂ das dornas: toda usina de etanol solta um gás quase puro, que hoje vai para o ar. Versão 1.0.0. [S. l.]: Essencial, 2026. Conjunto de dados. Disponível em: https://aikiesan.github.io/essencial-geo/en/maps/089-co2-das-dornas-sp/. Acesso em: 10 nov. 2026.
Cerejo, L. N. (2026). O CO₂ das dornas: toda usina de etanol solta um gás quase puro, que hoje vai para o ar [The CO₂ from the vats: Every ethanol mill gives off an almost pure gas that now goes into the air] (Version 1.0.0) [Data set]. Essencial. https://aikiesan.github.io/essencial-geo/en/maps/089-co2-das-dornas-sp/
@dataset{cerejo2026_co2_das_dornas_sp,
  author    = {Cerejo, Lucas Nakamura},
  title     = {O CO₂ das dornas: Toda usina de etanol solta um gás quase puro, que hoje vai para o ar},
  year      = {2026},
  publisher = {Essencial},
  version   = {1.0.0},
  url       = {https://aikiesan.github.io/essencial-geo/en/maps/089-co2-das-dornas-sp/},
  language  = {portuguese},
  note      = {English title: The CO₂ from the vats: Every ethanol mill gives off an almost pure gas that now goes into the air. Licence CC BY 4.0}
}
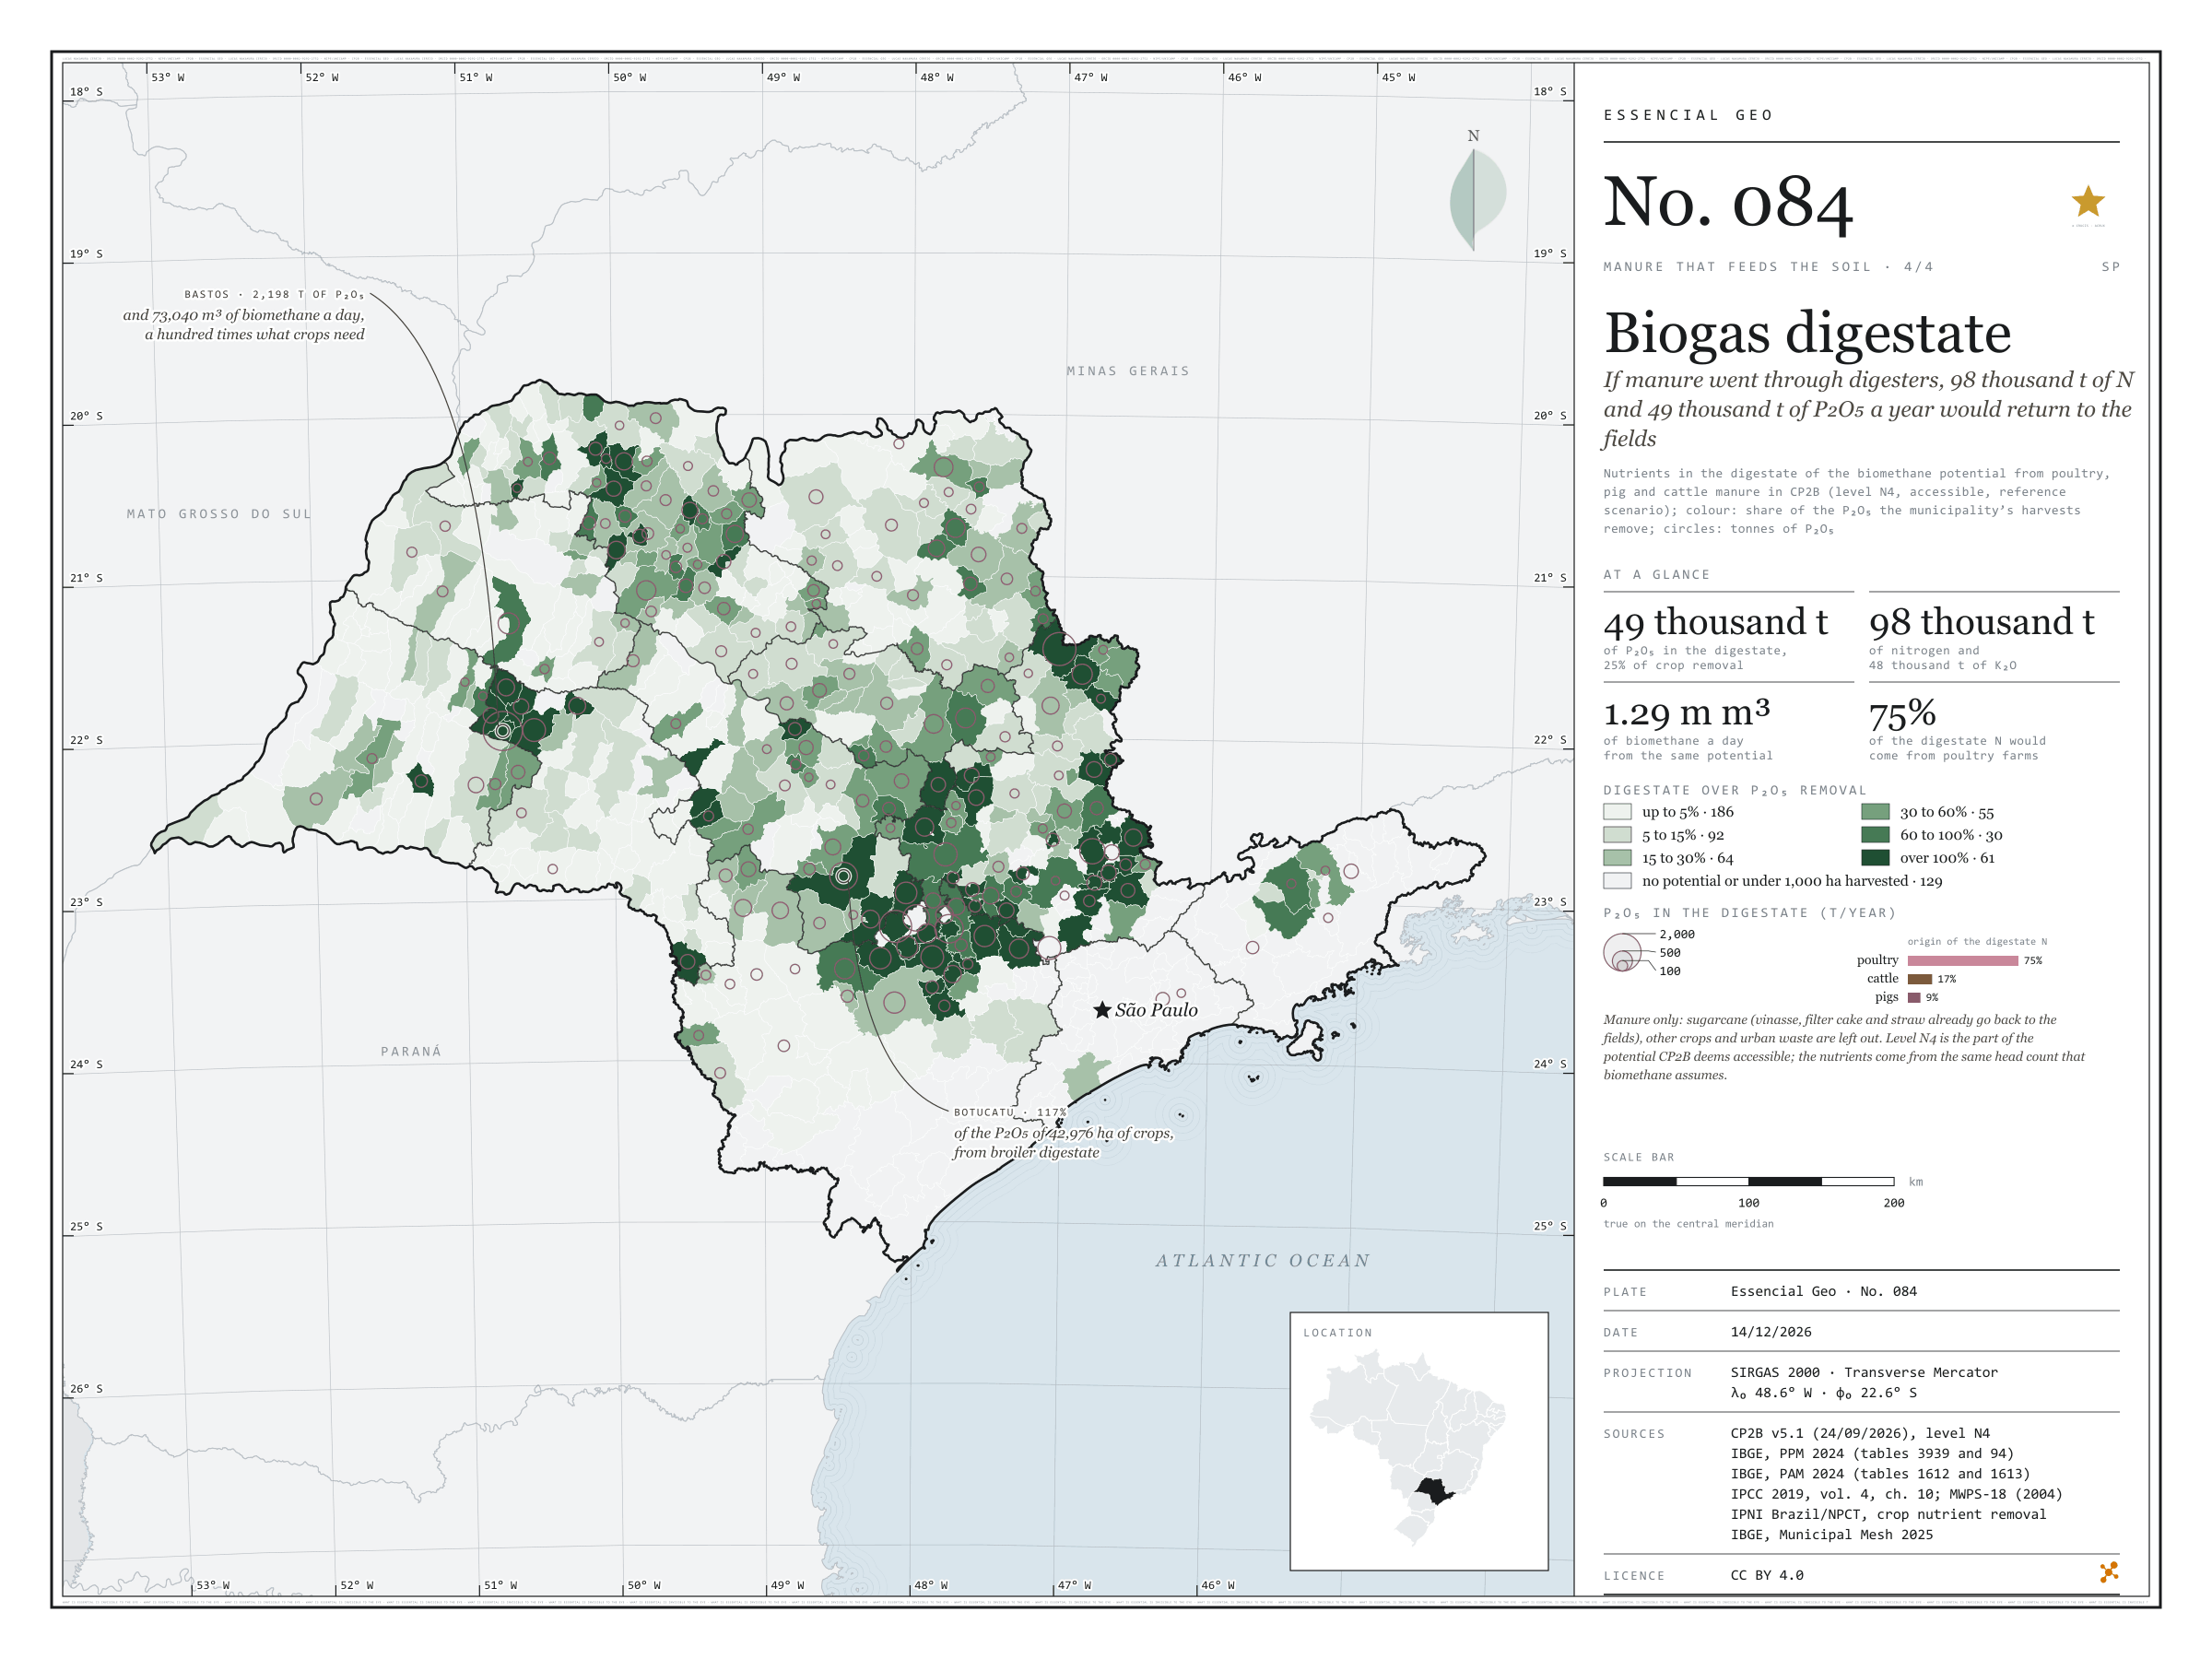
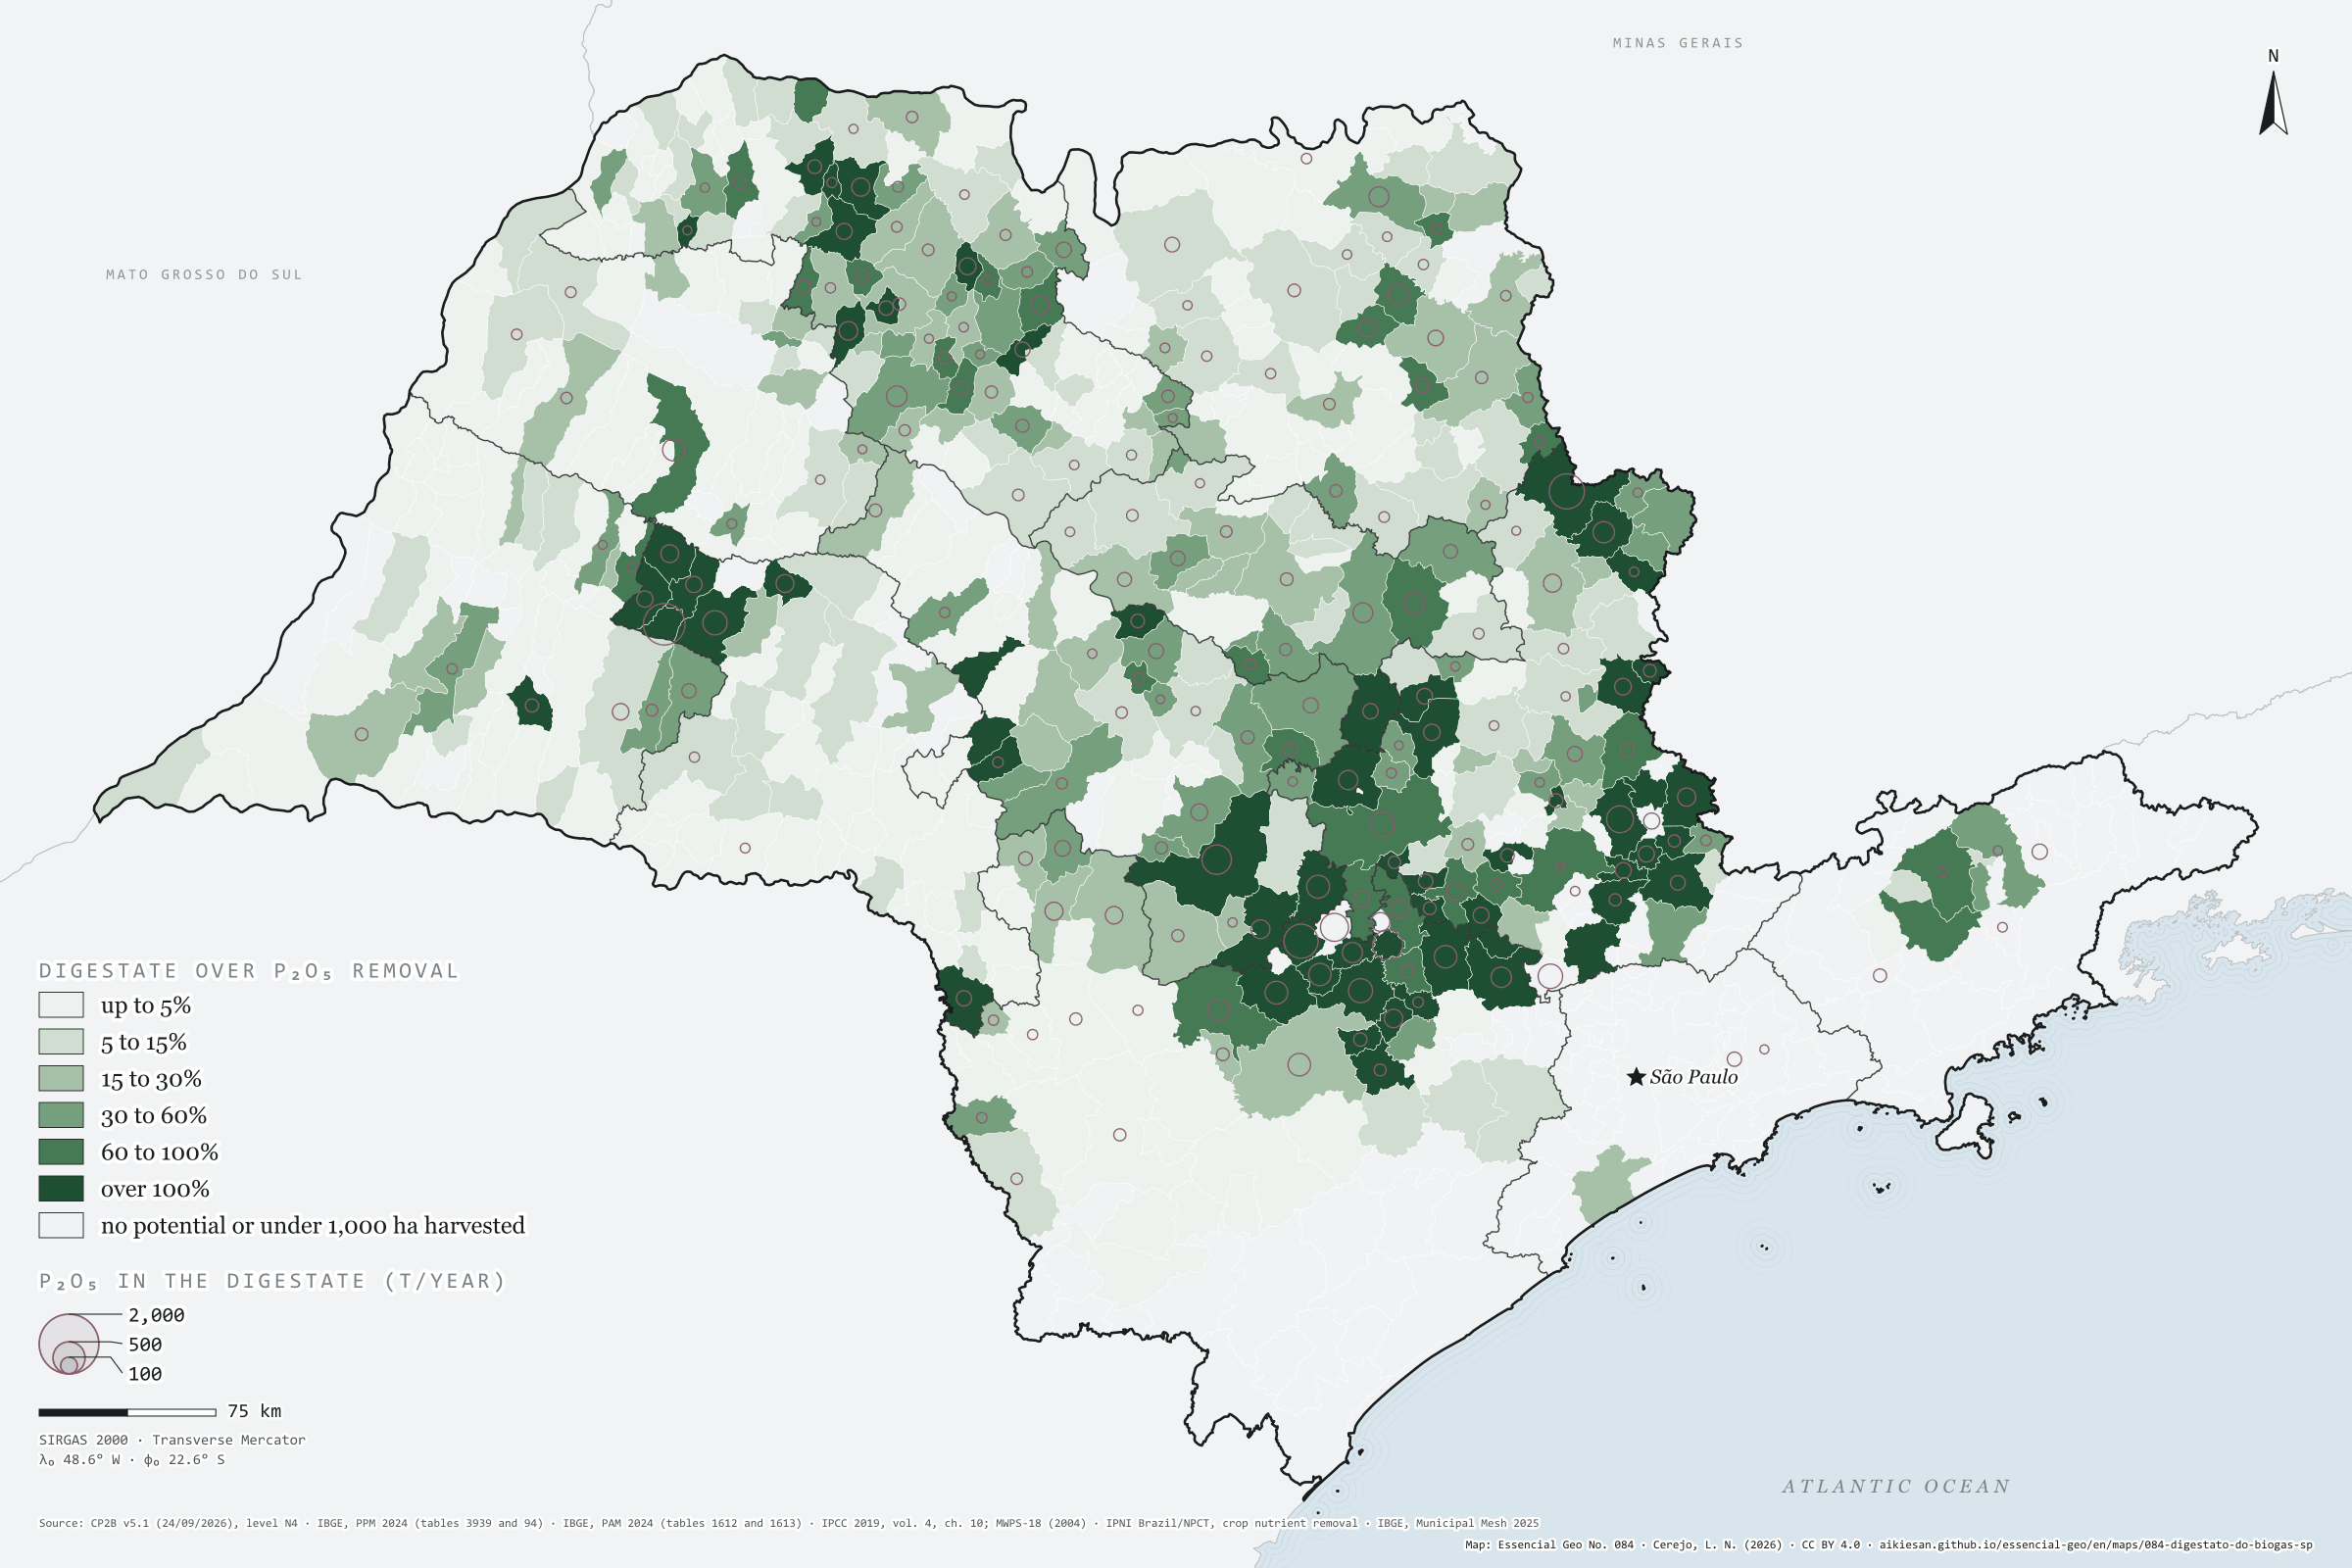
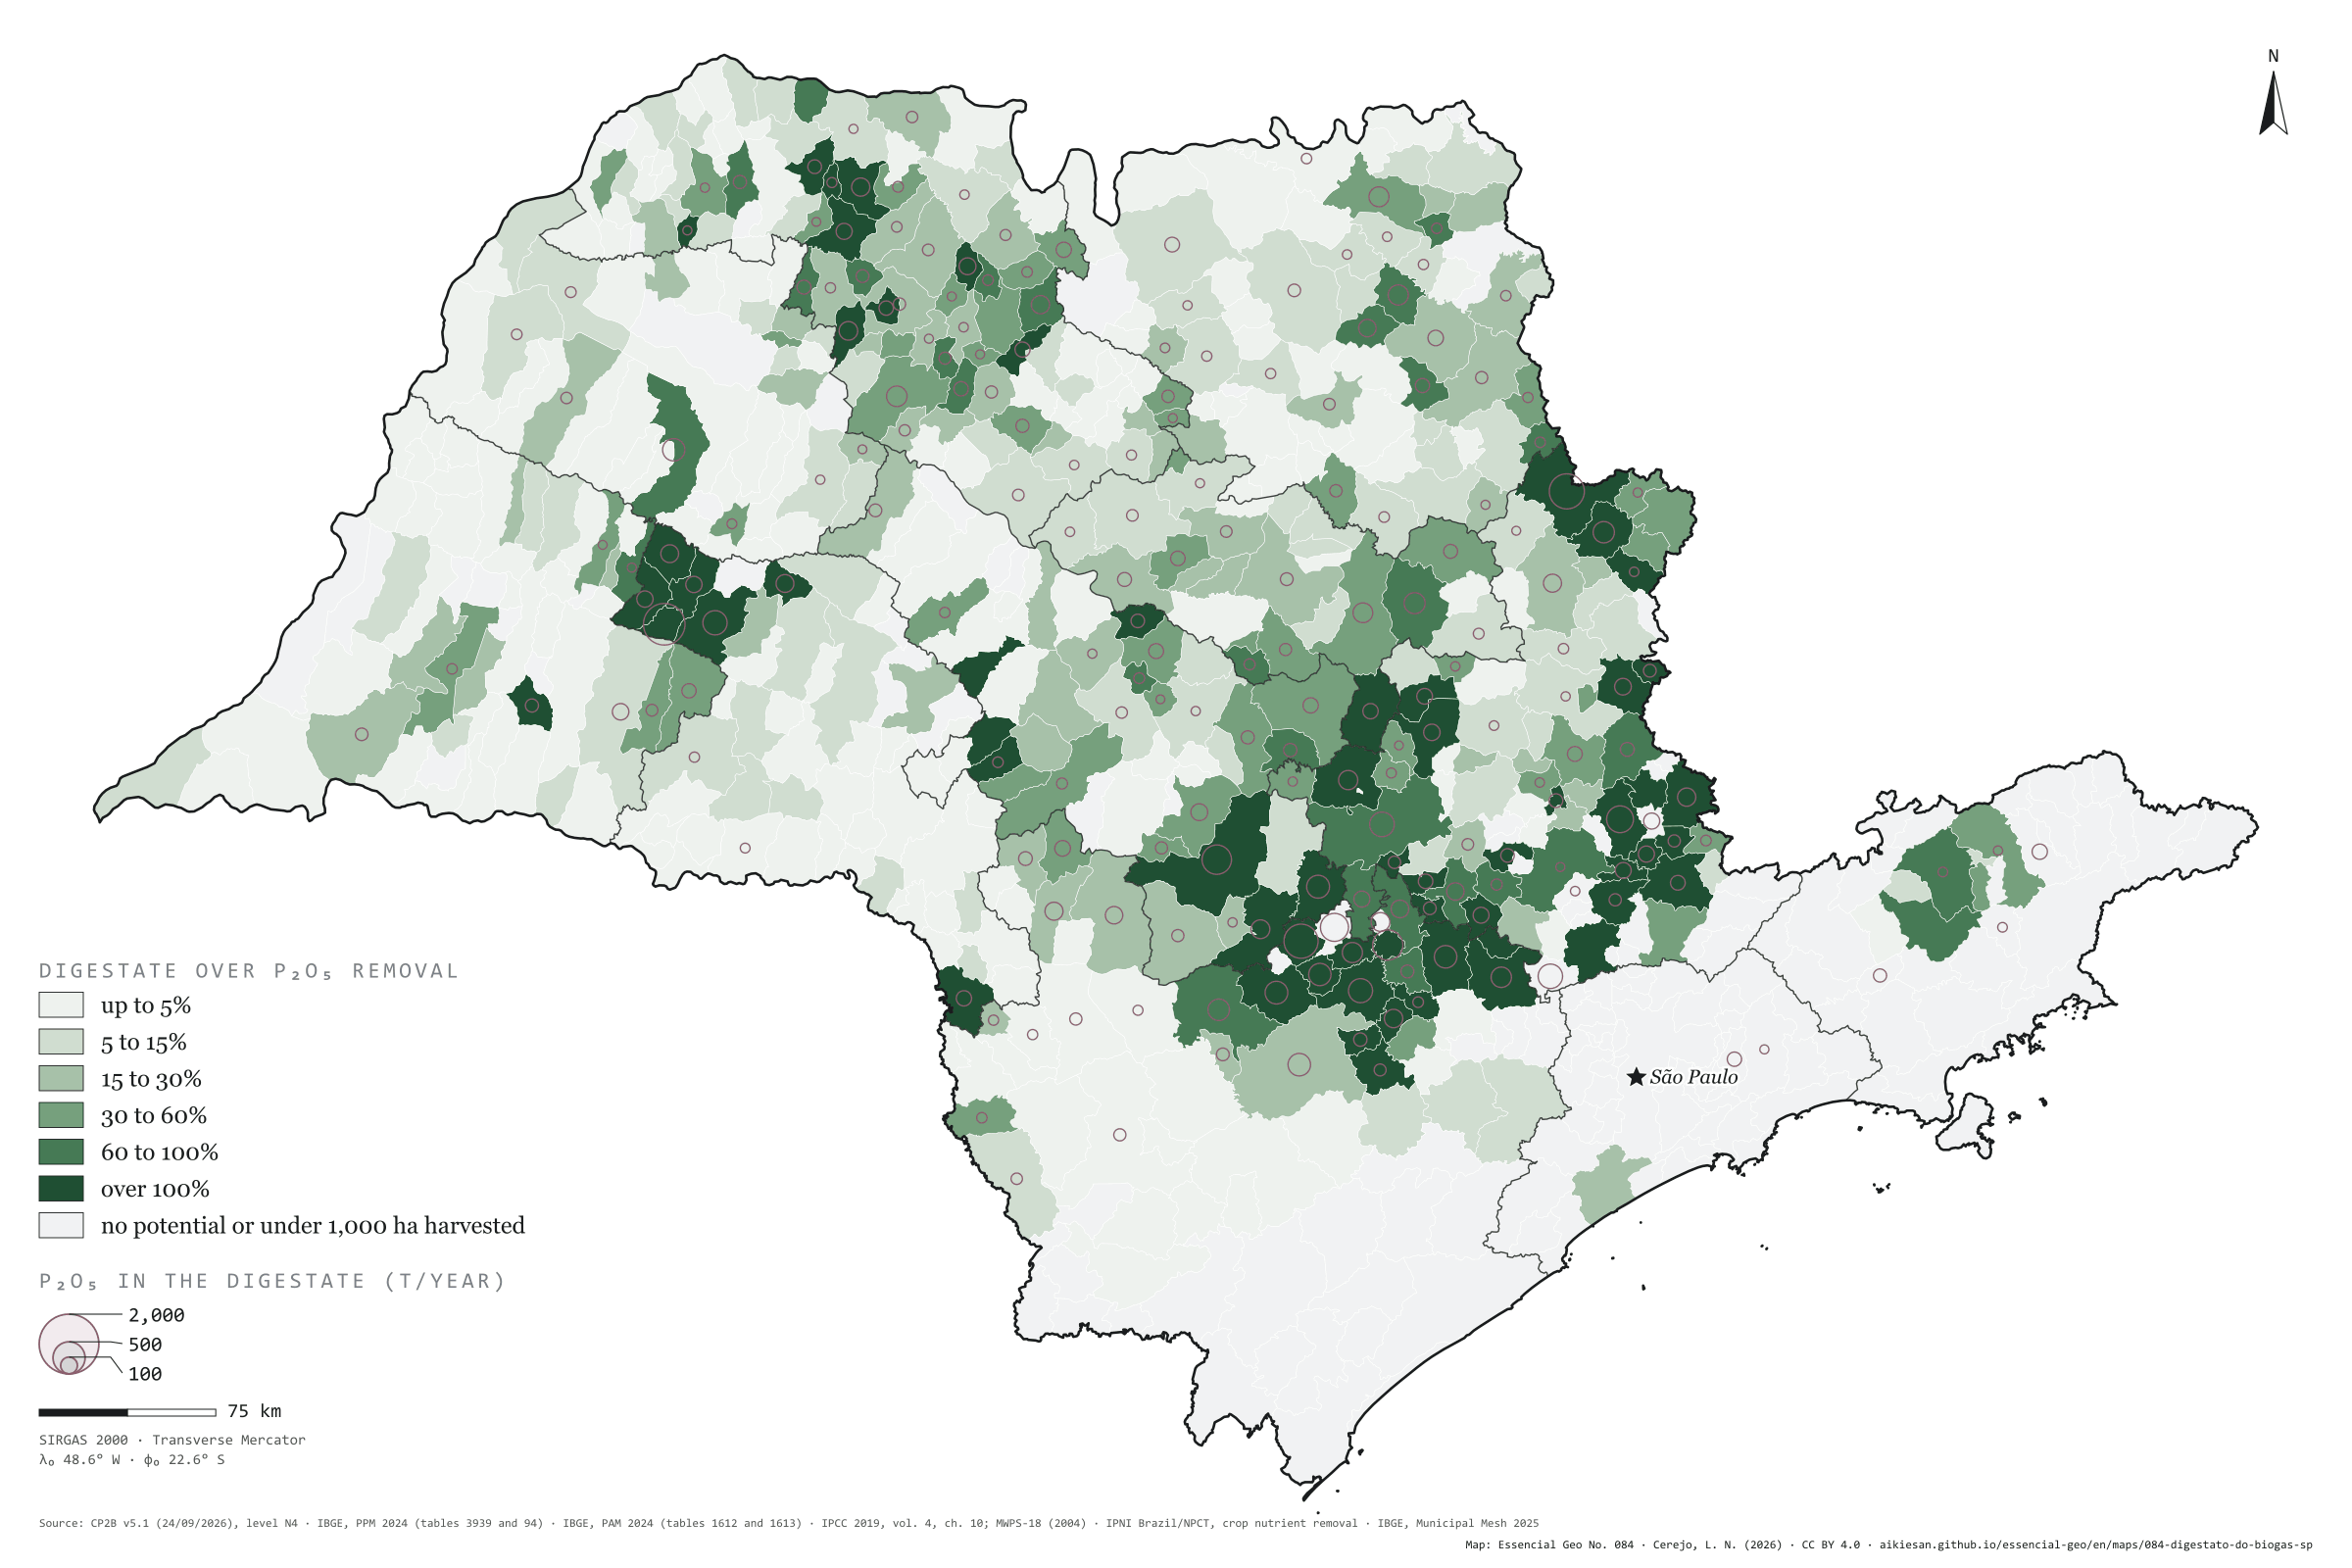
If manure went through digesters, 98,000 t of N and 49,000 t of P₂O₅ a year would return to the fields
Fig. 084São Paulo State (SP)EPSG:4674Source: CP2B (Unicamp), IBGE, IPCC, MidWest Plan Service, IPNI Brazil/NPCT
The biomethane potential of poultry, pig and cattle manure in São Paulo, at CP2B’s accessible level, is 1.29 million m³ a day. The digestate left by that biogas keeps the manure’s nutrients: about 98,000 tonnes of nitrogen, 49,000 of P₂O₅ and 48,000 of K₂O a year, equal to 25% of the phosphorus, 14% of the nitrogen and 9% of the potassium that the state’s harvests remove. Three quarters of the nitrogen would come from poultry farms. In 61 municipalities with at least 1,000 hectares harvested, digestate would supply all the P₂O₅ of the harvest. Bastos would have 2,200 tonnes of P₂O₅ in digestate, a hundred times what its crops remove; Botucatu, with 43,000 hectares of crops, 117%. Sugarcane, which makes up most of CP2B’s potential, is left out: vinasse, filter cake and straw already go back to the fields. Fourth and last plate of the collection “Manure that feeds the soil”.
Technical record · downloads · citation
At a glance
Nutrients in manure digestate (thousand t a year)
nitrogen (N)98
phosphorus (P₂O₅)49
potassium (K₂O)48
Origin of the digestate nitrogen (%)
poultry74.9%
cattle16.5%
pigs8.6%
Digestate P₂O₅ over the state’s crop removal
25%
1.29 million m³ of biomethane a day from the same potential
Layers
municipiospolygon645 municipalities: N, P₂O₅ and K₂O in manure digestate (CP2B N4), biomethane, and the share of crop removal it replaces (same GPKG as plate 081)
regioes_intermediariaspolygon11 intermediate geographic regions
Methane at level N4 of CP2B v5.1 (reference scenario) for manure from broilers and laying hens, pigs, and dairy, feedlot and grazing cattle, converted into equivalent head with each substrate’s mean parameters and multiplied by the N, P₂O₅ and K₂O excreted per head (IPCC 2019 and MWPS-18); digestate keeps these nutrients. Colour: digestate over the P₂O₅ removed by the municipality’s harvests (2024 PAM × IPNI), in six classes; circles: tonnes of P₂O₅.
The map without a frame, with legend, scale, reference system and credit written on it: ready for papers, lectures and slides. In two versions: with the basemap (neighbours and sea) or only the mapped area, on white.
CEREJO, Lucas Nakamura. O digestato do biogás: se os dejetos passassem pelo biodigestor, voltariam ao campo 98 mil t de N e 49 mil t de P₂O₅ por ano. Versão 1.0.0. [S. l.]: Essencial, 2026. Conjunto de dados. Disponível em: https://aikiesan.github.io/essencial-geo/en/maps/084-digestato-do-biogas-sp/. Acesso em: 10 nov. 2026.
Cerejo, L. N. (2026). O digestato do biogás: se os dejetos passassem pelo biodigestor, voltariam ao campo 98 mil t de N e 49 mil t de P₂O₅ por ano [Biogas digestate: If manure went through digesters, 98,000 t of N and 49,000 t of P₂O₅ a year would return to the fields] (Version 1.0.0) [Data set]. Essencial. https://aikiesan.github.io/essencial-geo/en/maps/084-digestato-do-biogas-sp/
@dataset{cerejo2026_digestato_do_biogas_sp,
  author    = {Cerejo, Lucas Nakamura},
  title     = {O digestato do biogás: Se os dejetos passassem pelo biodigestor, voltariam ao campo 98 mil t de N e 49 mil t de P₂O₅ por ano},
  year      = {2026},
  publisher = {Essencial},
  version   = {1.0.0},
  url       = {https://aikiesan.github.io/essencial-geo/en/maps/084-digestato-do-biogas-sp/},
  language  = {portuguese},
  note      = {English title: Biogas digestate: If manure went through digesters, 98,000 t of N and 49,000 t of P₂O₅ a year would return to the fields. Licence CC BY 4.0}
}
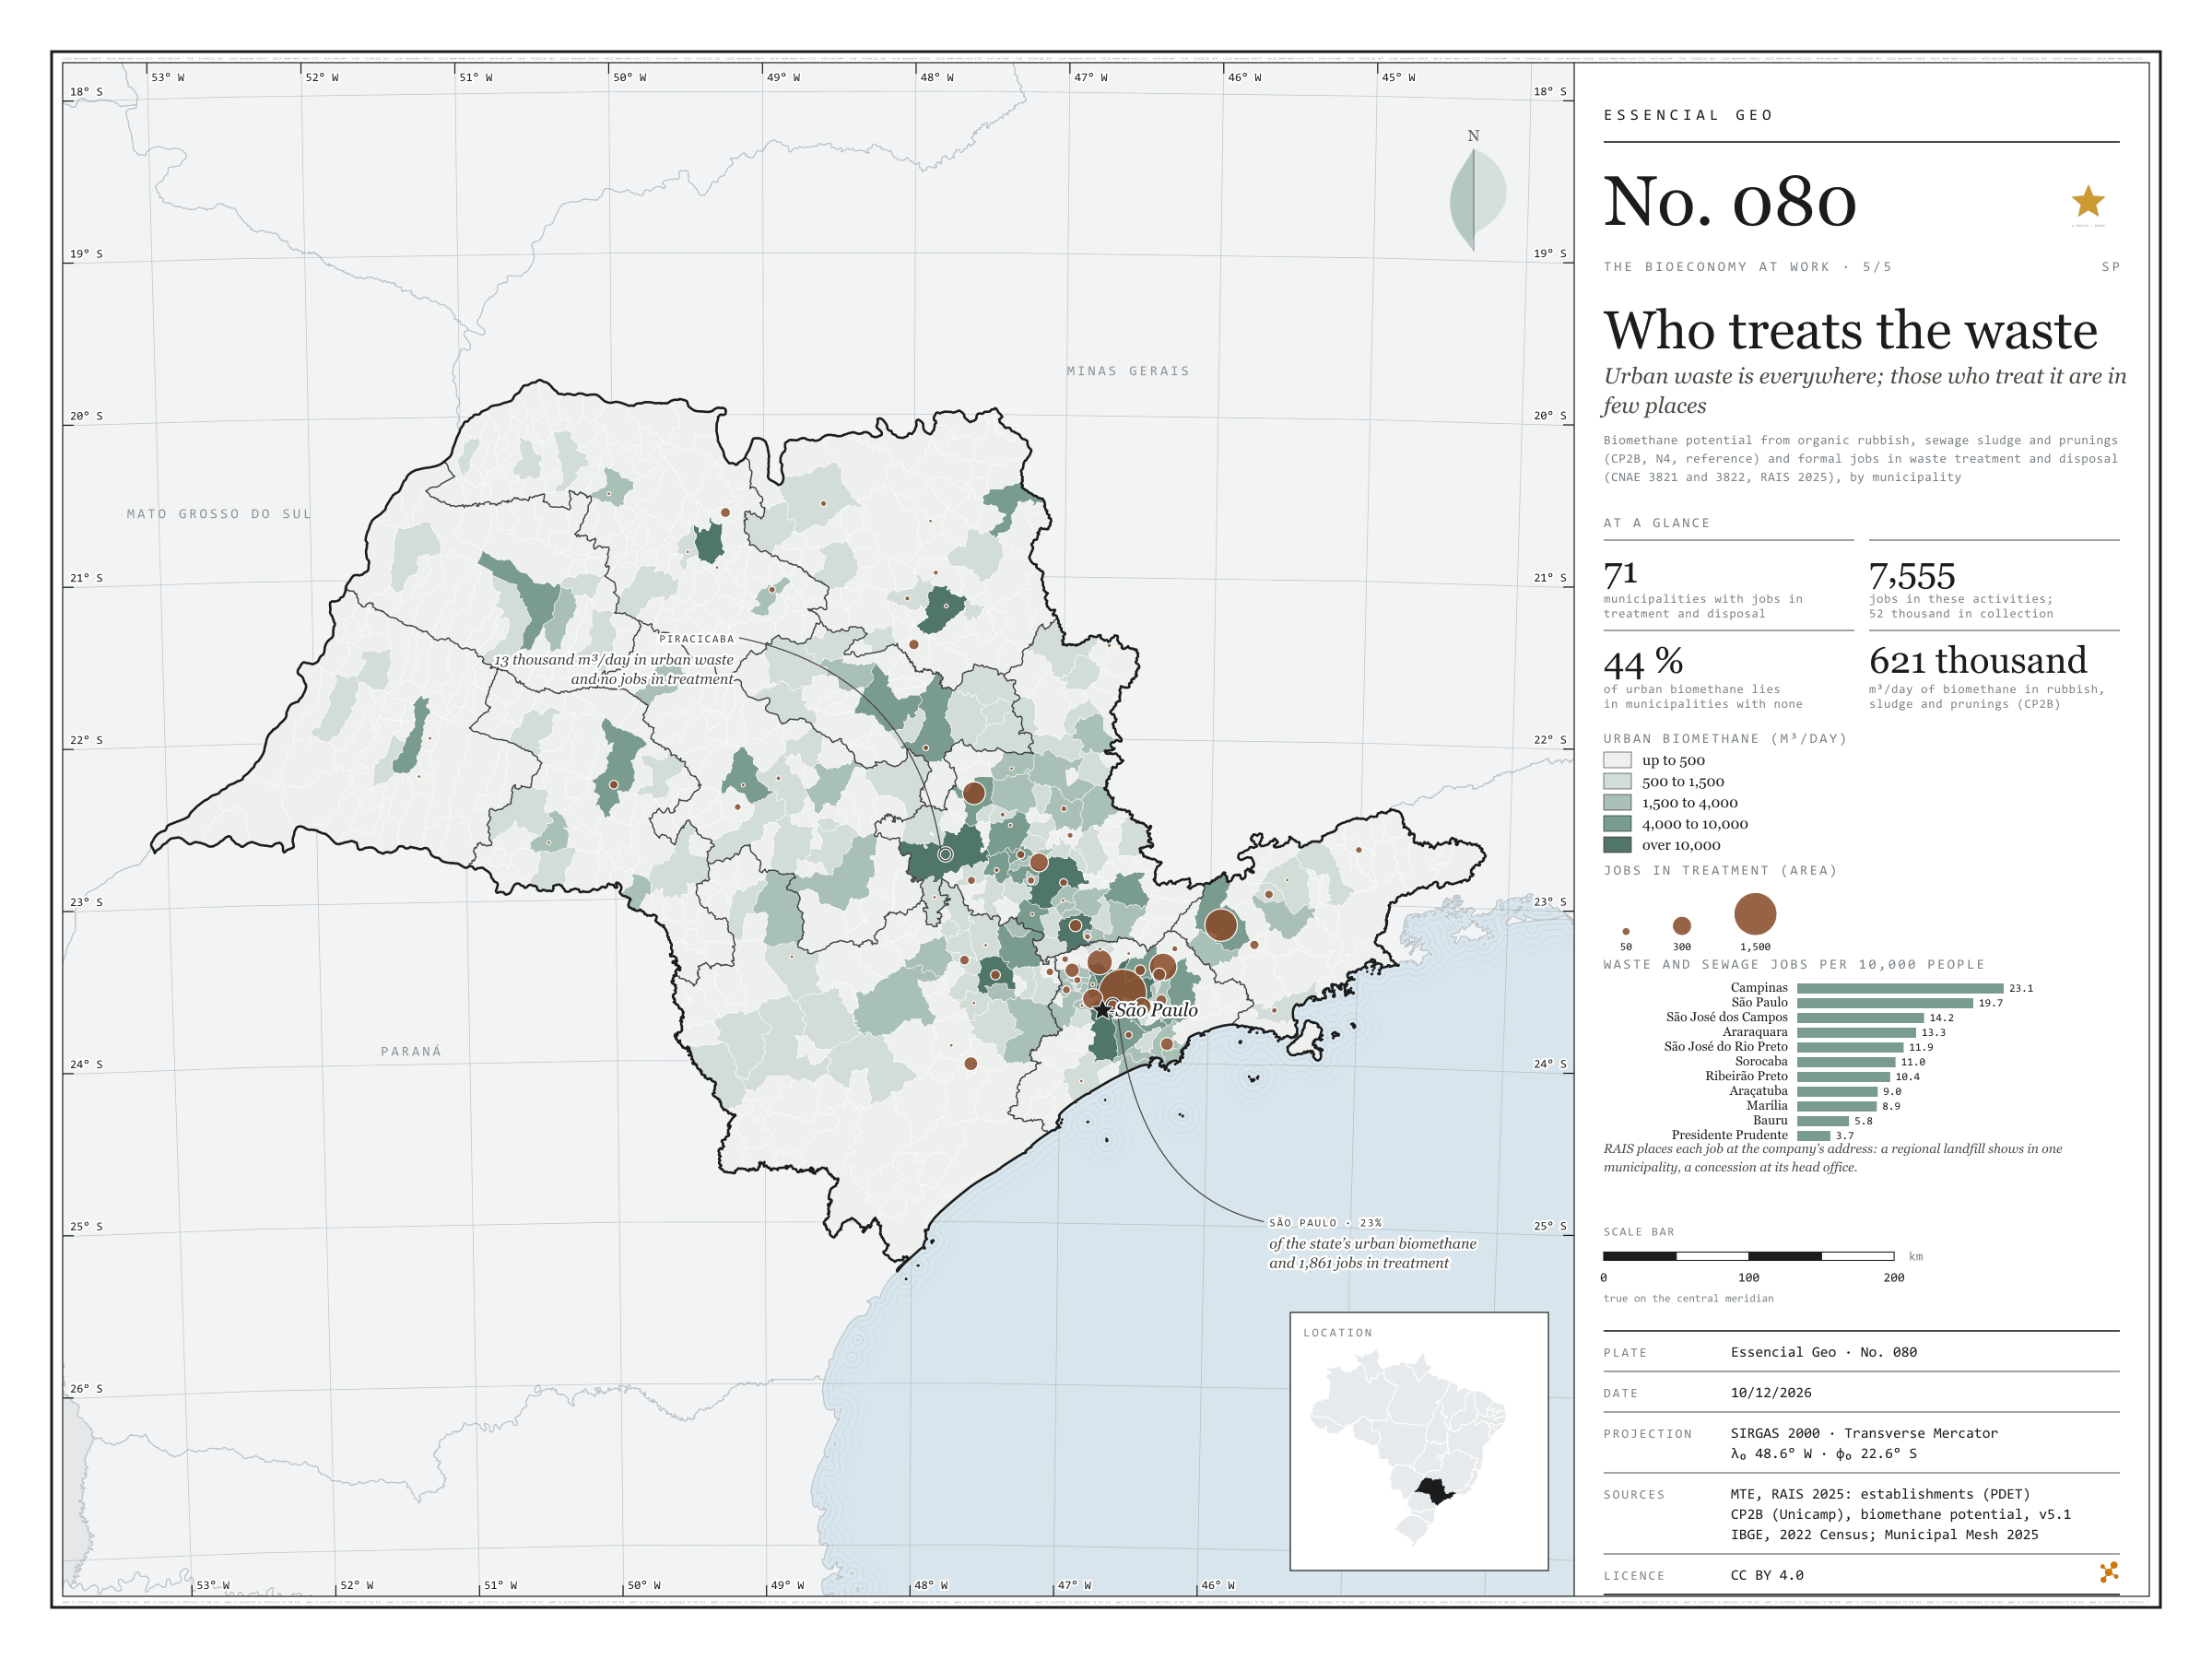
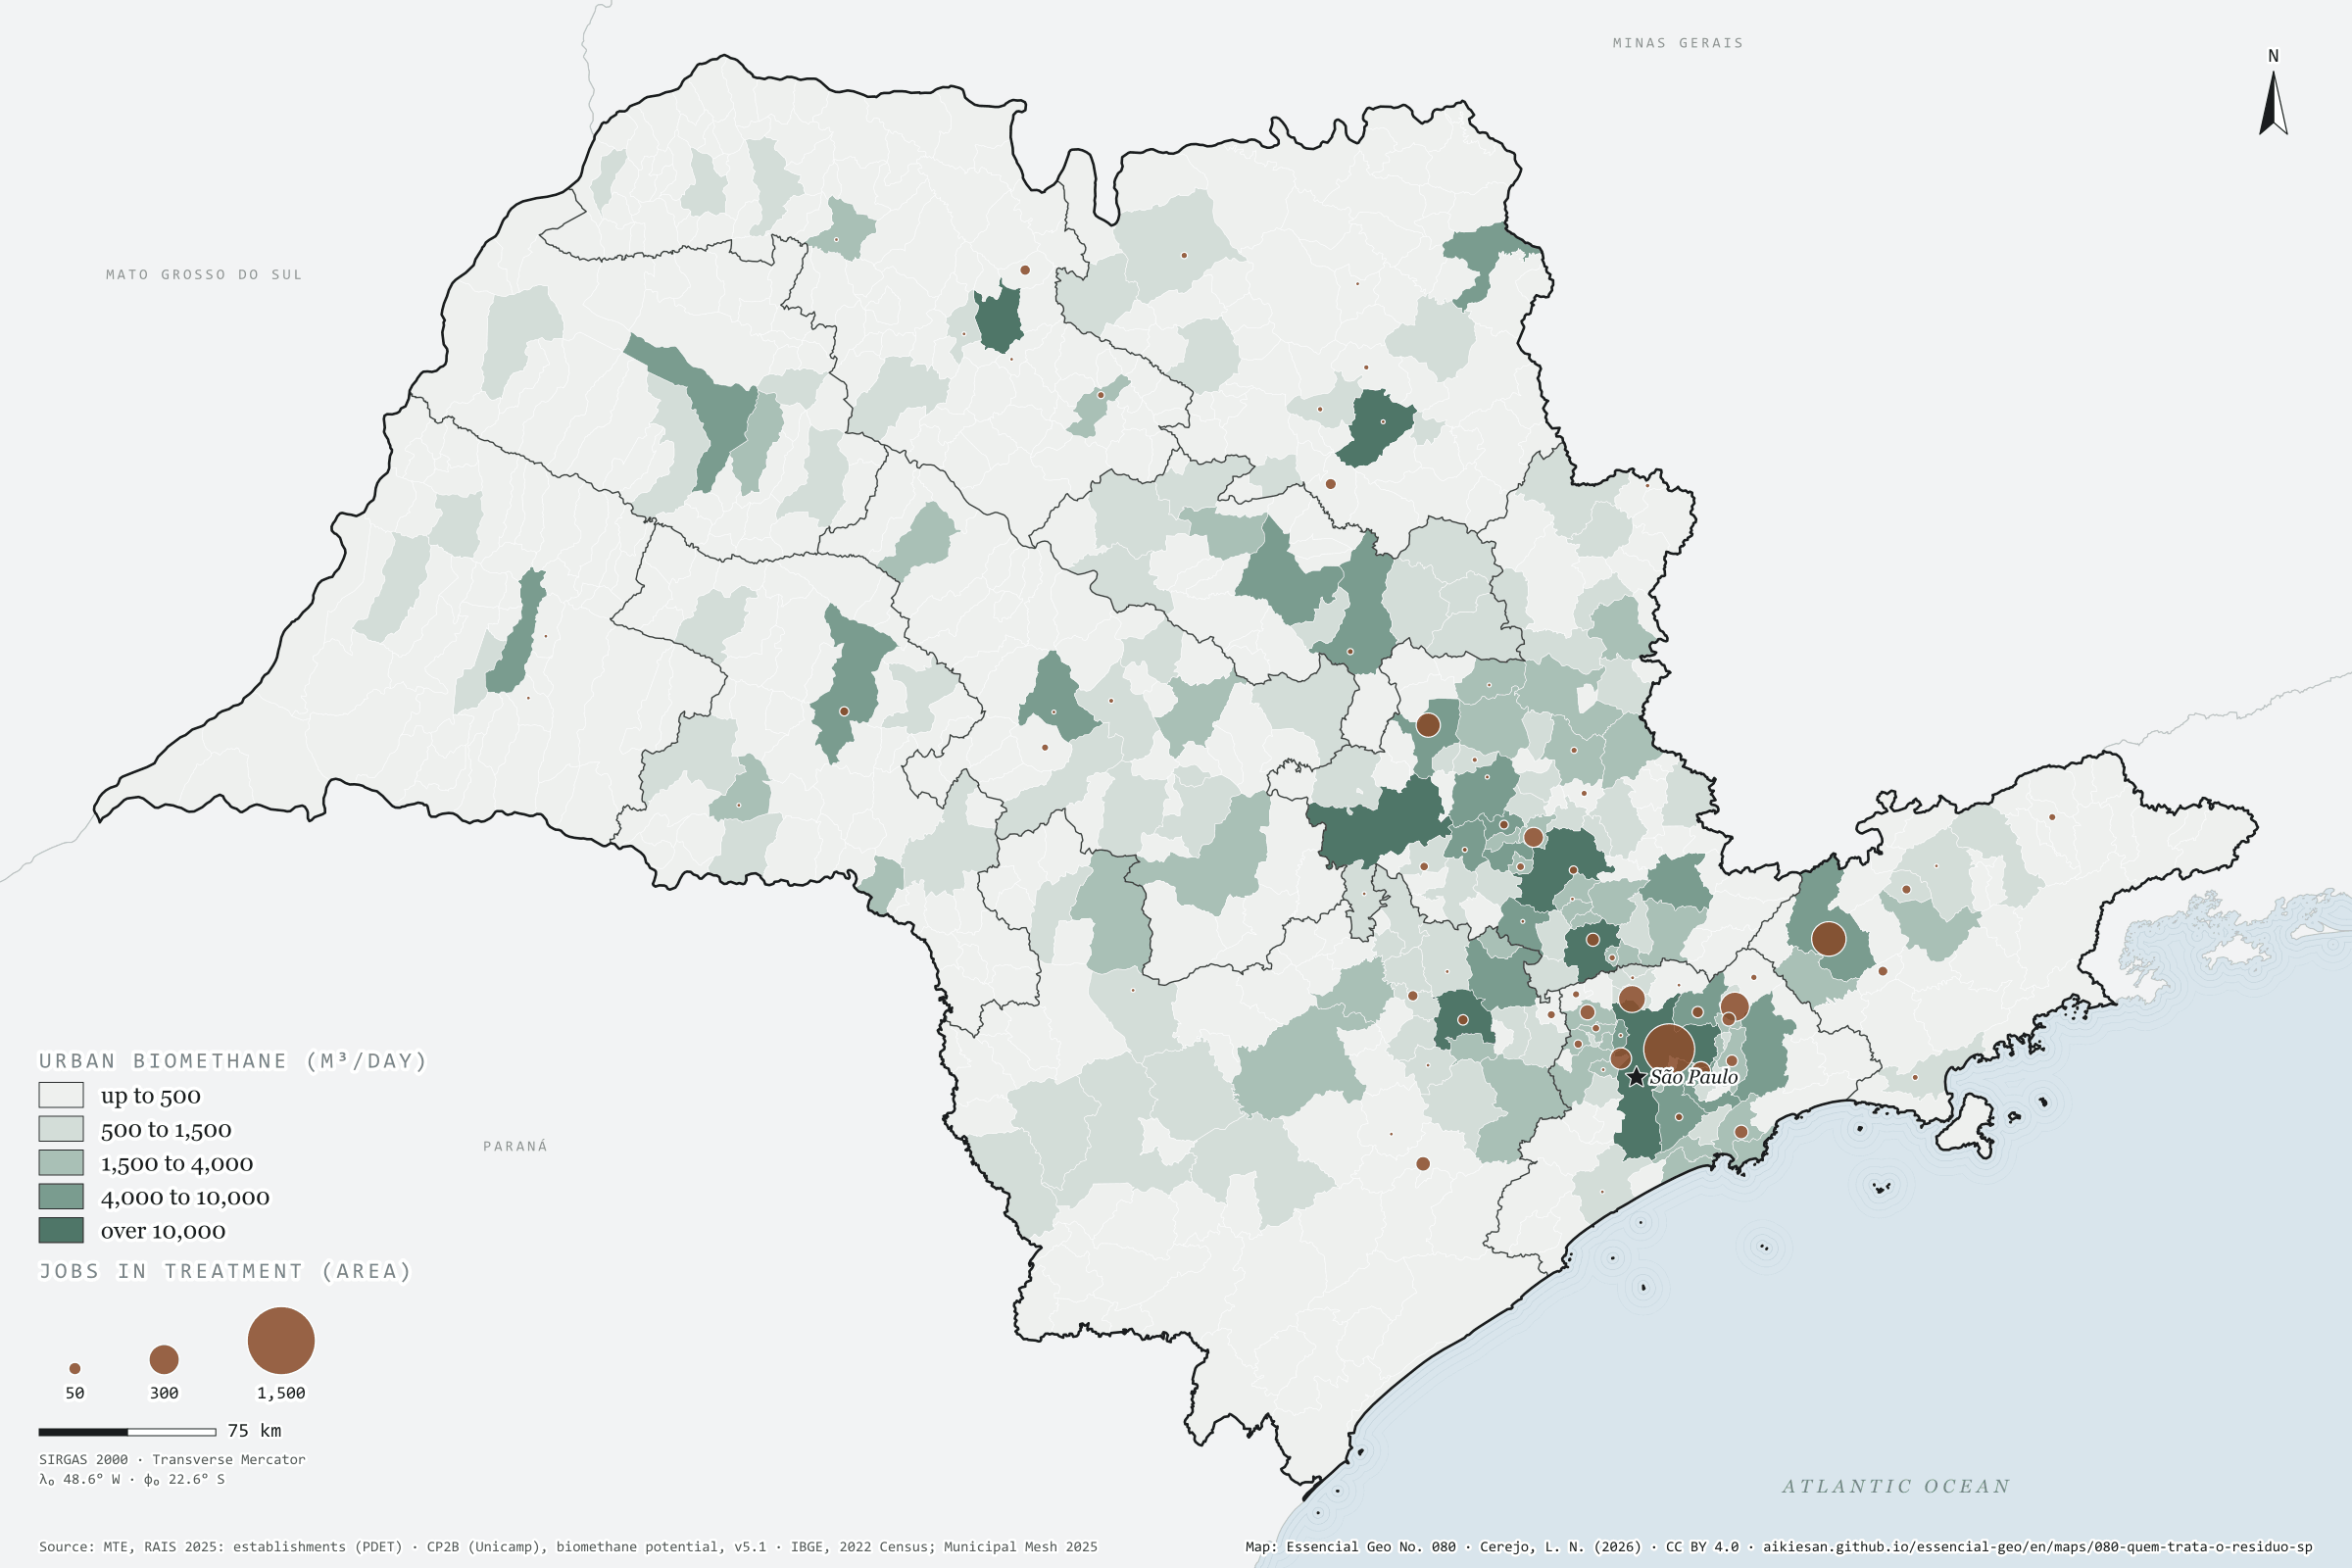
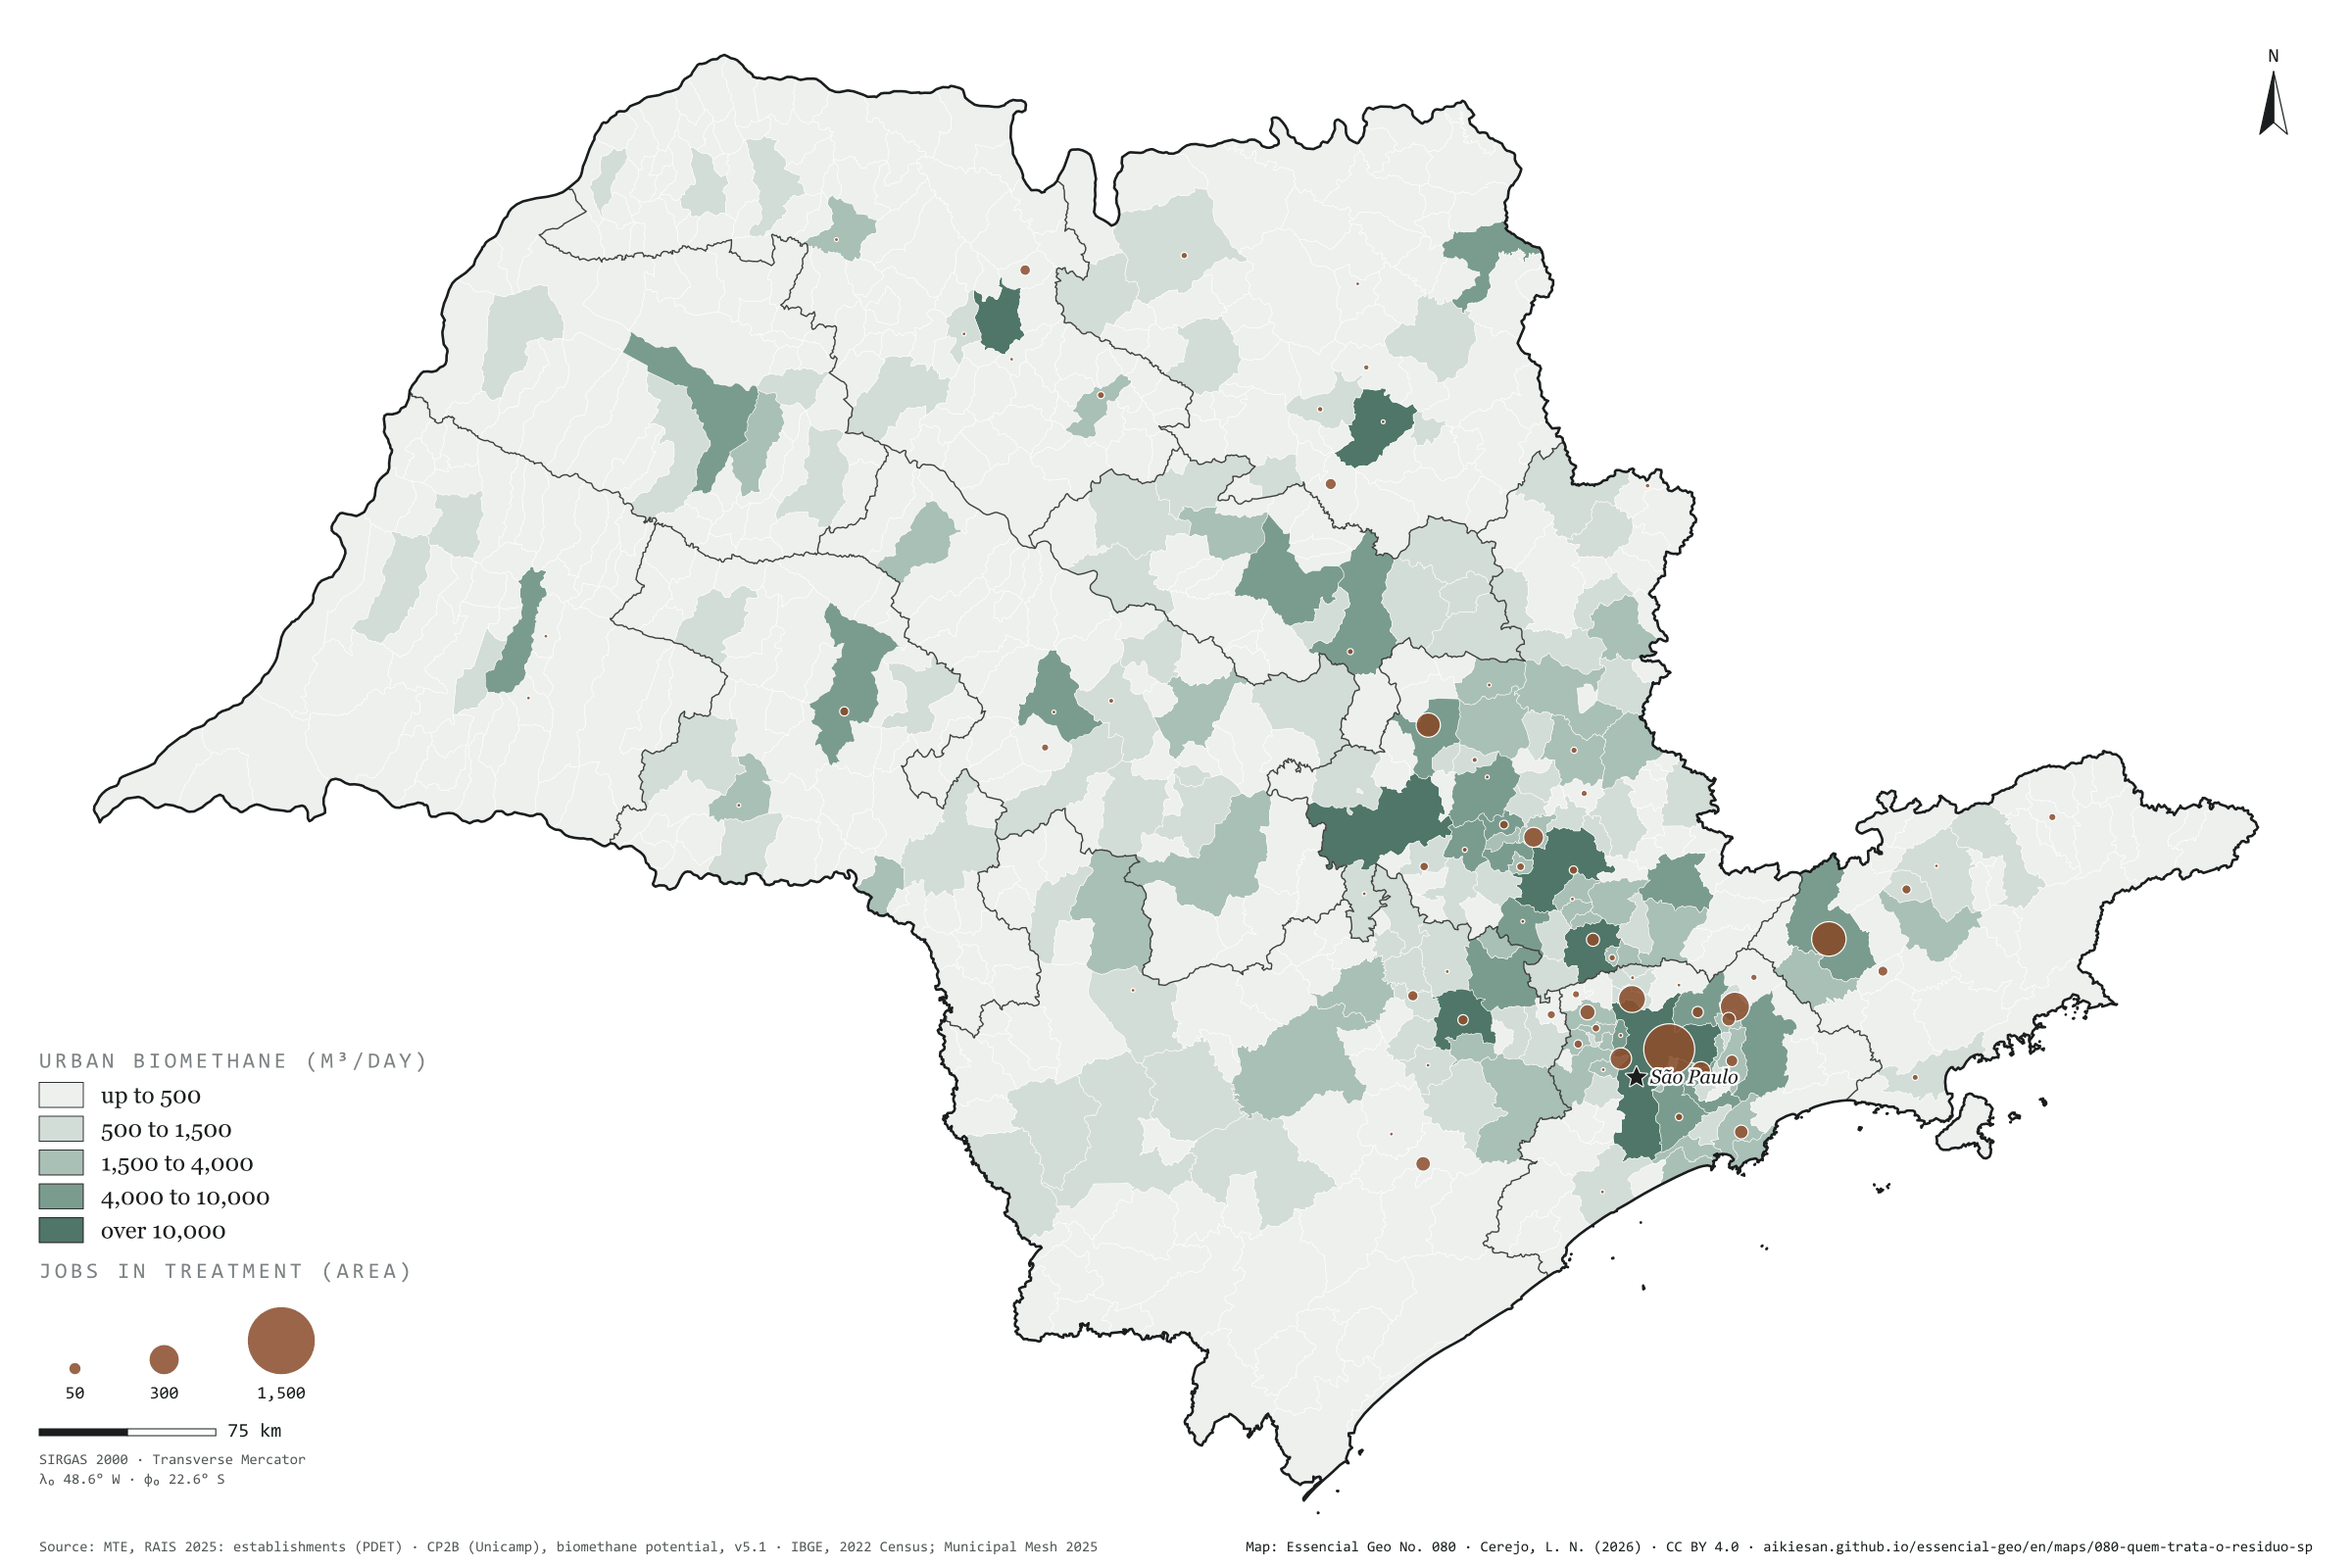
Urban waste is everywhere; those who treat it are in few places
Fig. 080São Paulo State (SP)EPSG:4674Source: MTE/PDET, CP2B (Unicamp), IBGE
São Paulo’s organic rubbish, sewage sludge and prunings would yield 621,000 m³ of biomethane a day at CP2B’s accessible level, and that matter is in every town. Those who treat it are not. Only 71 of the 645 municipalities have formal jobs in waste treatment and disposal, landfills, composting and biogas plants: 7,555 in the state, against 52,000 in collection. The capital has 23% of urban biomethane and 1,861 of those jobs; São José dos Campos, Arujá and Caieiras come next. Yet 44% of urban biomethane lies in municipalities with no treatment jobs at all: Piracicaba has 13,000 m³ a day and none; São José do Rio Preto, 12,000 and none. There, waste travels to a landfill in another municipality or is handled by the council, outside the private count. Fifth and last plate of the collection “The bioeconomy at work”.
Technical record · downloads · citation
At a glance
Waste and sewage jobs, by activity (jobs)
Collection67.8%
Materials recovery15.8%
Treatment and disposal9.9%
Sewage6.4%
Urban biomethane in municipalities with no treatment jobs
44%
of 621,000 m³/day; 574 municipalities
Layers
municipiospolygon645 municipalities: jobs in sewage, collection, treatment and recovery, jobs per 10,000 people and urban biomethane potential (same GPKG as plate 076)
regioes_intermediariaspolygon11 intermediate geographic regions
Urban-waste biomethane potential by municipality (CP2B v5.1, level N4, reference scenario: organic waste, sewage sludge and prunings), in five classes, and circles proportional to active jobs on 31/12/2025 in waste treatment and disposal (CNAE 38.21 and 38.22, RAIS 2025).
The map without a frame, with legend, scale, reference system and credit written on it: ready for papers, lectures and slides. In two versions: with the basemap (neighbours and sea) or only the mapped area, on white.
CEREJO, Lucas Nakamura. Quem trata o resíduo: o resíduo urbano está em toda parte; quem o trata, em poucos lugares. Versão 1.0.0. [S. l.]: Essencial, 2026. Conjunto de dados. Disponível em: https://aikiesan.github.io/essencial-geo/en/maps/080-quem-trata-o-residuo-sp/. Acesso em: 10 nov. 2026.
Cerejo, L. N. (2026). Quem trata o resíduo: o resíduo urbano está em toda parte; quem o trata, em poucos lugares [Who treats the waste: Urban waste is everywhere; those who treat it are in few places] (Version 1.0.0) [Data set]. Essencial. https://aikiesan.github.io/essencial-geo/en/maps/080-quem-trata-o-residuo-sp/
@dataset{cerejo2026_quem_trata_o_residuo_sp,
  author    = {Cerejo, Lucas Nakamura},
  title     = {Quem trata o resíduo: O resíduo urbano está em toda parte; quem o trata, em poucos lugares},
  year      = {2026},
  publisher = {Essencial},
  version   = {1.0.0},
  url       = {https://aikiesan.github.io/essencial-geo/en/maps/080-quem-trata-o-residuo-sp/},
  language  = {portuguese},
  note      = {English title: Who treats the waste: Urban waste is everywhere; those who treat it are in few places. Licence CC BY 4.0}
}
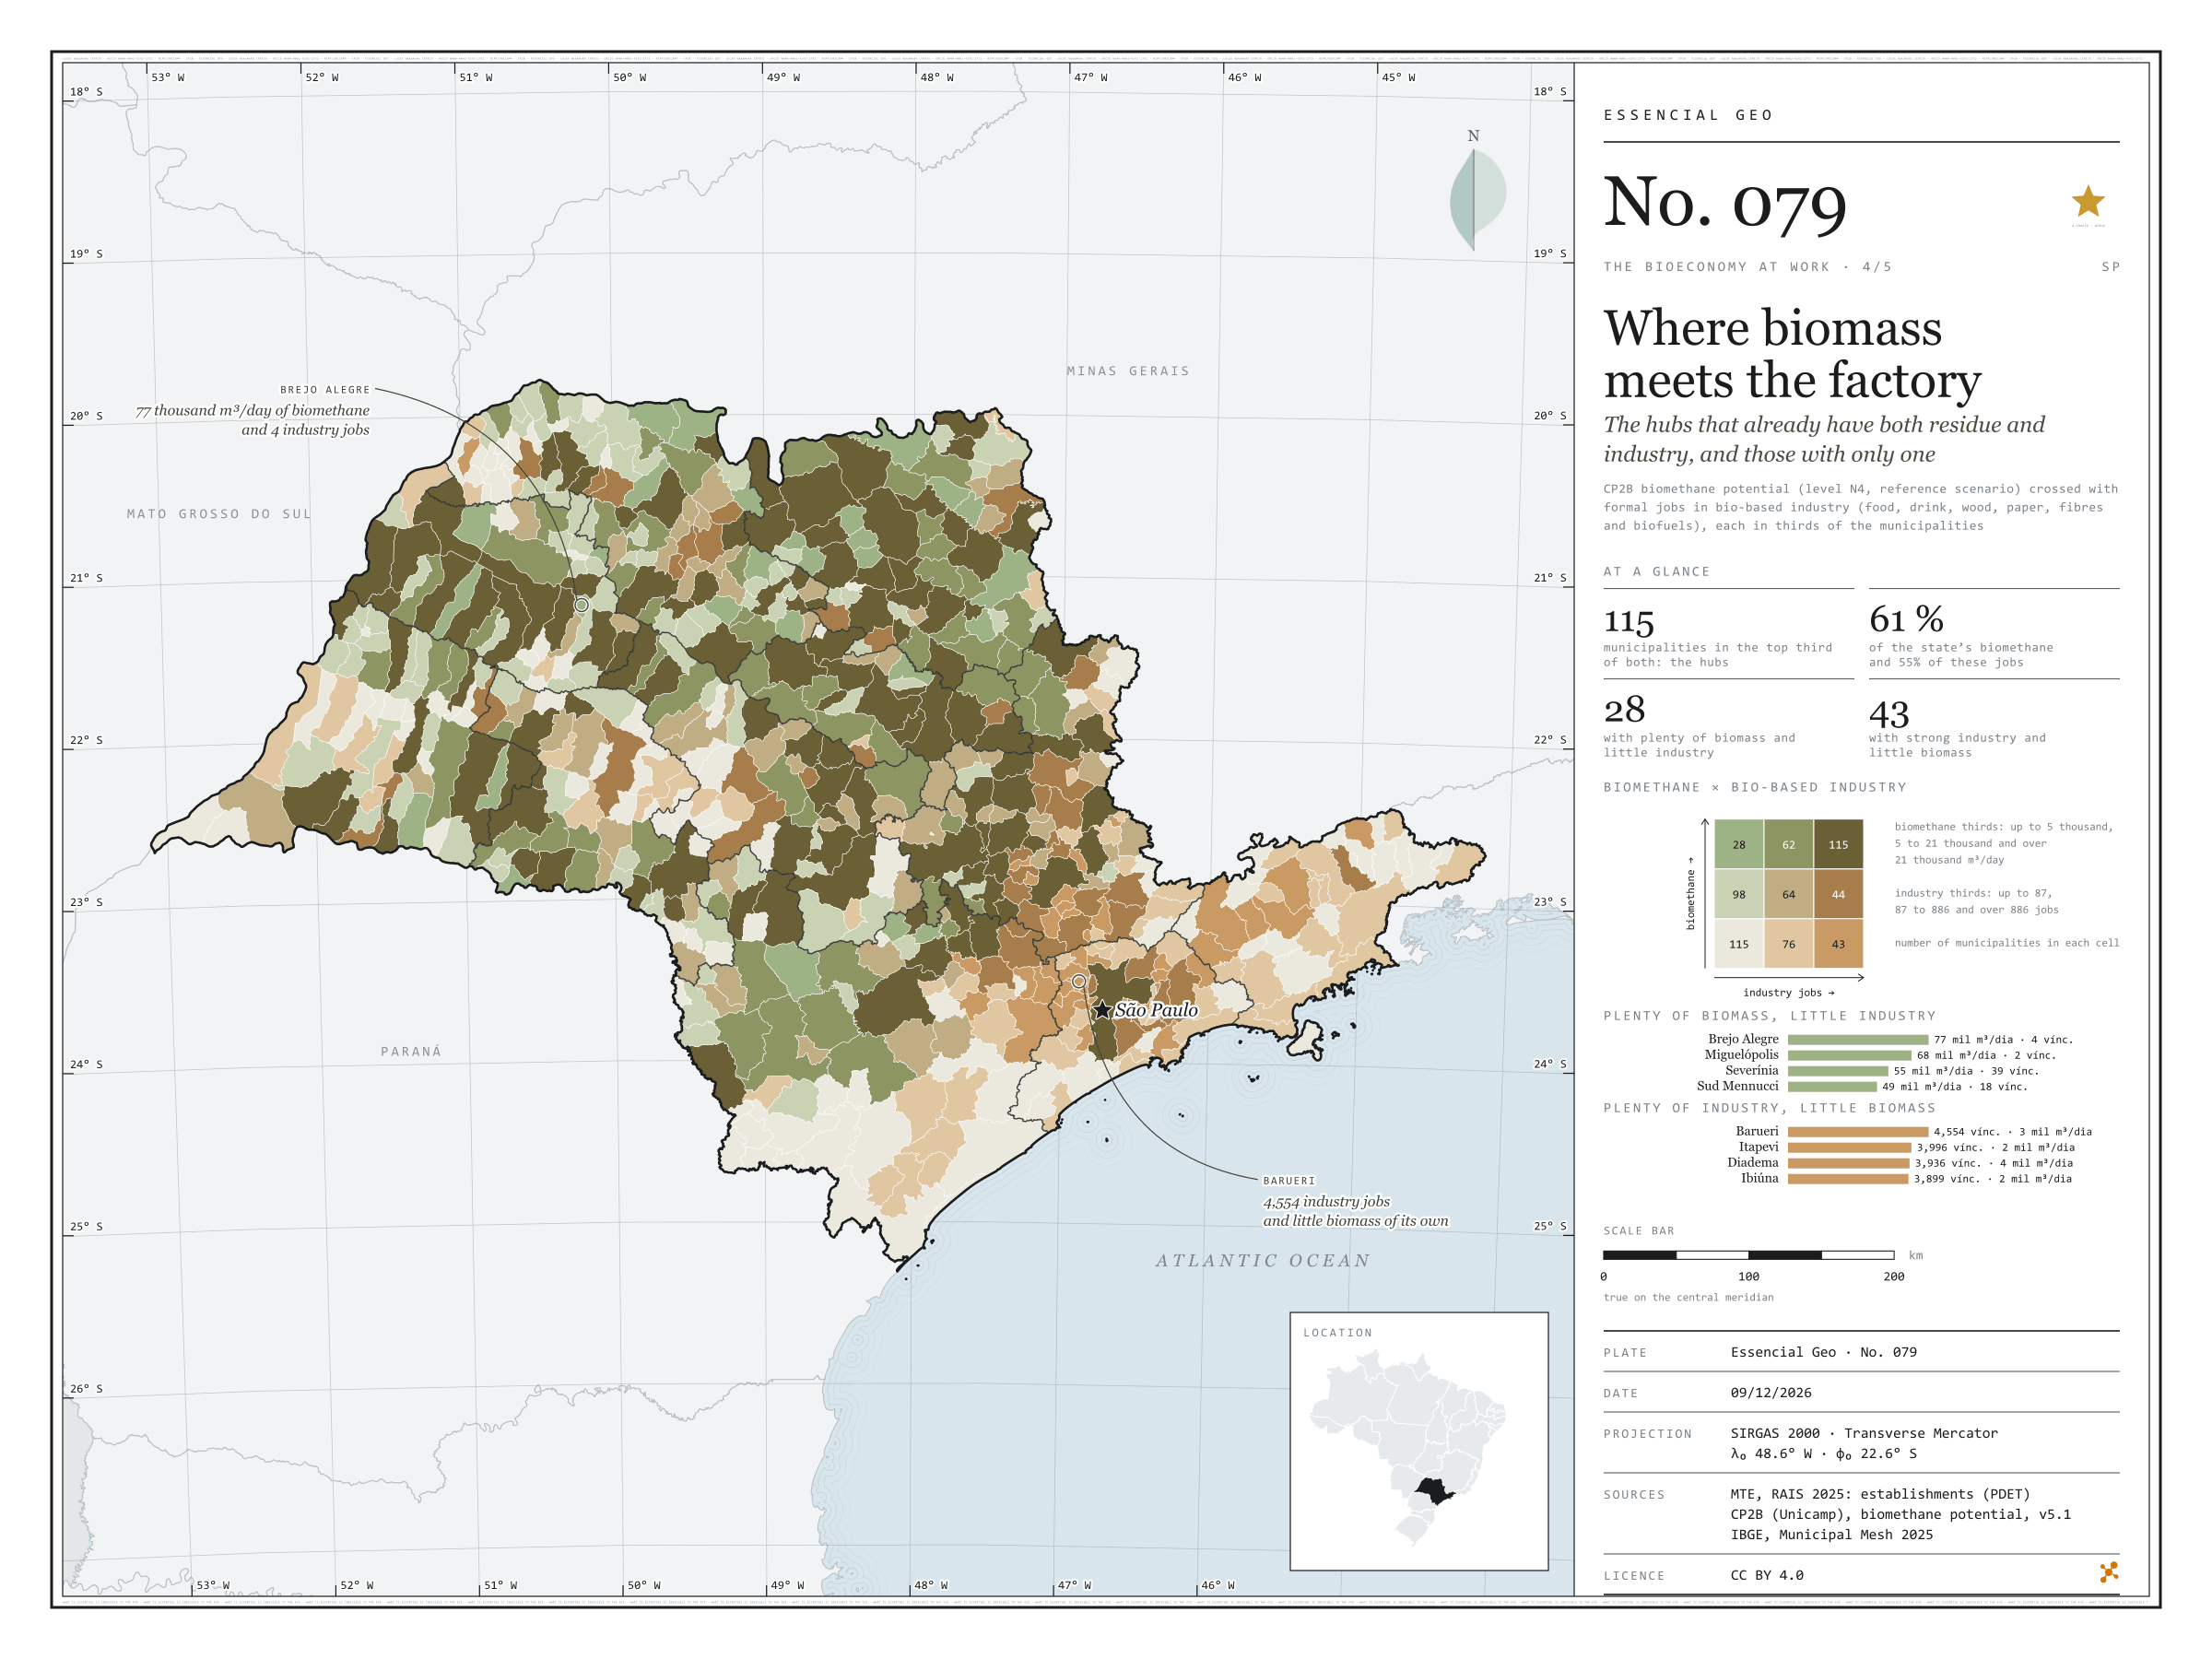
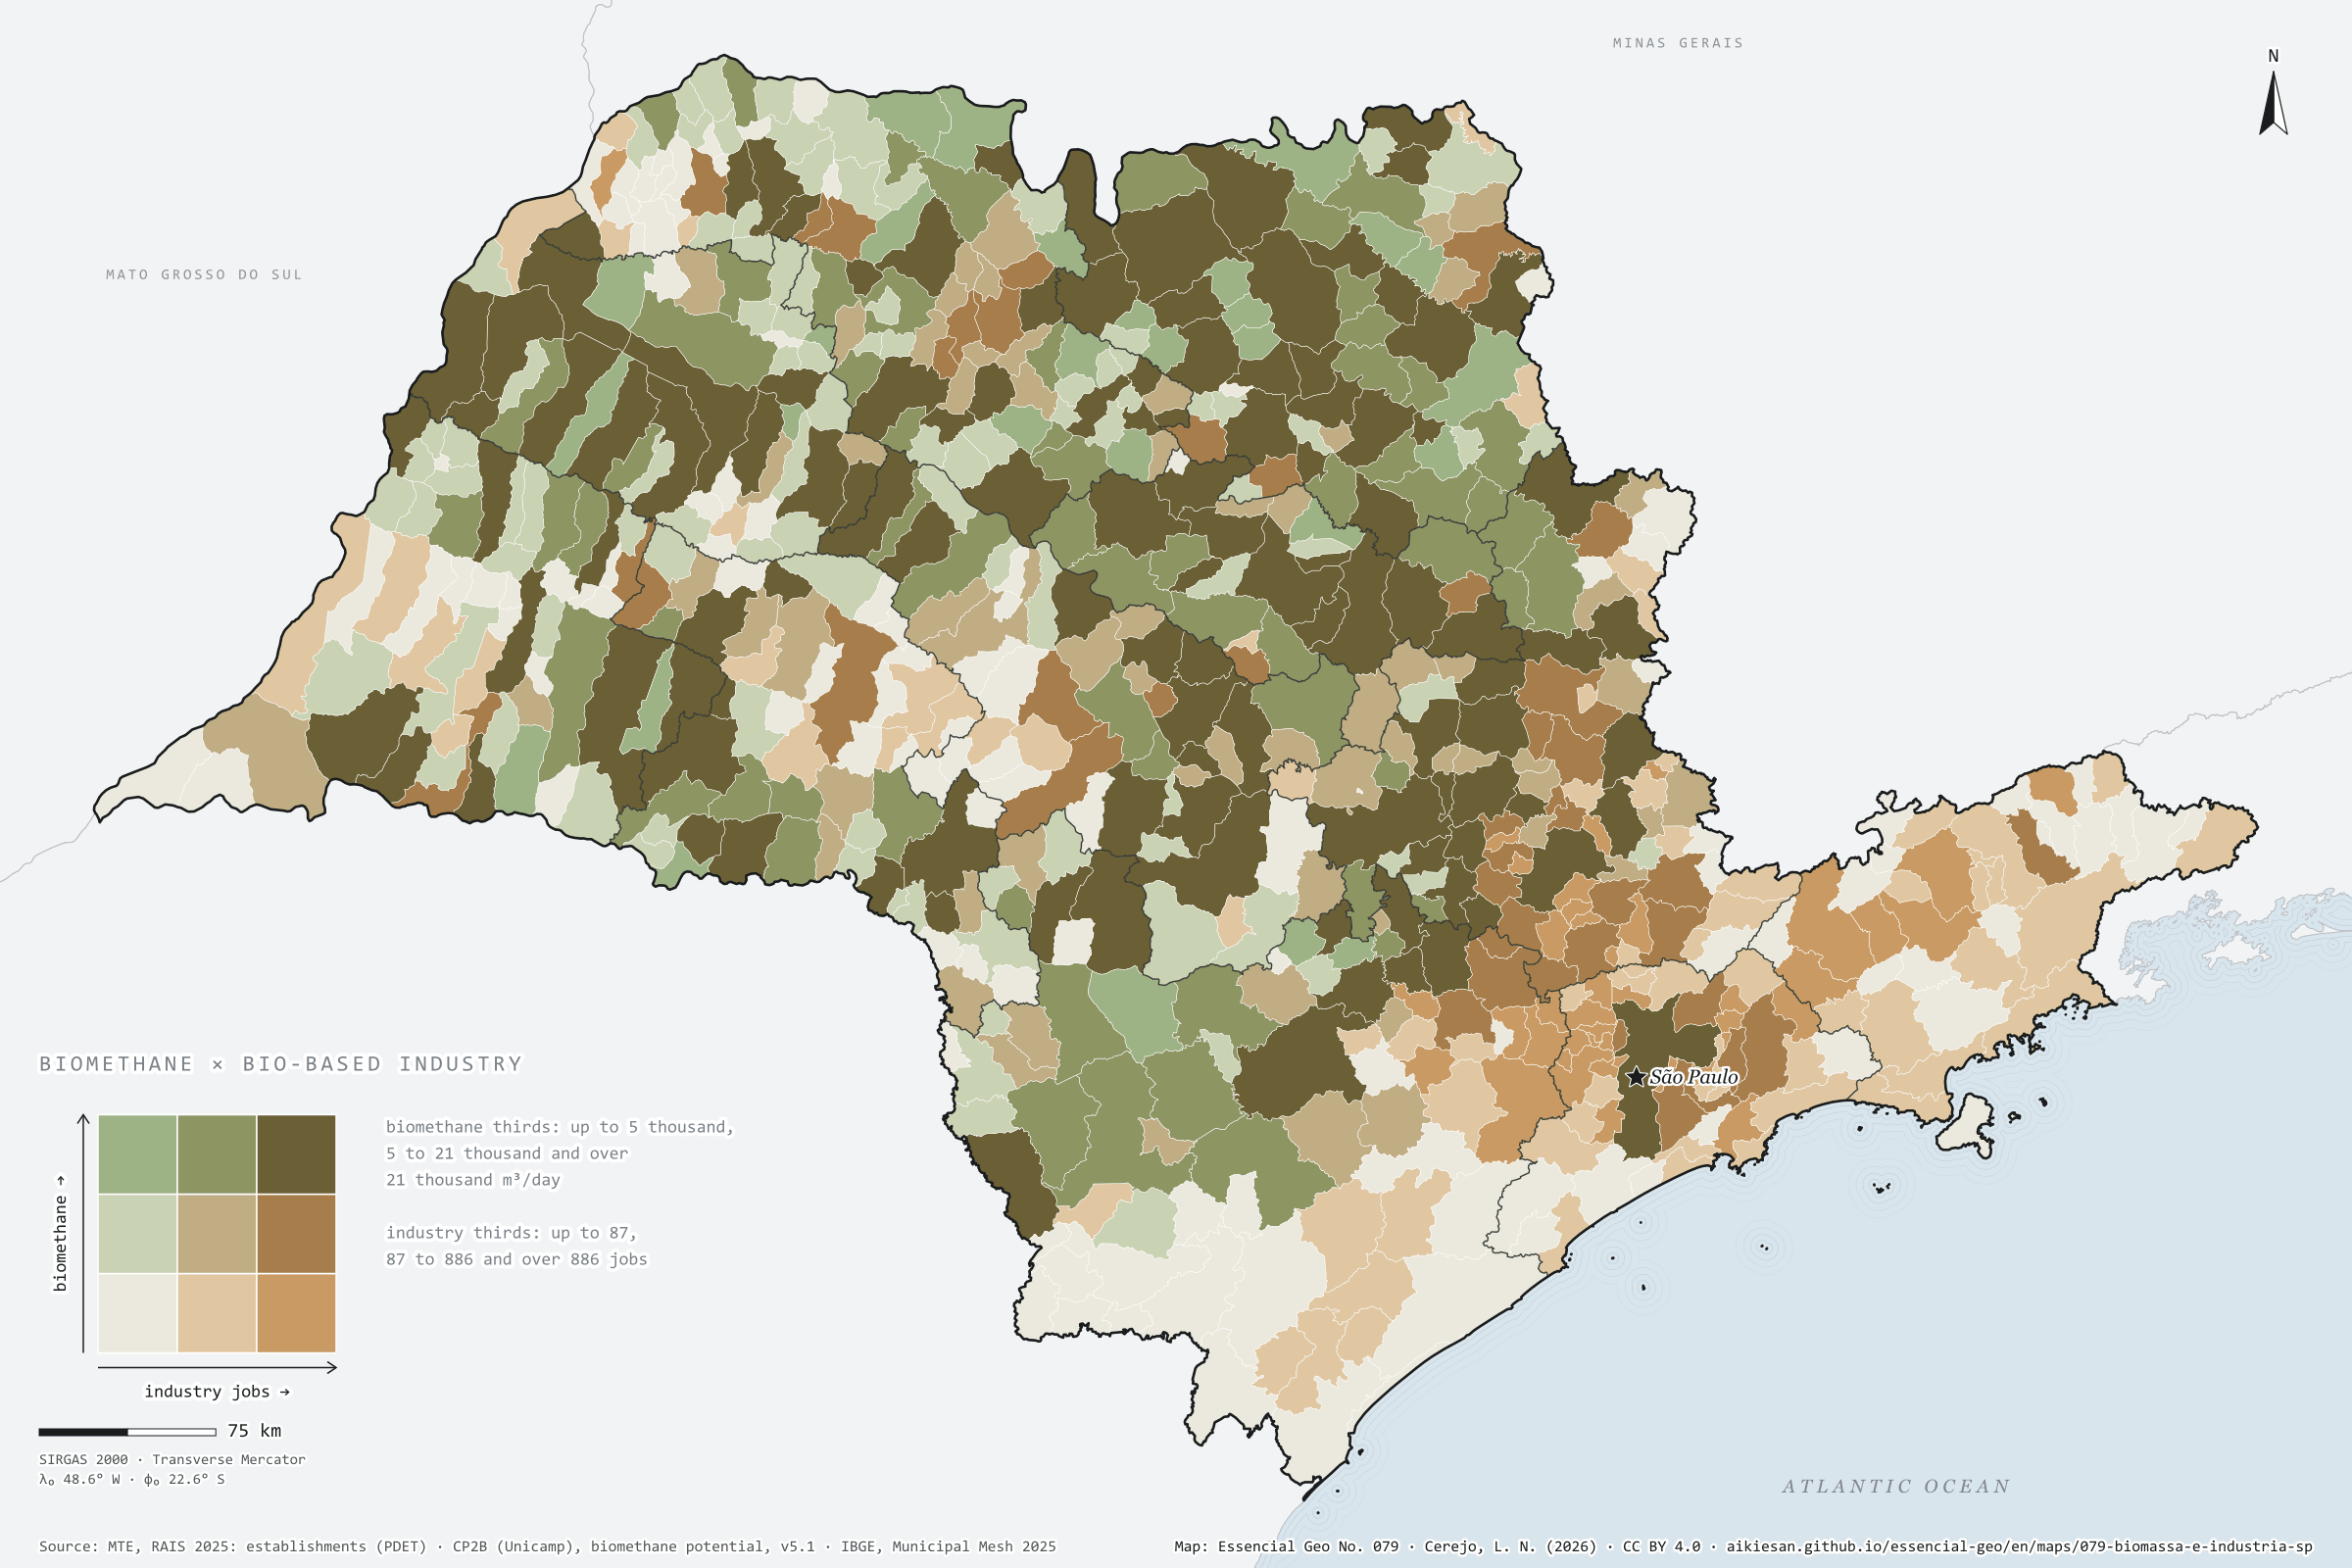
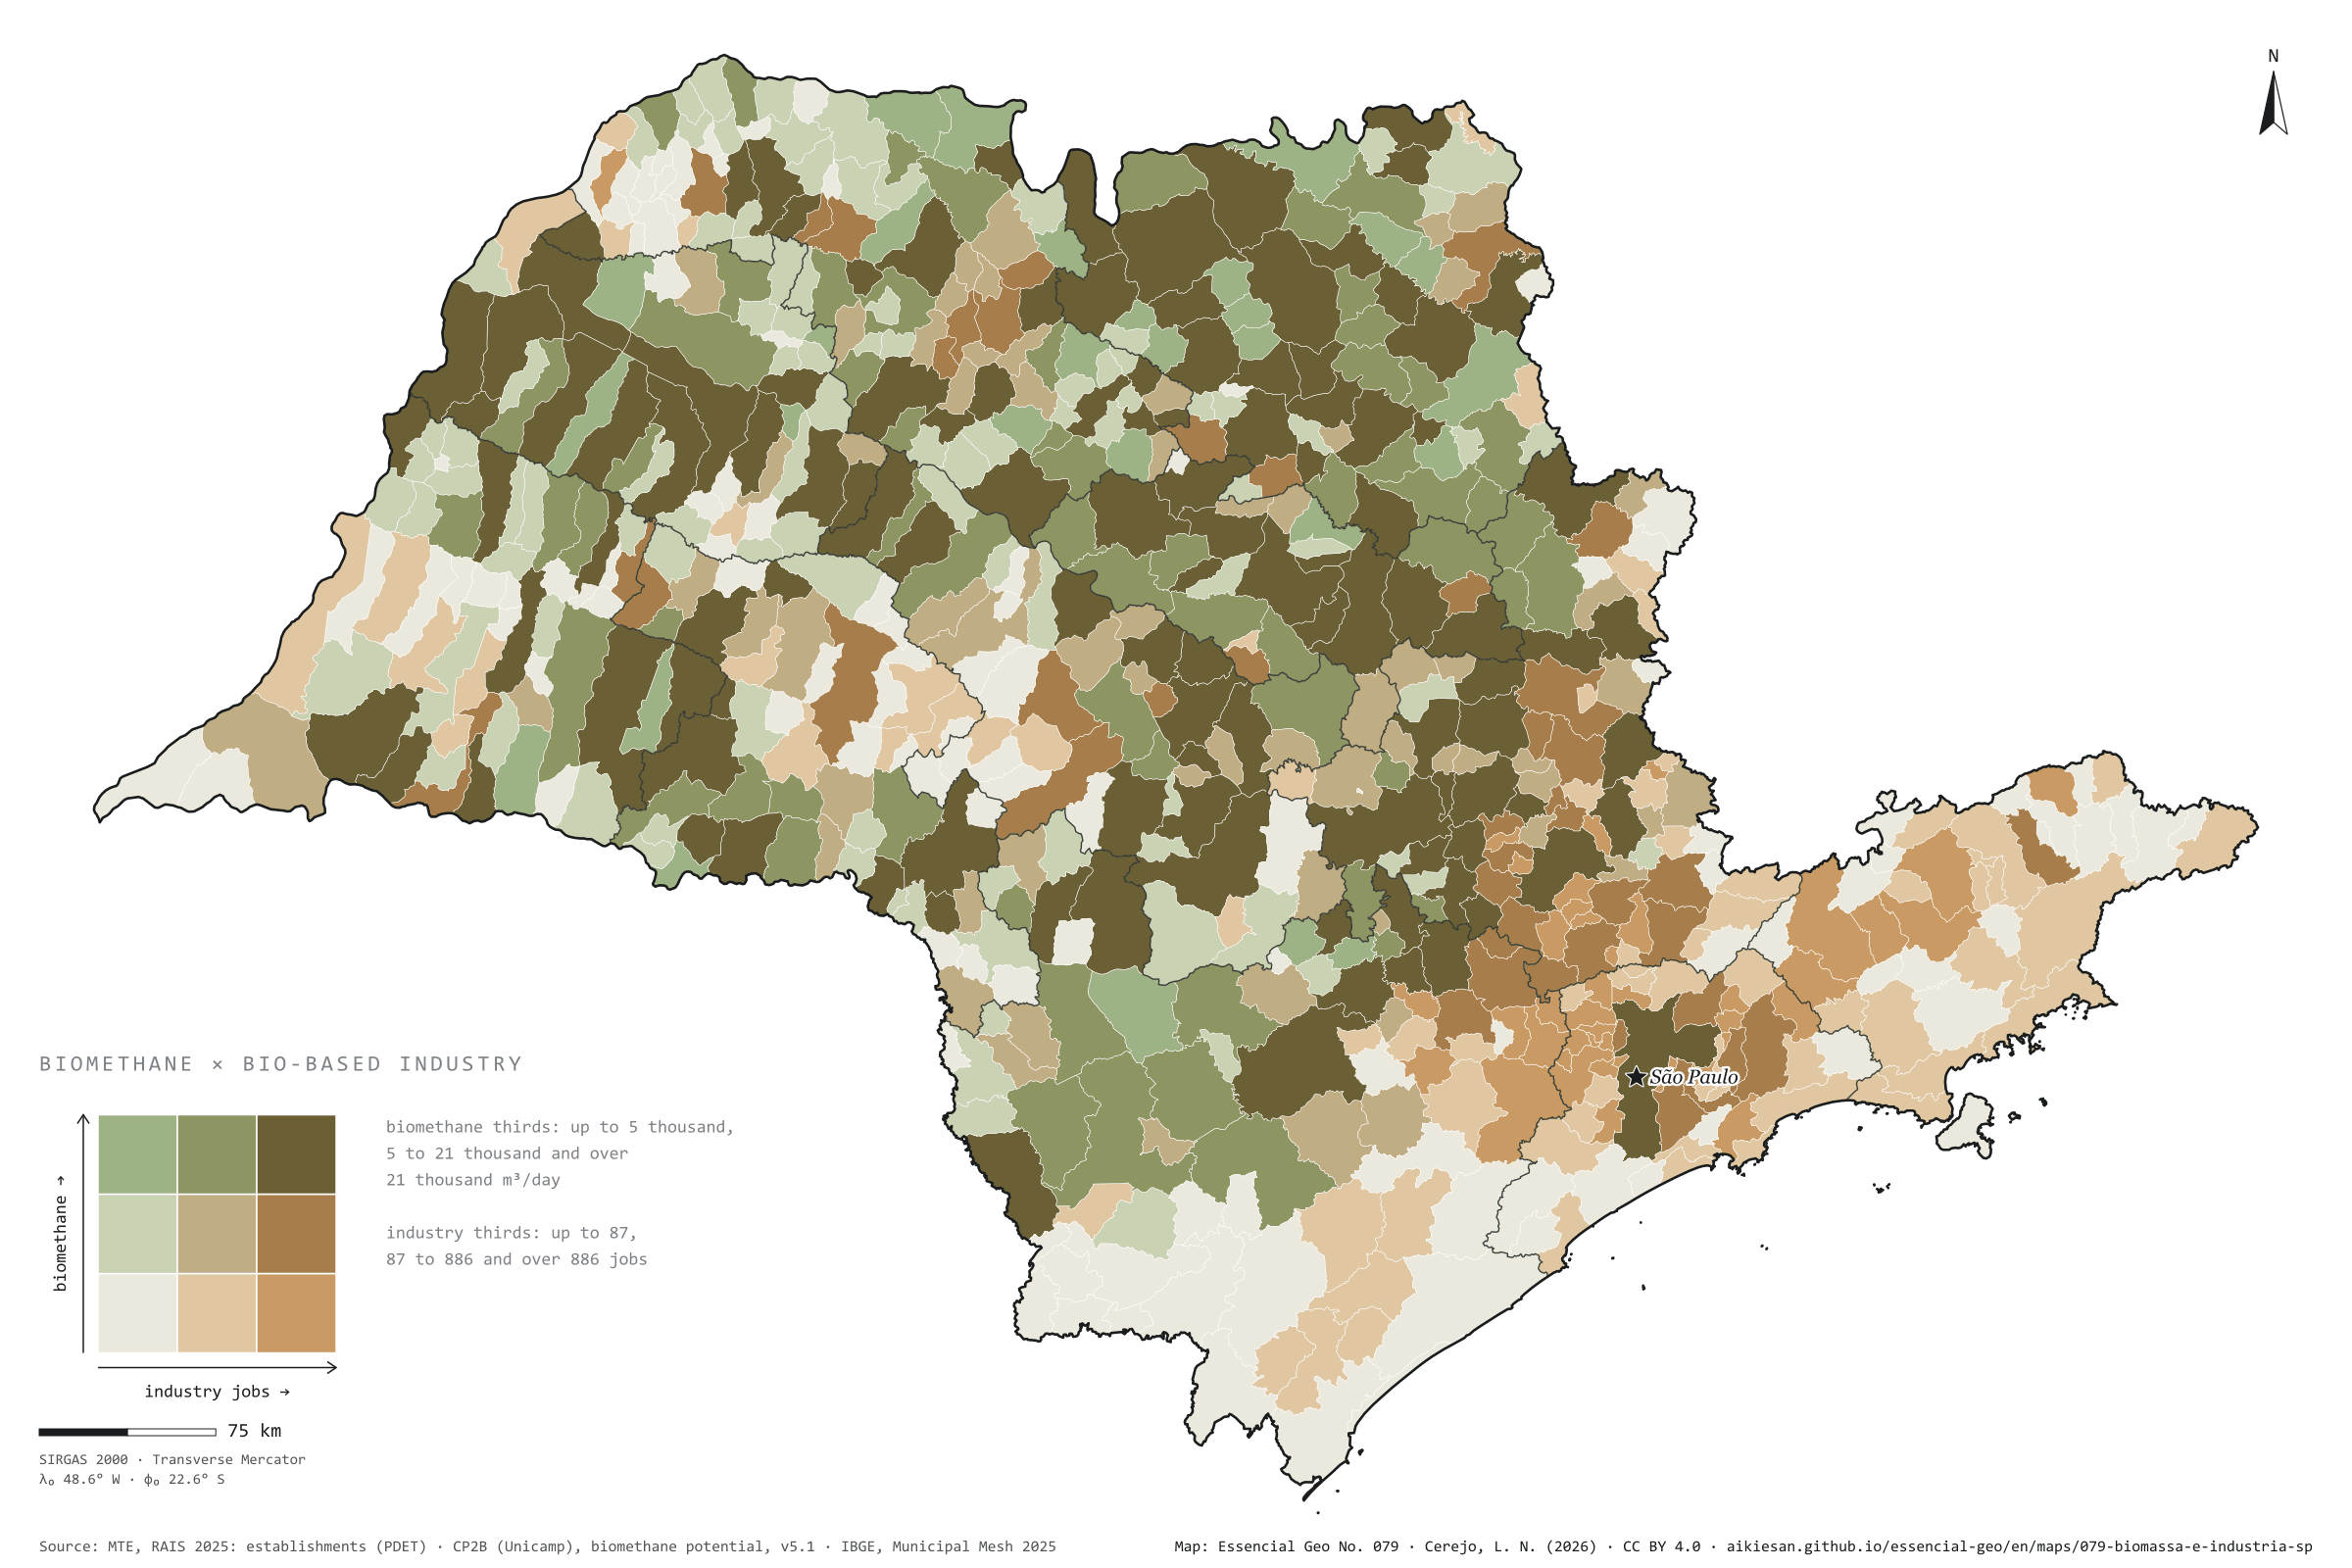
The hubs that already have both residue and industry, and those with only one
Fig. 079São Paulo State (SP)EPSG:4674Source: CP2B (Unicamp), MTE/PDET, IBGE
A bioeconomy hub needs two things in the same place: biomass and someone who knows how to convert it. This plate crosses the biomethane potential of residues (CP2B, accessible level, reference scenario) with formal jobs in bio-based industry (food, drink, wood, paper, fibres and biofuels), each split into thirds of the municipalities. In 115 municipalities both are in the top third: these are the hubs, with 61% of the state’s biomethane and 55% of those jobs, nearly all in the cane-growing north and centre. In 28, biomass is plentiful and industry scarce: Brejo Alegre has 77,000 m³ of biomethane a day and 4 industrial jobs. In 43, industry is strong and biomass is scarce, mostly in the metropolis: Barueri has 4,554 jobs and little residue of its own. Fourth plate of the collection “The bioeconomy at work”.
Technical record · downloads · citation
At a glance
Municipalities in the top third for both biomethane and industry
115municipalities
61% of the biomethane and 55% of the industry jobs
Municipalities with plenty of biomass and little industry
28municipalities
Municipalities with strong industry and little biomass
43municipalities
Layers
municipiospolygon645 municipalities: CP2B biomethane potential and bio-based industry jobs by segment (same GPKG as plate 076)
regioes_intermediariaspolygon11 intermediate geographic regions
Biomethane potential by municipality (CP2B v5.1, level N4, reference scenario) and active jobs on 31/12/2025 in bio-based industry (RAIS 2025), each split into thirds of the municipalities with a value; the cross gives nine classes.
The map without a frame, with legend, scale, reference system and credit written on it: ready for papers, lectures and slides. In two versions: with the basemap (neighbours and sea) or only the mapped area, on white.
CEREJO, Lucas Nakamura. Onde a biomassa encontra a fábrica: os polos que já têm resíduo e indústria, e os que só têm um dos dois. Versão 1.0.0. [S. l.]: Essencial, 2026. Conjunto de dados. Disponível em: https://aikiesan.github.io/essencial-geo/en/maps/079-biomassa-e-industria-sp/. Acesso em: 10 nov. 2026.
Cerejo, L. N. (2026). Onde a biomassa encontra a fábrica: os polos que já têm resíduo e indústria, e os que só têm um dos dois [Where biomass meets the factory: The hubs that already have both residue and industry, and those with only one] (Version 1.0.0) [Data set]. Essencial. https://aikiesan.github.io/essencial-geo/en/maps/079-biomassa-e-industria-sp/
@dataset{cerejo2026_biomassa_e_industria_sp,
  author    = {Cerejo, Lucas Nakamura},
  title     = {Onde a biomassa encontra a fábrica: Os polos que já têm resíduo e indústria, e os que só têm um dos dois},
  year      = {2026},
  publisher = {Essencial},
  version   = {1.0.0},
  url       = {https://aikiesan.github.io/essencial-geo/en/maps/079-biomassa-e-industria-sp/},
  language  = {portuguese},
  note      = {English title: Where biomass meets the factory: The hubs that already have both residue and industry, and those with only one. Licence CC BY 4.0}
}
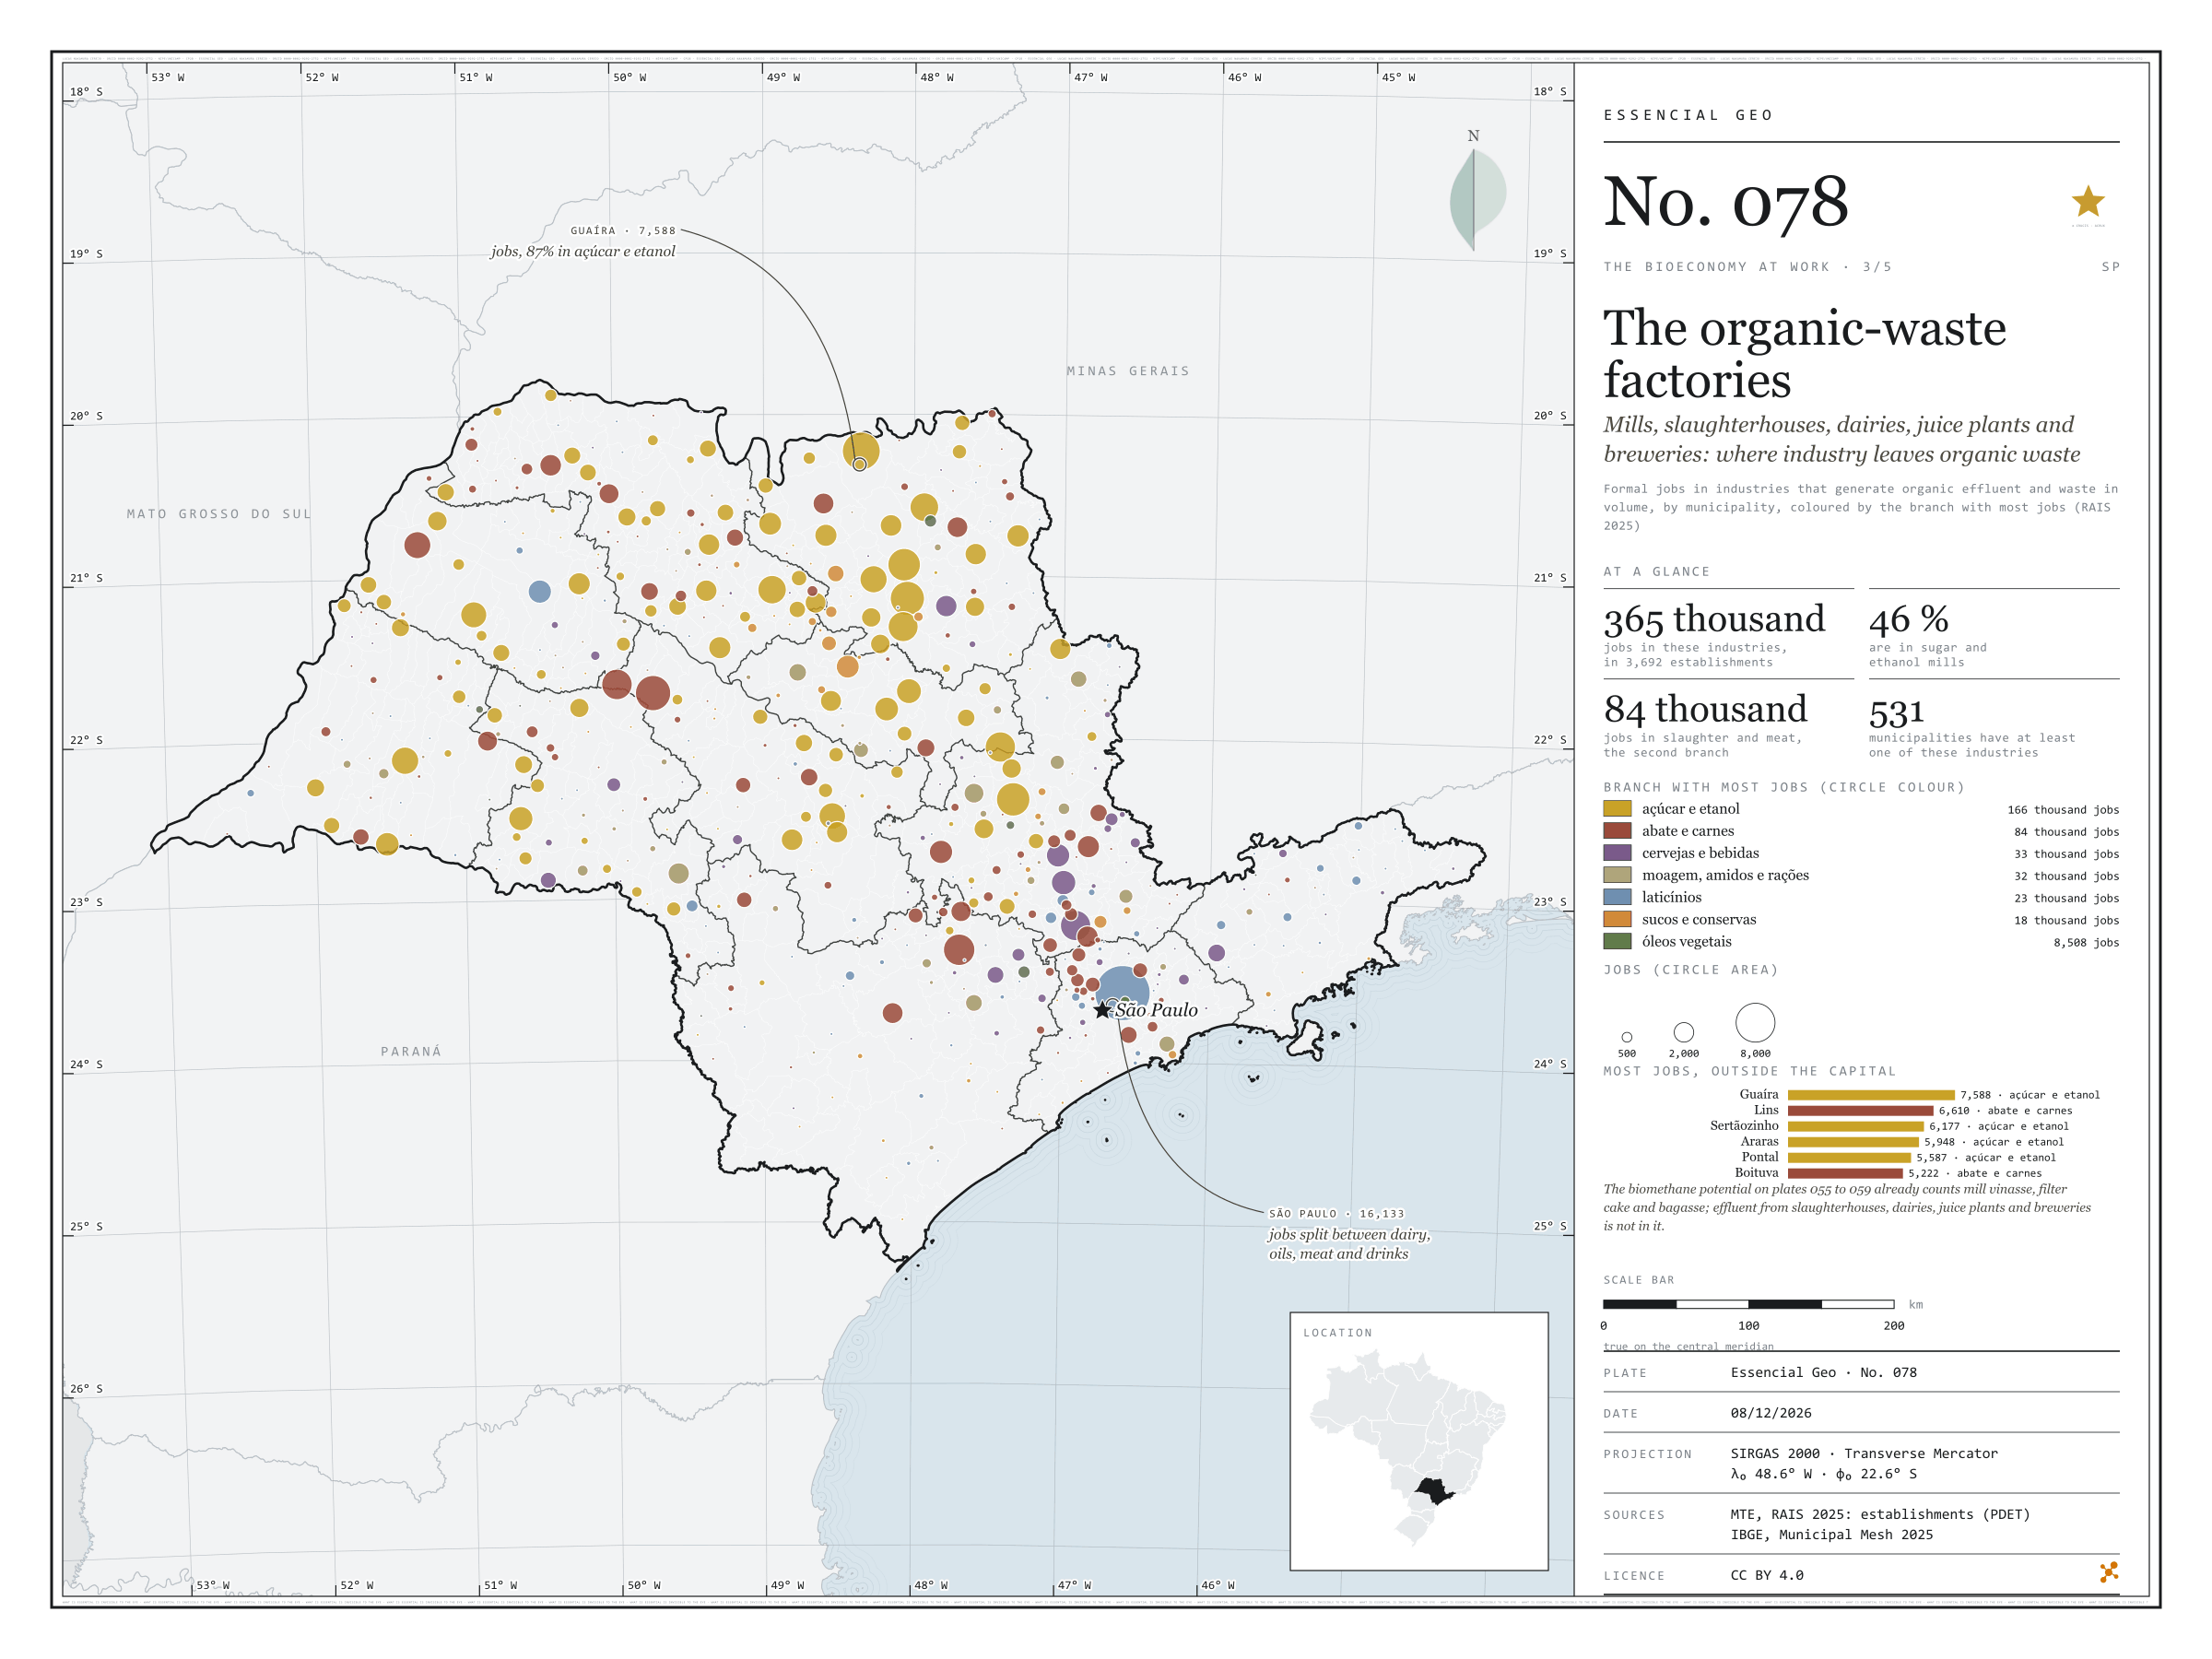
Mills, slaughterhouses, dairies, juice plants and breweries: where industry leaves organic waste
Fig. 078São Paulo State (SP)EPSG:4674Source: MTE/PDET, IBGE
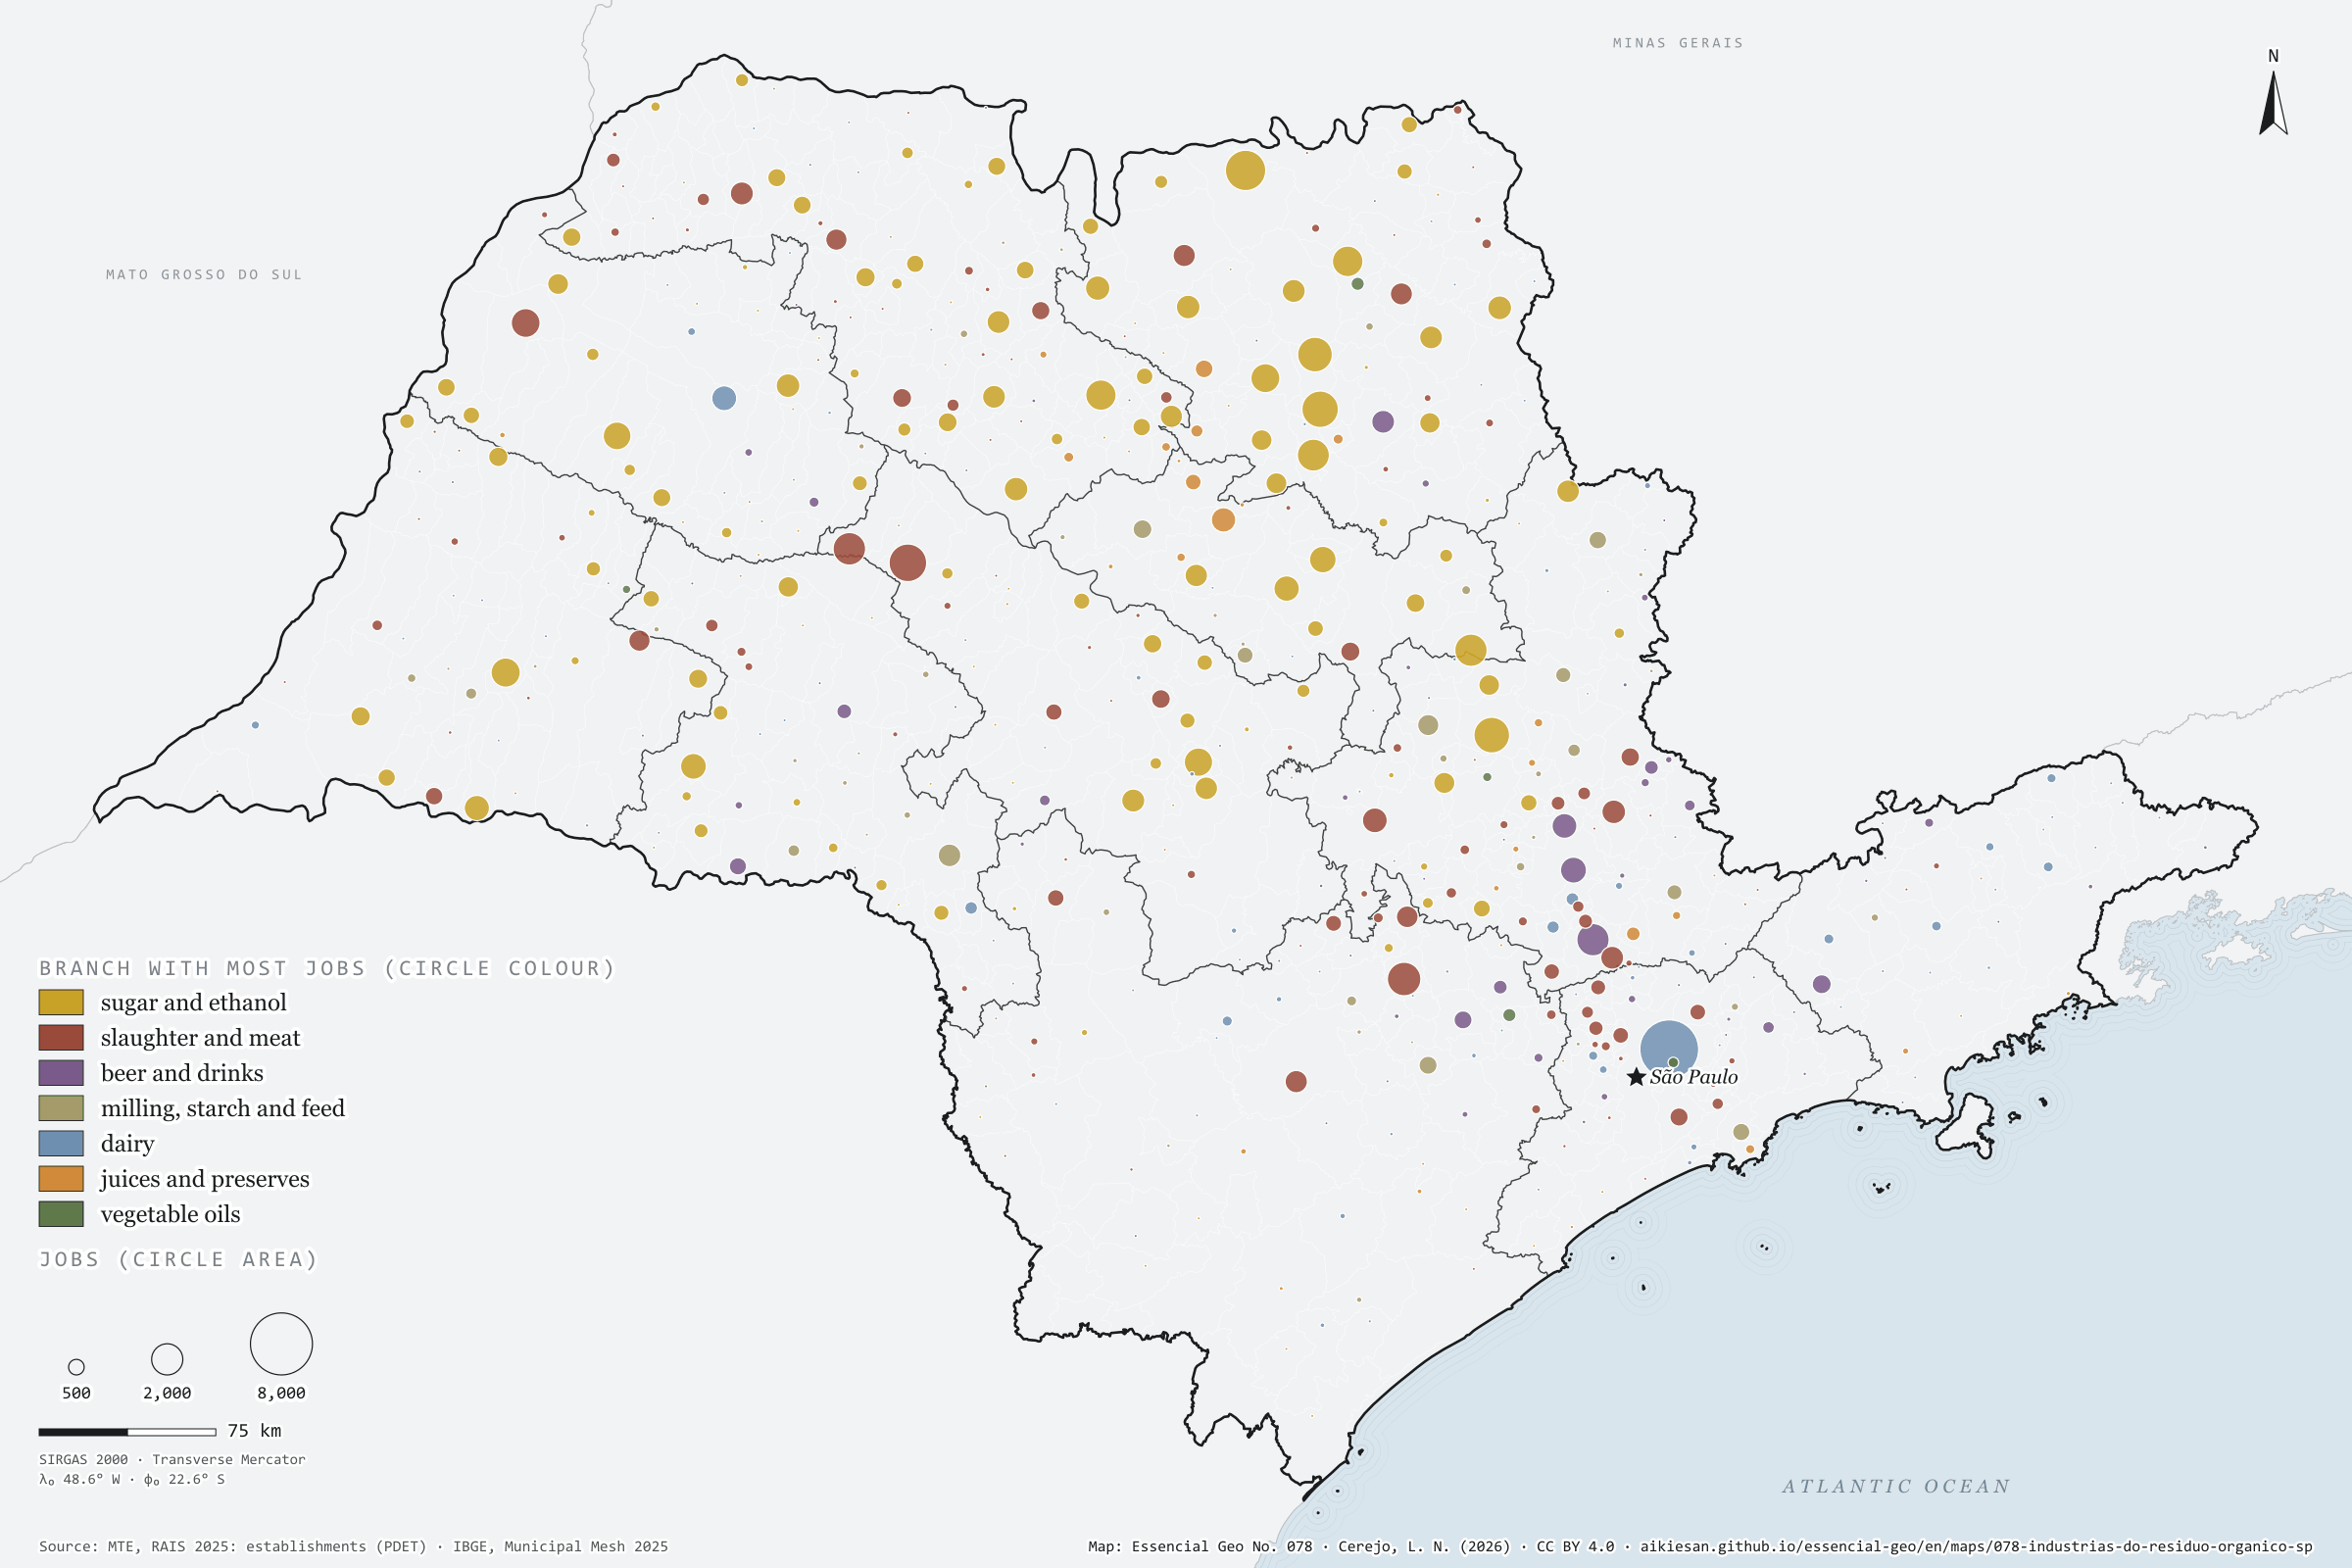
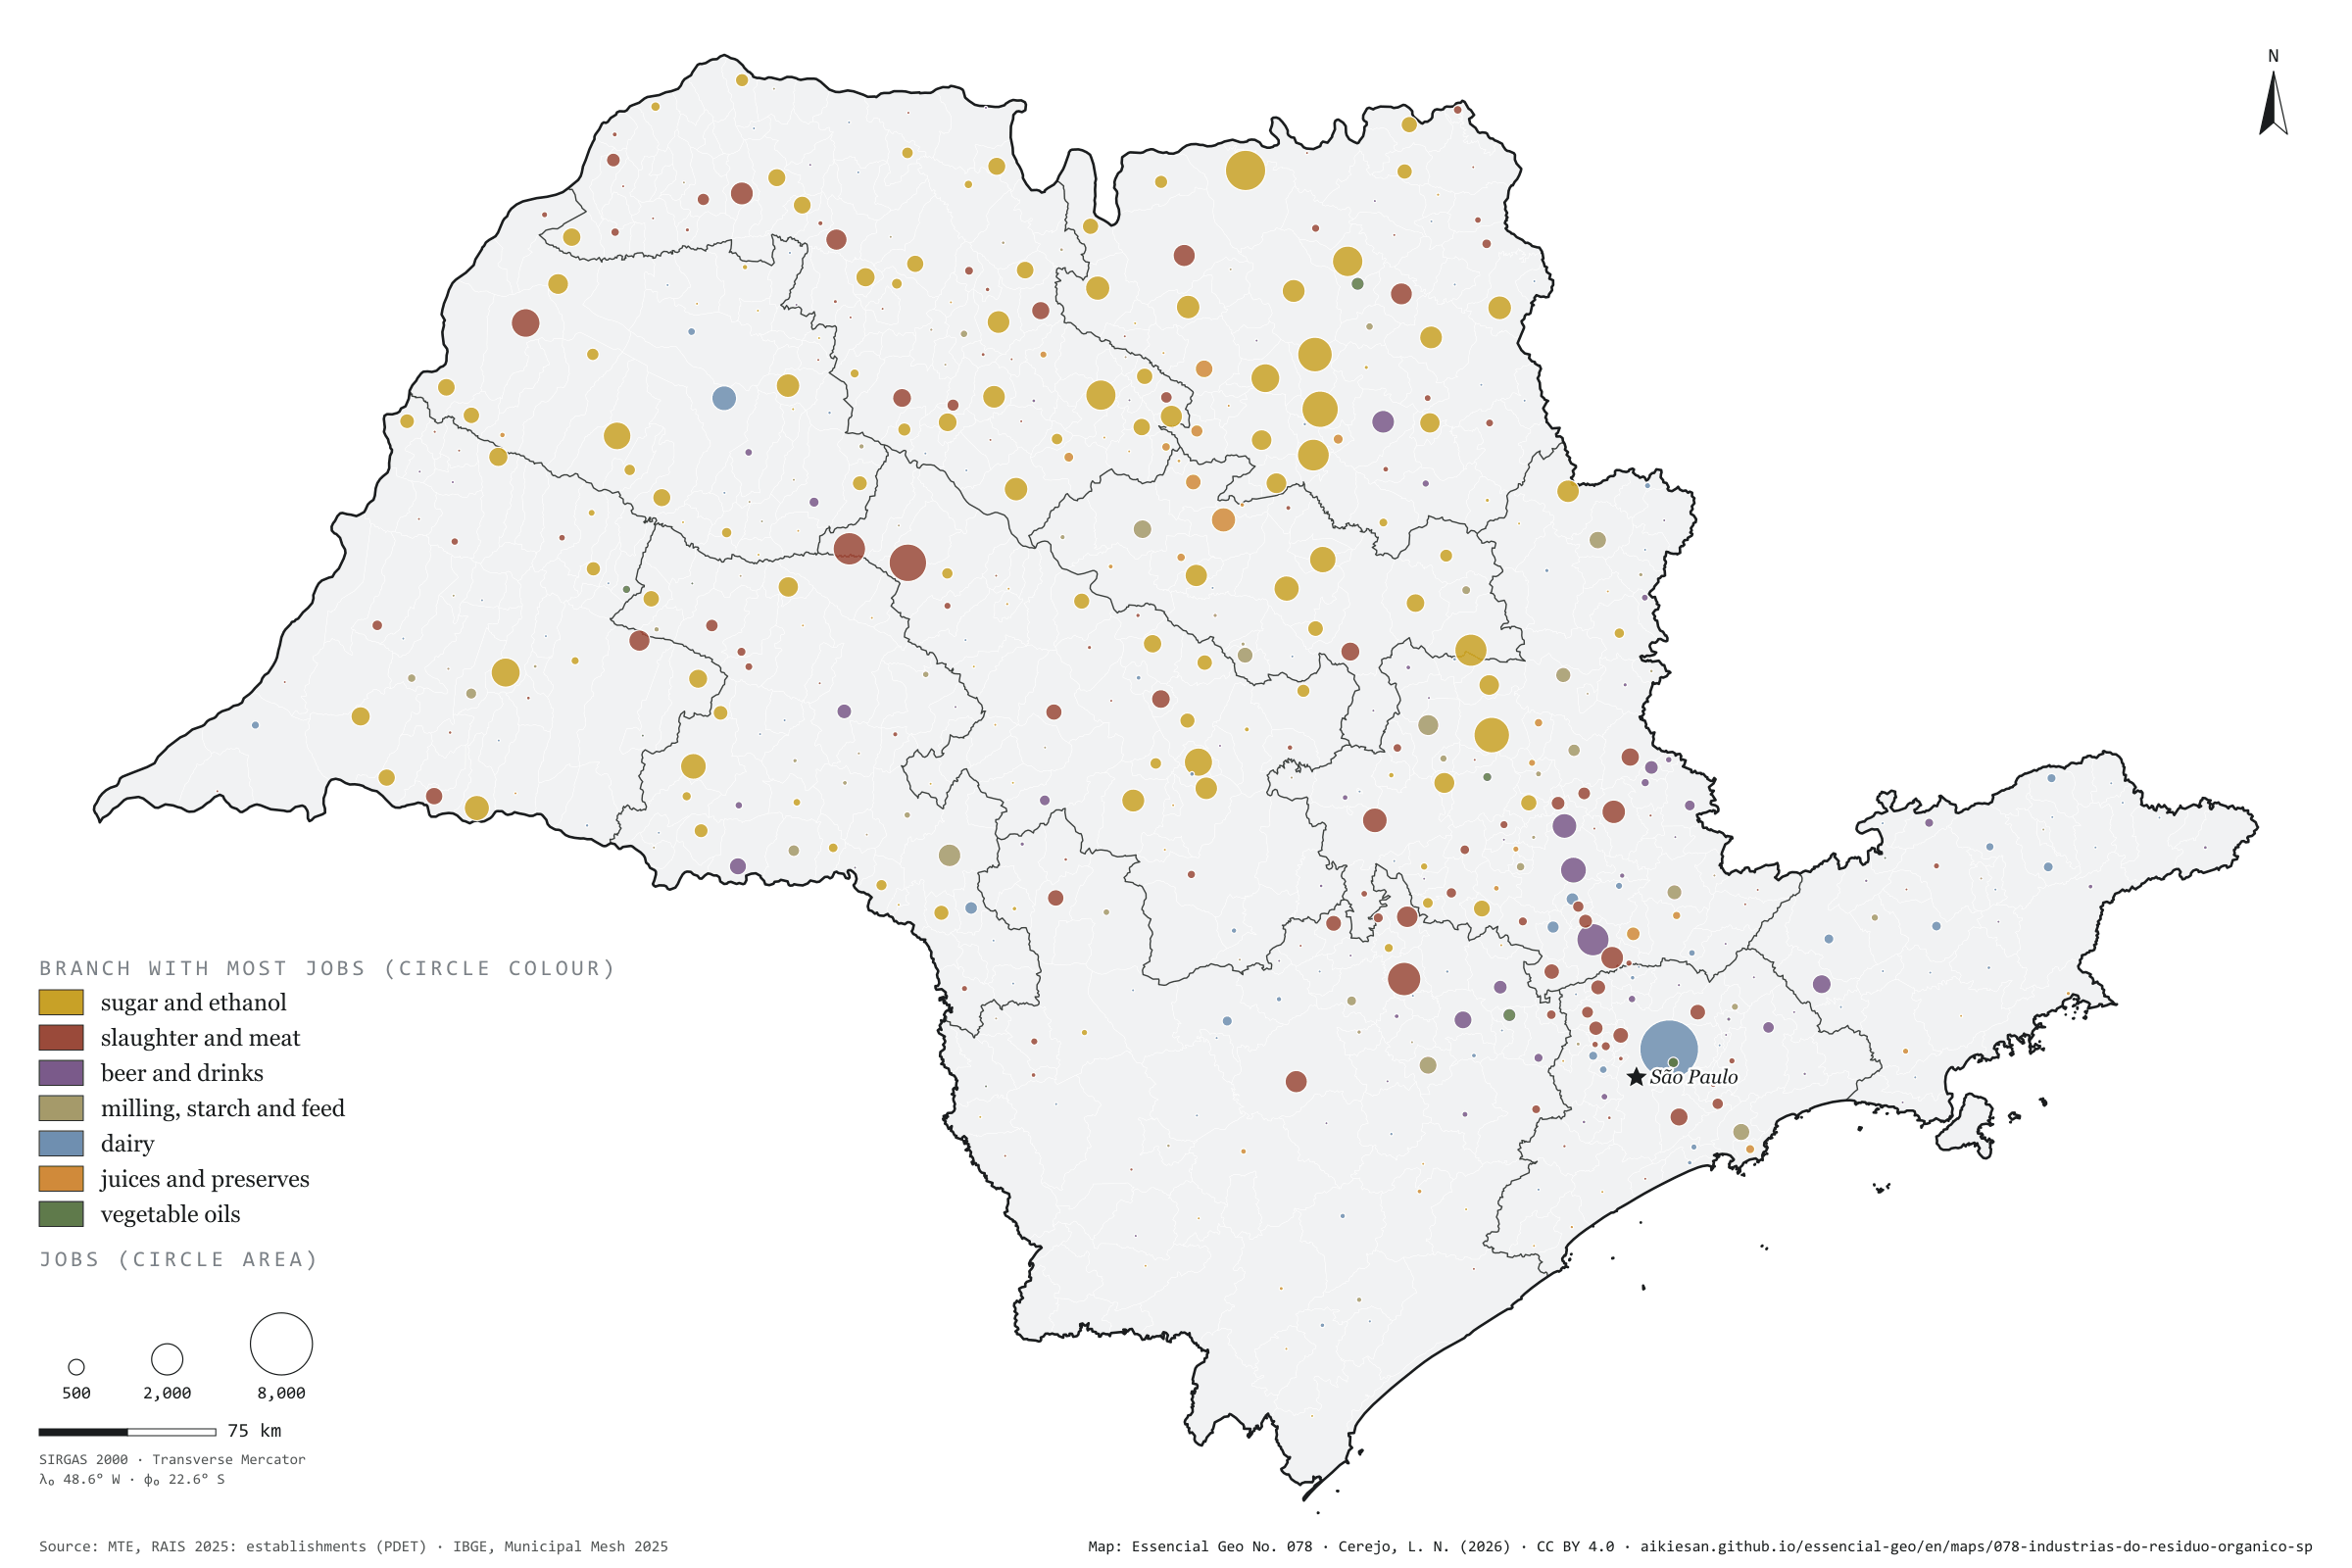
Some industries leave organic waste in volume: vinasse, filter cake and bagasse at the mills; blood, rumen contents and fatty effluent at slaughterhouses; whey at dairies; pulp and peel at juice plants; yeast and spent grain at breweries. In São Paulo, 364,647 formal jobs are in these industries, in 3,692 establishments and 531 municipalities. Sugar and ethanol account for 46%; slaughter, 23%. The capital has the most jobs, 16,133, split between dairy, oils, slaughter and drinks. Inland the mill rules: in Guaíra, 87% of the 7,588 jobs are in sugar and ethanol; Sertãozinho and Araras follow close behind. Slaughter leads in 124 municipalities, the mills in 116 and dairies in 89. CP2B already counts cane residues; the effluent of the other industries is left out. Third plate of the collection “The bioeconomy at work”.
Technical record · downloads · citation
At a glance
Jobs in organic-waste-generating industries, by branch (jobs)
Sugar and ethanol45.5%
Slaughter23%
Drinks9.1%
Grain and feed8.8%
Dairy6.4%
Fruit and juice4.9%
Oils2.3%
Establishments in generating industries
3,692establishments
in 531 municipalities
Layers
municipiospolygon645 municipalities: jobs and establishments in generating industries, by branch, and the dominant branch (same GPKG as plate 076)
regioes_intermediariaspolygon11 intermediate geographic regions
Active jobs on 31/12/2025 in seven industrial branches that generate organic effluent and waste in volume (slaughter, dairy, fruit and juice, sugar and ethanol, oils, drinks, grain and feed), by CNAE class and municipality; circle proportional to the total, coloured by the branch with most jobs.
The map without a frame, with legend, scale, reference system and credit written on it: ready for papers, lectures and slides. In two versions: with the basemap (neighbours and sea) or only the mapped area, on white.
CEREJO, Lucas Nakamura. As fábricas do resíduo orgânico: usinas, frigoríficos, laticínios, sucos e cervejarias: onde a indústria deixa resíduo orgânico. Versão 1.0.0. [S. l.]: Essencial, 2026. Conjunto de dados. Disponível em: https://aikiesan.github.io/essencial-geo/en/maps/078-industrias-do-residuo-organico-sp/. Acesso em: 10 nov. 2026.
Cerejo, L. N. (2026). As fábricas do resíduo orgânico: usinas, frigoríficos, laticínios, sucos e cervejarias: onde a indústria deixa resíduo orgânico [The organic-waste factories: Mills, slaughterhouses, dairies, juice plants and breweries: where industry leaves organic waste] (Version 1.0.0) [Data set]. Essencial. https://aikiesan.github.io/essencial-geo/en/maps/078-industrias-do-residuo-organico-sp/
@dataset{cerejo2026_industrias_do_residuo_organico_sp,
  author    = {Cerejo, Lucas Nakamura},
  title     = {As fábricas do resíduo orgânico: Usinas, frigoríficos, laticínios, sucos e cervejarias: onde a indústria deixa resíduo orgânico},
  year      = {2026},
  publisher = {Essencial},
  version   = {1.0.0},
  url       = {https://aikiesan.github.io/essencial-geo/en/maps/078-industrias-do-residuo-organico-sp/},
  language  = {portuguese},
  note      = {English title: The organic-waste factories: Mills, slaughterhouses, dairies, juice plants and breweries: where industry leaves organic waste. Licence CC BY 4.0}
}
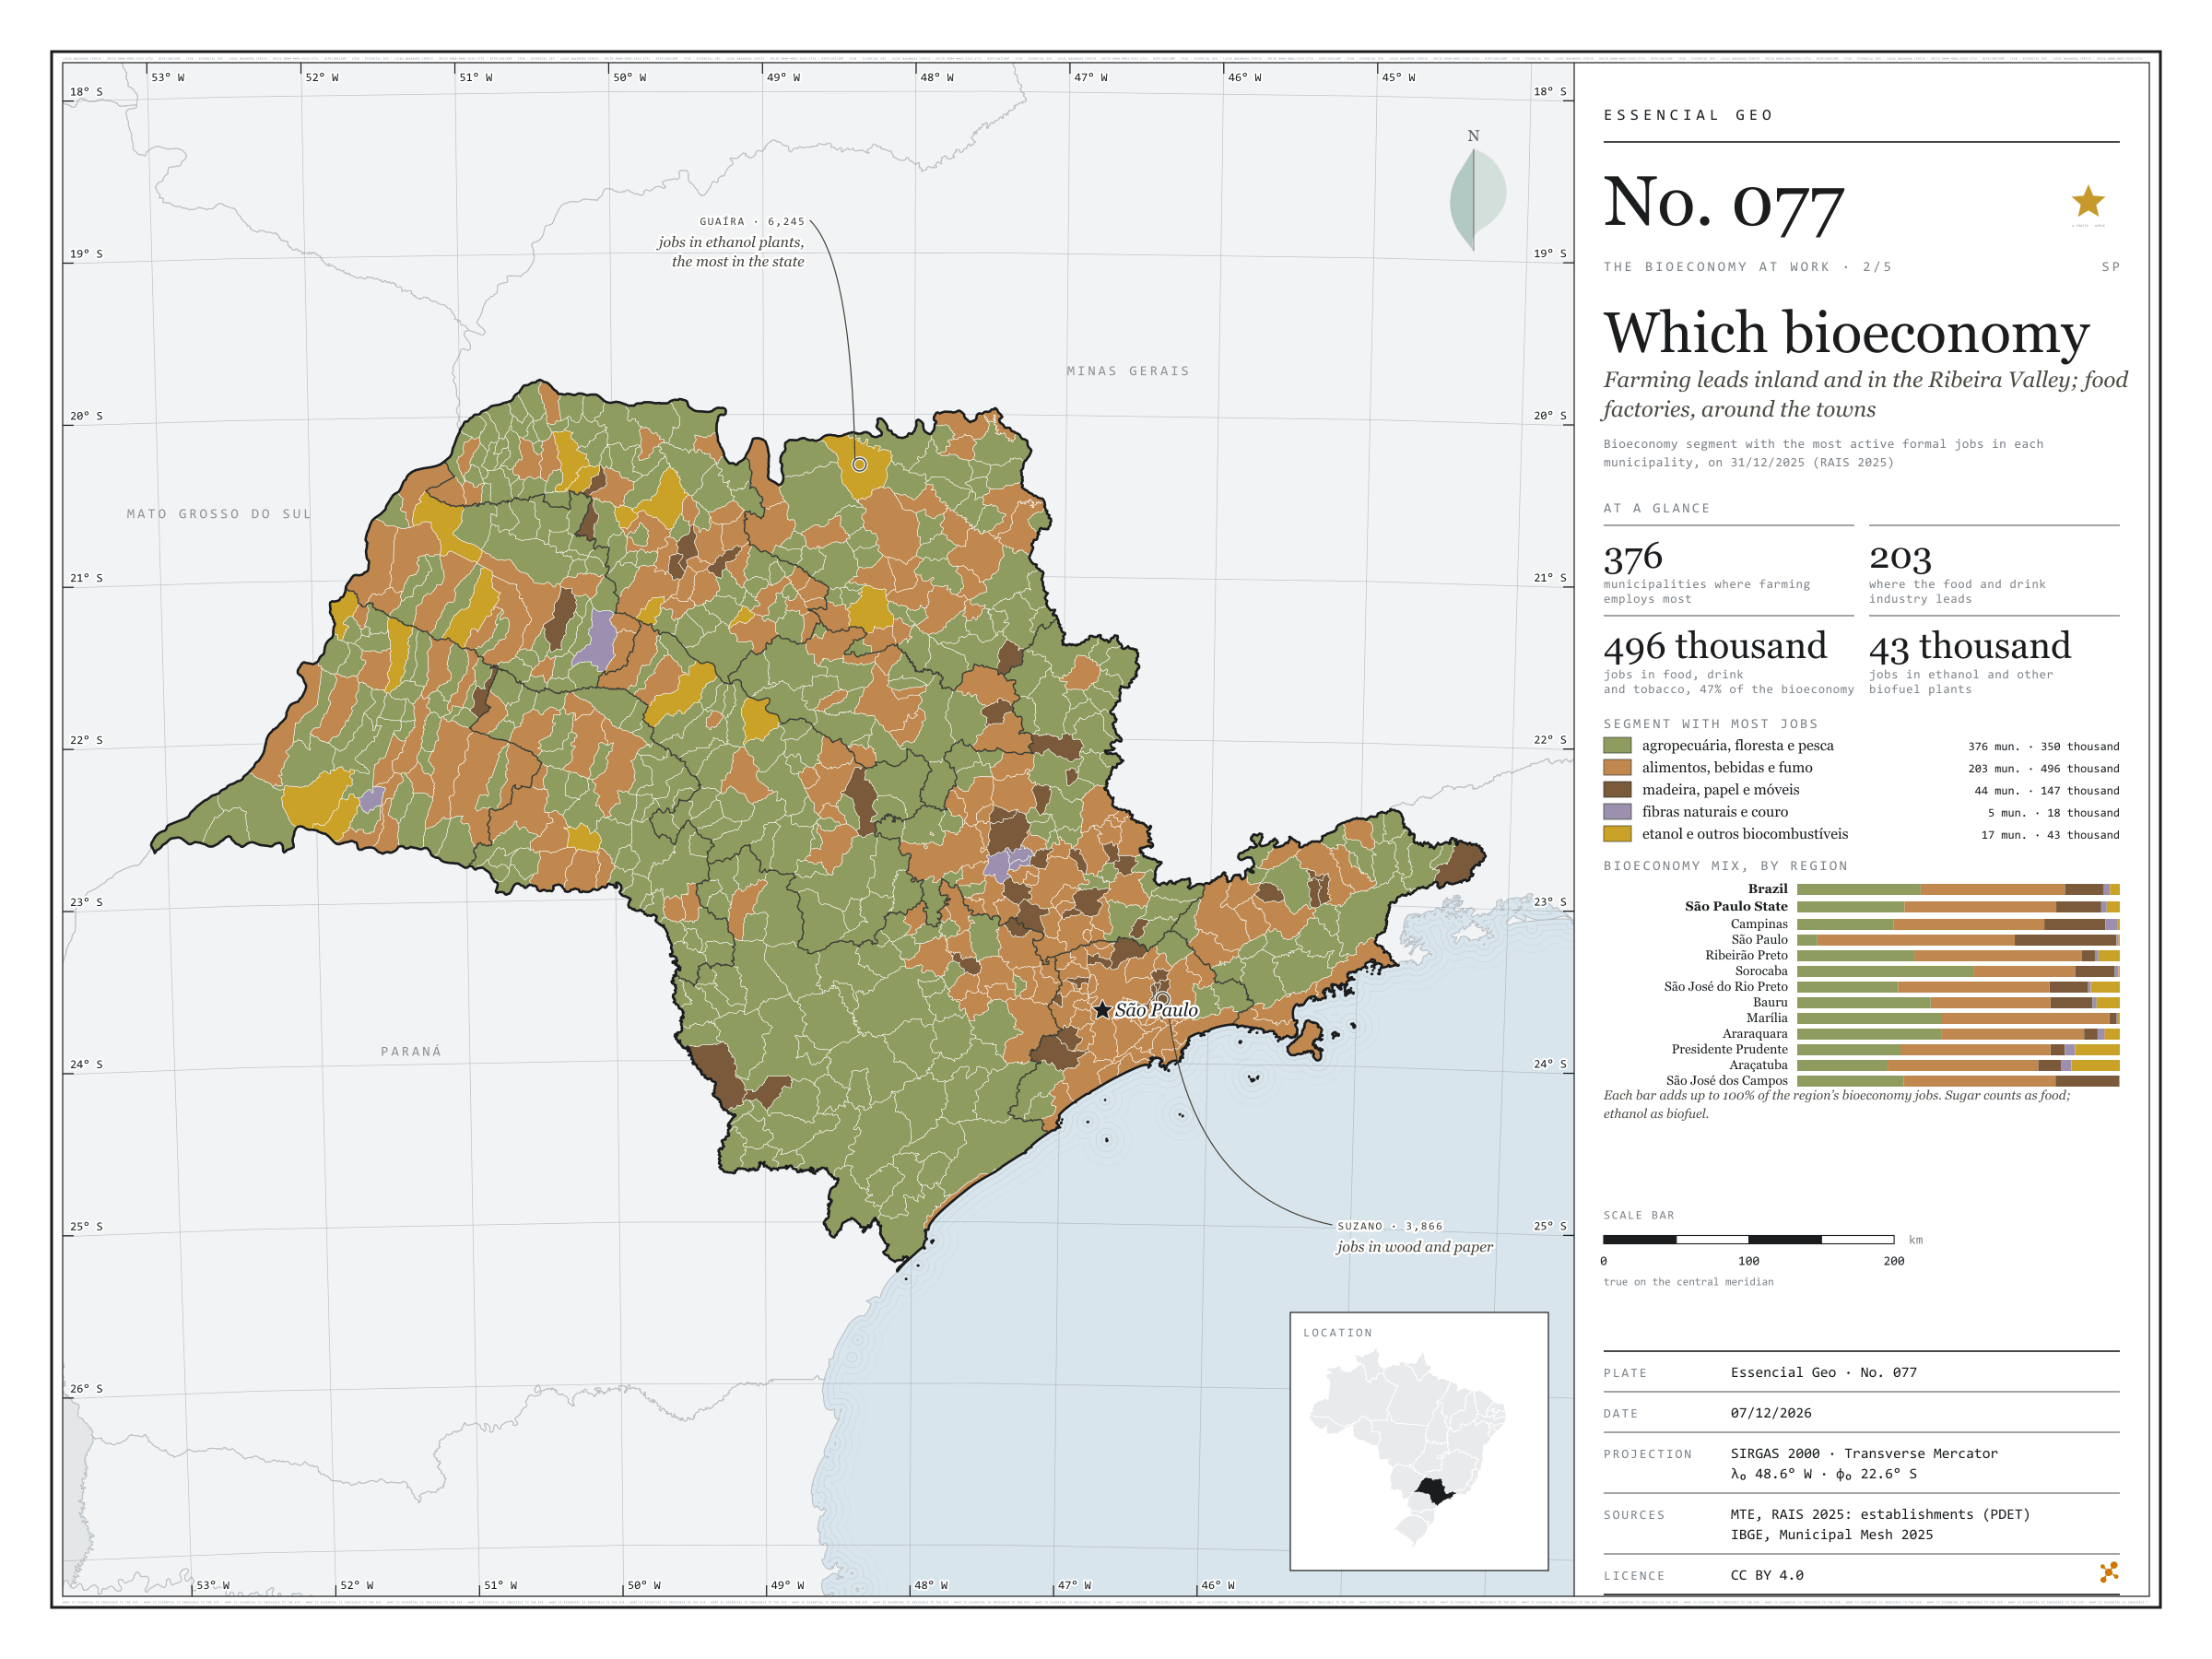
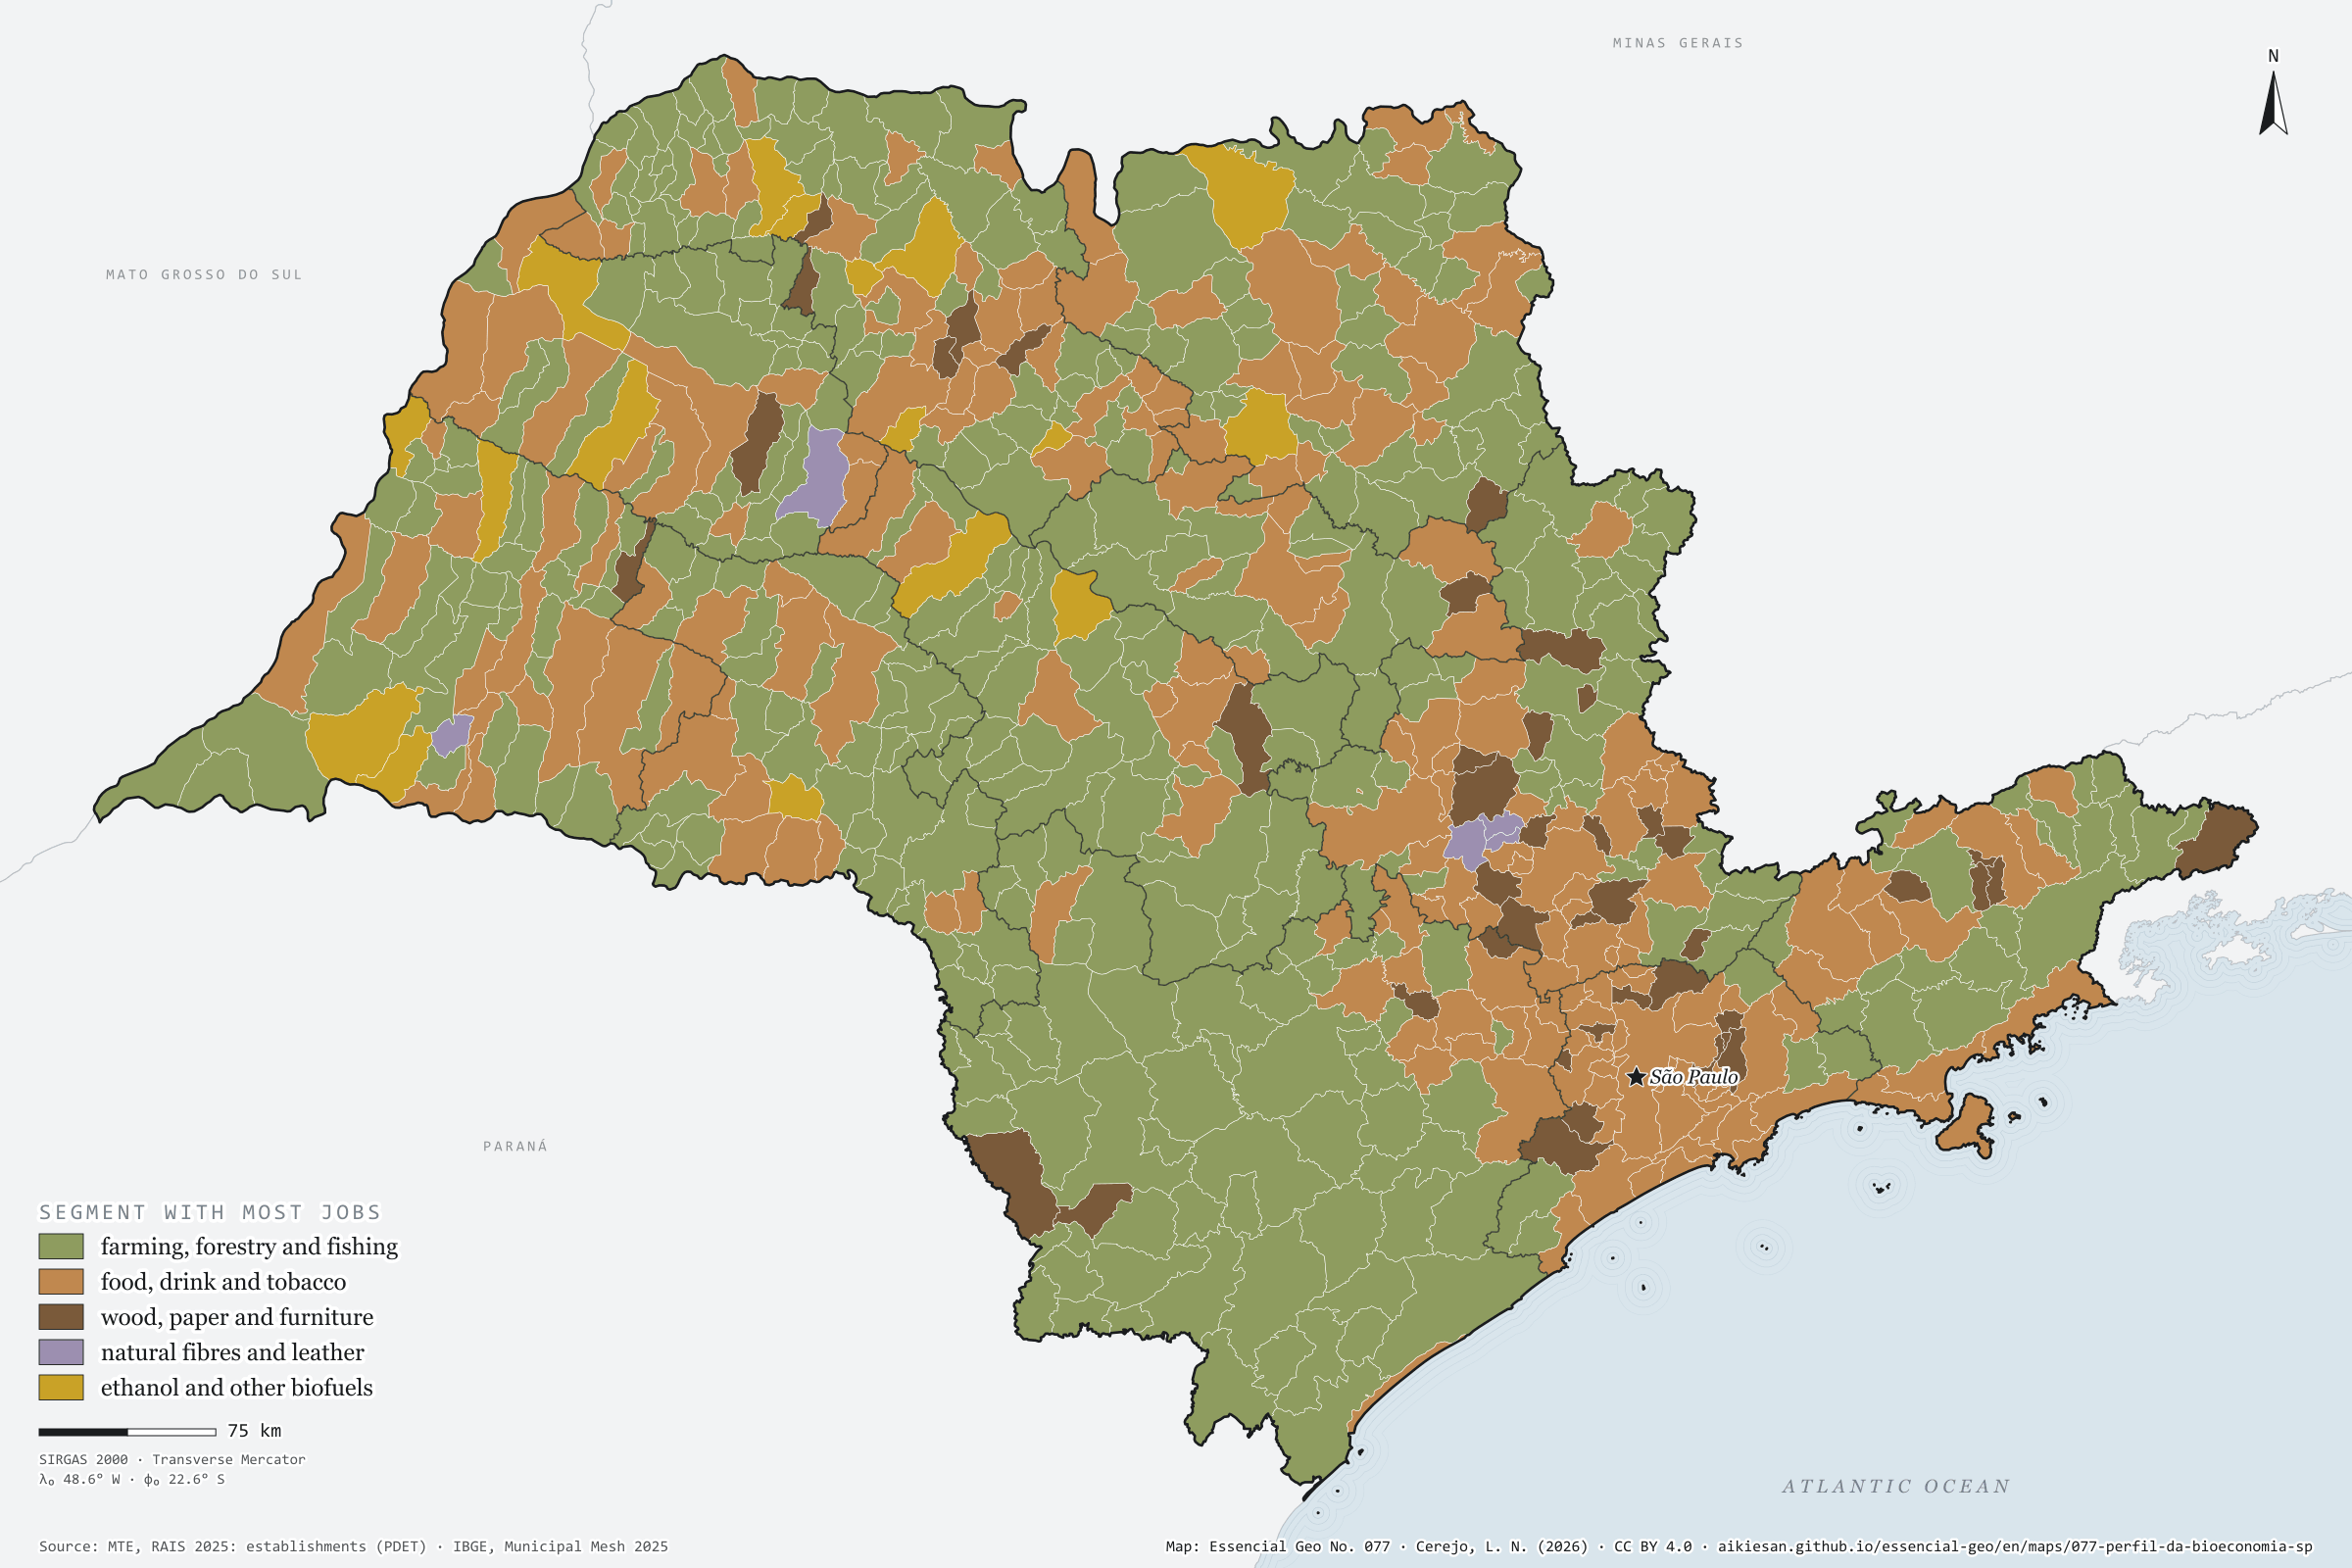
Farming leads inland and in the Ribeira Valley; food factories, around the towns
Fig. 077São Paulo State (SP)EPSG:4674Source: MTE/PDET, JRC (European Commission), IBGE
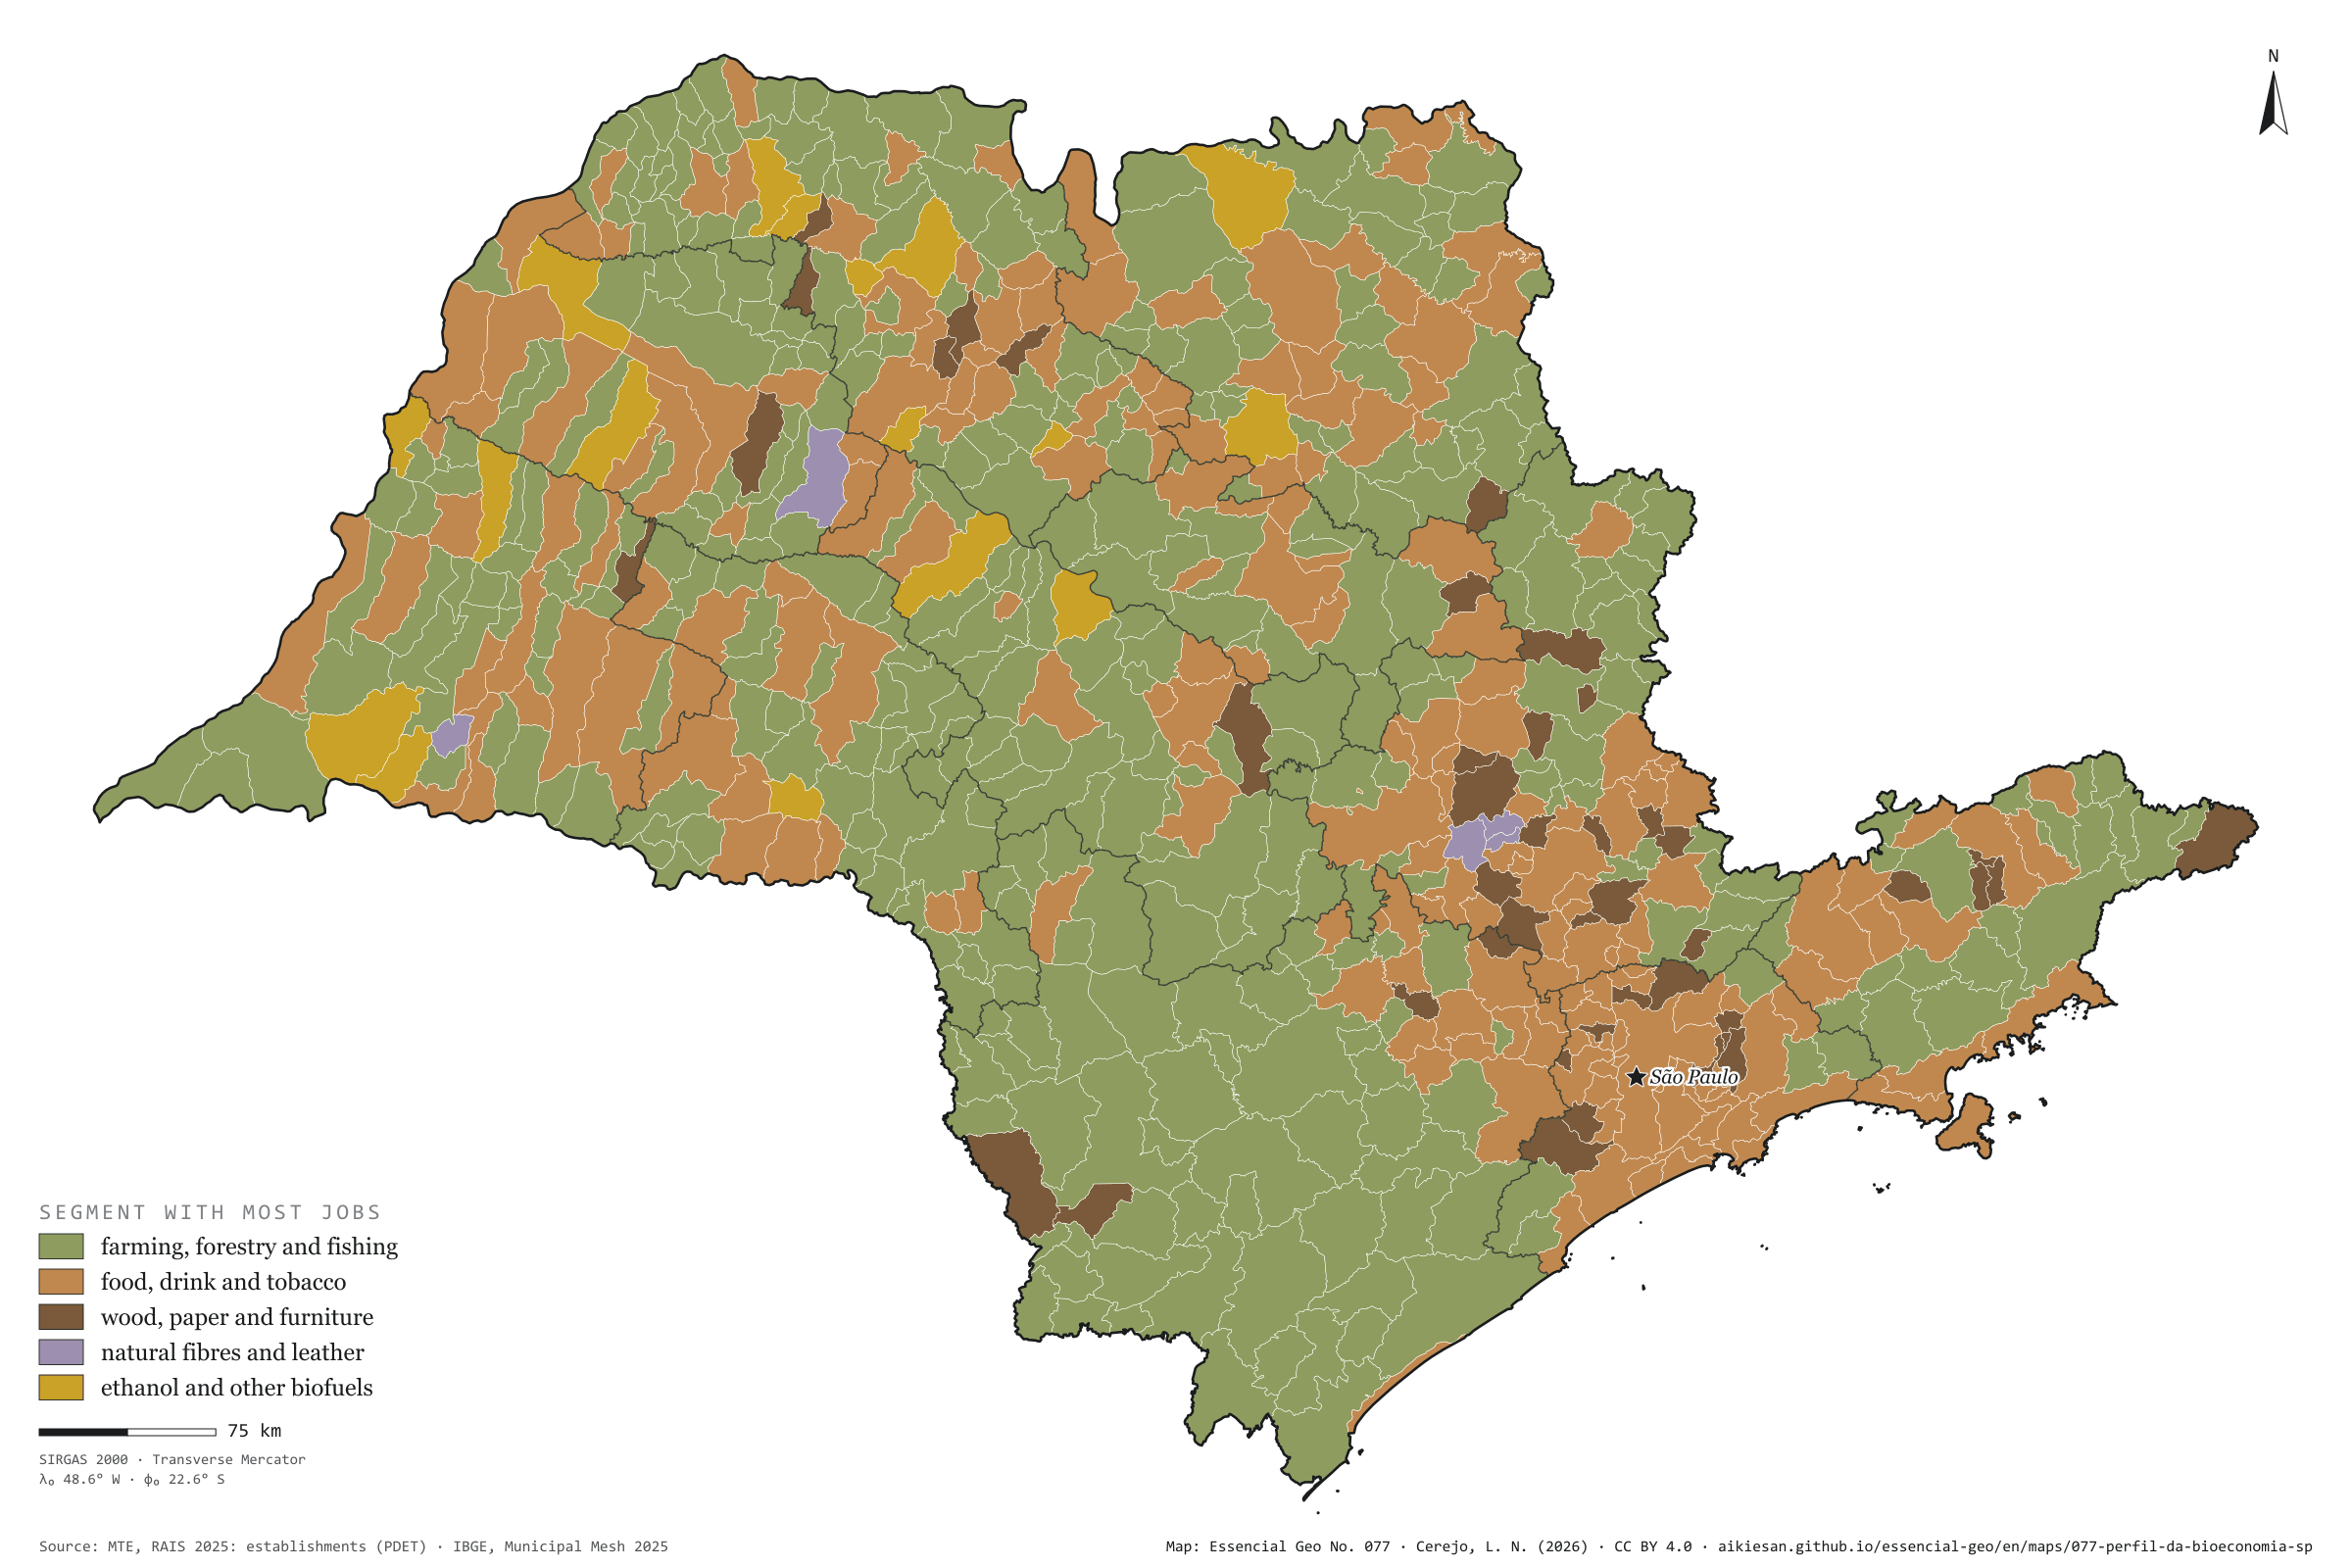
São Paulo’s bioeconomy is, above all, a food factory: food, drink and tobacco account for 496,000 of the 1.05 million formal jobs, 47%, against 45% in Brazil. Farming, fishing and forestry have 350,000, 33%, below the country’s 38%. Wood, paper and wooden furniture have 147,000; biofuels, 43,000; natural fibres and leather, 18,000. By municipality, farming leads in 376 of the 645, nearly all small, in the west and the Ribeira Valley. The food industry leads in 203, around the mid-sized towns and the metropolis. Wood and paper lead in 44, such as Suzano, with 3,866 jobs. Ethanol mills lead in 17, among them Guaíra, with 6,245 jobs in biofuels. Fibres and leather lead in 5. Second plate of the collection “The bioeconomy at work”.
Technical record · downloads · citation
At a glance
Bioeconomy jobs by segment (jobs)
Food, drink and tobacco47.1%
Farming, fishing and forestry33.2%
Wood and paper13.9%
Biofuels4%
Fibres and leather1.7%
Municipalities where farming is the segment with most jobs
376municipalities
of 645; food leads in 203
Layers
municipiospolygon645 municipalities: bioeconomy jobs by segment and dominant segment (same GPKG as plate 076)
regioes_intermediariaspolygon11 intermediate geographic regions
Bioeconomy active jobs on 31/12/2025, within the European JRC scope, split into five segments by CNAE subclass; each municipality takes the colour of the segment with most jobs.
The map without a frame, with legend, scale, reference system and credit written on it: ready for papers, lectures and slides. In two versions: with the basemap (neighbours and sea) or only the mapped area, on white.
CEREJO, Lucas Nakamura. Que bioeconomia: o campo lidera no interior e no Vale do Ribeira; a fábrica de alimentos, em volta das cidades. Versão 1.0.0. [S. l.]: Essencial, 2026. Conjunto de dados. Disponível em: https://aikiesan.github.io/essencial-geo/en/maps/077-perfil-da-bioeconomia-sp/. Acesso em: 10 nov. 2026.
Cerejo, L. N. (2026). Que bioeconomia: o campo lidera no interior e no Vale do Ribeira; a fábrica de alimentos, em volta das cidades [Which bioeconomy: Farming leads inland and in the Ribeira Valley; food factories, around the towns] (Version 1.0.0) [Data set]. Essencial. https://aikiesan.github.io/essencial-geo/en/maps/077-perfil-da-bioeconomia-sp/
@dataset{cerejo2026_perfil_da_bioeconomia_sp,
  author    = {Cerejo, Lucas Nakamura},
  title     = {Que bioeconomia: O campo lidera no interior e no Vale do Ribeira; a fábrica de alimentos, em volta das cidades},
  year      = {2026},
  publisher = {Essencial},
  version   = {1.0.0},
  url       = {https://aikiesan.github.io/essencial-geo/en/maps/077-perfil-da-bioeconomia-sp/},
  language  = {portuguese},
  note      = {English title: Which bioeconomy: Farming leads inland and in the Ribeira Valley; food factories, around the towns. Licence CC BY 4.0}
}
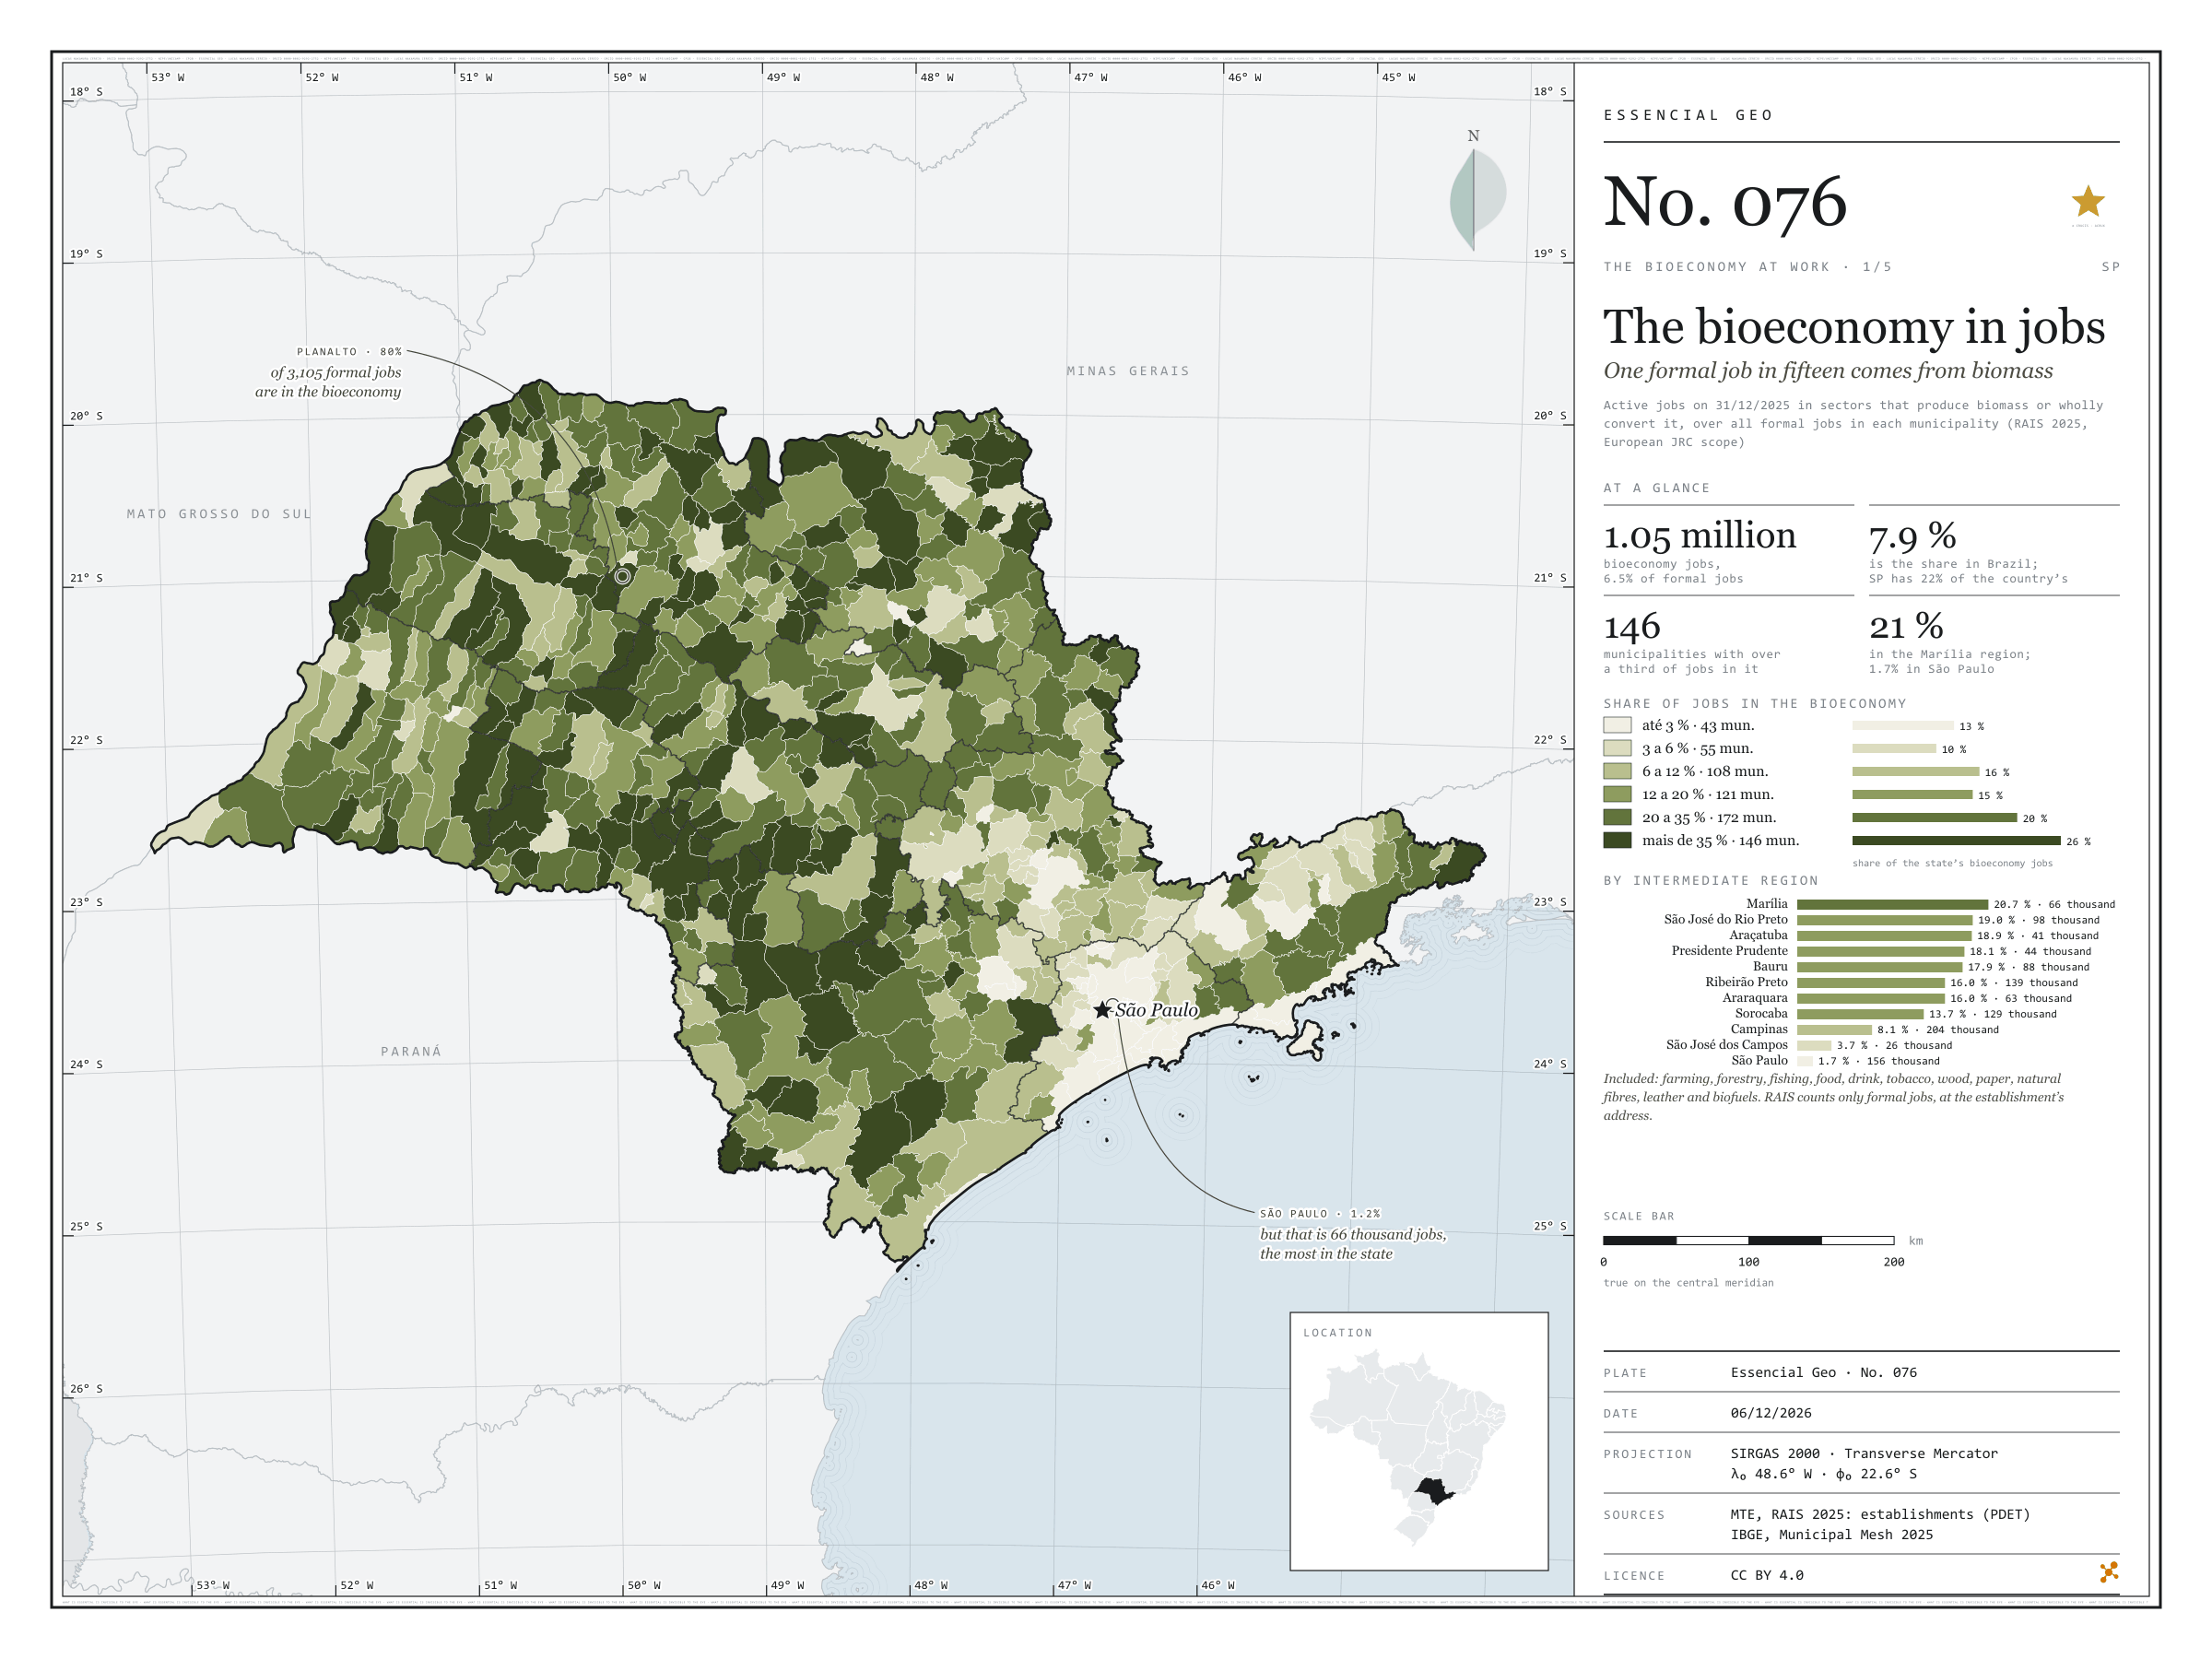
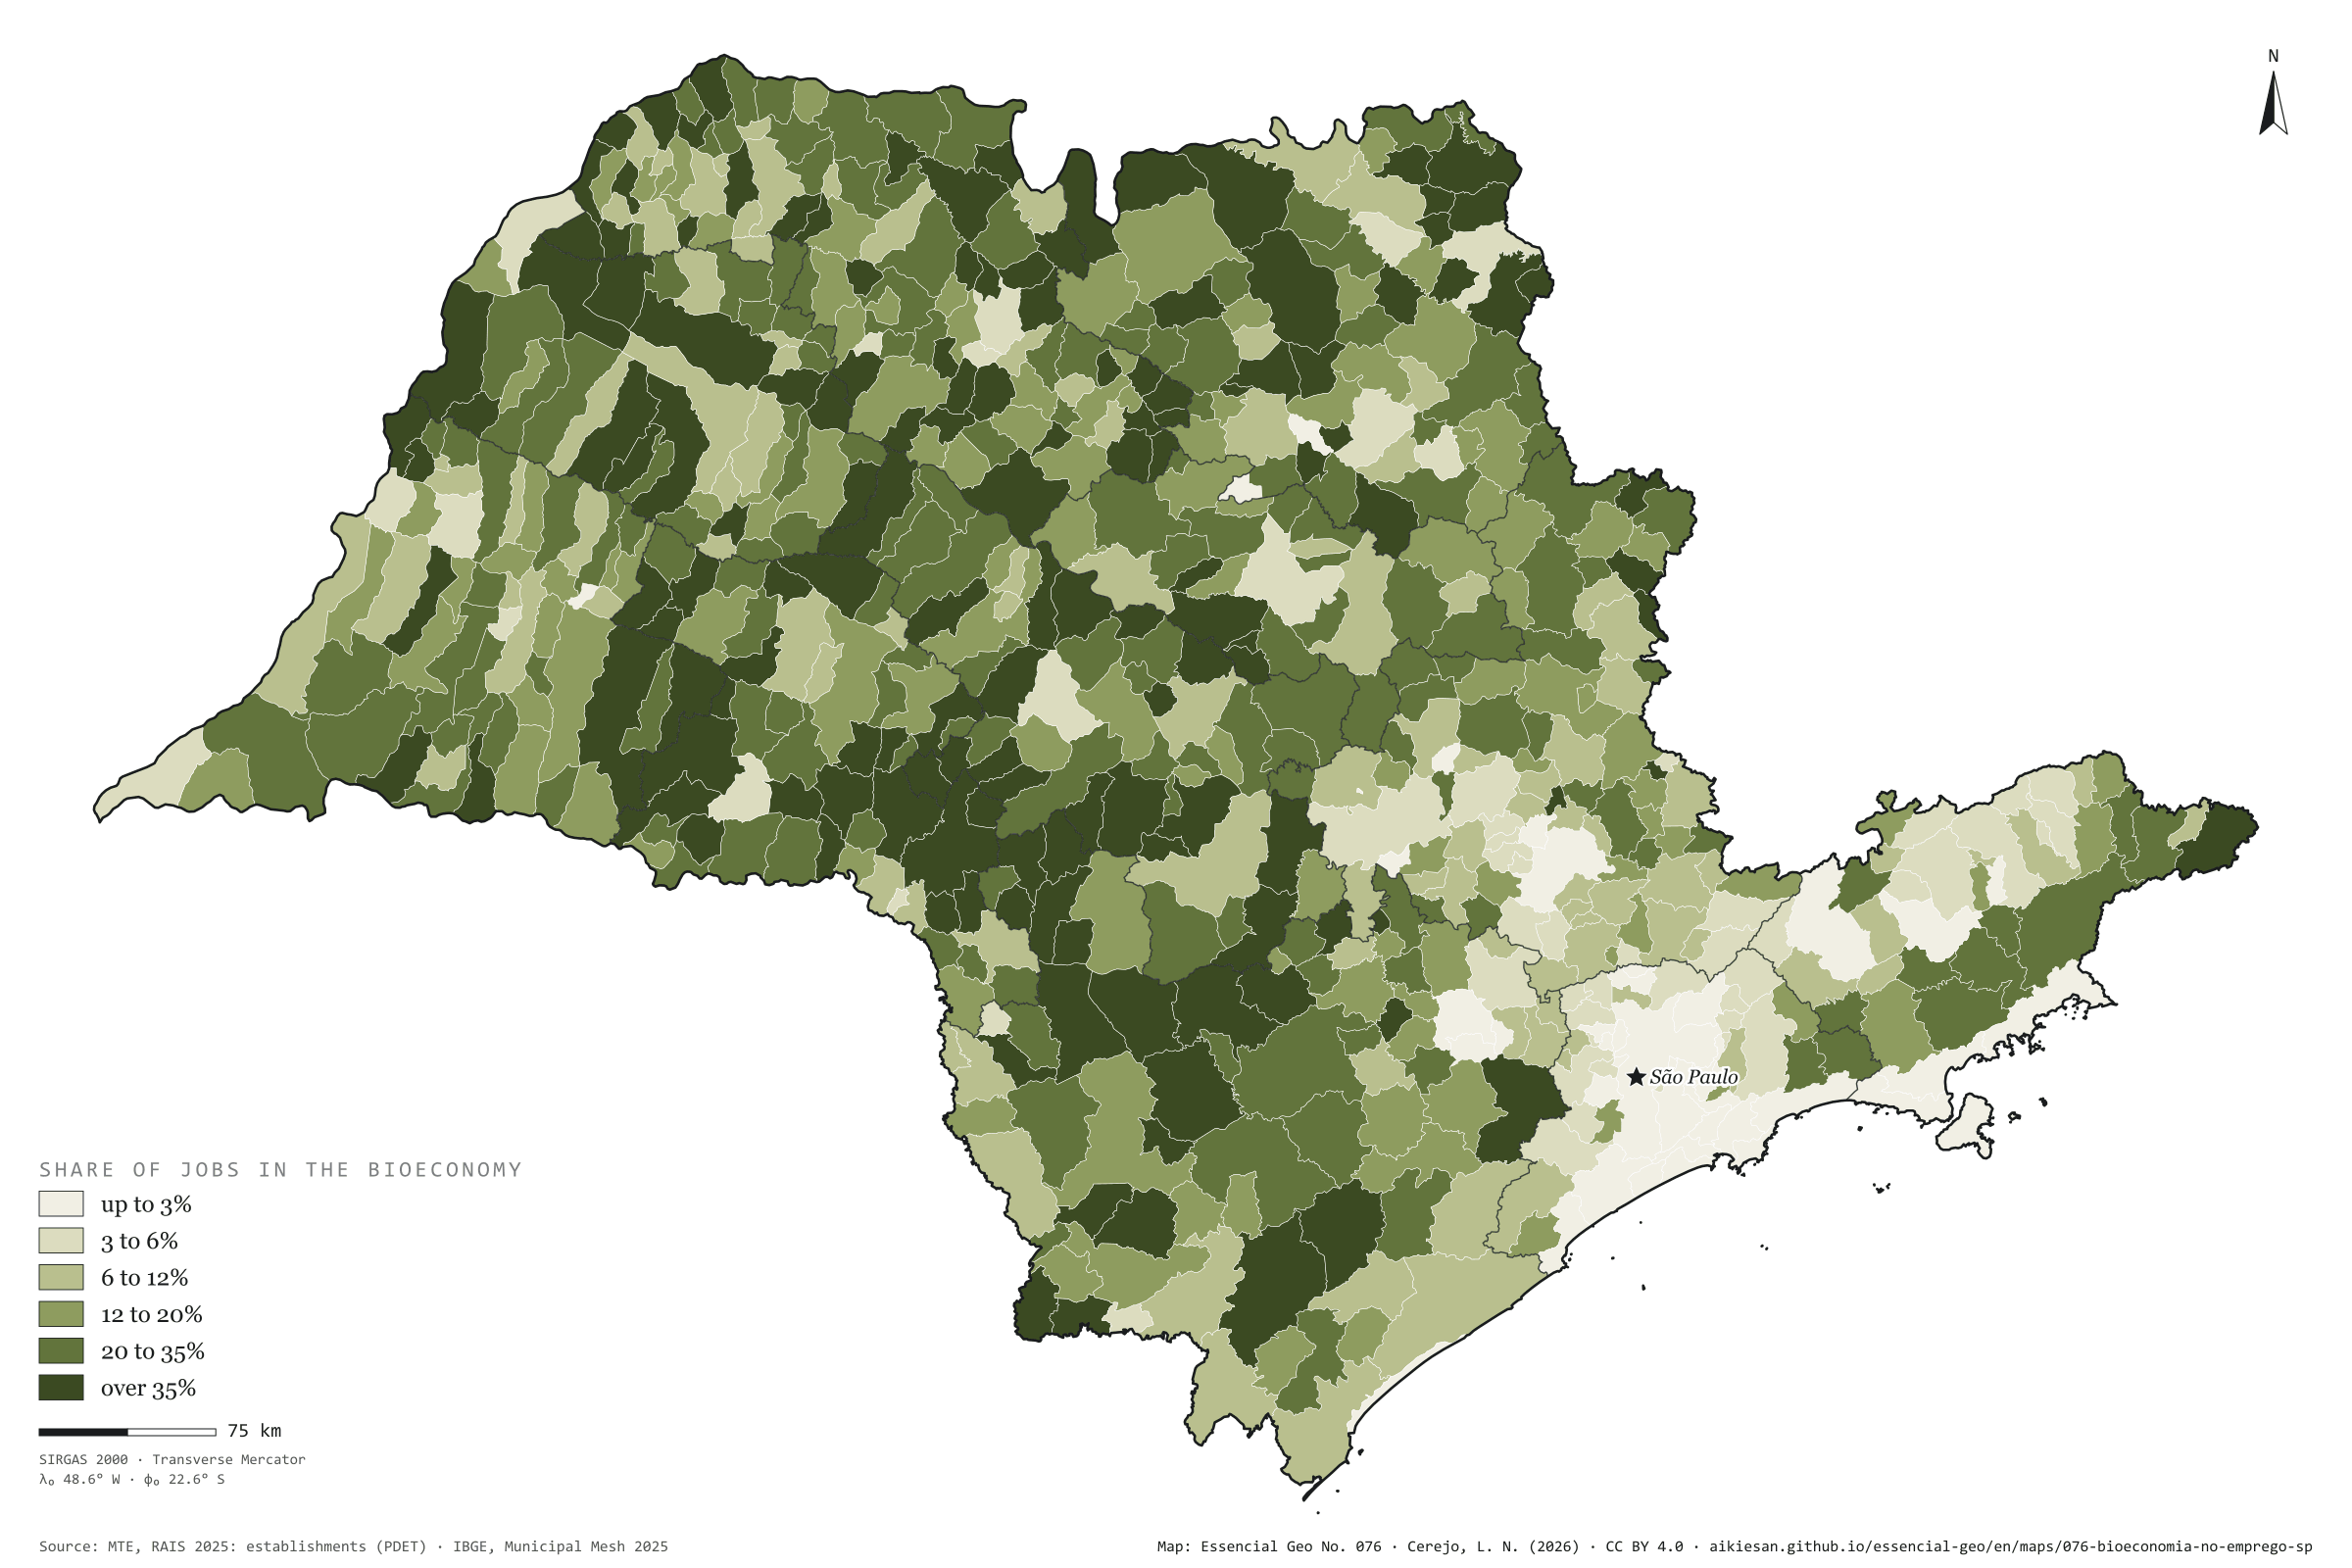
Fig. 076São Paulo State (SP)EPSG:4674Source: MTE/PDET, JRC (European Commission), IBGE
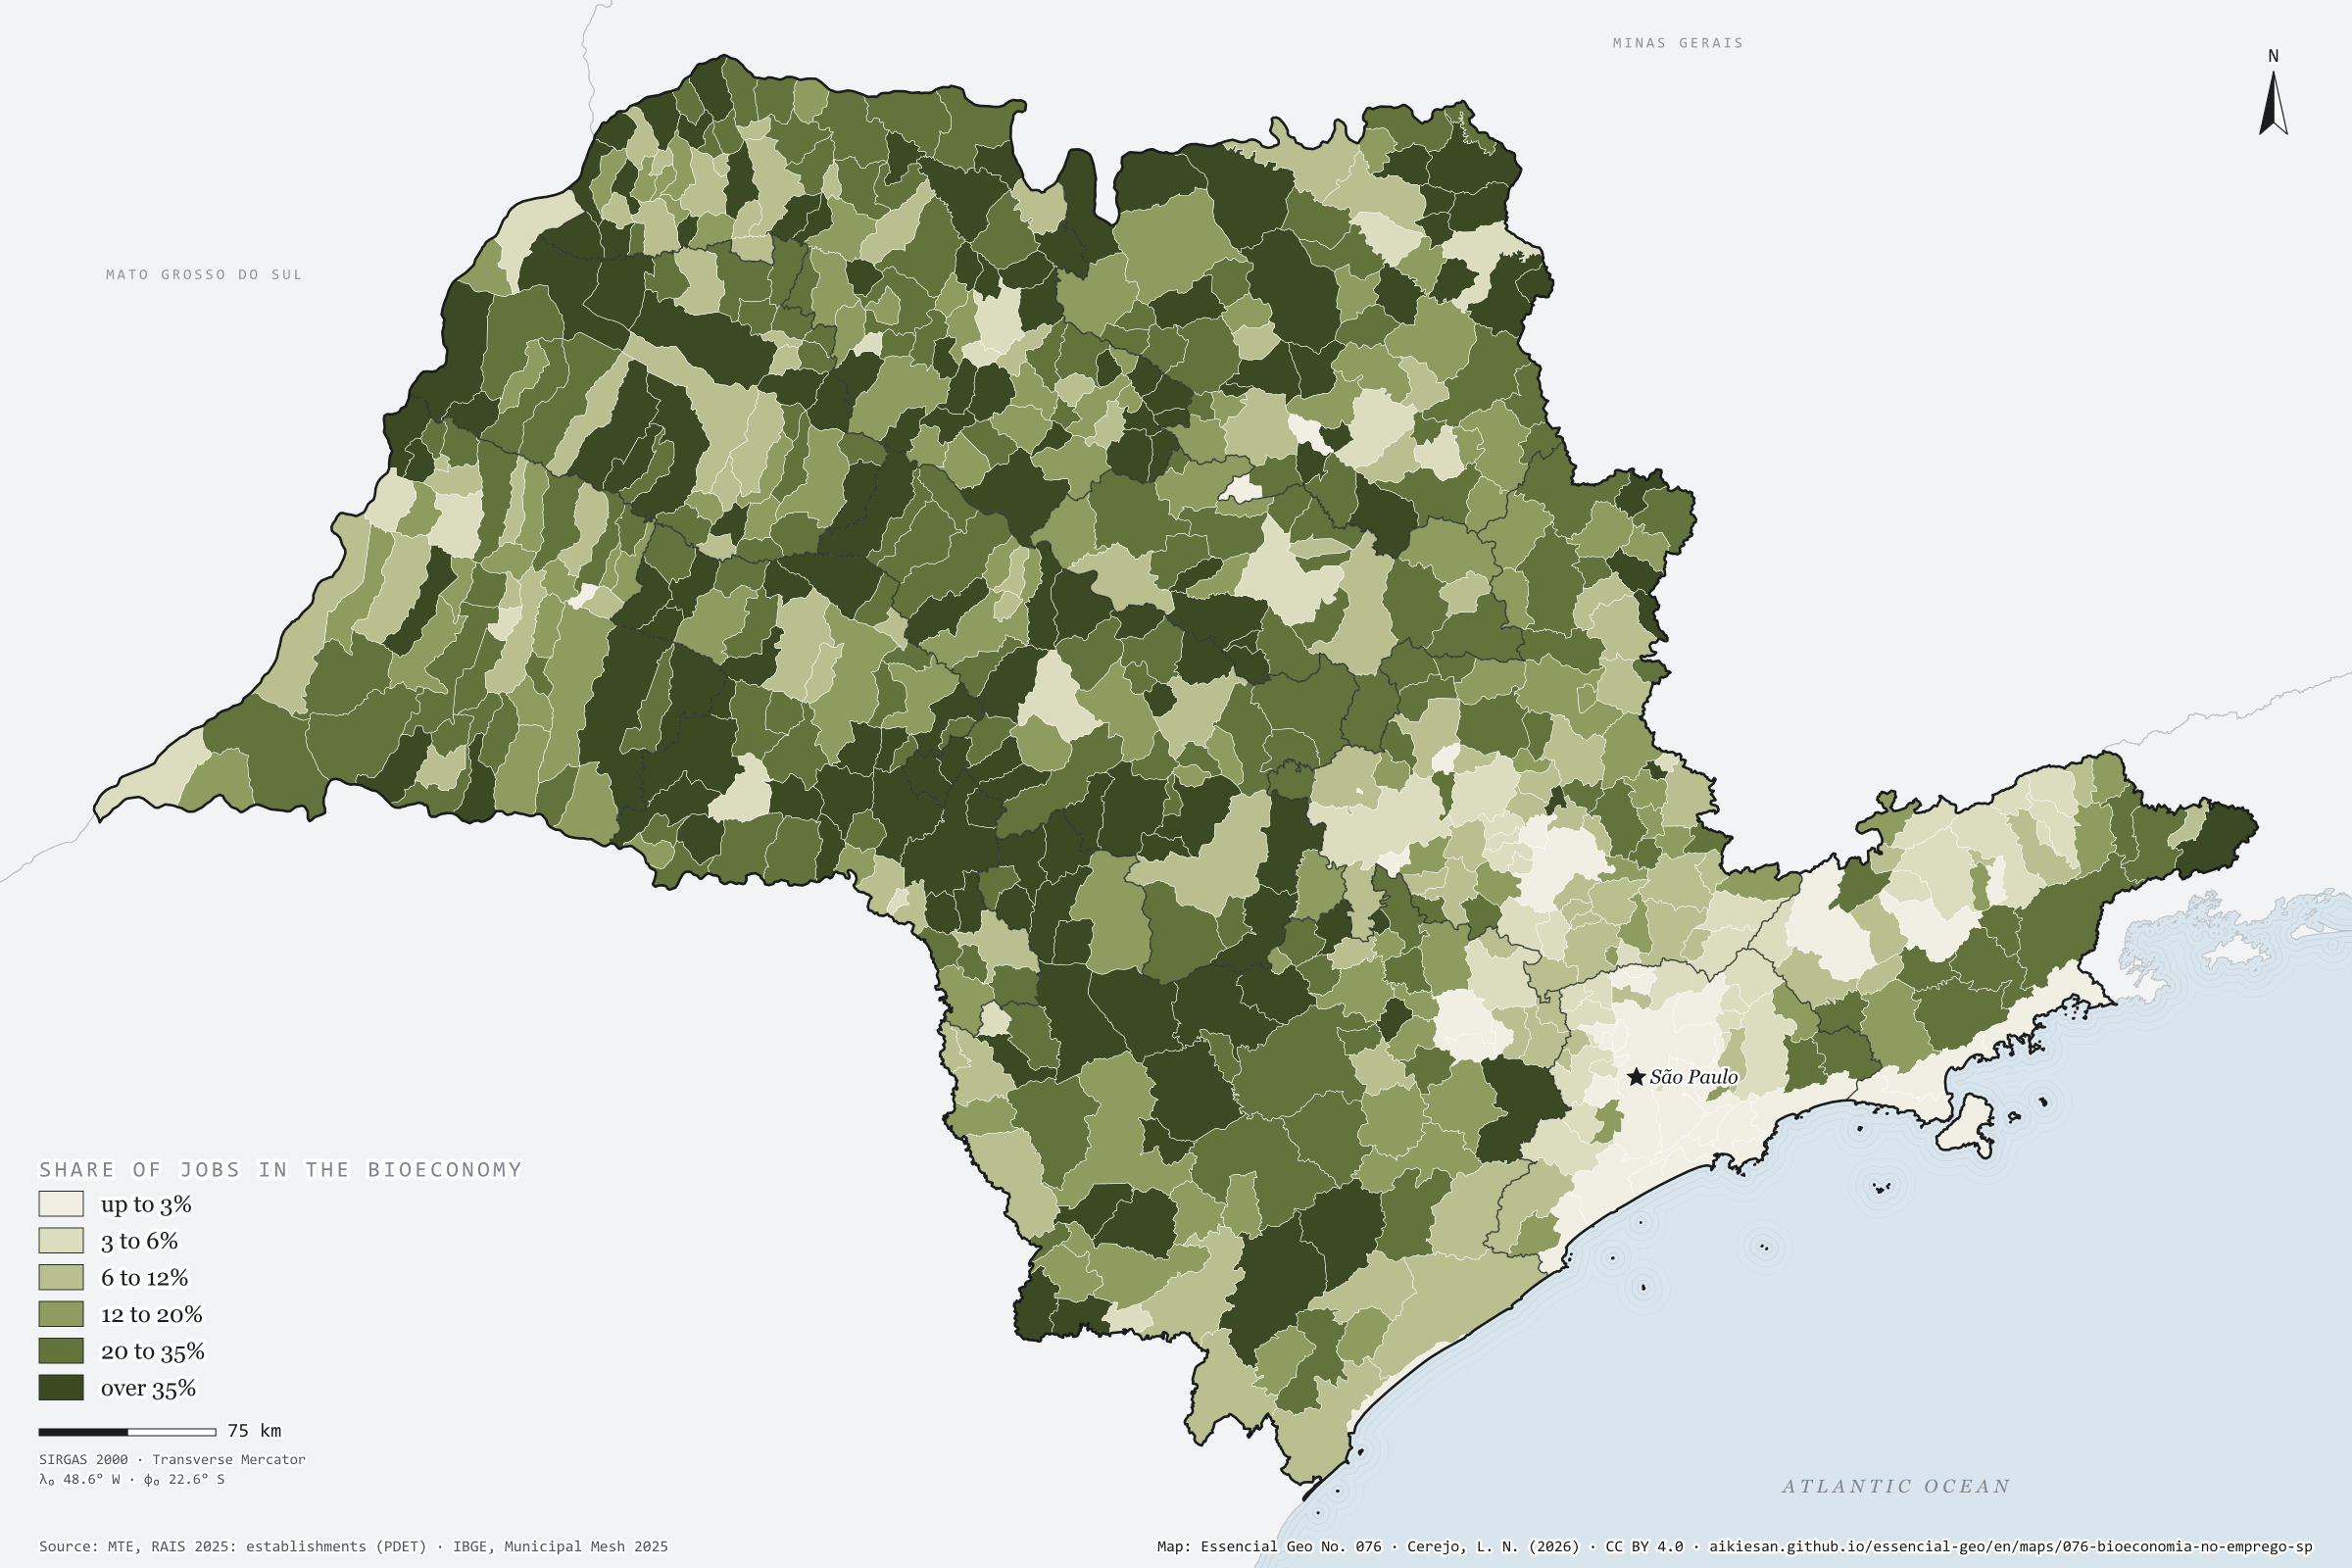
On 31 December 2025, 1.05 million formal jobs in São Paulo were in the bioeconomy: in farming, fishing and forestry, and in the industries that wholly convert biomass, such as food, drink, wood, paper, natural fibres, leather and biofuels. This is the scope the European Commission’s Joint Research Centre (JRC) uses to measure the European Union’s bioeconomy. They are 6.5% of the state’s 16.16 million jobs, below Brazil’s 7.9%, yet SP holds 22% of the country’s formal bioeconomy. The share grows westwards: 20.7% in the Marília region, 1.7% in the São Paulo region. In 146 municipalities over 35% of formal jobs come from biomass; in Planalto, 80%. The capital has the largest number, 66,000 jobs, but only 1.2% of its own. First plate of the collection “The bioeconomy at work”.
Technical record · downloads · citation
At a glance
Bioeconomy jobs by the bioeconomy’s share of the municipality’s jobs (jobs)
up to 3%12.6%
3 to 6%10.4%
6 to 12%15.8%
12 to 20%14.9%
20 to 35%20.5%
over 35%25.9%
Formal jobs in the bioeconomy
6.5%
1.05 million jobs; Brazil, 7.9%
SP’s share of Brazil’s formal bioeconomy
22%
of 4.74 million jobs
Layers
municipiospolygon645 municipalities: jobs, bioeconomy jobs by segment, share and location quotient, organic-waste-generating industries, waste and sewage, CP2B biomethane potential and population
regioes_intermediariaspolygon11 intermediate geographic regions
Active jobs on 31/12/2025 in the bioeconomy’s CNAE subclasses (farming, fishing and forestry; food, drink and tobacco; wood, paper and wooden furniture; natural fibres and leather; biofuels), within the European JRC scope, over all active jobs in each municipality, in six classes.
The map without a frame, with legend, scale, reference system and credit written on it: ready for papers, lectures and slides. In two versions: with the basemap (neighbours and sea) or only the mapped area, on white.
CEREJO, Lucas Nakamura. A bioeconomia no emprego: um em cada quinze empregos formais vem da biomassa. Versão 1.0.0. [S. l.]: Essencial, 2026. Conjunto de dados. Disponível em: https://aikiesan.github.io/essencial-geo/en/maps/076-bioeconomia-no-emprego-sp/. Acesso em: 10 nov. 2026.
Cerejo, L. N. (2026). A bioeconomia no emprego: um em cada quinze empregos formais vem da biomassa [The bioeconomy in jobs: One formal job in fifteen comes from biomass] (Version 1.0.0) [Data set]. Essencial. https://aikiesan.github.io/essencial-geo/en/maps/076-bioeconomia-no-emprego-sp/
@dataset{cerejo2026_bioeconomia_no_emprego_sp,
  author    = {Cerejo, Lucas Nakamura},
  title     = {A bioeconomia no emprego: Um em cada quinze empregos formais vem da biomassa},
  year      = {2026},
  publisher = {Essencial},
  version   = {1.0.0},
  url       = {https://aikiesan.github.io/essencial-geo/en/maps/076-bioeconomia-no-emprego-sp/},
  language  = {portuguese},
  note      = {English title: The bioeconomy in jobs: One formal job in fifteen comes from biomass. Licence CC BY 4.0}
}
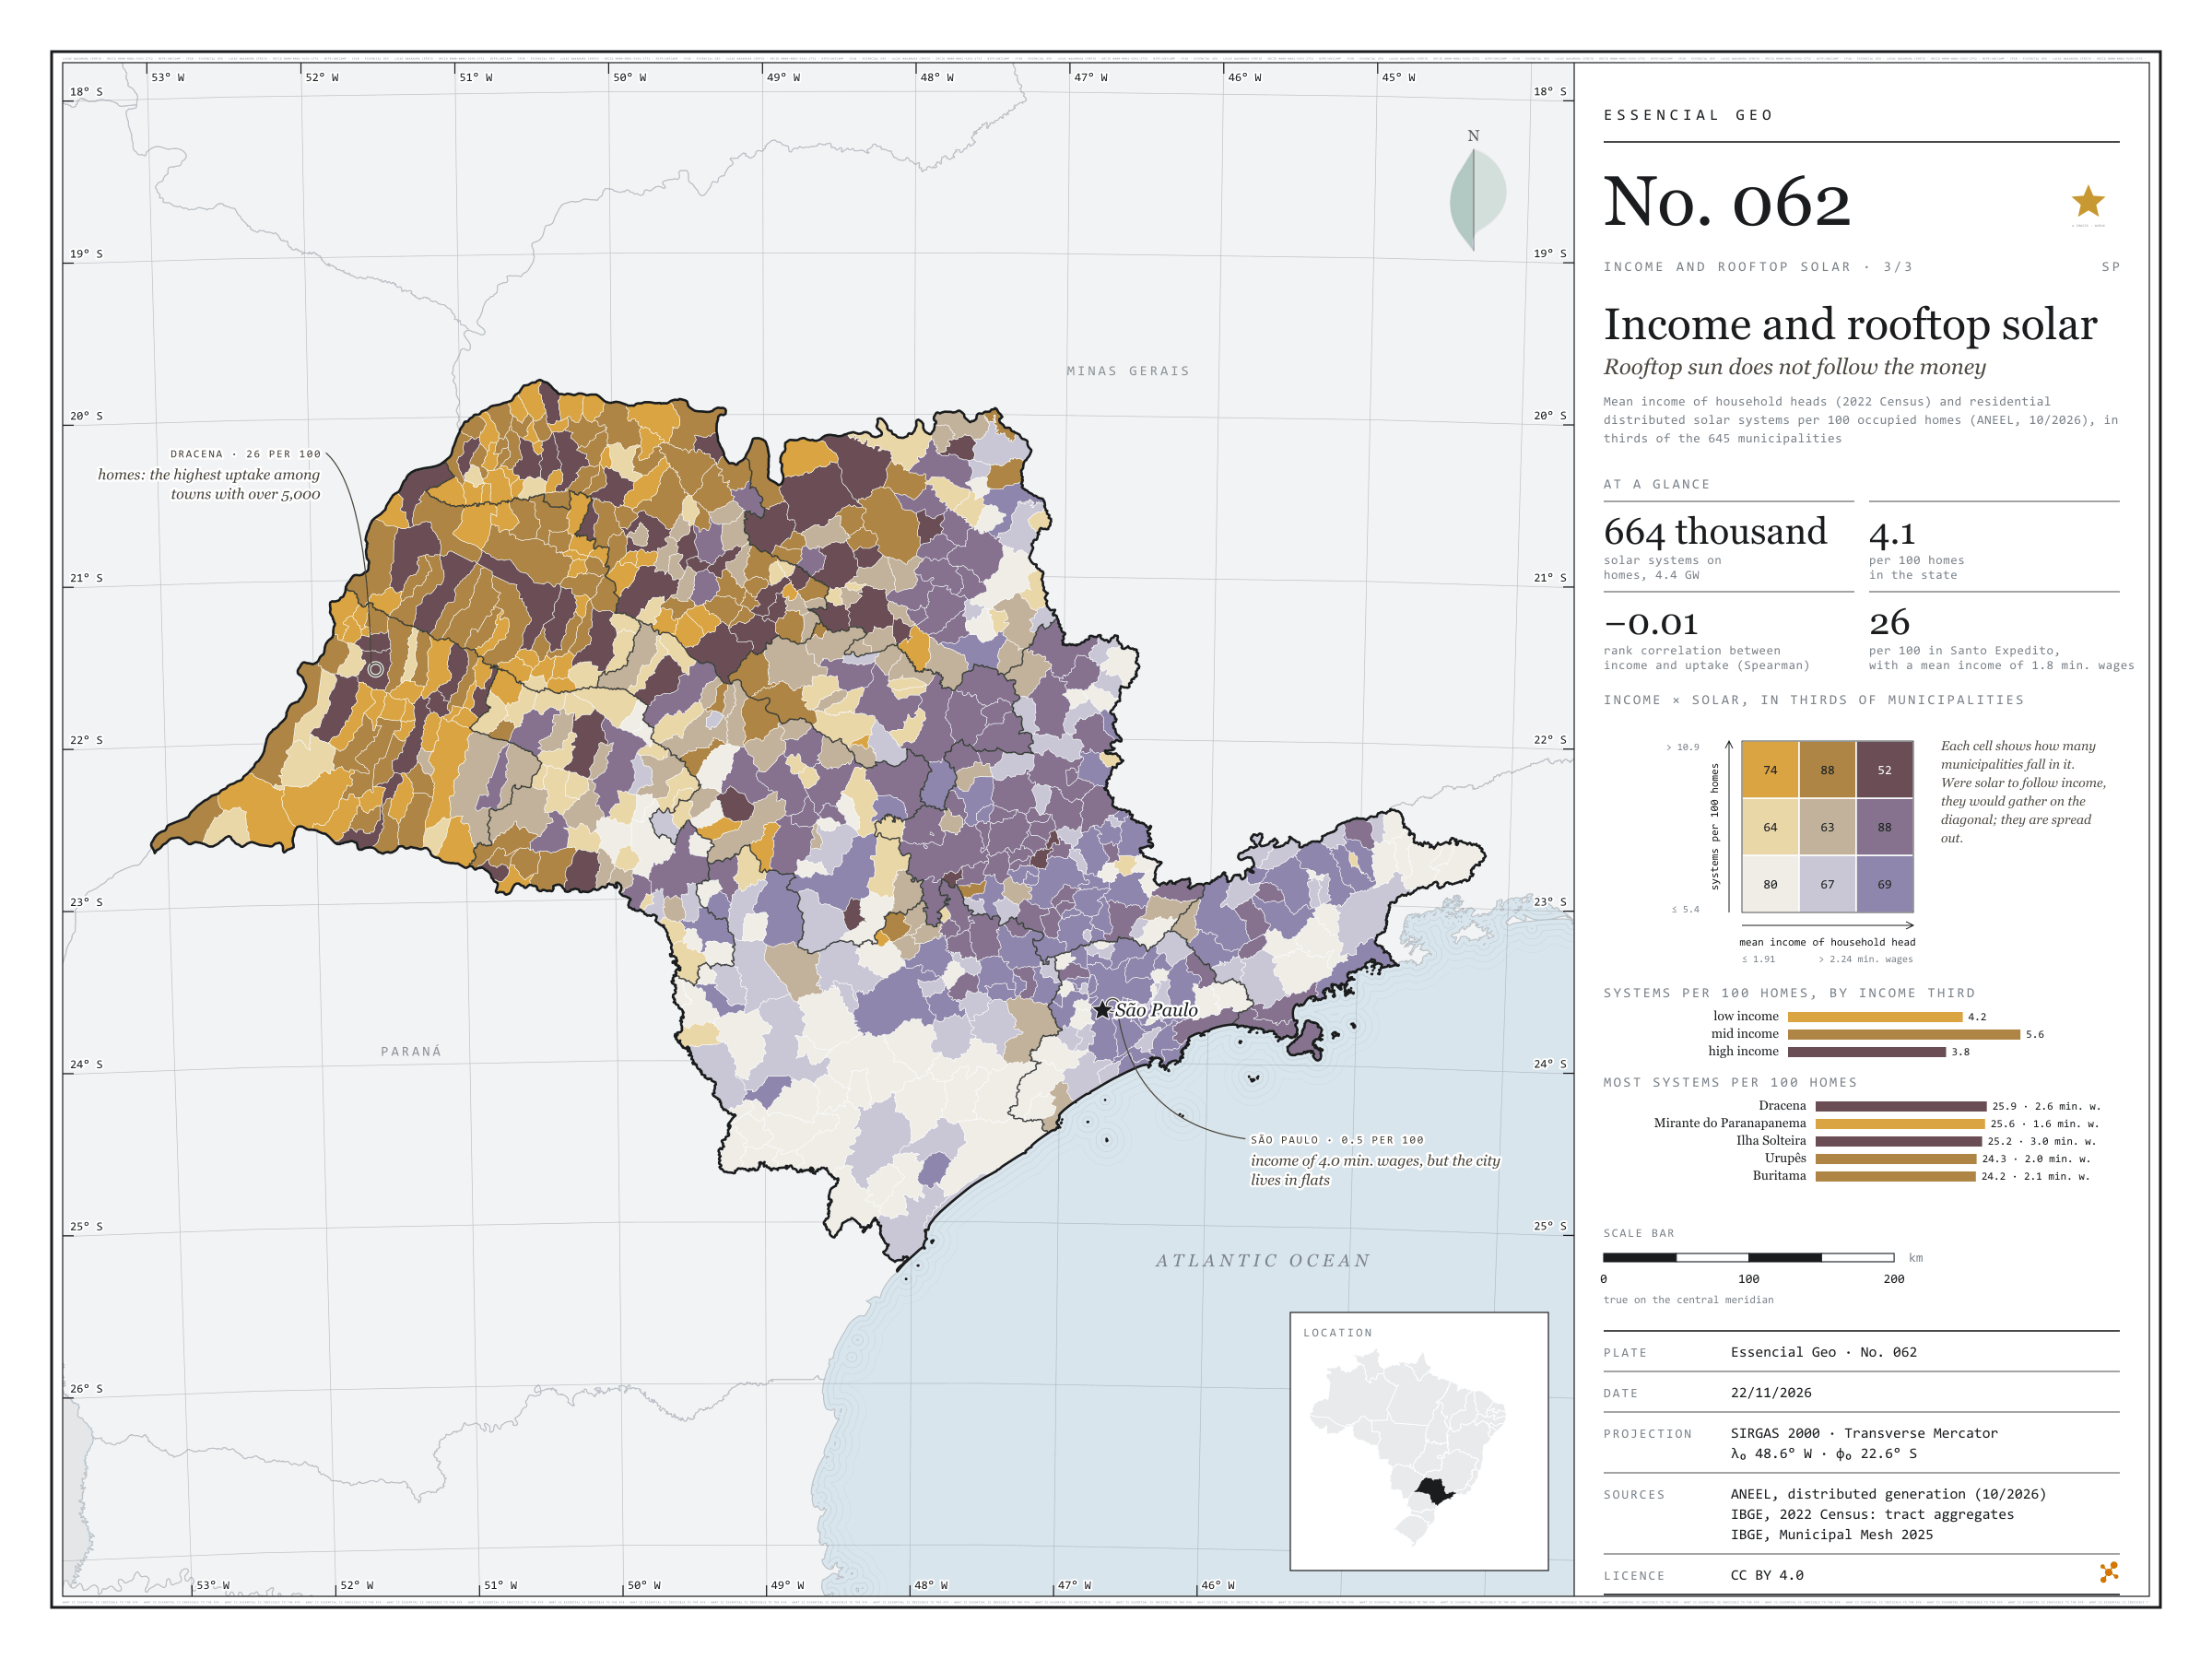
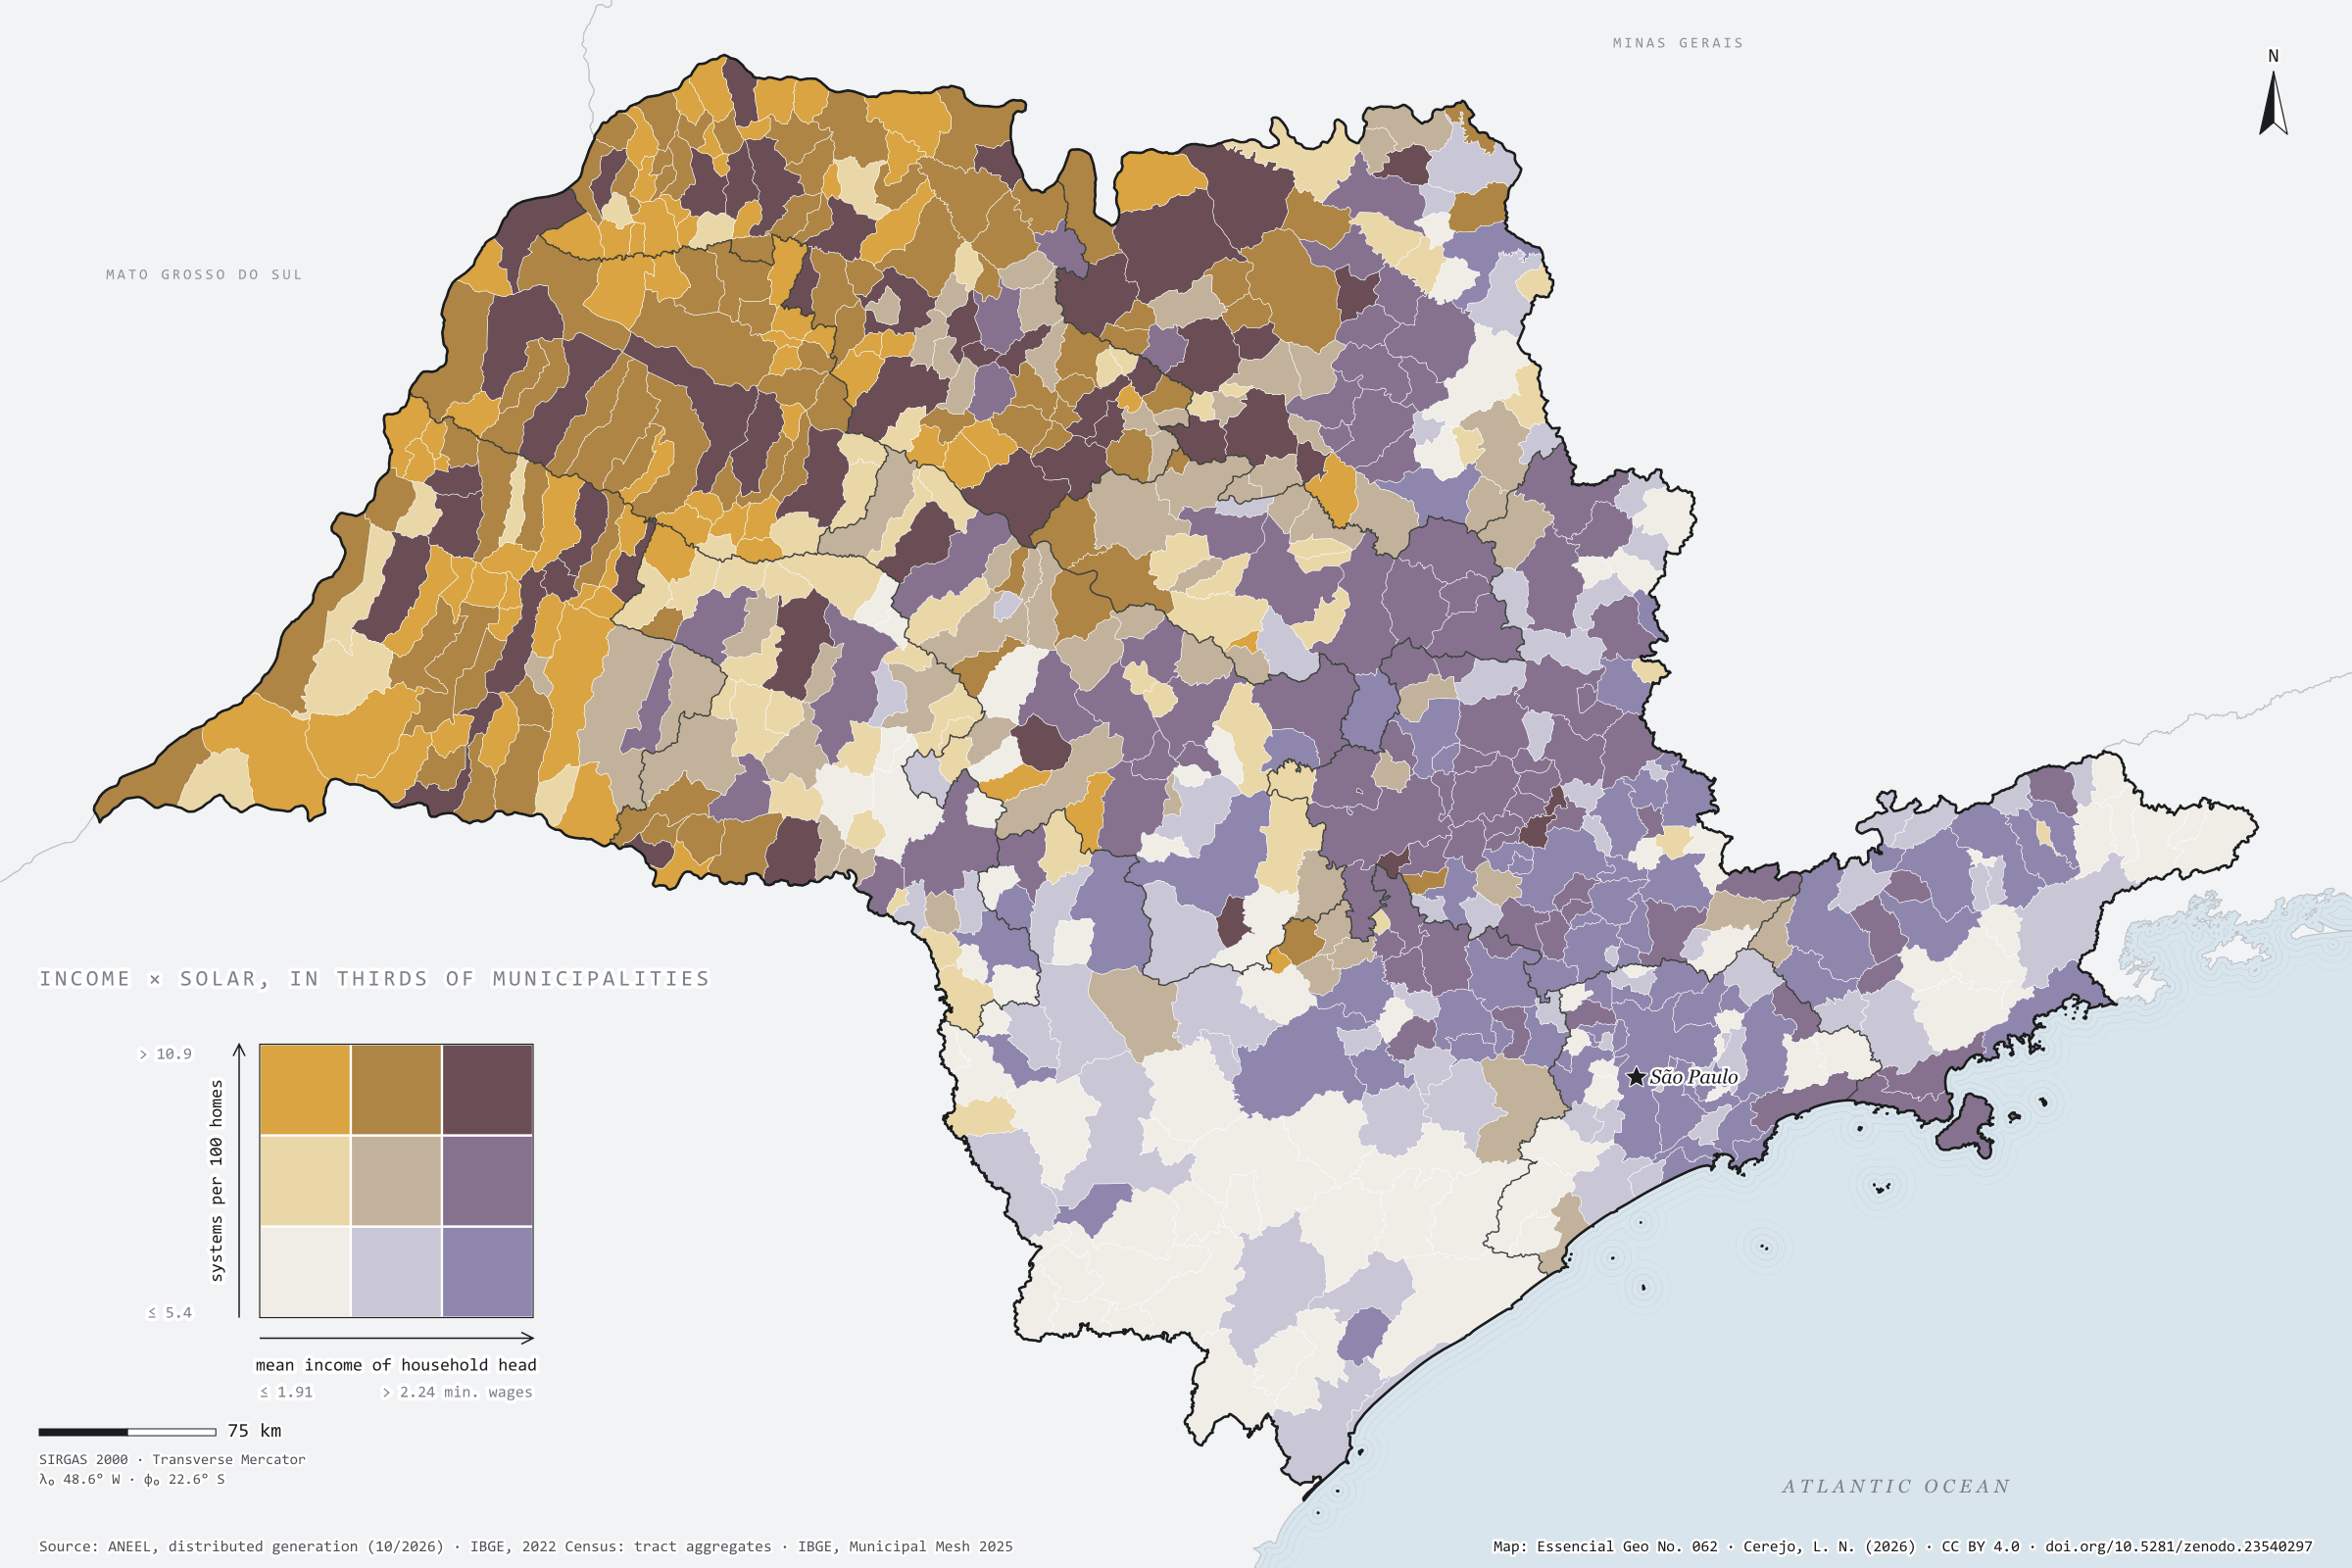
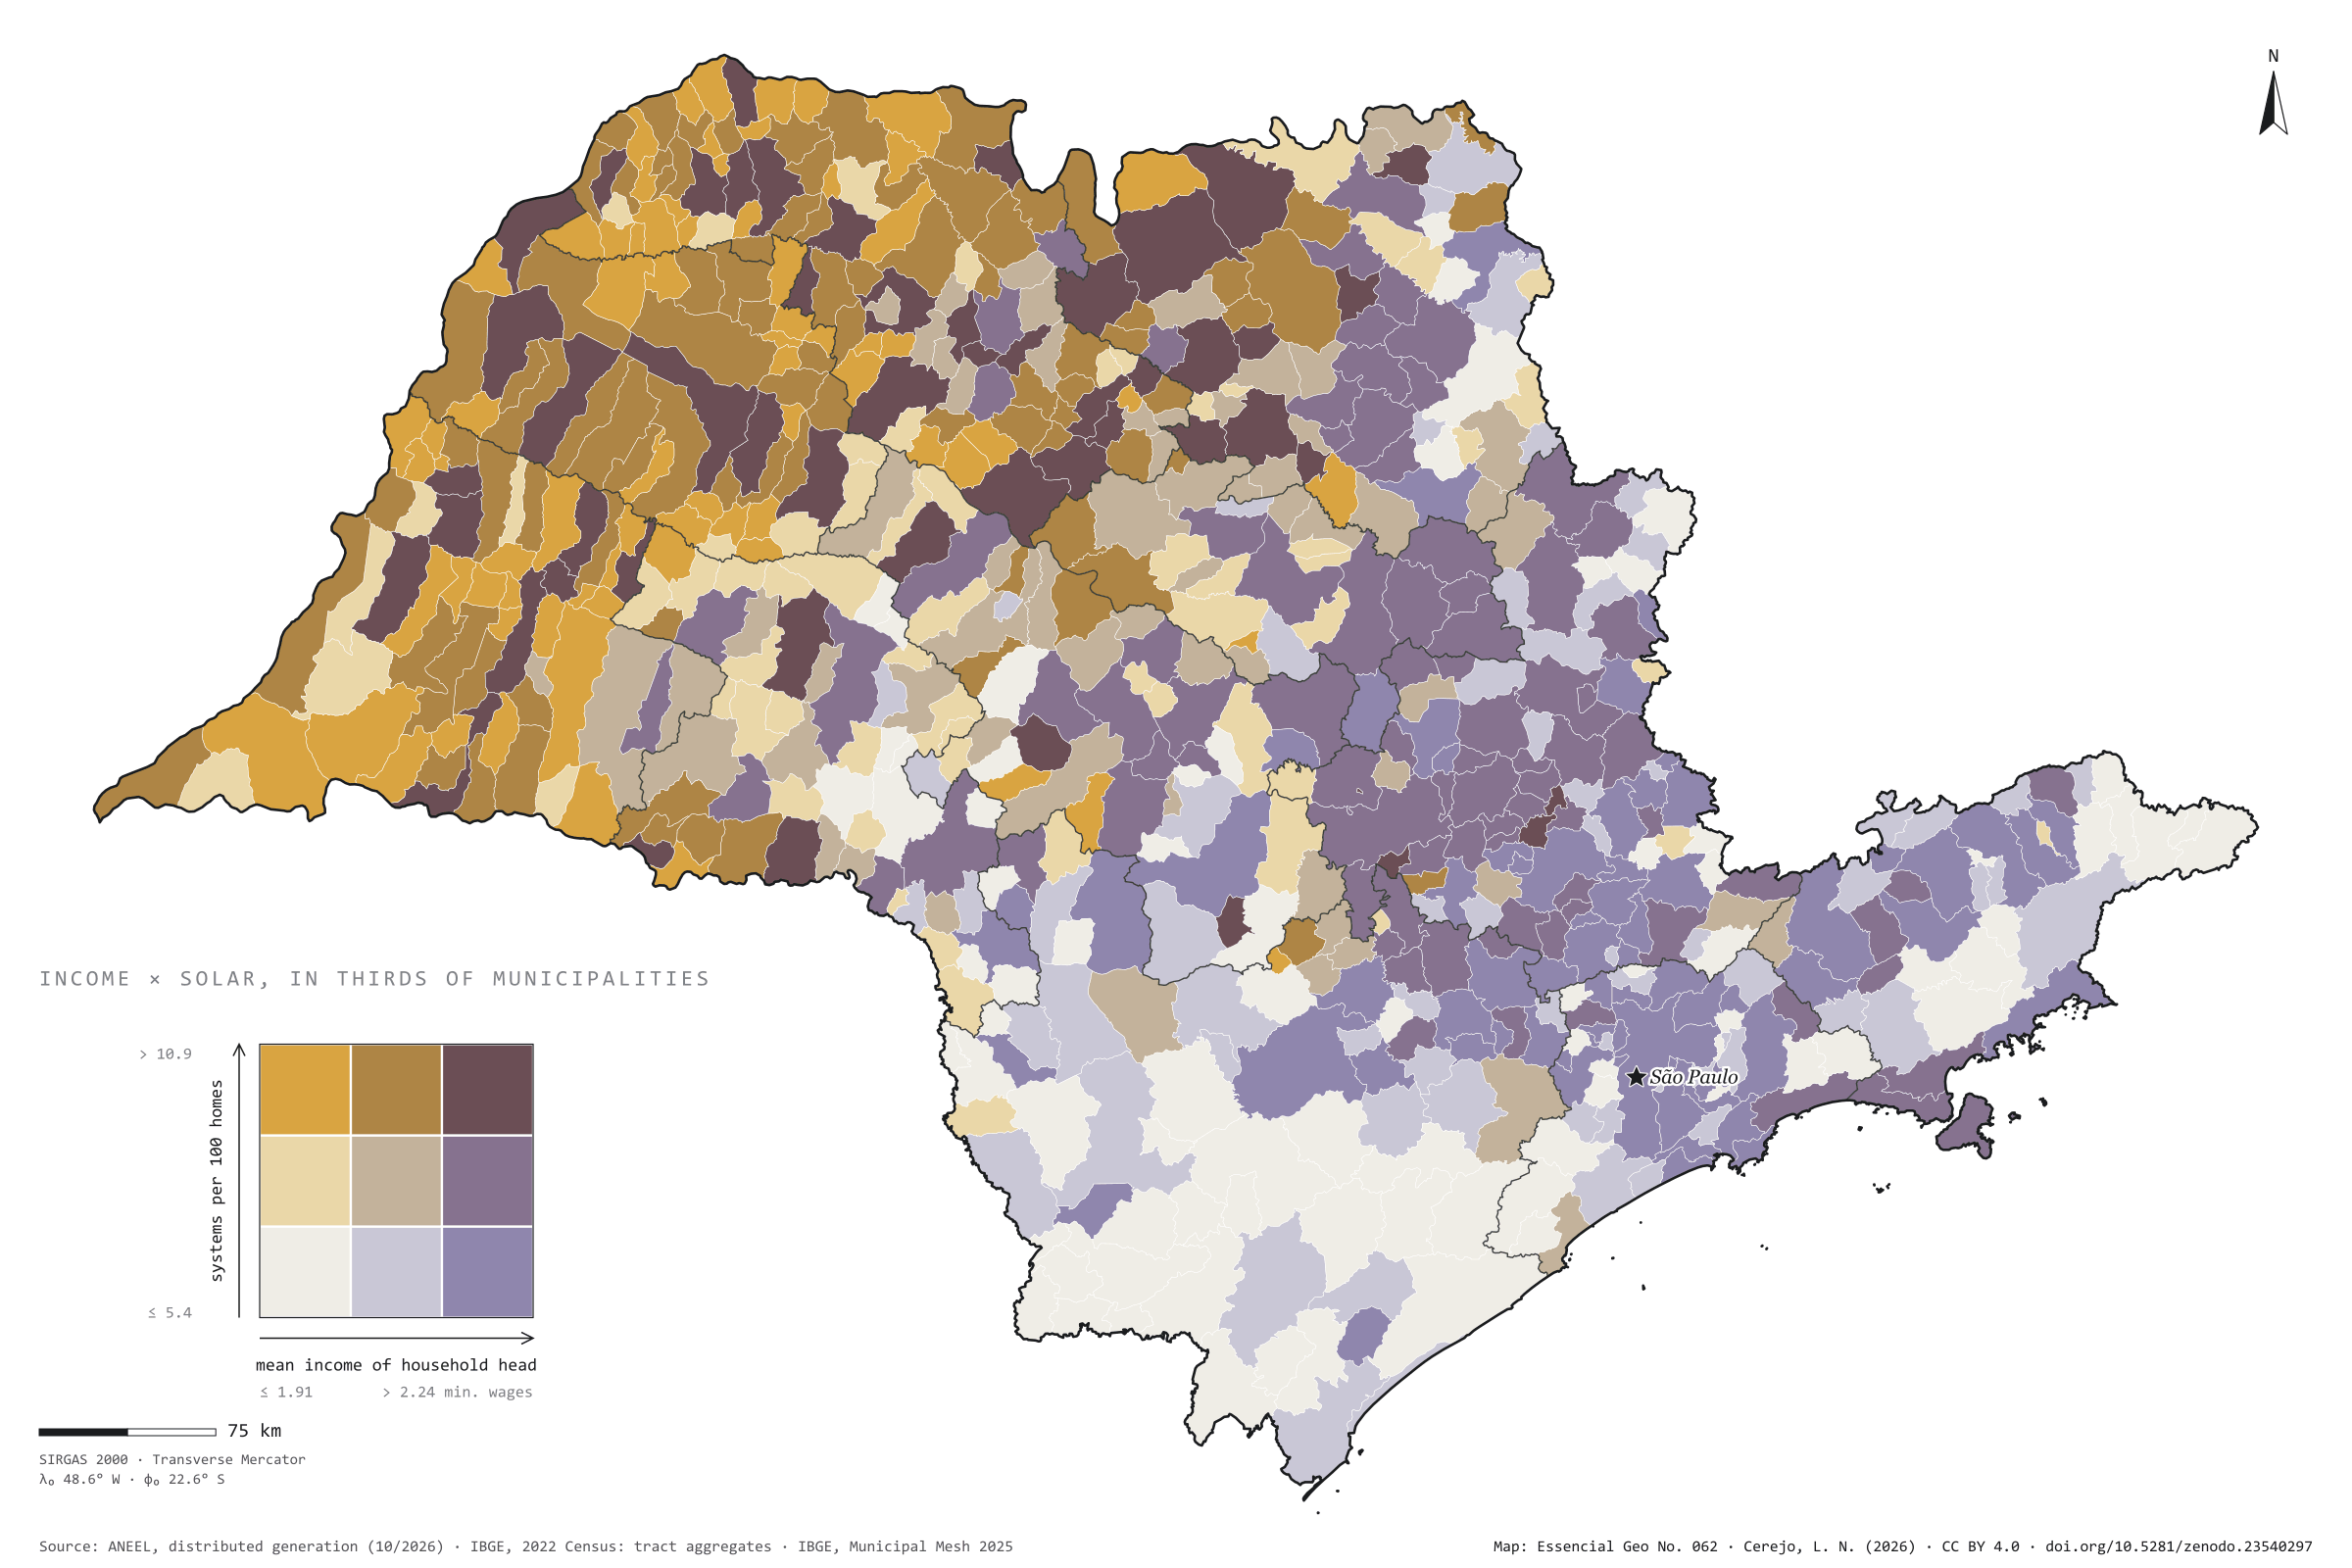
Fig. 062São Paulo State (SP)EPSG:4674Source: ANEEL, IBGE
São Paulo has 664,000 residential solar systems registered with ANEEL, with 4.4 GW: 4.1 for every 100 occupied homes. One would expect them in the richest towns. They are not there. Across the 645 municipalities, the rank correlation between household heads’ mean income and systems per home is −0.01, that is, none. In the highest income third there are 3.8 systems per 100 homes; in the lowest, 4.2. The map lights up in ochre and brown in the west and north-west, where Dracena reaches 26 per 100, and so does Santo Expedito, with a mean income of 1.8 minimum wages. The capital, with a mean income of 4 minimum wages and more systems than any other city (22,000), has only 0.5 per 100 homes, like Santos: where people live in flats, there is no roof. Plate 044 shows distributed solar generation across Brazil. Last plate of the collection “Income and rooftop solar”.
Technical record · downloads · citation
At a glance
Residential solar systems by municipal income third (systems)
low income6.9%
mid income17.4%
high income75.7%
Residential solar systems per 100 homes
4.1systems
664,205 systems and 16.2 million homes
Rank correlation between income and uptake
-0Spearman’s ρ
Layers
municipiospolygon645 municipalities: households, mean income, residential solar systems, kW, systems per 100 homes, W per home, thirds and group
regioes_intermediariaspolygon11 intermediate geographic regions
ANEEL residential distributed photovoltaic systems per 100 occupied permanent private homes of the 2022 Census, and mean income of household heads with income, each in thirds of the 645 municipalities, crossed in a nine-class bivariate map; Spearman rank correlation.
The map without a frame, with legend, scale, reference system and credit written on it: ready for papers, lectures and slides. In two versions: with the basemap (neighbours and sea) or only the mapped area, on white.
CEREJO, Lucas Nakamura. Renda e telhado solar: o sol dos telhados não segue o dinheiro. Versão 1.0.0. [S. l.]: Zenodo, 2026. Conjunto de dados. DOI: 10.5281/zenodo.23540297. Disponível em: https://doi.org/10.5281/zenodo.23540297. Acesso em: 10 nov. 2026.
Cerejo, L. N. (2026). Renda e telhado solar: o sol dos telhados não segue o dinheiro [Income and rooftop solar: Rooftop sun does not follow the money] (Version 1.0.0) [Data set]. Zenodo. https://doi.org/10.5281/zenodo.23540297
@dataset{cerejo2026_renda_e_solar_sp,
  author    = {Cerejo, Lucas Nakamura},
  title     = {Renda e telhado solar: O sol dos telhados não segue o dinheiro},
  year      = {2026},
  publisher = {Zenodo},
  version   = {1.0.0},
  doi       = {10.5281/zenodo.23540297},
  url       = {https://doi.org/10.5281/zenodo.23540297},
  language  = {portuguese},
  note      = {English title: Income and rooftop solar: Rooftop sun does not follow the money. Licence CC BY 4.0}
}
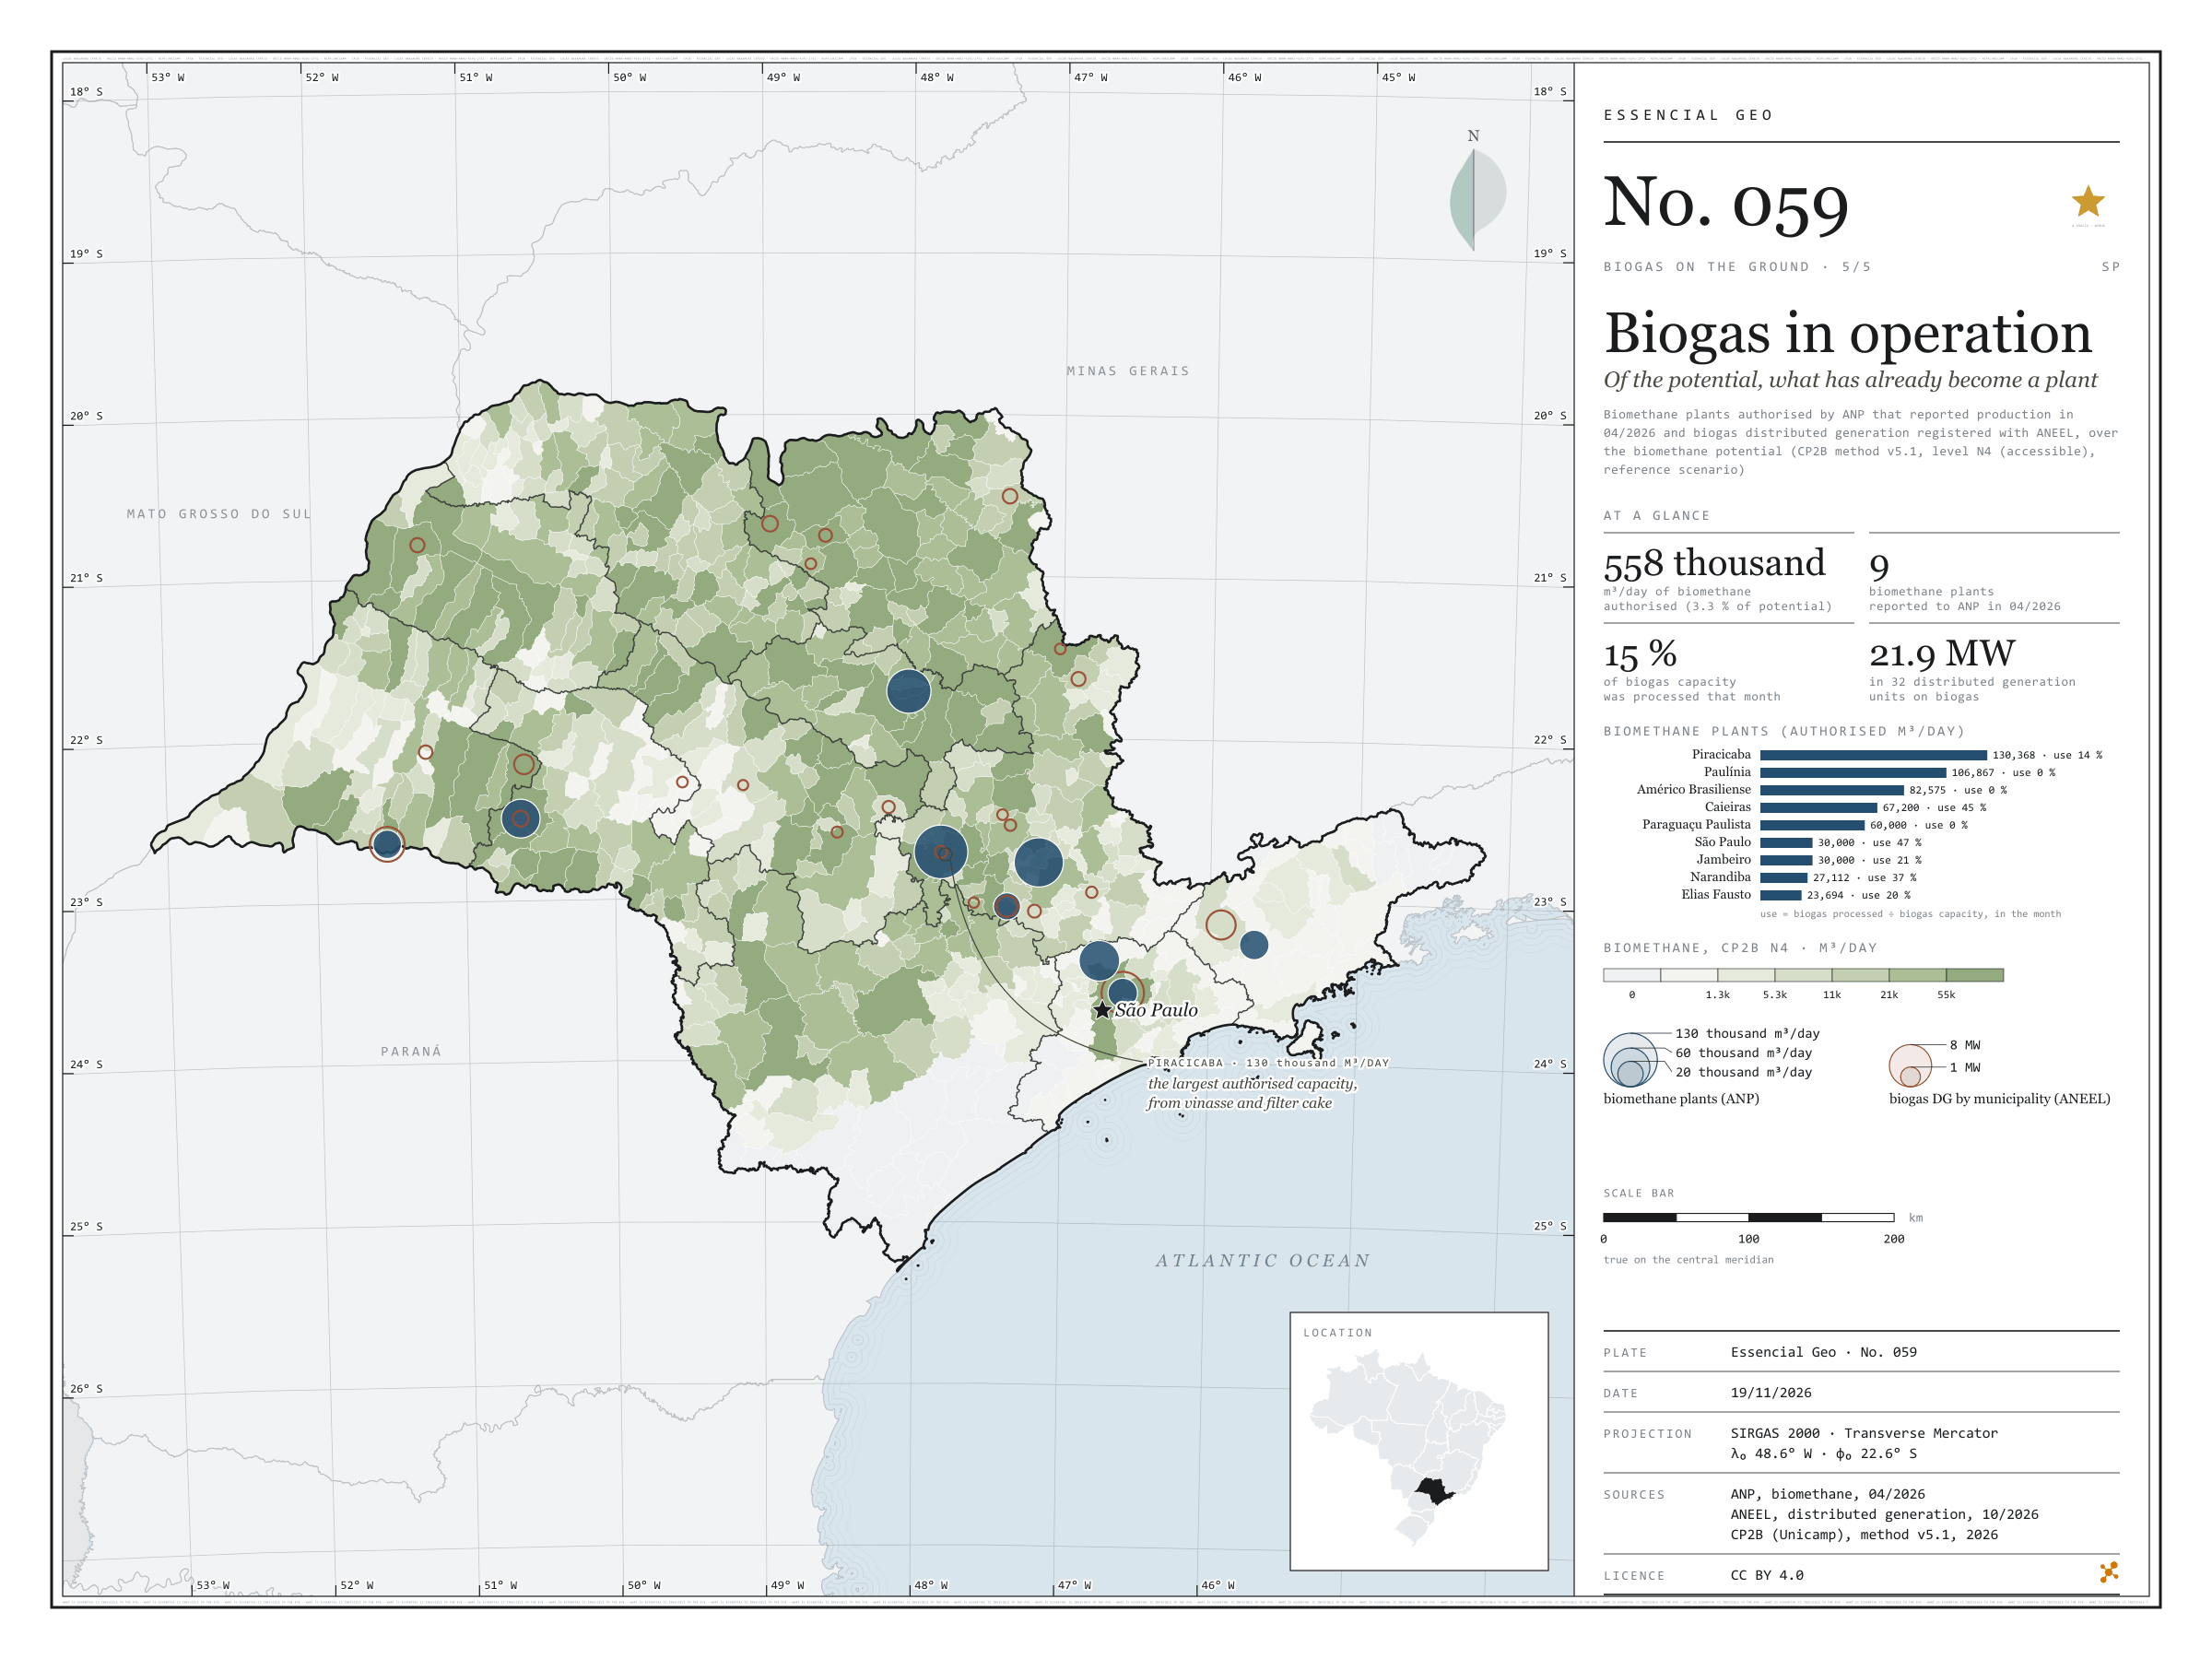
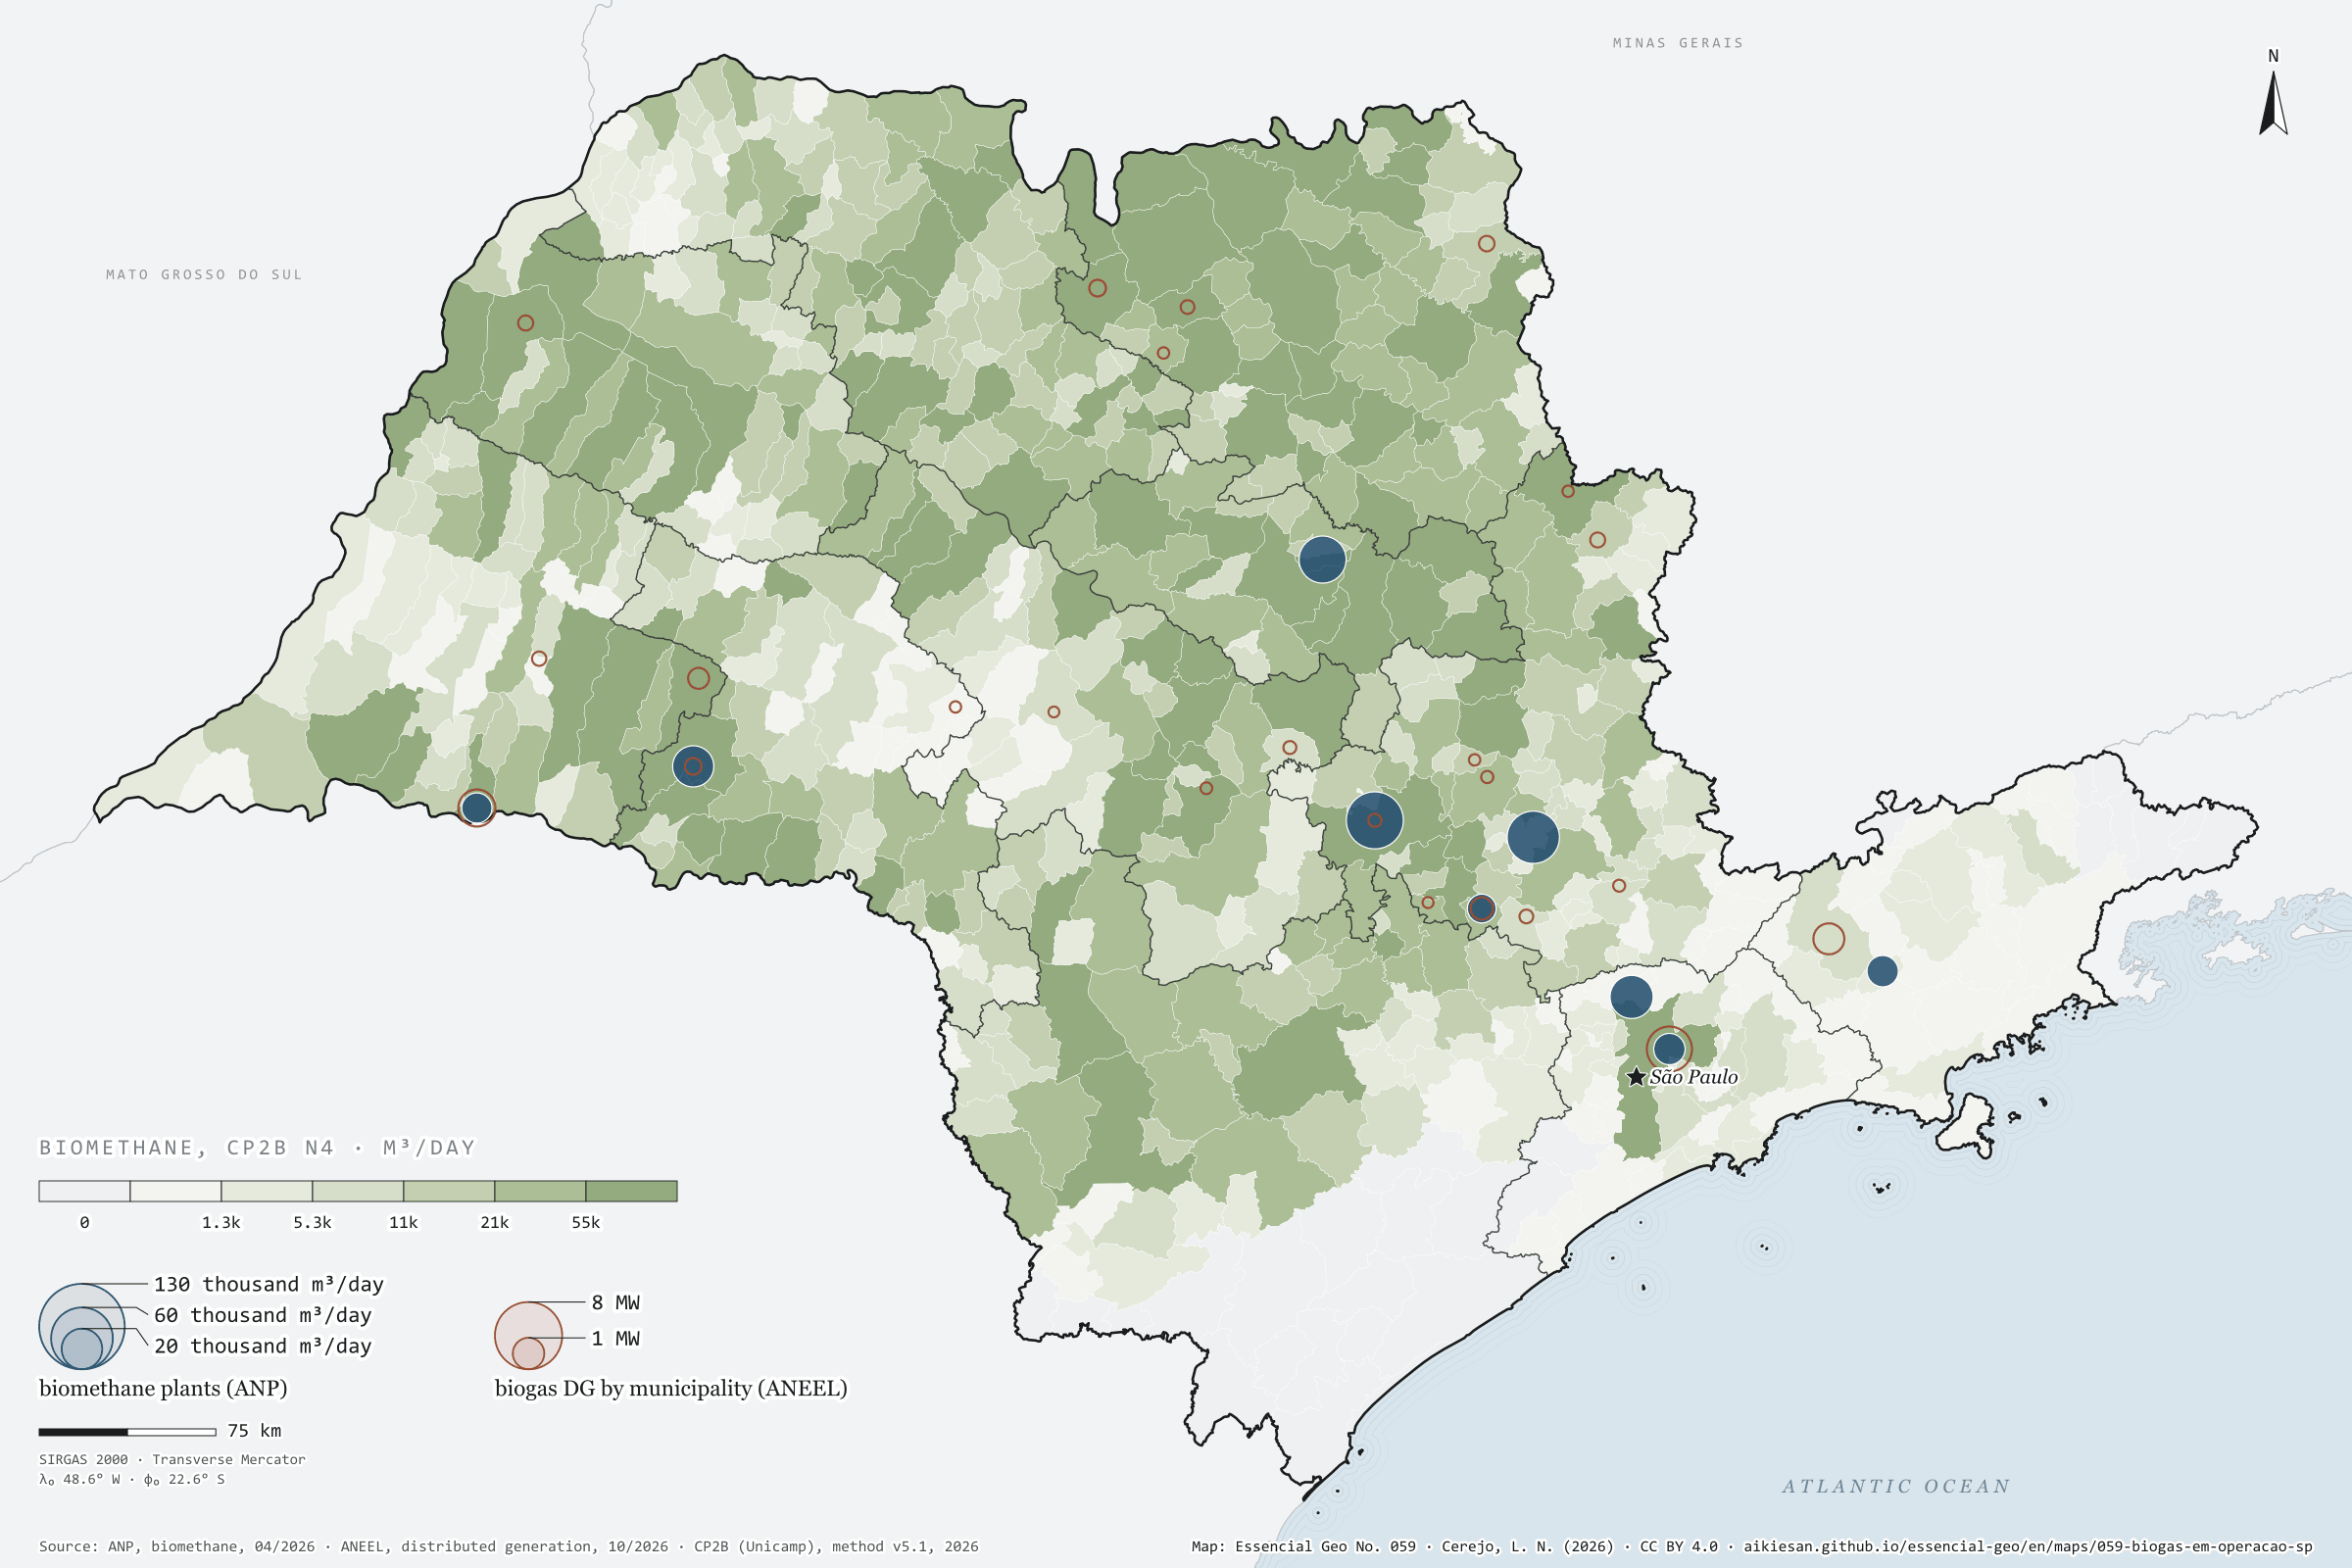
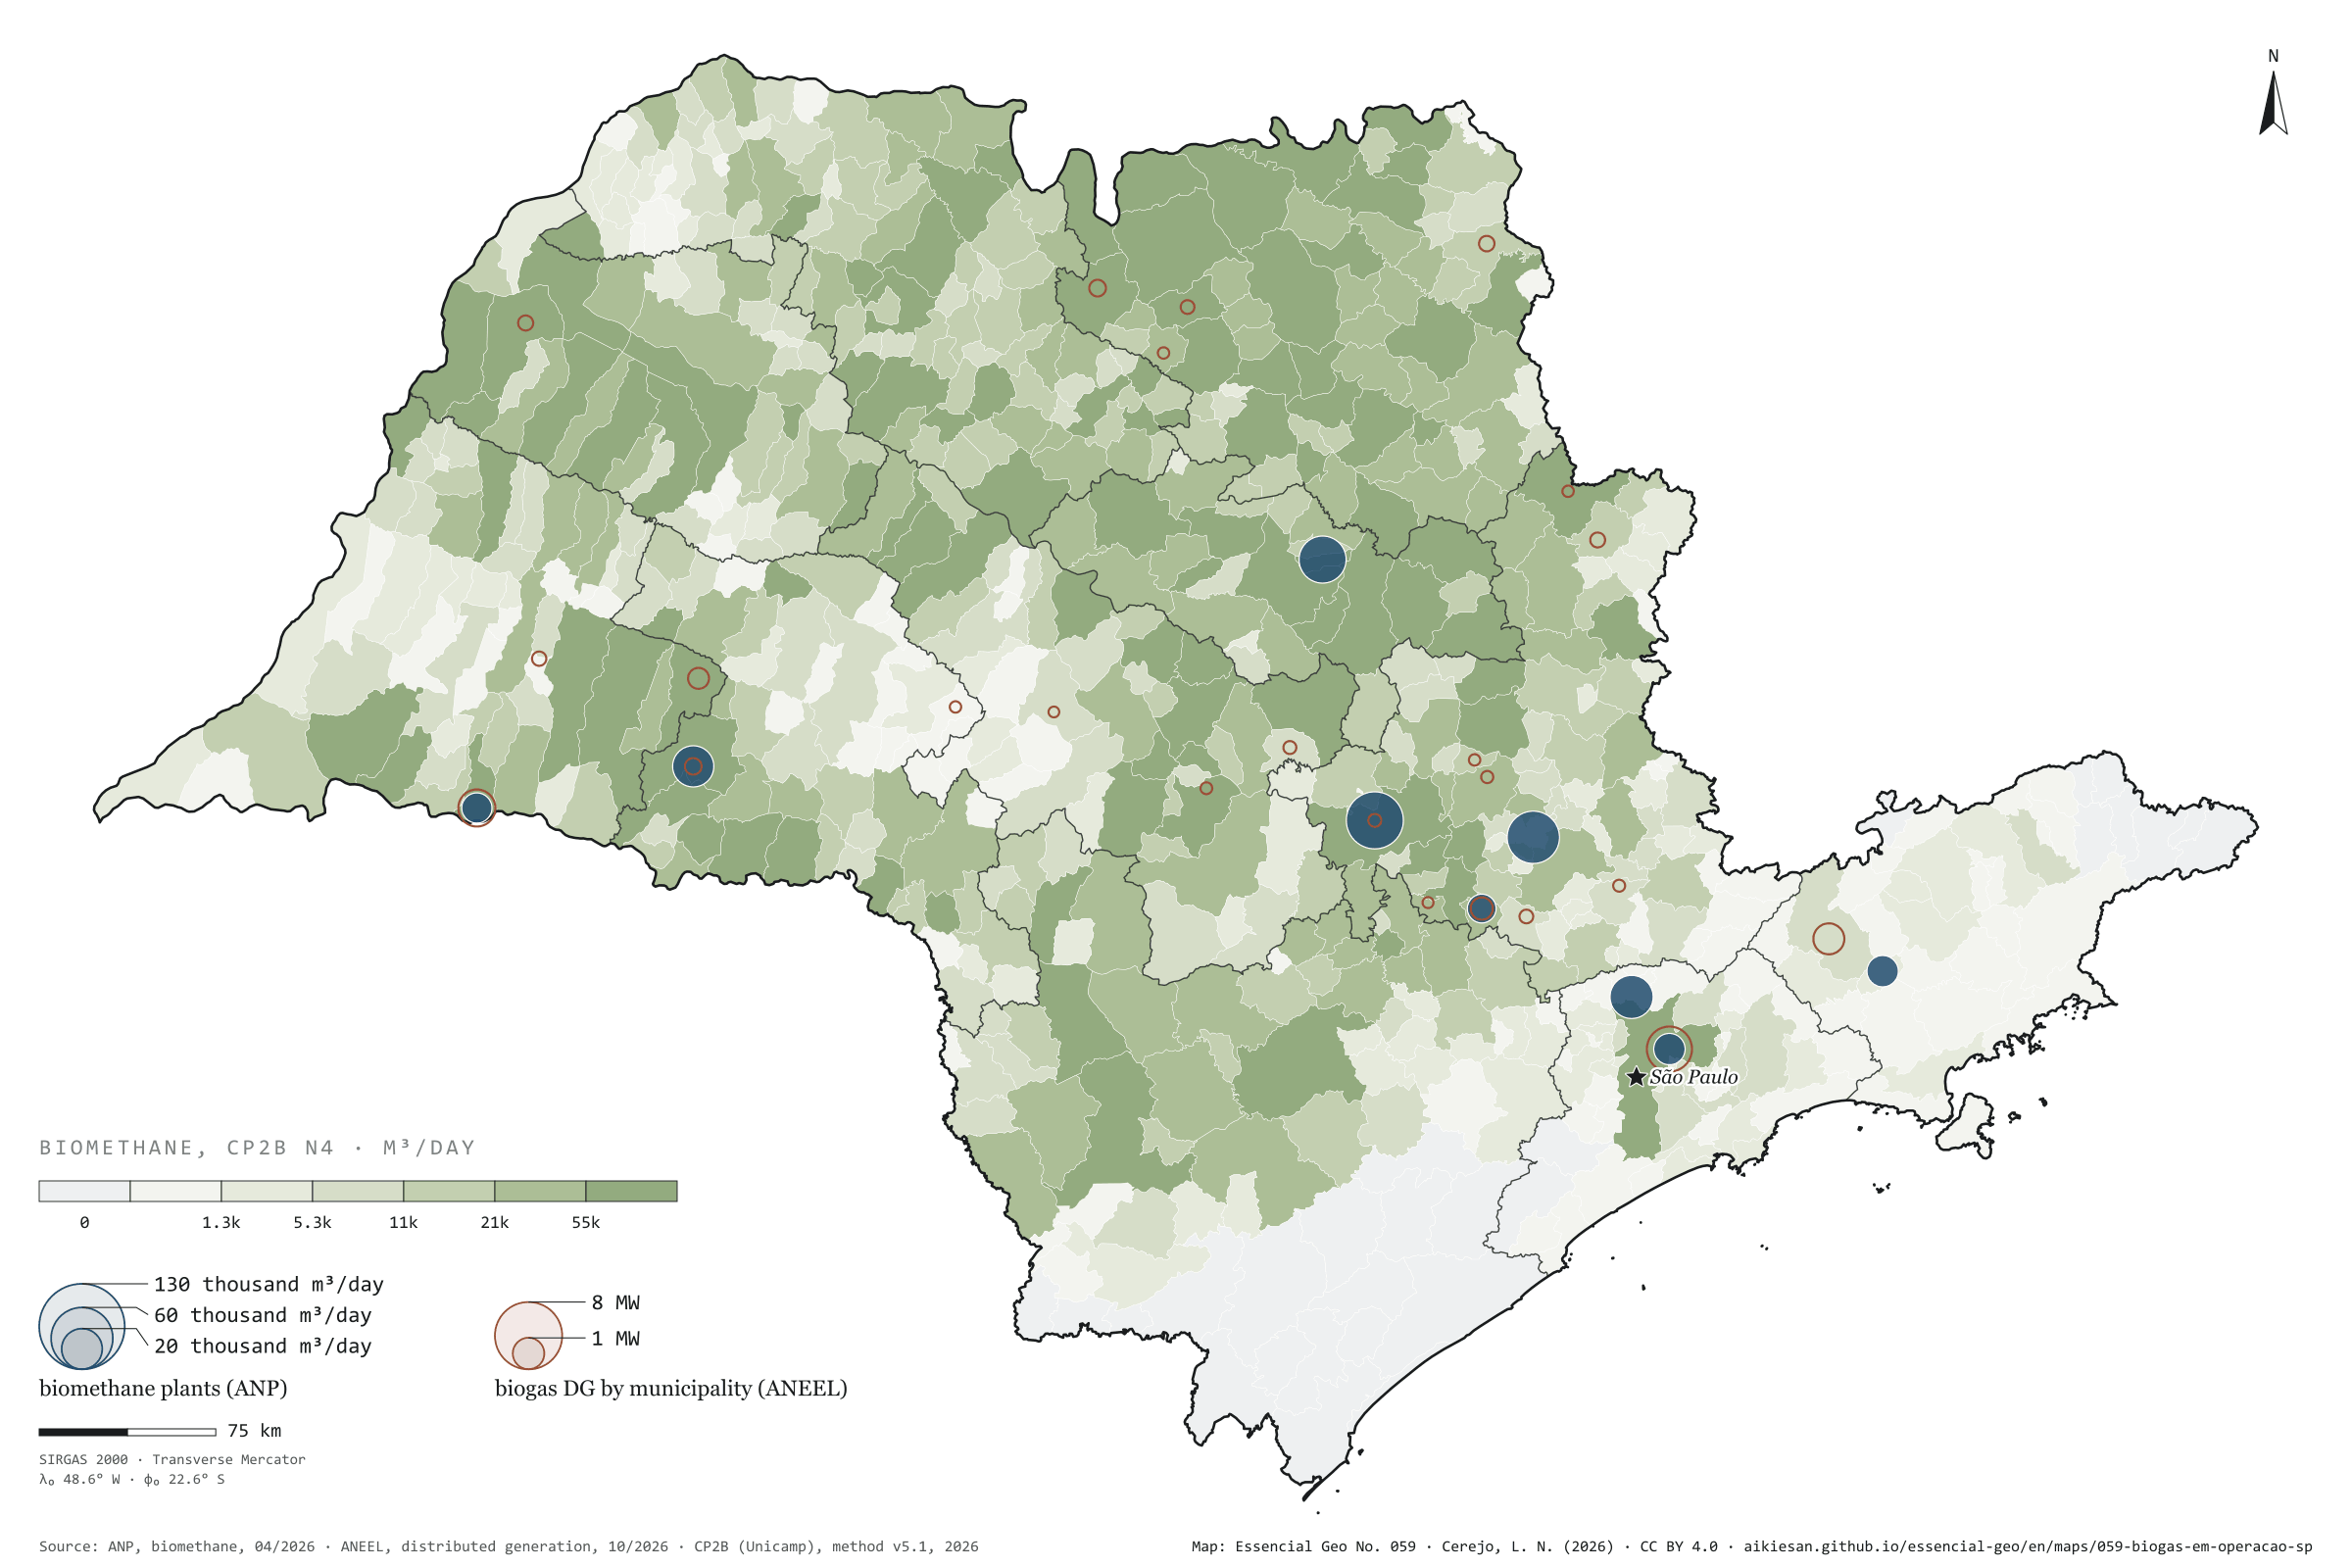
Fig. 059São Paulo State (SP)EPSG:4674Source: ANP, ANEEL, CP2B (Unicamp), IBGE
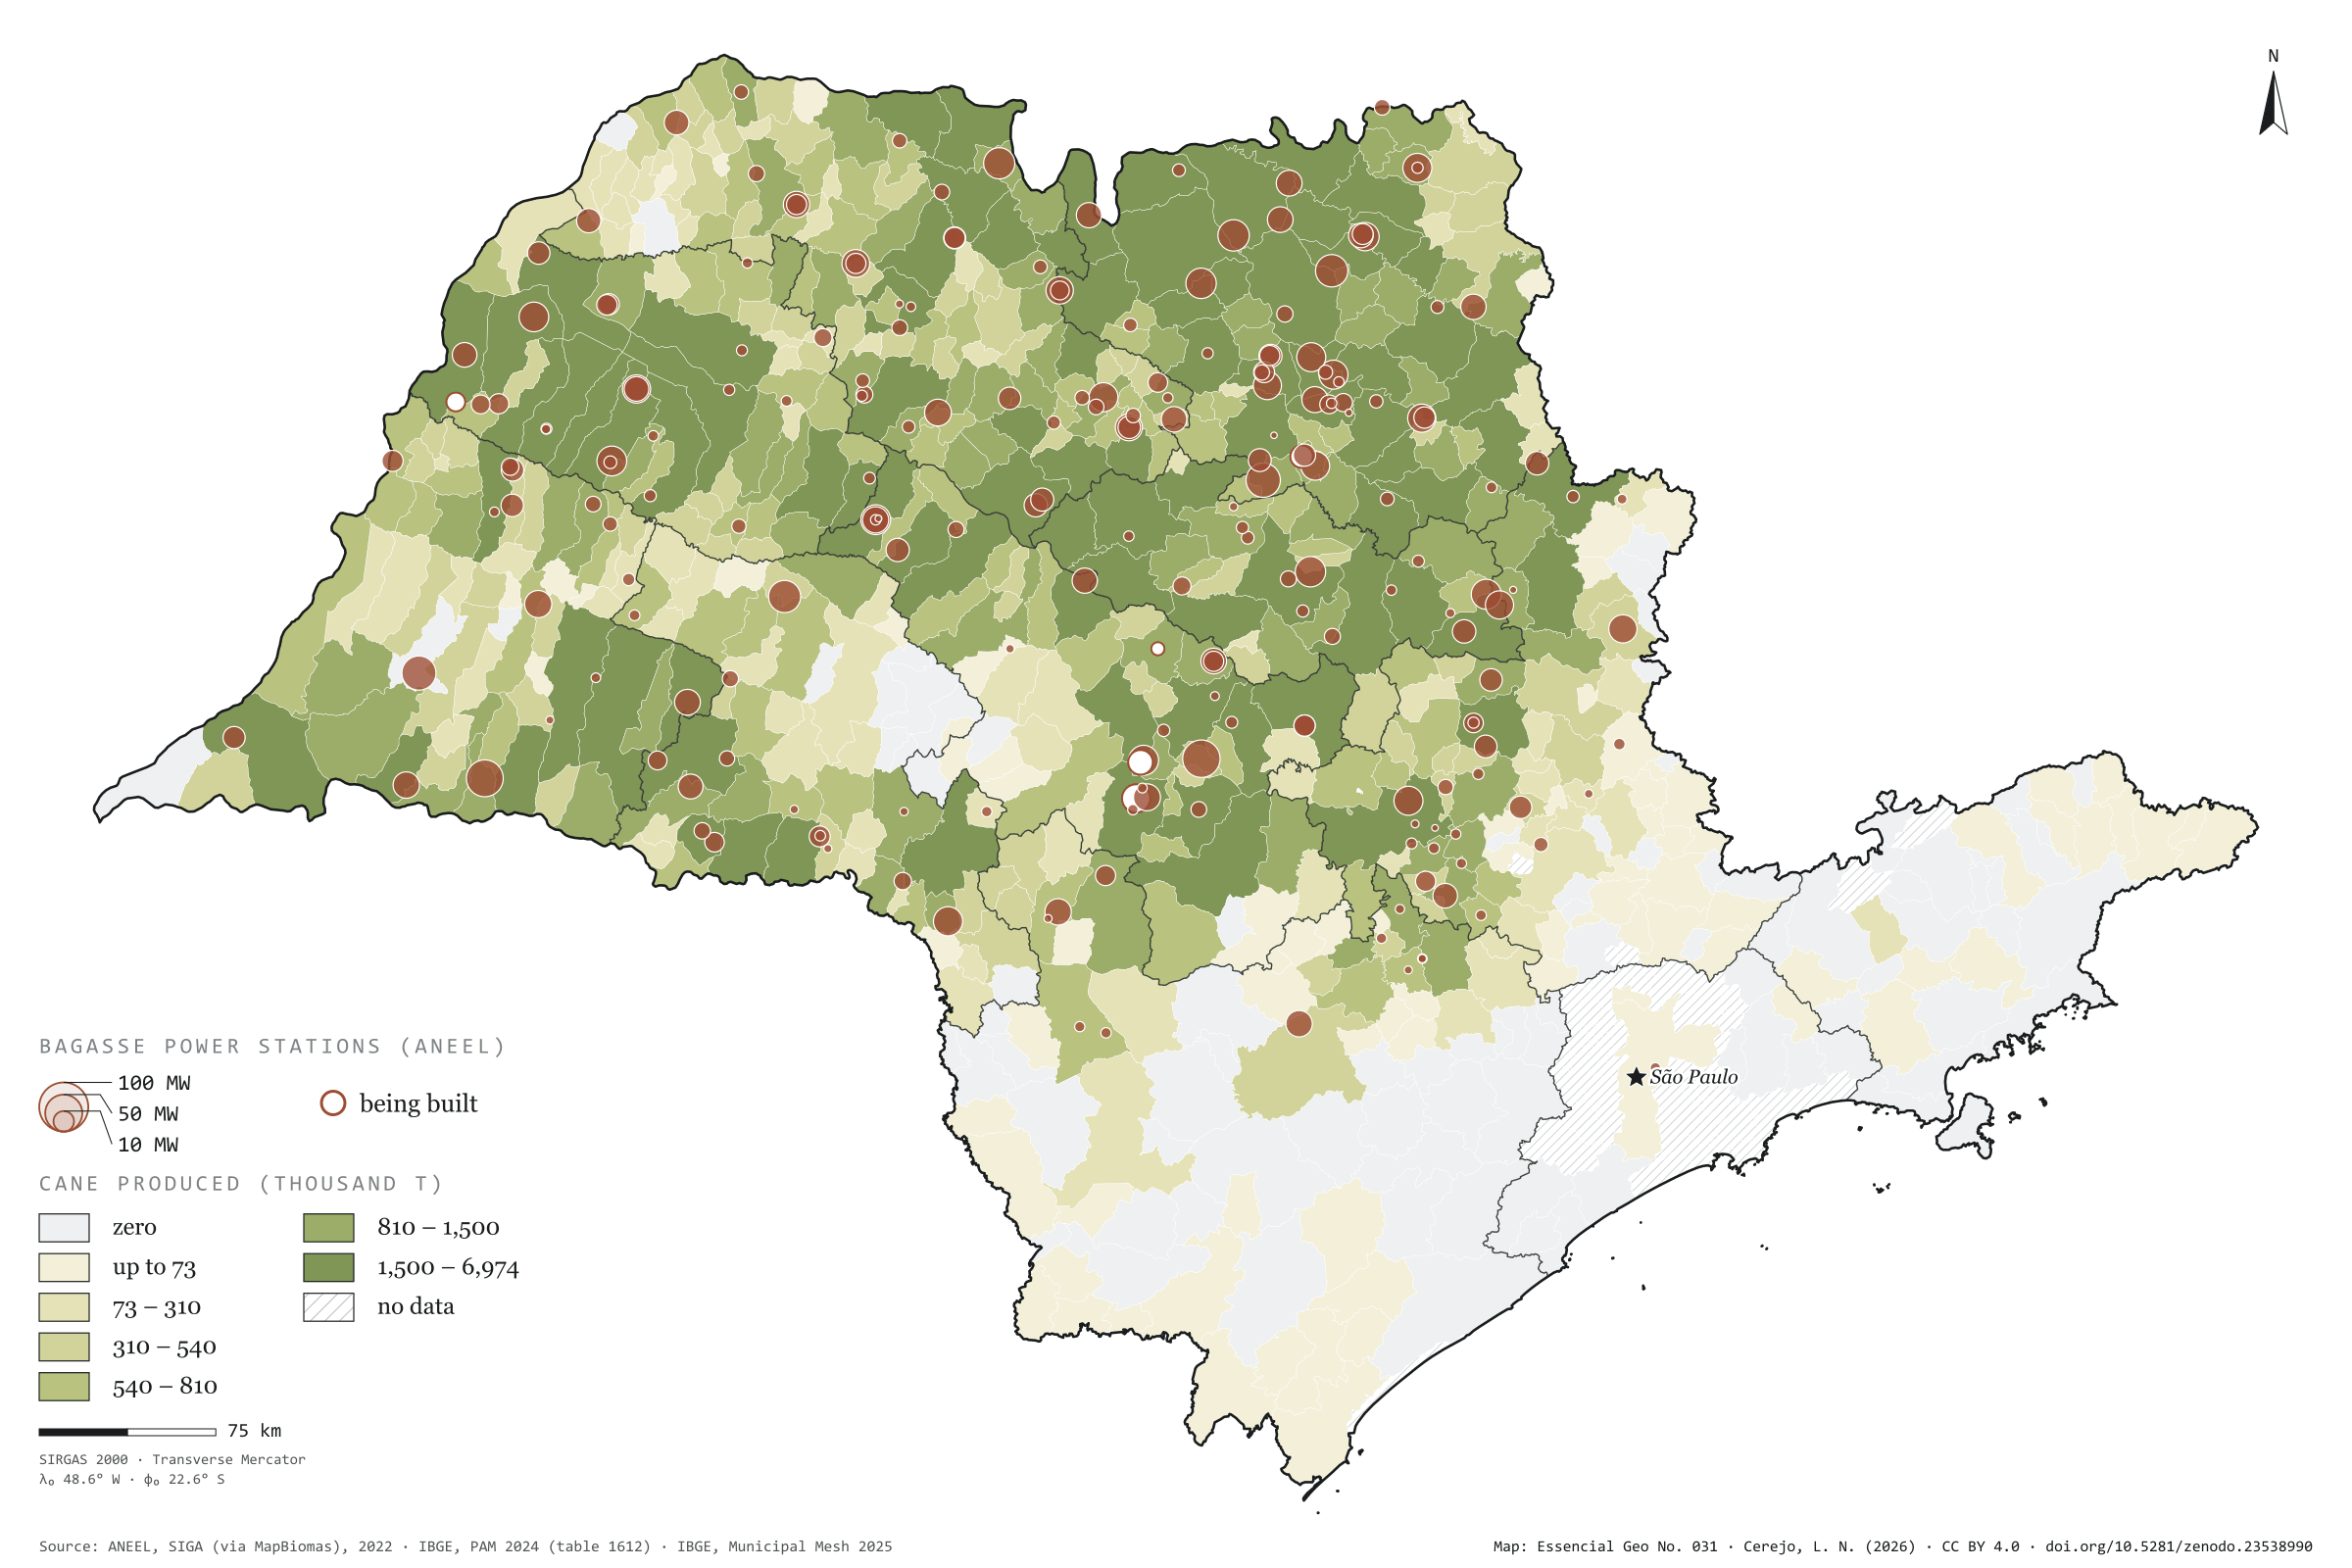
Of a potential of 16.9 million m³ of biomethane a day, how much has already become a plant? In April 2026, nine biomethane plants in São Paulo reported output to ANP. Together they hold 558,000 m³ a day of authorised capacity, 3.3% of the potential, and that month processed only 15% of the biogas they could treat: three of them stood near zero. The largest, Raízen and Geo’s plant in Piracicaba, has 130,000 m³ a day authorised, from vinasse and filter cake; the Caieiras landfill plant runs the most, at 45% use. In electricity, ANEEL lists 32 biogas distributed generation units in the state, with 21.9 MW, in 24 municipalities: most of it at landfills in the capital and São José dos Campos and at a mill in Narandiba; the rest, smaller, mostly from farm manure. The larger biogas power stations are on plate 028. Last plate of the collection “Biogas on the ground”.
Technical record · downloads · citation
At a glance
Authorised capacity of biomethane plants (m³/day)
Piracicaba23.4%
Paulínia19.2%
Américo Brasiliense14.8%
Caieiras12%
Paraguaçu Paulista10.8%
other four19.9%
Authorised capacity over the state’s potential
3.3%
557,816 of 16.9 million m³/day
Biogas distributed generation
22MW
32 units in 24 municipalities
Layers
plantas_biometanopoint9 biomethane plants: company name, CNPJ, biomethane and biogas capacity, biogas processed and use in the month
gd_biogaspoint24 municipalities with biogas distributed generation: units and capacity (kW) by residue type
municipiospolygon645 municipalities: potential, ANP capacity and DG capacity (same GPKG as plate 055)
SP biomethane plants that reported output to ANP in April 2026, with authorised capacity and biogas processed, and ANEEL biogas distributed generation units summed by municipality, over the biomethane potential (CP2B method v5.1, level N4, reference scenario).
The map without a frame, with legend, scale, reference system and credit written on it: ready for papers, lectures and slides. In two versions: with the basemap (neighbours and sea) or only the mapped area, on white.
CEREJO, Lucas Nakamura. Biogás em operação: do potencial, o que já virou planta. Versão 1.0.0. [S. l.]: Essencial, 2026. Conjunto de dados. Disponível em: https://aikiesan.github.io/essencial-geo/en/maps/059-biogas-em-operacao-sp/. Acesso em: 10 nov. 2026.
Cerejo, L. N. (2026). Biogás em operação: do potencial, o que já virou planta [Biogas in operation: Of the potential, what has already become a plant] (Version 1.0.0) [Data set]. Essencial. https://aikiesan.github.io/essencial-geo/en/maps/059-biogas-em-operacao-sp/
@dataset{cerejo2026_biogas_em_operacao_sp,
  author    = {Cerejo, Lucas Nakamura},
  title     = {Biogás em operação: Do potencial, o que já virou planta},
  year      = {2026},
  publisher = {Essencial},
  version   = {1.0.0},
  url       = {https://aikiesan.github.io/essencial-geo/en/maps/059-biogas-em-operacao-sp/},
  language  = {portuguese},
  note      = {English title: Biogas in operation: Of the potential, what has already become a plant. Licence CC BY 4.0}
}
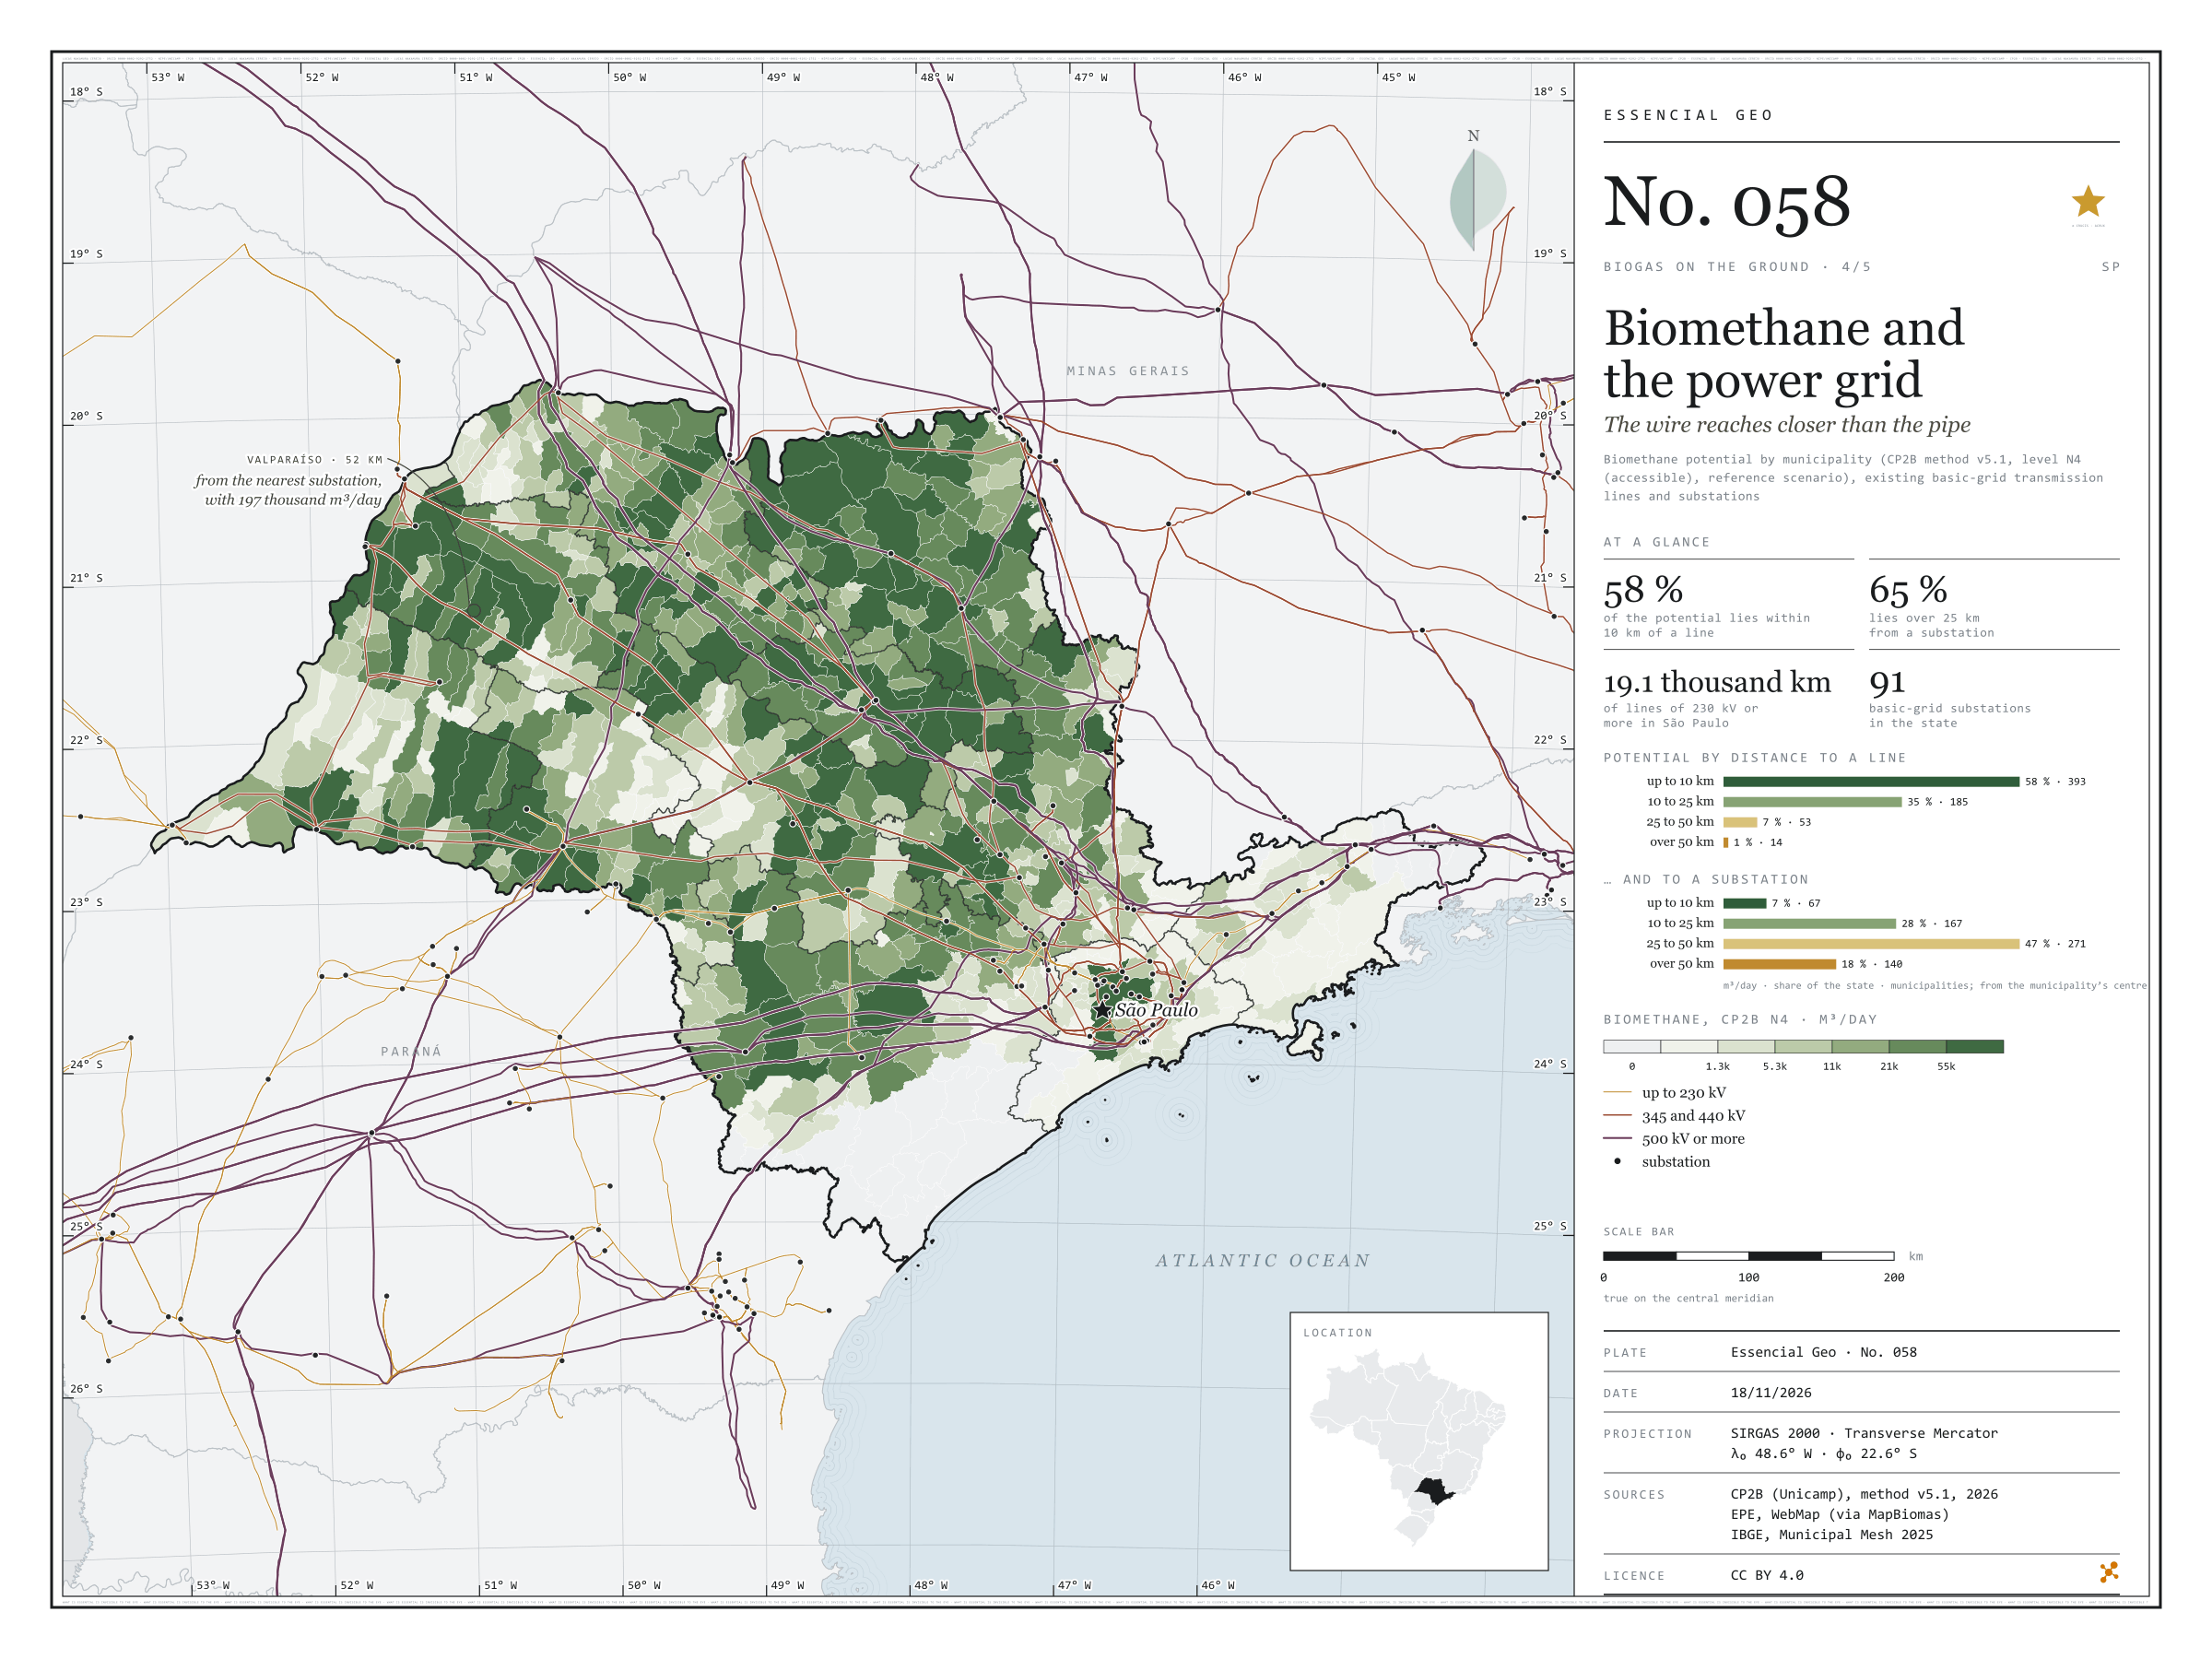
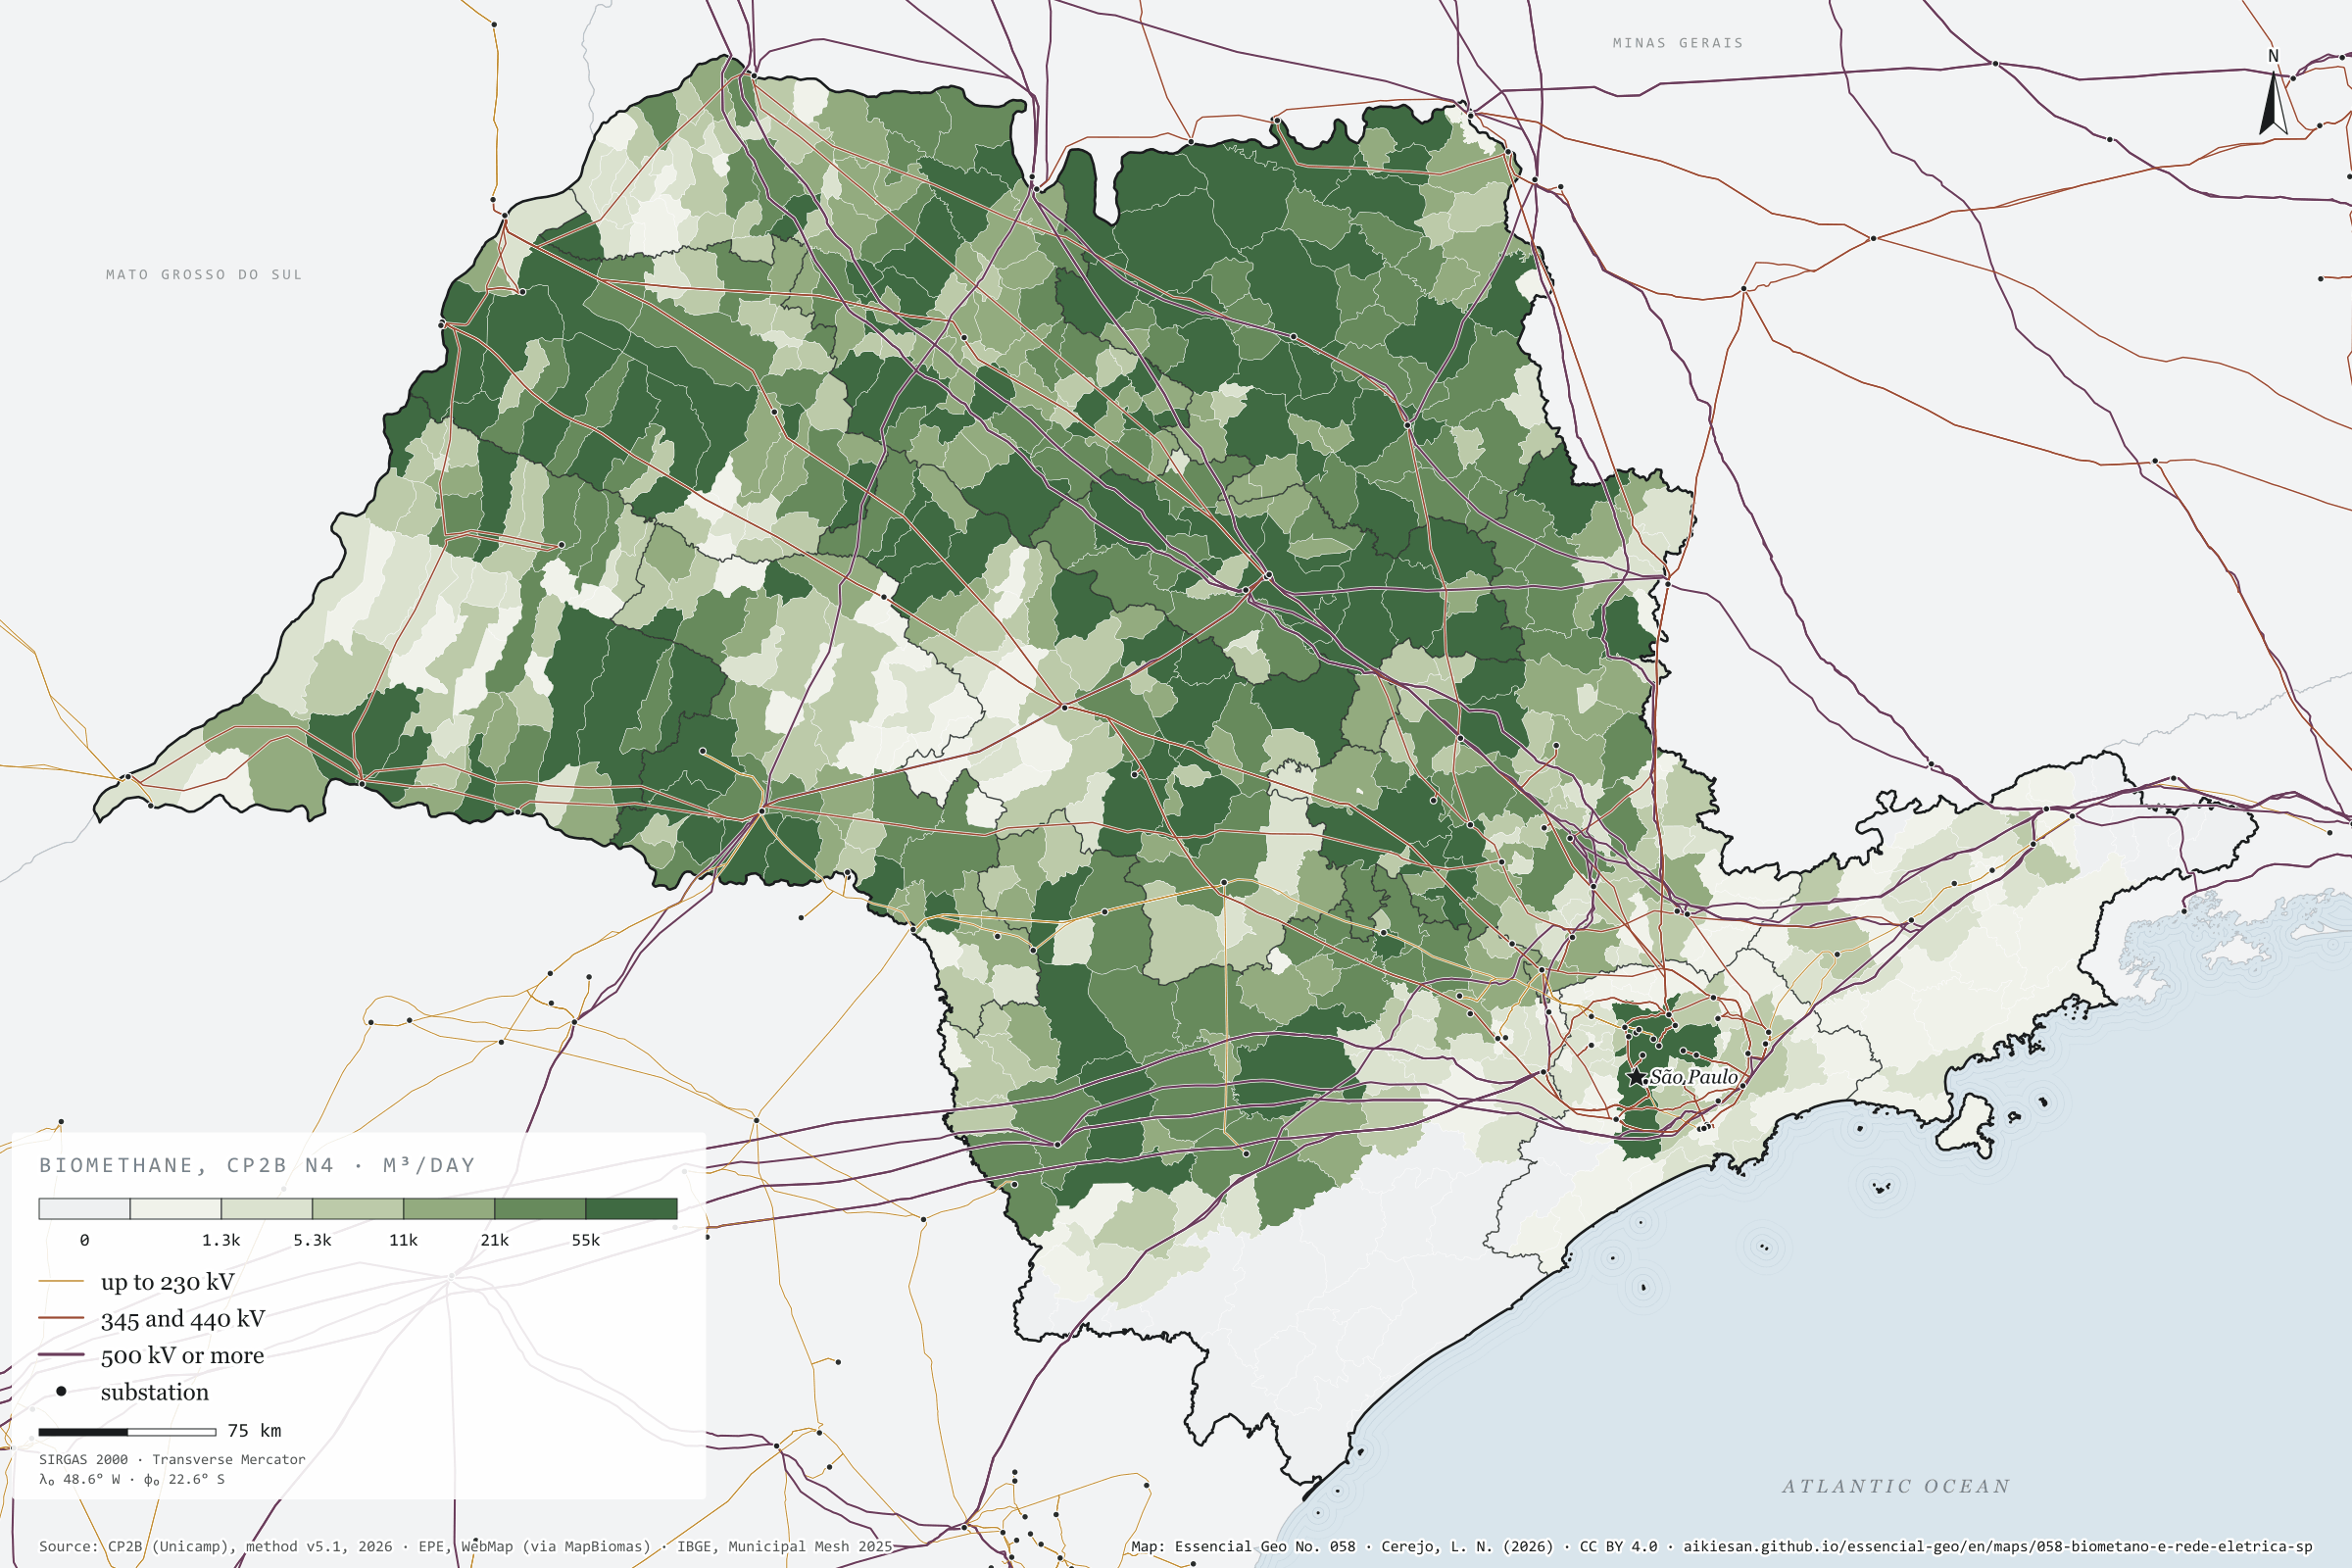
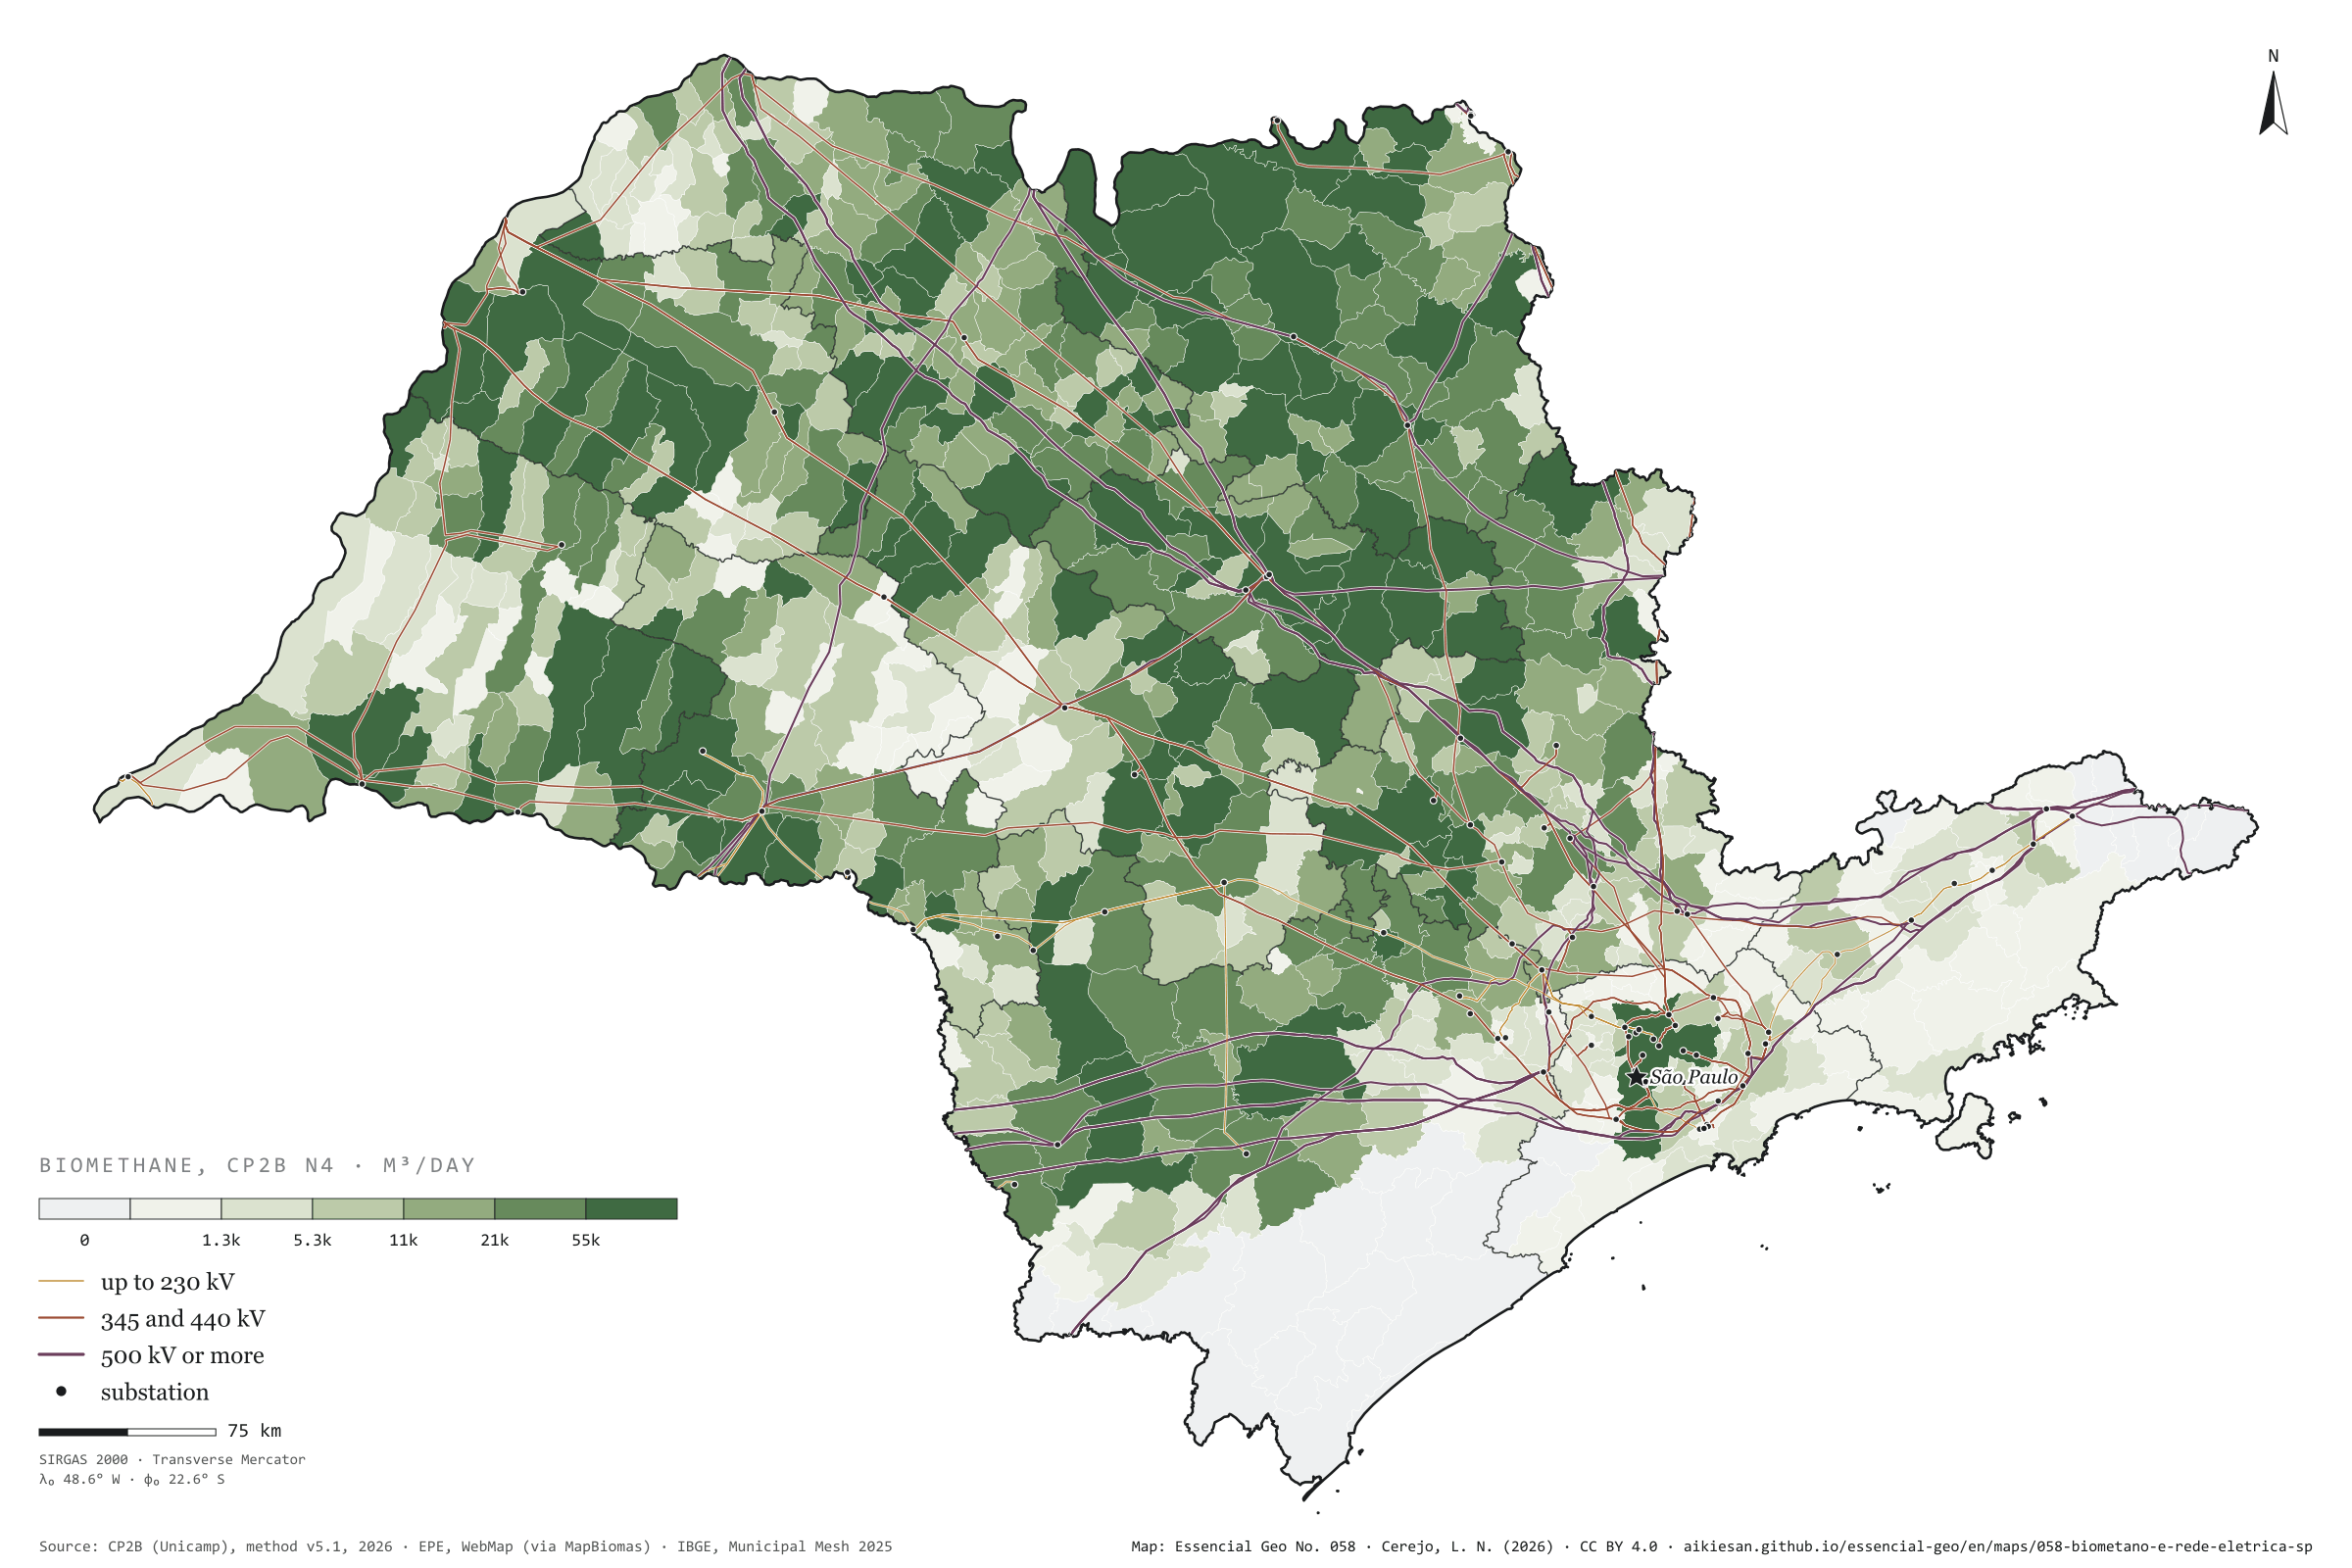
Fig. 058São Paulo State (SP)EPSG:4674Source: CP2B (Unicamp), EPE, IBGE
Where there is no pipeline, biogas can become electricity on the spot and leave by wire. In São Paulo, the basic grid, from 230 kV up, adds up to 19,100 km of lines and 91 substations, and covers the state far better than gas pipelines: 58% of the biomethane potential lies within 10 km of a transmission line, and only 1% over 50 km. The bottleneck is the substation, where power enters the grid: 65% of the potential lies over 25 km from one, measured from the municipality’s centre. Valparaíso, in the west, has 197,000 m³ of possible biomethane a day 2.6 km from a line, but 52 km from the nearest substation. On the previous plate, gas from the sugarcane north lay far from the pipe; here, the wire runs right over it. Fourth plate of the collection “Biogas on the ground”.
Technical record · downloads · citation
At a glance
Biomethane by distance to the nearest transmission line (m³/day)
up to 10 km57.7%
10 to 25 km34.8%
25 to 50 km6.6%
over 50 km0.9%
Biomethane by distance to the nearest substation (m³/day)
up to 10 km6.9%
10 to 25 km27.6%
25 to 50 km47.4%
over 50 km18.1%
Layers
municipiospolygon645 municipalities: potential and distances to lines and substations (same GPKG as plate 055)
linhas_transmissaoline493 lines of 230 kV or more, 19,100 km inside SP
subestacoespoint185 basic-grid substations, 91 in SP
Straight-line distance from each municipality’s interior point to the nearest basic-grid transmission line and substation, in four bands, crossed with the biomethane potential (CP2B method v5.1, level N4, reference scenario).
The map without a frame, with legend, scale, reference system and credit written on it: ready for papers, lectures and slides. In two versions: with the basemap (neighbours and sea) or only the mapped area, on white.
CEREJO, Lucas Nakamura. Biometano e rede elétrica: o fio chega mais perto do que o cano. Versão 1.0.0. [S. l.]: Essencial, 2026. Conjunto de dados. Disponível em: https://aikiesan.github.io/essencial-geo/en/maps/058-biometano-e-rede-eletrica-sp/. Acesso em: 10 nov. 2026.
Cerejo, L. N. (2026). Biometano e rede elétrica: o fio chega mais perto do que o cano [Biomethane and the power grid: The wire reaches closer than the pipe] (Version 1.0.0) [Data set]. Essencial. https://aikiesan.github.io/essencial-geo/en/maps/058-biometano-e-rede-eletrica-sp/
@dataset{cerejo2026_biometano_e_rede_eletrica_sp,
  author    = {Cerejo, Lucas Nakamura},
  title     = {Biometano e rede elétrica: O fio chega mais perto do que o cano},
  year      = {2026},
  publisher = {Essencial},
  version   = {1.0.0},
  url       = {https://aikiesan.github.io/essencial-geo/en/maps/058-biometano-e-rede-eletrica-sp/},
  language  = {portuguese},
  note      = {English title: Biomethane and the power grid: The wire reaches closer than the pipe. Licence CC BY 4.0}
}
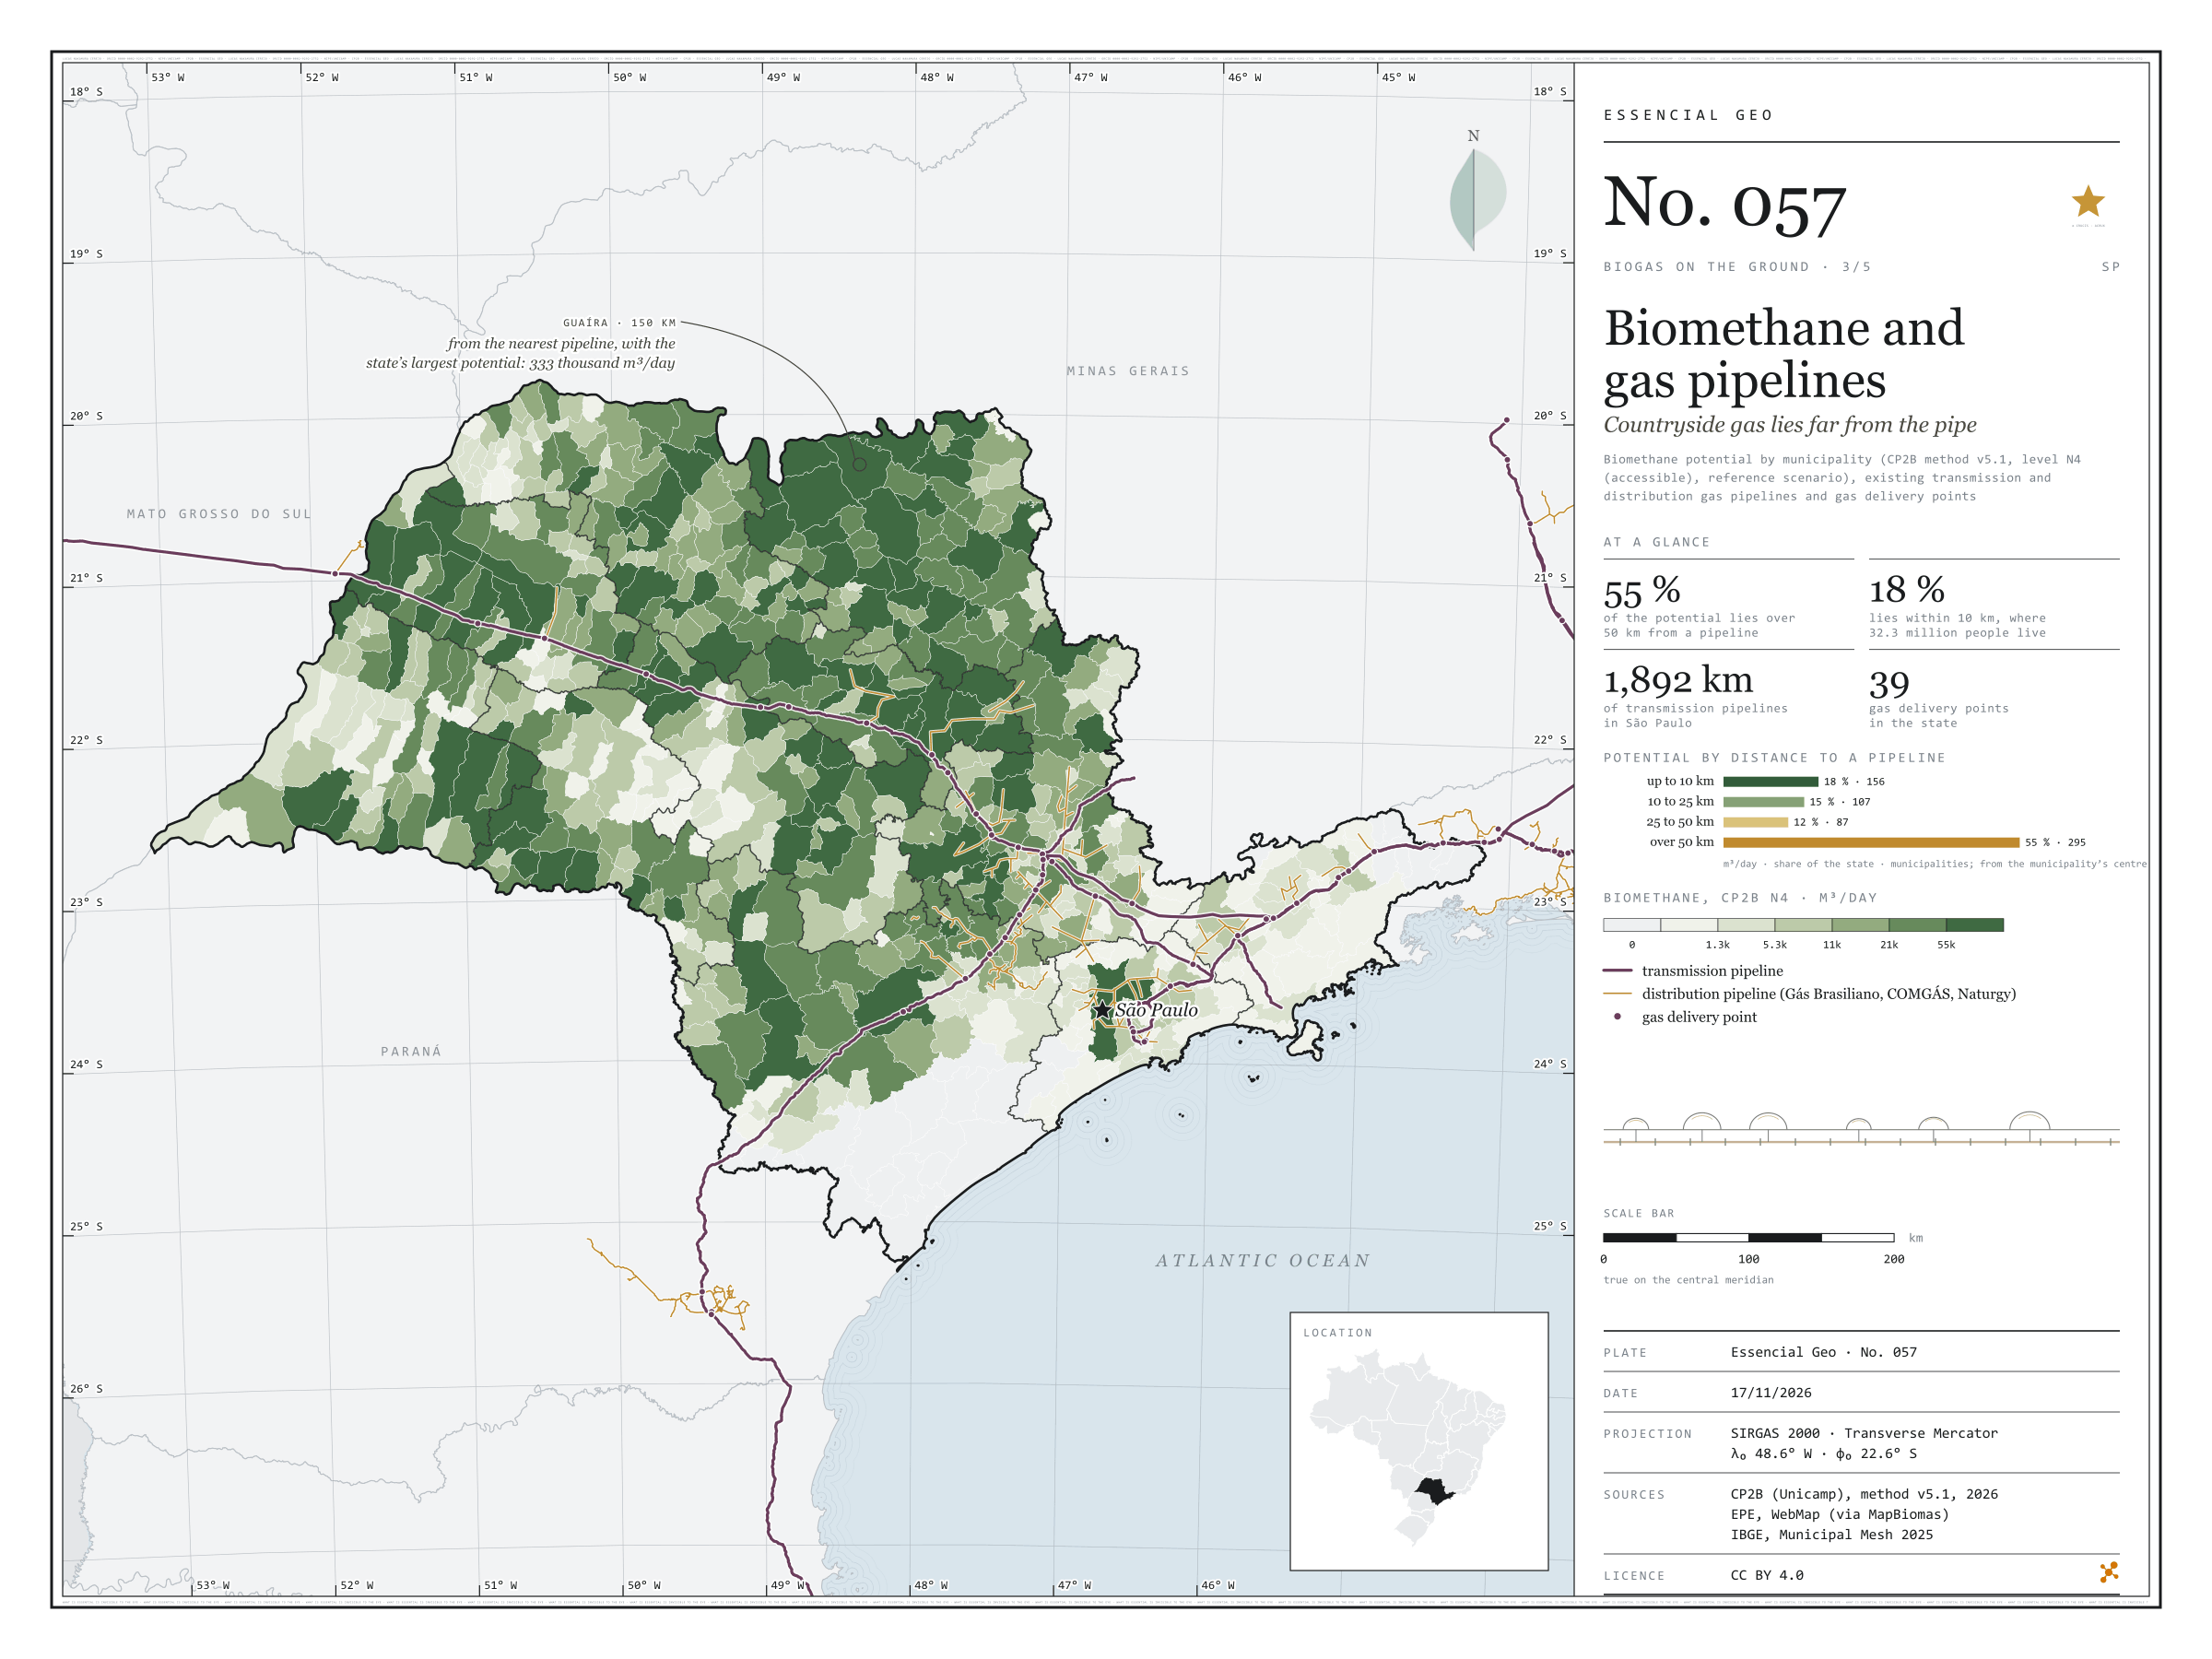
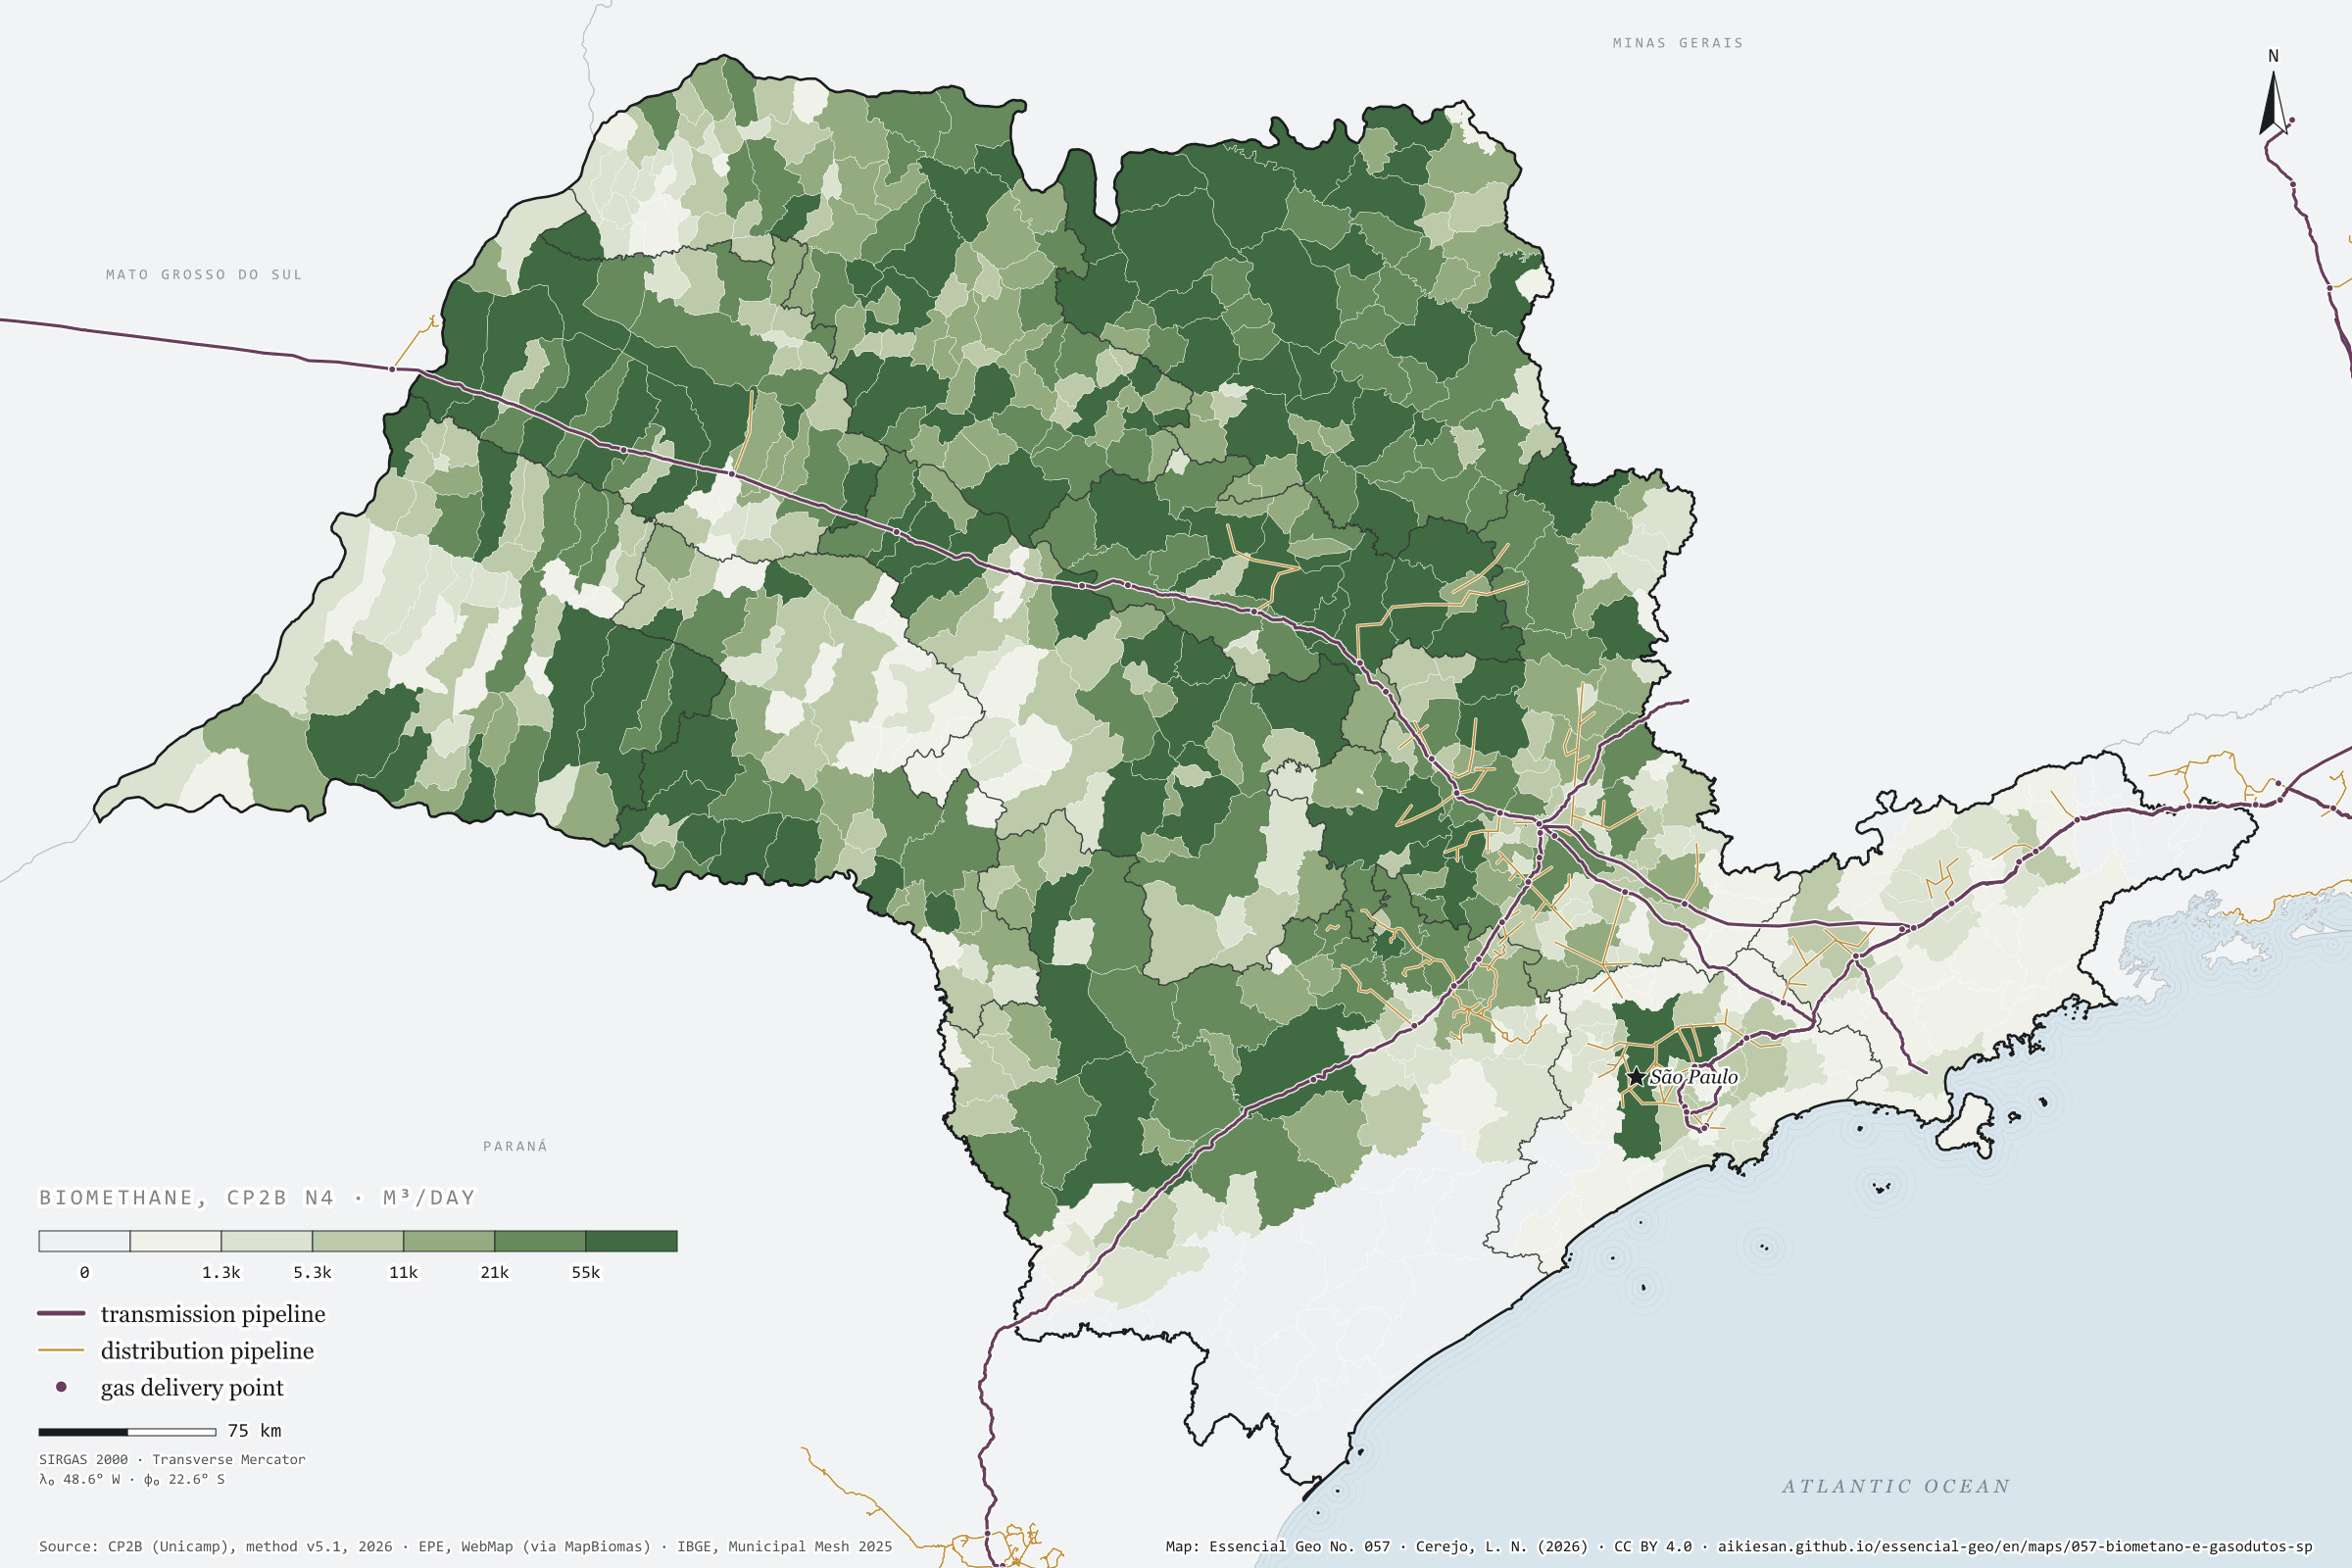
Fig. 057São Paulo State (SP)EPSG:4674Source: CP2B (Unicamp), EPE, IBGE
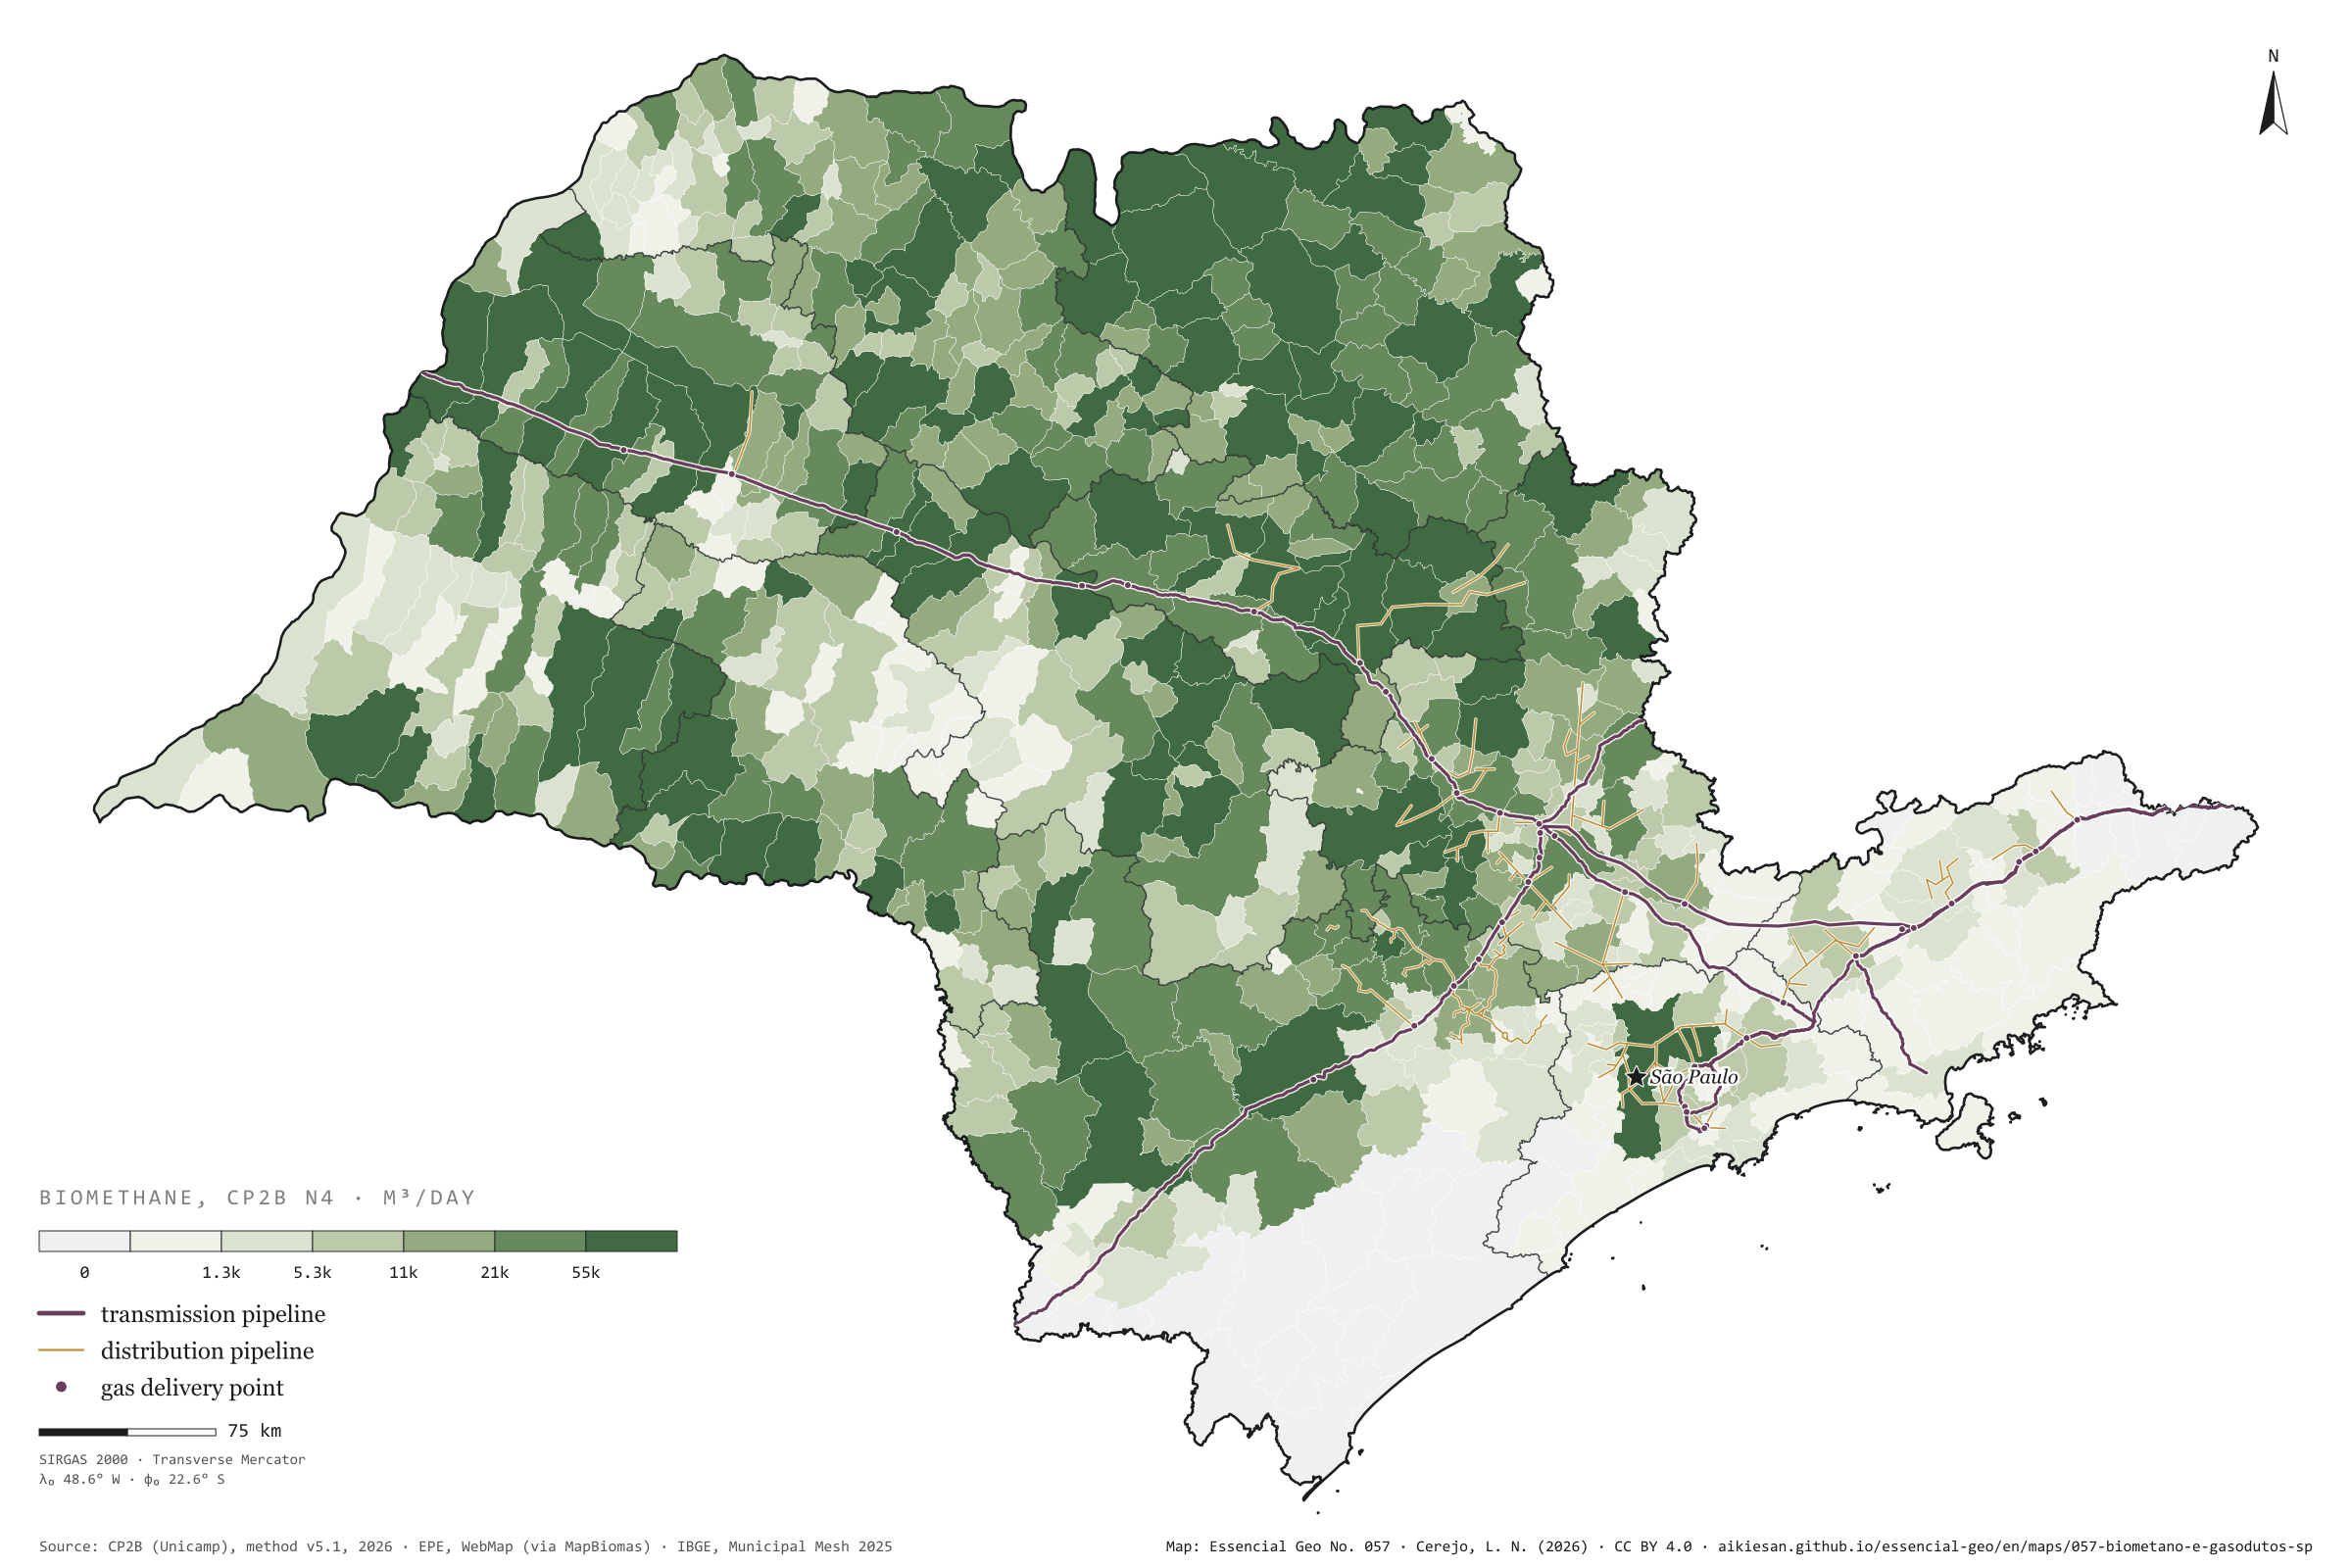
Biomethane is renewable natural gas: to reach its users it needs a pipeline, or a lorry. In São Paulo, transmission pipelines add up to 1,892 km, along an axis that comes from Mato Grosso do Sul on the Gasbol, passes Campinas and runs down to the capital and the Paraíba Valley; the distribution networks of Comgás, Gás Brasiliano and Naturgy cluster around it. The potential does not. Measured from the centre of each municipality to the nearest pipeline, 55% of the state’s possible biomethane lies over 50 km from a pipe; only 18% lies within 10 km, in 156 municipalities home to 32 million people. Guaíra, the state’s largest potential at 333,000 m³ a day, is 150 km from the nearest pipeline; Morro Agudo, the second, 103 km. The sugarcane north is a gas field without a pipe. Third plate of the collection “Biogas on the ground”.
Technical record · downloads · citation
At a glance
Biomethane by distance to the nearest pipeline (m³/day)
up to 10 km17.7%
10 to 25 km15%
25 to 50 km12.1%
over 50 km55.2%
Distance from Guaíra, the largest potential, to the nearest pipeline
150km
Layers
municipiospolygon645 municipalities: potential and distances to pipelines and delivery points (same GPKG as plate 055)
gasodutos_transporteline13 existing transmission pipelines, 1,892 km inside SP
gasodutos_distribuicaolineDistribution networks (Comgás, Gás Brasiliano, Naturgy and neighbours)
pontos_entregapoint62 existing delivery points, 39 in SP
Straight-line distance from each municipality’s interior point to the nearest existing transmission or distribution gas pipeline, in four bands, crossed with the biomethane potential (CP2B method v5.1, level N4, reference scenario).
The map without a frame, with legend, scale, reference system and credit written on it: ready for papers, lectures and slides. In two versions: with the basemap (neighbours and sea) or only the mapped area, on white.
CEREJO, Lucas Nakamura. Biometano e gasodutos: o gás do campo fica longe do cano. Versão 1.0.0. [S. l.]: Essencial, 2026. Conjunto de dados. Disponível em: https://aikiesan.github.io/essencial-geo/en/maps/057-biometano-e-gasodutos-sp/. Acesso em: 10 nov. 2026.
Cerejo, L. N. (2026). Biometano e gasodutos: o gás do campo fica longe do cano [Biomethane and gas pipelines: Countryside gas lies far from the pipe] (Version 1.0.0) [Data set]. Essencial. https://aikiesan.github.io/essencial-geo/en/maps/057-biometano-e-gasodutos-sp/
@dataset{cerejo2026_biometano_e_gasodutos_sp,
  author    = {Cerejo, Lucas Nakamura},
  title     = {Biometano e gasodutos: O gás do campo fica longe do cano},
  year      = {2026},
  publisher = {Essencial},
  version   = {1.0.0},
  url       = {https://aikiesan.github.io/essencial-geo/en/maps/057-biometano-e-gasodutos-sp/},
  language  = {portuguese},
  note      = {English title: Biomethane and gas pipelines: Countryside gas lies far from the pipe. Licence CC BY 4.0}
}
Without the cane, maize, poultry and the city appear
Fig. 056São Paulo State (SP)EPSG:4674Source: CP2B (Unicamp), IBGE
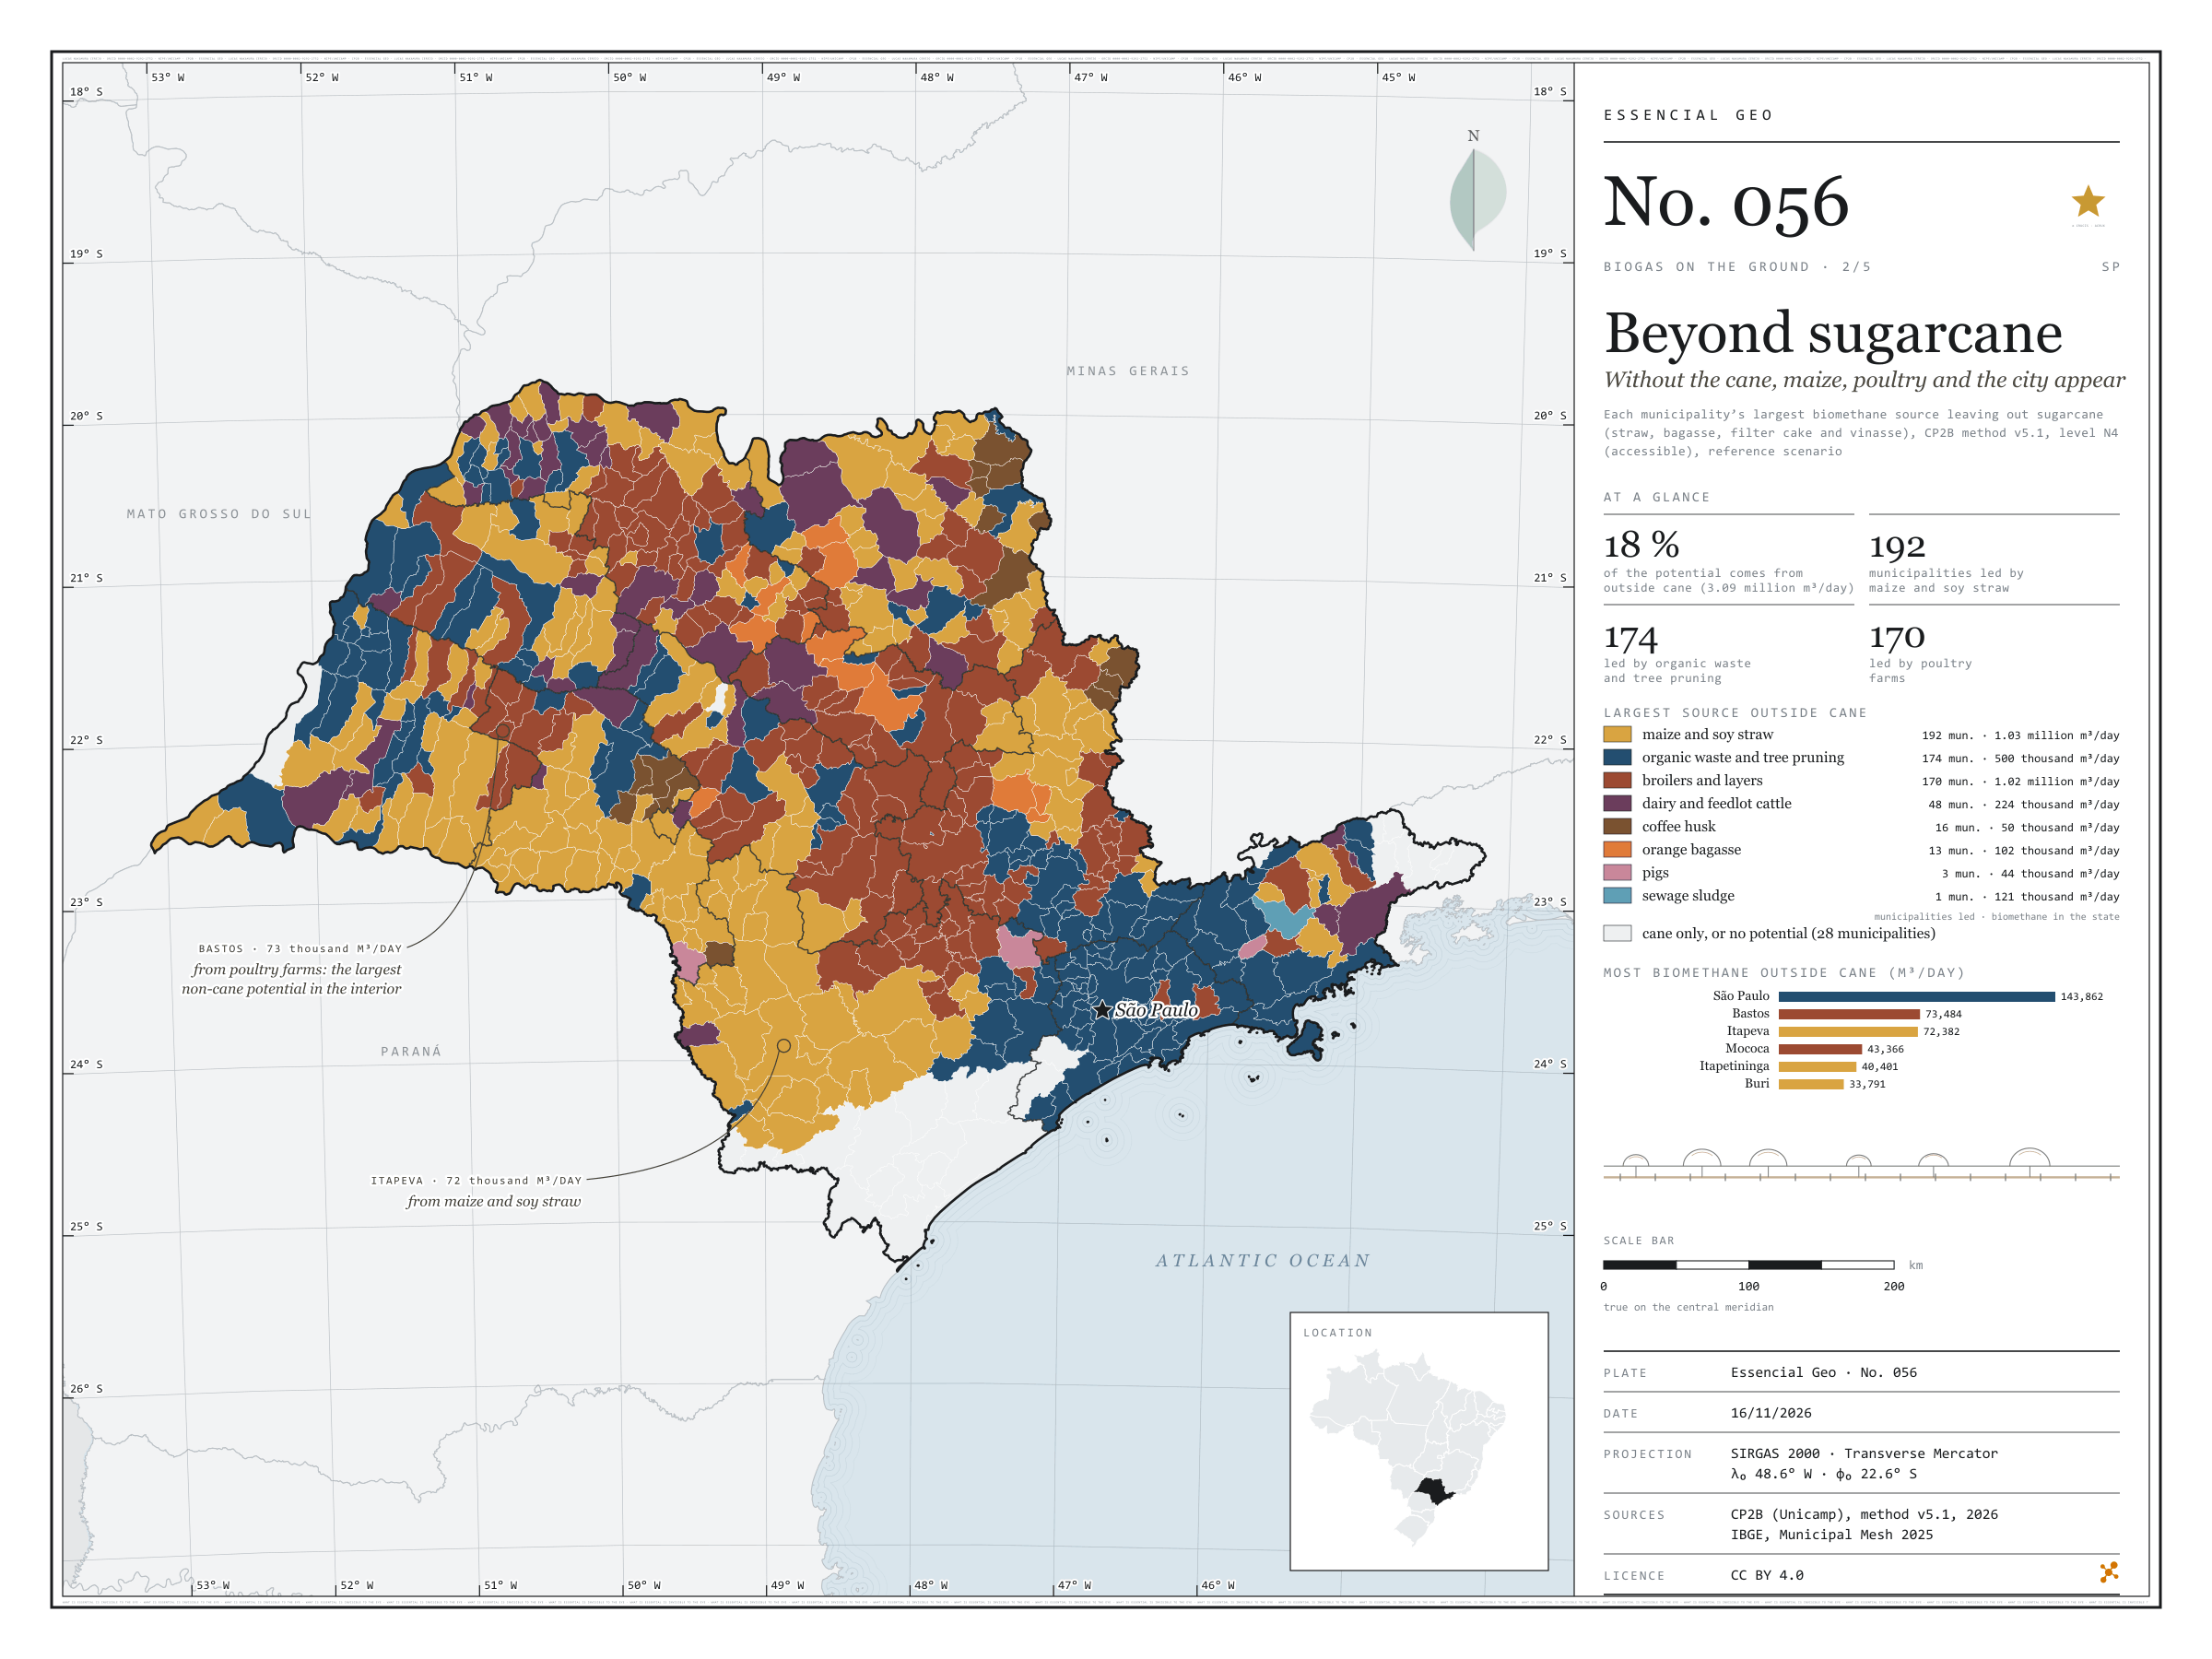
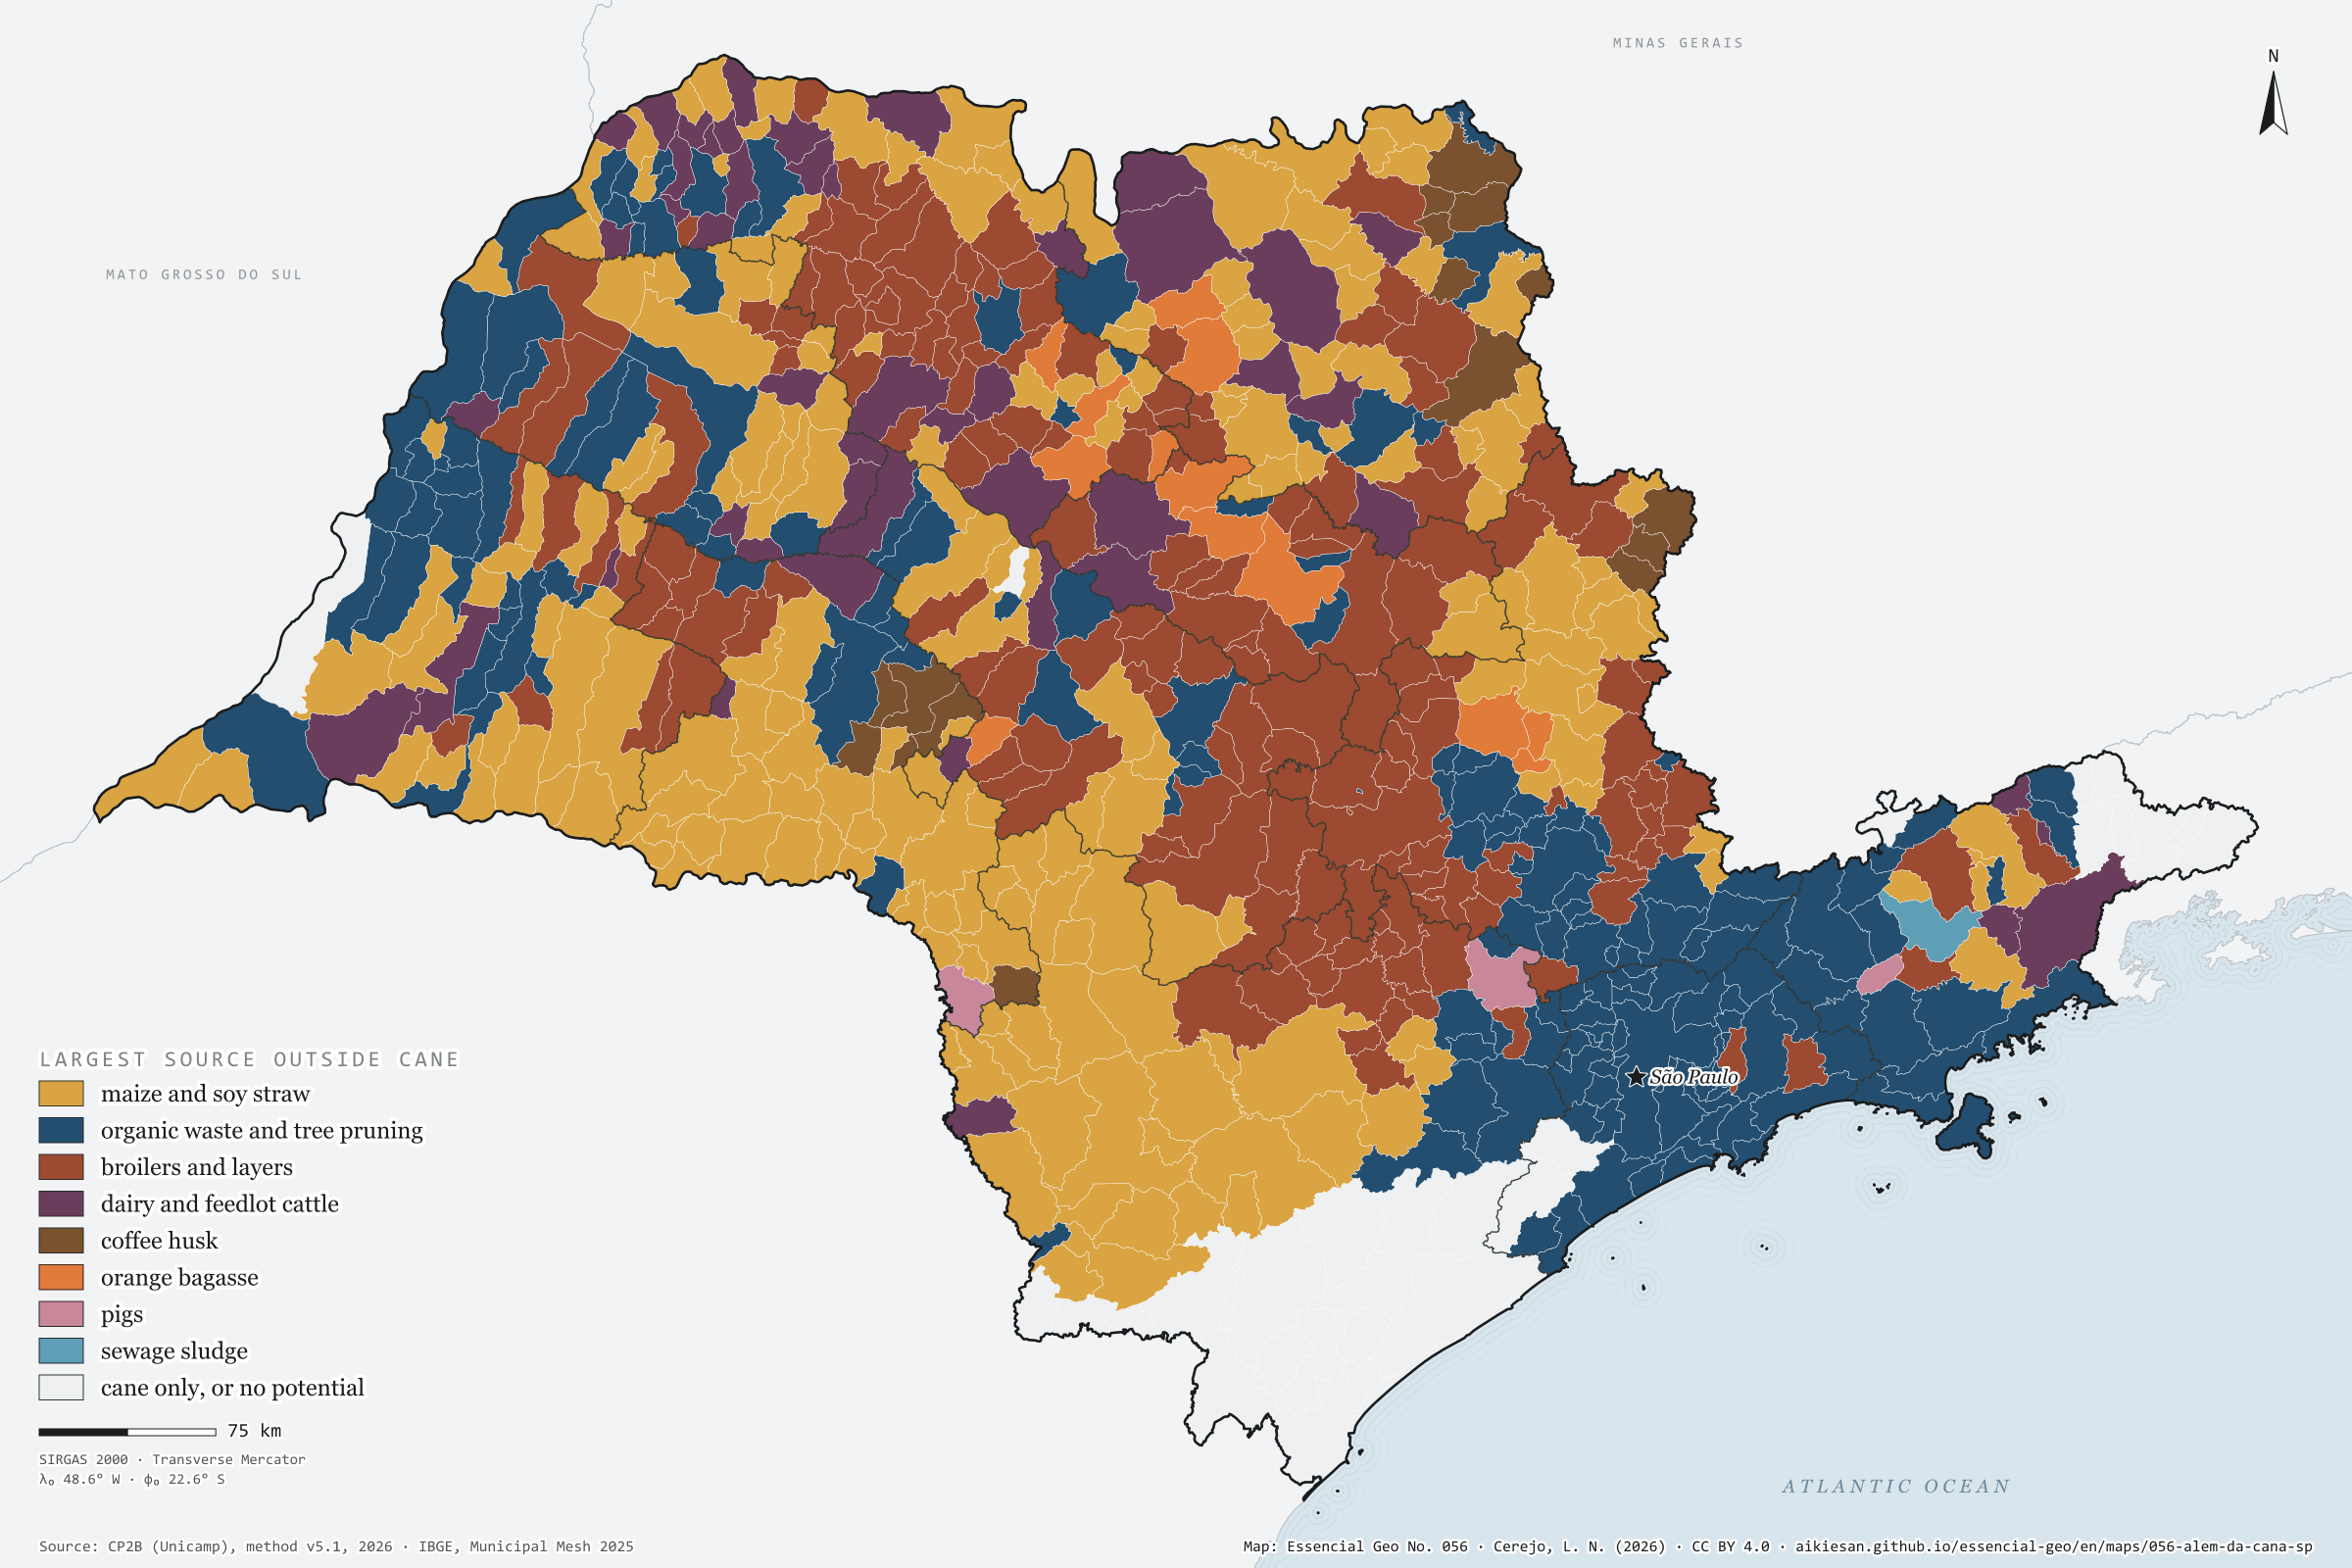
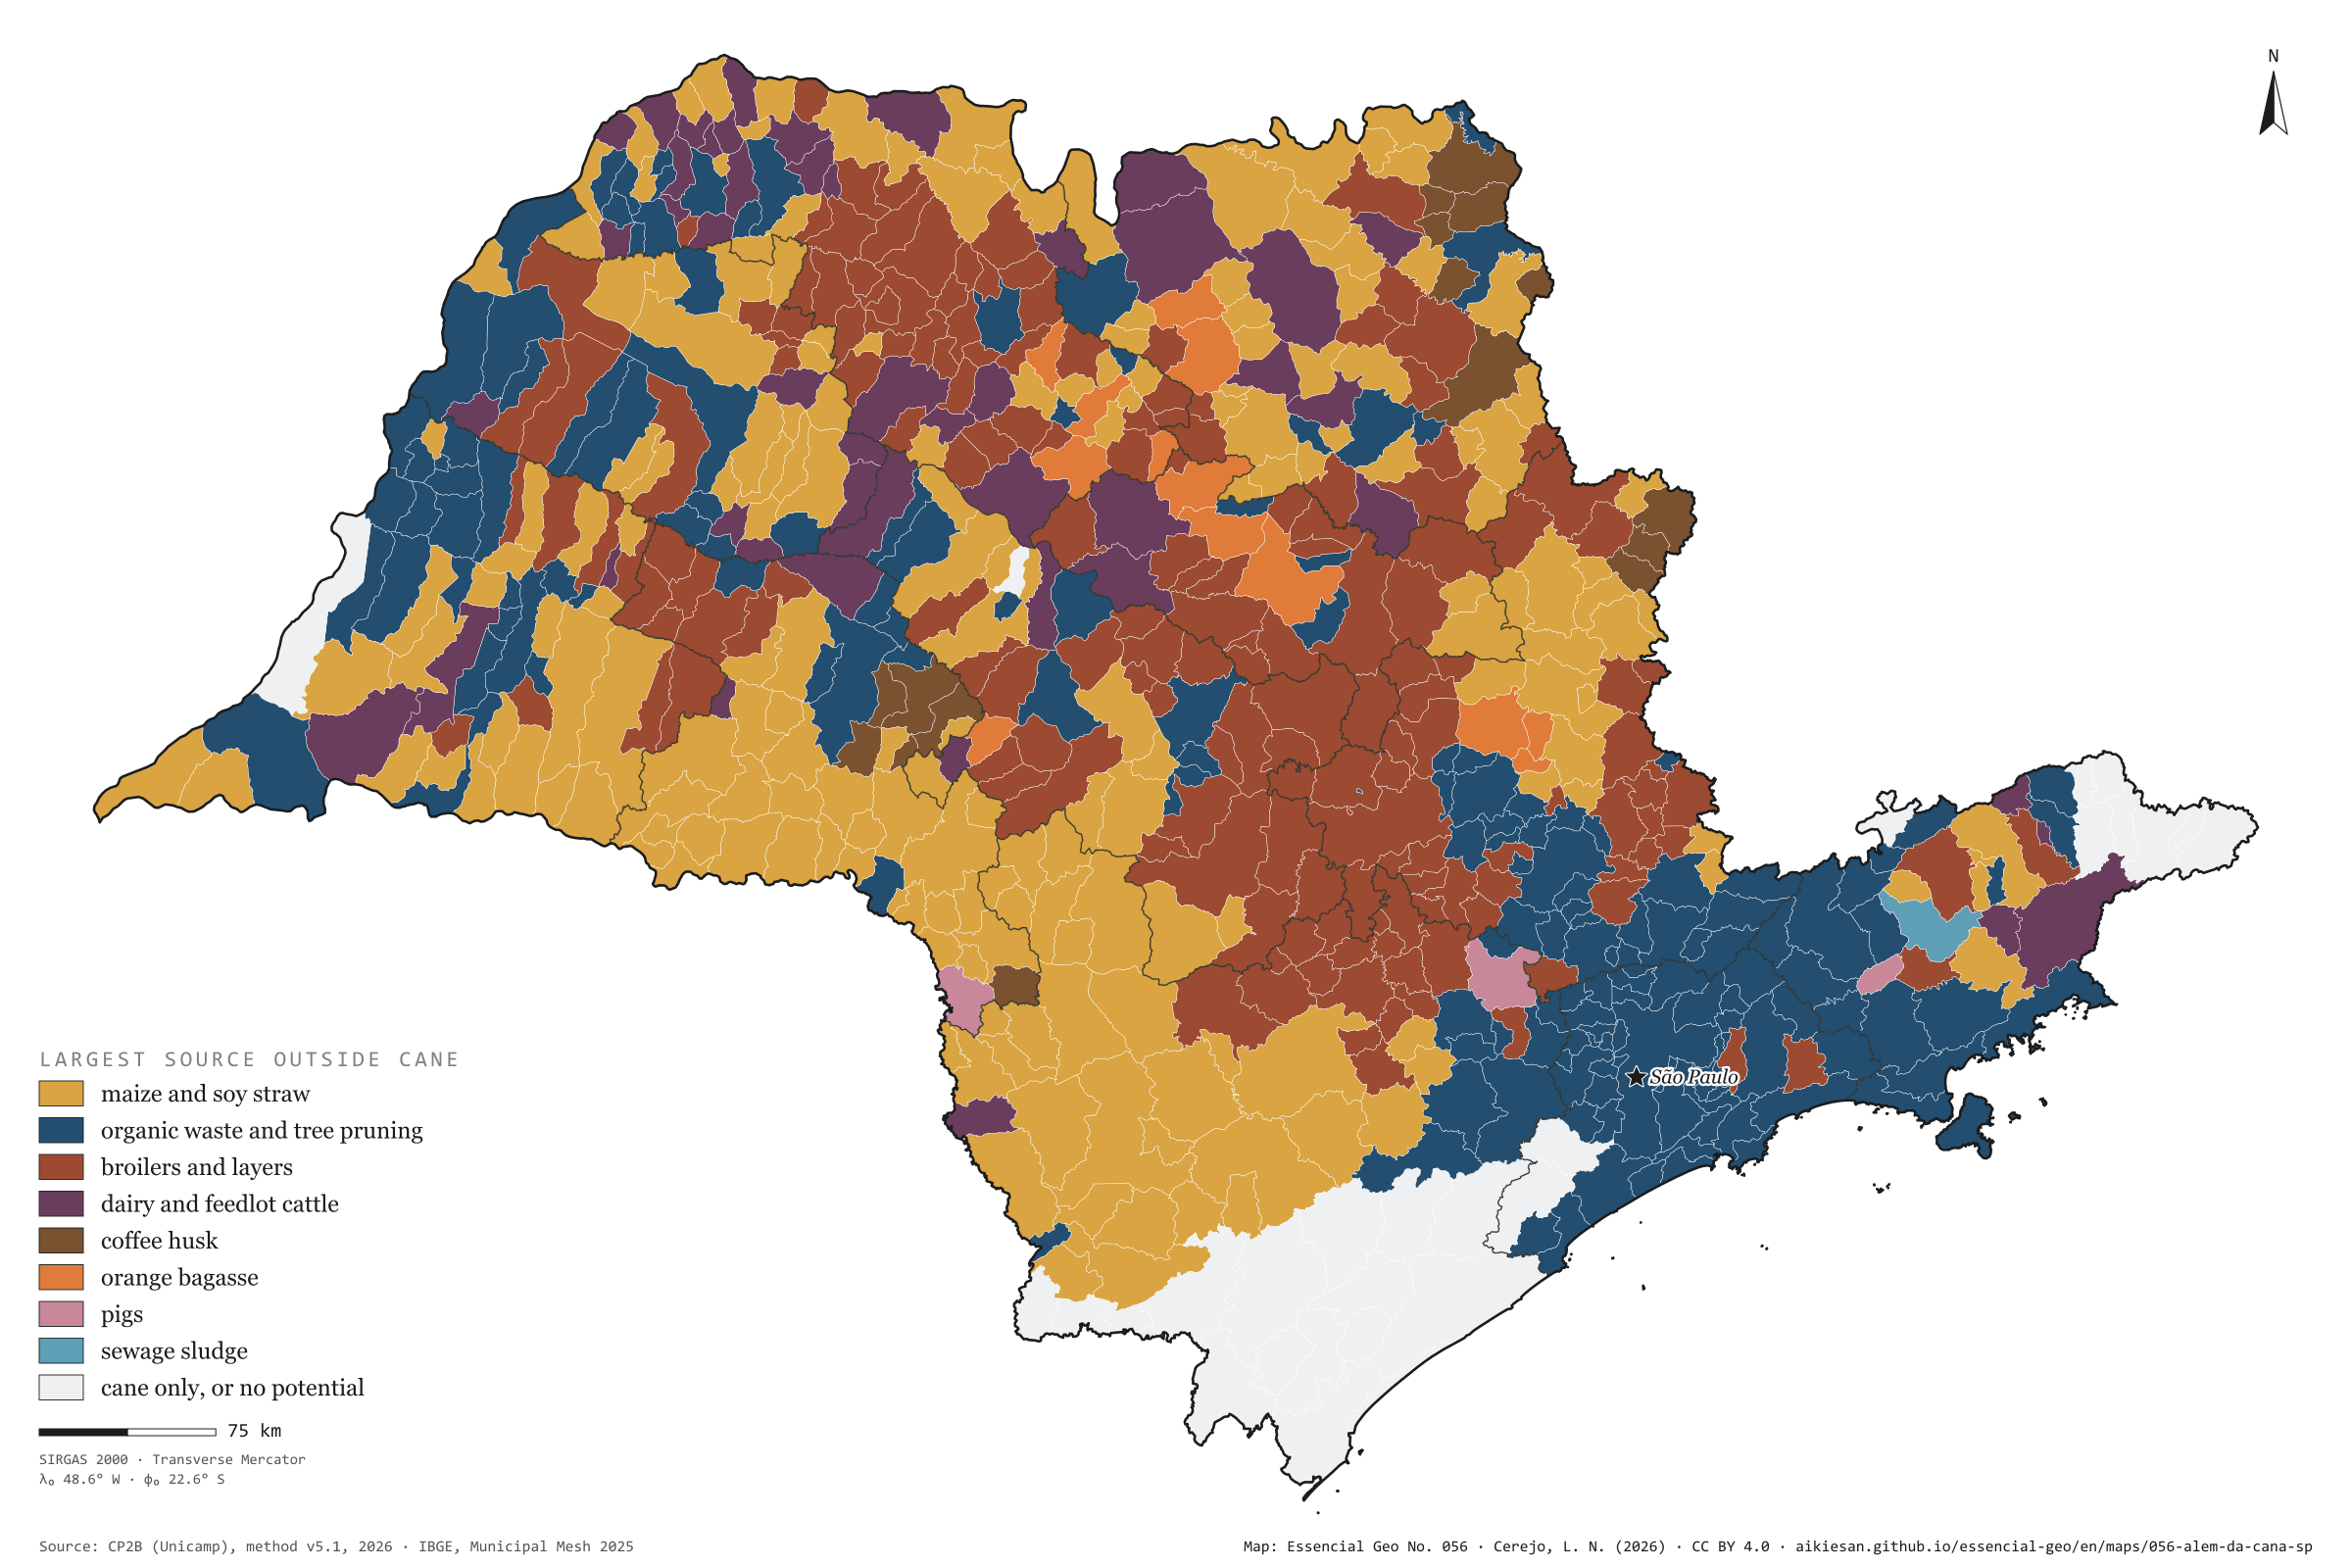
Sugarcane is the largest biomethane source in 370 of São Paulo’s municipalities and accounts for 82% of the state’s potential. The other 18%, 3.09 million m³ a day, draw a different map. With cane removed, maize and soy straw leads in 192 municipalities, scattered across the west and unbroken in the south and south-west, from Itapeva to Itapetininga; organic waste and tree pruning lead in 174, from Greater São Paulo to the Paraíba Valley and the interior’s mid-sized towns; poultry farms lead in 170, mostly in the centre and north of the state, from Bastos to Mococa. Dairy and feedlot cattle lead in 48 municipalities, coffee in 16, oranges in 13. The capital has the largest non-cane potential, 144,000 m³ a day, from waste and sewage; in the interior, the largest is Bastos, with 73,000, from its poultry farms. Second plate of the collection “Biogas on the ground”.
Technical record · downloads · citation
At a glance
Municipalities by largest source outside sugarcane (municipalities)
maize and soy straw29.8%
organic waste and tree pruning27%
broilers and layers26.4%
dairy and feedlot cattle7.4%
coffee husk2.5%
orange bagasse2%
pigs0.5%
sewage sludge0.2%
cane only, or no potential4.3%
Biomethane potential outside sugarcane
3,089,988m³/day
18% of the state’s 16.9 million m³/day
Layers
municipiospolygon645 municipalities: potential by non-cane source and largest source (same GPKG as plate 055)
regioes_intermediariaspolygon11 intermediate geographic regions
limite_estadualpolygonState boundary
Metadata
Sources
CP2B (Unicamp) — biogas and biomethane potential by municipality, method v5.1 (2026) IBGE — Municipal Mesh 2025 (2025)
Biomethane potential by municipality and residue (CP2B method v5.1, level N4, reference scenario), without the four sugarcane residues, summed into eight sources; each municipality gets its largest source.
The map without a frame, with legend, scale, reference system and credit written on it: ready for papers, lectures and slides. In two versions: with the basemap (neighbours and sea) or only the mapped area, on white.
CEREJO, Lucas Nakamura. Além da cana: sem a cana, aparecem o milho, a granja e a cidade. Versão 1.0.0. [S. l.]: Essencial, 2026. Conjunto de dados. Disponível em: https://aikiesan.github.io/essencial-geo/en/maps/056-alem-da-cana-sp/. Acesso em: 10 nov. 2026.
Cerejo, L. N. (2026). Além da cana: sem a cana, aparecem o milho, a granja e a cidade [Beyond sugarcane: Without the cane, maize, poultry and the city appear] (Version 1.0.0) [Data set]. Essencial. https://aikiesan.github.io/essencial-geo/en/maps/056-alem-da-cana-sp/
@dataset{cerejo2026_alem_da_cana_sp,
  author    = {Cerejo, Lucas Nakamura},
  title     = {Além da cana: Sem a cana, aparecem o milho, a granja e a cidade},
  year      = {2026},
  publisher = {Essencial},
  version   = {1.0.0},
  url       = {https://aikiesan.github.io/essencial-geo/en/maps/056-alem-da-cana-sp/},
  language  = {portuguese},
  note      = {English title: Beyond sugarcane: Without the cane, maize, poultry and the city appear. Licence CC BY 4.0}
}
Fig. 055São Paulo State (SP)EPSG:4674Source: CP2B (Unicamp), IBGE
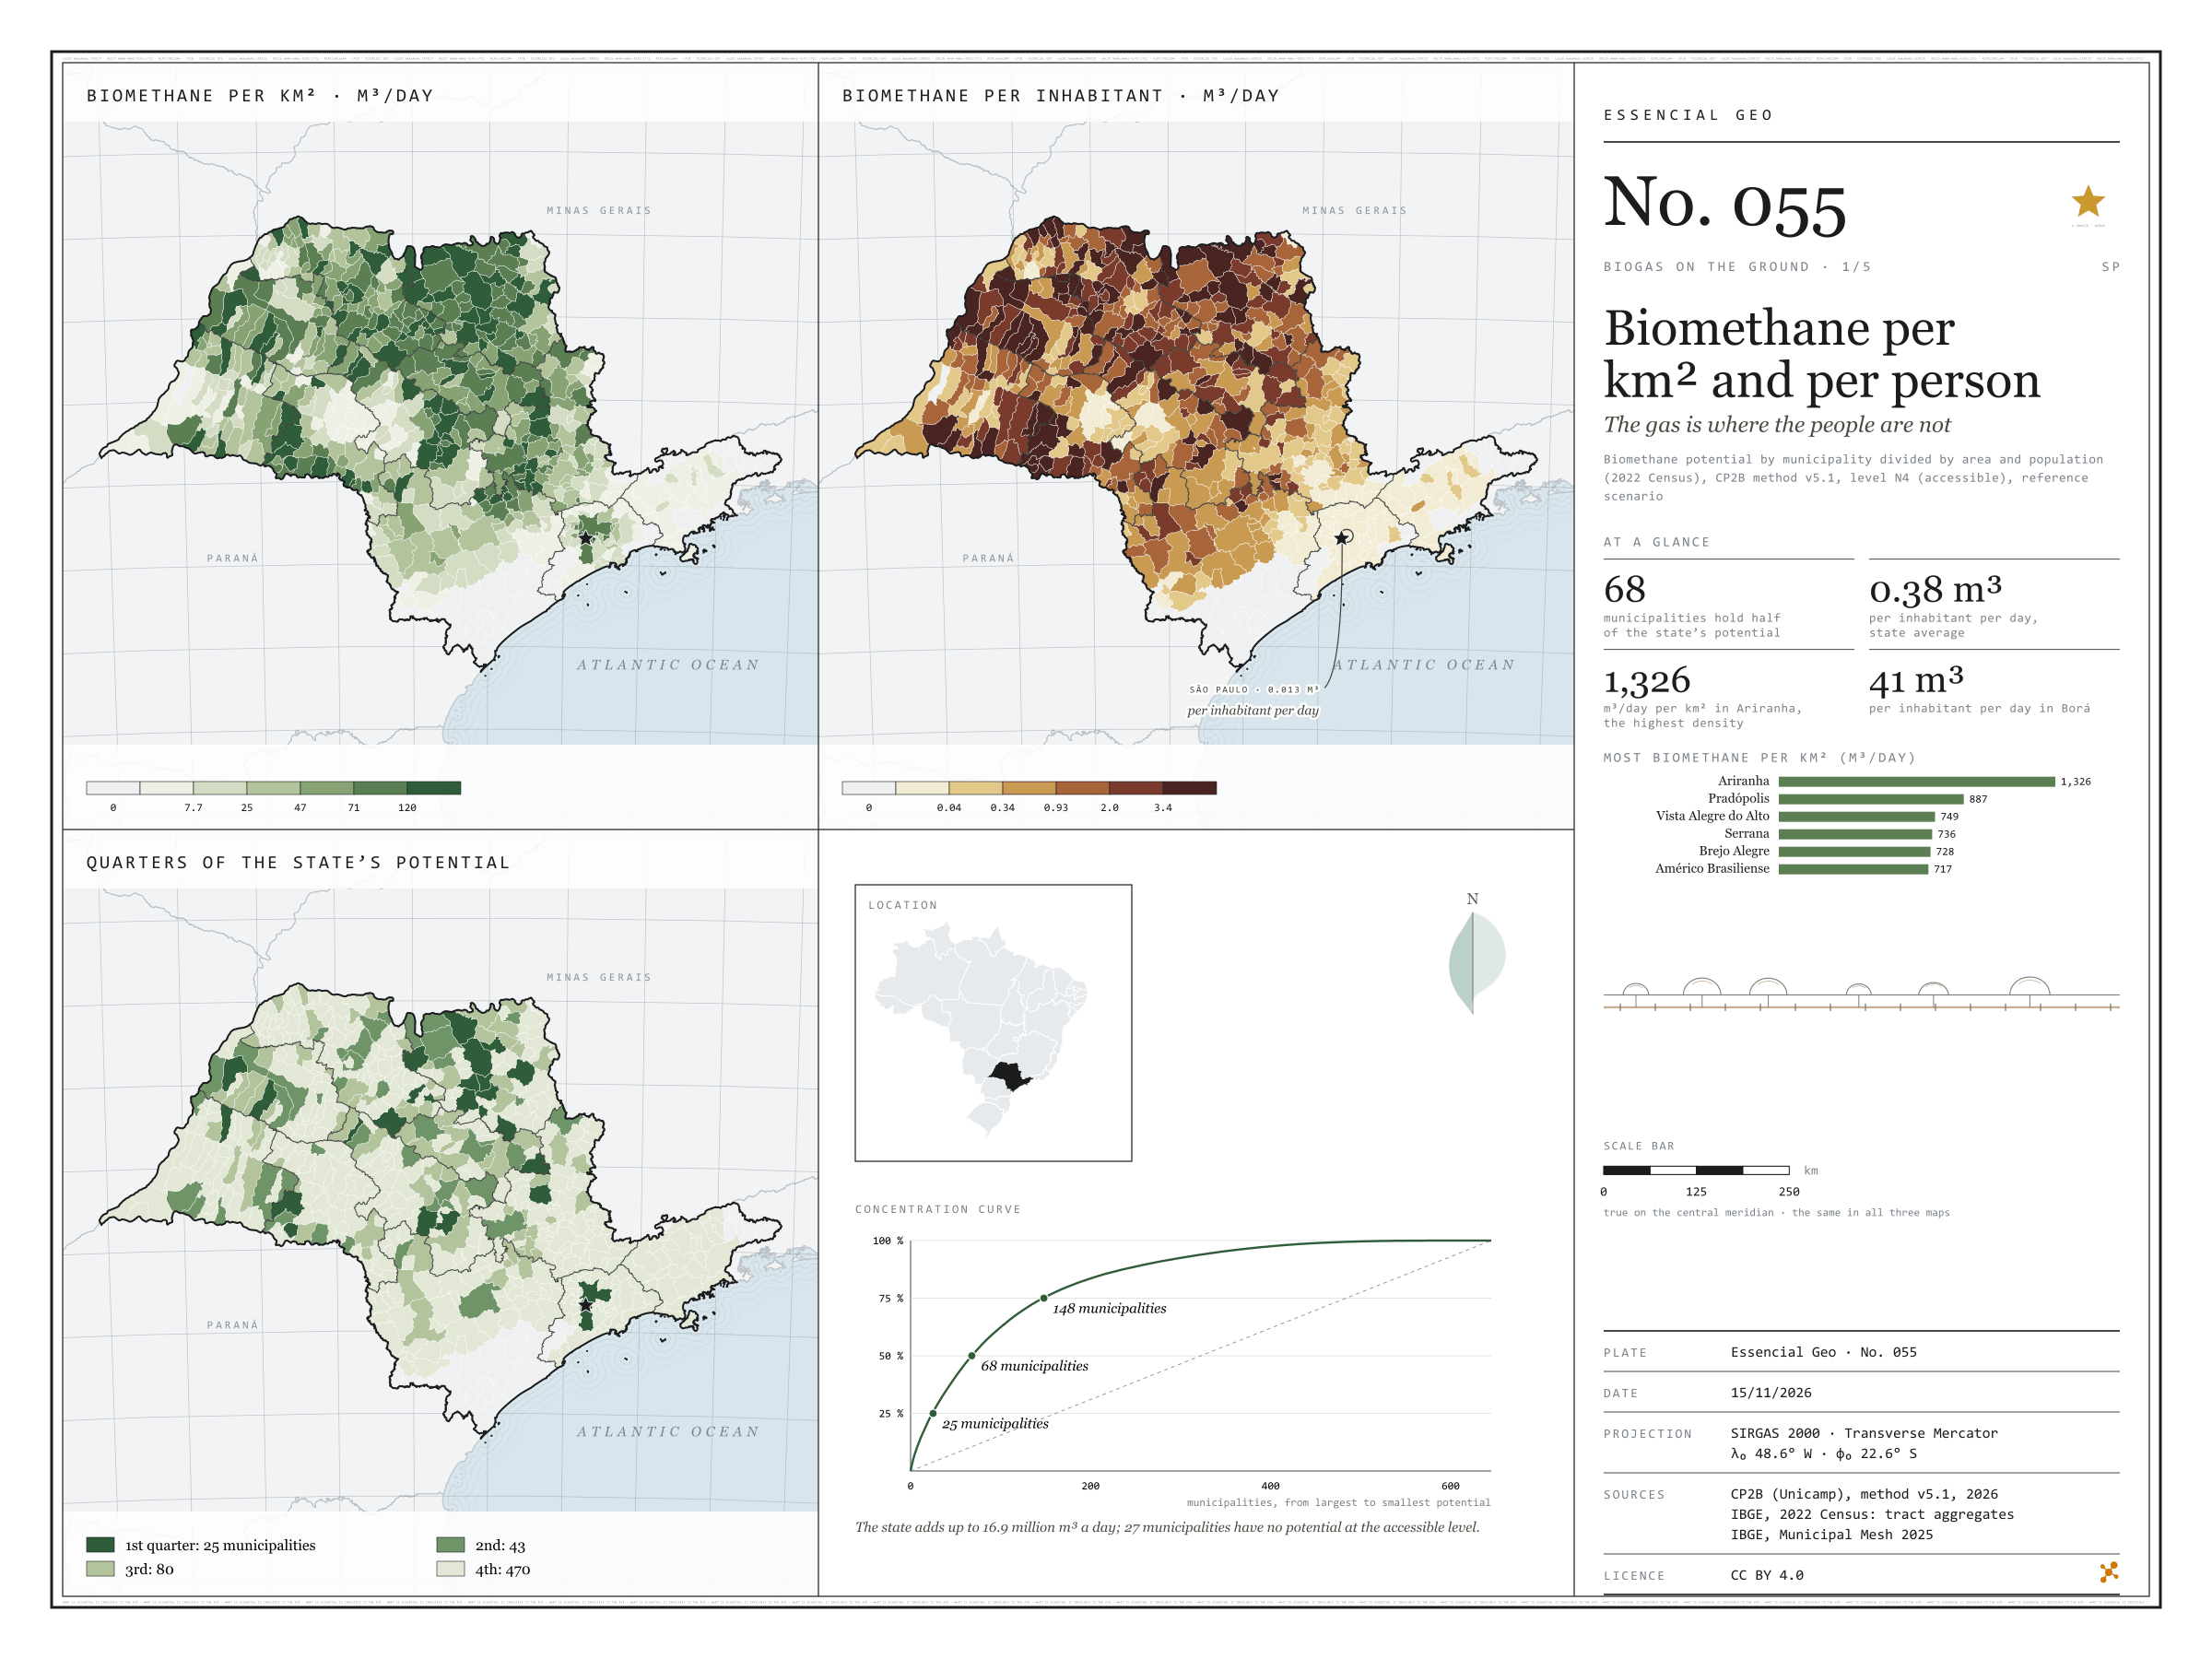
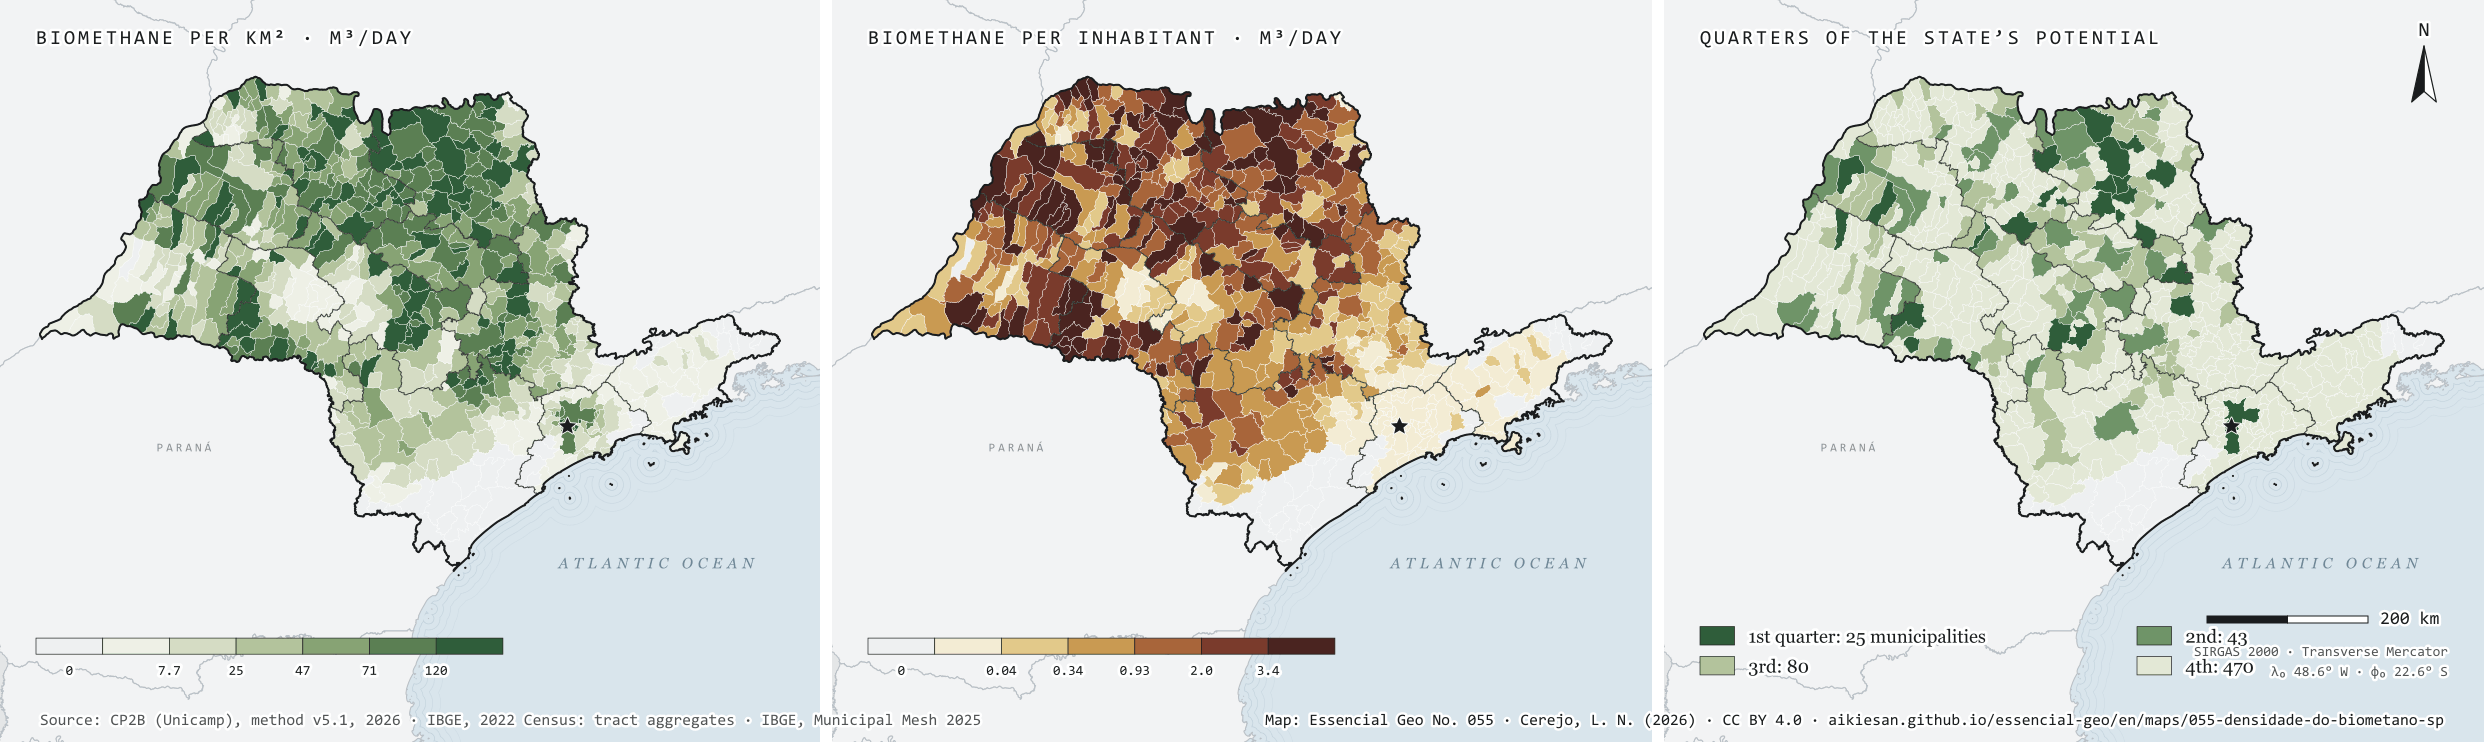
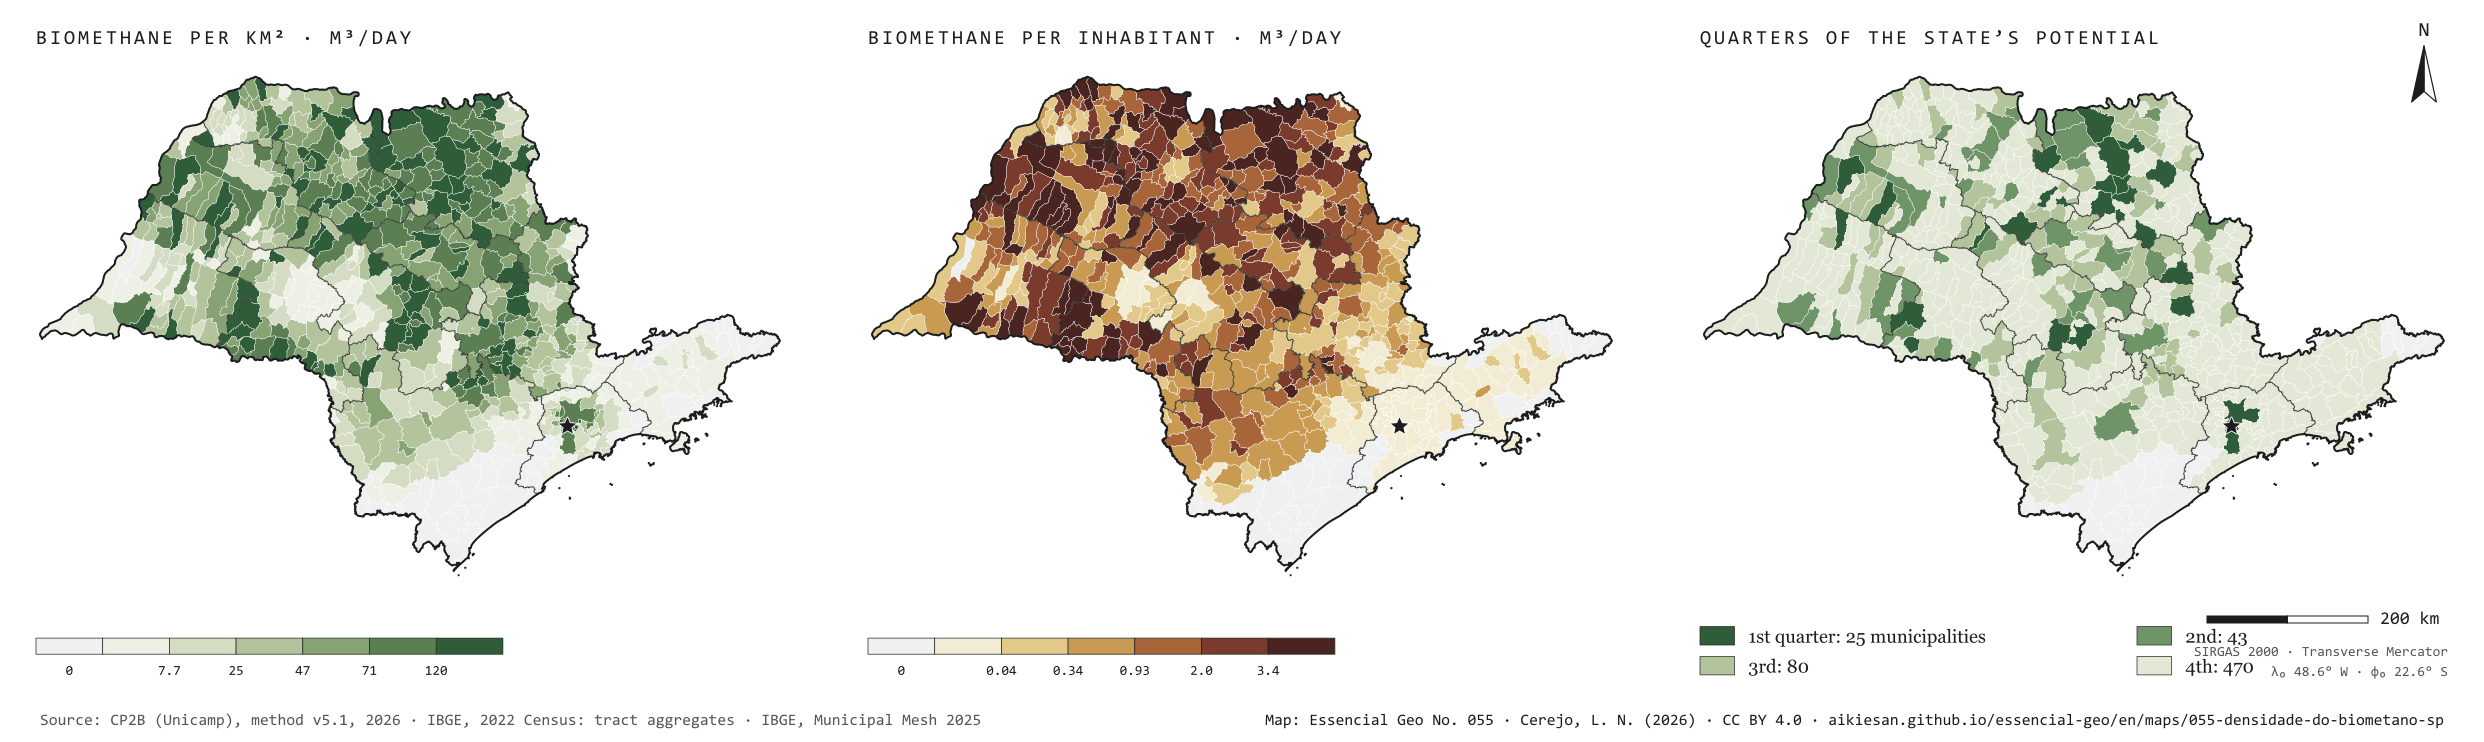
São Paulo’s residues could yield 16.9 million m³ of biomethane a day at the accessible level of the CP2B method. Divided by the population, that is 0.38 m³ per person per day. But the gas does not live where people live. Per km², the potential is densest in the sugarcane north: Ariranha reaches 1,326 m³ a day for each km². Per inhabitant, the leaders are small municipalities full of cane, such as Borá, with 41 m³ per person per day, while the capital, with the largest urban potential, stands at 0.013. The potential is also concentrated: 25 municipalities hold a quarter of the total, 68 hold half and 148 three quarters. Plate 050 shows how much each municipality has; this one shows how much that weighs on the ground and per person. First plate of the collection “Biogas on the ground”.
Technical record · downloads · citation
At a glance
Municipalities by quarter of the state’s potential (municipalities)
1st quarter3.9%
2nd quarter6.7%
3rd quarter12.4%
4th quarter72.9%
no potential4.2%
Biomethane per inhabitant, state average
0.4m³/day
Highest density (Ariranha)
1,326m³/day per km²
Layers
municipiospolygon645 municipalities: potential by group and source, per km² and per inhabitant, quarter of the potential, largest non-cane source and distances to infrastructure
gasodutos_transporteline13 existing transmission gas pipelines in and around SP
gasodutos_distribuicaolineNetworks of 8 gas distributors in and around SP
pontos_entregapoint62 existing gas delivery points
linhas_transmissaoline493 basic-grid transmission lines (230 kV or more)
subestacoespoint185 basic-grid substations
plantas_biometanopoint9 ANP biomethane plants, at the municipality
gd_biogaspointANEEL biogas distributed generation summed by municipality (24)
regioes_intermediariaspolygon11 intermediate geographic regions
Biomethane potential from 17 residues by municipality (CP2B method v5.1, level N4, reference scenario), divided by the 2025 Municipal Mesh area and the 2022 Census population; municipalities ranked by potential and grouped by the quarter of the state total they belong to.
The map without a frame, with legend, scale, reference system and credit written on it: ready for papers, lectures and slides. In two versions: with the basemap (neighbours and sea) or only the mapped area, on white.
CEREJO, Lucas Nakamura. Biometano por km² e por pessoa: o gás está onde a gente não está. Versão 1.0.0. [S. l.]: Essencial, 2026. Conjunto de dados. Disponível em: https://aikiesan.github.io/essencial-geo/en/maps/055-densidade-do-biometano-sp/. Acesso em: 10 nov. 2026.
Cerejo, L. N. (2026). Biometano por km² e por pessoa: o gás está onde a gente não está [Biomethane per km² and per person: The gas is where the people are not] (Version 1.0.0) [Data set]. Essencial. https://aikiesan.github.io/essencial-geo/en/maps/055-densidade-do-biometano-sp/
@dataset{cerejo2026_densidade_do_biometano_sp,
  author    = {Cerejo, Lucas Nakamura},
  title     = {Biometano por km² e por pessoa: O gás está onde a gente não está},
  year      = {2026},
  publisher = {Essencial},
  version   = {1.0.0},
  url       = {https://aikiesan.github.io/essencial-geo/en/maps/055-densidade-do-biometano-sp/},
  language  = {portuguese},
  note      = {English title: Biomethane per km² and per person: The gas is where the people are not. Licence CC BY 4.0}
}
Sludge gas only exists where sewage reaches the plant
Fig. 054São Paulo State (SP)EPSG:4674Source: IBGE, CP2B (Unicamp)
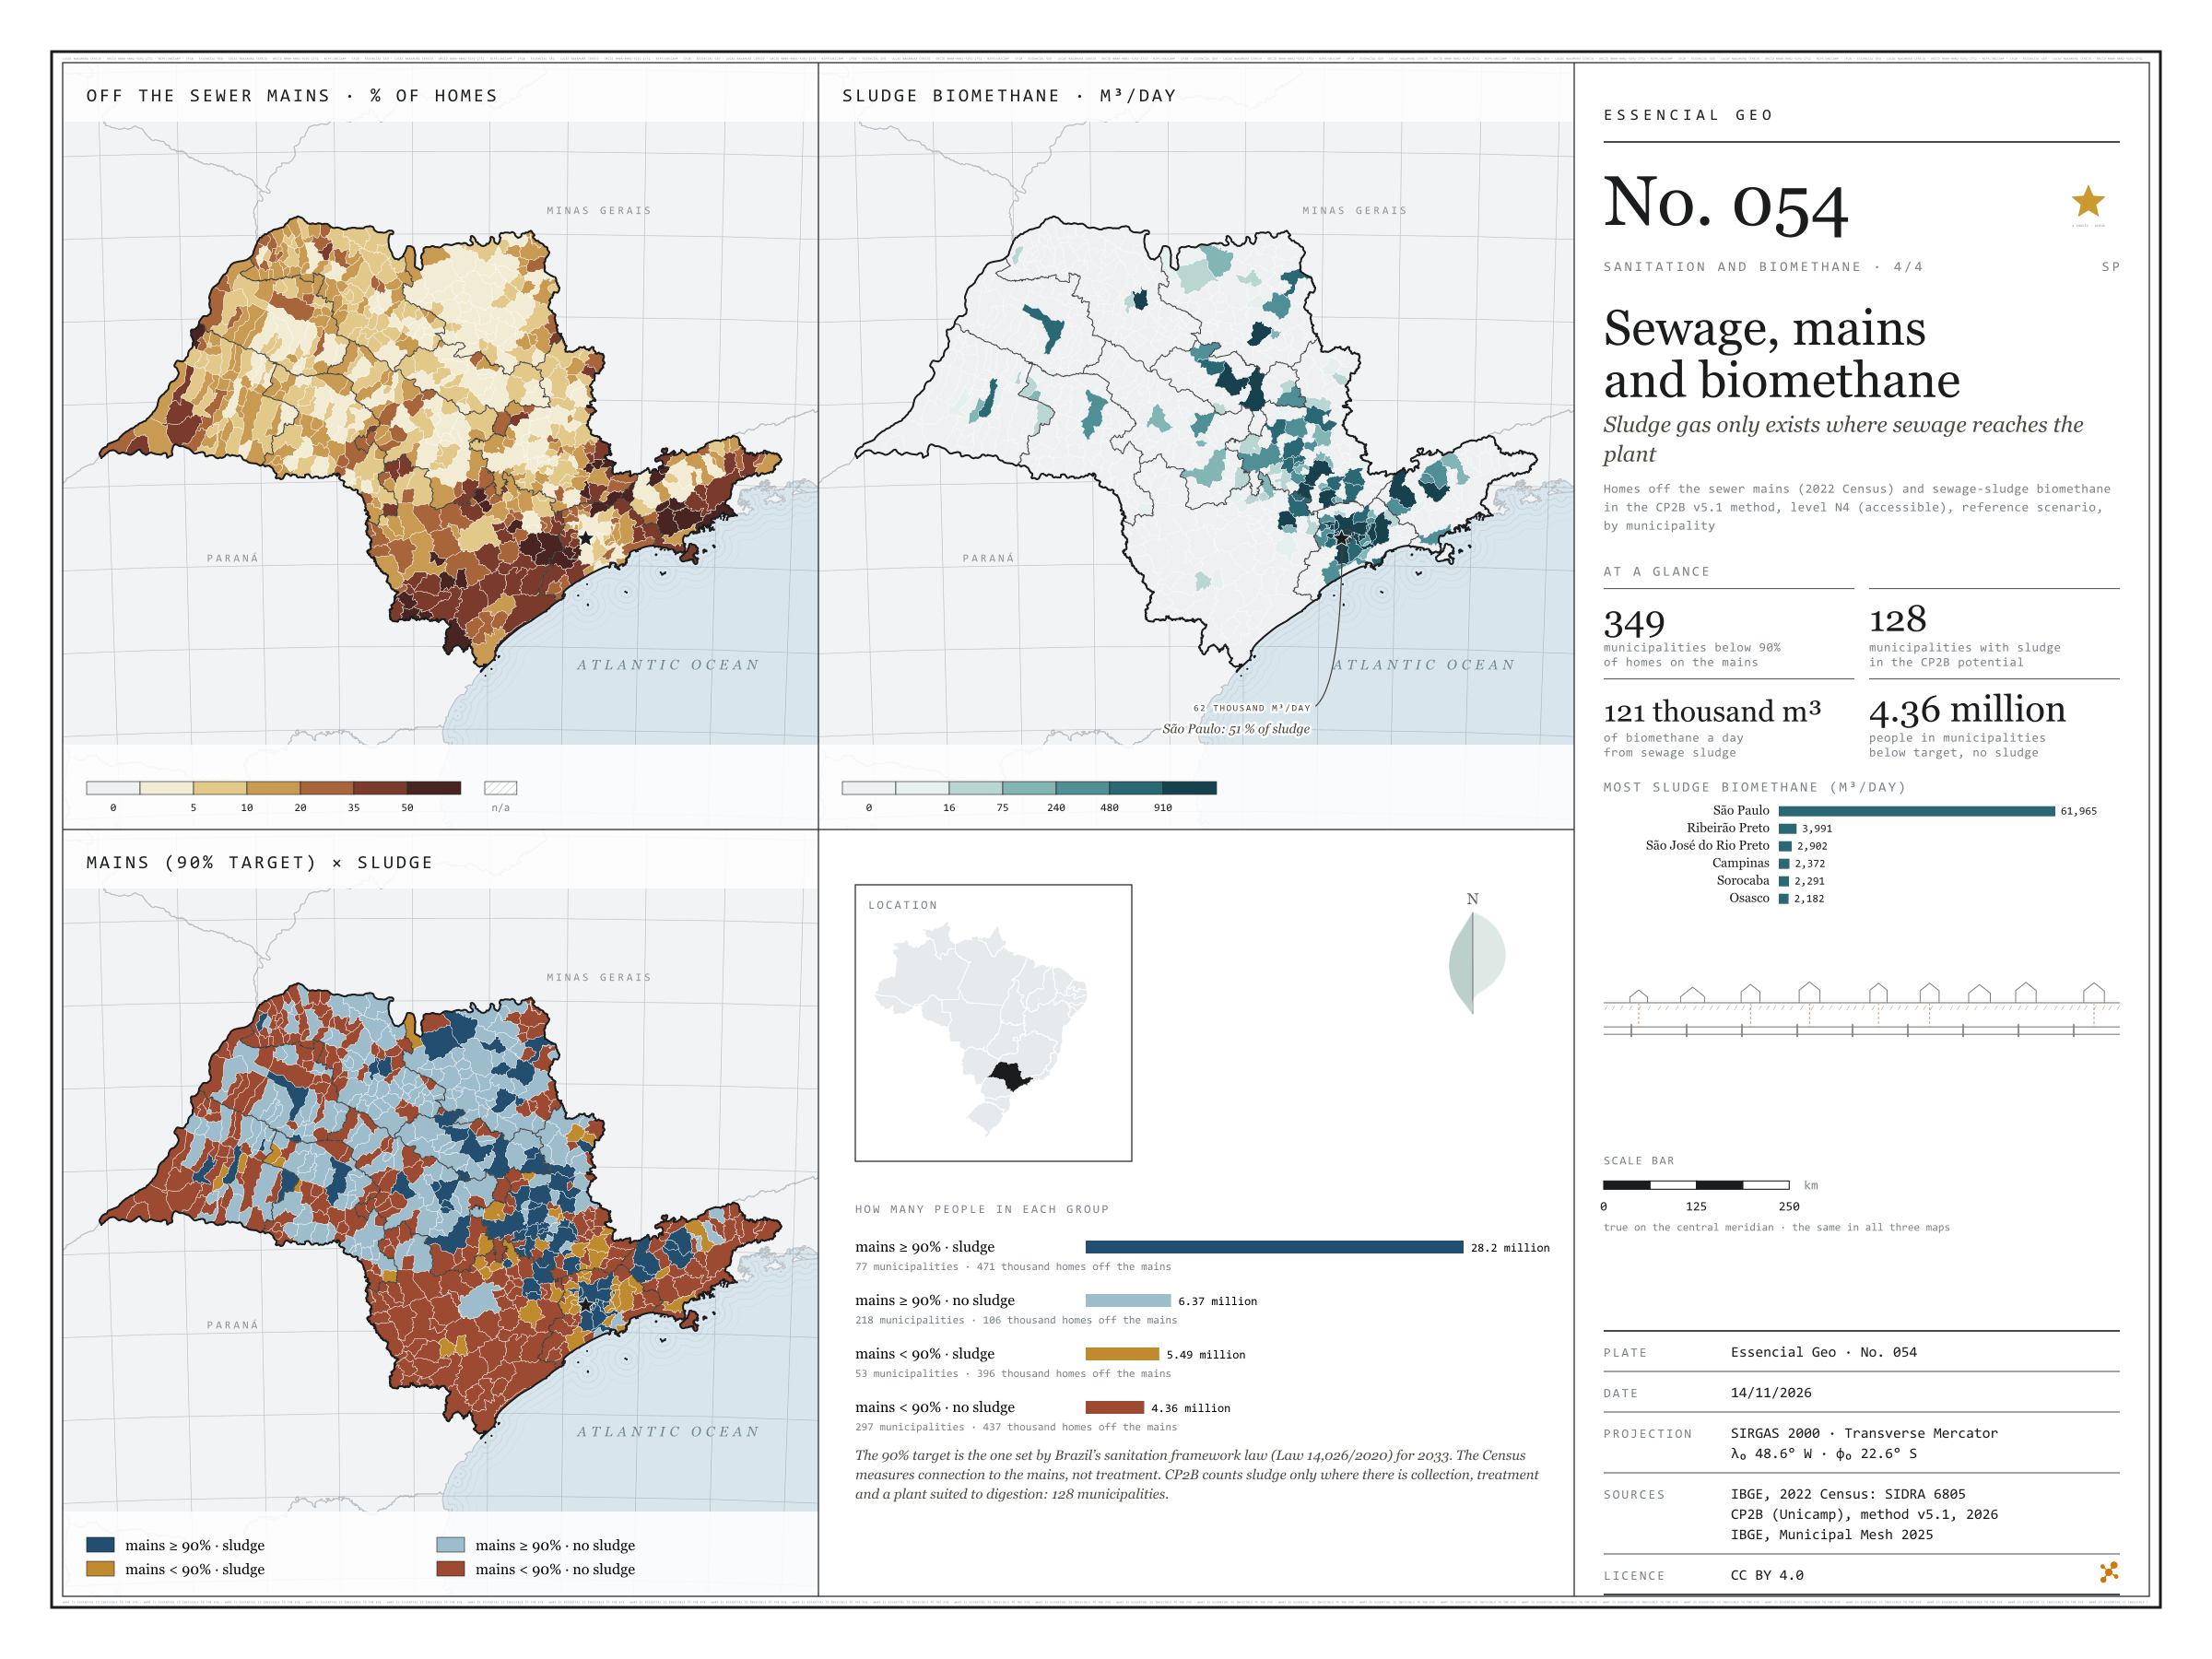
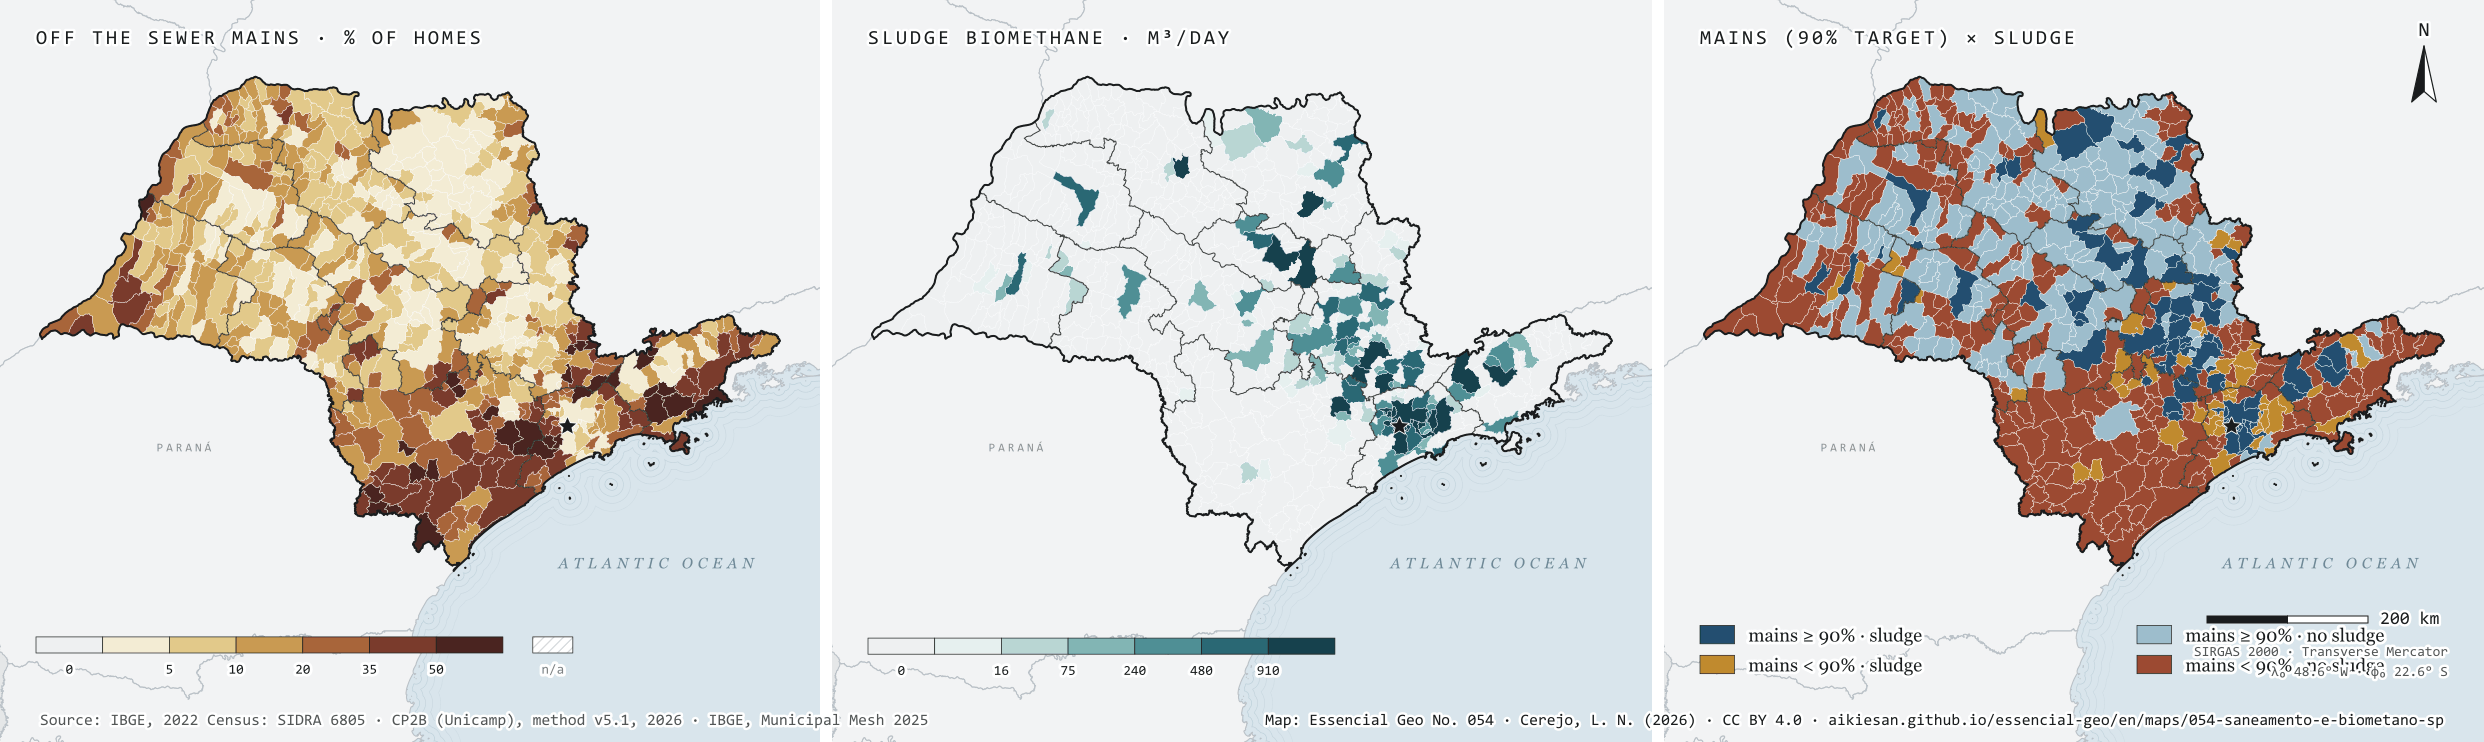
Sludge from sewage plants becomes biomethane, but only where sewage is collected and treated at a plant suited to digestion. Under the CP2B method, that gives São Paulo 121,000 m³ of biomethane a day, in only 128 of its 645 municipalities, and the capital accounts for 51%. Beside it, the 2022 Census: 349 municipalities still have fewer than 90% of households on the mains, the target of the sanitation legal framework for 2033. The crossing separates four groups. 77 municipalities, with 28.2 million people, already pass the target and have sludge; 297, with 4.36 million, are below the target and have no sludge at all, and add up to 437,000 households off the mains. Bringing the mains to those places is the condition for their sewage to count towards the gas. Last plate of the collection “Sanitation and biomethane”.
Technical record · downloads · citation
At a glance
People by mains and sludge group (people)
mains ≥ 90% · with sludge63.5%
mains ≥ 90% · no sludge14.3%
mains < 90% · with sludge12.4%
mains < 90% · no sludge9.8%
Biomethane from sewage sludge
121,403m³/day
128 municipalities; 61,965 m³/day in the capital
Municipalities below 90% of households on the mains
349municipalities
9.84 million people
Layers
municipiospolygon645 municipalities: people, households, sewage off the mains, uncollected rubbish, biomethane from sludge and rubbish, and crossing group
regioes_intermediariaspolygon11 intermediate geographic regions
Share of households off the sewage mains (SIDRA 6805) and biomethane from sewage sludge under the CP2B v5.1 method, level N4 (accessible), reference scenario, by municipality; municipalities are crossed by the 90% mains target and by whether the potential includes sludge.
The map without a frame, with legend, scale, reference system and credit written on it: ready for papers, lectures and slides. In two versions: with the basemap (neighbours and sea) or only the mapped area, on white.
CEREJO, Lucas Nakamura. Esgoto, rede e biometano: o gás do lodo só existe onde o esgoto chega à estação. Versão 1.0.0. [S. l.]: Essencial, 2026. Conjunto de dados. Disponível em: https://aikiesan.github.io/essencial-geo/en/maps/054-saneamento-e-biometano-sp/. Acesso em: 10 nov. 2026.
Cerejo, L. N. (2026). Esgoto, rede e biometano: o gás do lodo só existe onde o esgoto chega à estação [Sewage, mains and biomethane: Sludge gas only exists where sewage reaches the plant] (Version 1.0.0) [Data set]. Essencial. https://aikiesan.github.io/essencial-geo/en/maps/054-saneamento-e-biometano-sp/
@dataset{cerejo2026_saneamento_e_biometano_sp,
  author    = {Cerejo, Lucas Nakamura},
  title     = {Esgoto, rede e biometano: O gás do lodo só existe onde o esgoto chega à estação},
  year      = {2026},
  publisher = {Essencial},
  version   = {1.0.0},
  url       = {https://aikiesan.github.io/essencial-geo/en/maps/054-saneamento-e-biometano-sp/},
  language  = {portuguese},
  note      = {English title: Sewage, mains and biomethane: Sludge gas only exists where sewage reaches the plant. Licence CC BY 4.0}
}
Fig. 049São Paulo state (SP)EPSG:4674Source: CP2B (Unicamp), ANA, IBGE
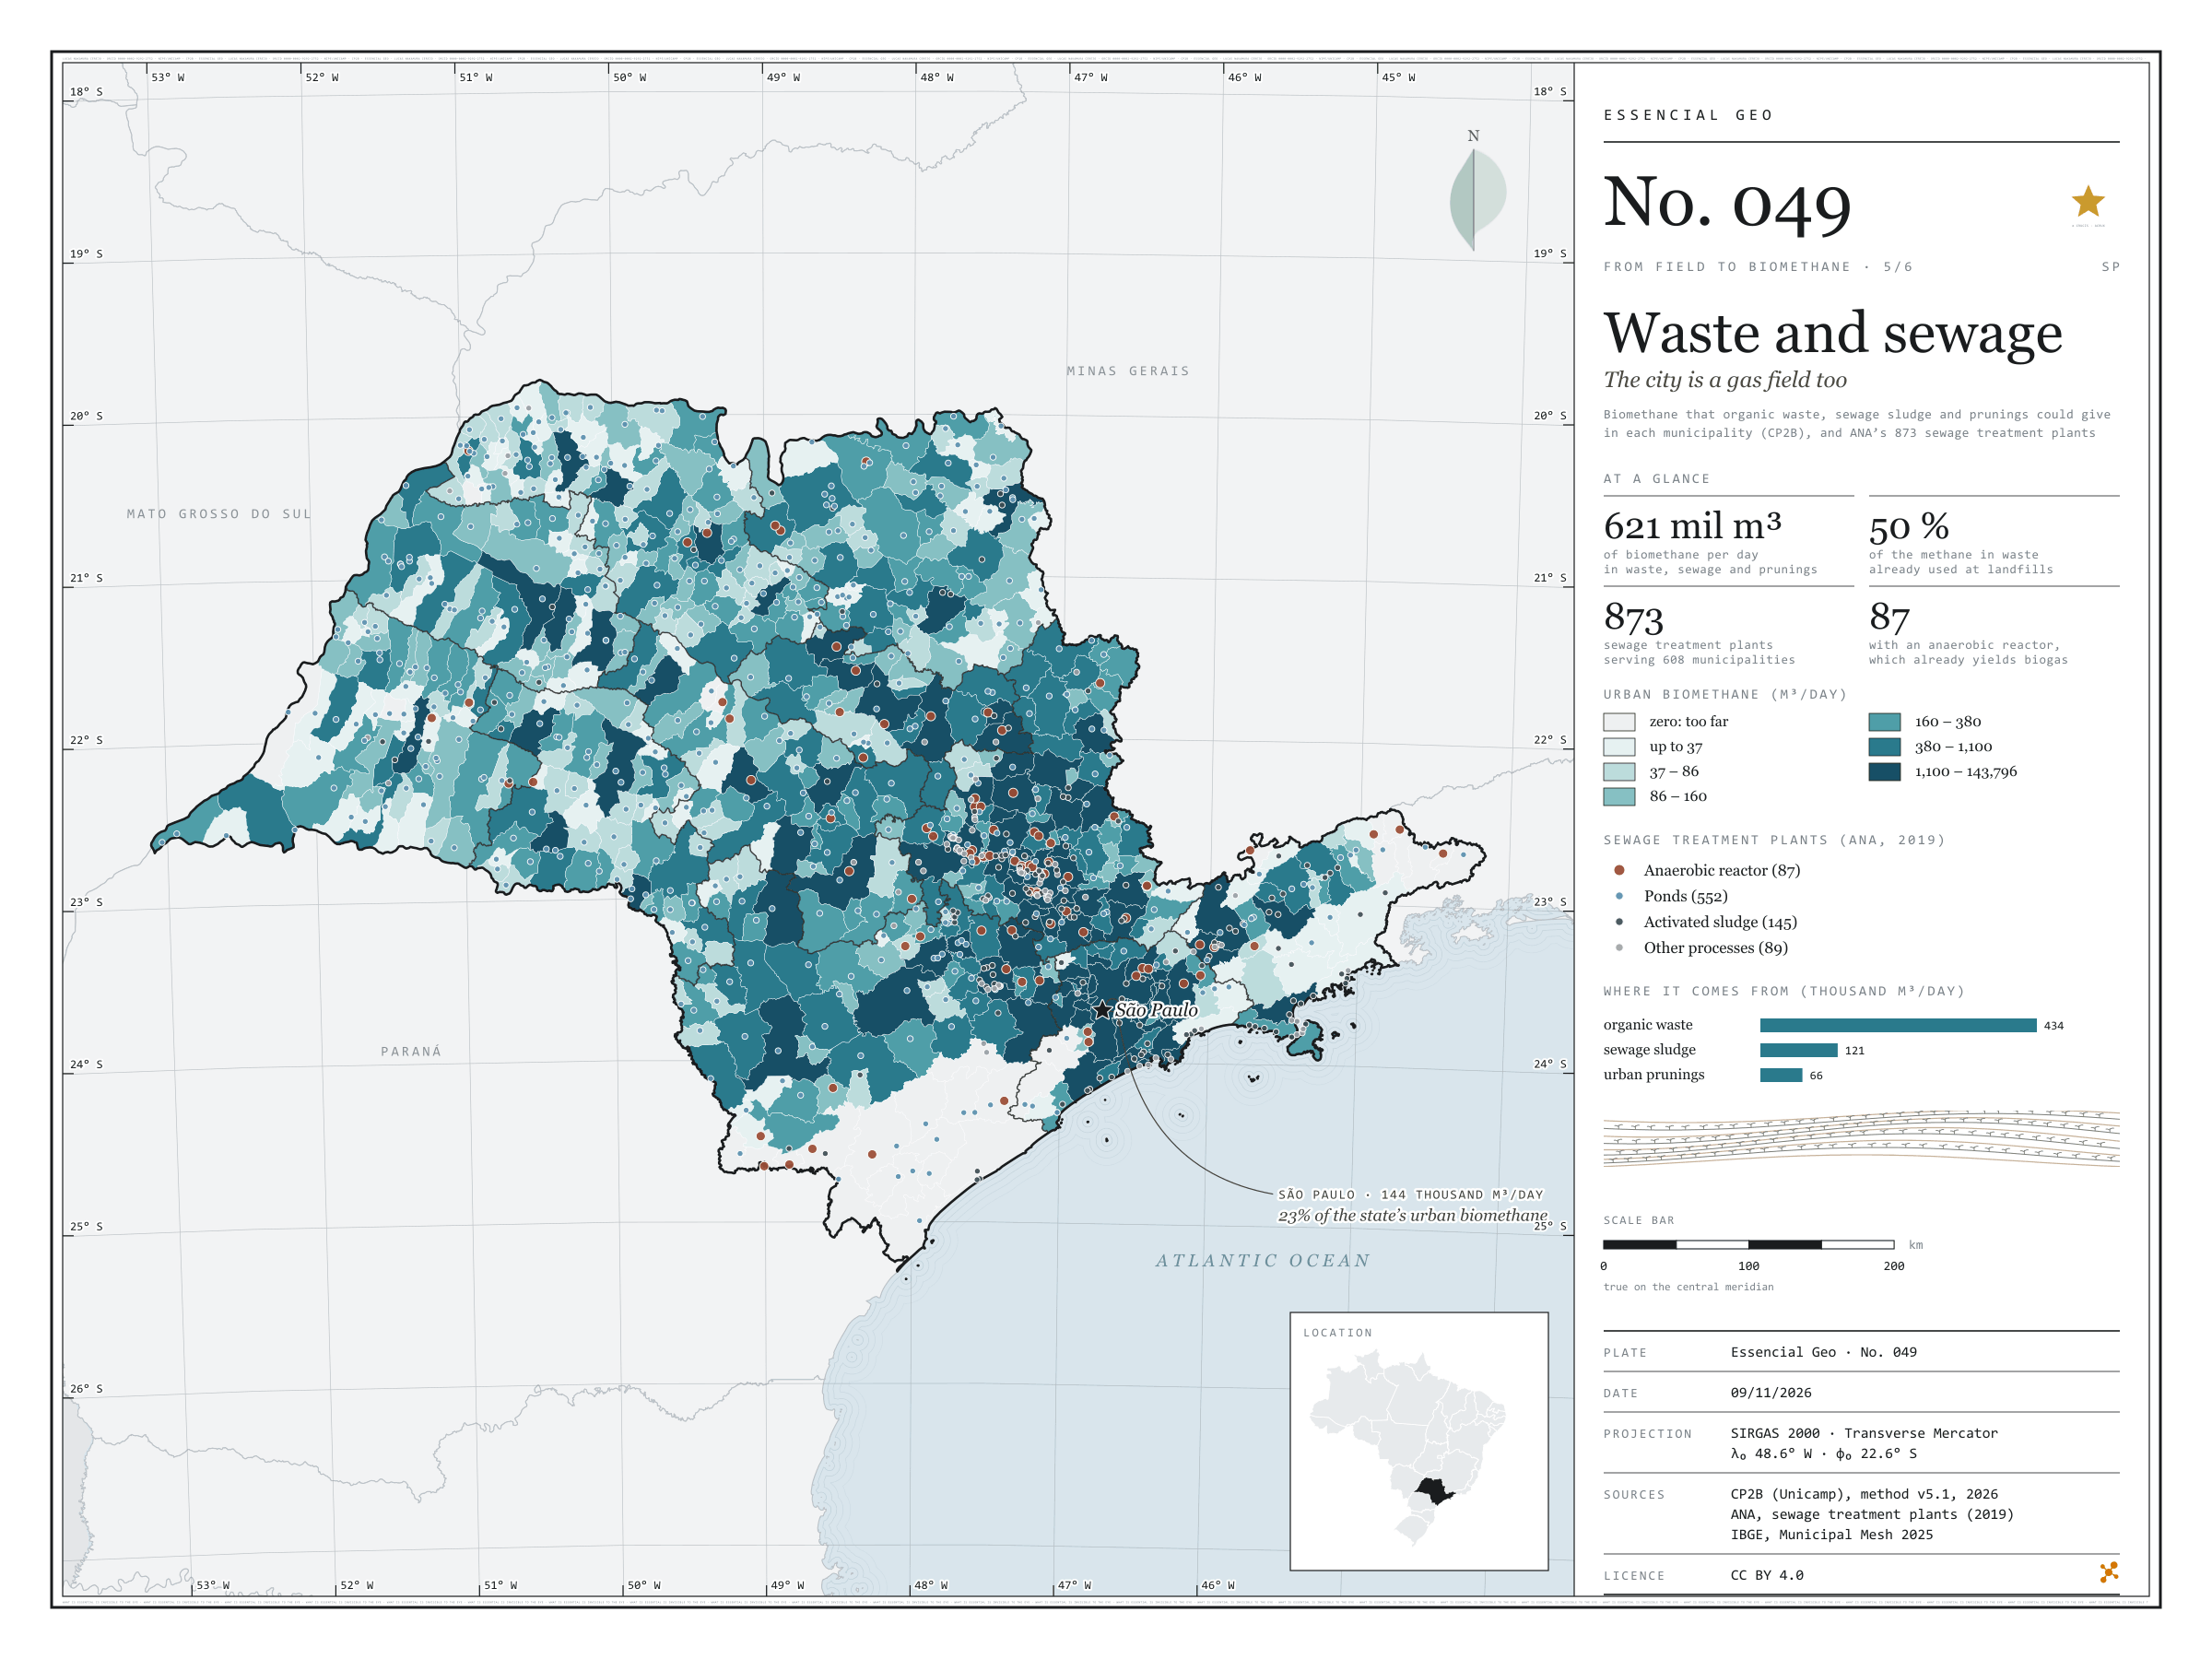
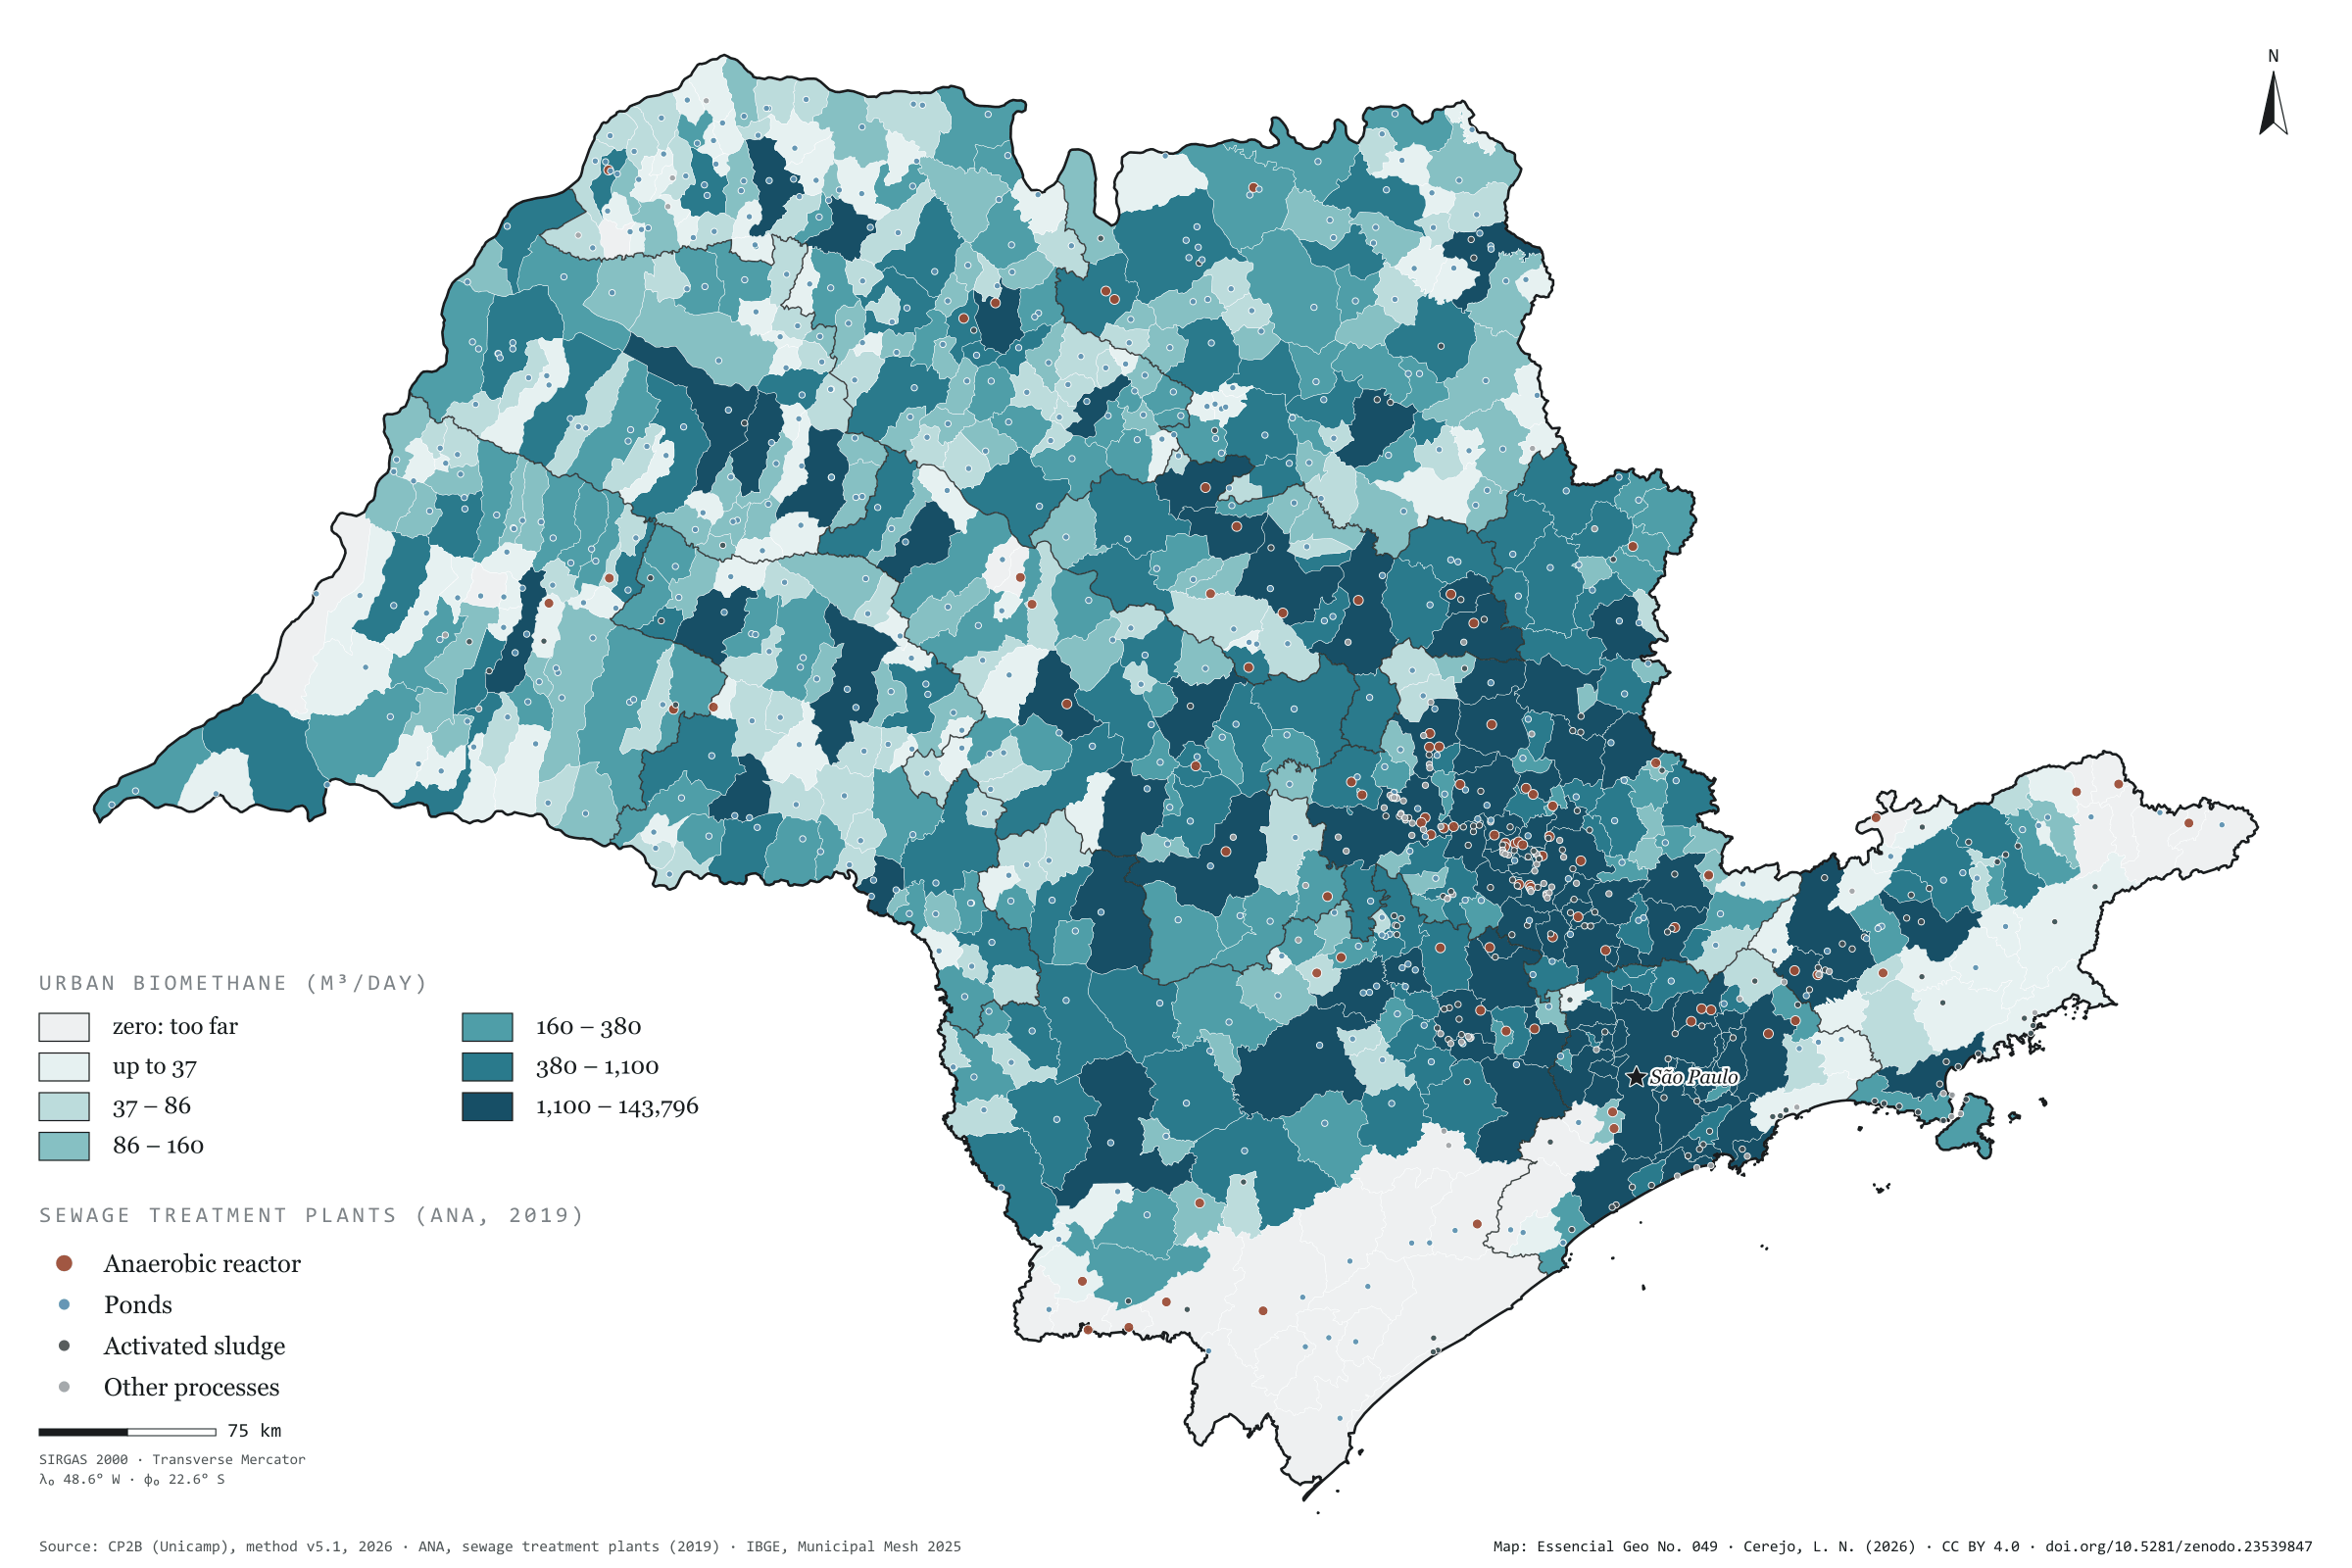
The organic waste, sewage sludge and prunings of São Paulo’s towns and cities could give 621,000 m³ of biomethane a day under the CP2B method: 434,000 from waste, 121,000 from sludge and 66,000 from prunings. That is little next to the countryside, under 4% of the state total, but it lies where almost everyone lives. The city of São Paulo accounts for 23% and its region for 39%. Half the methane the waste could generate is already captured at landfills, and the method deducts that share. The map also shows the 873 sewage treatment plants registered by ANA, serving 608 municipalities. Most treat sewage in ponds (552); 87 use anaerobic reactors, which produce biogas during treatment. Fifth plate of the collection “From field to biomethane”.
Technical record · downloads · citation
At a glance
Where urban biomethane comes from (m³/day)
Organic waste69.8%
Sewage sludge19.5%
Urban prunings10.6%
Waste methane already used
446,934m³ CH₄/day
50% of the 889,450 m³ of methane a day that organic waste could generate, deducted by the method
Largest urban potentials (m³/day)
São Paulo143,796
Campinas28,064
Sorocaba18,094
Piracicaba12,561
São José do Rio Preto12,338
Layers
etespoint873 sewage treatment plants: name, status, process, family, BOD removal and municipalities served
municipiospolygon645 municipalities: biomethane from waste, sludge and prunings (m³/day) and waste methane already used at landfills
regioes_intermediariaspolygon11 intermediate geographic regions
limite_estadualpolygonState boundary
Metadata
Sources
CP2B (Unicamp) — biogas and biomethane potential by municipality, method v5.1 (2026) ANA — Sewage treatment plants (2019 database) (2019) IBGE — Municipal Mesh 2025 (2025)
Biomethane potential of organic waste, sewage sludge and urban prunings at the accessible level of the CP2B method, by municipality, in six quantile classes; ANA sewage treatment plants, one per code, coloured by process family.
The map without a frame, with legend, scale, reference system and credit written on it: ready for papers, lectures and slides. In two versions: with the basemap (neighbours and sea) or only the mapped area, on white.
CEREJO, Lucas Nakamura. Lixo e esgoto: a cidade também é lavoura de gás. Versão 1.0.0. [S. l.]: Zenodo, 2026. Conjunto de dados. DOI: 10.5281/zenodo.23539847. Disponível em: https://doi.org/10.5281/zenodo.23539847. Acesso em: 10 nov. 2026.
Cerejo, L. N. (2026). Lixo e esgoto: a cidade também é lavoura de gás [Waste and sewage: The city is a gas crop too] (Version 1.0.0) [Data set]. Zenodo. https://doi.org/10.5281/zenodo.23539847
@dataset{cerejo2026_lixo_e_esgoto_sp,
  author    = {Cerejo, Lucas Nakamura},
  title     = {Lixo e esgoto: A cidade também é lavoura de gás},
  year      = {2026},
  publisher = {Zenodo},
  version   = {1.0.0},
  doi       = {10.5281/zenodo.23539847},
  url       = {https://doi.org/10.5281/zenodo.23539847},
  language  = {portuguese},
  note      = {English title: Waste and sewage: The city is a gas crop too. Licence CC BY 4.0}
}
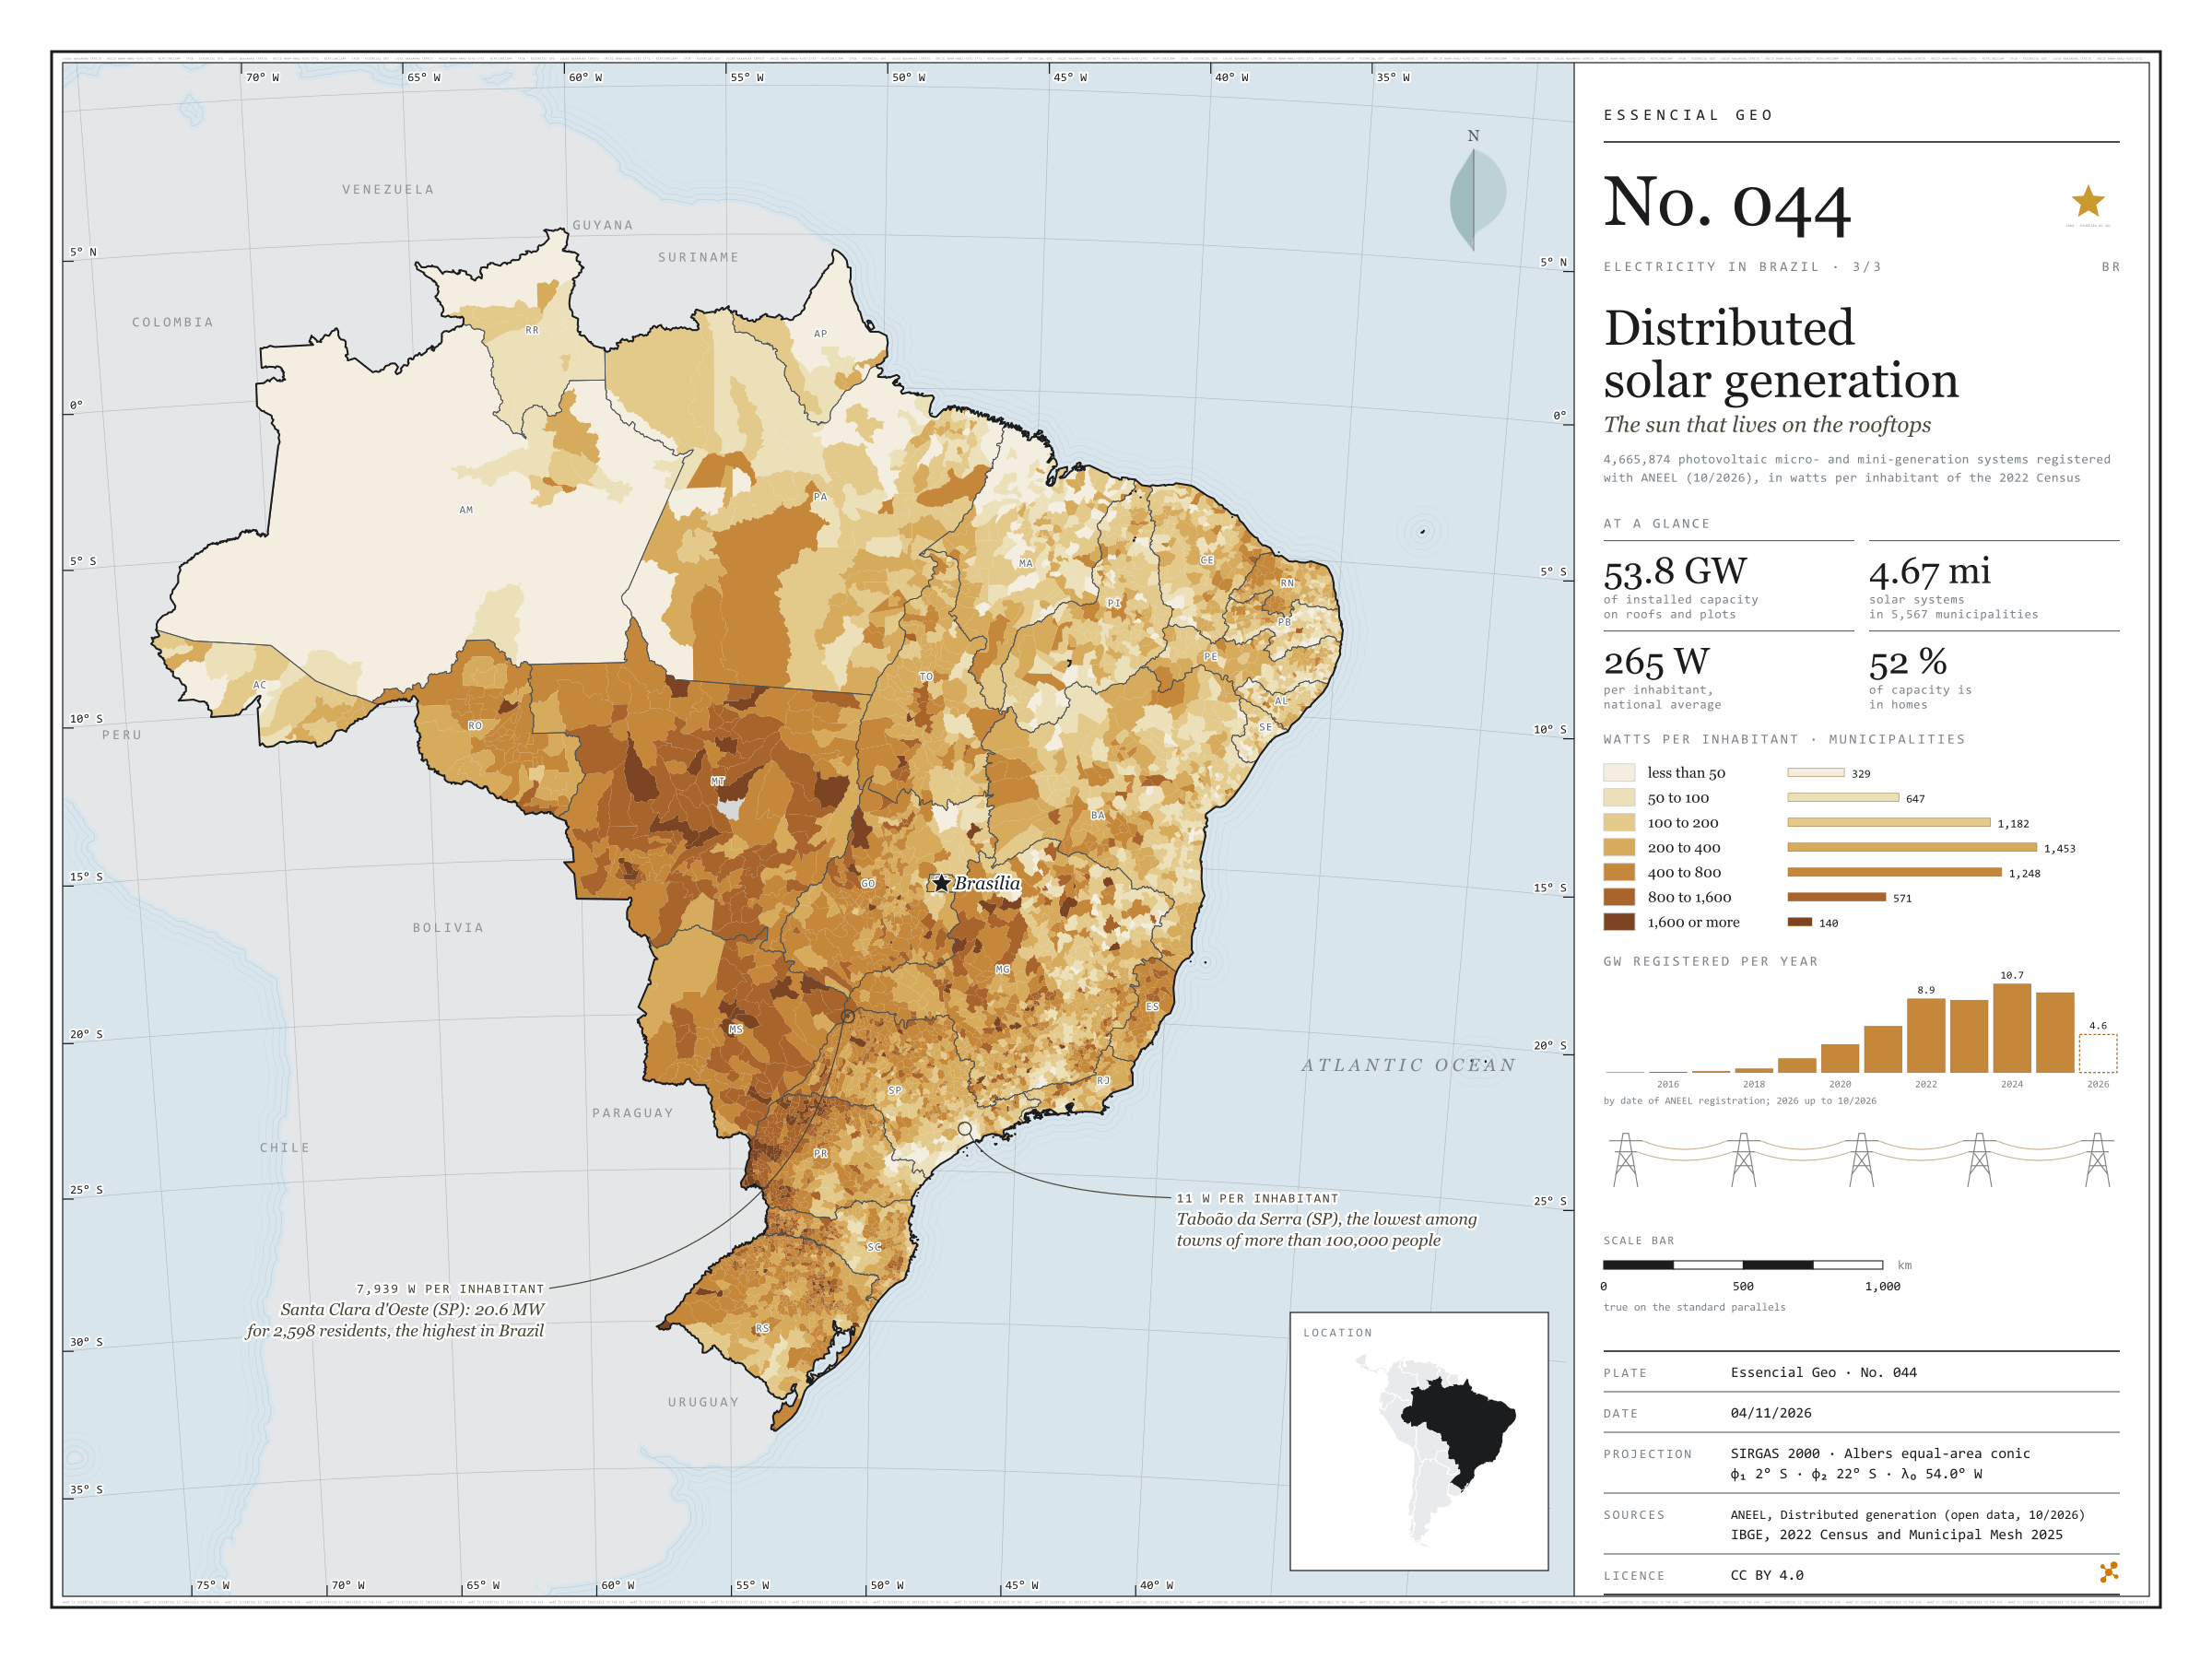
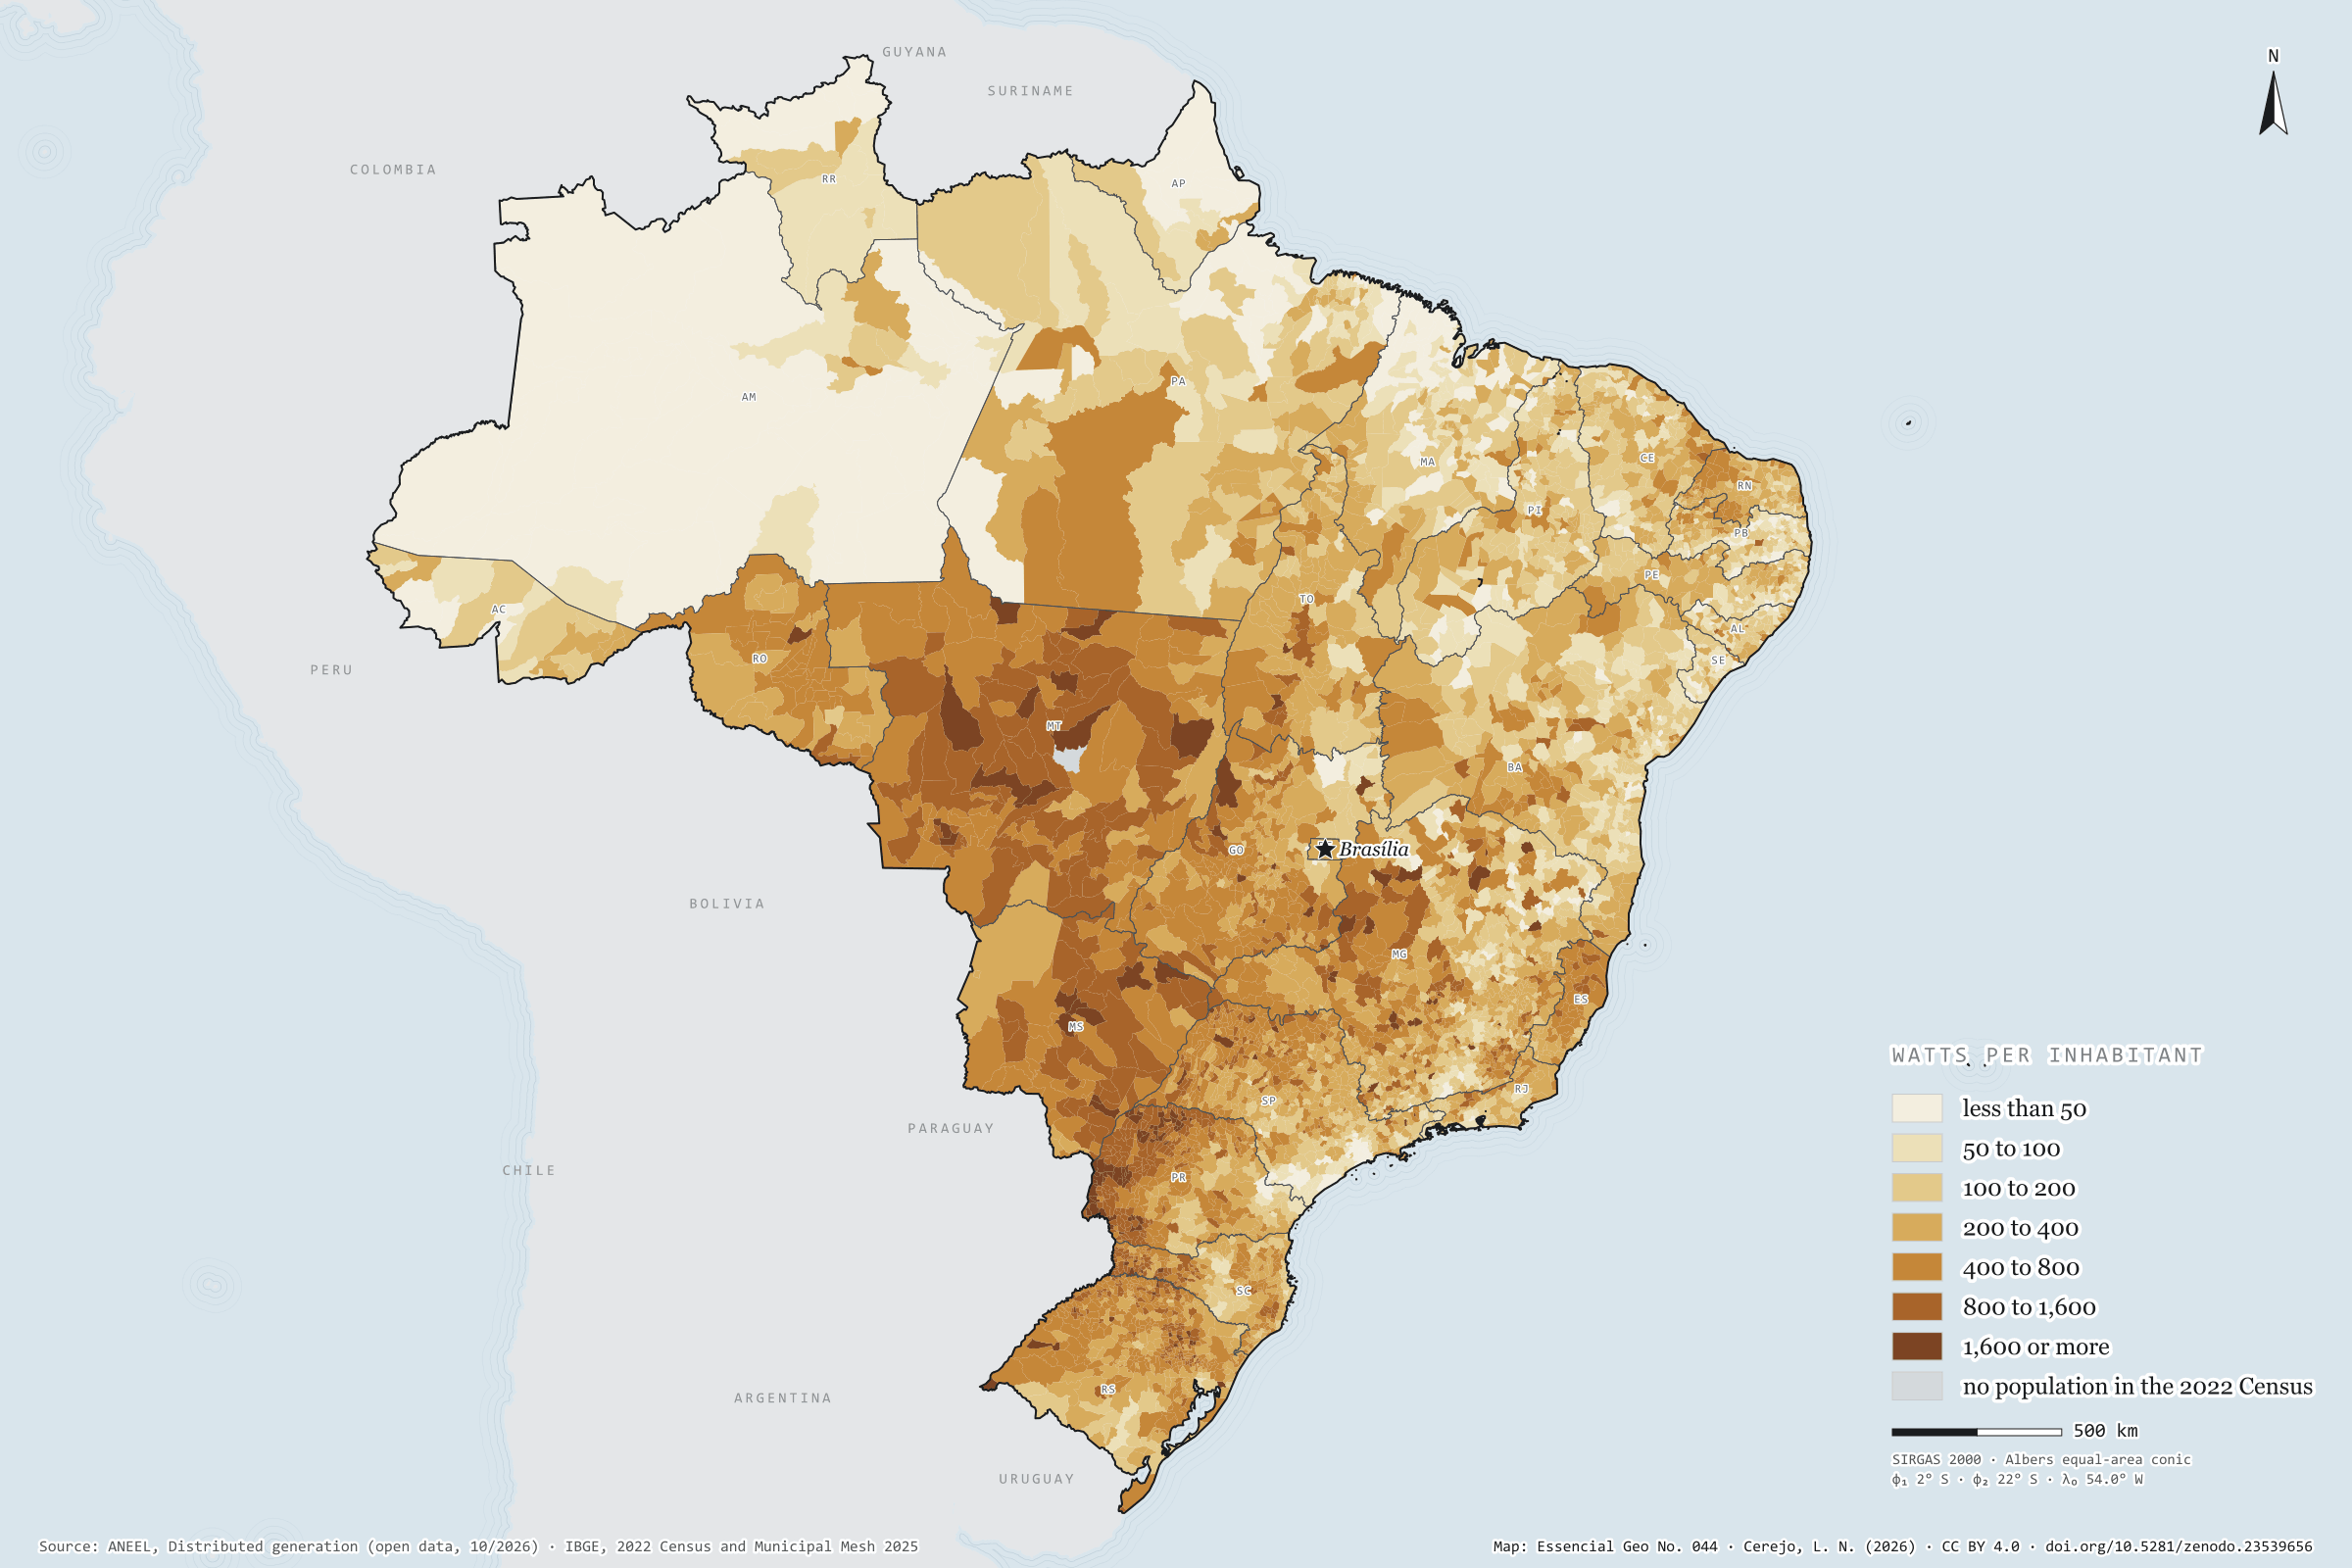
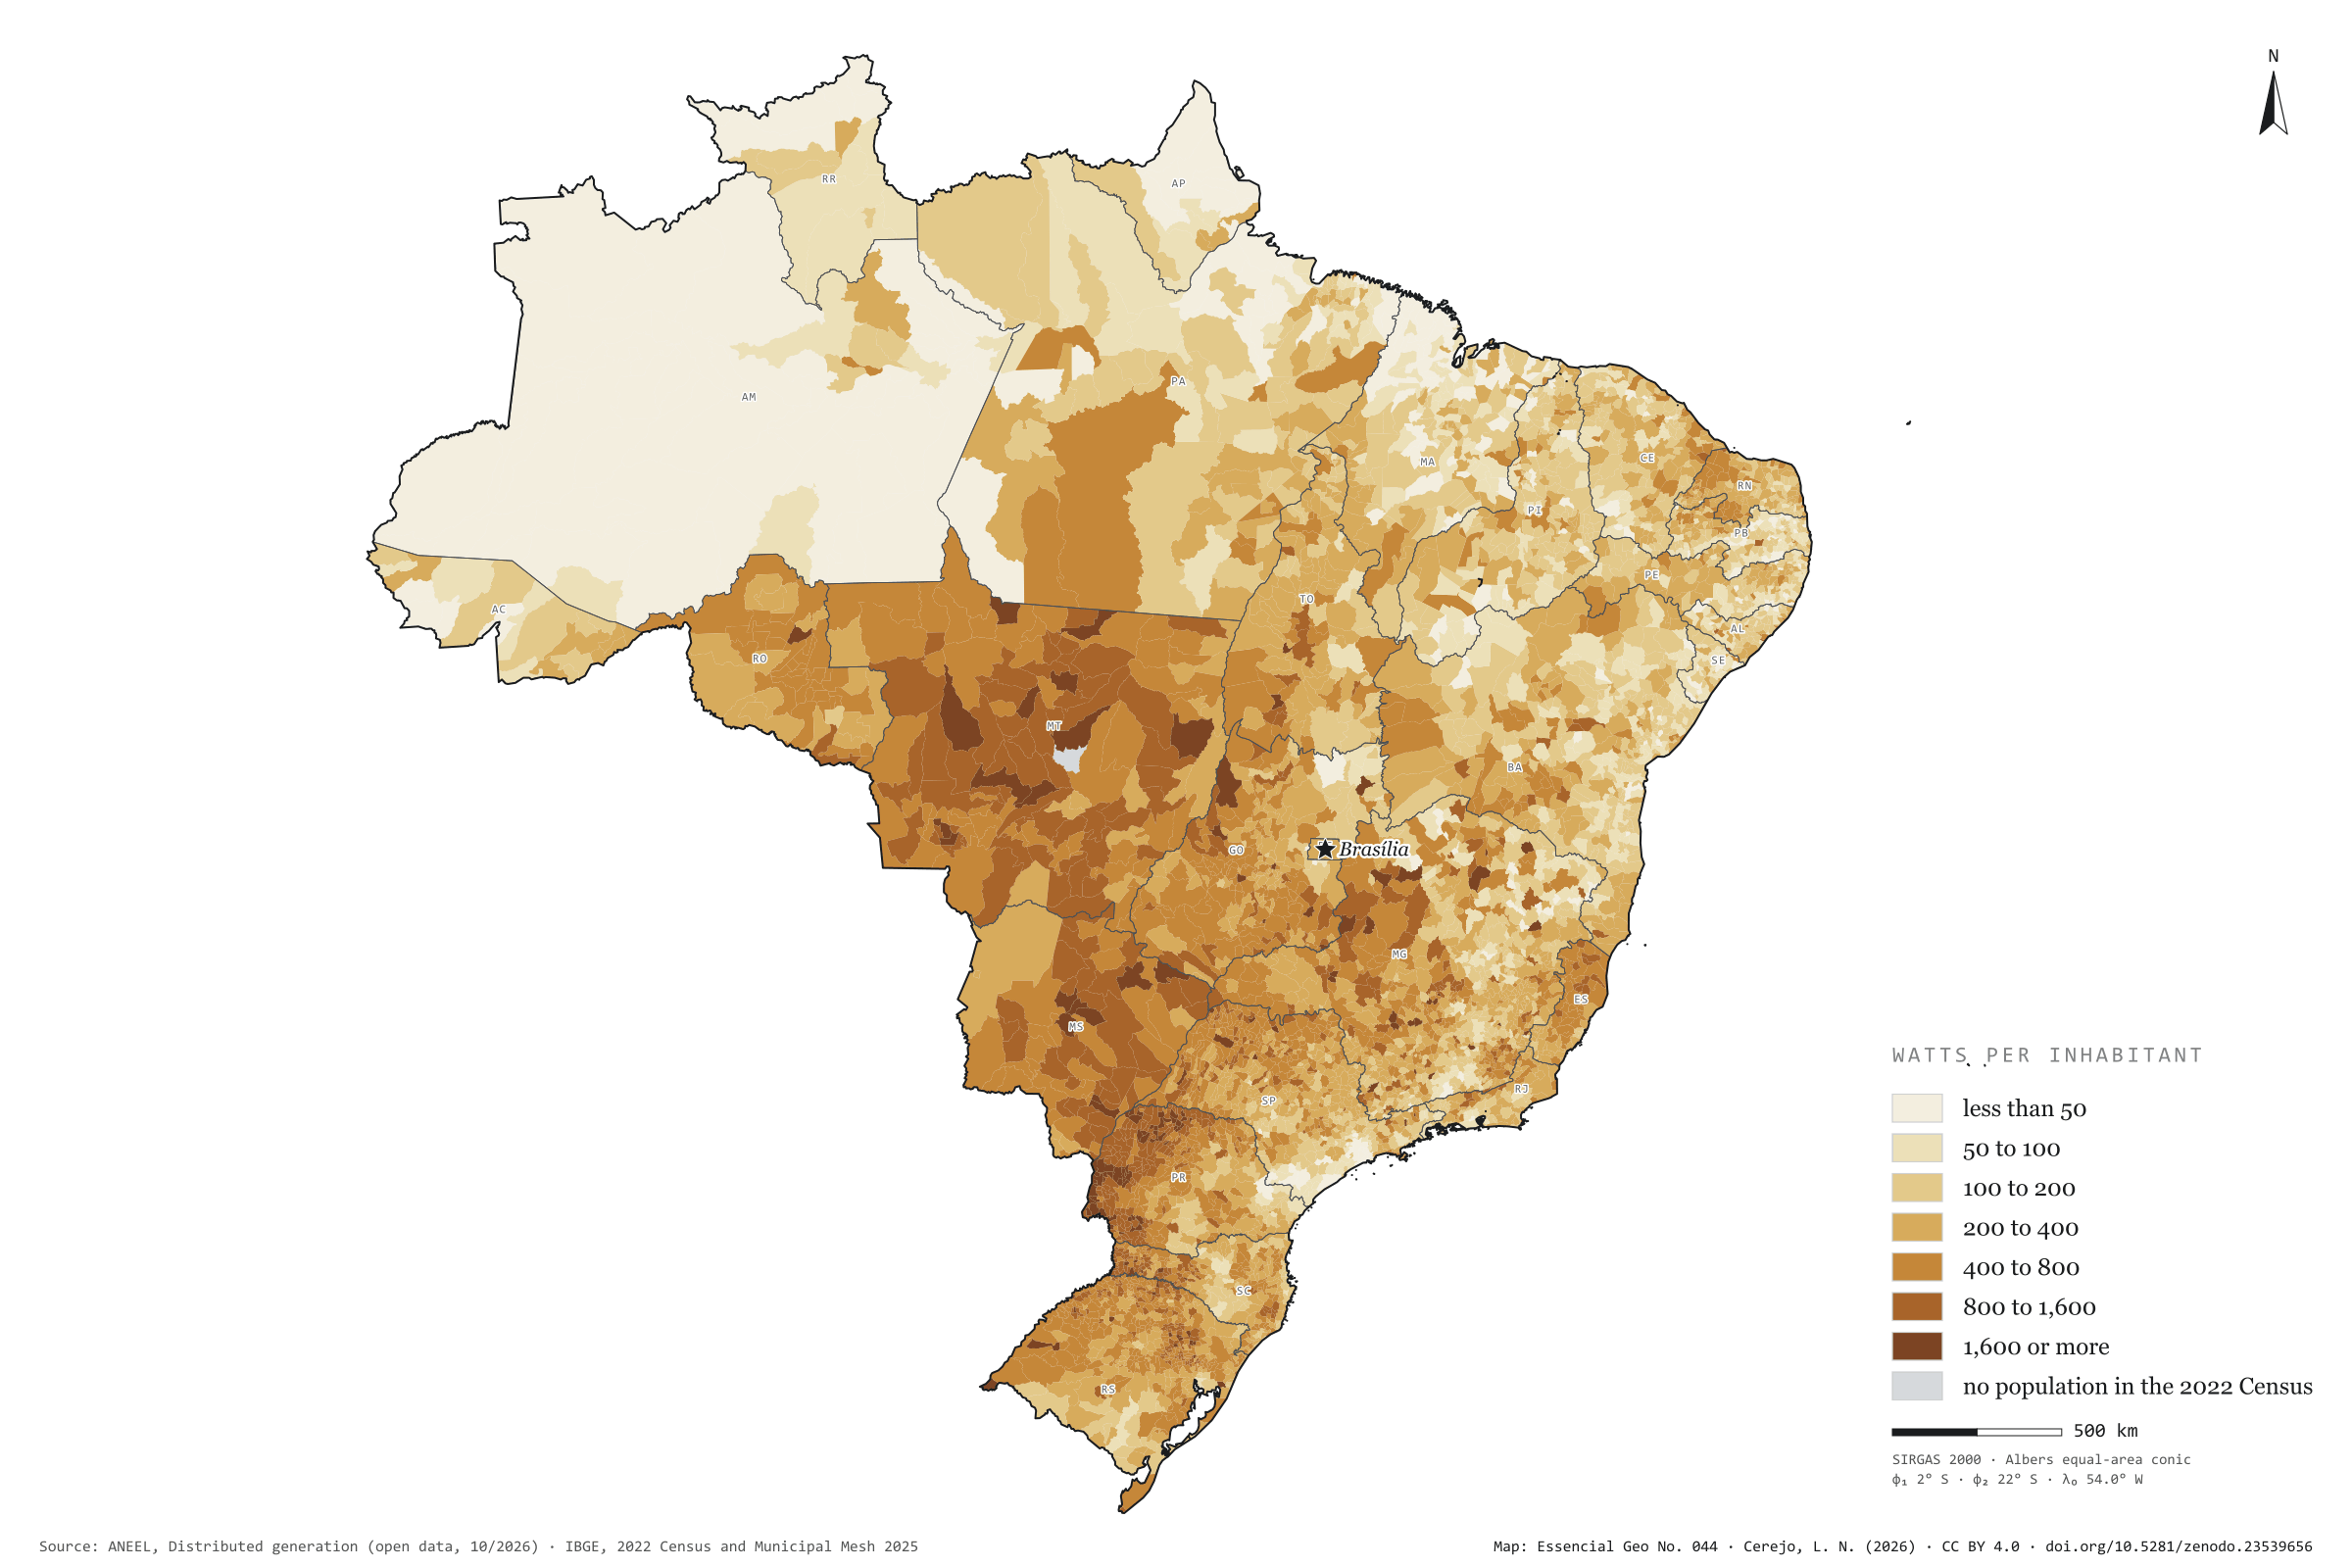
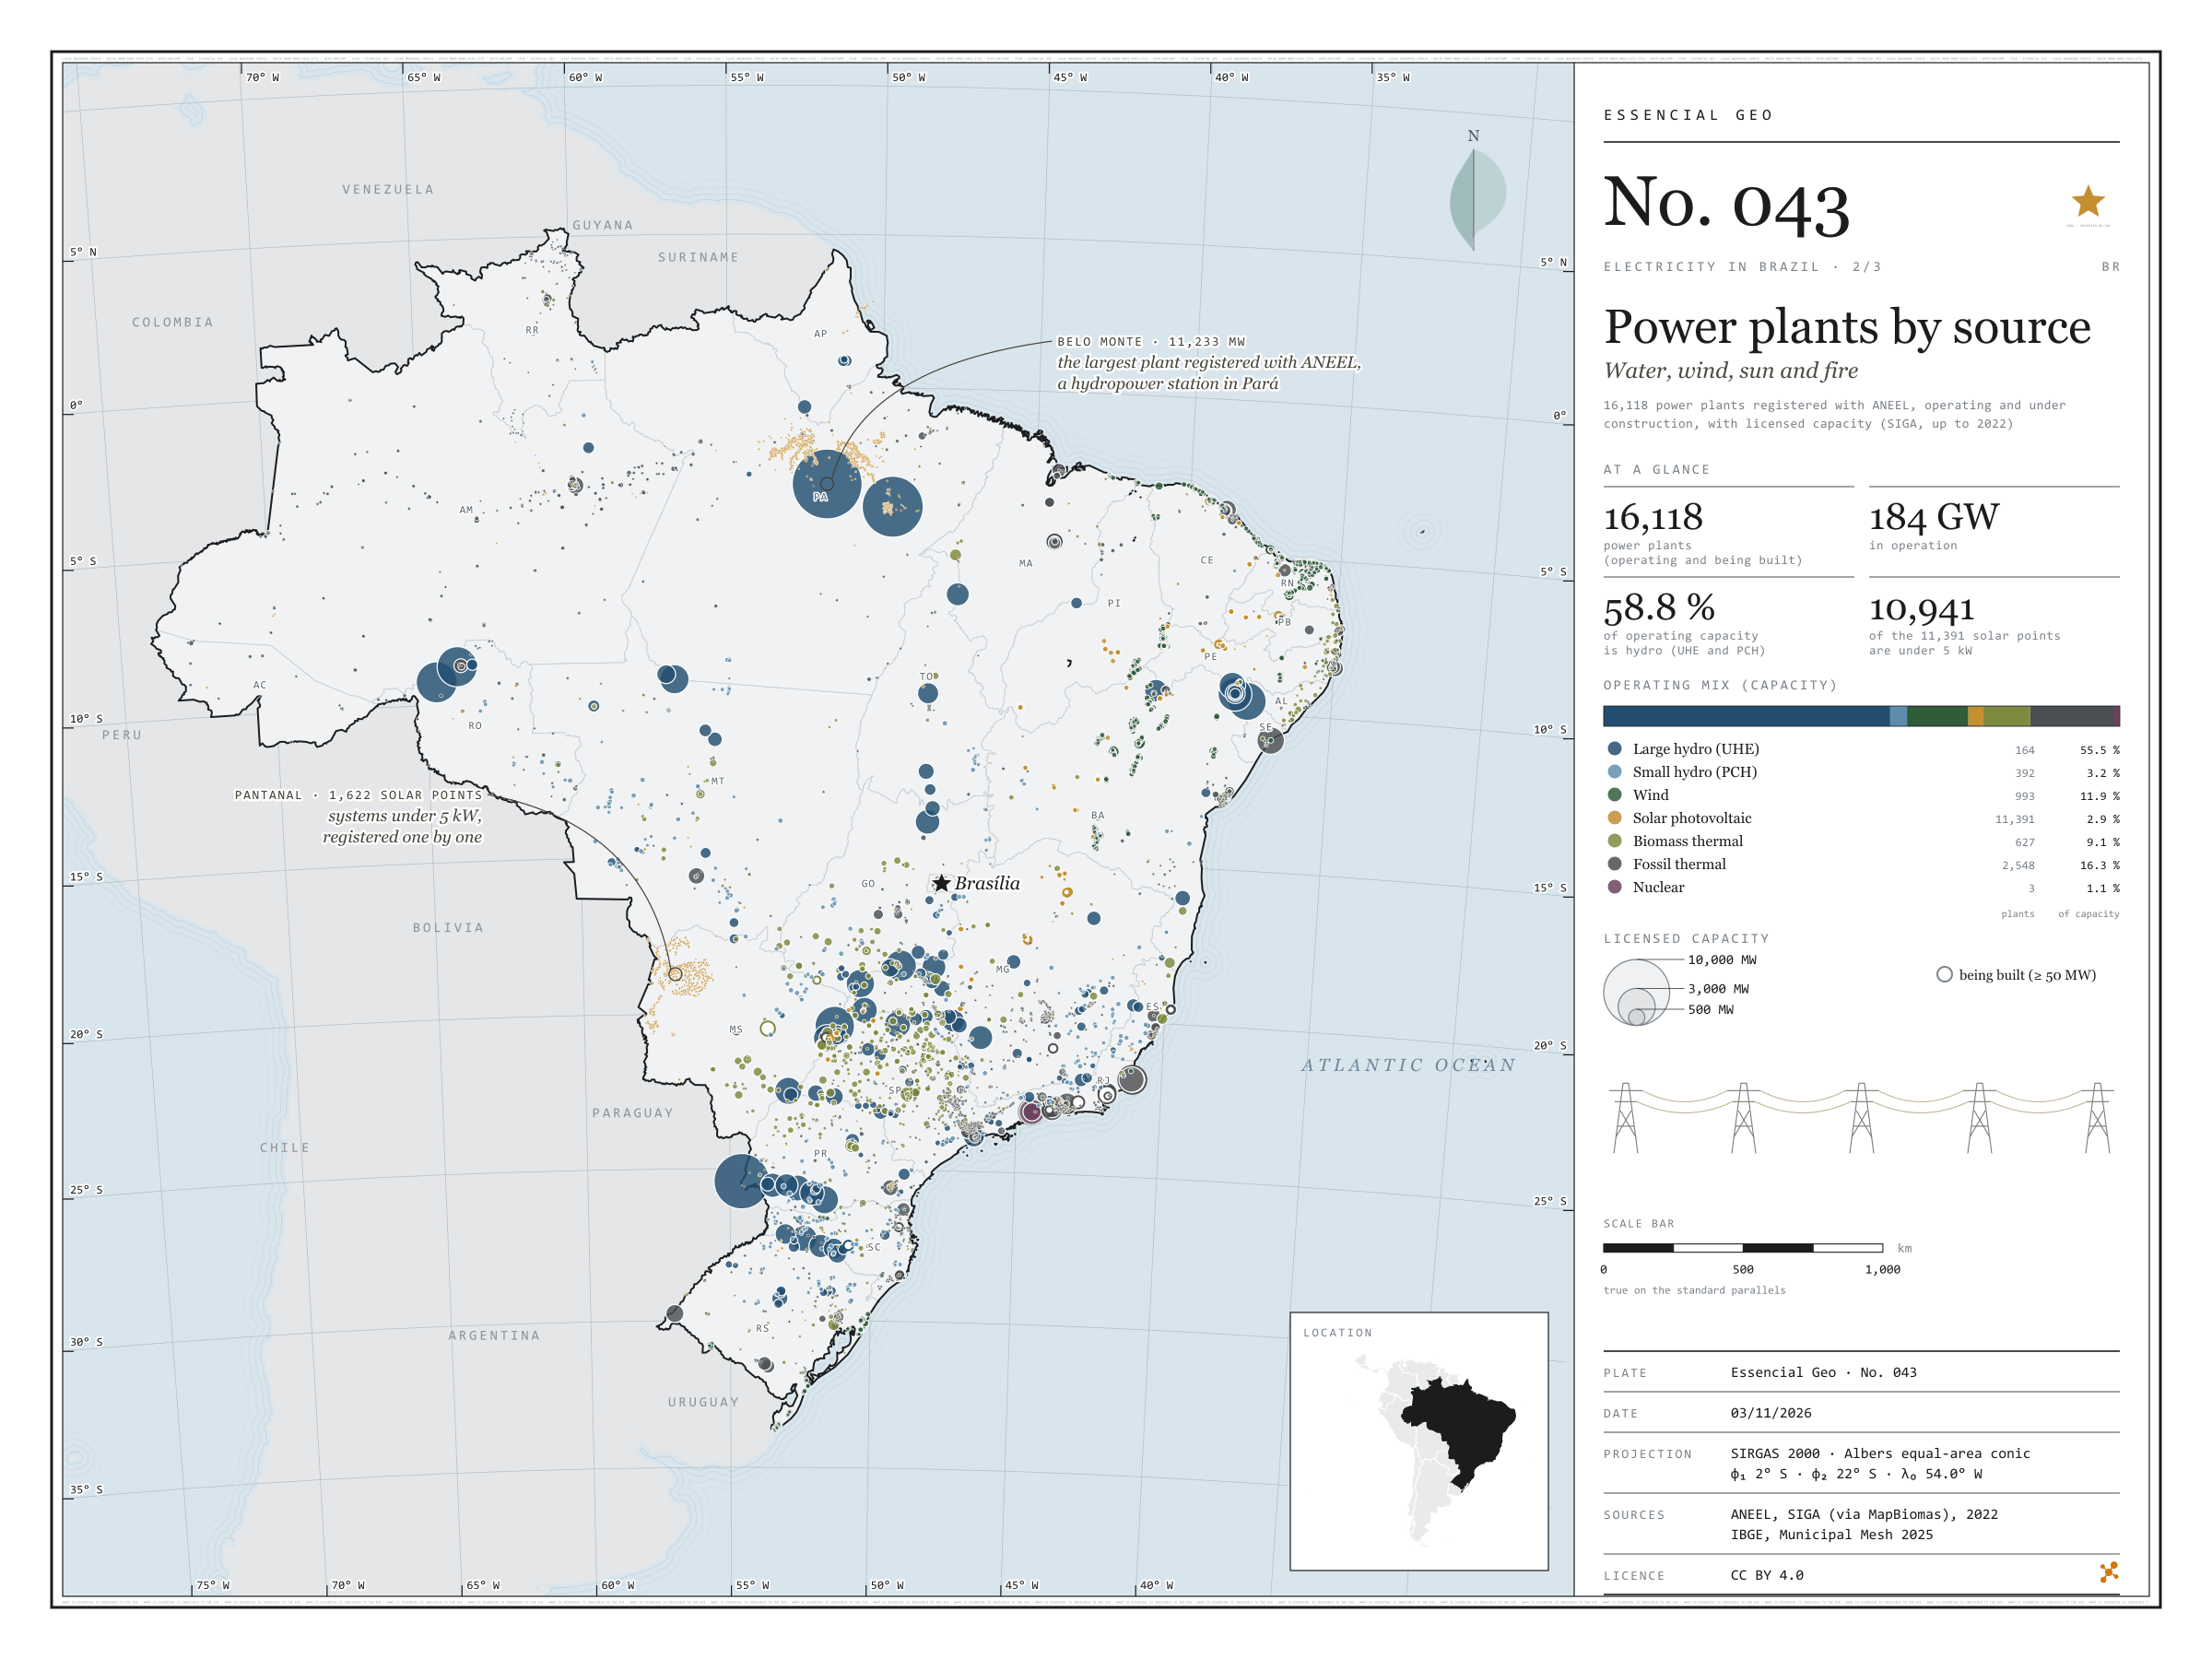
There are 4.67 million photovoltaic systems in 5,567 municipalities: panels on the roofs of homes, shops and smallholdings, and small plants of up to 5 MW that cut their owners’ electricity bills. They add up to 53.8 GW, 265 W per inhabitant, 52% of it in homes. Rooftop sun is strongest in the Centre-West and western Paraná: Mato Grosso has 872 W per inhabitant, and Foz do Iguaçu, with 1,408 W, leads among towns of more than 100,000 people. São Paulo has the largest capacity, 7.6 GW, but only 170 W per inhabitant; Taboão da Serra stands at 11 W. At the other extreme, the 20.6 MW of Santa Clara d’Oeste give 7,939 W to each of its 2,598 residents. Last plate of the collection “Electricity in Brazil”.
Technical record · downloads · citation
At a glance
Solar capacity in distributed generation
54GW
4,665,874 systems, 265 W per inhabitant
Capacity by consumer class (GW) (GW)
Residencial52.3%
Comercial26.6%
Rural12.4%
Industrial6.8%
Poder público1.2%
Outras0.8%
Watts per inhabitant, the five highest and five lowest states (W)
MT872
MS700
PR600
TO503
RO492
PB165
MA164
SE144
RJ128
AM115
Layers
municipiospolygon5,571 municipalities: population, number of solar systems, total capacity, by size, residential and remote self-consumption (kW), units receiving credit, watts per inhabitant and class
Capacity of photovoltaic micro- and mini-generation systems summed by municipality, divided by the 2022 Census population and grouped into seven classes of watts per inhabitant.
The map without a frame, with legend, scale, reference system and credit written on it: ready for papers, lectures and slides. In two versions: with the basemap (neighbours and sea) or only the mapped area, on white.
CEREJO, Lucas Nakamura. Geração solar distribuída: o sol que mora nos telhados. Versão 1.0.0. [S. l.]: Zenodo, 2026. Conjunto de dados. DOI: 10.5281/zenodo.23539656. Disponível em: https://doi.org/10.5281/zenodo.23539656. Acesso em: 10 nov. 2026.
Cerejo, L. N. (2026). Geração solar distribuída: o sol que mora nos telhados [Distributed solar generation: The sun that lives on the rooftops] (Version 1.0.0) [Data set]. Zenodo. https://doi.org/10.5281/zenodo.23539656
@dataset{cerejo2026_geracao_solar_distribuida_brasil,
  author    = {Cerejo, Lucas Nakamura},
  title     = {Geração solar distribuída: O sol que mora nos telhados},
  year      = {2026},
  publisher = {Zenodo},
  version   = {1.0.0},
  doi       = {10.5281/zenodo.23539656},
  url       = {https://doi.org/10.5281/zenodo.23539656},
  language  = {portuguese},
  note      = {English title: Distributed solar generation: The sun that lives on the rooftops. Licence CC BY 4.0}
}
Belo Monte, on the Xingu, has 11,233 MW of licensed capacity: it is the largest of the 16,118 power plants registered with ANEEL, operating or under construction. Water still dominates: large and small hydro add up to 58.8% of the 184 GW in operation. In the smaller circles, the map tells other stories. The wind lines up 89% of the 993 wind farms in the North-East; sugarcane bagasse fires 427 of the 627 biomass power stations, 237 of them in São Paulo; and Angra 3 is still being built beside the other two. Of the 11,391 solar plants, 10,941 are under 5 kW: individual systems registered one by one by the distribution companies, nearly all in Pará and in the Pantanal of Mato Grosso do Sul. Second plate of the collection “Electricity in Brazil”.
Technical record · downloads · citation
At a glance
Operating mix, by licensed capacity (GW) (GW)
Hidrelétrica (UHE)55.5%
Pequena central hidrelétrica3.2%
Eólica11.9%
Solar fotovoltaica2.9%
Termelétrica a biomassa9.1%
Termelétrica fóssil16.3%
Termonuclear1.1%
Belo Monte, the largest registered plant
11,233MW
followed by Tucuruí (8,535 MW) and the Brazilian share of Itaipu (7,000 MW)
Layers
usinaspoint16,118 power plants: source, fuel, phase, licensed and inspected capacity (kW), start of operations, owner and state
The map without a frame, with legend, scale, reference system and credit written on it: ready for papers, lectures and slides. In two versions: with the basemap (neighbours and sea) or only the mapped area, on white.
CEREJO, Lucas Nakamura. Usinas por fonte: água, vento, sol e fogo. Versão 1.0.0. [S. l.]: Zenodo, 2026. Conjunto de dados. DOI: 10.5281/zenodo.23539628. Disponível em: https://doi.org/10.5281/zenodo.23539628. Acesso em: 10 nov. 2026.
Cerejo, L. N. (2026). Usinas por fonte: água, vento, sol e fogo [Power plants by source: Water, wind, sun and fire] (Version 1.0.0) [Data set]. Zenodo. https://doi.org/10.5281/zenodo.23539628
@dataset{cerejo2026_usinas_por_fonte_brasil,
  author    = {Cerejo, Lucas Nakamura},
  title     = {Usinas por fonte: Água, vento, sol e fogo},
  year      = {2026},
  publisher = {Zenodo},
  version   = {1.0.0},
  doi       = {10.5281/zenodo.23539628},
  url       = {https://doi.org/10.5281/zenodo.23539628},
  language  = {portuguese},
  note      = {English title: Power plants by source: Water, wind, sun and fire. Licence CC BY 4.0}
}
From the Xingu to Rio de Janeiro, an 800 kV direct-current line runs 2,552 km to carry Belo Monte’s power to the South-East: it is the longest of the 1,712 existing transmission lines mapped by EPE. Adding up circuits, they come to 170.2 thousand km of lines and 780 substations. Lines of 500 to 765 kV make up most of the length, 68.0 thousand km; the eleven direct-current lines, 19.5 thousand km, bring the power of Itaipu, the Madeira plants and Belo Monte to the South-East. On the map, the grid thickens in the South-East, the South and along the north-eastern coast, and reaches the Amazon through a handful of wires. First plate of the collection “Electricity in Brazil”.
Technical record · downloads · citation
At a glance
Length by voltage class (thousand km, adding up circuits) (mil km)
até 230 kV66
345 e 440 kV17
500 a 765 kV68
600 e 800 kV, corrente contínua20
The longest line: Xingu – Terminal Rio, 800 kV direct current
2,552km
in service since 2019
Layers
linhas_transmissaoline1,712 lines: voltage, length, year in service, concession holder and voltage class
subestacoespoint780 substations: voltages, year in service, concession holder and state
EPE’s existing transmission lines and substations, grouped into four voltage classes; length as declared by EPE and checked against the geodesic measurement.
The map without a frame, with legend, scale, reference system and credit written on it: ready for papers, lectures and slides. In two versions: with the basemap (neighbours and sea) or only the mapped area, on white.
CEREJO, Lucas Nakamura. Linhas de transmissão: os fios que costuram o país. Versão 1.0.0. [S. l.]: Zenodo, 2026. Conjunto de dados. DOI: 10.5281/zenodo.23539594. Disponível em: https://doi.org/10.5281/zenodo.23539594. Acesso em: 10 nov. 2026.
Cerejo, L. N. (2026). Linhas de transmissão: os fios que costuram o país [Transmission lines: The wires that stitch the country together] (Version 1.0.0) [Data set]. Zenodo. https://doi.org/10.5281/zenodo.23539594
@dataset{cerejo2026_transmissao_brasil,
  author    = {Cerejo, Lucas Nakamura},
  title     = {Linhas de transmissão: Os fios que costuram o país},
  year      = {2026},
  publisher = {Zenodo},
  version   = {1.0.0},
  doi       = {10.5281/zenodo.23539594},
  url       = {https://doi.org/10.5281/zenodo.23539594},
  language  = {portuguese},
  note      = {English title: Transmission lines: The wires that stitch the country together. Licence CC BY 4.0}
}
Fig. 031São Paulo state (SP)EPSG:4674Source: ANEEL, IBGE, EPE
After crushing, sugarcane bagasse goes into the boiler, and the steam makes the mill’s own electricity plus a surplus for the grid. In São Paulo, 211 bagasse power stations are registered with ANEEL, 206 of them in operation, with 6.18 GW of licensed capacity; the largest, Barra Bioenergia in Barra Bonita, has 136 MW. Over the map of cane harvested in 2024, the circles show that the energy is born where the crop is: the 140 municipalities with at least one such station accounted for 48.8% of the cane harvested in the state. There, between cane field and substation, waste becomes grid. Final plate of the collection “Bioenergy in São Paulo”.
Technical record · downloads · citation
At a glance
Bagasse capacity in operation
6,179MW
206 stations in operation and 5 being built
Largest bagasse power stations (MW)
Barra Bioenergia136
Cocal II131
Bonfim111
Conquista do Pontal110
Vale do Rosário97
Cane in municipalities with a station
49%
140 municipalities with at least one bagasse power station
Layers
ute_bagacopoint211 sugarcane-bagasse power stations: phase, capacity (kW), start of operations
usinas_epe_2018point161 sugar-energy mills from the EPE WebMap 2018: type, crushing class, ethanol capacity
municipiospolygon645 municipalities: cane production (t), number and capacity of power stations
regioes_intermediariaspolygon11 intermediate geographic regions
The map without a frame, with legend, scale, reference system and credit written on it: ready for papers, lectures and slides. In two versions: with the basemap (neighbours and sea) or only the mapped area, on white.
CEREJO, Lucas Nakamura. Usinas e cana: a colheita que acende a rede. Versão 1.0.0. [S. l.]: Zenodo, 2026. Conjunto de dados. DOI: 10.5281/zenodo.23538990. Disponível em: https://doi.org/10.5281/zenodo.23538990. Acesso em: 10 nov. 2026.
Cerejo, L. N. (2026). Usinas e cana: a colheita que acende a rede [Mills and cane: The harvest that lights the grid] (Version 1.0.0) [Data set]. Zenodo. https://doi.org/10.5281/zenodo.23538990
@dataset{cerejo2026_usinas_e_cana_sp,
  author    = {Cerejo, Lucas Nakamura},
  title     = {Usinas e cana: A colheita que acende a rede},
  year      = {2026},
  publisher = {Zenodo},
  version   = {1.0.0},
  doi       = {10.5281/zenodo.23538990},
  url       = {https://doi.org/10.5281/zenodo.23538990},
  language  = {portuguese},
  note      = {English title: Mills and cane: The harvest that lights the grid. Licence CC BY 4.0}
}
In 2024, São Paulo state held 10.8 million cattle, 1.5 million pigs and 205 million poultry. Side by side, the three herds occupy the state in different ways: cattle spread across the west, led by Presidente Bernardes (151,407 head) and Mirante do Paranapanema (138,268); pigs gather in a few hubs, such as Itu and Cerqueira César, each with over 100,000 head; and poultry cluster in farms, with Bastos alone holding 13.7 million birds. For anyone thinking about biogas, density matters more than the total: many animals on little land also concentrate the manure. Second plate of the collection “Bioenergy in São Paulo”.
Technical record · downloads · citation
At a glance
Cattle
10,756,815head
617 municipalities with cattle; largest herd: Presidente Bernardes (151,407)
Pigs
1,480,785head
584 municipalities with pigs; largest herd: Itu (117,600)
Poultry
205,018,513head
572 municipalities with poultry; largest flock: Bastos (13,650,920)
Layers
municipiospolygon645 municipalities: herd size and density (head/km²) of cattle, pigs and poultry
regioes_intermediariaspolygon11 intermediate geographic regions
The map without a frame, with legend, scale, reference system and credit written on it: ready for papers, lectures and slides. In two versions: with the basemap (neighbours and sea) or only the mapped area, on white.
CEREJO, Lucas Nakamura. Rebanhos: três rebanhos, três geografias. Versão 1.0.0. [S. l.]: Zenodo, 2026. Conjunto de dados. DOI: 10.5281/zenodo.23506048. Disponível em: https://doi.org/10.5281/zenodo.23506048. Acesso em: 10 nov. 2026.
Cerejo, L. N. (2026). Rebanhos: três rebanhos, três geografias [Livestock: Three herds, three geographies] (Version 1.0.0) [Data set]. Zenodo. https://doi.org/10.5281/zenodo.23506048
@dataset{cerejo2026_rebanhos_sp,
  author    = {Cerejo, Lucas Nakamura},
  title     = {Rebanhos: Três rebanhos, três geografias},
  year      = {2026},
  publisher = {Zenodo},
  version   = {1.0.0},
  doi       = {10.5281/zenodo.23506048},
  url       = {https://doi.org/10.5281/zenodo.23506048},
  language  = {portuguese},
  note      = {English title: Livestock: Three herds, three geographies. Licence CC BY 4.0}
}
Fig. 028São Paulo state (SP)EPSG:4674Source: MapBiomas, ANEEL, IBGE
On top of a landfill in Caieiras, in Greater São Paulo, the gas rising from the rubbish drives the state’s largest biogas power station: 29.5 MW of licensed capacity. It is one of 13 biogas power stations registered with ANEEL in São Paulo, which together add up to 108.2 MW. MapBiomas maps other ways of using the same gas: 51 plants across the state, 44 of them in operation, burning manure from farms, industrial effluent and what comes out of landfills and sewage works to make electricity, heat or biomethane. On the map they gather around the capital and along the agro-industrial hubs of the interior. First plate of the collection “Bioenergy in São Paulo”, which follows waste all the way to energy.
Technical record · downloads · citation
At a glance
Biogas plants by waste source (plants)
Farming24
Industry14
Landfill or sewage13
Biogas power stations (ANEEL)
108MW
13 stations; the largest is Termoverde Caieiras (29.5 MW)
Layers
usinas_biogaspoint51 biogas plants: category, main use, status, scale and start of operations
ute_biogaspoint13 biogas power stations registered with ANEEL, with capacity (kW)
municipiospolygon645 municipalities, with the number of plants and biogas capacity
regioes_intermediariaspolygon11 intermediate geographic regions
The map without a frame, with legend, scale, reference system and credit written on it: ready for papers, lectures and slides. In two versions: with the basemap (neighbours and sea) or only the mapped area, on white.
CEREJO, Lucas Nakamura. Usinas de biogás: onde o lixo e o esterco viram luz. Versão 1.0.0. [S. l.]: Zenodo, 2026. Conjunto de dados. DOI: 10.5281/zenodo.23482137. Disponível em: https://doi.org/10.5281/zenodo.23482137. Acesso em: 10 nov. 2026.
Cerejo, L. N. (2026). Usinas de biogás: onde o lixo e o esterco viram luz [Biogas plants: Where rubbish and manure become light] (Version 1.0.0) [Data set]. Zenodo. https://doi.org/10.5281/zenodo.23482137
@dataset{cerejo2026_usinas_de_biogas_sp,
  author    = {Cerejo, Lucas Nakamura},
  title     = {Usinas de biogás: Onde o lixo e o esterco viram luz},
  year      = {2026},
  publisher = {Zenodo},
  version   = {1.0.0},
  doi       = {10.5281/zenodo.23482137},
  url       = {https://doi.org/10.5281/zenodo.23482137},
  language  = {portuguese},
  note      = {English title: Biogas plants: Where rubbish and manure become light. Licence CC BY 4.0}
}