Skip to content
Essencial

No. 028 Energy · biomass Bioenergy in São Paulo 1/4

Biogas plants

Where rubbish and manure become light

Record, downloads and citation
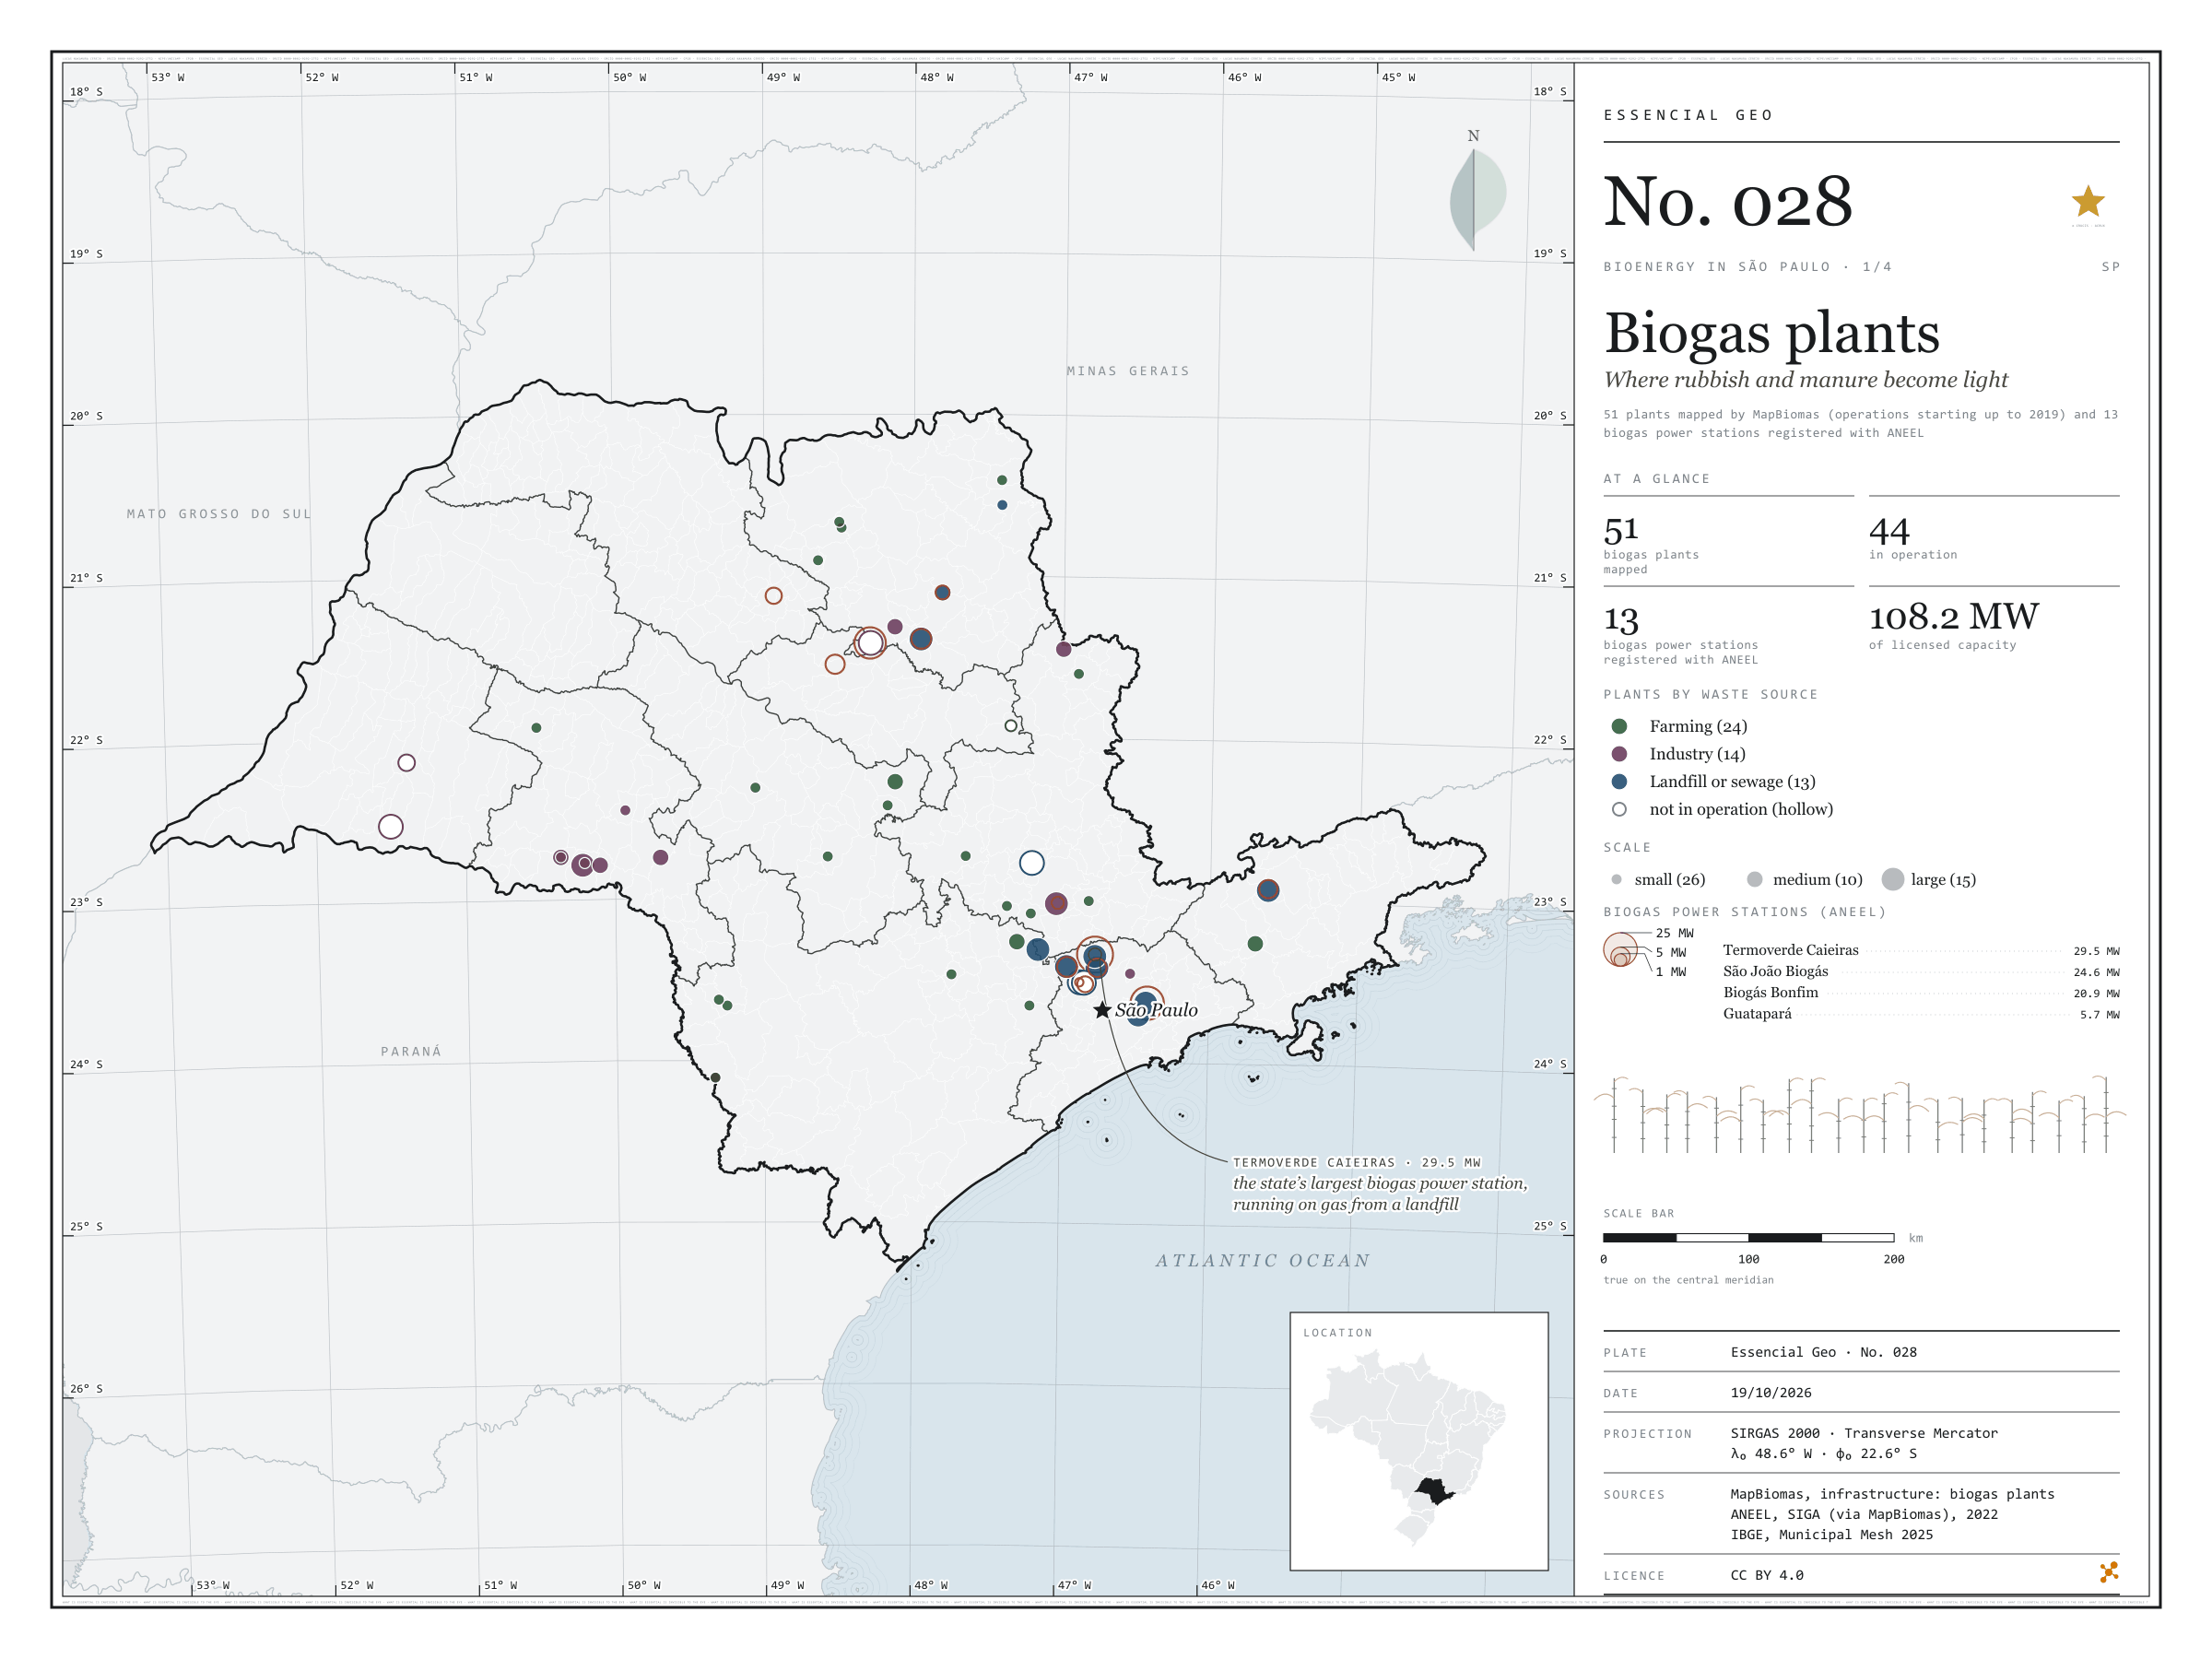
Fig. 028 São Paulo state (SP) EPSG:4674 Source: MapBiomas, ANEEL, IBGE

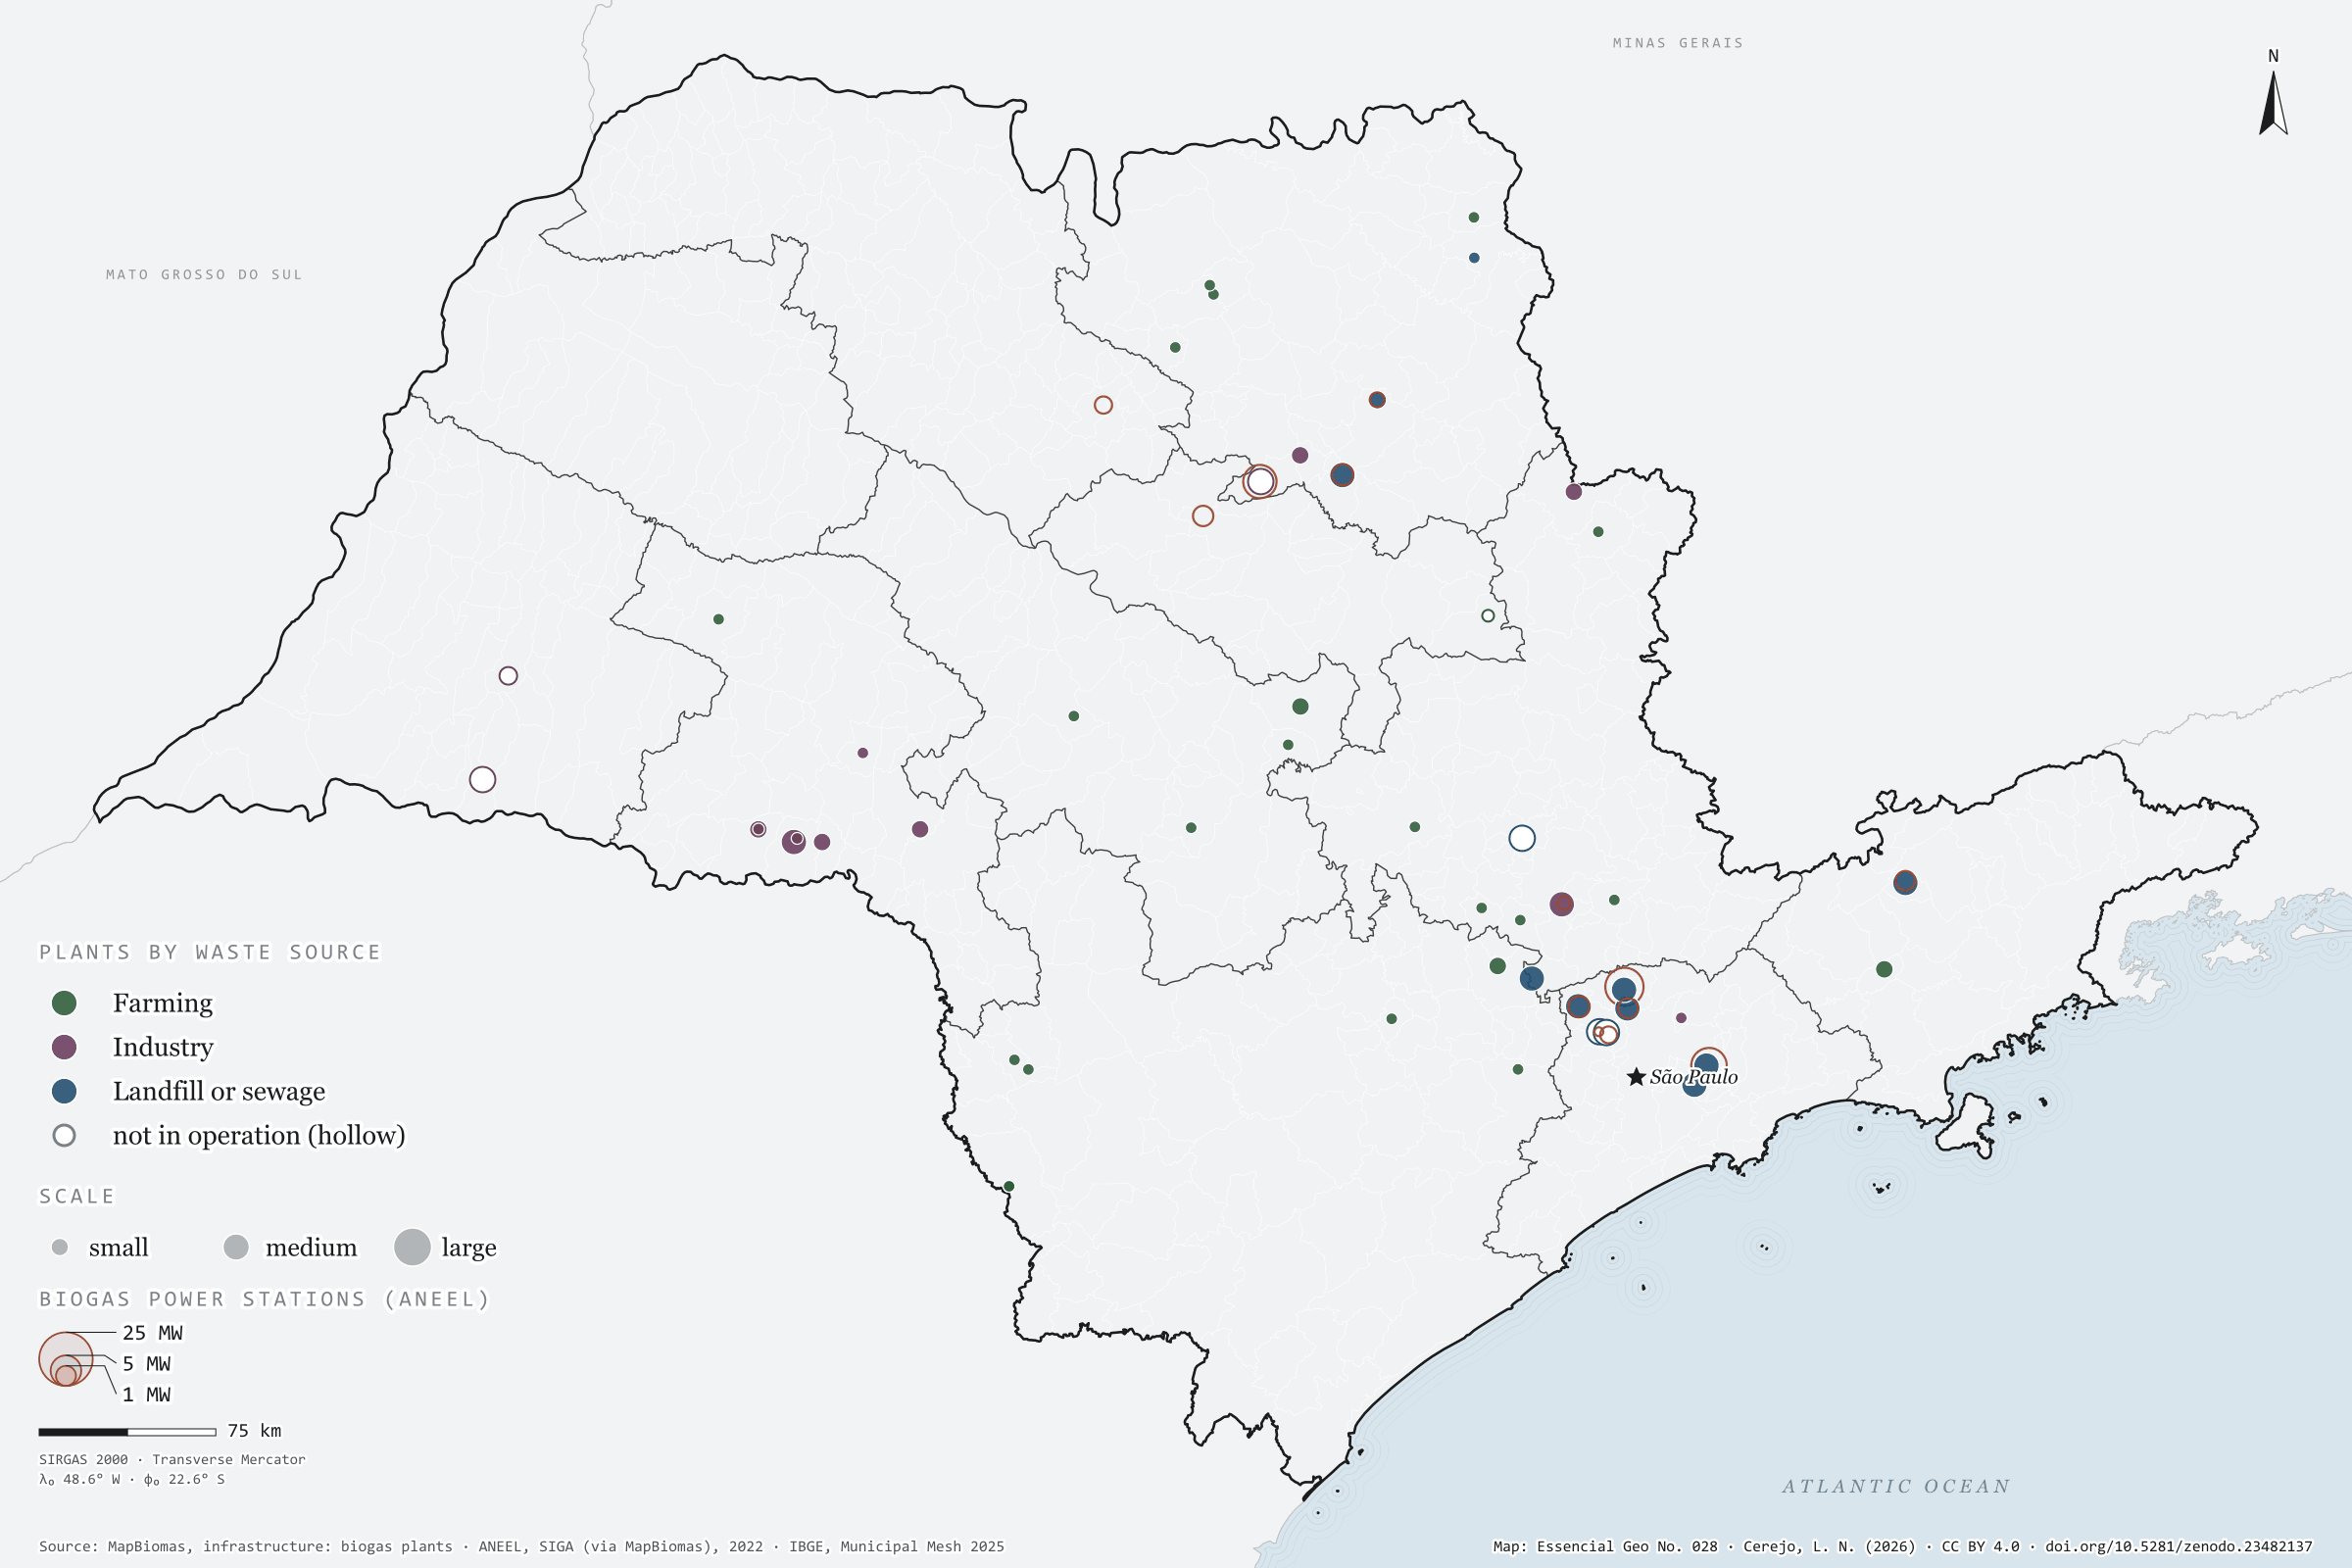
On top of a landfill in Caieiras, in Greater São Paulo, the gas rising from the rubbish drives the state’s largest biogas power station: 29.5 MW of licensed capacity. It is one of 13 biogas power stations registered with ANEEL in São Paulo, which together add up to 108.2 MW. MapBiomas maps other ways of using the same gas: 51 plants across the state, 44 of them in operation, burning manure from farms, industrial effluent and what comes out of landfills and sewage works to make electricity, heat or biomethane. On the map they gather around the capital and along the agro-industrial hubs of the interior. First plate of the collection “Bioenergy in São Paulo”, which follows waste all the way to energy.

Technical record · downloads · citation

At a glance

Biogas plants by waste source (plants)
  • Farming 24
  • Industry 14
  • Landfill or sewage 13
Biogas power stations (ANEEL)

108 MW

13 stations; the largest is Termoverde Caieiras (29.5 MW)

Layers

  • usinas_biogas point 51 biogas plants: category, main use, status, scale and start of operations
  • ute_biogas point 13 biogas power stations registered with ANEEL, with capacity (kW)
  • municipios polygon 645 municipalities, with the number of plants and biogas capacity
  • regioes_intermediarias polygon 11 intermediate geographic regions
  • limite_estadual polygon State boundary

Metadata

Extent
São Paulo state (SP)
CRS / Projection
SIRGAS 2000 (EPSG:4674)
EPSG:4674
Software
Python · GeoPandas · GDAL · QGIS · Node.js · d3-geo
Method
MapBiomas biogas plants and SIGA biogas power stations clipped to São Paulo state and assigned to municipalities by spatial join.
Version
v1.0.0
Licence
CC BY 4.0

Downloads

Figure to reuse

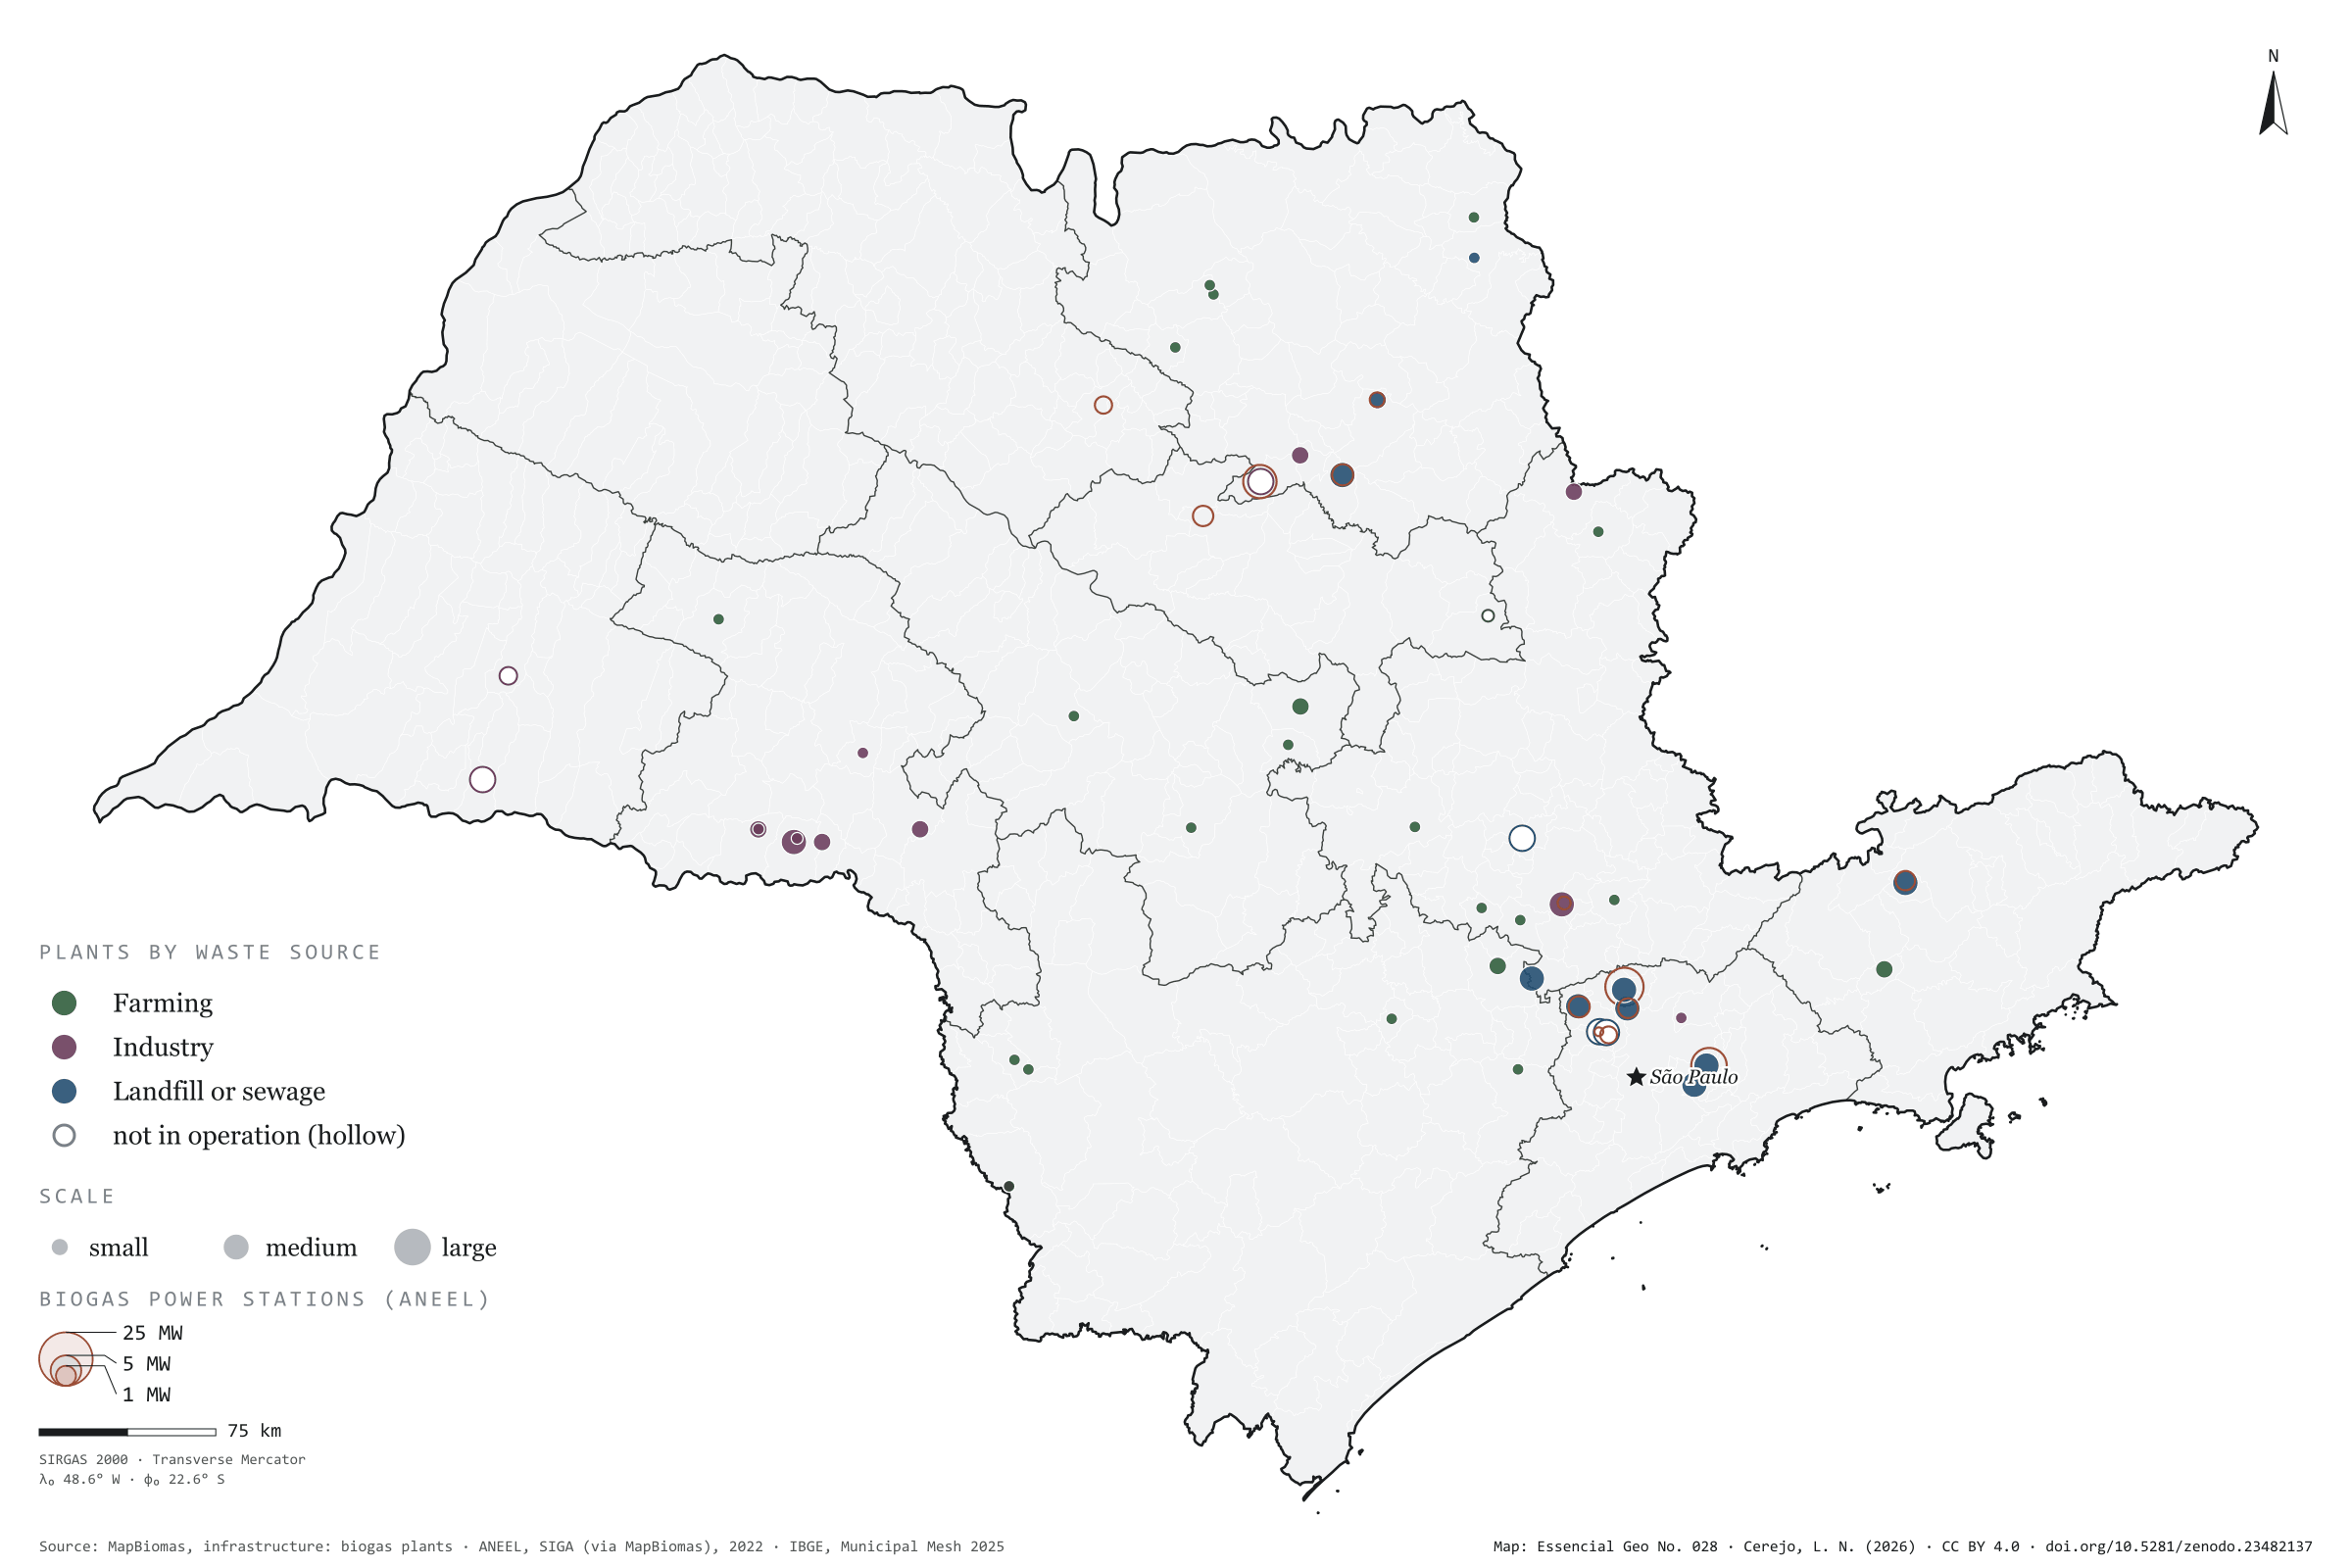
The map without a frame, with legend, scale, reference system and credit written on it: ready for papers, lectures and slides. In two versions: with the basemap (neighbours and sea) or only the mapped area, on white.

Point a camera at it to open this page.

How to cite

Cerejo, L. N. (2026). Usinas de biogás: onde o lixo e o esterco viram luz [Biogas plants: Where rubbish and manure become light] (Version 1.0.0) [Data set]. Zenodo. https://doi.org/10.5281/zenodo.23482137

How to read this plate area, projection, scale, legend and source · 6 terms
1 Area
São Paulo state (SP) The area the plate covers. Outside it, neighbours and sea are drawn in grey, just for orientation.
2 Coordinates and projection
SIRGAS 2000 (EPSG:4674) The layers are in SIRGAS 2000; the drawing’s projection is written in the colophon at the foot of the panel.
3 Scale
Graphic scale bar in the panel The scale bar is true on the central meridian; away from it, measured distances vary a little.
4 Legend and layers
5 layers in the GeoPackage · point, polygon Read the legend before the map: it tells you whether a colour is a rate or a class, and whether a circle is a total.
5 Sources
MapBiomas; ANEEL (2022); IBGE (2025) Every figure comes from a public source, with its year. The data sheet gives each one’s address.

Terms on this plate

Biogas
The gas from the airless breakdown (anaerobic digestion) of organic waste: manure, vinasse, sewage sludge, rubbish. It is 50% to 70% methane; the rest is mostly CO₂.
Biomethane
Biogas upgraded, with most of the CO₂ removed, to ANP’s specification, at which point it replaces natural gas in the pipeline, in industry and in the lorry’s tank.
Landfill and open dump
A sanitary landfill is an engineered site: sealed ground, leachate and gas drainage. An open dump is tipping in the open air, banned by Brazil’s National Solid Waste Policy. Landfill gas is biogas.
Land cover and land use
What covers each patch of ground (forest, pasture, soy, cane, water, town), read from satellite images year by year. The forty-year plates use MapBiomas’ series, 1985 to 2025, summed by municipality.
MapBiomas
A network of universities, NGOs and companies that classifies land cover across all of Brazil from Landsat images, one map a year since 1985, as open data.
ANEEL
Brazil’s National Electricity Agency: it registers every power plant and distributed-generation system, with source, capacity and municipality.

Download

Layers, table and figures, under CC BY 4.0. Cite with the DOI.

Full record and citation

Method notes · No. 028

Biogas plants in São Paulo state

Português · English

Plate No. 028, the first of four in the collection Bioenergy in São Paulo: where biogas is already put to use. The next plates show where the feedstock comes from — livestock and cane — and where bagasse becomes electricity.

What the files contain

Layer (GPKG)GeometryContents
usinas_biogaspoint51 MapBiomas plants: categoria (farming, industry, landfill or sewage), uso_principal, energy uses (energia_eletrica, energia_termica, energia_mecanica, biometano), situacao, porte, inicio_operacao, municipality
ute_biogaspoint13 SIGA biogas power stations: nome, ceg, combustivel, fase, potencia_kw (licensed), potencia_fiscalizada_kw, inicio_operacao, proprietario, municipality
municipiospolygon645 municipalities: usinas_biogas (count) and ute_biogas_kw (total capacity)
regioes_intermediariaspolygon11 intermediate geographic regions
limite_estadualpolygonoutline of the state

The GPKG is zipped and attached to the bioenergia-sp-2026 release. It carries QGIS styles: plants coloured by category and sized by scale (hollow when not in operation), and power stations as rings proportional to capacity, with their names.

The CSV combines both point layers (column camada), with longitude and latitude in decimal degrees, in UTF-8.

Method

  1. Biogas plants from the MapBiomas infrastructure database, filtered by the state field (SP). The layer does not report biogas output (the field is zero for every plant), so dot size follows the declared scale.
  2. SIGA (ANEEL) power stations fuelled by biogas — Biogás – RU, Biogás-AGR and Biogás – Floresta — in the version published by MapBiomas. Capacity is the licensed figure, in kW.
  3. Each point receives the code of the municipality it falls in, by spatial join with IBGE’s 2025 Municipal Mesh.
  4. On the plate, ring area is proportional to capacity; both layers appear together because the same plant may be in both databases.

Limitations

  • The two databases share no common identifier: it is not possible to say which MapBiomas plants match which ANEEL power stations, and adding the two counts would double-count some of them.
  • The MapBiomas layer records operations starting up to October 2019; the SIGA layer, up to June 2022. Newer plants are missing. The current SIGA release, on ANEEL’s open data portal, can be used to update the ute_biogas layer.
  • Plants that only flare their biogas, without using the energy, are in neither database.

View this map’s folder on GitHub

Technical record

Technical record · No. 028

Biogas plants

At a glance

Biogas plants by waste source (plants)
  • Farming 24
  • Industry 14
  • Landfill or sewage 13
Biogas power stations (ANEEL)

108 MW

13 stations; the largest is Termoverde Caieiras (29.5 MW)

Layers

  • usinas_biogas point 51 biogas plants: category, main use, status, scale and start of operations
  • ute_biogas point 13 biogas power stations registered with ANEEL, with capacity (kW)
  • municipios polygon 645 municipalities, with the number of plants and biogas capacity
  • regioes_intermediarias polygon 11 intermediate geographic regions
  • limite_estadual polygon State boundary

Metadata

Extent
São Paulo state (SP)
CRS / Projection
SIRGAS 2000 (EPSG:4674)
EPSG:4674
Software
Python · GeoPandas · GDAL · QGIS · Node.js · d3-geo
Method
MapBiomas biogas plants and SIGA biogas power stations clipped to São Paulo state and assigned to municipalities by spatial join.
Version
v1.0.0
Licence
CC BY 4.0

Downloads

Figure to reuse

The map without a frame, with legend, scale, reference system and credit written on it: ready for papers, lectures and slides. In two versions: with the basemap (neighbours and sea) or only the mapped area, on white.

Point a camera at it to open this page.

How to cite

Cerejo, L. N. (2026). Usinas de biogás: onde o lixo e o esterco viram luz [Biogas plants: Where rubbish and manure become light] (Version 1.0.0) [Data set]. Zenodo. https://doi.org/10.5281/zenodo.23482137

100%