Skip to content
Essencial

No. 081 Land use Manure that feeds the soil 1/4

The nitrogen in manure

Half a million tonnes a year; in Bastos, three times the European cap

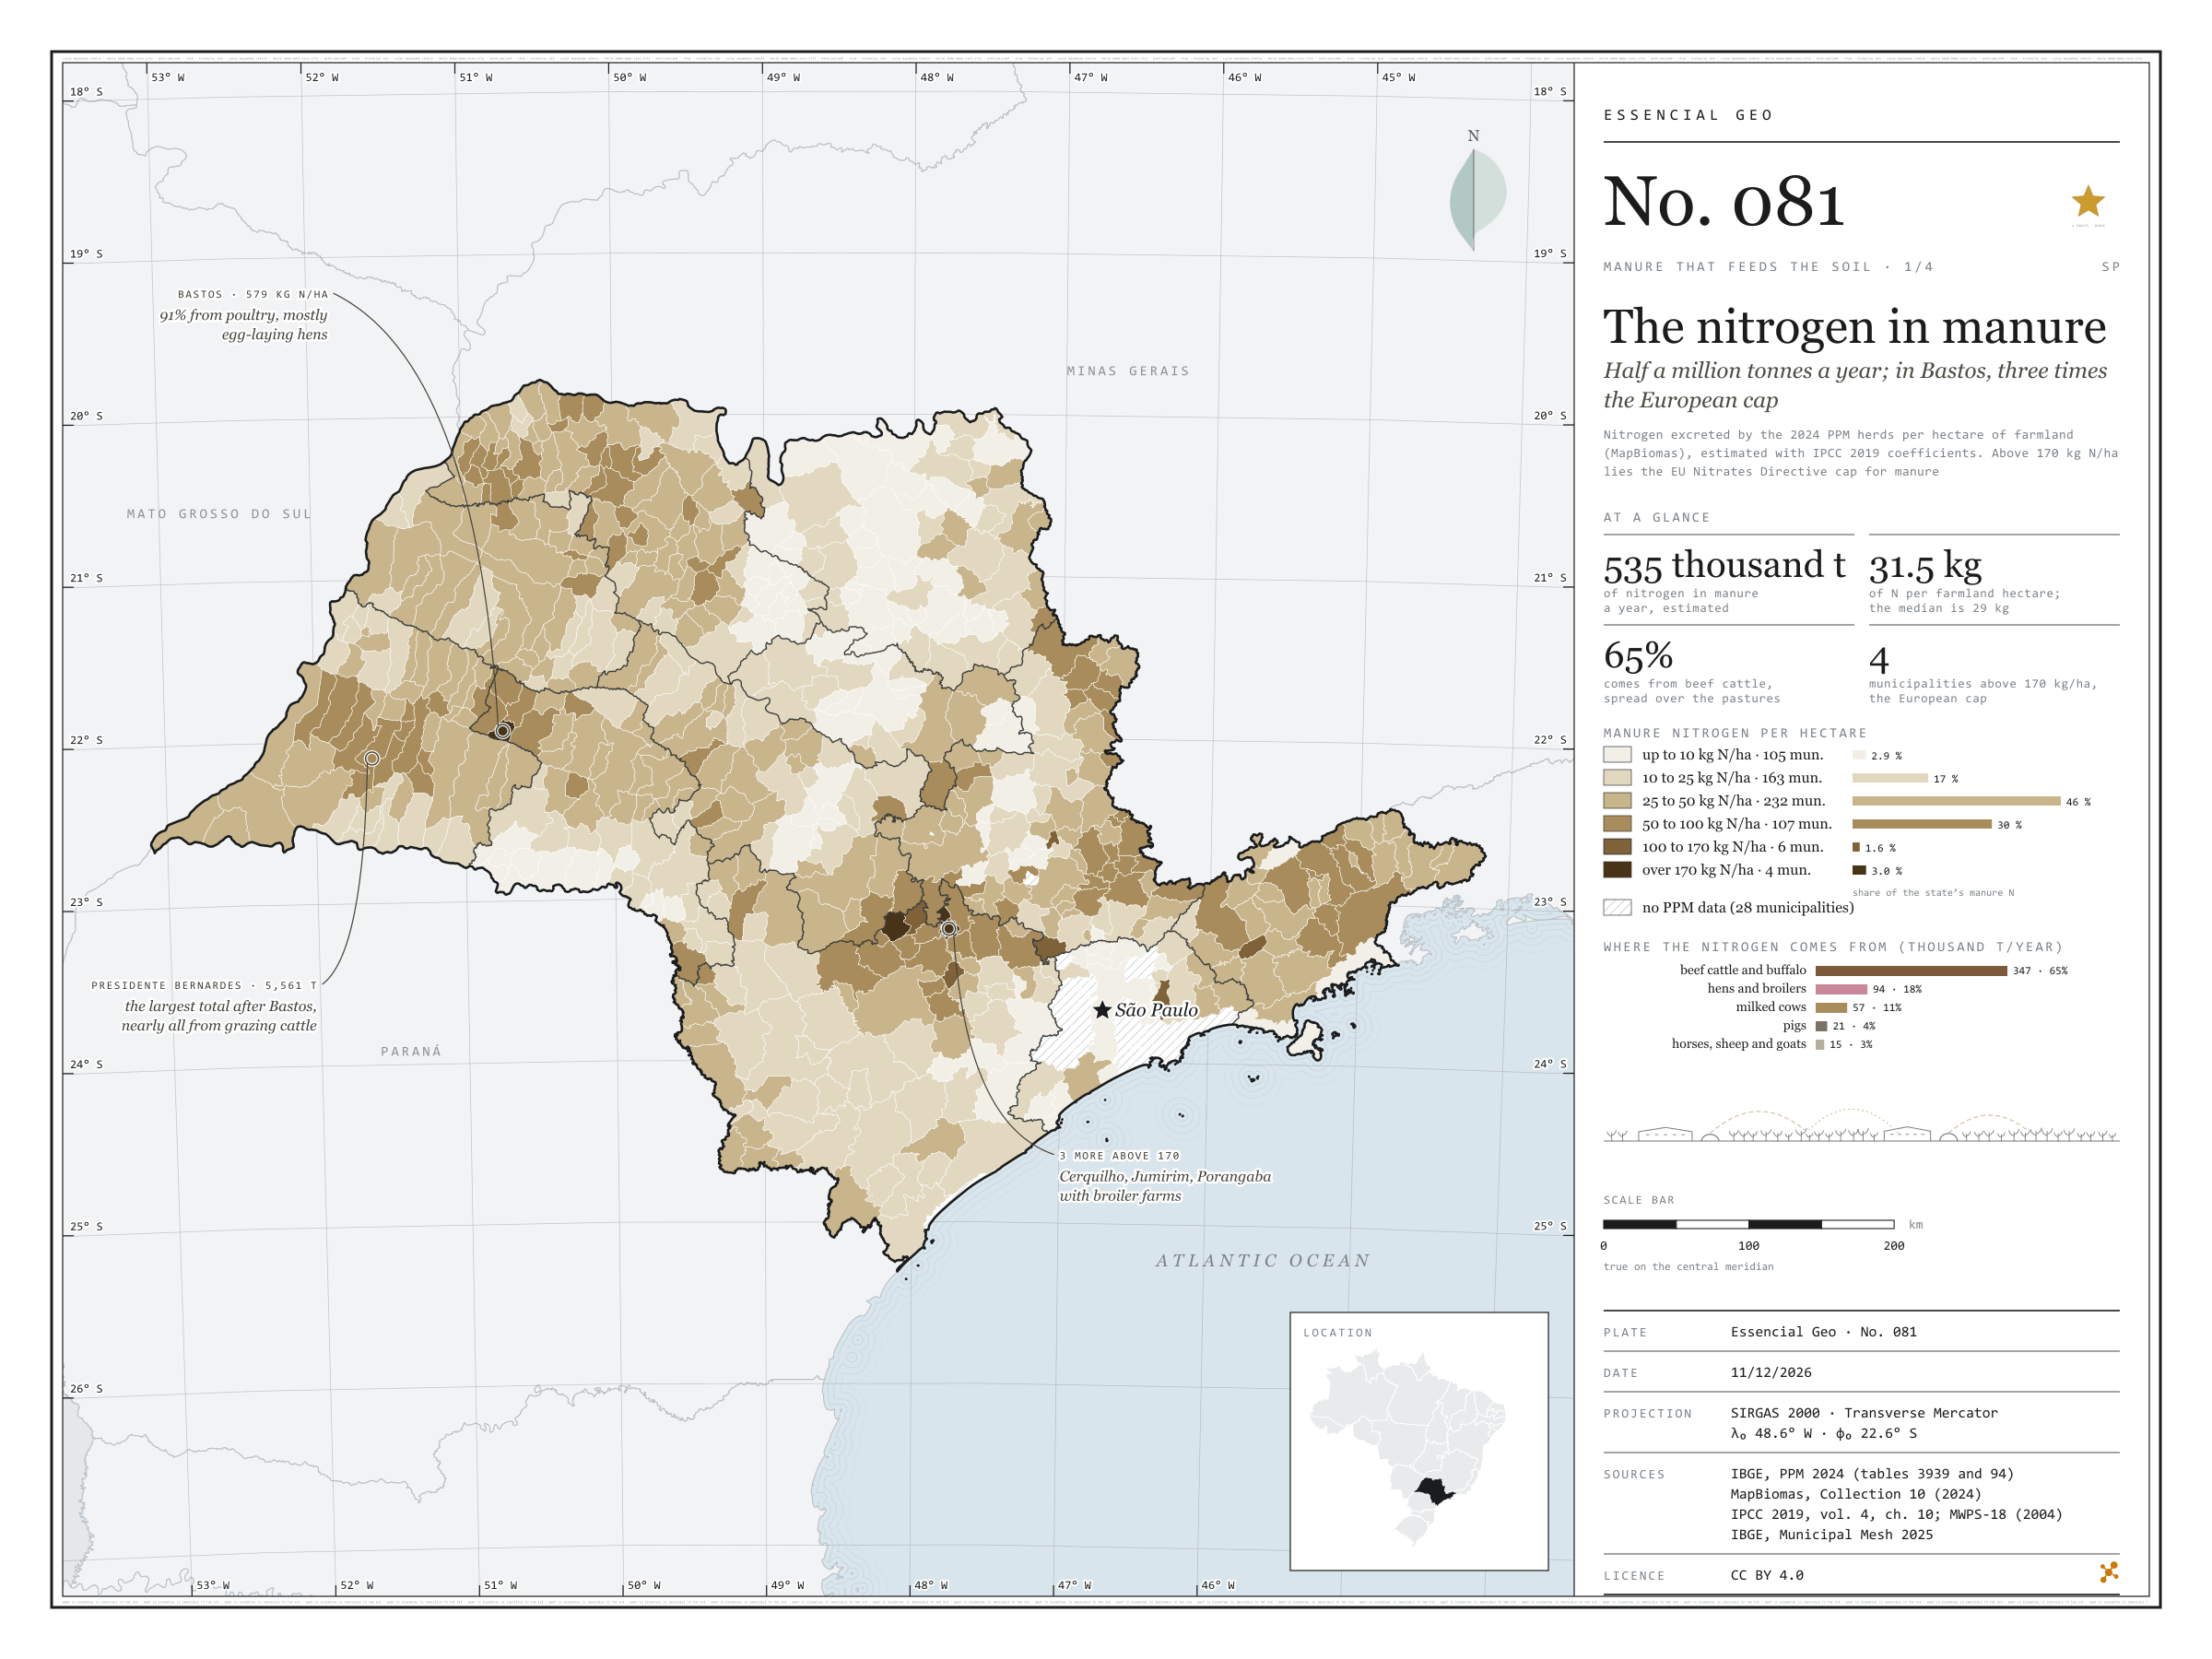
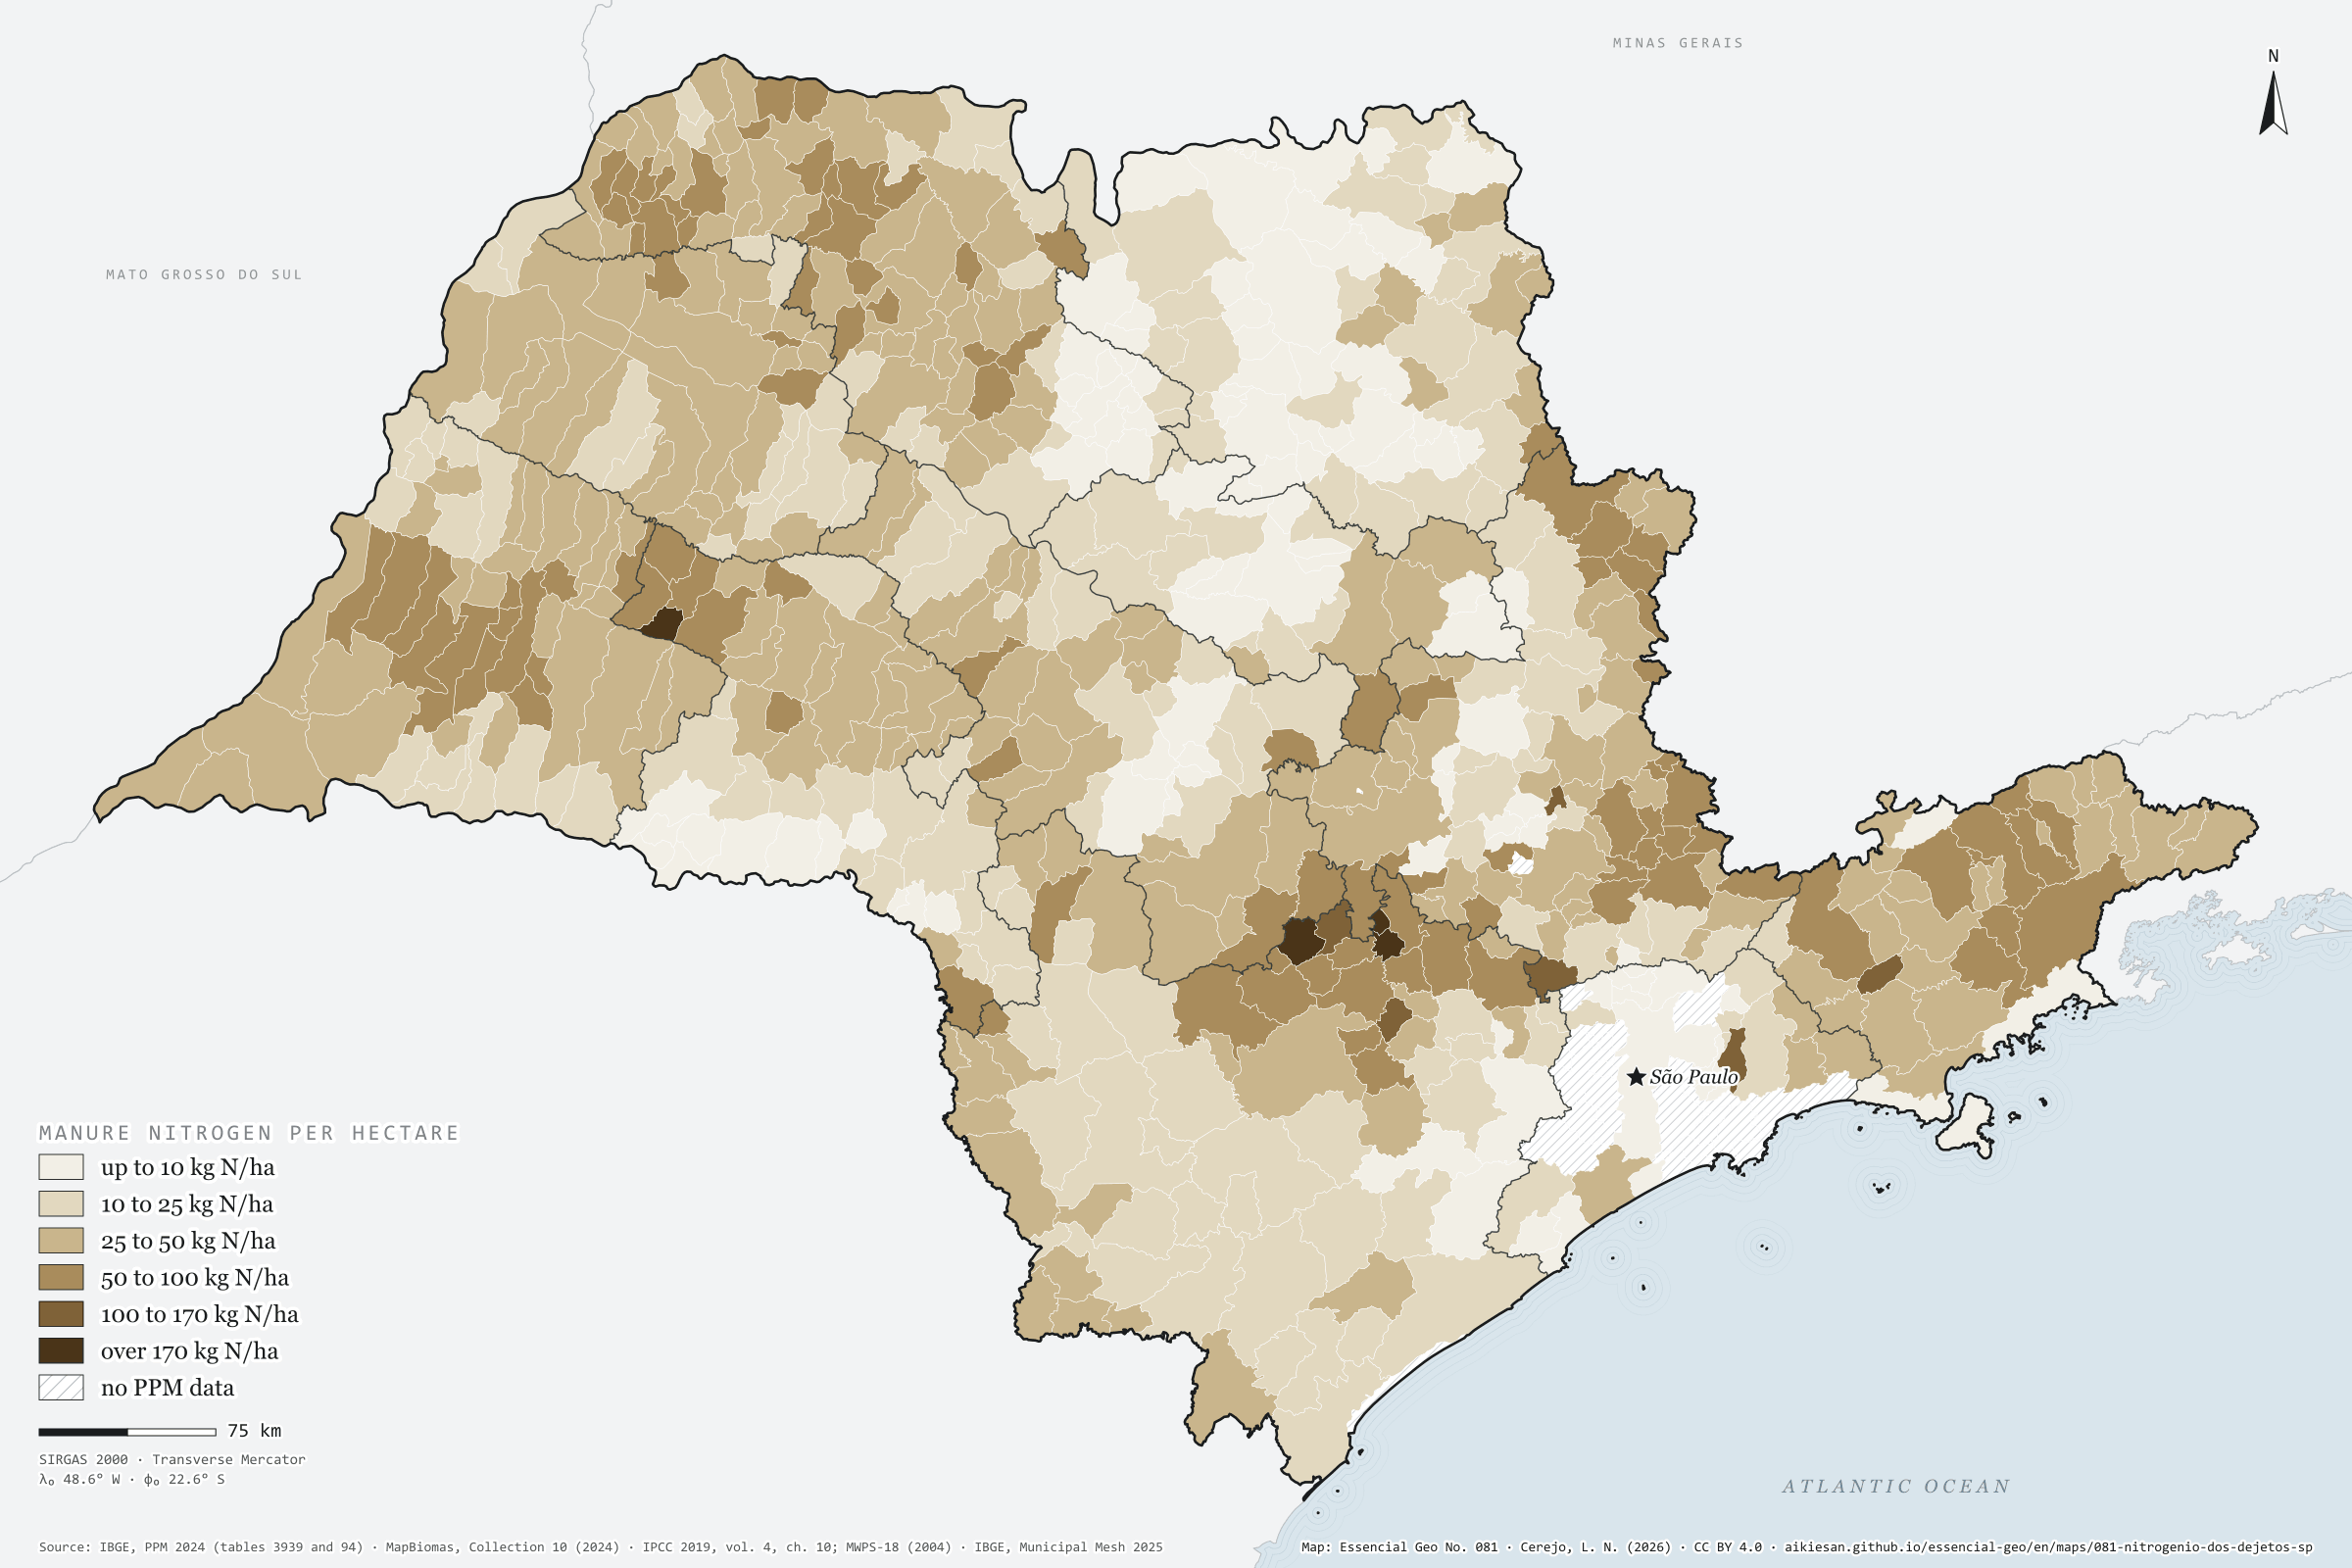
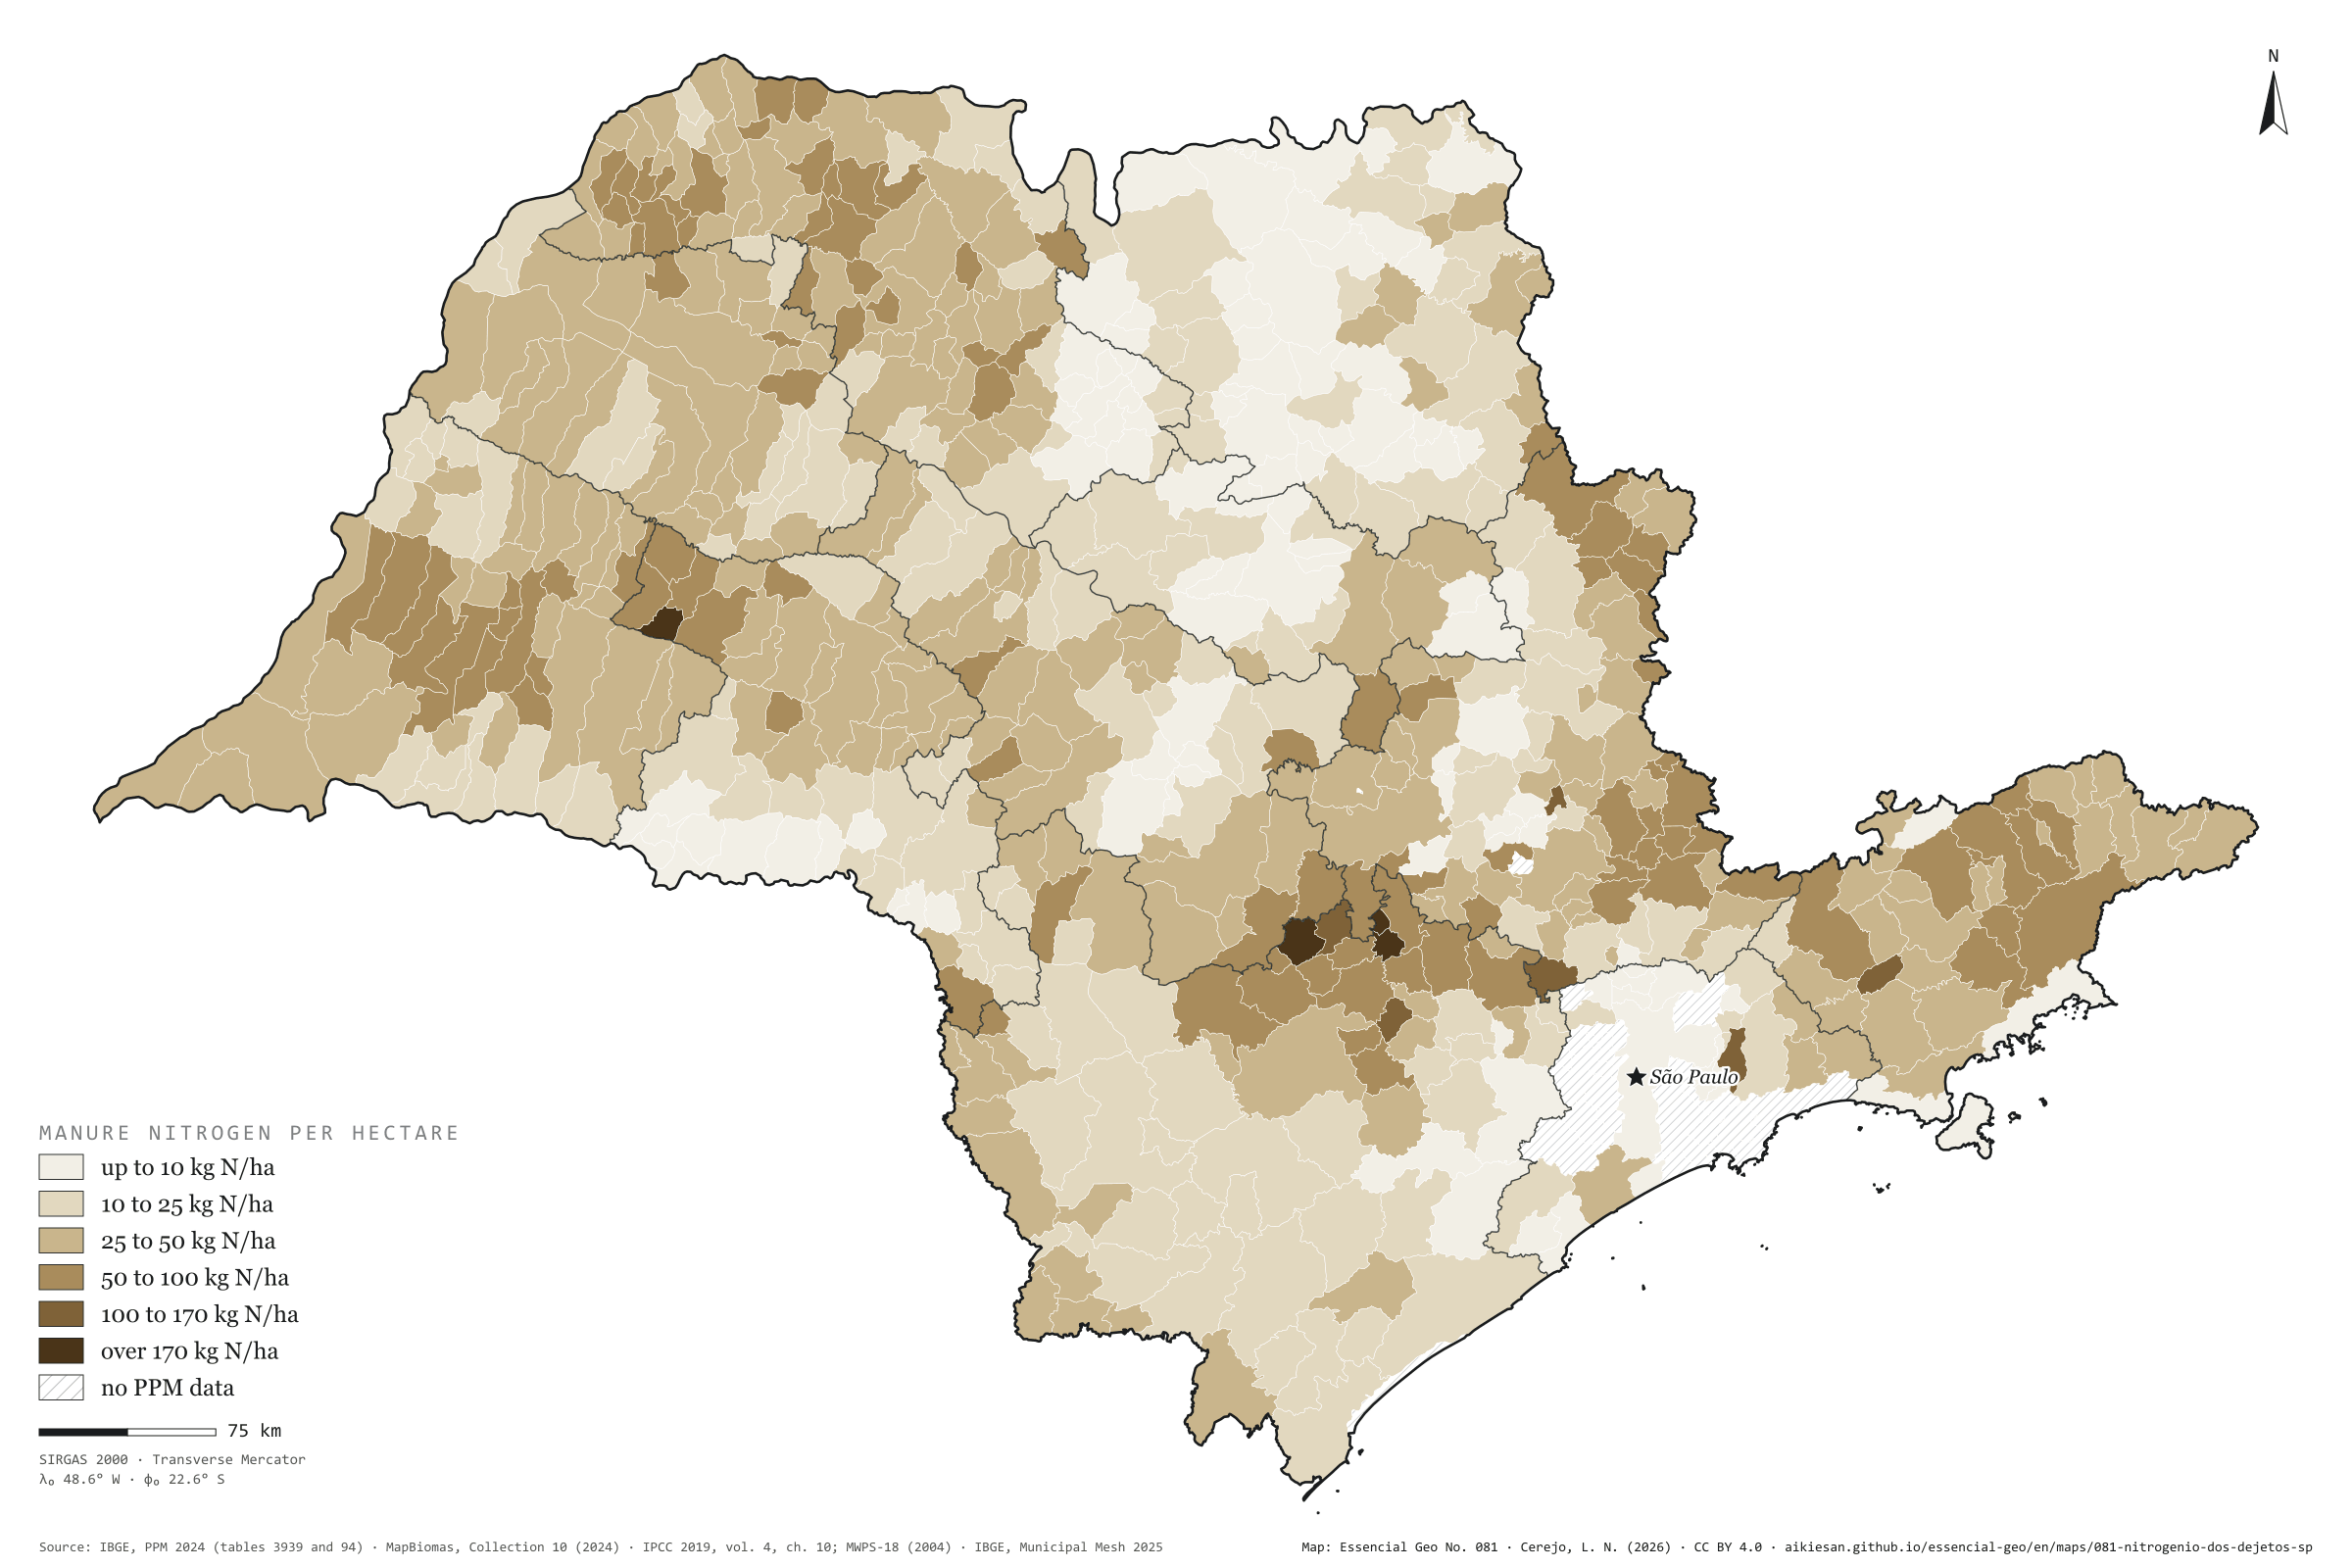
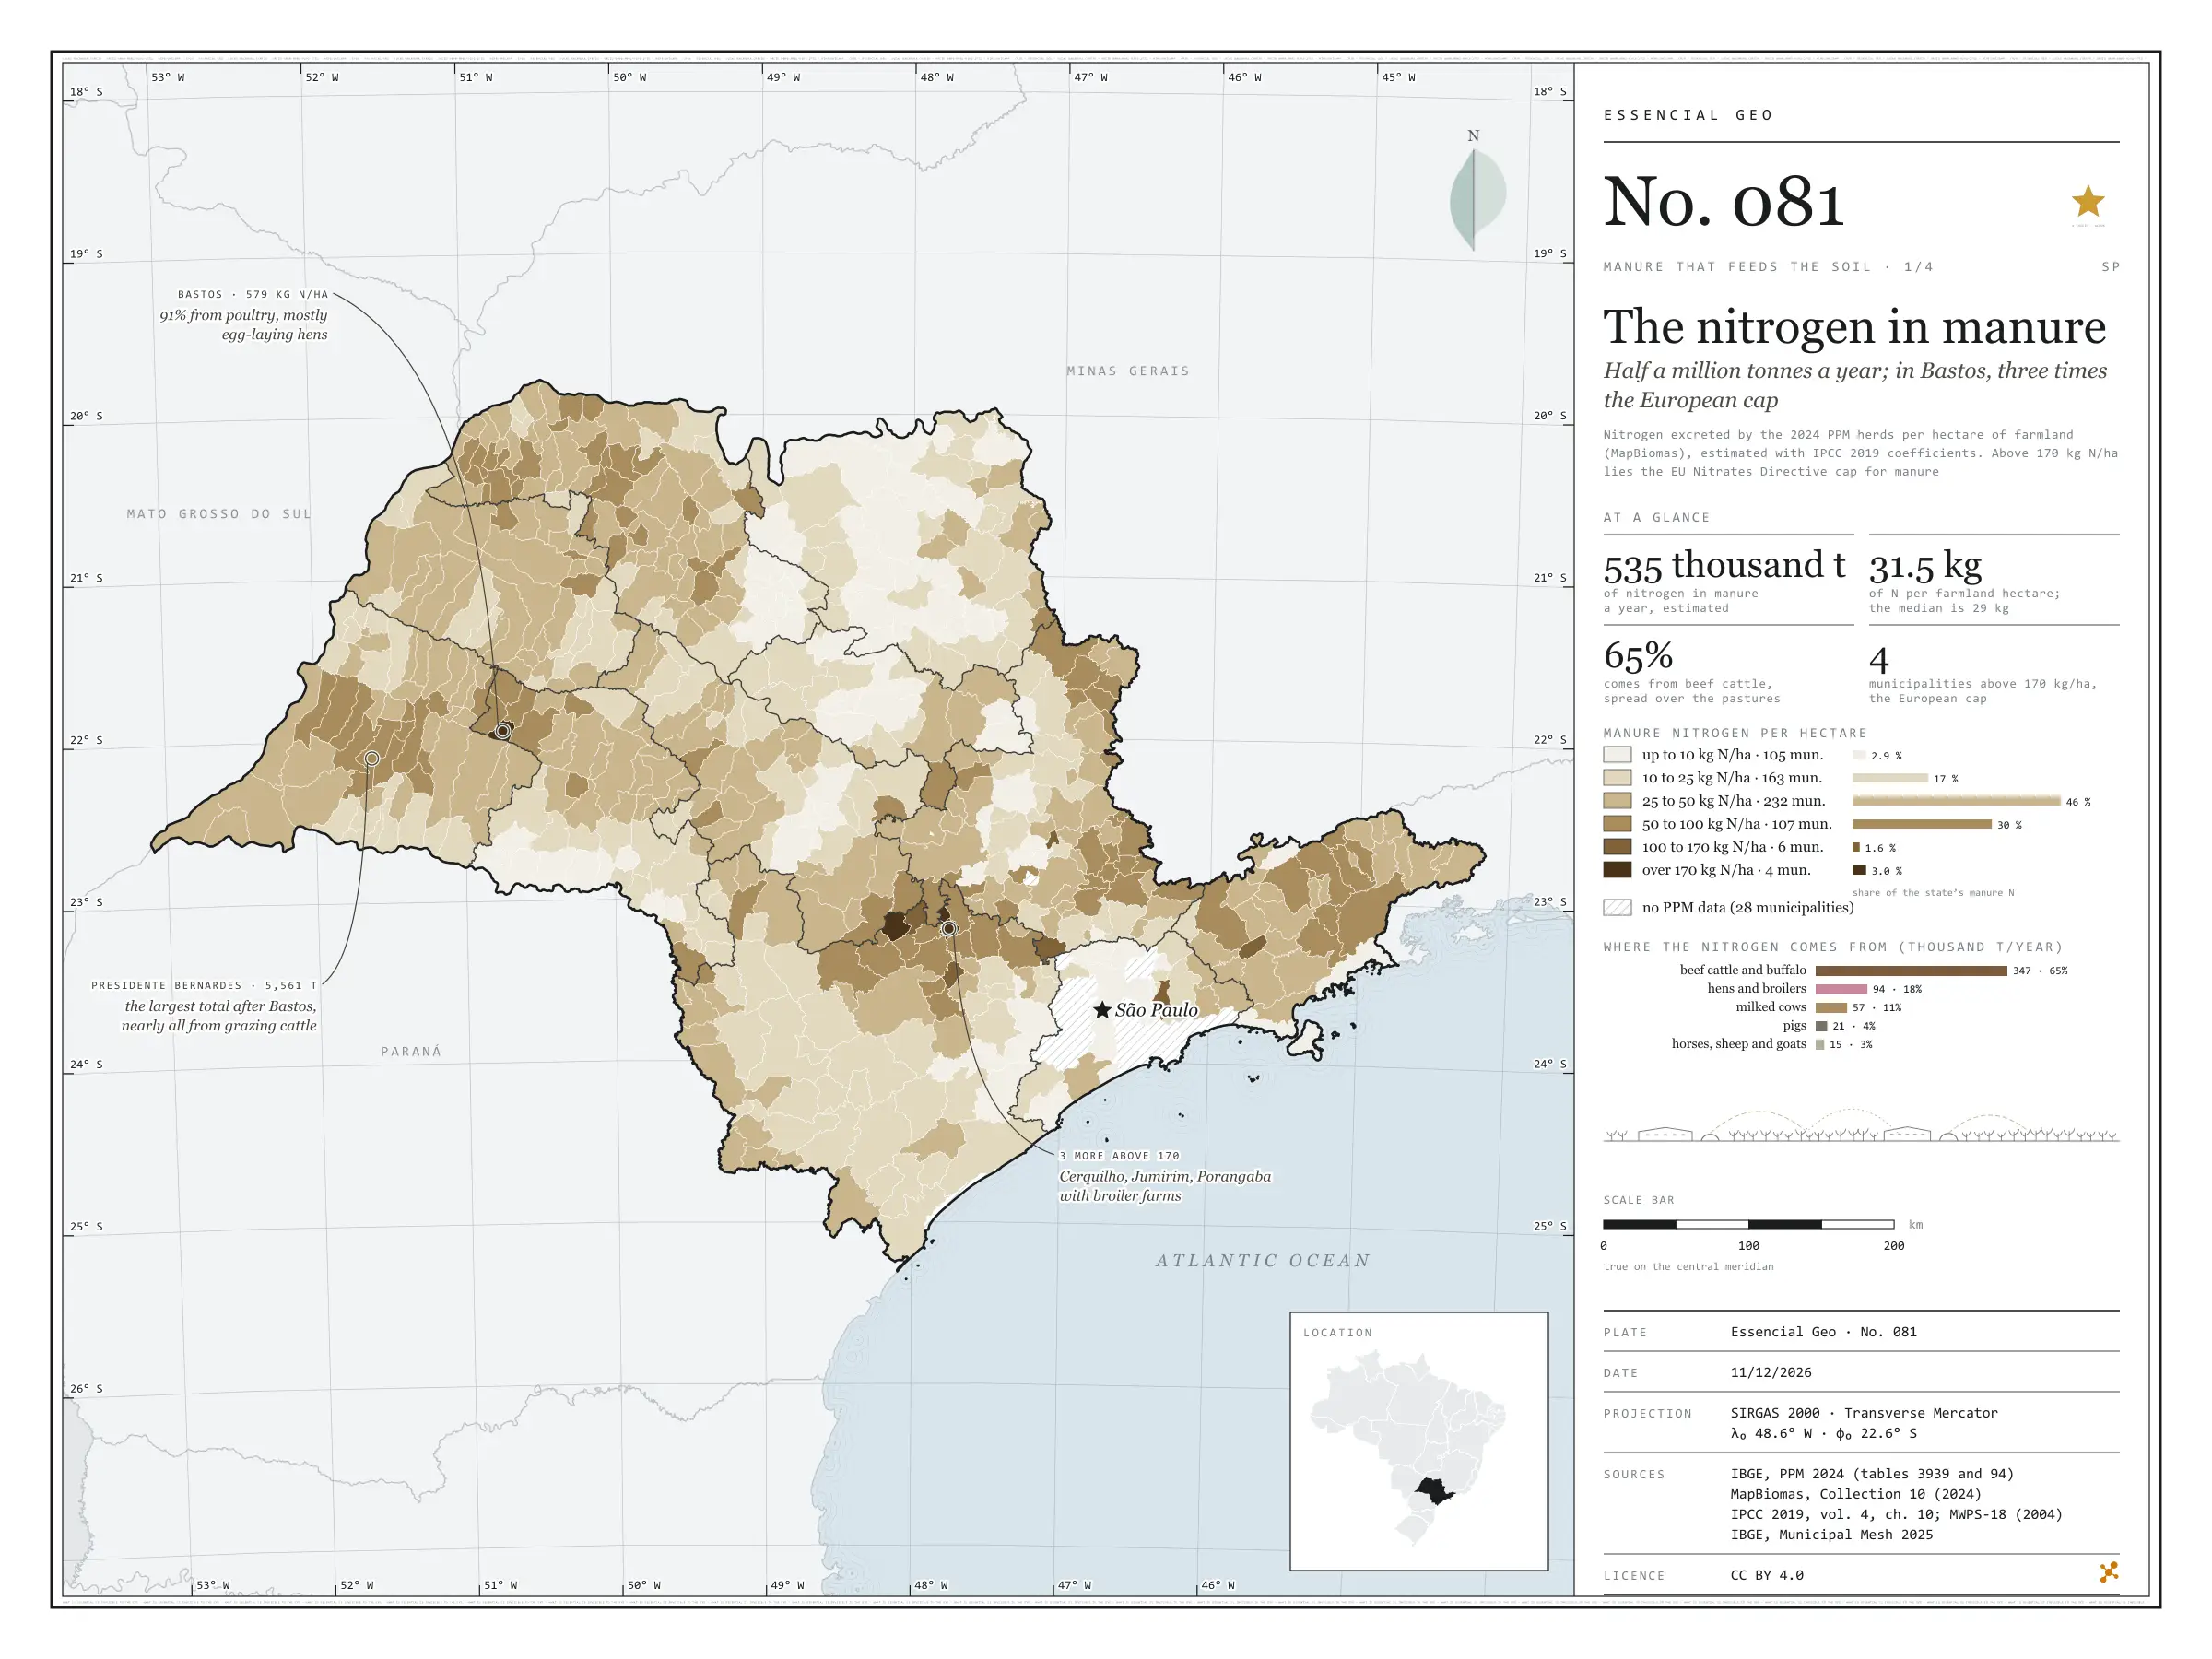
Fig. 081 São Paulo State (SP) EPSG:4674 Source: IBGE, MapBiomas, IPCC, MidWest Plan Service

São Paulo’s herds excrete about 535,000 tonnes of nitrogen a year, by a calculation using the 2024 PPM head counts and IPCC coefficients. Over the 16.9 million hectares of MapBiomas farmland, that is 31.5 kg of N per hectare; the municipal median is 29 kg. Nearly two thirds (65%) comes from beef cattle, spread across the pastures; poultry gives 18%, dairy cows 11% and pigs 4%. The EU Nitrates Directive caps manure applied in vulnerable zones at 170 kg of N per hectare. Four São Paulo municipalities exceed it: Bastos, the egg capital, with 579 kg/ha, and Cerquilho (232), Jumirim (219) and Porangaba (171), with broiler farms. Presidente Bernardes, in the Pontal, has the largest total after Bastos: 5,600 tonnes, nearly all from grazing cattle. First plate of the collection “Manure that feeds the soil”.

Technical record · downloads · citation

At a glance

Manure nitrogen by the municipality’s kg N per hectare class (t N a year)
  • up to 10 kg/ha 2.9%
  • 10 to 25 kg/ha 16.5%
  • 25 to 50 kg/ha 45.5%
  • 50 to 100 kg/ha 30.5%
  • 100 to 170 kg/ha 1.6%
  • over 170 kg/ha 3%
Manure nitrogen by herd (thousand t N a year)
  • beef cattle and buffalo 347
  • hens and broilers 94
  • milked cows 57
  • pigs 21
  • horses, sheep and goats 16
Manure nitrogen per farmland hectare

32 kg/ha

535,000 t N a year, estimated

Layers

  • municipios polygon 645 municipalities: 2024 PPM herds, farmland and cropland; manure N, P₂O₅ and K₂O; crop removal; coverage; CP2B digestate
  • regioes_intermediarias polygon 11 intermediate geographic regions
  • limite_estadual polygon State boundary

Metadata

Extent
São Paulo State (SP)
CRS / Projection
SIRGAS 2000 (EPSG:4674)
EPSG:4674
Software
Node.js · d3-geo · QGIS
Method
Head counts of each herd in the 2024 PPM times the nitrogen excreted per head per year (IPCC 2019, Latin American means), summed by municipality and divided by the 2024 MapBiomas farmland (pasture, temporary and perennial crops, sugarcane, citrus and mixed use), in six classes; the last starts at the Nitrates Directive cap of 170 kg of N per hectare.
Version
v1.0.0
Licence
CC BY 4.0
DOI
being registered on Zenodo

Downloads

Figure to reuse

The map without a frame, with legend, scale, reference system and credit written on it: ready for papers, lectures and slides. In two versions: with the basemap (neighbours and sea) or only the mapped area, on white.

Point a camera at it to open this page.

How to cite

Cerejo, L. N. (2026). O nitrogênio dos dejetos: meio milhão de toneladas por ano; em Bastos, três vezes o teto europeu [The nitrogen in manure: Half a million tonnes a year; in Bastos, three times the European cap] (Version 1.0.0) [Data set]. Essencial. https://aikiesan.github.io/essencial-geo/en/maps/081-nitrogenio-dos-dejetos-sp/

No. 082 Land use Manure that feeds the soil 2/4

The phosphorus in manure

In 177 municipalities, farms yield more phosphorus than the harvest removes

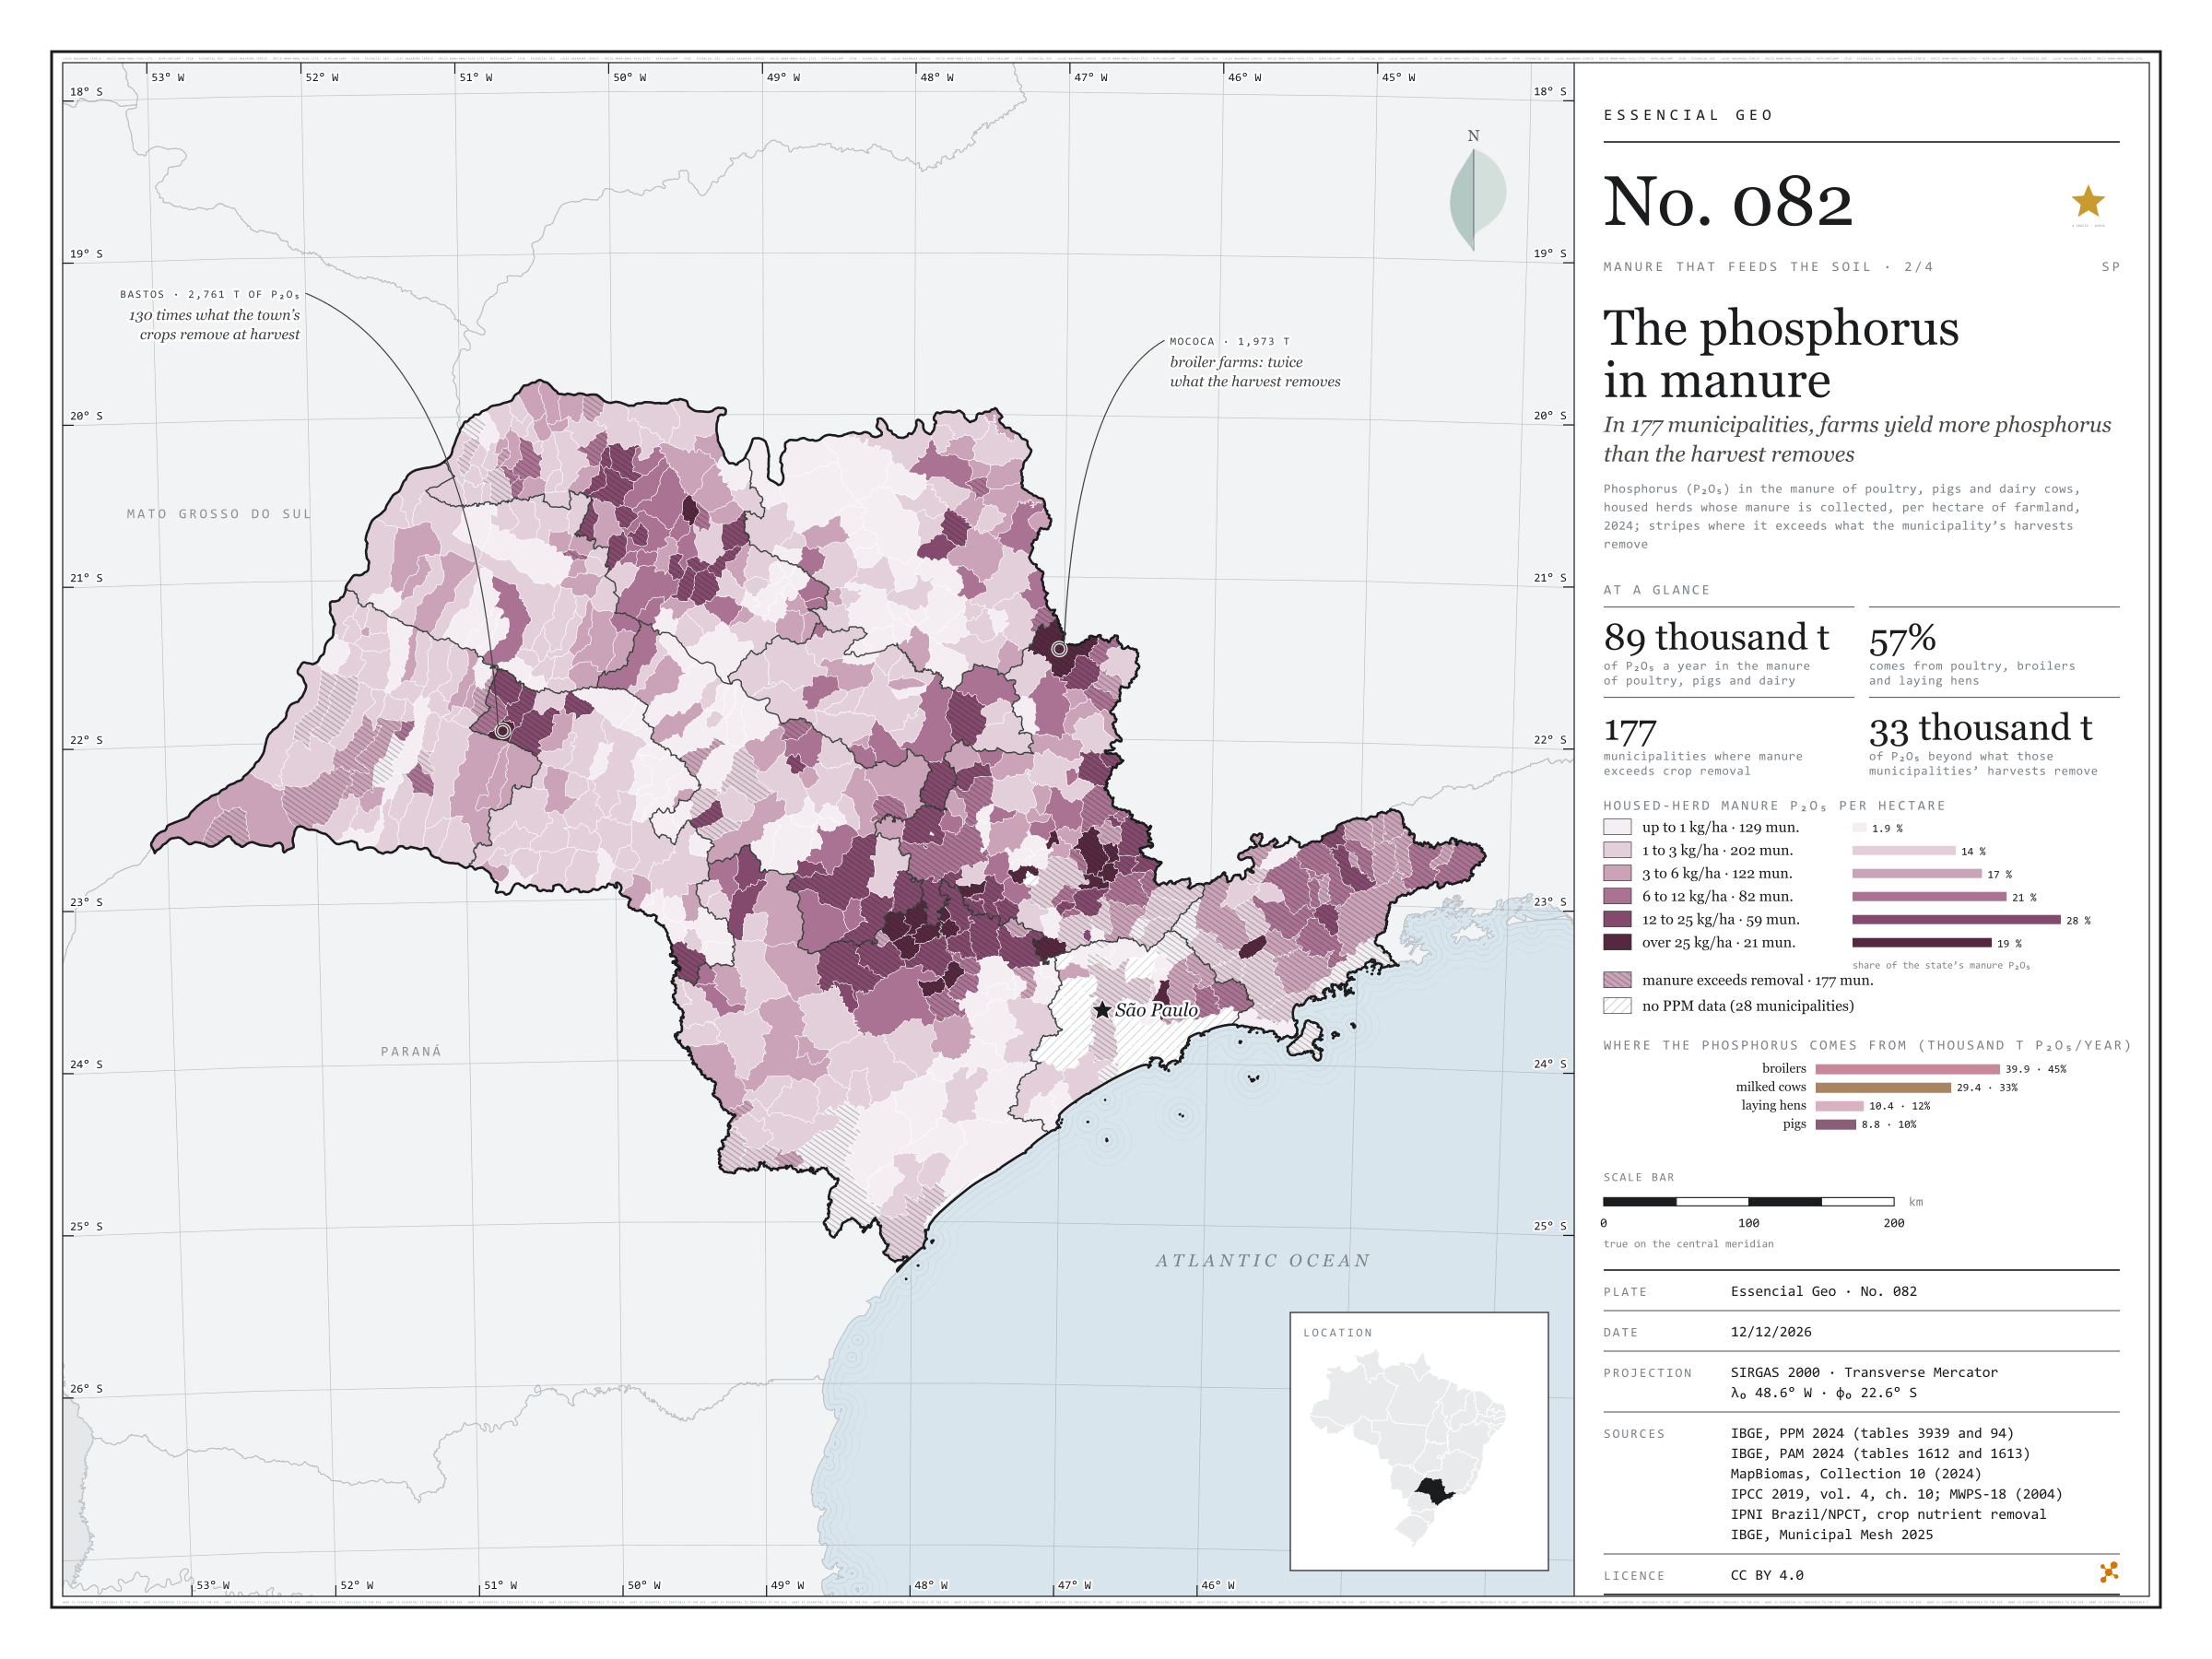
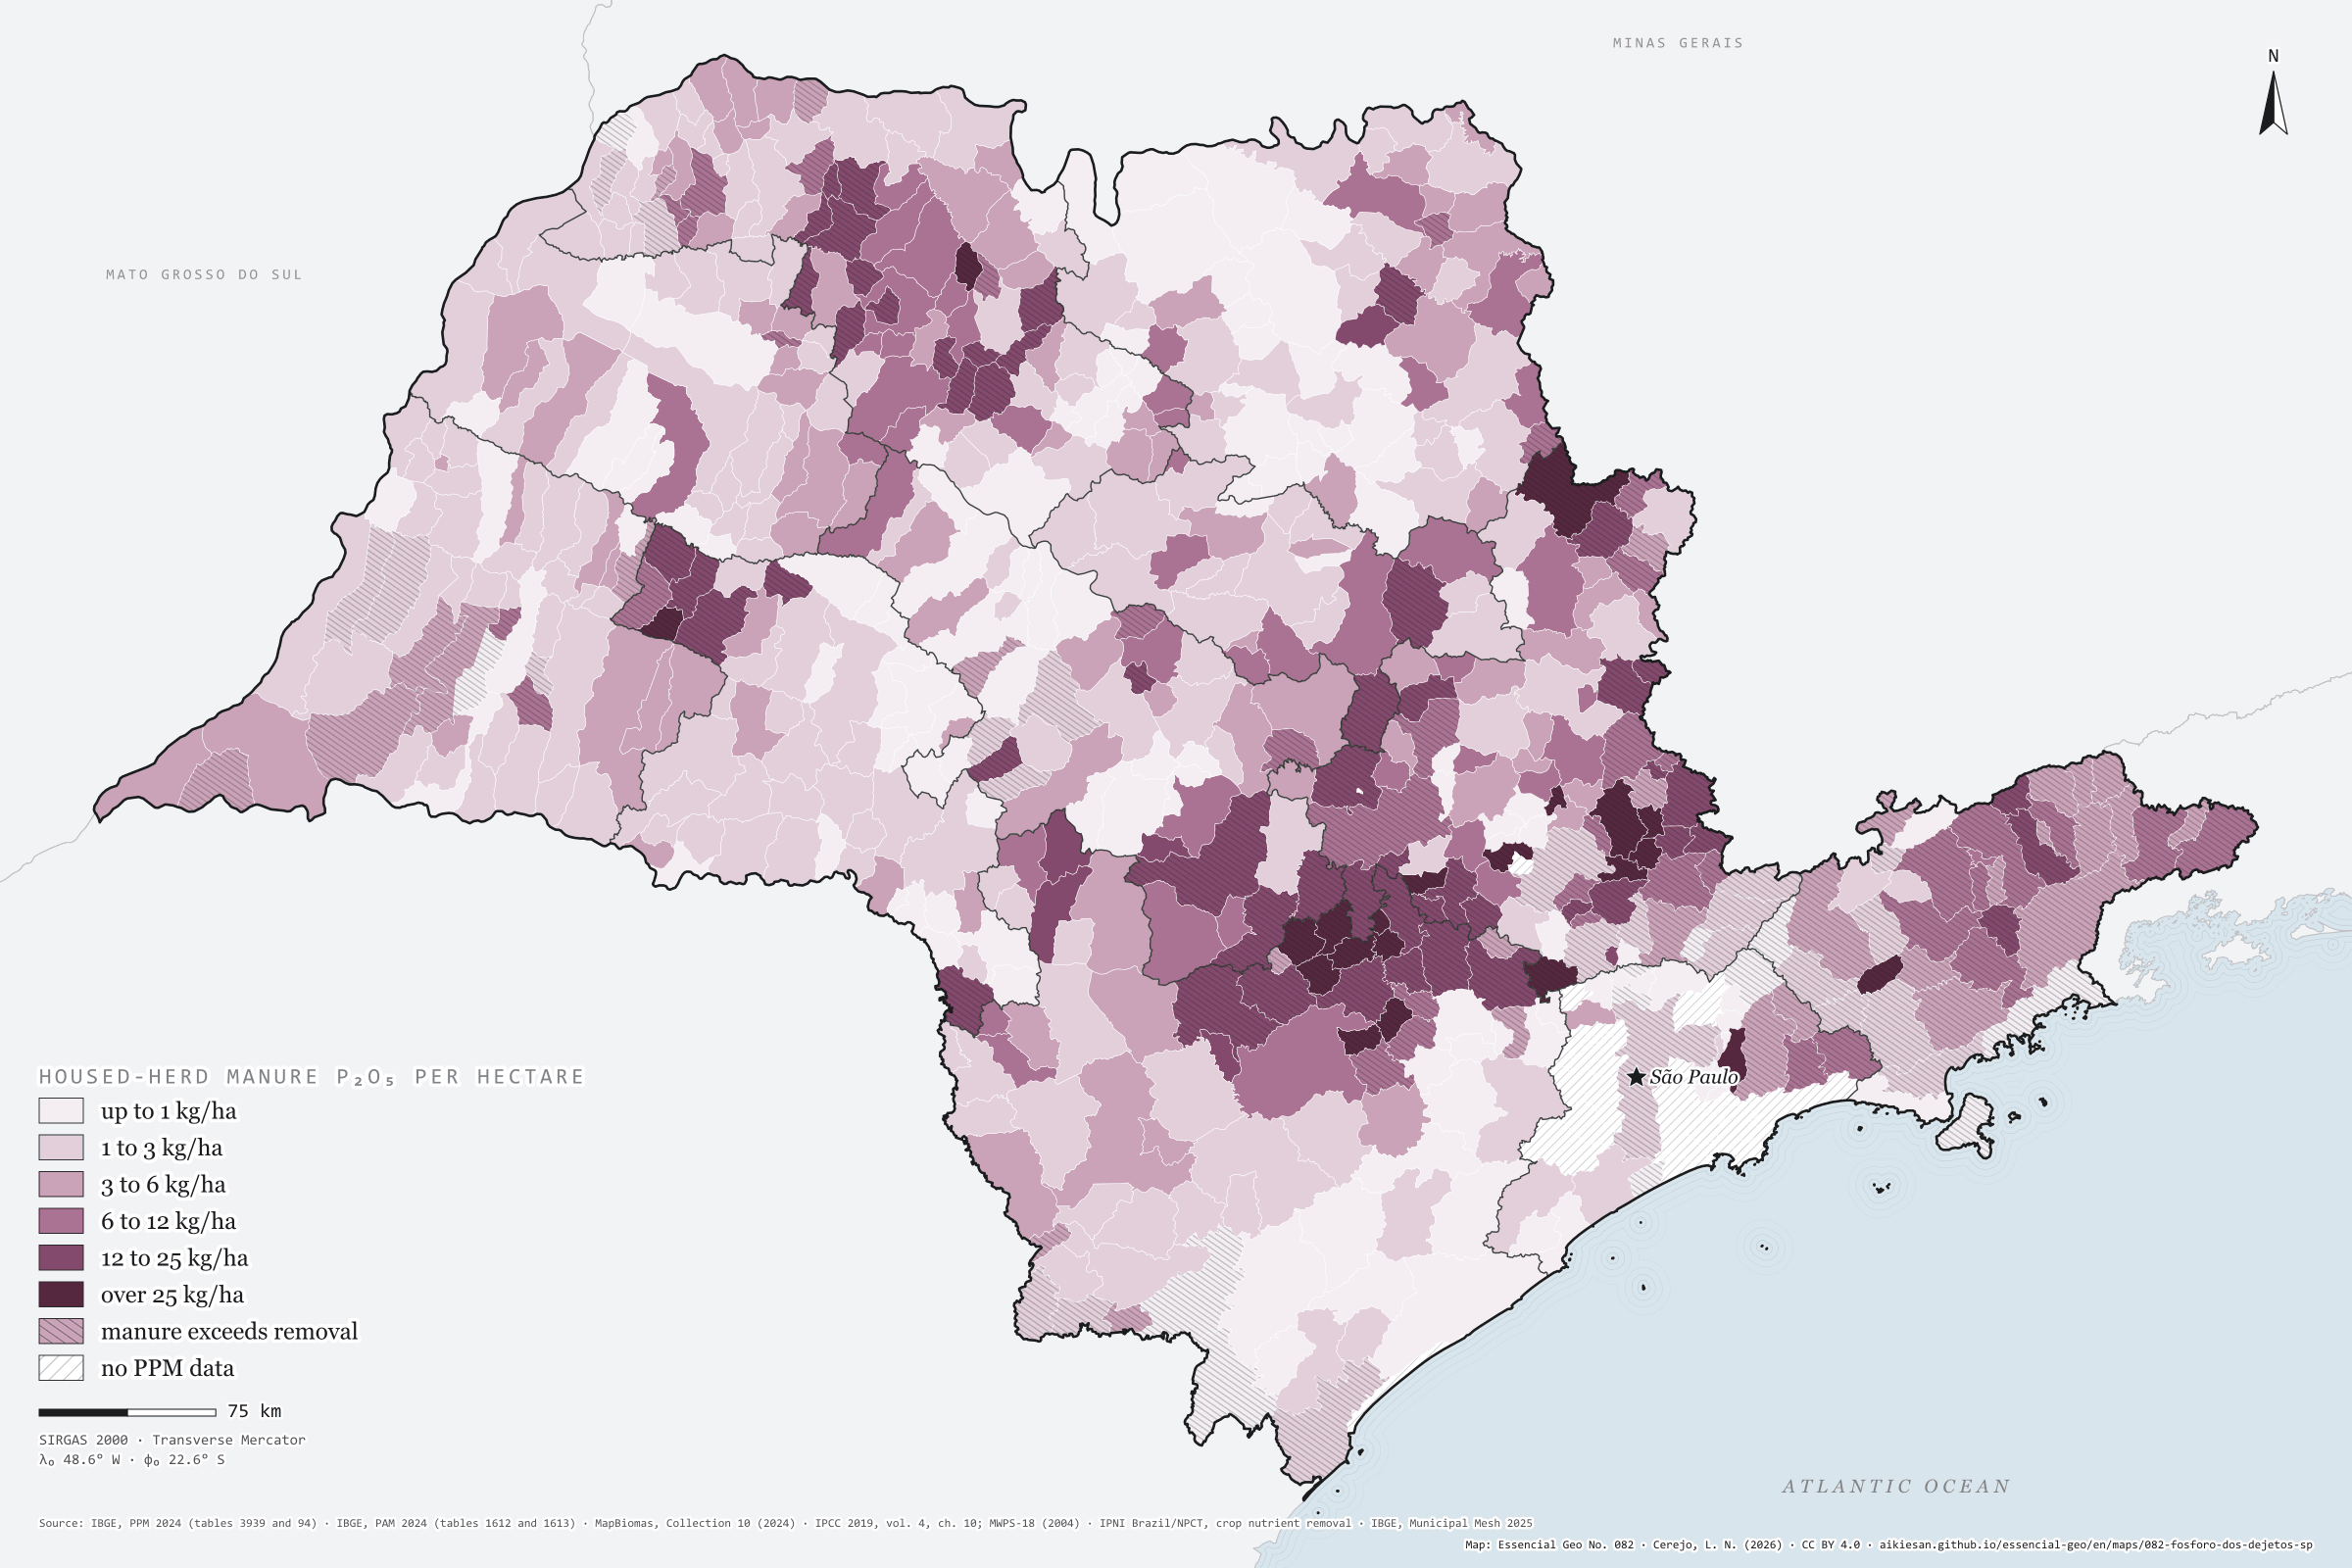
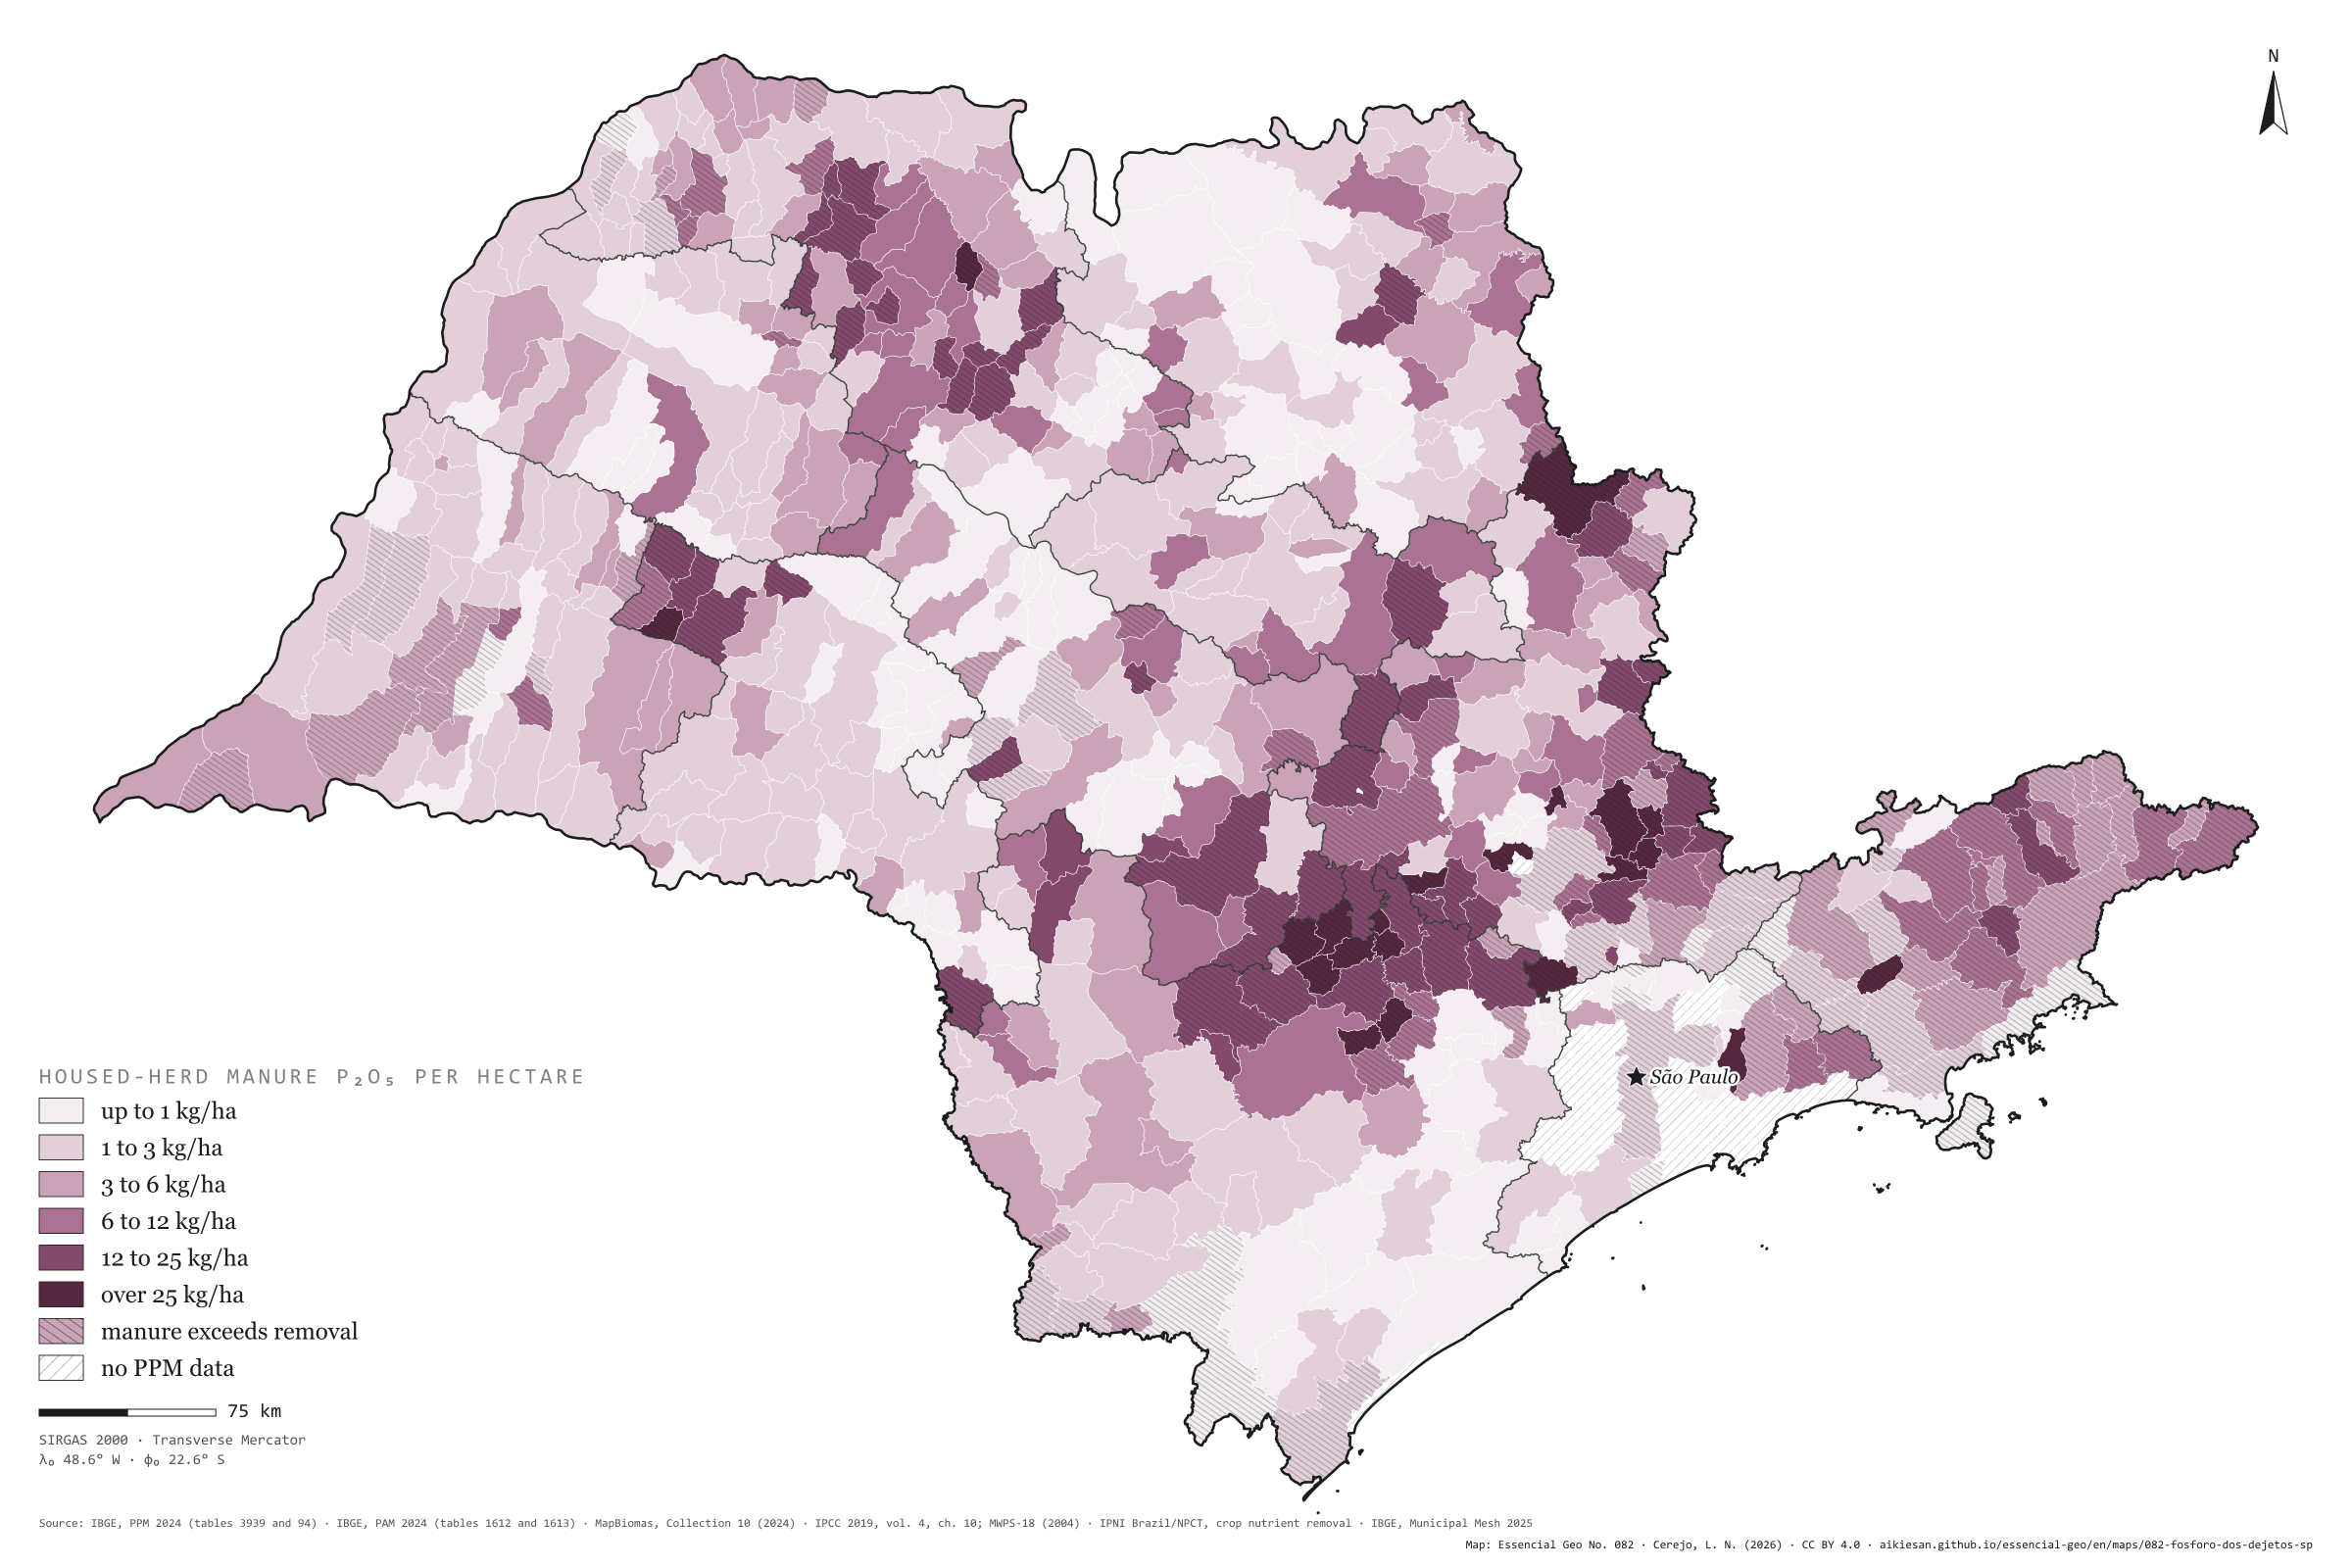
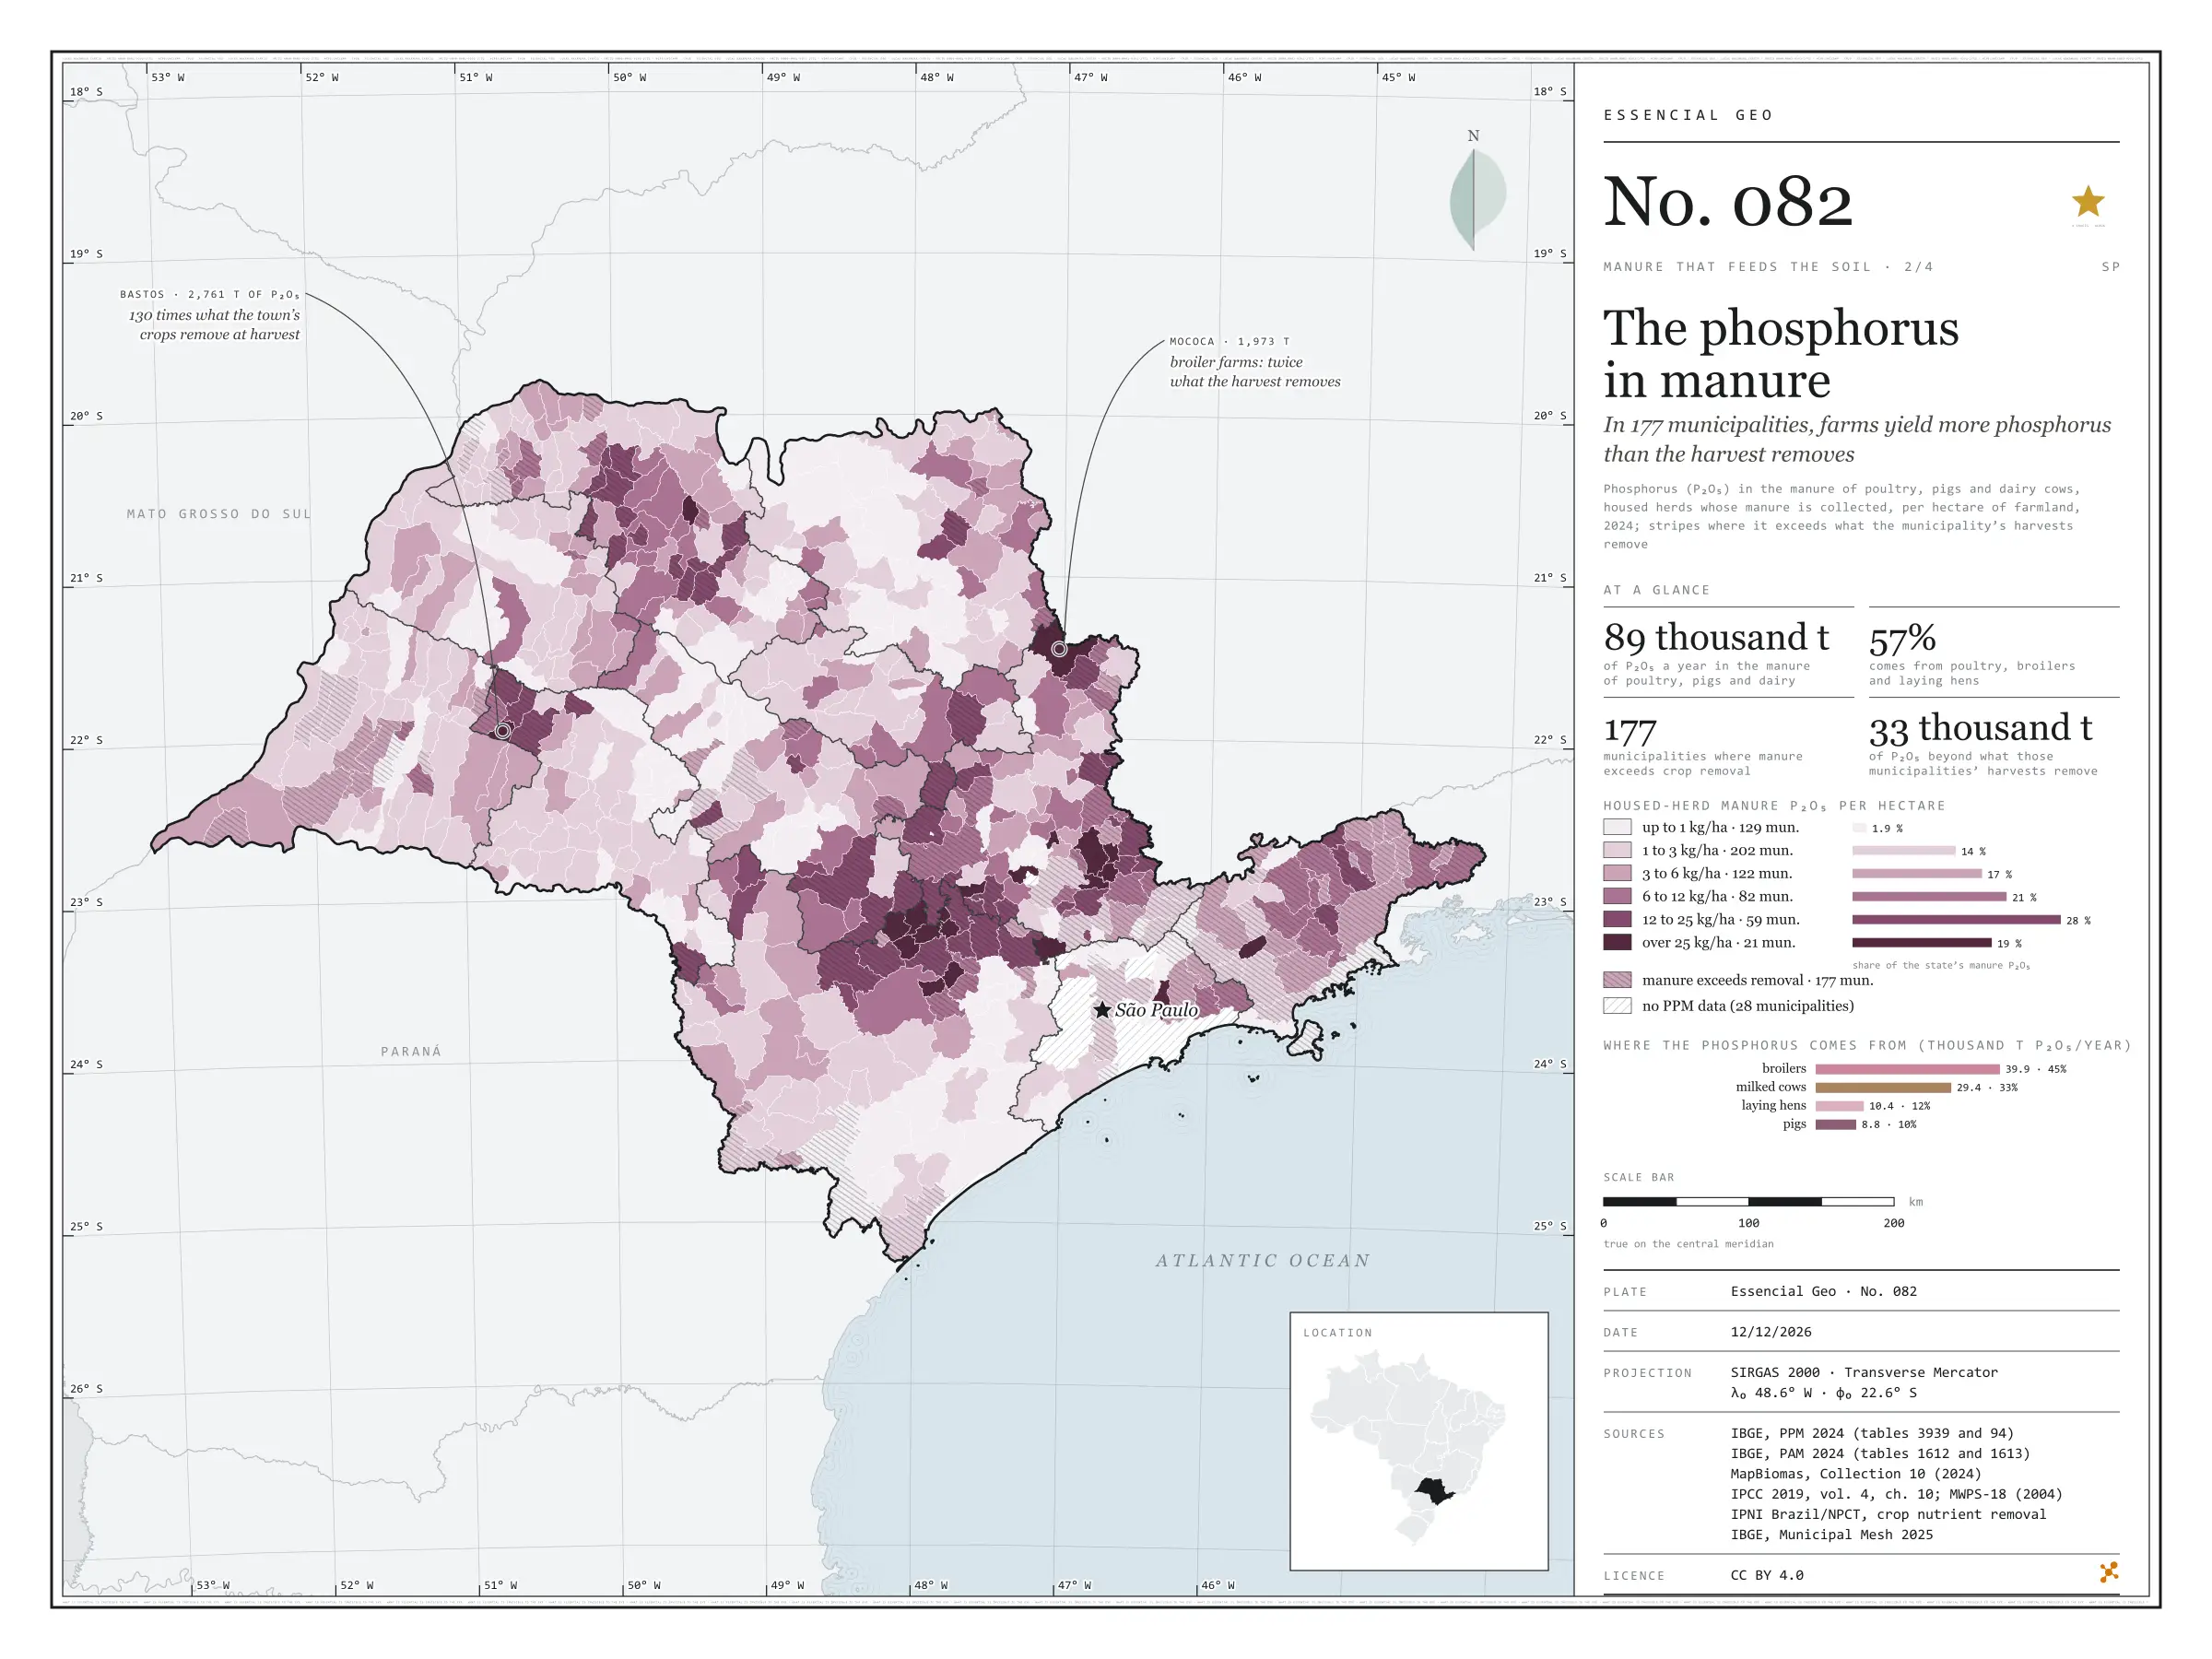
Fig. 082 São Paulo State (SP) EPSG:4674 Source: IBGE, MapBiomas, IPCC, MidWest Plan Service, IPNI Brazil/NPCT

Poultry, pigs and dairy cows live in sheds and byres, and their manure can be collected: about 88,500 tonnes of P₂O₅ a year in São Paulo, 5.2 kg per farmland hectare. Broilers give 45%, milked cows 33%, laying hens 12% and pigs 10%. Phosphorus builds up where farms cluster: Bastos has 188 kg of P₂O₅ per hectare, Cerquilho 131, Jumirim 98, Cabreúva and Porangaba 81. In 177 municipalities, manure phosphorus exceeds what the municipality’s own harvests remove; together they hold 51,000 tonnes of P₂O₅ in manure, 33,000 more than their crops take. In Bastos, manure holds 130 times the phosphorus of the harvest; in Mococa, with 6.75 million broilers, twice as much. Second plate of the collection “Manure that feeds the soil”.

Technical record · downloads · citation

At a glance

Housed-herd manure P₂O₅ by the municipality’s kg per hectare class (t P₂O₅ a year)
  • up to 1 kg/ha 1.9%
  • 1 to 3 kg/ha 13.8%
  • 3 to 6 kg/ha 17.3%
  • 6 to 12 kg/ha 20.6%
  • 12 to 25 kg/ha 27.8%
  • over 25 kg/ha 18.6%
Manure P₂O₅ by herd (thousand t P₂O₅ a year)
  • broilers 40
  • milked cows 29
  • laying hens 10
  • pigs 8.8
Municipalities where manure phosphorus exceeds crop removal

177 municipalities

33,000 t of P₂O₅ beyond what the harvests remove

Layers

  • municipios polygon 645 municipalities: herds, housed-herd manure N, P₂O₅ and K₂O, P₂O₅ per hectare and crop removal (same GPKG as plate 081)
  • regioes_intermediarias polygon 11 intermediate geographic regions
  • limite_estadual polygon State boundary

Metadata

Sources
IBGE — 2024 Municipal Livestock Survey (SIDRA, tables 3939 and 94; table 94 retrieved from https://apisidra.ibge.gov.br/values/t/94/n6/in%20n3%2035/v/all/p/2024 on 18/10/2026) (2024)
IBGE — 2024 Municipal Agricultural Production (SIDRA, tables 1612 and 1613, variables 214 and 216; retrieved from https://apisidra.ibge.gov.br/values/t/1612/n6/in%20n3%2035/v/214/p/2024/c81/all and equivalents on 18/10/2026) (2024)
MapBiomas — Collection 10 of the Annual Series of Land Use and Land Cover Maps of Brazil, 2024 (farmland by municipality, from plate 045) (2024)
IPCC — 2019 Refinement to the 2006 IPCC Guidelines for National Greenhouse Gas Inventories, vol. 4, ch. 10 (tables 10.19 and 10A.5) (2019)
MidWest Plan Service — MWPS-18, Manure Characteristics, section 1, 2nd ed. (table 6) (2004)
IPNI Brazil/NPCT — Nutrient Balance Calculator (contents in the harvested product; Cunha, Casarin and Prochnow, Informações Agronômicas 130 and 145) (2014)
IBGE — Municipal Mesh 2025 (2025)
Extent
São Paulo State (SP)
CRS / Projection
SIRGAS 2000 (EPSG:4674)
EPSG:4674
Software
Node.js · d3-geo · QGIS
Method
Head counts of hens, broilers, pigs, sows and milked cows in the 2024 PPM times the P₂O₅ excreted per head per year (IPCC 2019 nitrogen times the MWPS-18 P₂O₅/N ratio), per hectare of 2024 MapBiomas farmland, in six classes; stripes where that P₂O₅ exceeds the municipality’s crop removal (2024 PAM × IPNI contents).
Version
v1.0.0
Licence
CC BY 4.0
DOI
being registered on Zenodo

Downloads

Figure to reuse

The map without a frame, with legend, scale, reference system and credit written on it: ready for papers, lectures and slides. In two versions: with the basemap (neighbours and sea) or only the mapped area, on white.

Point a camera at it to open this page.

How to cite

Cerejo, L. N. (2026). O fósforo dos dejetos: em 177 municípios, as granjas dão mais fósforo do que a colheita leva [The phosphorus in manure: In 177 municipalities, farms yield more phosphorus than the harvest removes] (Version 1.0.0) [Data set]. Essencial. https://aikiesan.github.io/essencial-geo/en/maps/082-fosforo-dos-dejetos-sp/

No. 083 Land use Manure that feeds the soil 3/4

Manure and harvests

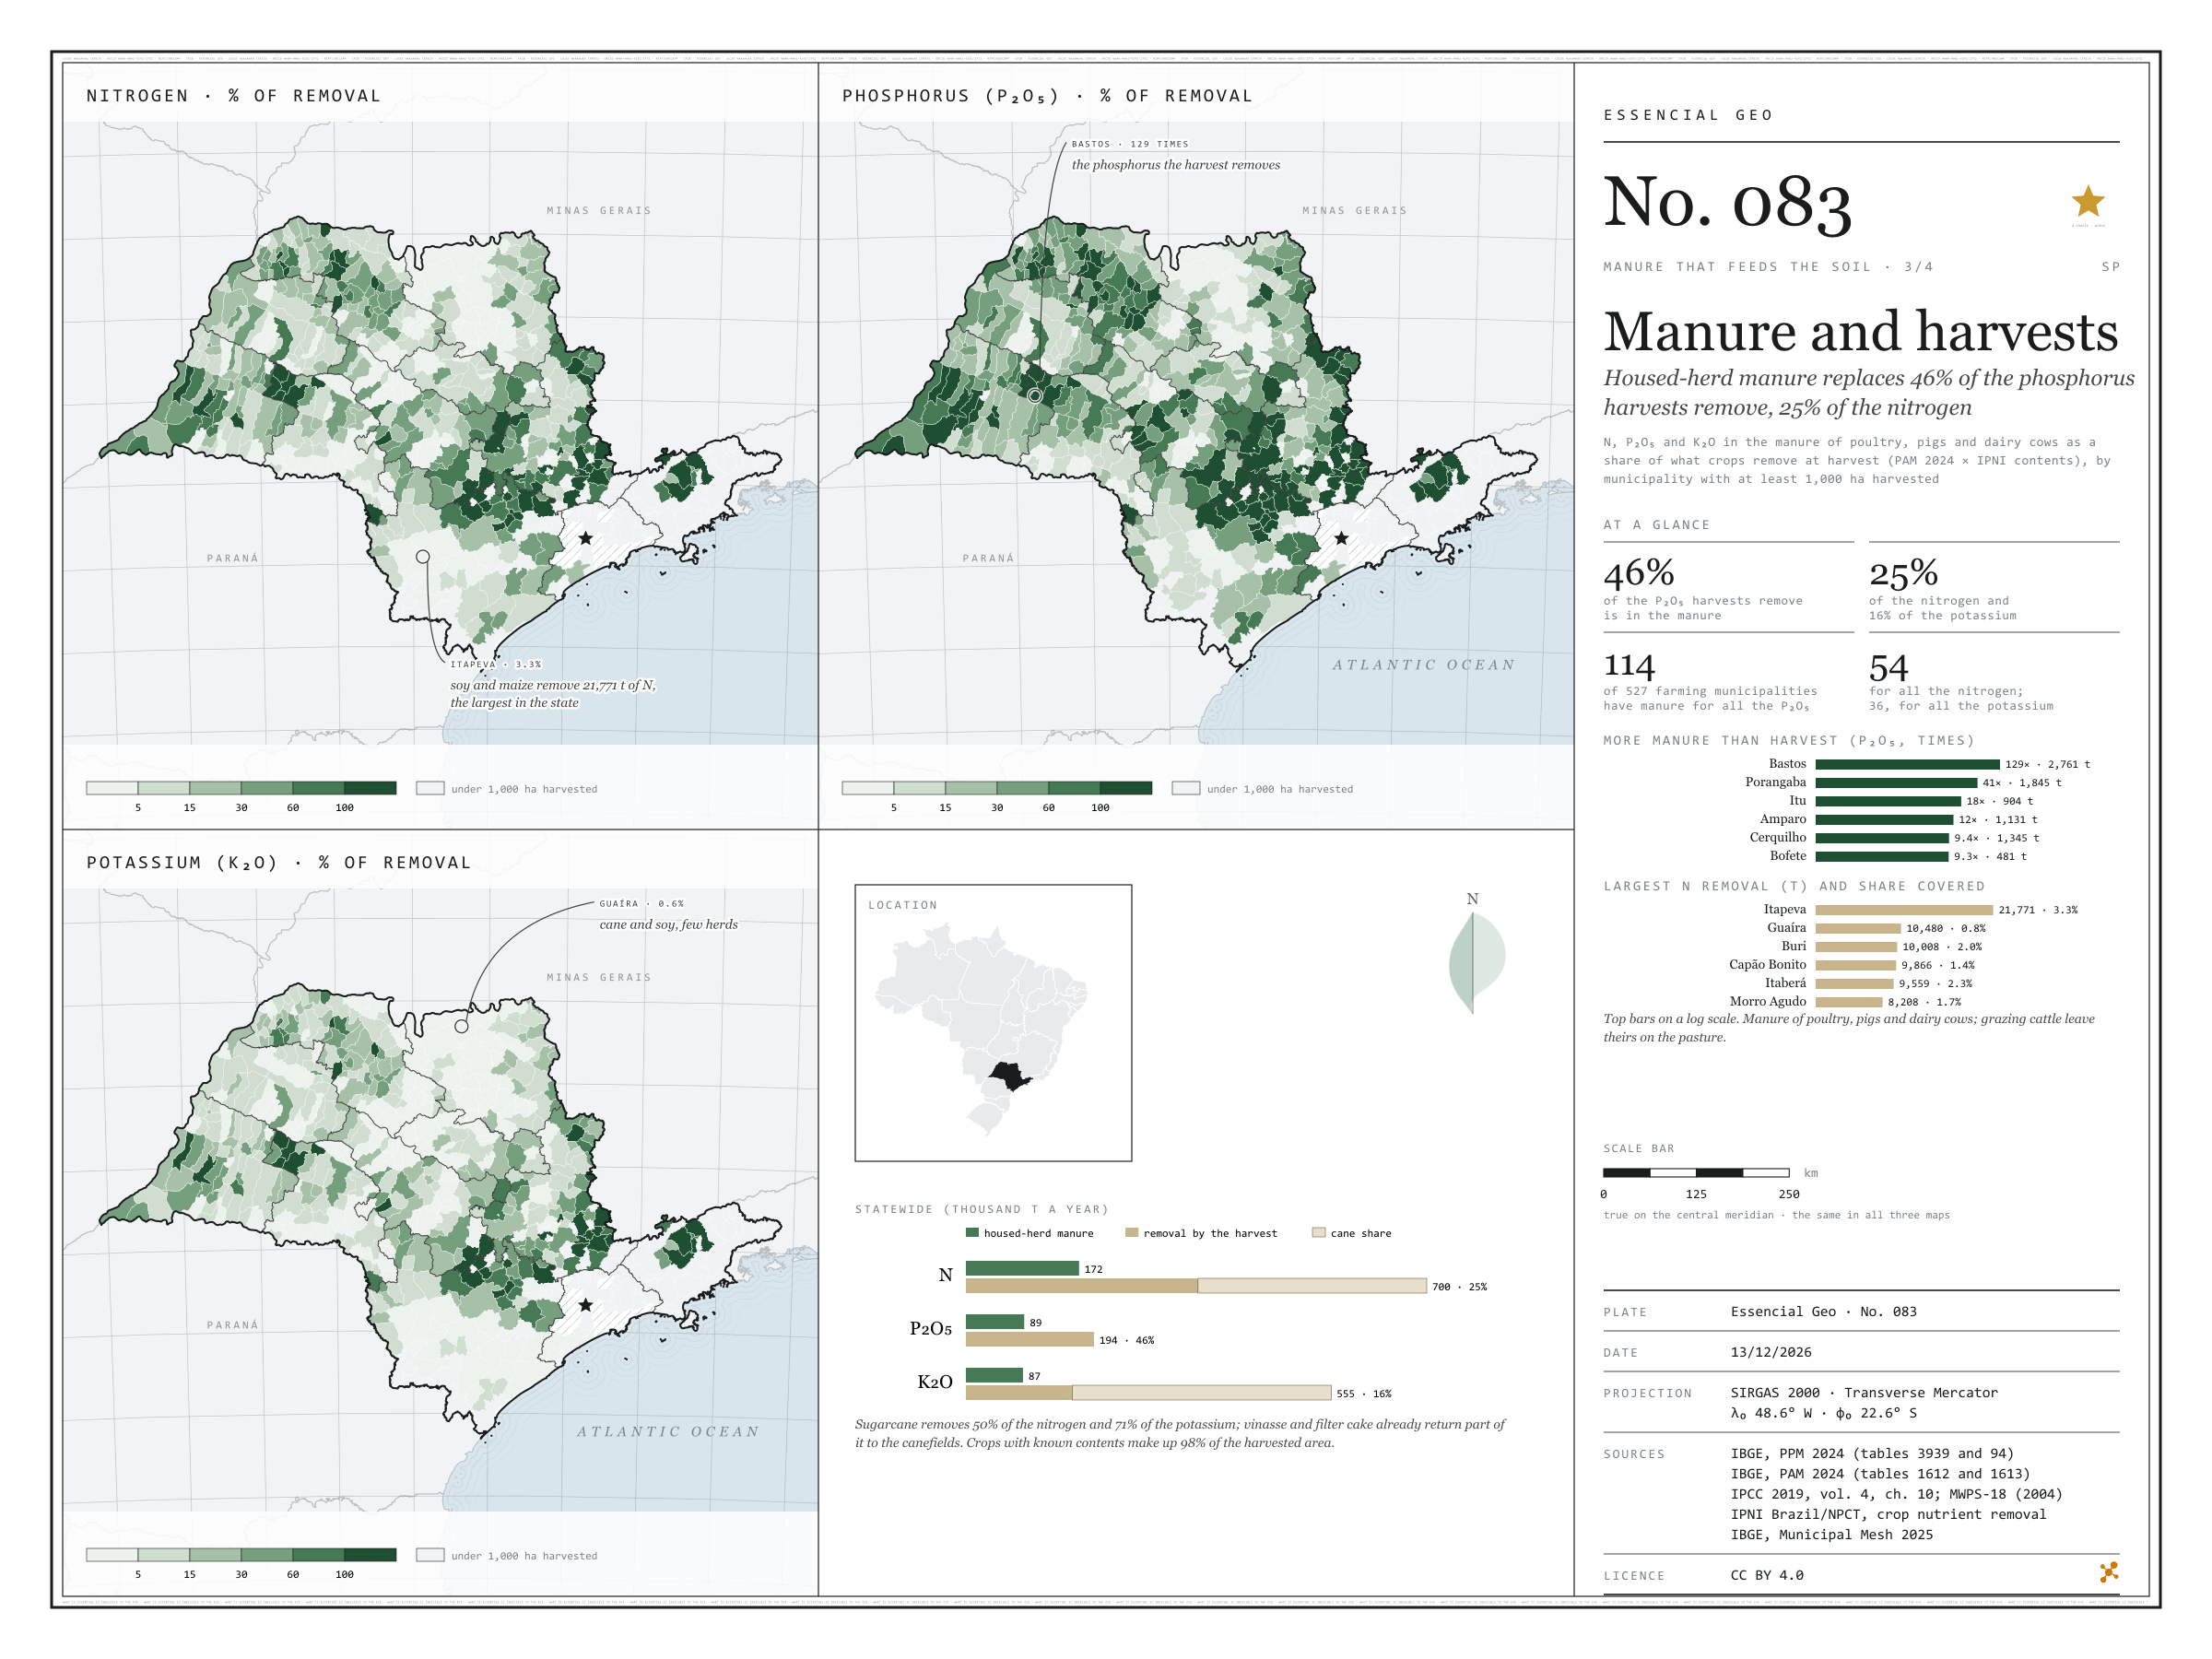
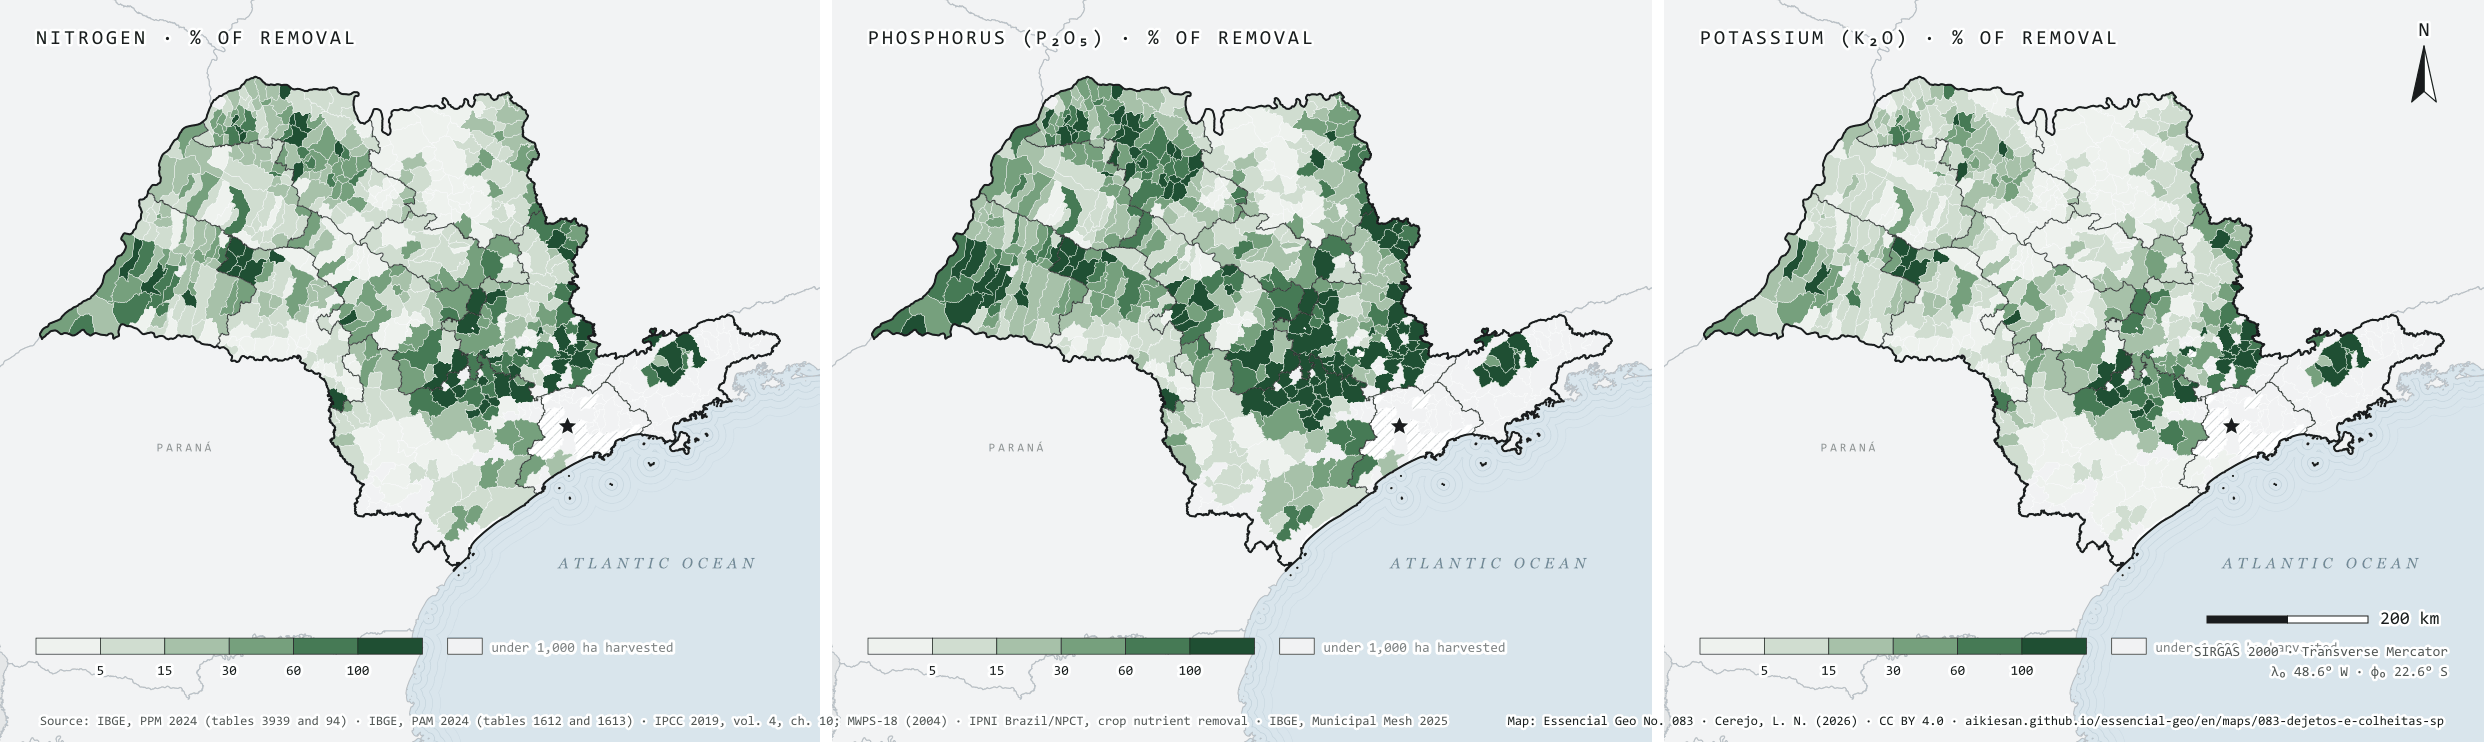
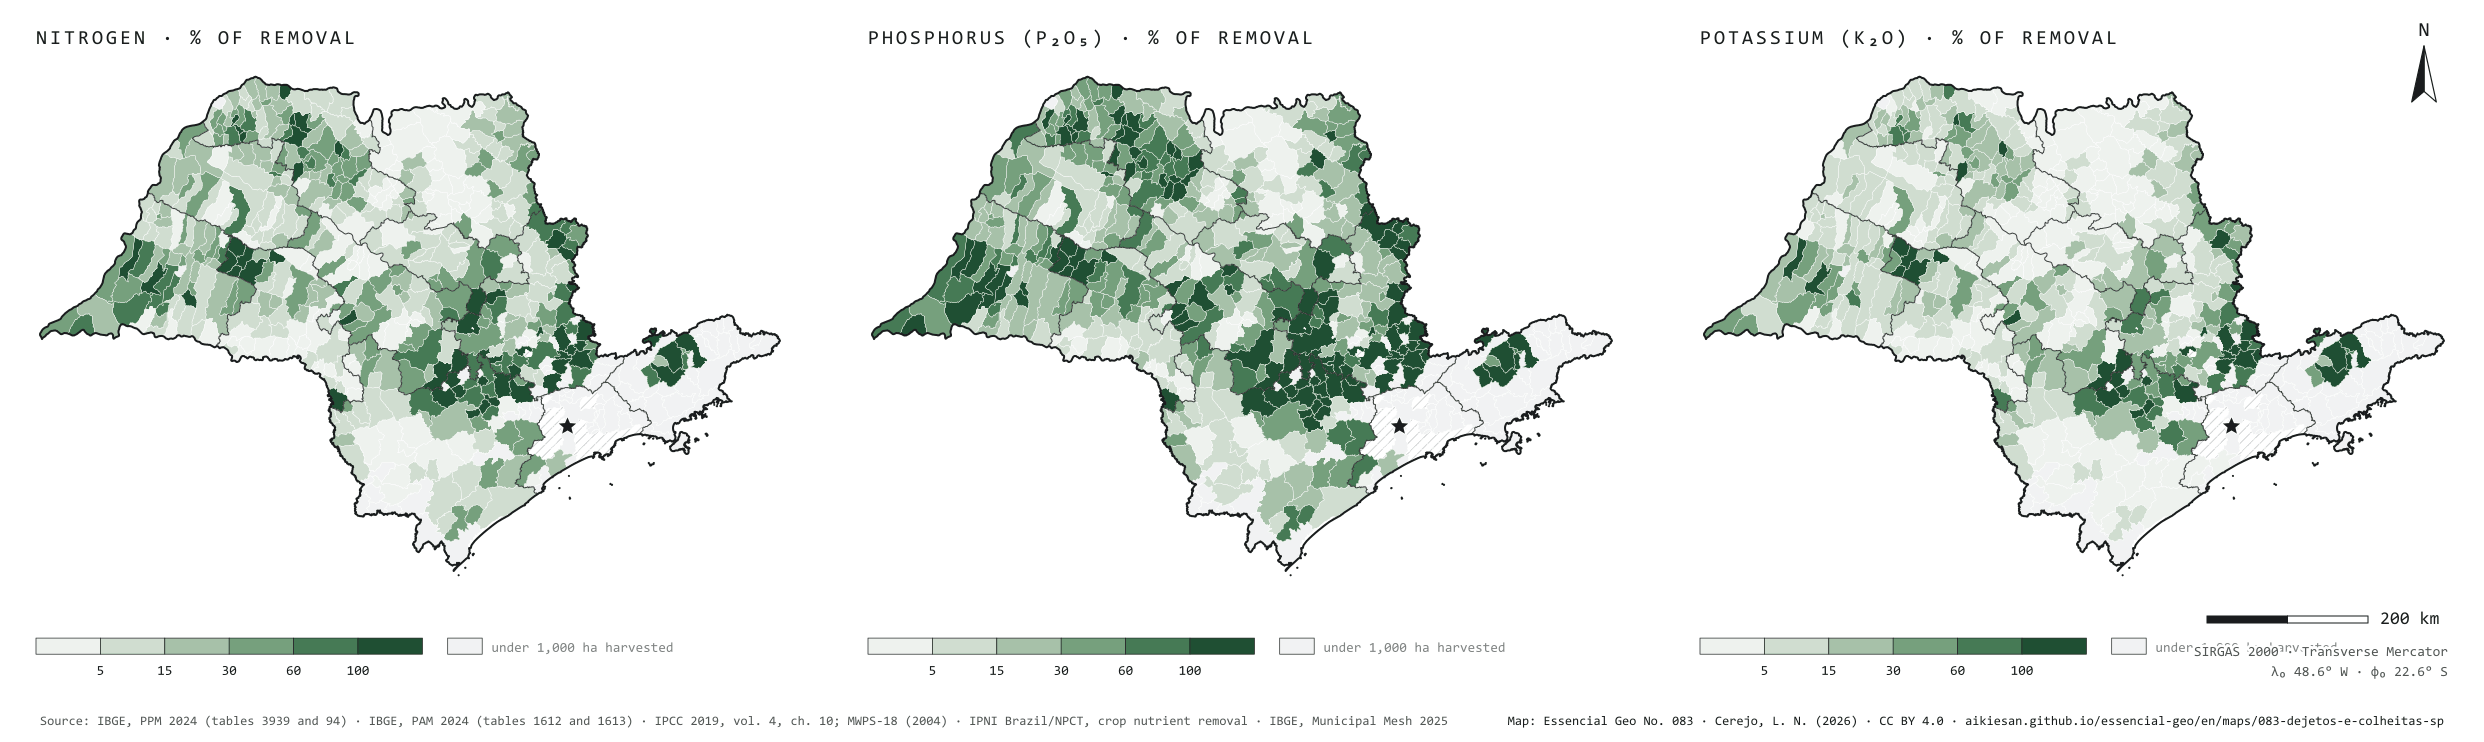
Housed-herd manure replaces 46% of the phosphorus harvests remove, 25% of the nitrogen

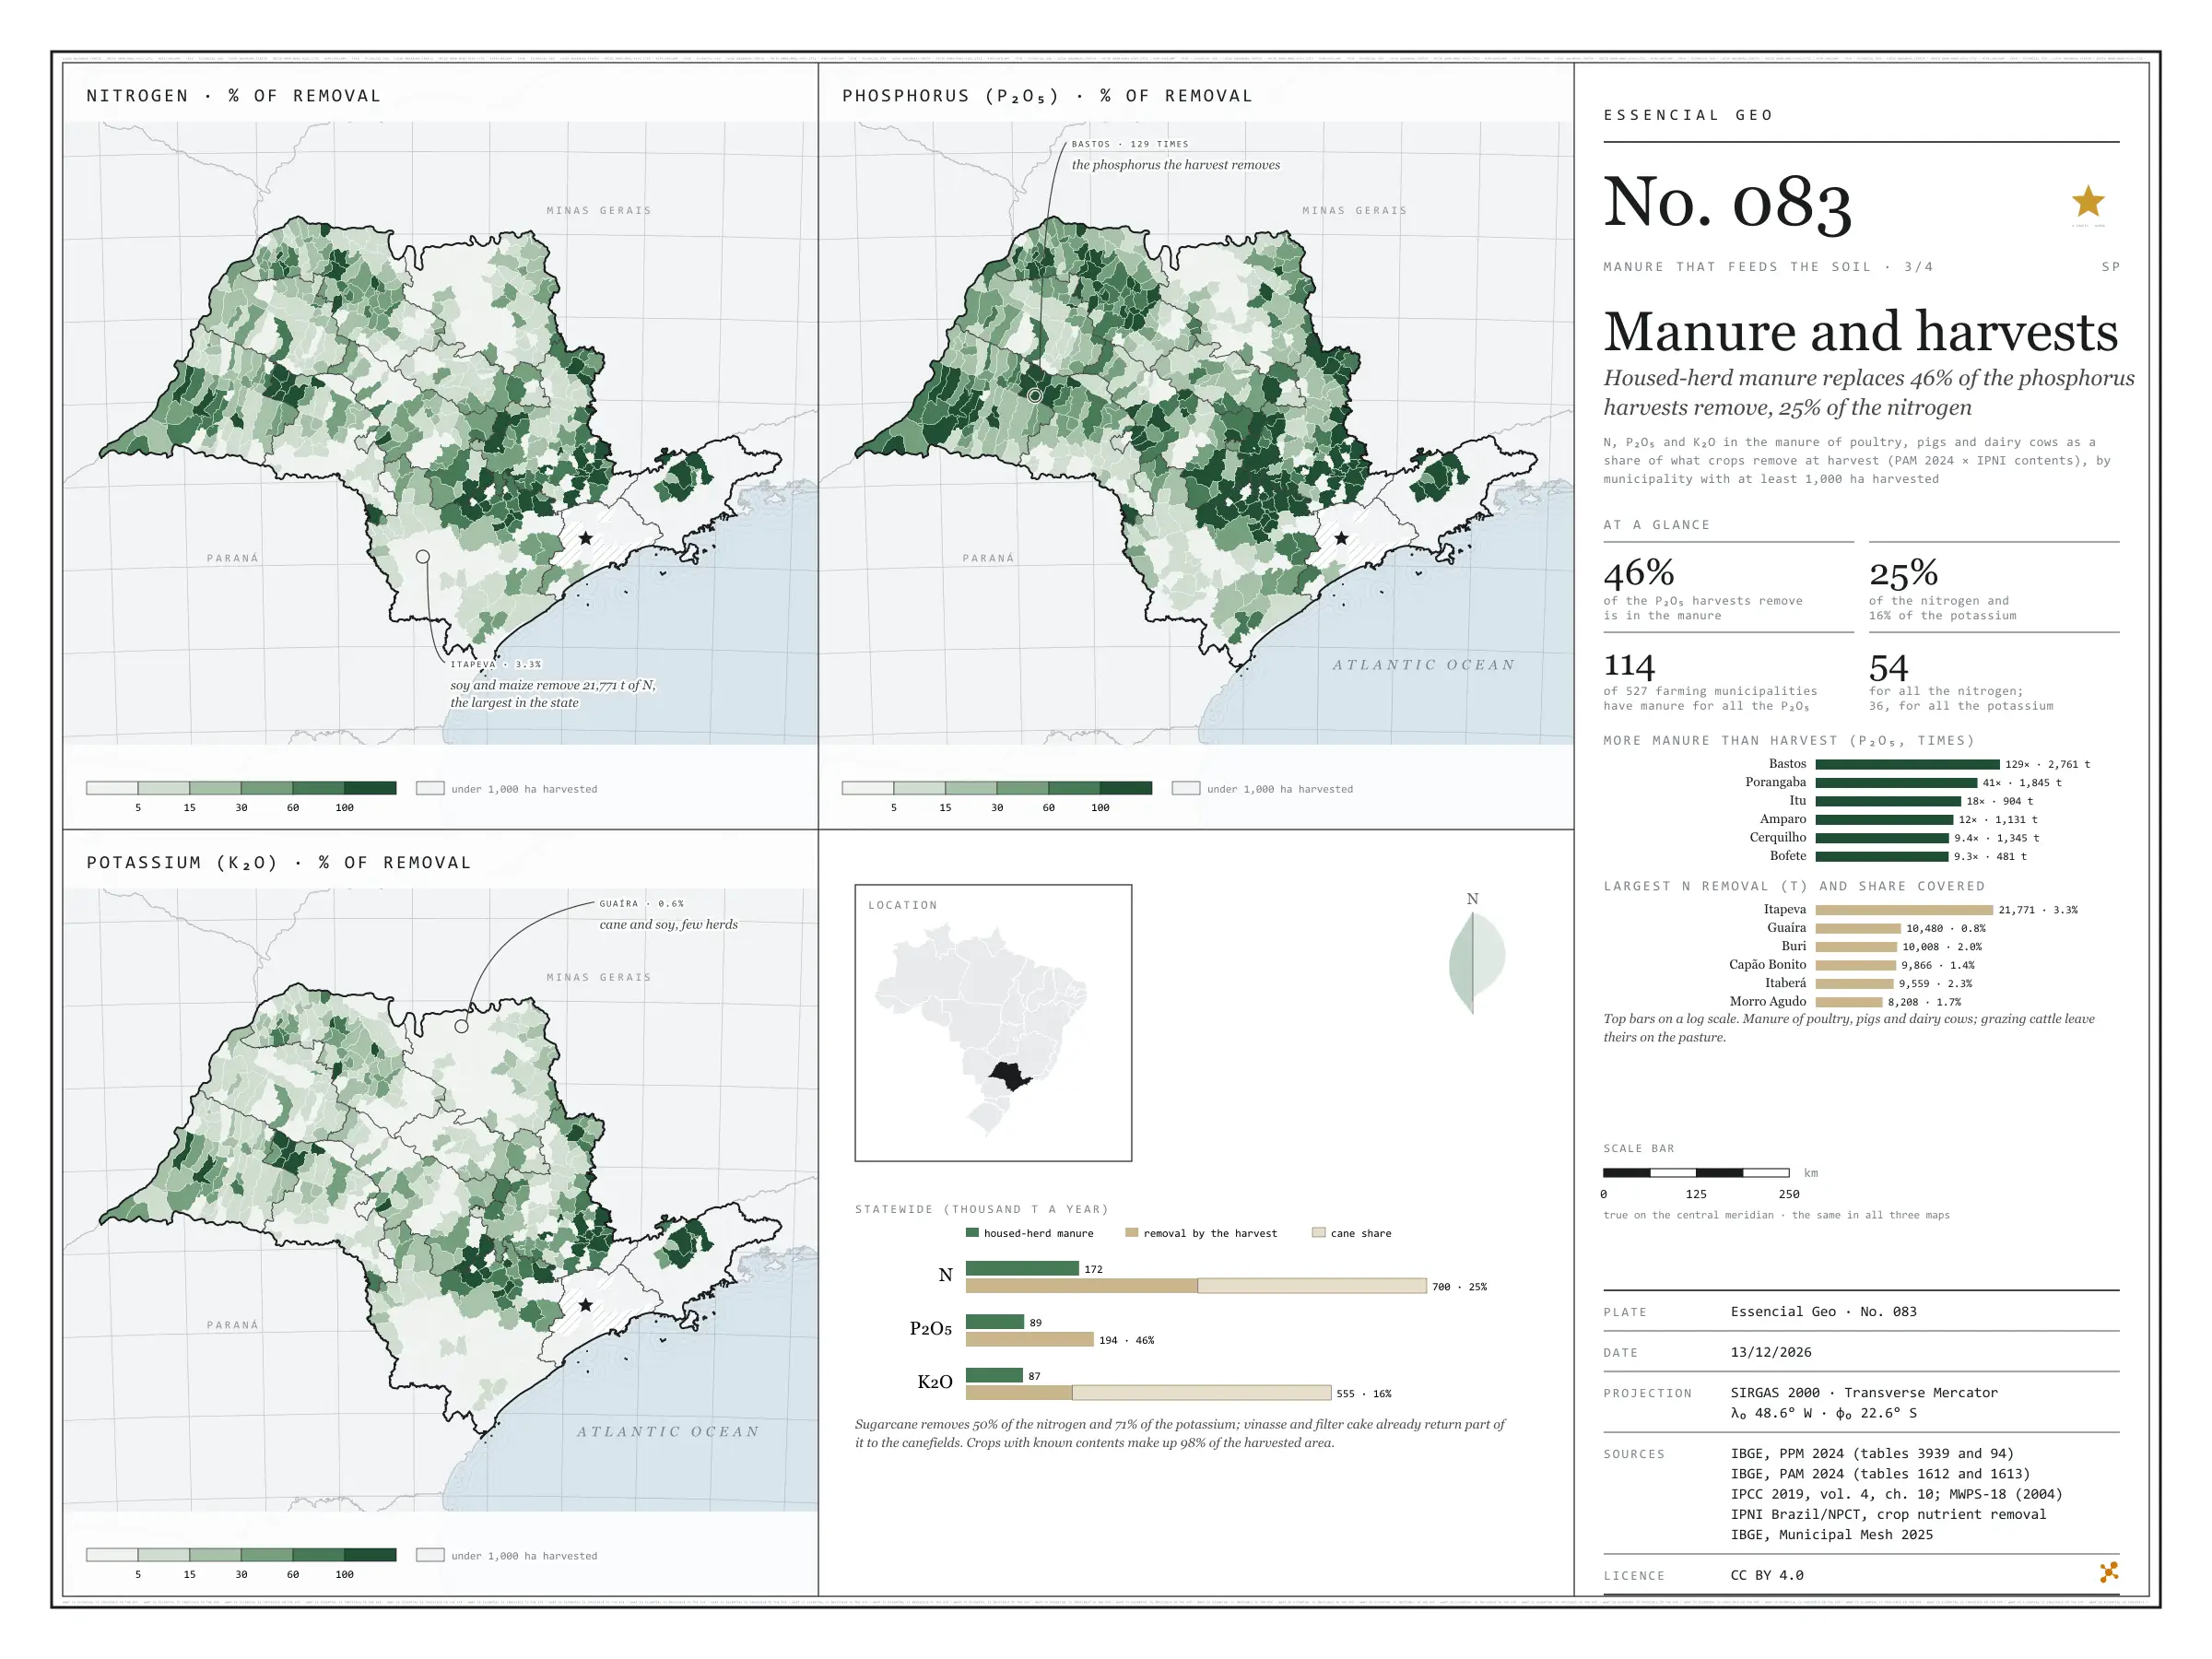
Fig. 083 São Paulo State (SP) EPSG:4674 Source: IBGE, IPNI Brazil/NPCT, IPCC, MidWest Plan Service

São Paulo’s harvests take from the soil, every year, about 700,000 tonnes of nitrogen, 194,000 of P₂O₅ and 555,000 of K₂O, by 2024 PAM production and IPNI contents. The manure of poultry, pigs and dairy cows, the part that can be collected, holds 172,000, 89,000 and 87,000: it replaces 46% of the phosphorus, 25% of the nitrogen and 16% of the potassium. Sugarcane weighs on the account: it removes half the nitrogen and 71% of the potassium, and part of that returns to the canefields with vinasse and filter cake. Of the 527 municipalities with at least 1,000 hectares harvested, 114 have manure to replace all the phosphorus, 54 all the nitrogen and 36 all the potassium. In the grain regions the account does not balance: Itapeva removes 21,800 tonnes of N at harvest, and local manure covers 3.3%. Third plate of the collection “Manure that feeds the soil”.

Technical record · downloads · citation

At a glance

Share of crop removal that housed-herd manure replaces, statewide (%)
  • phosphorus (P₂O₅) 46
  • nitrogen (N) 25
  • potassium (K₂O) 16
Crop removal and housed-herd manure (thousand t a year)
  • N removed 700
  • N in manure 172
  • P₂O₅ removed 194
  • P₂O₅ in manure 89
  • K₂O removed 555
  • K₂O in manure 87
Farming municipalities with manure for all the harvest’s phosphorus

114 of 527

with at least 1,000 hectares harvested

Layers

  • municipios polygon 645 municipalities: housed-herd manure, crop removal of N, P₂O₅ and K₂O and coverage (same GPKG as plate 081)
  • regioes_intermediarias polygon 11 intermediate geographic regions
  • limite_estadual polygon State boundary

Metadata

Sources
IBGE — 2024 Municipal Agricultural Production (SIDRA, tables 1612 and 1613, variables 214 and 216; retrieved from https://apisidra.ibge.gov.br/values/t/1612/n6/in%20n3%2035/v/214/p/2024/c81/all and equivalents on 18/10/2026) (2024)
IPNI Brazil/NPCT — Nutrient Balance Calculator (contents in the harvested product; Cunha, Casarin and Prochnow, Informações Agronômicas 130 and 145) (2014)
IBGE — 2024 Municipal Livestock Survey (SIDRA, tables 3939 and 94; table 94 retrieved from https://apisidra.ibge.gov.br/values/t/94/n6/in%20n3%2035/v/all/p/2024 on 18/10/2026) (2024)
IPCC — 2019 Refinement to the 2006 IPCC Guidelines for National Greenhouse Gas Inventories, vol. 4, ch. 10 (tables 10.19 and 10A.5) (2019)
MidWest Plan Service — MWPS-18, Manure Characteristics, section 1, 2nd ed. (table 6) (2004)
IBGE — Municipal Mesh 2025 (2025)
Extent
São Paulo State (SP)
CRS / Projection
SIRGAS 2000 (EPSG:4674)
EPSG:4674
Software
Node.js · d3-geo · QGIS
Method
N, P₂O₅ and K₂O in poultry, pig and dairy manure (2024 PPM × IPCC 2019 and MWPS-18) over the N, P₂O₅ and K₂O removed by the municipality’s temporary and permanent crops (2024 PAM production × IPNI Brazil contents in the harvested product), in six classes, in municipalities with at least 1,000 hectares harvested.
Version
v1.0.0
Licence
CC BY 4.0
DOI
being registered on Zenodo

Downloads

Figure to reuse

The map without a frame, with legend, scale, reference system and credit written on it: ready for papers, lectures and slides. In two versions: with the basemap (neighbours and sea) or only the mapped area, on white.

Point a camera at it to open this page.

How to cite

Cerejo, L. N. (2026). Dejetos e colheitas: o esterco confinado repõe 46% do fósforo que as colheitas levam, 25% do nitrogênio [Manure and harvests: Housed-herd manure replaces 46% of the phosphorus harvests remove, 25% of the nitrogen] (Version 1.0.0) [Data set]. Essencial. https://aikiesan.github.io/essencial-geo/en/maps/083-dejetos-e-colheitas-sp/

No. 084 Energy · biomass Manure that feeds the soil 4/4

Biogas digestate

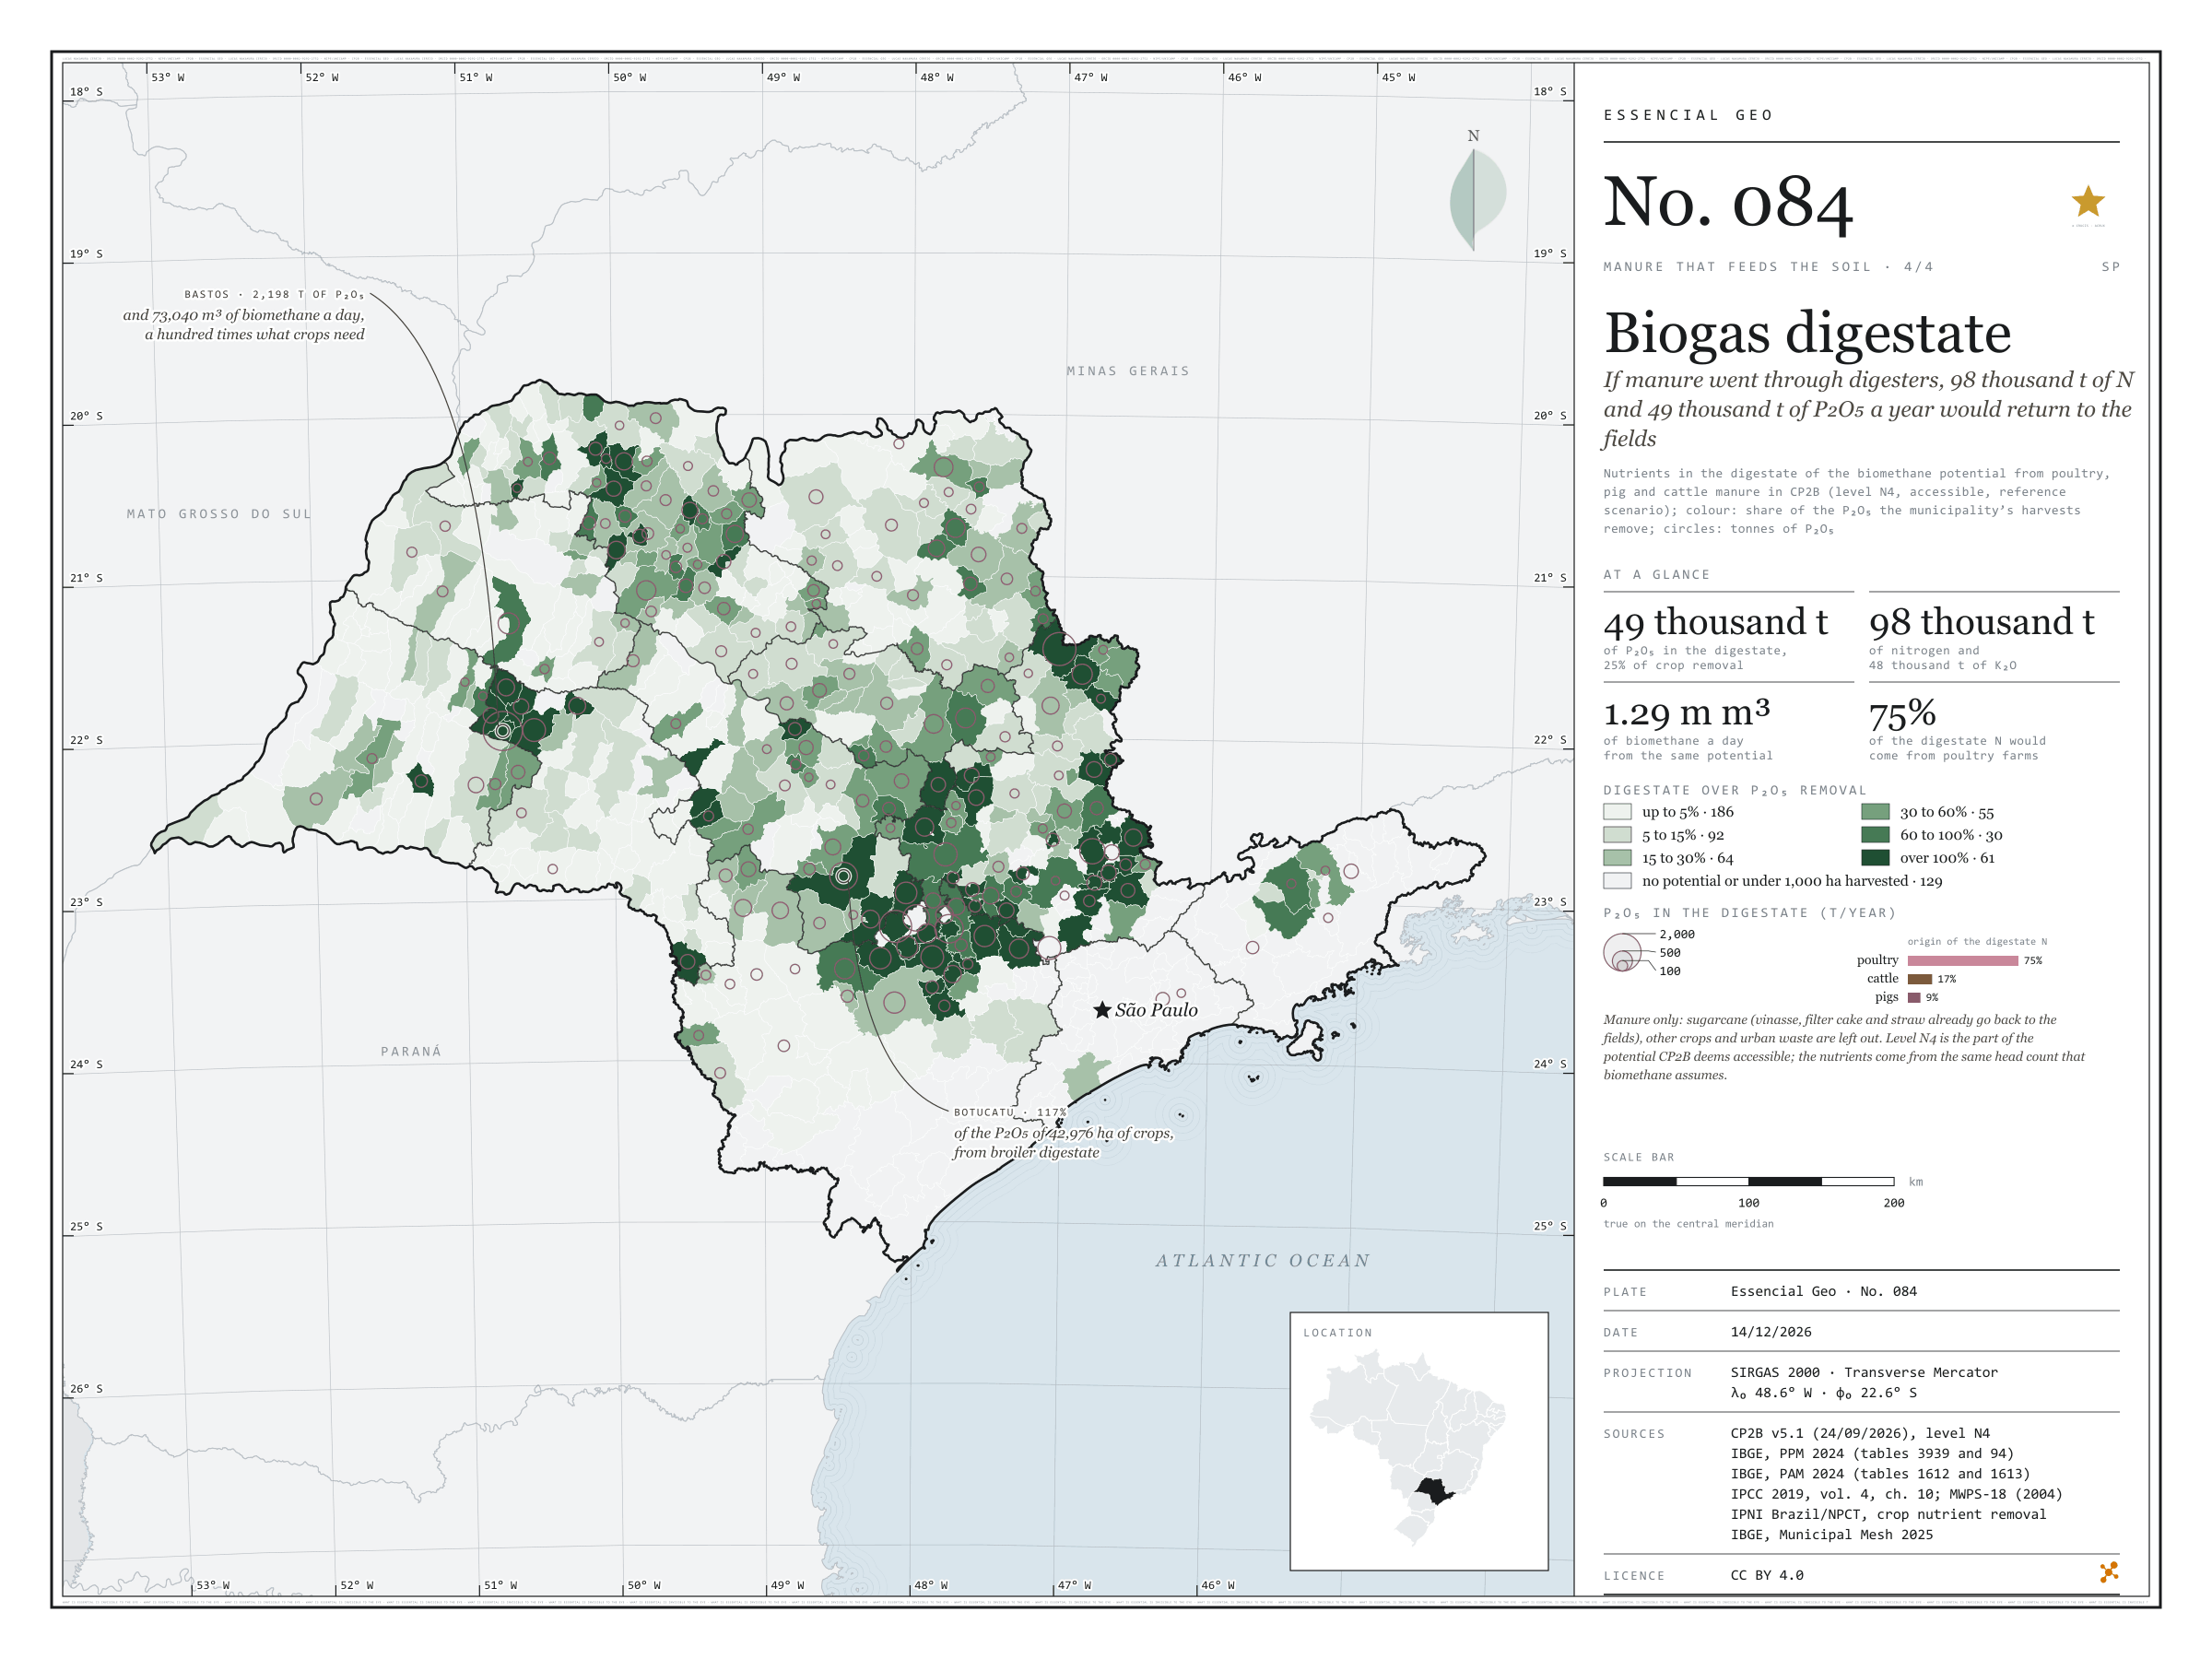
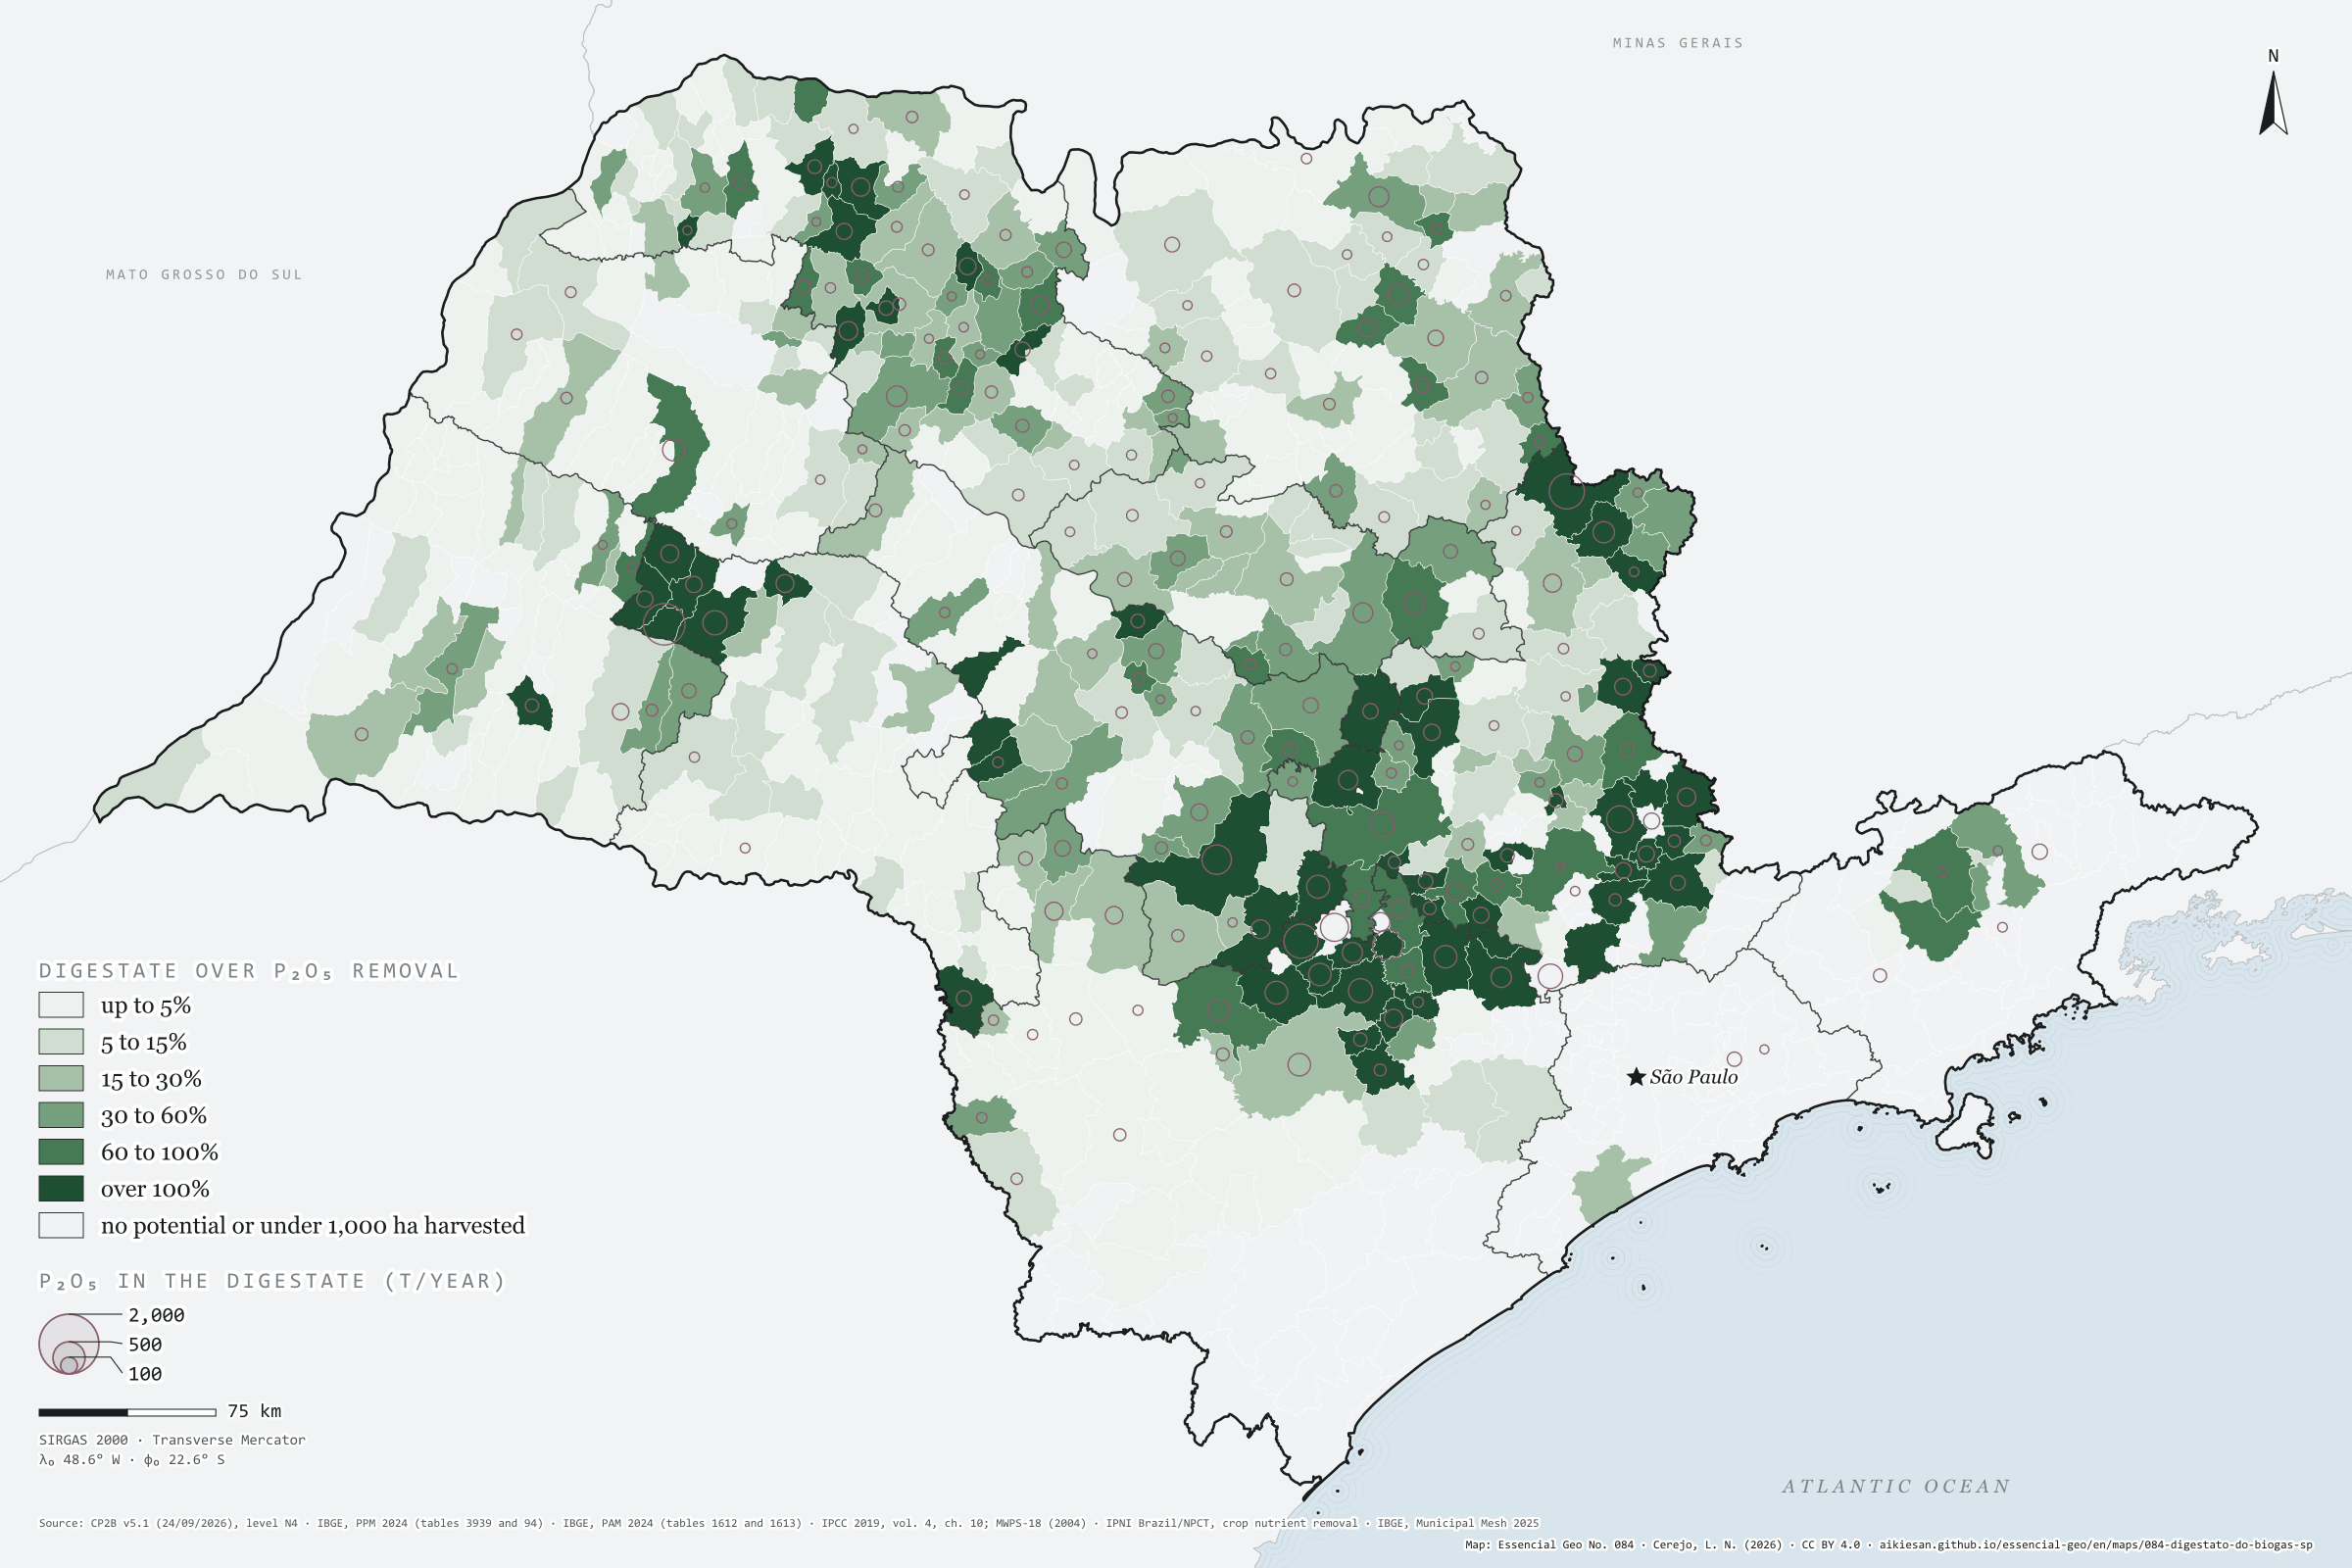
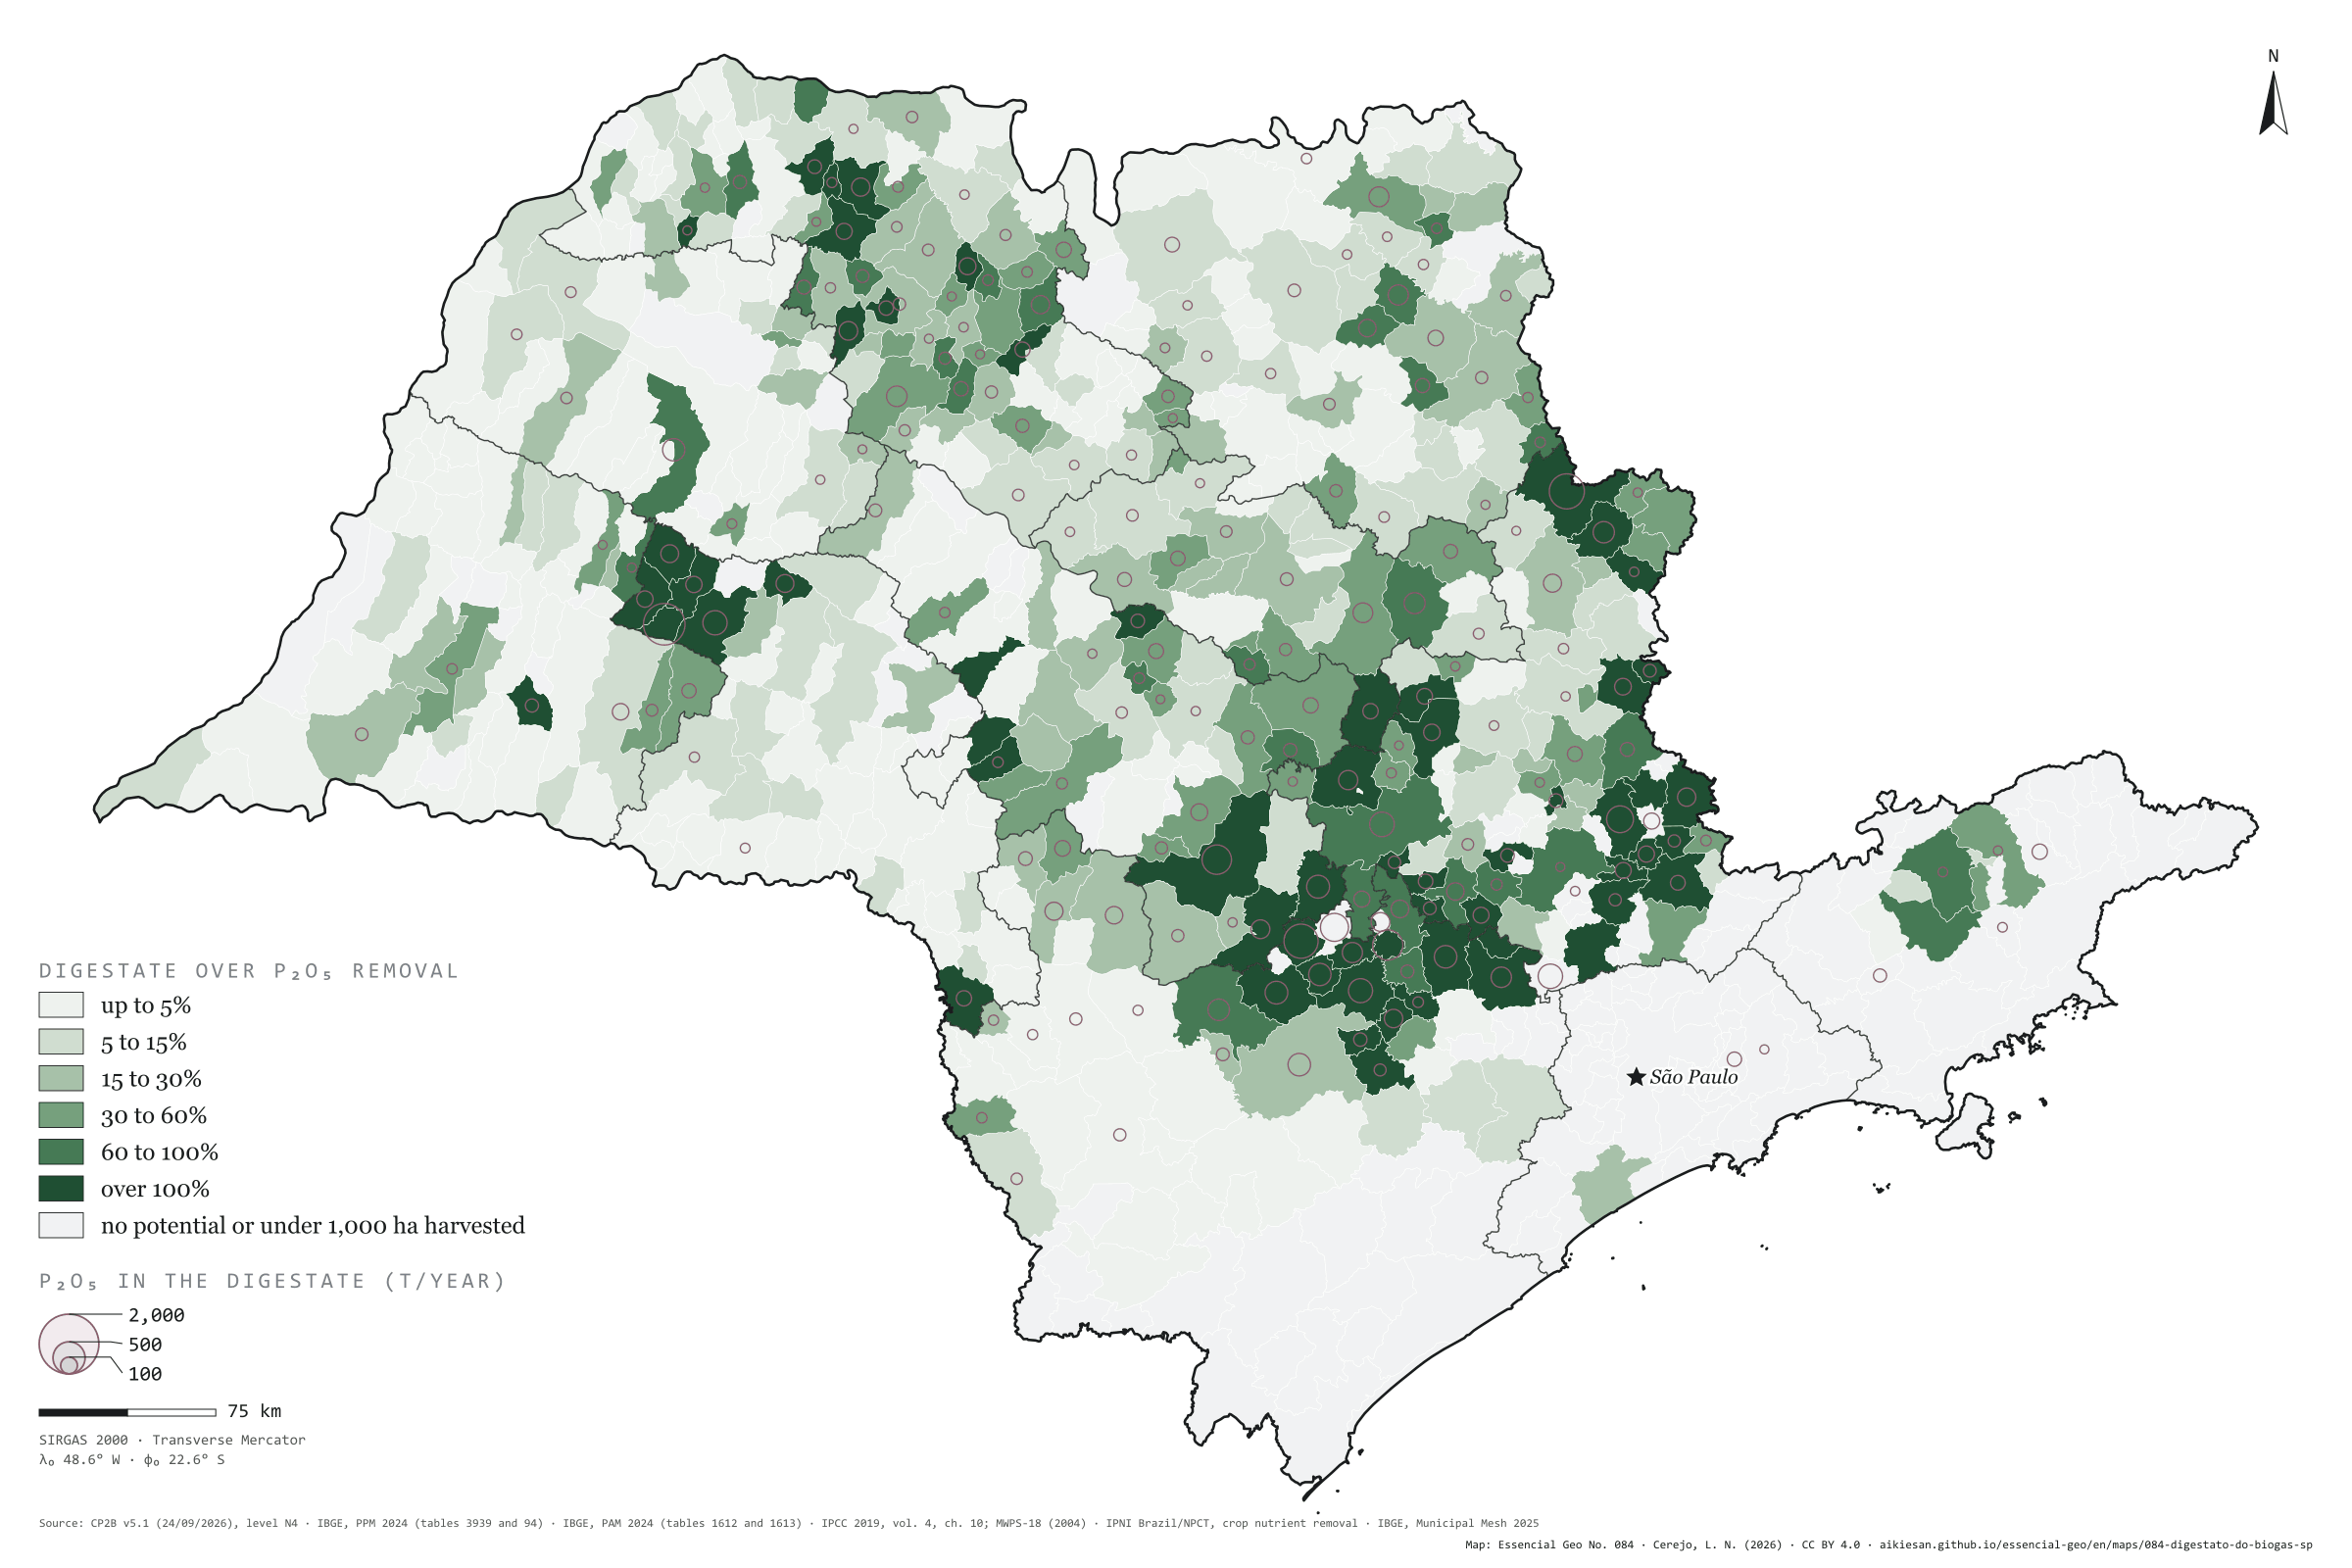
If manure went through digesters, 98,000 t of N and 49,000 t of P₂O₅ a year would return to the fields

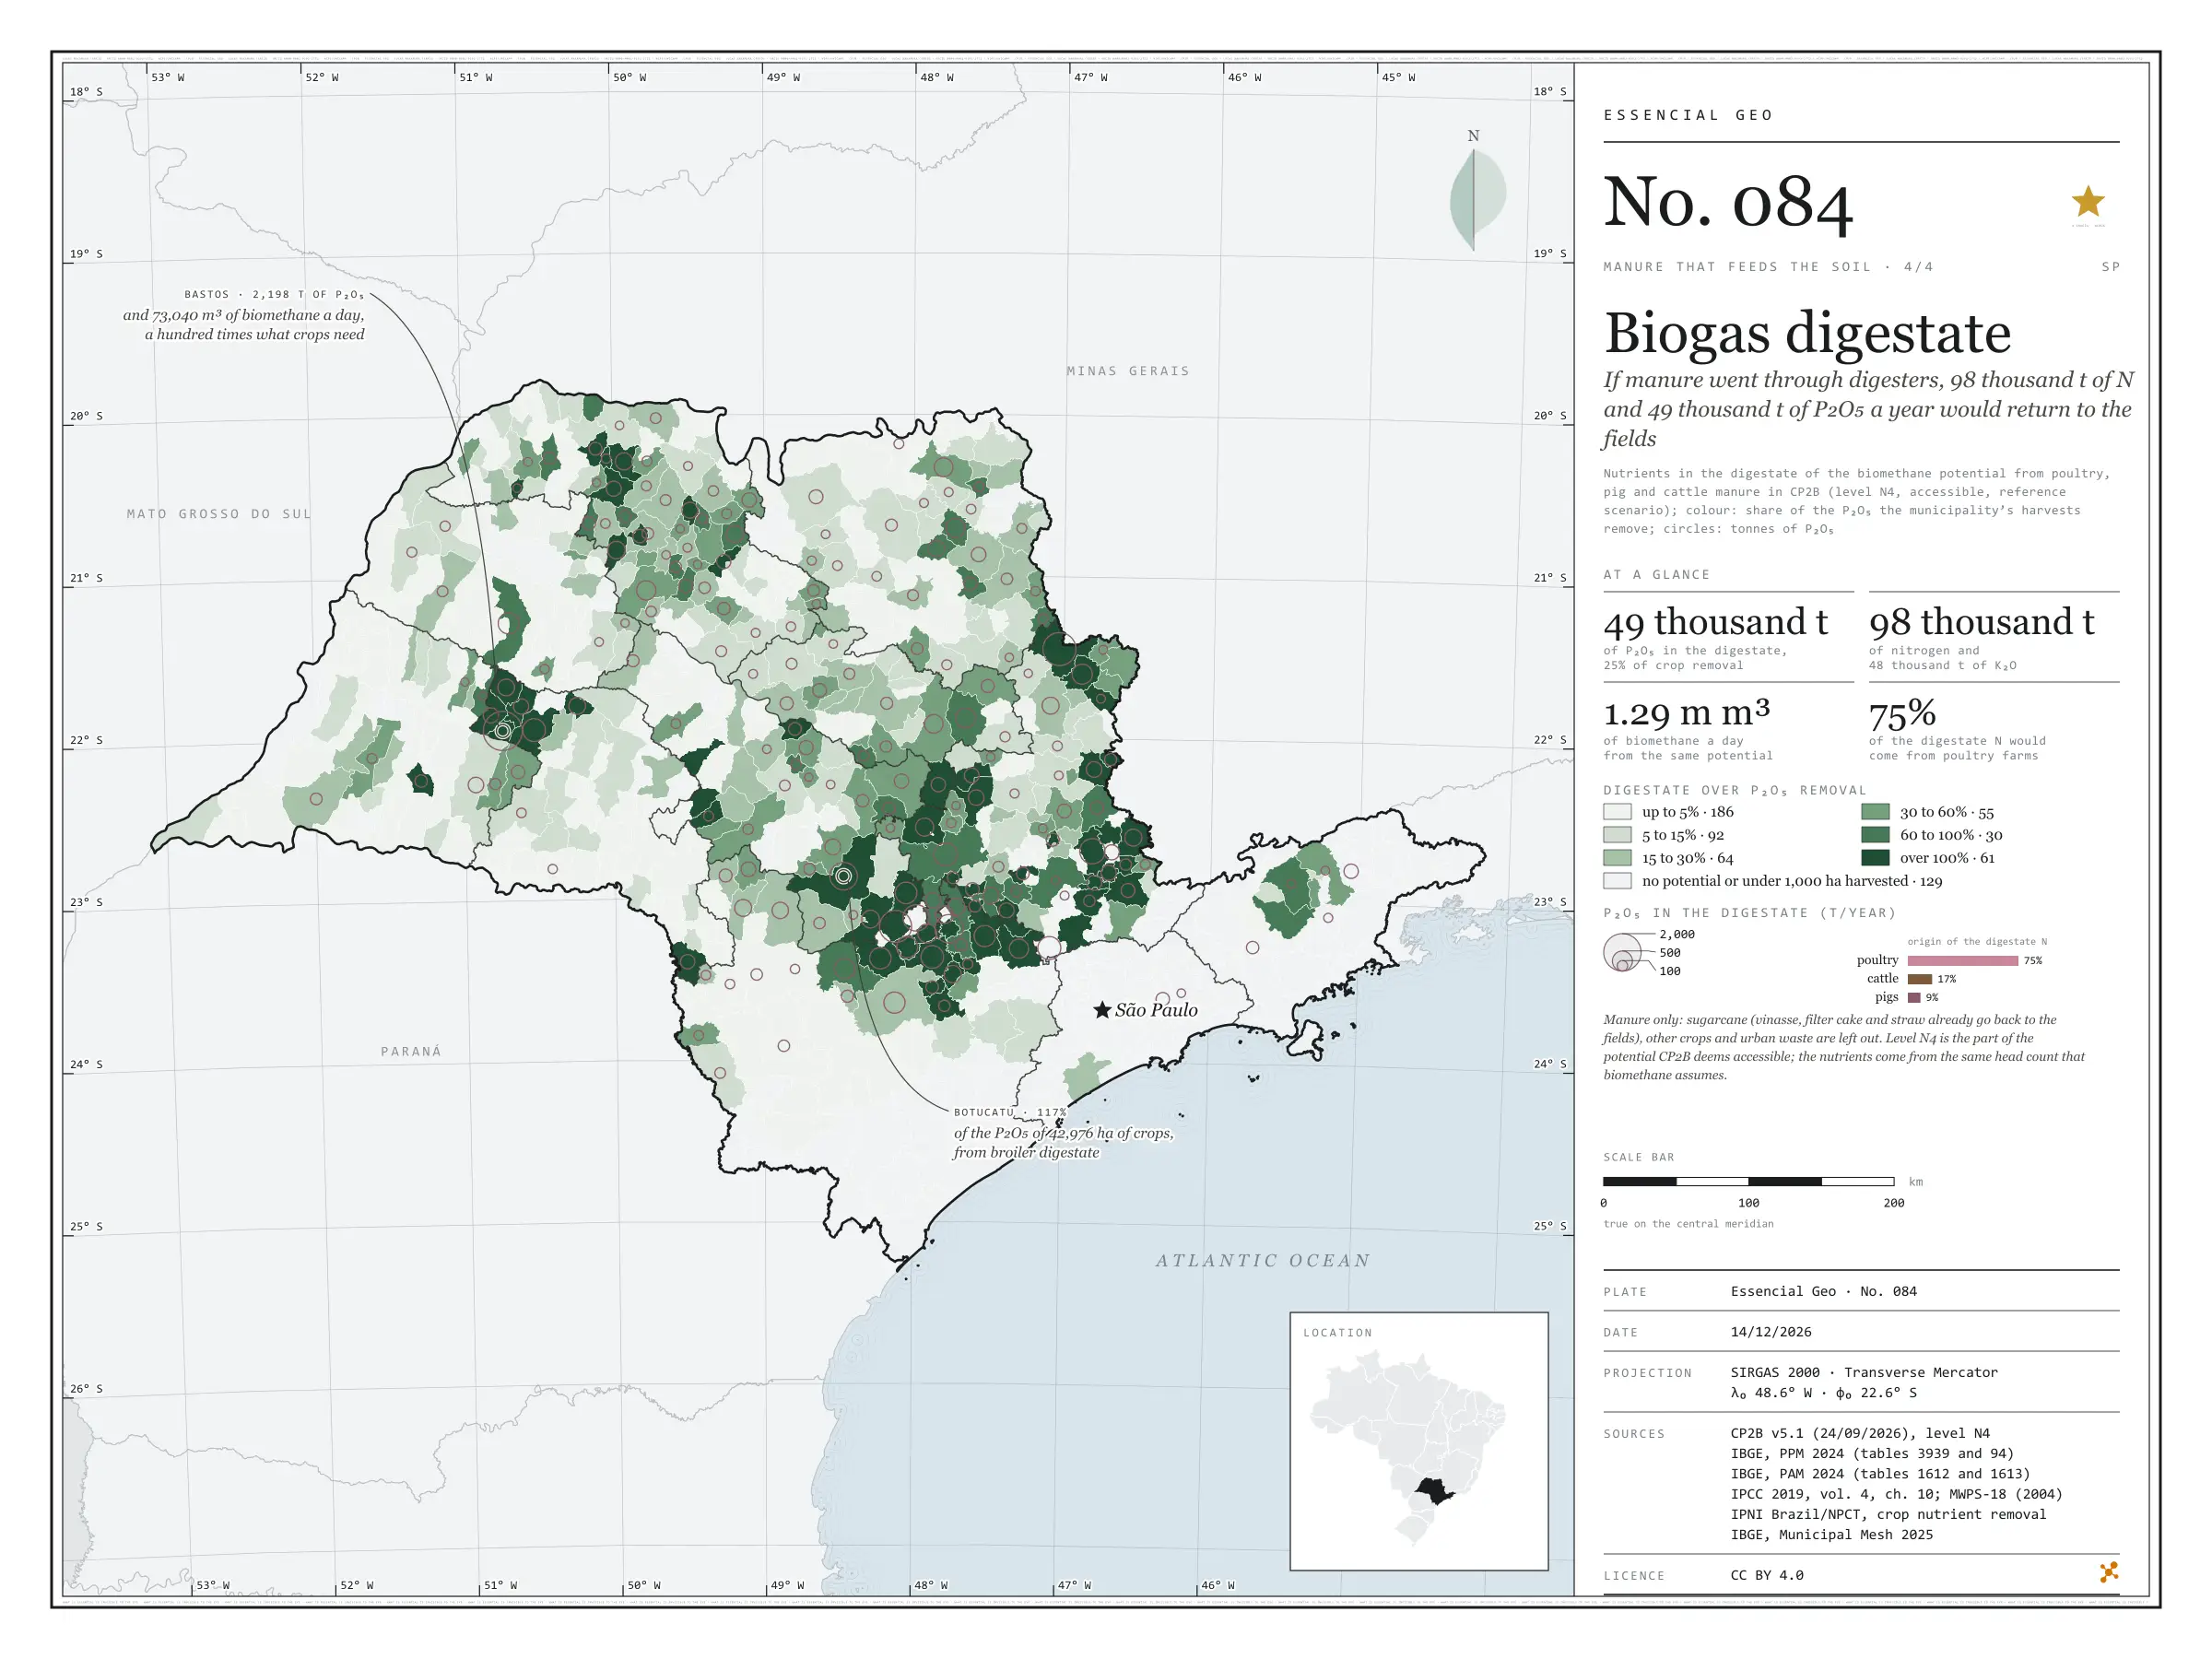
Fig. 084 São Paulo State (SP) EPSG:4674 Source: CP2B (Unicamp), IBGE, IPCC, MidWest Plan Service, IPNI Brazil/NPCT

The biomethane potential of poultry, pig and cattle manure in São Paulo, at CP2B’s accessible level, is 1.29 million m³ a day. The digestate left by that biogas keeps the manure’s nutrients: about 98,000 tonnes of nitrogen, 49,000 of P₂O₅ and 48,000 of K₂O a year, equal to 25% of the phosphorus, 14% of the nitrogen and 9% of the potassium that the state’s harvests remove. Three quarters of the nitrogen would come from poultry farms. In 61 municipalities with at least 1,000 hectares harvested, digestate would supply all the P₂O₅ of the harvest. Bastos would have 2,200 tonnes of P₂O₅ in digestate, a hundred times what its crops remove; Botucatu, with 43,000 hectares of crops, 117%. Sugarcane, which makes up most of CP2B’s potential, is left out: vinasse, filter cake and straw already go back to the fields. Fourth and last plate of the collection “Manure that feeds the soil”.

Technical record · downloads · citation

At a glance

Nutrients in manure digestate (thousand t a year)
  • nitrogen (N) 98
  • phosphorus (P₂O₅) 49
  • potassium (K₂O) 48
Origin of the digestate nitrogen (%)
  • poultry 74.9%
  • cattle 16.5%
  • pigs 8.6%
Digestate P₂O₅ over the state’s crop removal

25 %

1.29 million m³ of biomethane a day from the same potential

Layers

  • municipios polygon 645 municipalities: N, P₂O₅ and K₂O in manure digestate (CP2B N4), biomethane, and the share of crop removal it replaces (same GPKG as plate 081)
  • regioes_intermediarias polygon 11 intermediate geographic regions
  • limite_estadual polygon State boundary

Metadata

Sources
CP2B (Unicamp) — biogas and biomethane potential by municipality, method v5.1 (24/09/2026), accessible level N4, reference scenario (2026)
IBGE — 2024 Municipal Agricultural Production (SIDRA, tables 1612 and 1613, variables 214 and 216; retrieved from https://apisidra.ibge.gov.br/values/t/1612/n6/in%20n3%2035/v/214/p/2024/c81/all and equivalents on 18/10/2026) (2024)
IBGE — 2024 Municipal Livestock Survey (SIDRA, tables 3939 and 94) (2024)
IPCC — 2019 Refinement to the 2006 IPCC Guidelines for National Greenhouse Gas Inventories, vol. 4, ch. 10 (tables 10.19 and 10A.5) (2019)
MidWest Plan Service — MWPS-18, Manure Characteristics, section 1, 2nd ed. (table 6) (2004)
IPNI Brazil/NPCT — Nutrient Balance Calculator (contents in the harvested product; Cunha, Casarin and Prochnow, Informações Agronômicas 130 and 145) (2014)
IBGE — Municipal Mesh 2025 (2025)
Extent
São Paulo State (SP)
CRS / Projection
SIRGAS 2000 (EPSG:4674)
EPSG:4674
Software
Node.js · d3-geo · QGIS
Method
Methane at level N4 of CP2B v5.1 (reference scenario) for manure from broilers and laying hens, pigs, and dairy, feedlot and grazing cattle, converted into equivalent head with each substrate’s mean parameters and multiplied by the N, P₂O₅ and K₂O excreted per head (IPCC 2019 and MWPS-18); digestate keeps these nutrients. Colour: digestate over the P₂O₅ removed by the municipality’s harvests (2024 PAM × IPNI), in six classes; circles: tonnes of P₂O₅.
Version
v1.0.0
Licence
CC BY 4.0
DOI
being registered on Zenodo

Downloads

Figure to reuse

The map without a frame, with legend, scale, reference system and credit written on it: ready for papers, lectures and slides. In two versions: with the basemap (neighbours and sea) or only the mapped area, on white.

Point a camera at it to open this page.

How to cite

Cerejo, L. N. (2026). O digestato do biogás: se os dejetos passassem pelo biodigestor, voltariam ao campo 98 mil t de N e 49 mil t de P₂O₅ por ano [Biogas digestate: If manure went through digesters, 98,000 t of N and 49,000 t of P₂O₅ a year would return to the fields] (Version 1.0.0) [Data set]. Essencial. https://aikiesan.github.io/essencial-geo/en/maps/084-digestato-do-biogas-sp/

Technical record

Technical record · No. 081

The nitrogen in manure

At a glance

Manure nitrogen by the municipality’s kg N per hectare class (t N a year)
  • up to 10 kg/ha 2.9%
  • 10 to 25 kg/ha 16.5%
  • 25 to 50 kg/ha 45.5%
  • 50 to 100 kg/ha 30.5%
  • 100 to 170 kg/ha 1.6%
  • over 170 kg/ha 3%
Manure nitrogen by herd (thousand t N a year)
  • beef cattle and buffalo 347
  • hens and broilers 94
  • milked cows 57
  • pigs 21
  • horses, sheep and goats 16
Manure nitrogen per farmland hectare

32 kg/ha

535,000 t N a year, estimated

Layers

  • municipios polygon 645 municipalities: 2024 PPM herds, farmland and cropland; manure N, P₂O₅ and K₂O; crop removal; coverage; CP2B digestate
  • regioes_intermediarias polygon 11 intermediate geographic regions
  • limite_estadual polygon State boundary

Metadata

Extent
São Paulo State (SP)
CRS / Projection
SIRGAS 2000 (EPSG:4674)
EPSG:4674
Software
Node.js · d3-geo · QGIS
Method
Head counts of each herd in the 2024 PPM times the nitrogen excreted per head per year (IPCC 2019, Latin American means), summed by municipality and divided by the 2024 MapBiomas farmland (pasture, temporary and perennial crops, sugarcane, citrus and mixed use), in six classes; the last starts at the Nitrates Directive cap of 170 kg of N per hectare.
Version
v1.0.0
Licence
CC BY 4.0
DOI
being registered on Zenodo

Downloads

Figure to reuse

The map without a frame, with legend, scale, reference system and credit written on it: ready for papers, lectures and slides. In two versions: with the basemap (neighbours and sea) or only the mapped area, on white.

Point a camera at it to open this page.

How to cite

Cerejo, L. N. (2026). O nitrogênio dos dejetos: meio milhão de toneladas por ano; em Bastos, três vezes o teto europeu [The nitrogen in manure: Half a million tonnes a year; in Bastos, three times the European cap] (Version 1.0.0) [Data set]. Essencial. https://aikiesan.github.io/essencial-geo/en/maps/081-nitrogenio-dos-dejetos-sp/

Data and plates under CC BY 4.0: use them in commercial drawings and papers, citing the source.

100%