Skip to content
Essencial

No. 081 Land use Manure that feeds the soil 1/4

The nitrogen in manure

Half a million tonnes a year; in Bastos, three times the European cap

Record, downloads and citation
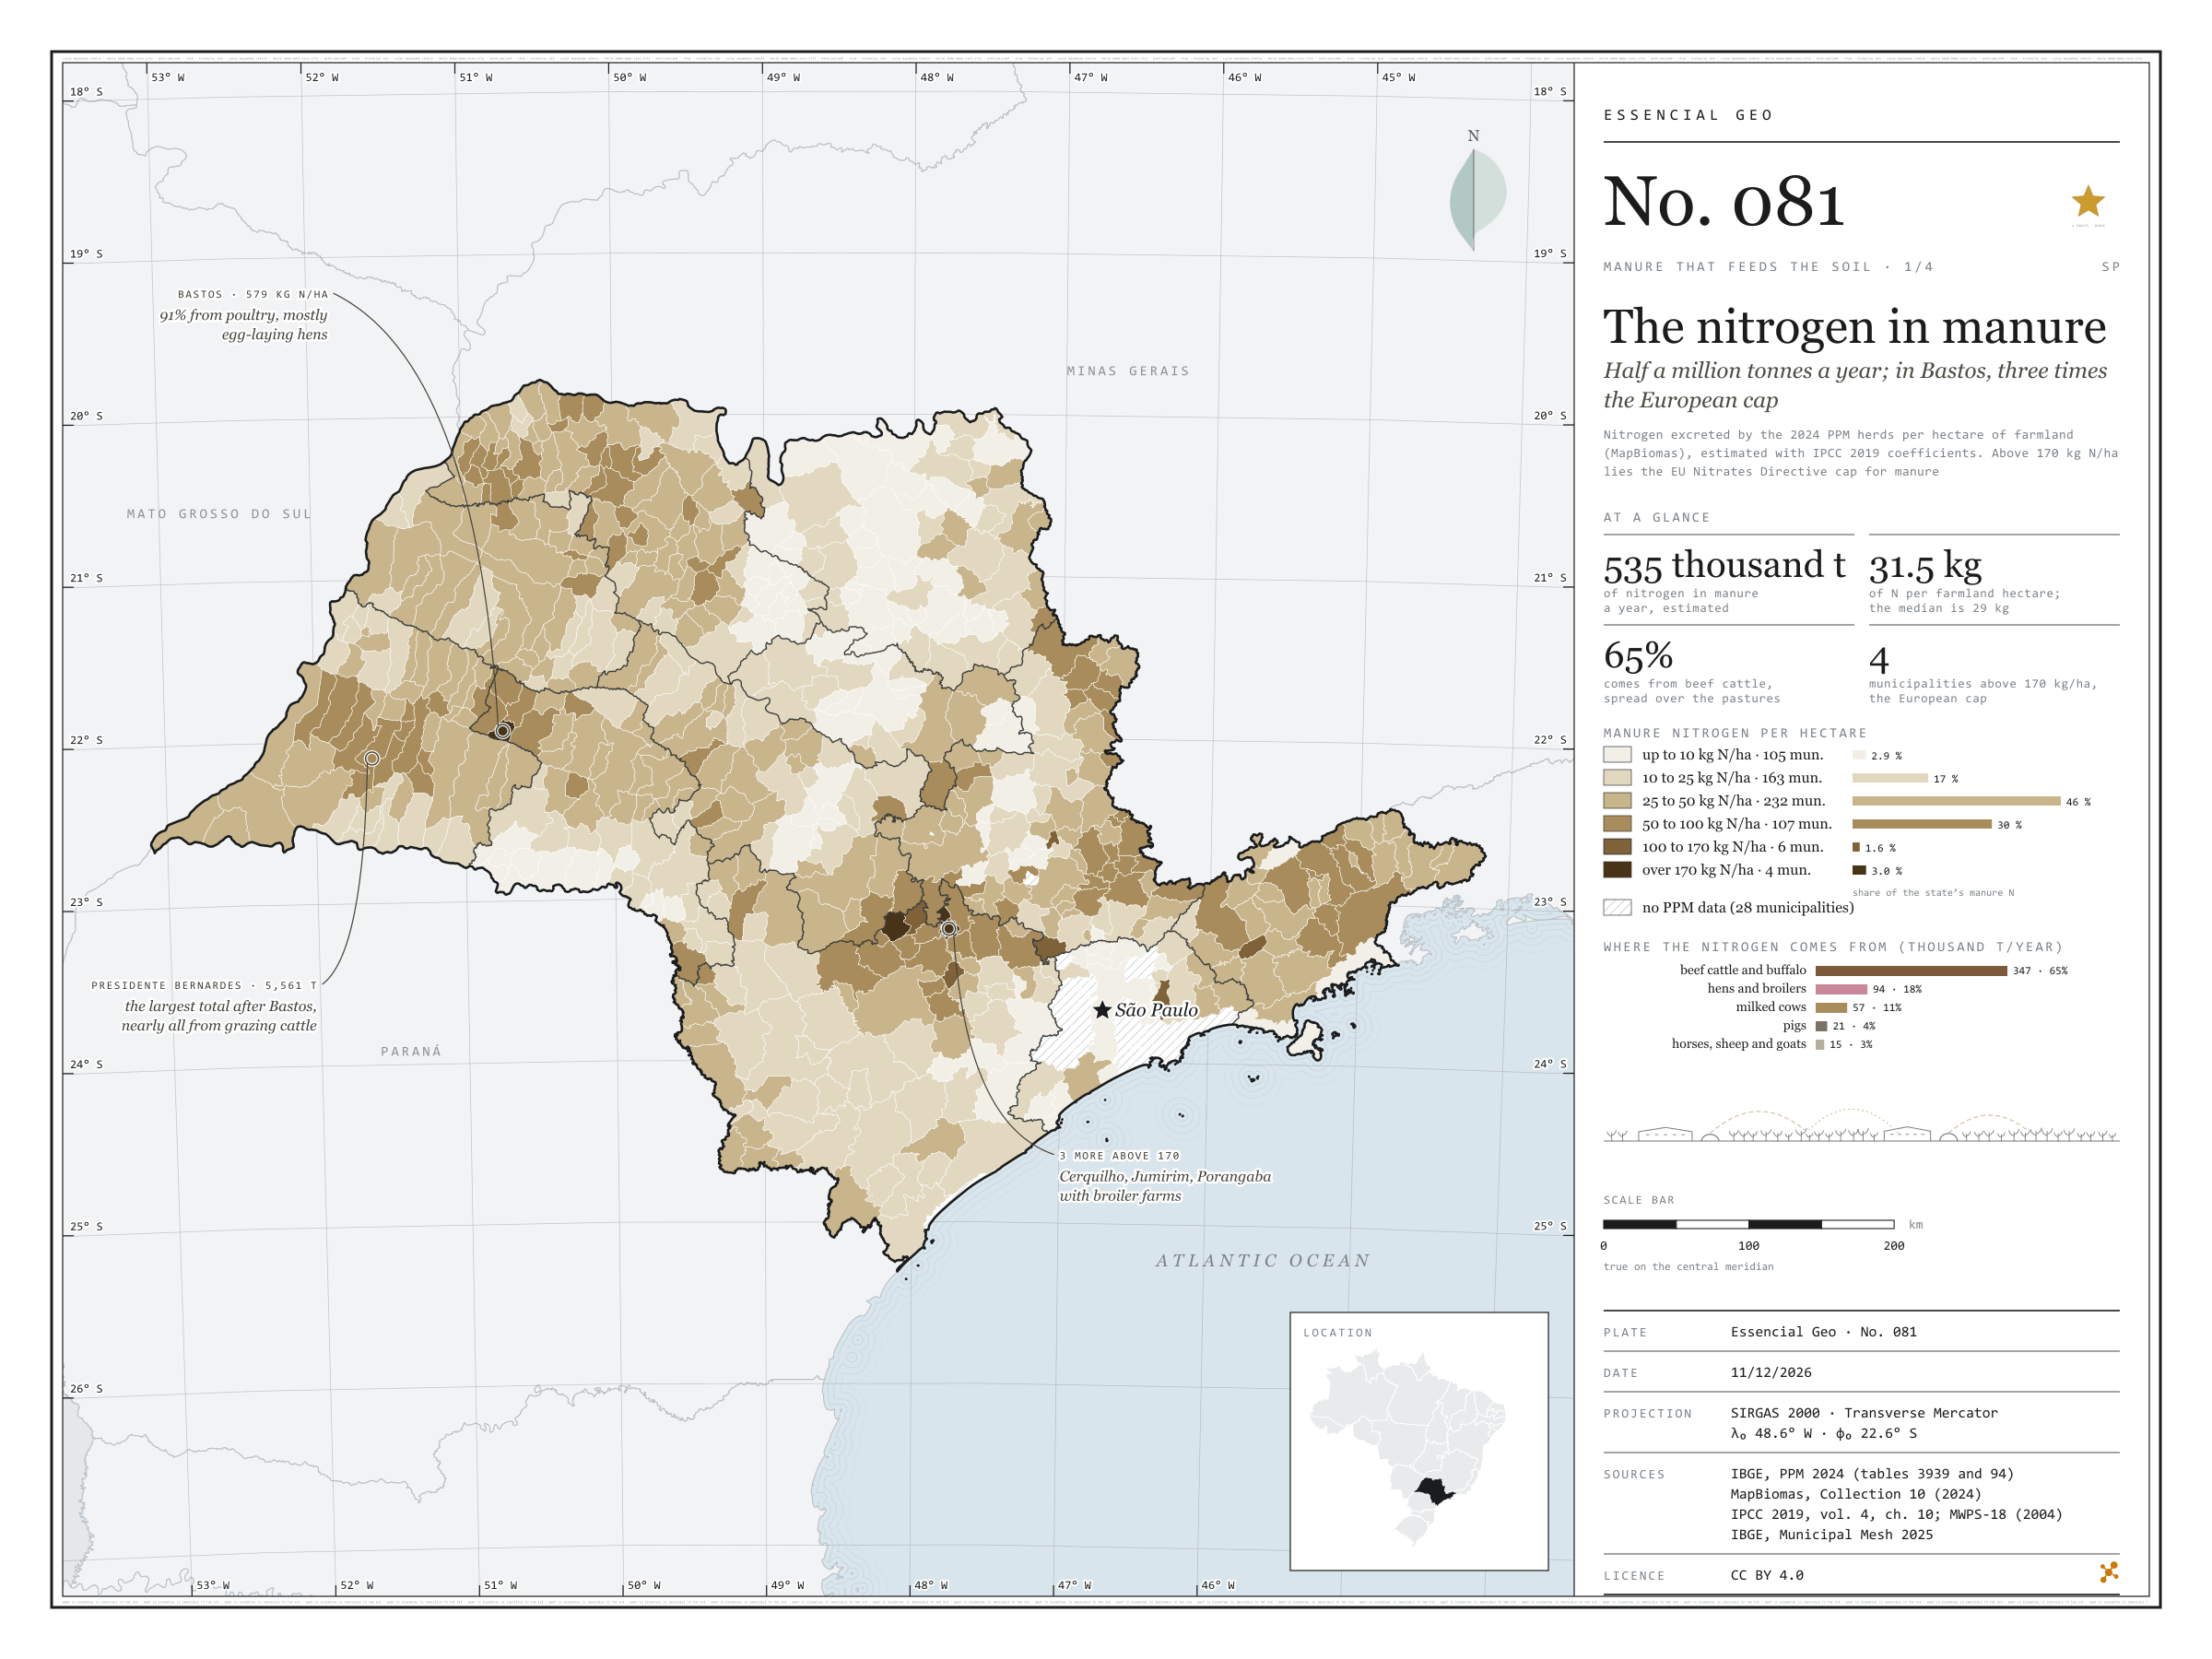
Fig. 081 São Paulo State (SP) EPSG:4674 Source: IBGE, MapBiomas, IPCC, MidWest Plan Service

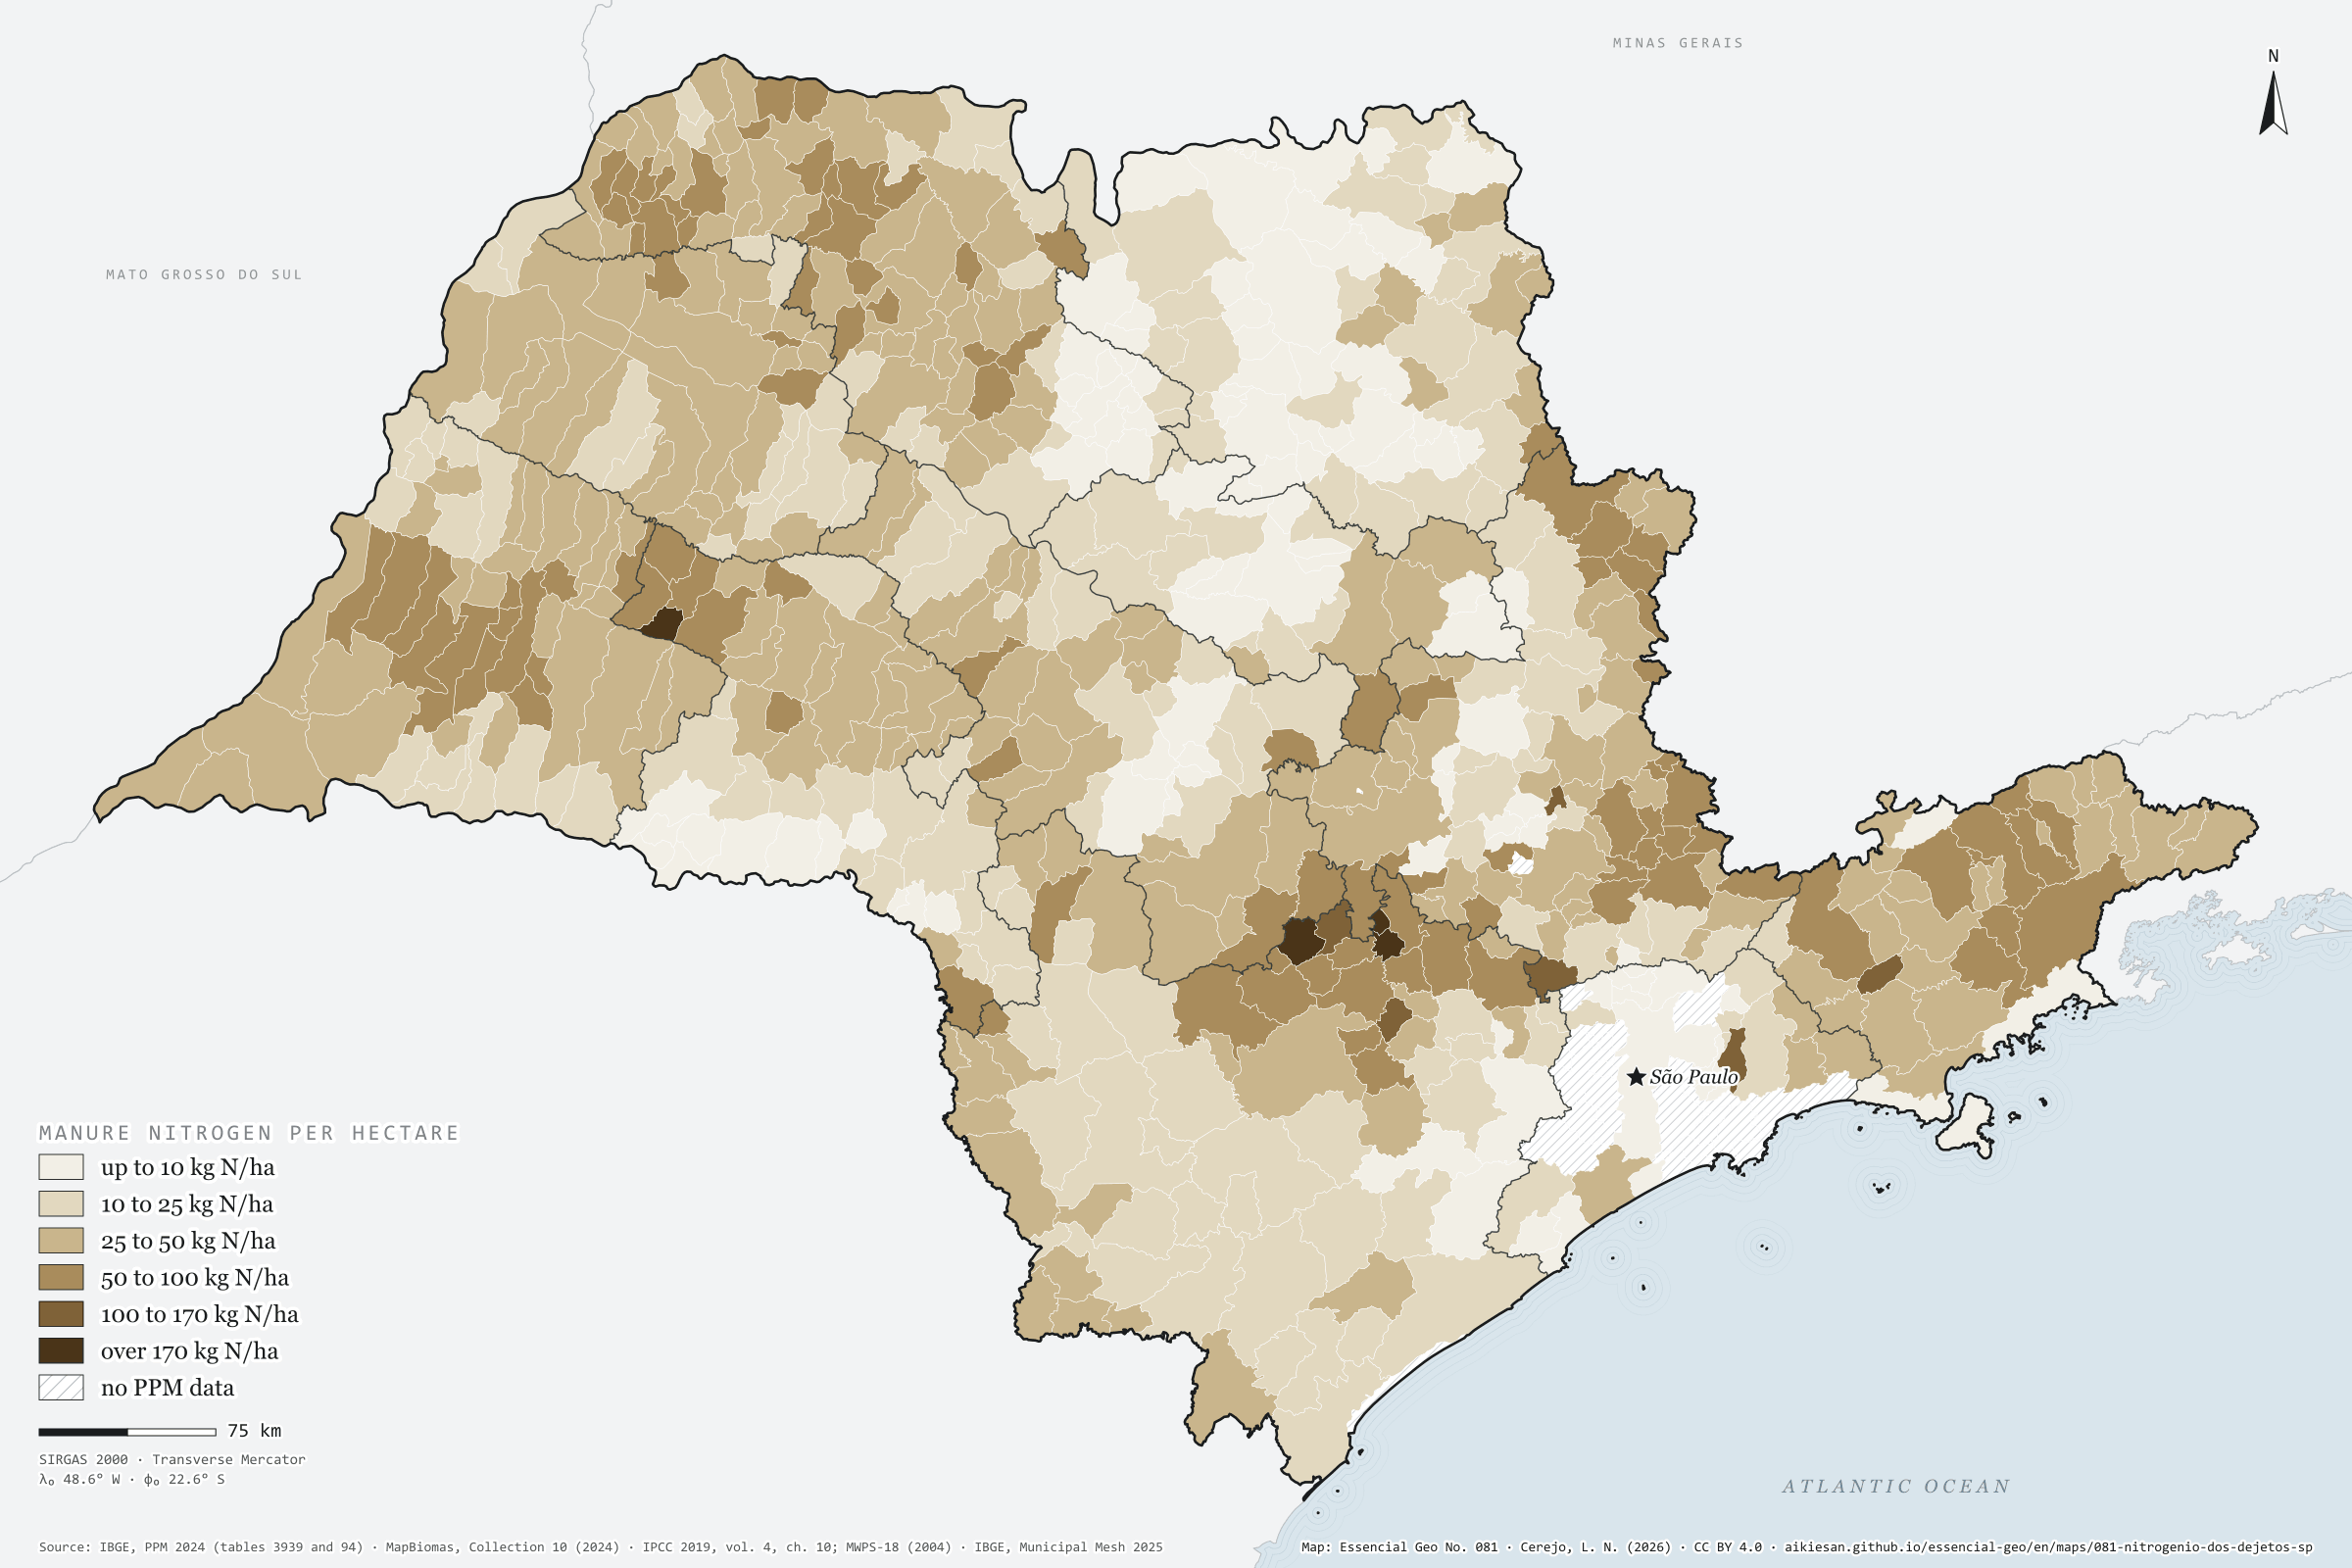
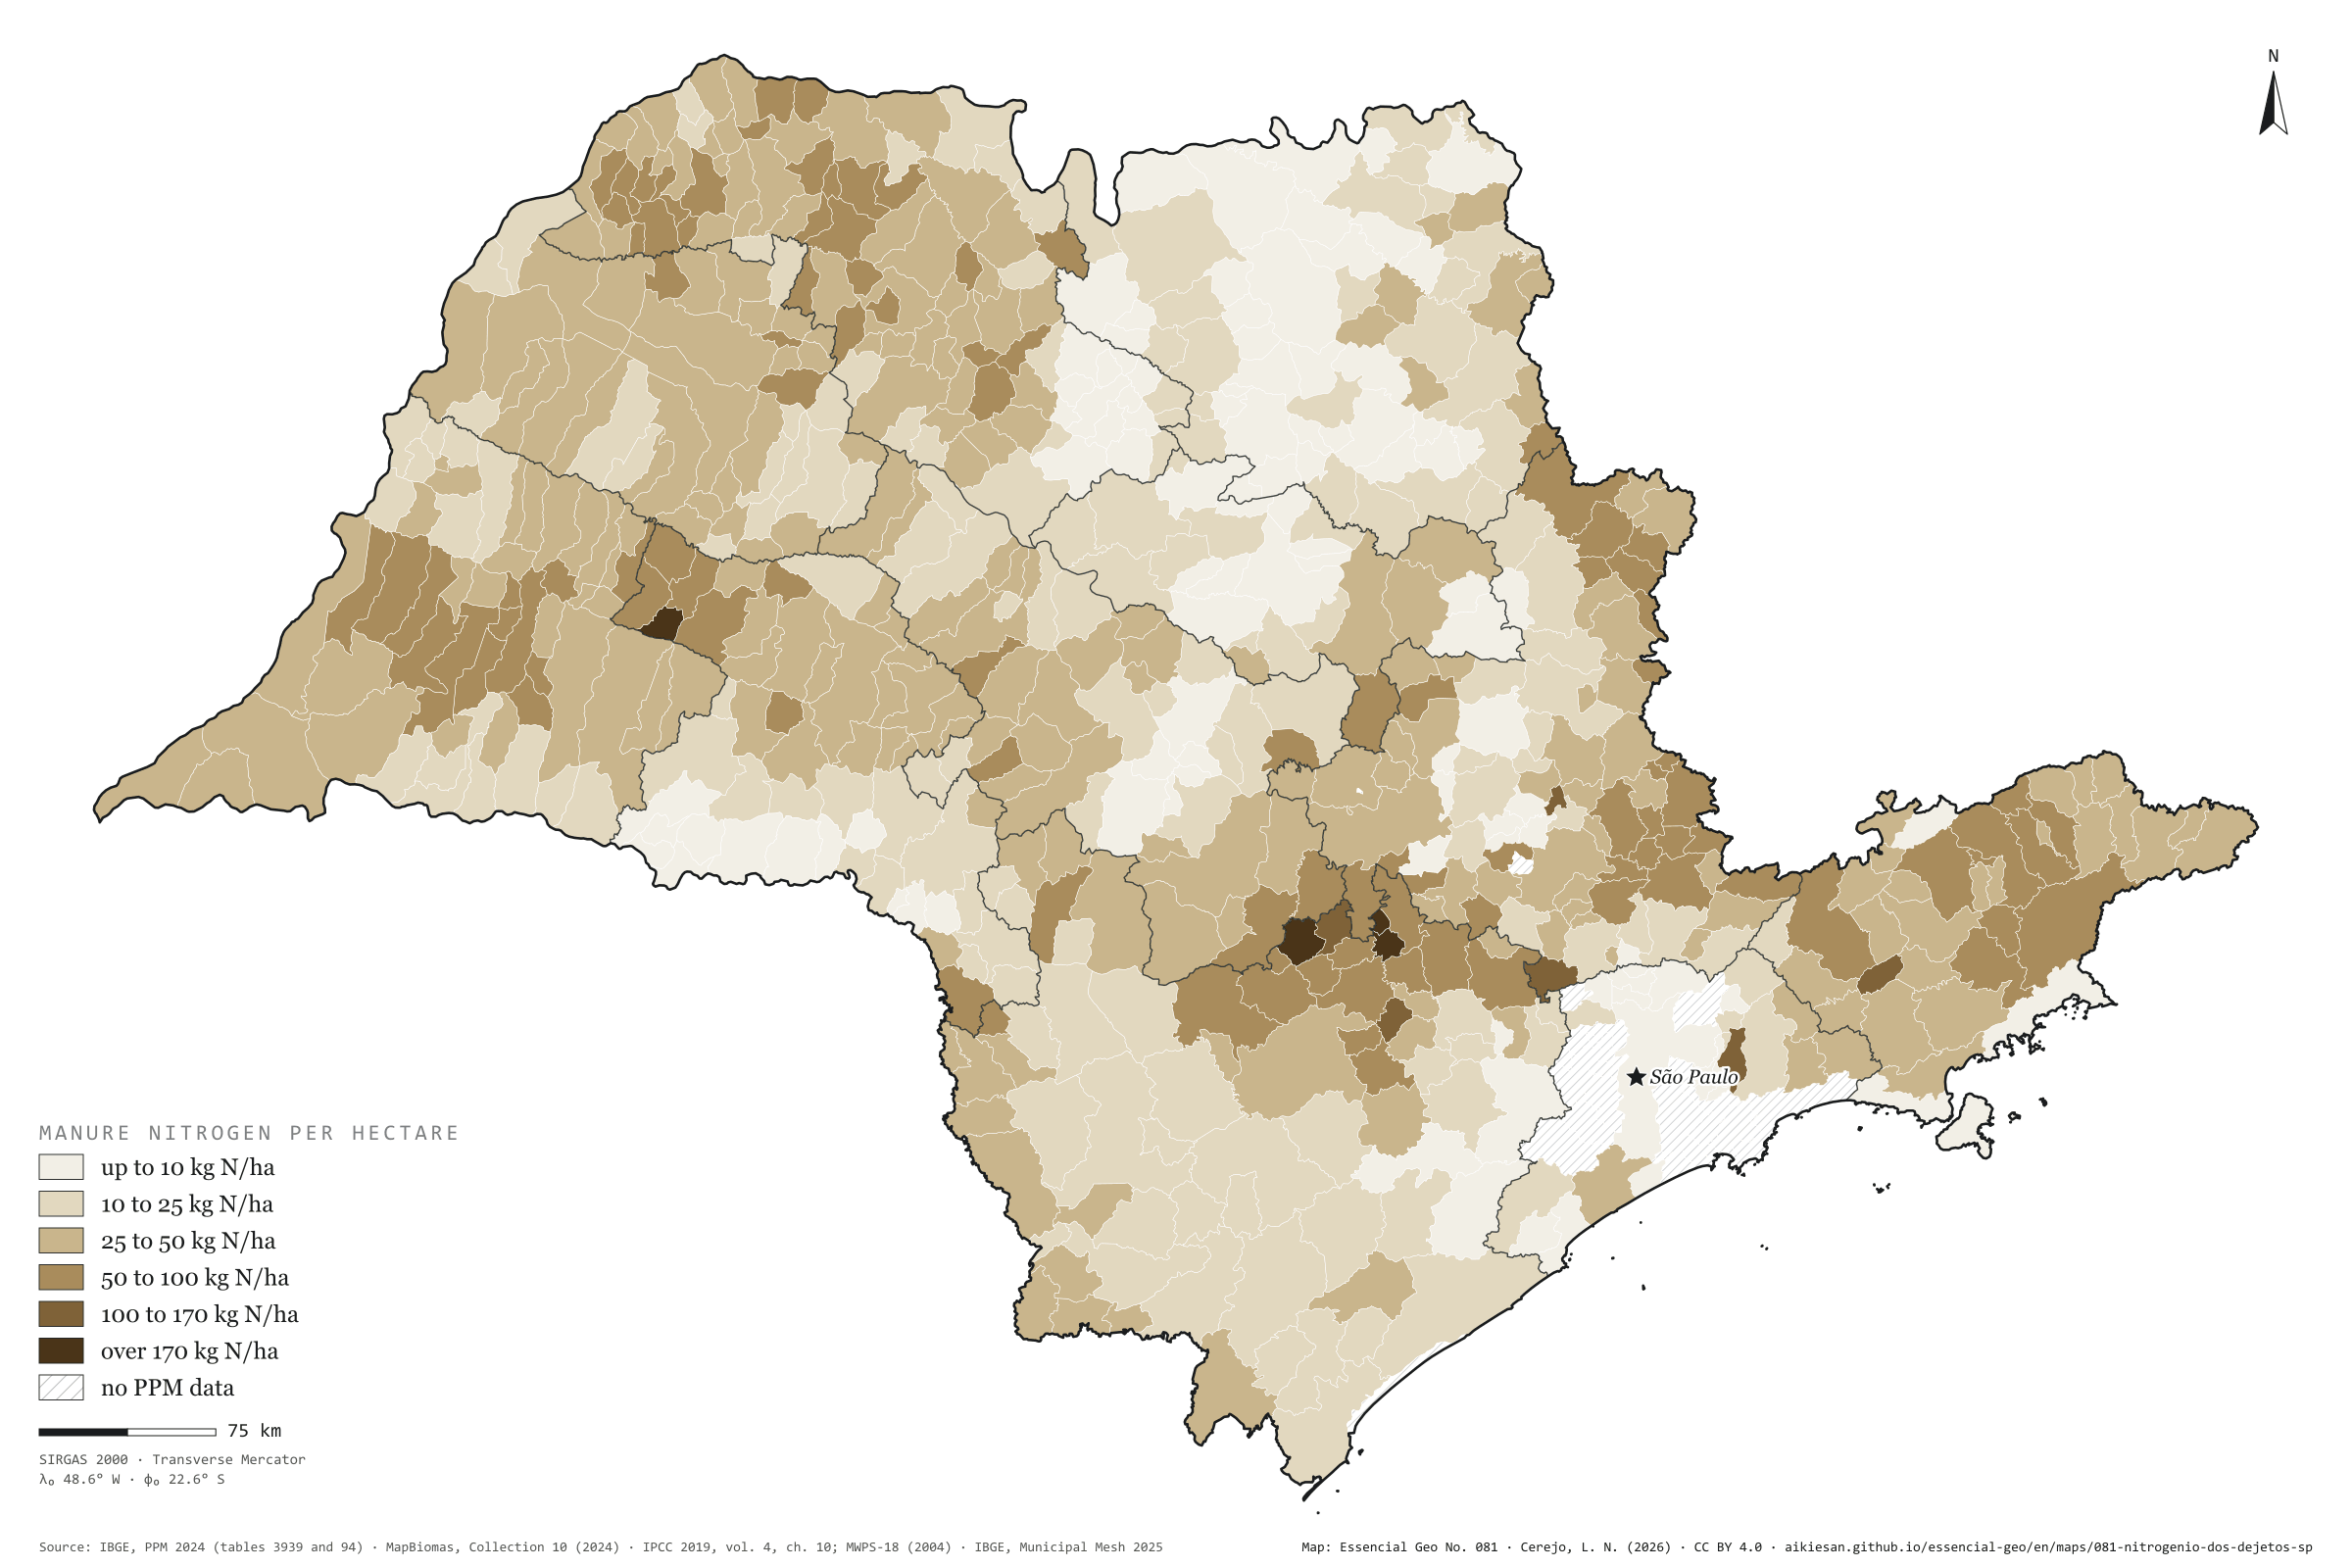
São Paulo’s herds excrete about 535,000 tonnes of nitrogen a year, by a calculation using the 2024 PPM head counts and IPCC coefficients. Over the 16.9 million hectares of MapBiomas farmland, that is 31.5 kg of N per hectare; the municipal median is 29 kg. Nearly two thirds (65%) comes from beef cattle, spread across the pastures; poultry gives 18%, dairy cows 11% and pigs 4%. The EU Nitrates Directive caps manure applied in vulnerable zones at 170 kg of N per hectare. Four São Paulo municipalities exceed it: Bastos, the egg capital, with 579 kg/ha, and Cerquilho (232), Jumirim (219) and Porangaba (171), with broiler farms. Presidente Bernardes, in the Pontal, has the largest total after Bastos: 5,600 tonnes, nearly all from grazing cattle. First plate of the collection “Manure that feeds the soil”.

Technical record · downloads · citation

At a glance

Manure nitrogen by the municipality’s kg N per hectare class (t N a year)
  • up to 10 kg/ha 2.9%
  • 10 to 25 kg/ha 16.5%
  • 25 to 50 kg/ha 45.5%
  • 50 to 100 kg/ha 30.5%
  • 100 to 170 kg/ha 1.6%
  • over 170 kg/ha 3%
Manure nitrogen by herd (thousand t N a year)
  • beef cattle and buffalo 347
  • hens and broilers 94
  • milked cows 57
  • pigs 21
  • horses, sheep and goats 16
Manure nitrogen per farmland hectare

32 kg/ha

535,000 t N a year, estimated

Layers

  • municipios polygon 645 municipalities: 2024 PPM herds, farmland and cropland; manure N, P₂O₅ and K₂O; crop removal; coverage; CP2B digestate
  • regioes_intermediarias polygon 11 intermediate geographic regions
  • limite_estadual polygon State boundary

Metadata

Extent
São Paulo State (SP)
CRS / Projection
SIRGAS 2000 (EPSG:4674)
EPSG:4674
Software
Node.js · d3-geo · QGIS
Method
Head counts of each herd in the 2024 PPM times the nitrogen excreted per head per year (IPCC 2019, Latin American means), summed by municipality and divided by the 2024 MapBiomas farmland (pasture, temporary and perennial crops, sugarcane, citrus and mixed use), in six classes; the last starts at the Nitrates Directive cap of 170 kg of N per hectare.
Version
v1.0.0
Licence
CC BY 4.0
DOI
being registered on Zenodo

Downloads

Figure to reuse

The map without a frame, with legend, scale, reference system and credit written on it: ready for papers, lectures and slides. In two versions: with the basemap (neighbours and sea) or only the mapped area, on white.

Point a camera at it to open this page.

How to cite

Cerejo, L. N. (2026). O nitrogênio dos dejetos: meio milhão de toneladas por ano; em Bastos, três vezes o teto europeu [The nitrogen in manure: Half a million tonnes a year; in Bastos, three times the European cap] (Version 1.0.0) [Data set]. Essencial. https://aikiesan.github.io/essencial-geo/en/maps/081-nitrogenio-dos-dejetos-sp/

How to read this plate area, projection, scale, legend and source · 2 terms
1 Area
São Paulo State (SP) The area the plate covers. Outside it, neighbours and sea are drawn in grey, just for orientation.
2 Coordinates and projection
SIRGAS 2000 (EPSG:4674) The layers are in SIRGAS 2000; the drawing’s projection is written in the colophon at the foot of the panel.
3 Scale
Graphic scale bar in the panel The scale bar is true on the central meridian; away from it, measured distances vary a little.
4 Legend and layers
3 layers in the GeoPackage · polygon Read the legend before the map: it tells you whether a colour is a rate or a class, and whether a circle is a total.
5 Sources
IBGE (2024); MapBiomas (2024); IPCC (2019); MidWest Plan Service (2004); IBGE (2025) Every figure comes from a public source, with its year. The data sheet gives each one’s address.

Terms on this plate

Land cover and land use
What covers each patch of ground (forest, pasture, soy, cane, water, town), read from satellite images year by year. The forty-year plates use MapBiomas’ series, 1985 to 2025, summed by municipality.
MapBiomas
A network of universities, NGOs and companies that classifies land cover across all of Brazil from Landsat images, one map a year since 1985, as open data.

Download

Layers, table and figures, under CC BY 4.0. Cite with the DOI.

Full record and citation

Method notes · No. 081

The nitrogen in São Paulo’s herd manure

Português · English

Plate No. 081, the first of four in the collection Manure that feeds the soil, in the manner of the Eurostat and OECD gross nutrient balance and the European Environment Agency’s livestock density maps. Phosphorus is on plate 082; the comparison with harvests on 083; biogas digestate on 084.

What the files contain

Layer (GPKG)GeometryContent
municipiospolygon645 municipalities. 2024 PPM herds (bovinos without milked cows, vacas_ordenhadas, bubalinos, equinos, suinos without sows, matrizes, galinhas, frangos = all chickens minus hens, ovinos, caprinos, codornas); area_agro_ha (MapBiomas) and area_lavoura_ha (PAM); n_dejetos_t and each herd’s part (n_bovinos_t, n_leite_t, n_aves_t, n_suinos_t, n_outros_t); n_kg_ha_agro; the fields of plates 082 to 084; sem_info_ppm
regioes_intermediarias, limite_estadualpolygonreference

The GPKG is shared by all four plates, with each one’s QGIS styles (n_kg_ha_agro, p2o5_kg_ha_agro, cob_n_pct, cob_p2o5_pct, cob_k2o_pct, dig_cob_p2o5_pct). The CSV has the municipal table without geometry; the coefficients CSV lists every number used, with its source.

Method

  1. Herds. Head counts on 31/12/2024 from the PPM (table 3939) by municipality; milked cows from table 94, retrieved through the SIDRA API on 18/10/2026. Milked cows are taken out of all cattle, sows out of all pigs and hens out of all chickens (the rest are broilers). Where IBGE does not publish milked cows (42 municipalities), the whole herd counts as beef cattle.
  2. Nitrogen per head. Excretion rate (kg of N per 1,000 kg of live weight per day, table 10.19) times typical mass (table 10A.5), IPCC 2019 Latin American means, times 365. Per head per year: milked cow 72.3 kg; beef animal 34.3; buffalo 47.1; horse 40.0; sow 18.3; pig 13.6; hen 0.60; broiler 0.40; sheep 3.6; goat 3.0. The coefficients are in the CSV.
  3. Per hectare. Sum over the herds divided by the 2024 MapBiomas farmland (pasture, temporary and perennial crops, sugarcane, citrus and mixed use), the same as plate 045. Six classes, closed on the right: up to 10, 10 to 25, 25 to 50, 50 to 100, 100 to 170 and over 170 kg of N per hectare.
  4. The European cap. The Nitrates Directive (91/676/EEC) limits manure applied in vulnerable zones to 170 kg of N per hectare per year. Here it is only a yardstick: the cap applies to spread manure, not to what is excreted on pasture, and Brazil has no equivalent rule.

Limitations

  • These are estimates. Nitrogen comes from mean per-head coefficients, not from farm measurements; diet, breed, weight and productivity change excretion. The numbers show the order of magnitude and where the load concentrates.
  • Excreted nitrogen is not what reaches the soil: part is lost as ammonia and nitrous oxide in the shed, the manure store and the field. An account of available nitrogen would need loss factors for each management system.
  • Beef cattle leave their manure on the pasture, spread out; their load per hectare does not compare with that of a poultry farm, which concentrates its manure in one place.
  • 28 municipalities in Greater São Paulo and on the coast have no PPM data and are hatched as no data, never as zero.
  • The PPM counts animals on a single day (31/12); broiler farms raise several flocks a year, and the per-head coefficient already assumes an animal present all year.

View this map’s folder on GitHub

Technical record

Technical record · No. 081

The nitrogen in manure

At a glance

Manure nitrogen by the municipality’s kg N per hectare class (t N a year)
  • up to 10 kg/ha 2.9%
  • 10 to 25 kg/ha 16.5%
  • 25 to 50 kg/ha 45.5%
  • 50 to 100 kg/ha 30.5%
  • 100 to 170 kg/ha 1.6%
  • over 170 kg/ha 3%
Manure nitrogen by herd (thousand t N a year)
  • beef cattle and buffalo 347
  • hens and broilers 94
  • milked cows 57
  • pigs 21
  • horses, sheep and goats 16
Manure nitrogen per farmland hectare

32 kg/ha

535,000 t N a year, estimated

Layers

  • municipios polygon 645 municipalities: 2024 PPM herds, farmland and cropland; manure N, P₂O₅ and K₂O; crop removal; coverage; CP2B digestate
  • regioes_intermediarias polygon 11 intermediate geographic regions
  • limite_estadual polygon State boundary

Metadata

Extent
São Paulo State (SP)
CRS / Projection
SIRGAS 2000 (EPSG:4674)
EPSG:4674
Software
Node.js · d3-geo · QGIS
Method
Head counts of each herd in the 2024 PPM times the nitrogen excreted per head per year (IPCC 2019, Latin American means), summed by municipality and divided by the 2024 MapBiomas farmland (pasture, temporary and perennial crops, sugarcane, citrus and mixed use), in six classes; the last starts at the Nitrates Directive cap of 170 kg of N per hectare.
Version
v1.0.0
Licence
CC BY 4.0
DOI
being registered on Zenodo

Downloads

Figure to reuse

The map without a frame, with legend, scale, reference system and credit written on it: ready for papers, lectures and slides. In two versions: with the basemap (neighbours and sea) or only the mapped area, on white.

Point a camera at it to open this page.

How to cite

Cerejo, L. N. (2026). O nitrogênio dos dejetos: meio milhão de toneladas por ano; em Bastos, três vezes o teto europeu [The nitrogen in manure: Half a million tonnes a year; in Bastos, three times the European cap] (Version 1.0.0) [Data set]. Essencial. https://aikiesan.github.io/essencial-geo/en/maps/081-nitrogenio-dos-dejetos-sp/

100%