Skip to content
Essencial

No. 084 Energy · biomass Manure that feeds the soil 4/4

Biogas digestate

If manure went through digesters, 98,000 t of N and 49,000 t of P₂O₅ a year would return to the fields

Record, downloads and citation
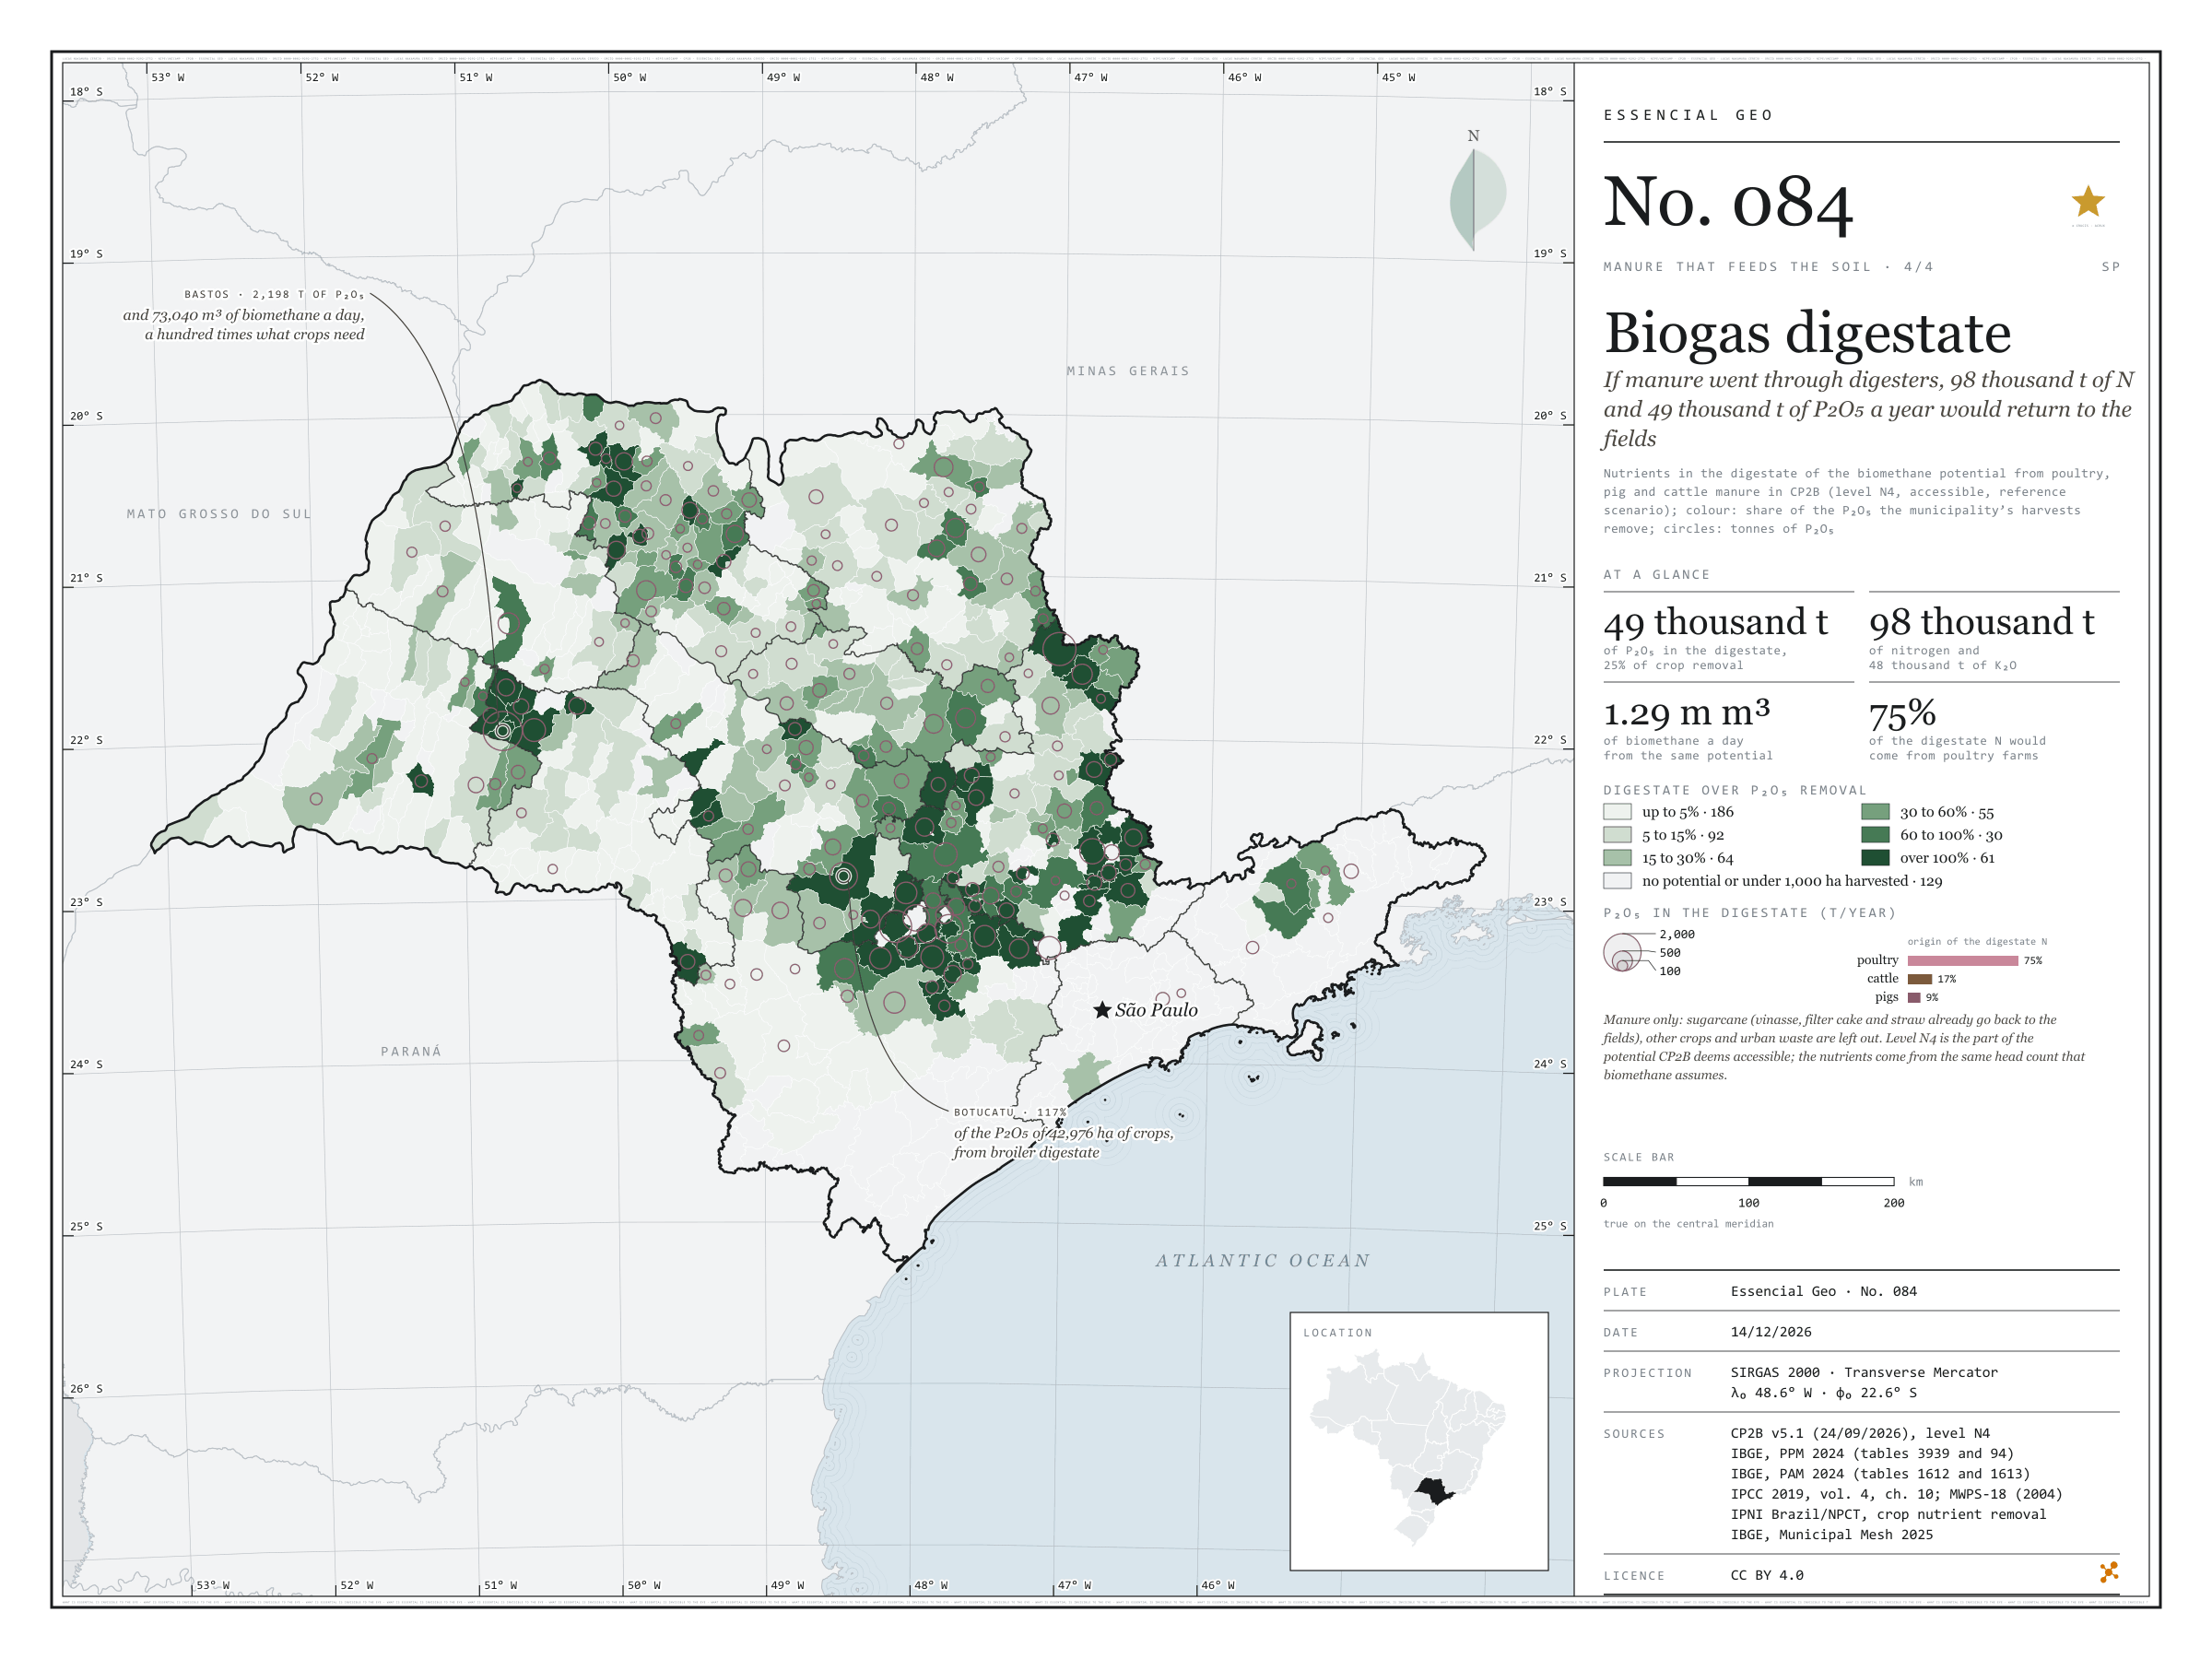
Fig. 084 São Paulo State (SP) EPSG:4674 Source: CP2B (Unicamp), IBGE, IPCC, MidWest Plan Service, IPNI Brazil/NPCT

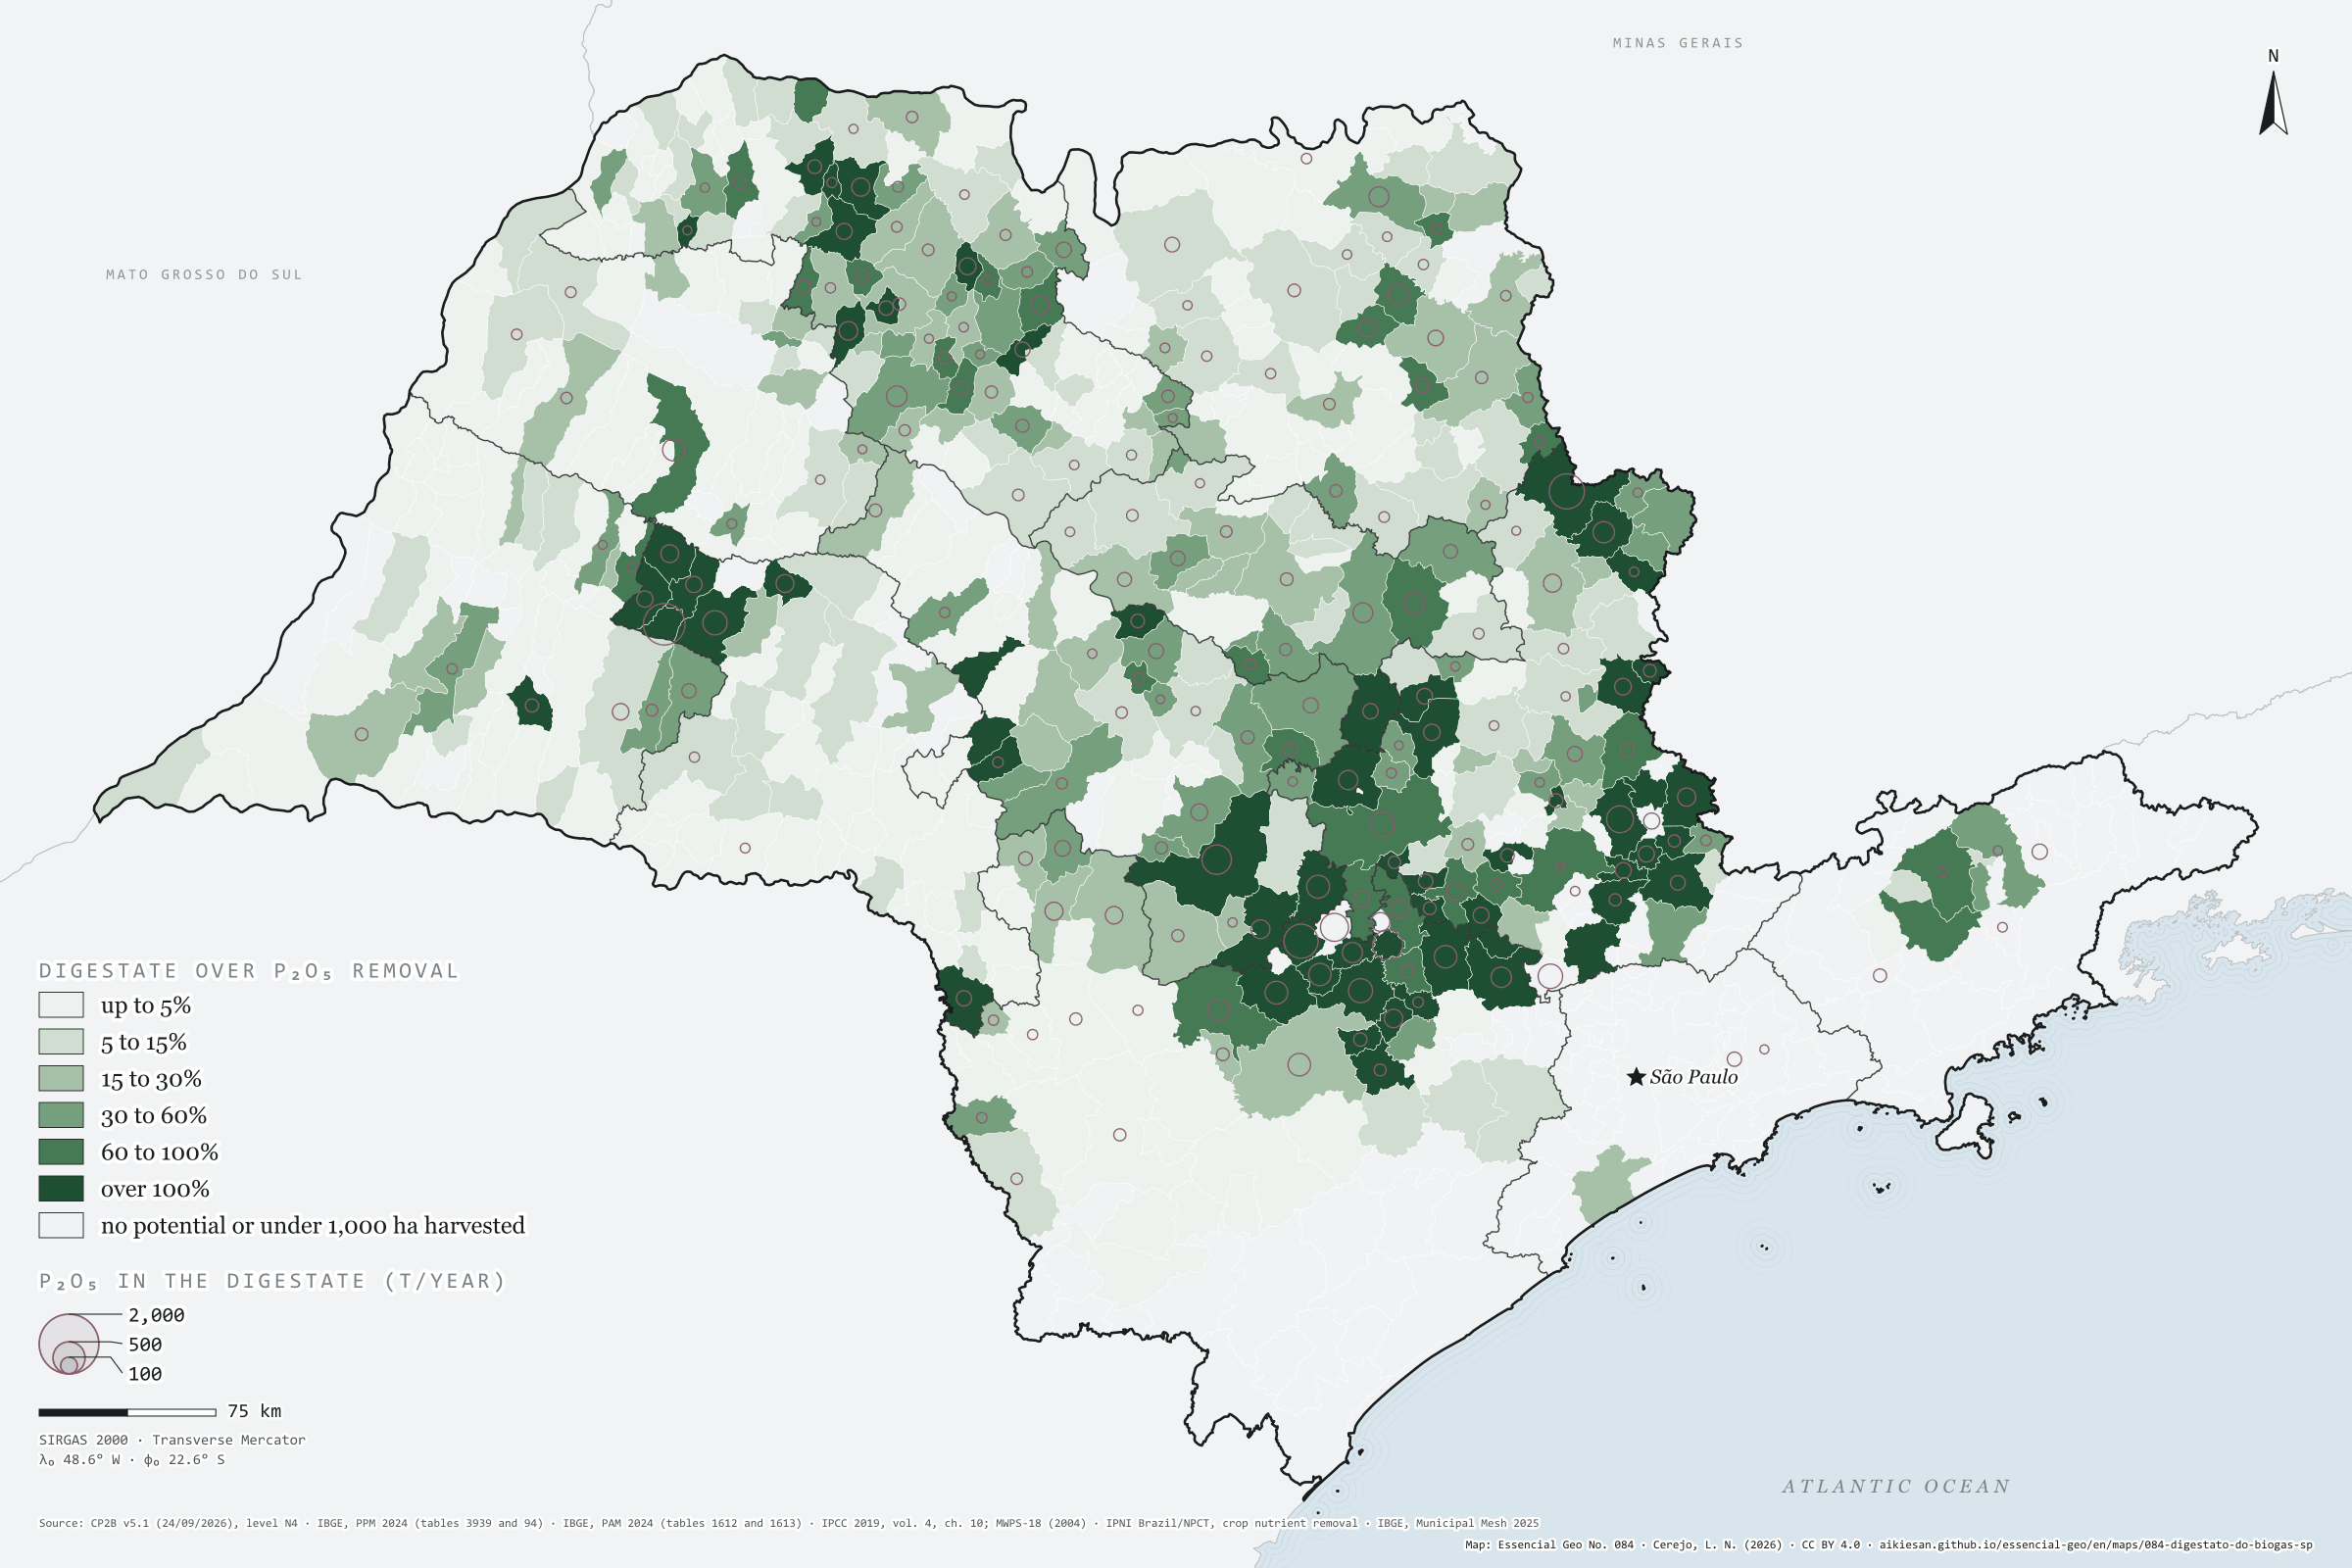
The biomethane potential of poultry, pig and cattle manure in São Paulo, at CP2B’s accessible level, is 1.29 million m³ a day. The digestate left by that biogas keeps the manure’s nutrients: about 98,000 tonnes of nitrogen, 49,000 of P₂O₅ and 48,000 of K₂O a year, equal to 25% of the phosphorus, 14% of the nitrogen and 9% of the potassium that the state’s harvests remove. Three quarters of the nitrogen would come from poultry farms. In 61 municipalities with at least 1,000 hectares harvested, digestate would supply all the P₂O₅ of the harvest. Bastos would have 2,200 tonnes of P₂O₅ in digestate, a hundred times what its crops remove; Botucatu, with 43,000 hectares of crops, 117%. Sugarcane, which makes up most of CP2B’s potential, is left out: vinasse, filter cake and straw already go back to the fields. Fourth and last plate of the collection “Manure that feeds the soil”.

Technical record · downloads · citation

At a glance

Nutrients in manure digestate (thousand t a year)
  • nitrogen (N) 98
  • phosphorus (P₂O₅) 49
  • potassium (K₂O) 48
Origin of the digestate nitrogen (%)
  • poultry 74.9%
  • cattle 16.5%
  • pigs 8.6%
Digestate P₂O₅ over the state’s crop removal

25 %

1.29 million m³ of biomethane a day from the same potential

Layers

  • municipios polygon 645 municipalities: N, P₂O₅ and K₂O in manure digestate (CP2B N4), biomethane, and the share of crop removal it replaces (same GPKG as plate 081)
  • regioes_intermediarias polygon 11 intermediate geographic regions
  • limite_estadual polygon State boundary

Metadata

Sources
CP2B (Unicamp) — biogas and biomethane potential by municipality, method v5.1 (24/09/2026), accessible level N4, reference scenario (2026)
IBGE — 2024 Municipal Agricultural Production (SIDRA, tables 1612 and 1613, variables 214 and 216; retrieved from https://apisidra.ibge.gov.br/values/t/1612/n6/in%20n3%2035/v/214/p/2024/c81/all and equivalents on 18/10/2026) (2024)
IBGE — 2024 Municipal Livestock Survey (SIDRA, tables 3939 and 94) (2024)
IPCC — 2019 Refinement to the 2006 IPCC Guidelines for National Greenhouse Gas Inventories, vol. 4, ch. 10 (tables 10.19 and 10A.5) (2019)
MidWest Plan Service — MWPS-18, Manure Characteristics, section 1, 2nd ed. (table 6) (2004)
IPNI Brazil/NPCT — Nutrient Balance Calculator (contents in the harvested product; Cunha, Casarin and Prochnow, Informações Agronômicas 130 and 145) (2014)
IBGE — Municipal Mesh 2025 (2025)
Extent
São Paulo State (SP)
CRS / Projection
SIRGAS 2000 (EPSG:4674)
EPSG:4674
Software
Node.js · d3-geo · QGIS
Method
Methane at level N4 of CP2B v5.1 (reference scenario) for manure from broilers and laying hens, pigs, and dairy, feedlot and grazing cattle, converted into equivalent head with each substrate’s mean parameters and multiplied by the N, P₂O₅ and K₂O excreted per head (IPCC 2019 and MWPS-18); digestate keeps these nutrients. Colour: digestate over the P₂O₅ removed by the municipality’s harvests (2024 PAM × IPNI), in six classes; circles: tonnes of P₂O₅.
Version
v1.0.0
Licence
CC BY 4.0
DOI
being registered on Zenodo

Downloads

Figure to reuse

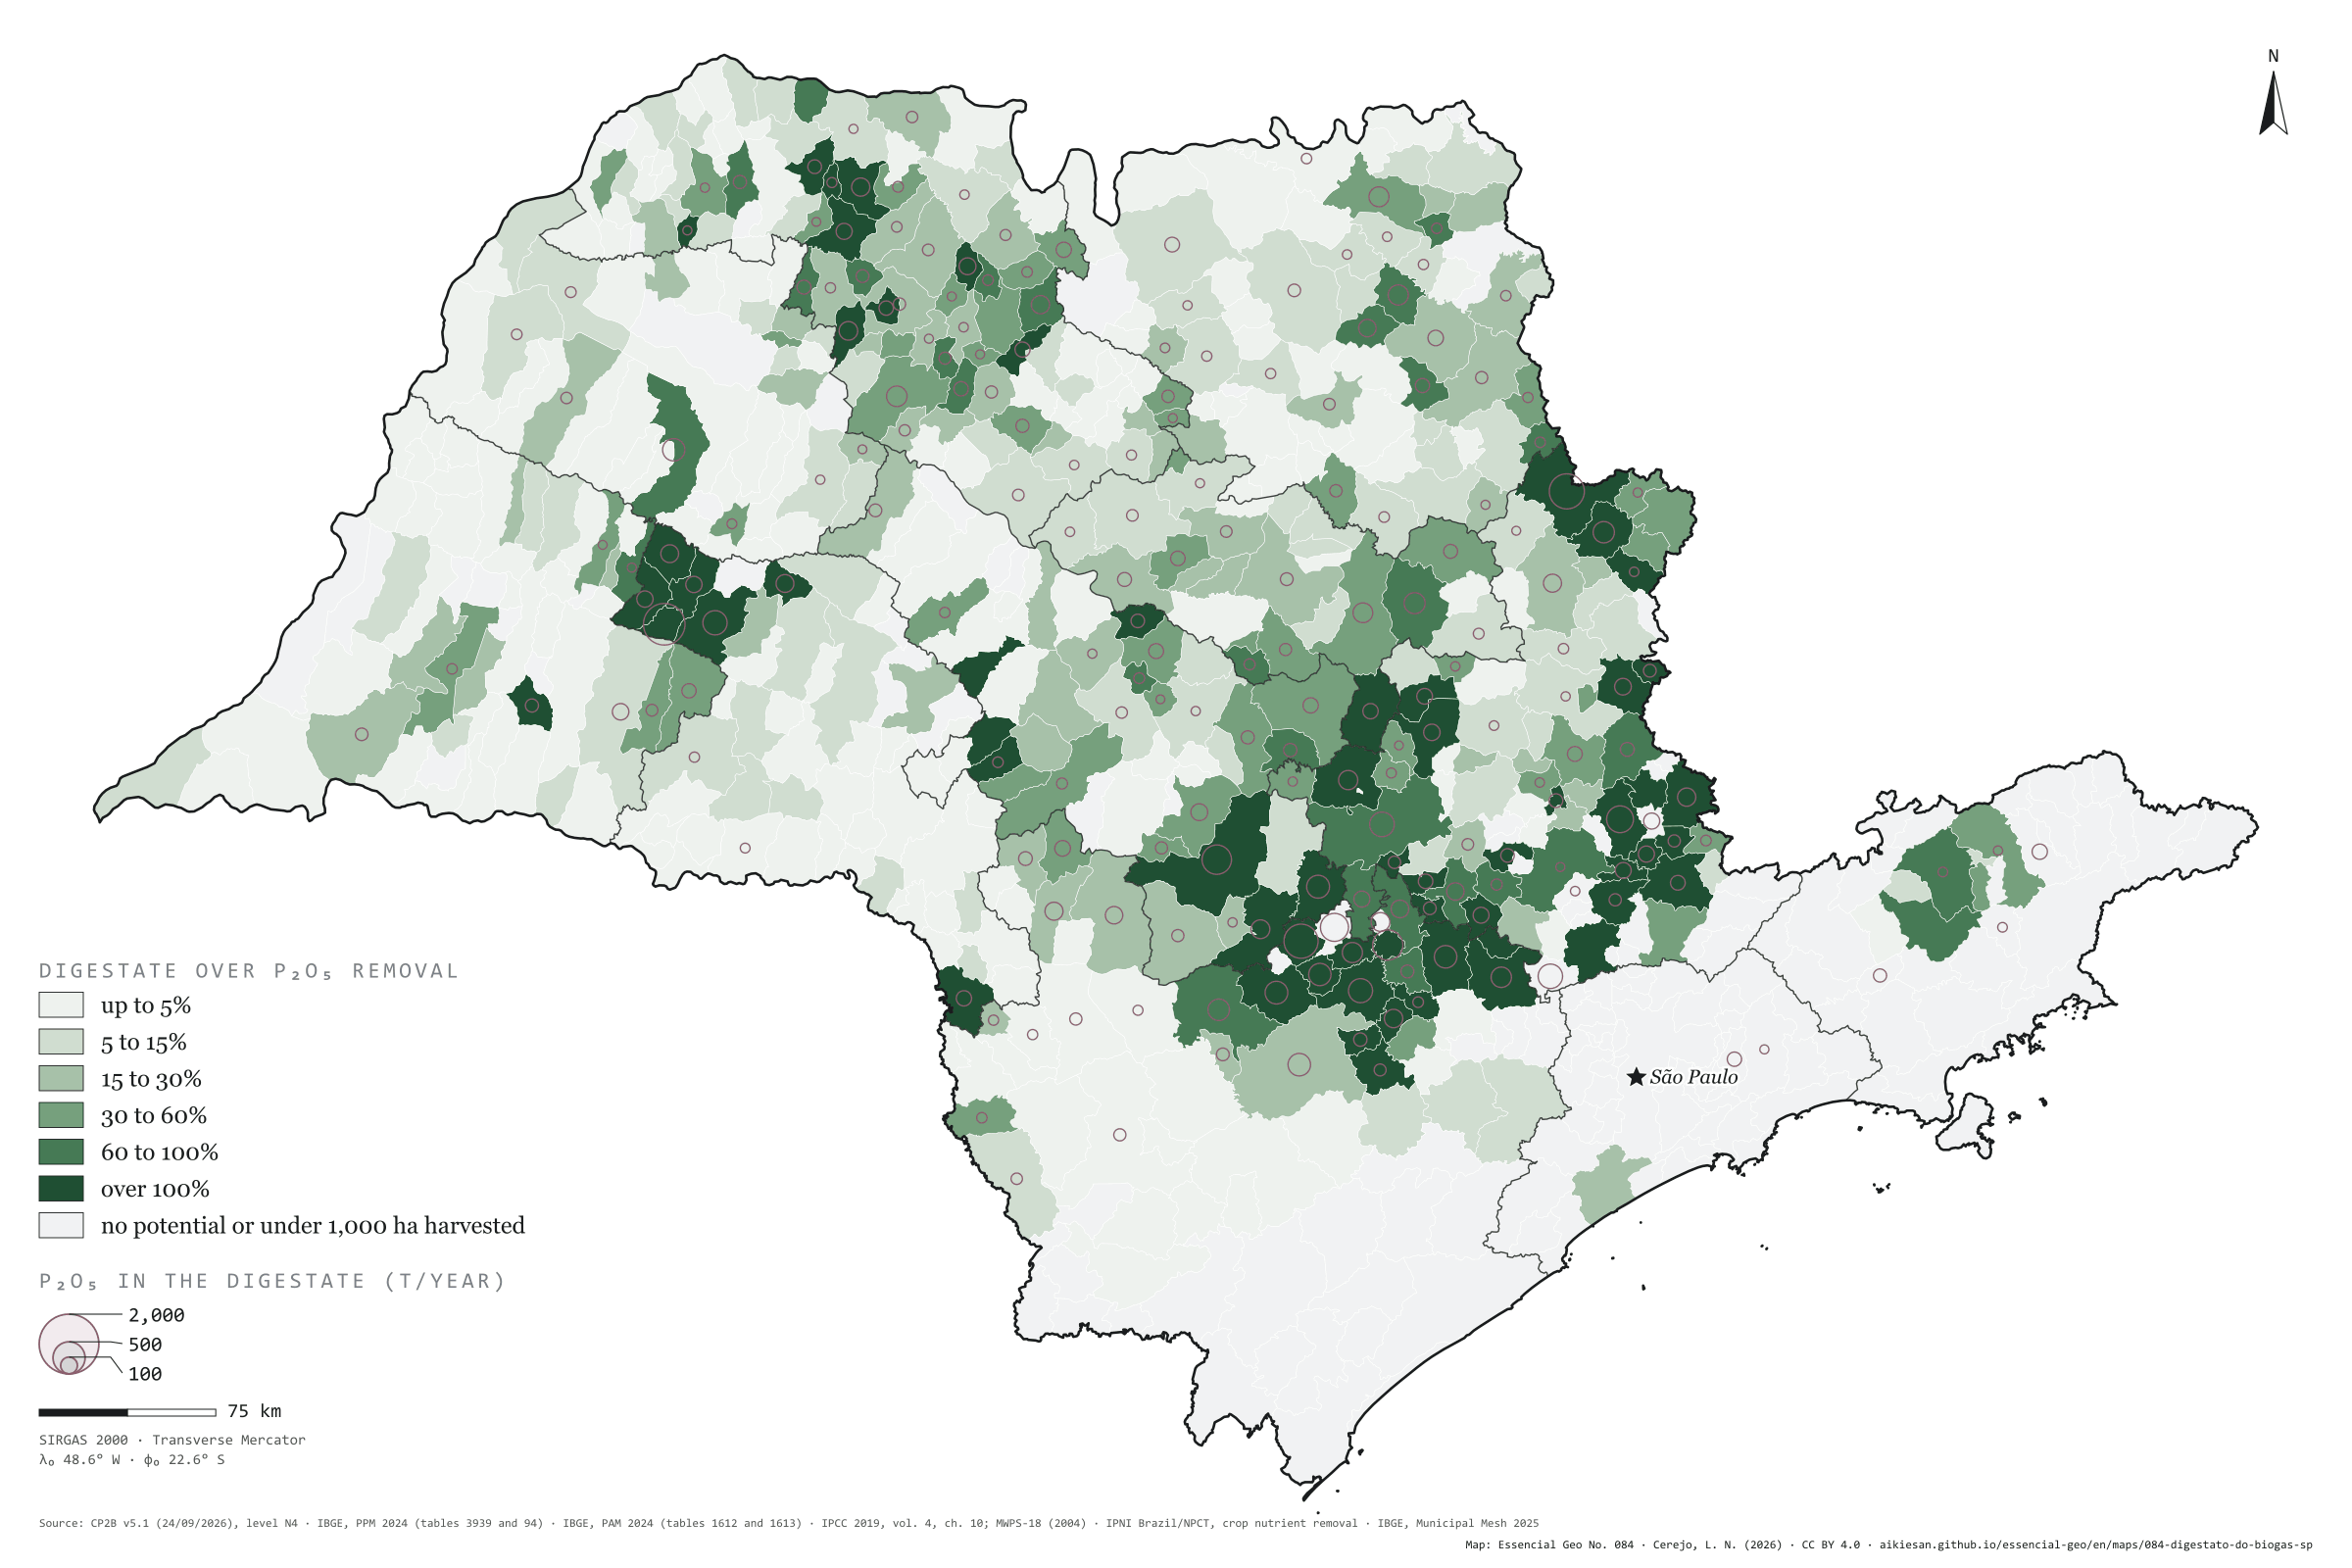
The map without a frame, with legend, scale, reference system and credit written on it: ready for papers, lectures and slides. In two versions: with the basemap (neighbours and sea) or only the mapped area, on white.

Point a camera at it to open this page.

How to cite

Cerejo, L. N. (2026). O digestato do biogás: se os dejetos passassem pelo biodigestor, voltariam ao campo 98 mil t de N e 49 mil t de P₂O₅ por ano [Biogas digestate: If manure went through digesters, 98,000 t of N and 49,000 t of P₂O₅ a year would return to the fields] (Version 1.0.0) [Data set]. Essencial. https://aikiesan.github.io/essencial-geo/en/maps/084-digestato-do-biogas-sp/

How to read this plate area, projection, scale, legend and source · 8 terms
1 Area
São Paulo State (SP) The area the plate covers. Outside it, neighbours and sea are drawn in grey, just for orientation.
2 Coordinates and projection
SIRGAS 2000 (EPSG:4674) The layers are in SIRGAS 2000; the drawing’s projection is written in the colophon at the foot of the panel.
3 Scale
Graphic scale bar in the panel The scale bar is true on the central meridian; away from it, measured distances vary a little.
4 Legend and layers
3 layers in the GeoPackage · polygon Read the legend before the map: it tells you whether a colour is a rate or a class, and whether a circle is a total.
5 Sources
CP2B (Unicamp) (2026); IBGE (2024); IPCC (2019); MidWest Plan Service (2004); IPNI Brazil/NPCT (2014); IBGE (2025) Every figure comes from a public source, with its year. The data sheet gives each one’s address.

Terms on this plate

Harvest year
Cane years are not calendar years: in the Centre-South the harvest runs from April to March; in the Northeast, from September to August. That is why the two regions crush in opposite months.
Cane straw
Tops and leaves left in the field by mechanised harvesting since cane burning ended. Some can be collected for energy; some must stay to protect the soil.
Vinasse
The liquid left by distillation, around ten litres per litre of ethanol, rich in potassium. It goes back to the cane fields as fertiliser and can pass through a digester first.
Filter cake
The residue from clarifying cane juice, rich in phosphorus and organic matter: a fertiliser and a biogas feedstock.
Biogas
The gas from the airless breakdown (anaerobic digestion) of organic waste: manure, vinasse, sewage sludge, rubbish. It is 50% to 70% methane; the rest is mostly CO₂.
Biomethane
Biogas upgraded, with most of the CO₂ removed, to ANP’s specification, at which point it replaces natural gas in the pipeline, in industry and in the lorry’s tank.
N1 to N4 (potential levels)
CP2B’s four levels: N1 theoretical (all residue generated), N2 technical (after collection), N3 mobilisable (after competing uses and what already becomes biogas) and N4 accessible (after storage and the logistic factor).
Digestate
What comes out of the digester after the biogas: a liquid with nitrogen, phosphorus and potassium that goes back to the field as fertiliser.

Download

Layers, table and figures, under CC BY 4.0. Cite with the DOI.

Full record and citation

Method notes · No. 084

Biogas digestate from manure

Português · English

Plate No. 084, the fourth and last in the collection Manure that feeds the soil. What manure gives back without a digester is on plate 083.

What the files contain

Layer (GPKG)GeometryContent
municipiospolygon645 municipalities: dig_n_t, dig_p2o5_t, dig_k2o_t (nutrients in digestate); dig_biometano_m3_dia; dig_cob_n_pct, dig_cob_p2o5_pct, dig_cob_k2o_pct (digestate over crop removal); the collection’s other fields
regioes_intermediarias, limite_estadualpolygonreference

The GPKG and CSV are the collection’s, published with plate 081; this plate’s QGIS style is dig_cob_p2o5_pct.

Method

  1. Potential. Methane per year at the accessible level N4 of CP2B v5.1, reference scenario, for the six manure substrates: broilers, laying hens, pigs, dairy cattle, feedlot cattle and grazing cattle. Biomethane is the equivalent CP2B publishes.
  2. Equivalent head. Methane divided by one animal’s methane, using CP2B’s own mean parameters for each substrate (manure per head, total solids, volatile solids and biochemical methane potential). Each substrate maps to a herd category: broiler, hen, pig, milked cow, feedlot animal (IPCC coefficient for high-productivity systems) and beef animal.
  3. Nutrients. Equivalent head times the N, P₂O₅ and K₂O excreted per head (IPCC 2019 and MWPS-18, as on plates 081 and 082). Digestion removes carbon as methane and carbon dioxide and keeps the nitrogen, phosphorus and potassium, which leave in the digestate.
  4. Comparison. Digestate over the P₂O₅ removed by the municipality’s harvests (plate 083), in six classes closed on the right: up to 5, 5 to 15, 15 to 30, 30 to 60, 60 to 100 and over 100%. Municipalities with no manure potential or under 1,000 harvested hectares are grey. Circles for municipalities with at least 50 tonnes of P₂O₅ in digestate.

Limitations

  • These are estimates. CP2B’s potential is technical, not an installed fleet of digesters; the nutrients come from mean per-head coefficients and from converting methane back into head, and carry the uncertainty of both.
  • Animal manure only. Sugarcane (82% of CP2B’s potential in the state, whose residues, vinasse, filter cake and straw, already go back to the fields), other crops and urban waste and sewage are left out.
  • Part of the nitrogen is lost as ammonia when digestate is stored and spread; the figure is the nitrogen that enters the digester.
  • Mineral fertiliser delivered in the state is not compared: ANDA does not publish deliveries by municipality as open data. The comparison is with what harvests remove.

View this map’s folder on GitHub

Technical record

Technical record · No. 084

Biogas digestate

At a glance

Nutrients in manure digestate (thousand t a year)
  • nitrogen (N) 98
  • phosphorus (P₂O₅) 49
  • potassium (K₂O) 48
Origin of the digestate nitrogen (%)
  • poultry 74.9%
  • cattle 16.5%
  • pigs 8.6%
Digestate P₂O₅ over the state’s crop removal

25 %

1.29 million m³ of biomethane a day from the same potential

Layers

  • municipios polygon 645 municipalities: N, P₂O₅ and K₂O in manure digestate (CP2B N4), biomethane, and the share of crop removal it replaces (same GPKG as plate 081)
  • regioes_intermediarias polygon 11 intermediate geographic regions
  • limite_estadual polygon State boundary

Metadata

Sources
CP2B (Unicamp) — biogas and biomethane potential by municipality, method v5.1 (24/09/2026), accessible level N4, reference scenario (2026)
IBGE — 2024 Municipal Agricultural Production (SIDRA, tables 1612 and 1613, variables 214 and 216; retrieved from https://apisidra.ibge.gov.br/values/t/1612/n6/in%20n3%2035/v/214/p/2024/c81/all and equivalents on 18/10/2026) (2024)
IBGE — 2024 Municipal Livestock Survey (SIDRA, tables 3939 and 94) (2024)
IPCC — 2019 Refinement to the 2006 IPCC Guidelines for National Greenhouse Gas Inventories, vol. 4, ch. 10 (tables 10.19 and 10A.5) (2019)
MidWest Plan Service — MWPS-18, Manure Characteristics, section 1, 2nd ed. (table 6) (2004)
IPNI Brazil/NPCT — Nutrient Balance Calculator (contents in the harvested product; Cunha, Casarin and Prochnow, Informações Agronômicas 130 and 145) (2014)
IBGE — Municipal Mesh 2025 (2025)
Extent
São Paulo State (SP)
CRS / Projection
SIRGAS 2000 (EPSG:4674)
EPSG:4674
Software
Node.js · d3-geo · QGIS
Method
Methane at level N4 of CP2B v5.1 (reference scenario) for manure from broilers and laying hens, pigs, and dairy, feedlot and grazing cattle, converted into equivalent head with each substrate’s mean parameters and multiplied by the N, P₂O₅ and K₂O excreted per head (IPCC 2019 and MWPS-18); digestate keeps these nutrients. Colour: digestate over the P₂O₅ removed by the municipality’s harvests (2024 PAM × IPNI), in six classes; circles: tonnes of P₂O₅.
Version
v1.0.0
Licence
CC BY 4.0
DOI
being registered on Zenodo

Downloads

Figure to reuse

The map without a frame, with legend, scale, reference system and credit written on it: ready for papers, lectures and slides. In two versions: with the basemap (neighbours and sea) or only the mapped area, on white.

Point a camera at it to open this page.

How to cite

Cerejo, L. N. (2026). O digestato do biogás: se os dejetos passassem pelo biodigestor, voltariam ao campo 98 mil t de N e 49 mil t de P₂O₅ por ano [Biogas digestate: If manure went through digesters, 98,000 t of N and 49,000 t of P₂O₅ a year would return to the fields] (Version 1.0.0) [Data set]. Essencial. https://aikiesan.github.io/essencial-geo/en/maps/084-digestato-do-biogas-sp/

100%