Skip to content
Essencial

No. 083 Land use Manure that feeds the soil 3/4

Manure and harvests

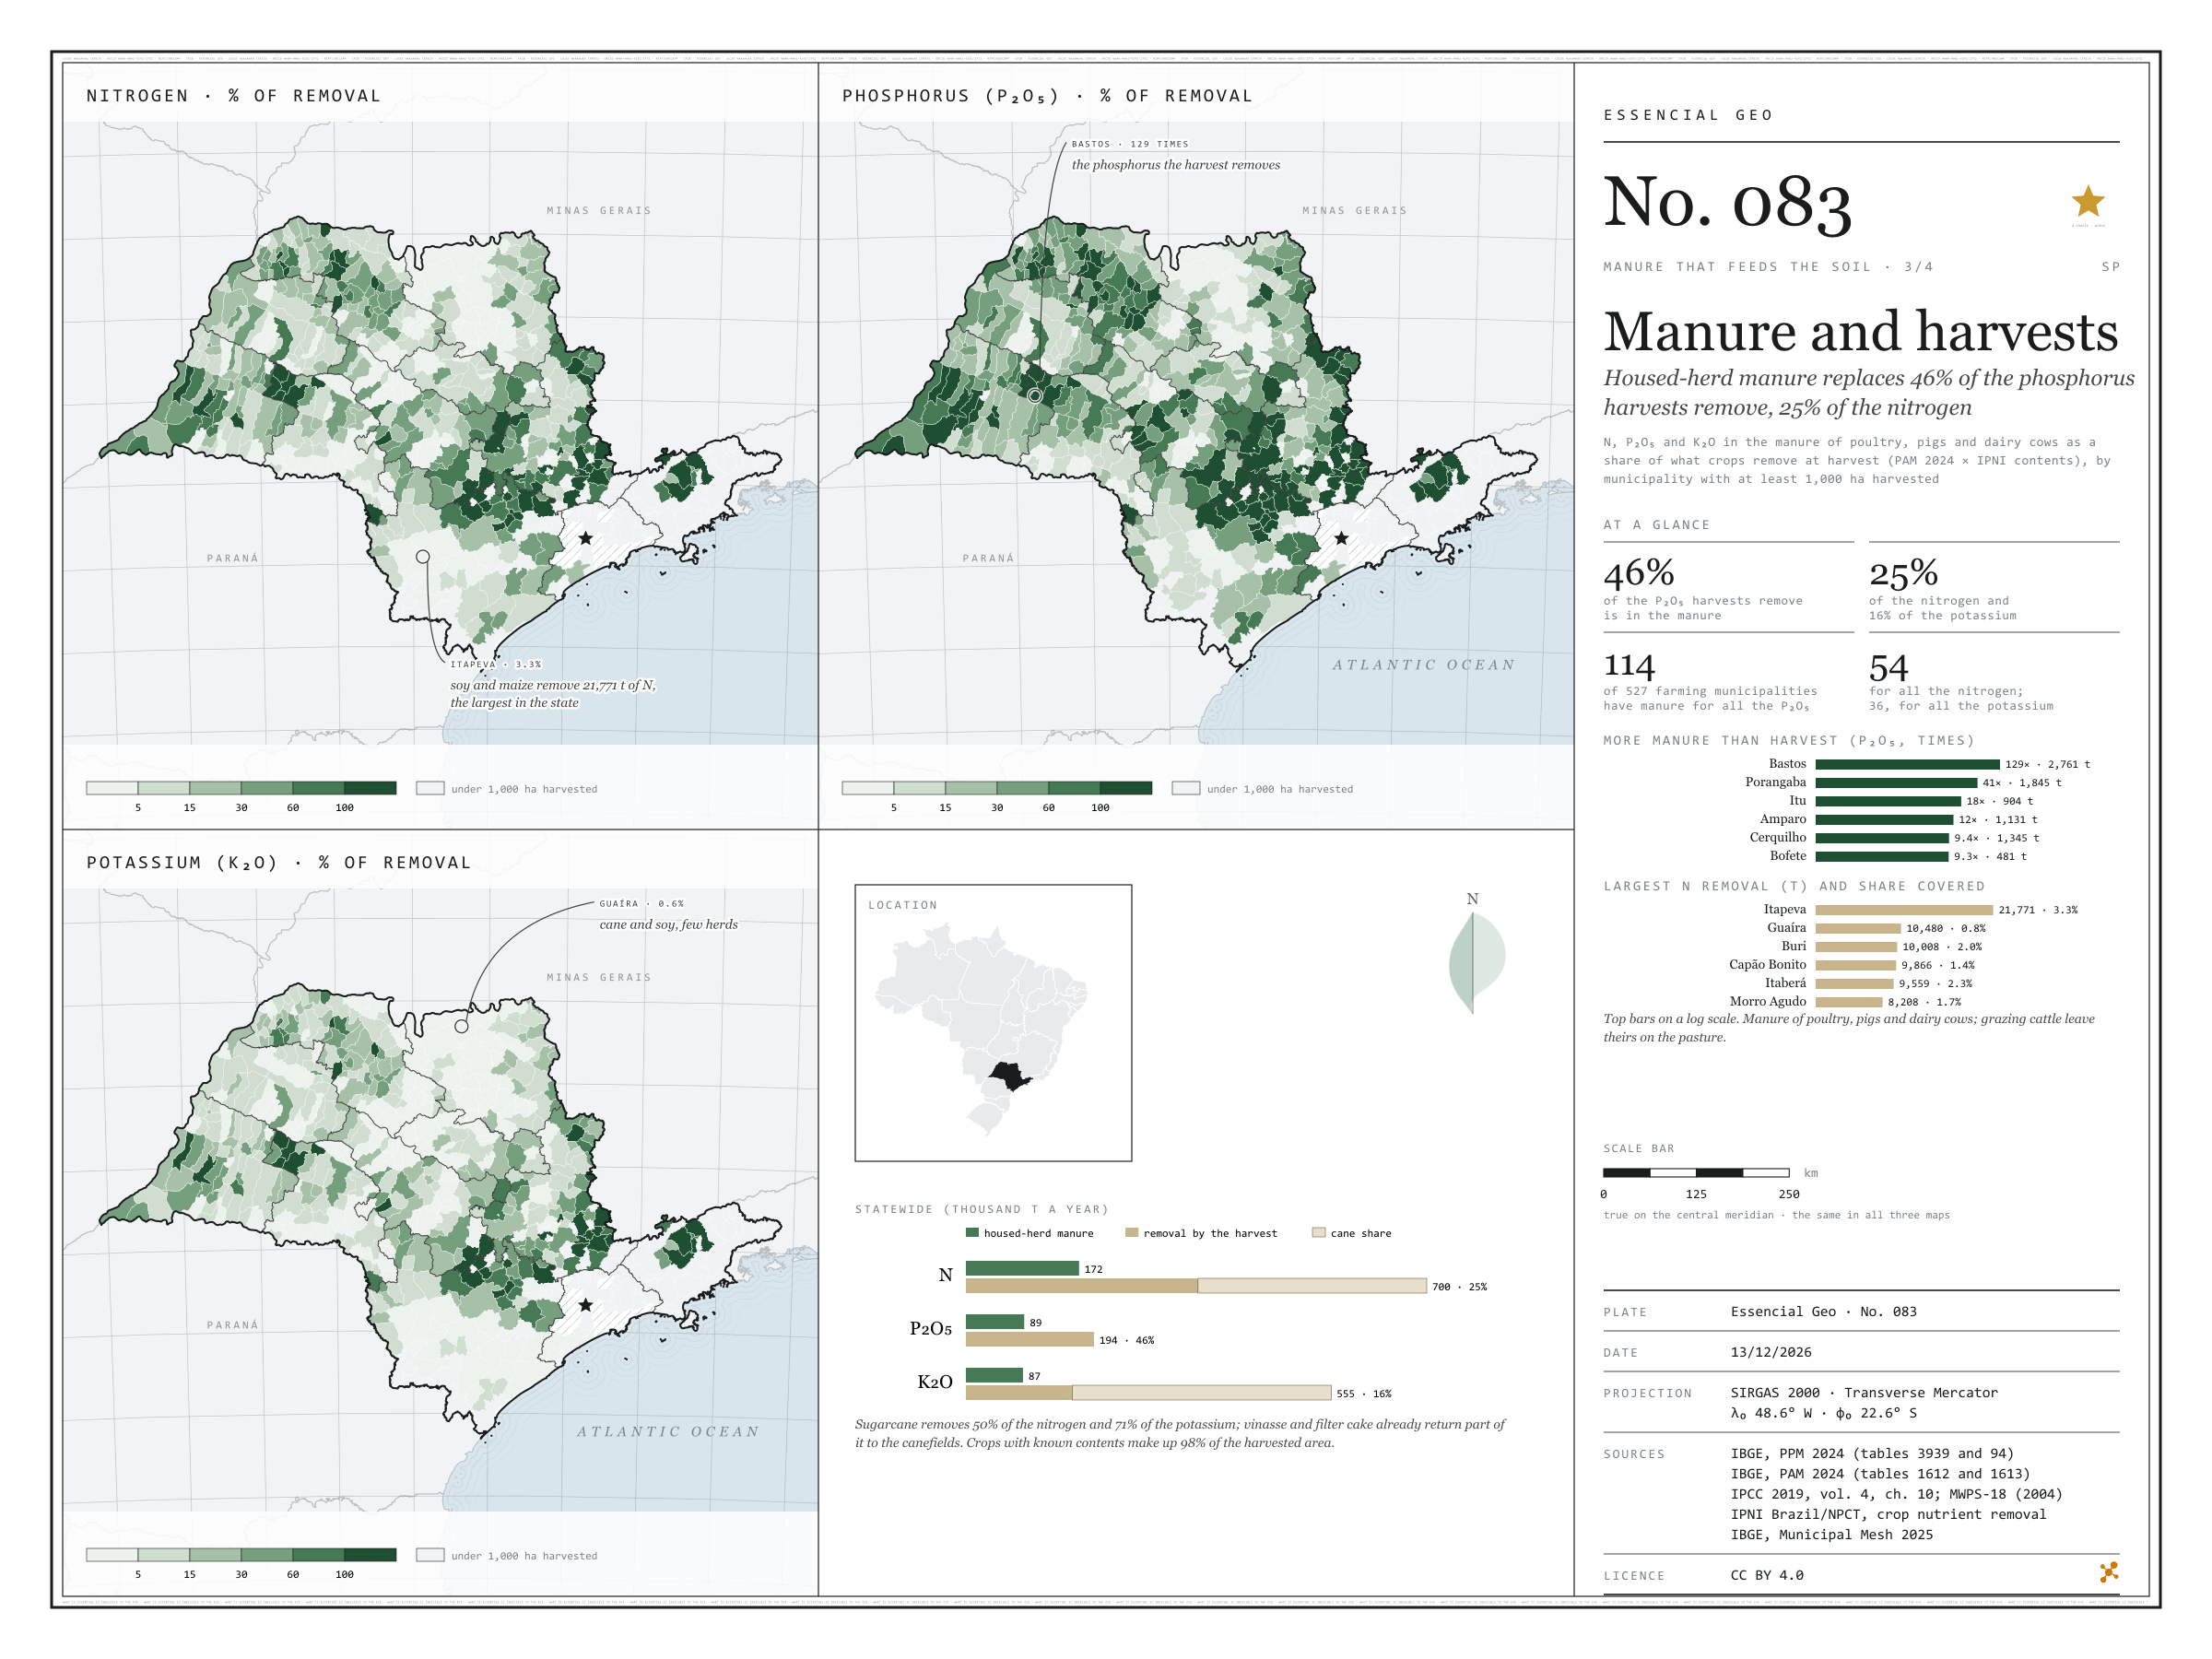
Housed-herd manure replaces 46% of the phosphorus harvests remove, 25% of the nitrogen

Record, downloads and citation
Fig. 083 São Paulo State (SP) EPSG:4674 Source: IBGE, IPNI Brazil/NPCT, IPCC, MidWest Plan Service

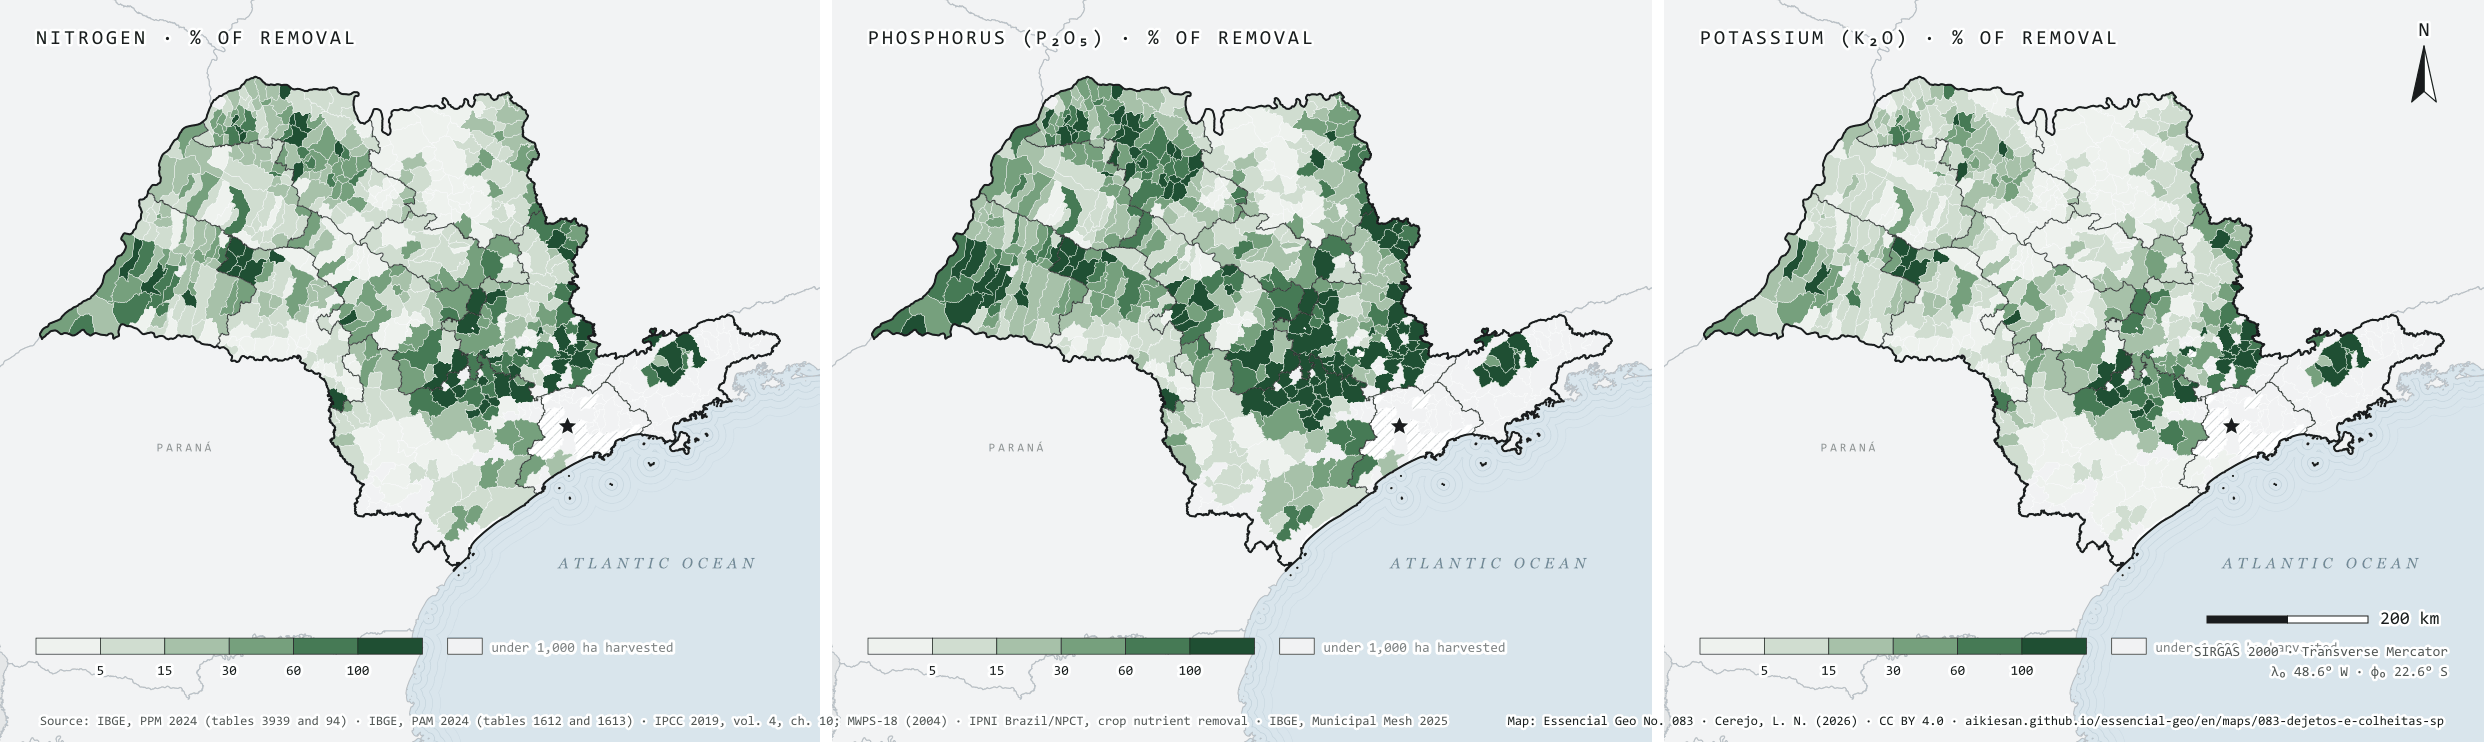
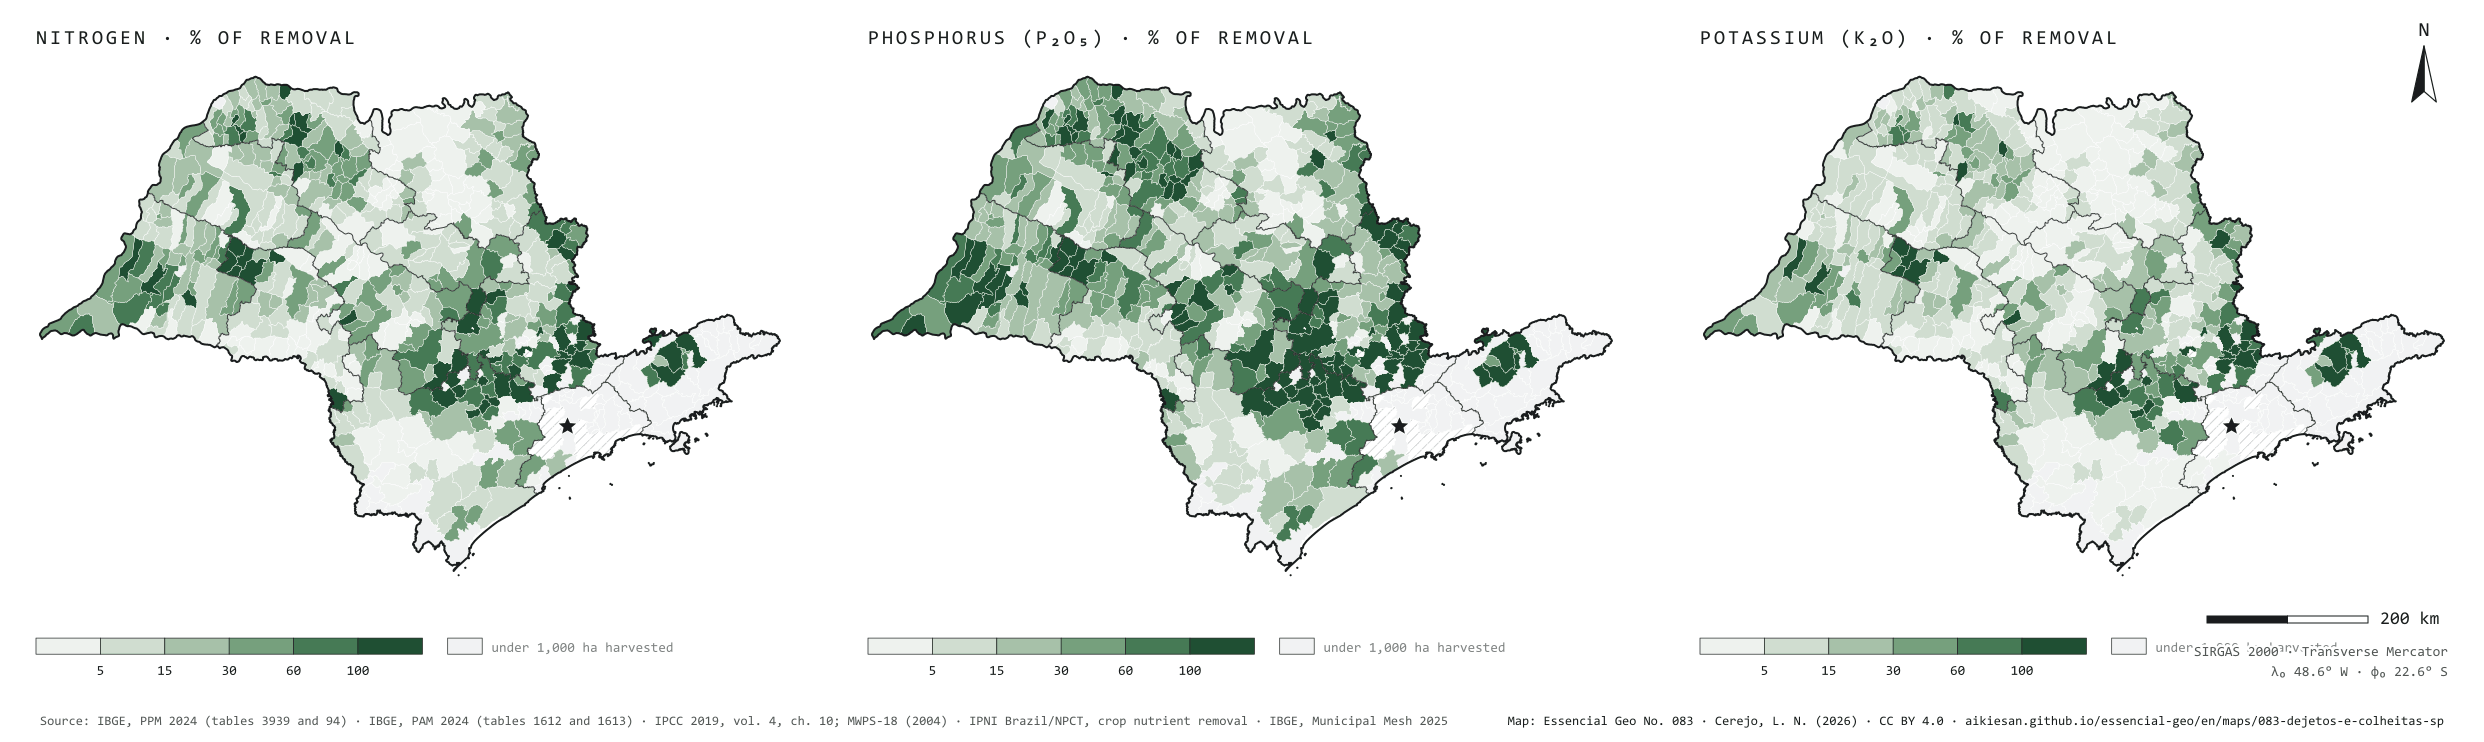
São Paulo’s harvests take from the soil, every year, about 700,000 tonnes of nitrogen, 194,000 of P₂O₅ and 555,000 of K₂O, by 2024 PAM production and IPNI contents. The manure of poultry, pigs and dairy cows, the part that can be collected, holds 172,000, 89,000 and 87,000: it replaces 46% of the phosphorus, 25% of the nitrogen and 16% of the potassium. Sugarcane weighs on the account: it removes half the nitrogen and 71% of the potassium, and part of that returns to the canefields with vinasse and filter cake. Of the 527 municipalities with at least 1,000 hectares harvested, 114 have manure to replace all the phosphorus, 54 all the nitrogen and 36 all the potassium. In the grain regions the account does not balance: Itapeva removes 21,800 tonnes of N at harvest, and local manure covers 3.3%. Third plate of the collection “Manure that feeds the soil”.

Technical record · downloads · citation

At a glance

Share of crop removal that housed-herd manure replaces, statewide (%)
  • phosphorus (P₂O₅) 46
  • nitrogen (N) 25
  • potassium (K₂O) 16
Crop removal and housed-herd manure (thousand t a year)
  • N removed 700
  • N in manure 172
  • P₂O₅ removed 194
  • P₂O₅ in manure 89
  • K₂O removed 555
  • K₂O in manure 87
Farming municipalities with manure for all the harvest’s phosphorus

114 of 527

with at least 1,000 hectares harvested

Layers

  • municipios polygon 645 municipalities: housed-herd manure, crop removal of N, P₂O₅ and K₂O and coverage (same GPKG as plate 081)
  • regioes_intermediarias polygon 11 intermediate geographic regions
  • limite_estadual polygon State boundary

Metadata

Sources
IBGE — 2024 Municipal Agricultural Production (SIDRA, tables 1612 and 1613, variables 214 and 216; retrieved from https://apisidra.ibge.gov.br/values/t/1612/n6/in%20n3%2035/v/214/p/2024/c81/all and equivalents on 18/10/2026) (2024)
IPNI Brazil/NPCT — Nutrient Balance Calculator (contents in the harvested product; Cunha, Casarin and Prochnow, Informações Agronômicas 130 and 145) (2014)
IBGE — 2024 Municipal Livestock Survey (SIDRA, tables 3939 and 94; table 94 retrieved from https://apisidra.ibge.gov.br/values/t/94/n6/in%20n3%2035/v/all/p/2024 on 18/10/2026) (2024)
IPCC — 2019 Refinement to the 2006 IPCC Guidelines for National Greenhouse Gas Inventories, vol. 4, ch. 10 (tables 10.19 and 10A.5) (2019)
MidWest Plan Service — MWPS-18, Manure Characteristics, section 1, 2nd ed. (table 6) (2004)
IBGE — Municipal Mesh 2025 (2025)
Extent
São Paulo State (SP)
CRS / Projection
SIRGAS 2000 (EPSG:4674)
EPSG:4674
Software
Node.js · d3-geo · QGIS
Method
N, P₂O₅ and K₂O in poultry, pig and dairy manure (2024 PPM × IPCC 2019 and MWPS-18) over the N, P₂O₅ and K₂O removed by the municipality’s temporary and permanent crops (2024 PAM production × IPNI Brazil contents in the harvested product), in six classes, in municipalities with at least 1,000 hectares harvested.
Version
v1.0.0
Licence
CC BY 4.0
DOI
being registered on Zenodo

Downloads

Figure to reuse

The map without a frame, with legend, scale, reference system and credit written on it: ready for papers, lectures and slides. In two versions: with the basemap (neighbours and sea) or only the mapped area, on white.

Point a camera at it to open this page.

How to cite

Cerejo, L. N. (2026). Dejetos e colheitas: o esterco confinado repõe 46% do fósforo que as colheitas levam, 25% do nitrogênio [Manure and harvests: Housed-herd manure replaces 46% of the phosphorus harvests remove, 25% of the nitrogen] (Version 1.0.0) [Data set]. Essencial. https://aikiesan.github.io/essencial-geo/en/maps/083-dejetos-e-colheitas-sp/

How to read this plate area, projection, scale, legend and source · 3 terms
1 Area
São Paulo State (SP) The area the plate covers. Outside it, neighbours and sea are drawn in grey, just for orientation.
2 Coordinates and projection
SIRGAS 2000 (EPSG:4674) The layers are in SIRGAS 2000; the drawing’s projection is written in the colophon at the foot of the panel.
3 Scale
Graphic scale bar in the panel The scale bar is true on the central meridian; away from it, measured distances vary a little.
4 Legend and layers
3 layers in the GeoPackage · polygon Read the legend before the map: it tells you whether a colour is a rate or a class, and whether a circle is a total.
5 Sources
IBGE (2024); IPNI Brazil/NPCT (2014); IPCC (2019); MidWest Plan Service (2004); IBGE (2025) Every figure comes from a public source, with its year. The data sheet gives each one’s address.

Terms on this plate

Harvest year
Cane years are not calendar years: in the Centre-South the harvest runs from April to March; in the Northeast, from September to August. That is why the two regions crush in opposite months.
Vinasse
The liquid left by distillation, around ten litres per litre of ethanol, rich in potassium. It goes back to the cane fields as fertiliser and can pass through a digester first.
Filter cake
The residue from clarifying cane juice, rich in phosphorus and organic matter: a fertiliser and a biogas feedstock.

Download

Layers, table and figures, under CC BY 4.0. Cite with the DOI.

Full record and citation

Method notes · No. 083

Manure and harvests: how much of what crops take the manure gives back

Português · English

Plate No. 083, the third of four in the collection Manure that feeds the soil: the Eurostat and OECD gross nutrient balance, reduced to two terms, input from manure and output at harvest. The manure comes from plates 081 and 082.

What the files contain

Layer (GPKG)GeometryContent
municipiospolygon645 municipalities: n_conf_t, p2o5_conf_t, k2o_conf_t (poultry, pig and dairy manure); n_exporta_t, p2o5_exporta_t, k2o_exporta_t (crop removal); cob_n_pct, cob_p2o5_pct, cob_k2o_pct (manure over removal); area_lavoura_ha; the collection’s other fields
regioes_intermediarias, limite_estadualpolygonreference

The GPKG and CSV are the collection’s, published with plate 081; this plate’s QGIS styles are cob_n_pct, cob_p2o5_pct and cob_k2o_pct. The coefficients CSV gives each crop’s contents.

Method

  1. Output: removal at harvest. Production of each temporary and permanent crop in the 2024 PAM (tables 1612 and 1613, retrieved through the SIDRA API on 18/10/2026) times the N, P and K content of the harvested product from the IPNI Brazil (now NPCT) balance calculator, with P and K converted to P₂O₅ (× 2.2914) and K₂O (× 1.2046). Nineteen crops are included, 97.8% of the state’s harvested area; tangerine and lime use the orange contents. Per tonne harvested, for instance: sugarcane 0.83 kg of N, 0.25 of P₂O₅ and 0.94 of K₂O; soy 59.2, 12.6 and 22.6; maize 13.5, 4.8 and 3.7.
  2. Input: collectable manure. N, P₂O₅ and K₂O in the manure of hens, broilers, pigs, sows and milked cows, as on plate 082 (K₂O/N also from table 6 of MWPS-18).
  3. Coverage. Manure over removal, by nutrient, in six classes closed on the right: up to 5, 5 to 15, 15 to 30, 30 to 60, 60 to 100 and over 100%. Municipalities with under 1,000 harvested hectares are grey: there the ratio loses meaning (in the capital, for instance, it would exceed 600%).

Limitations

  • These are estimates, and the account is partial. The full balance also adds mineral fertiliser, biological fixation, deposition and seed, and subtracts losses. Mineral fertiliser is left out because ANDA does not publish deliveries by municipality as open data.
  • Harvested-product contents vary with variety, yield and management; IPNI’s are means. Sorghum, at 7.5 g of P per kg in the IPNI table, is high for the grain, and is used as published.
  • Soy takes nearly all its nitrogen from the air through biological fixation; N removal in the grain regions is not all nitrogen that needs replacing.
  • On sugarcane, vinasse, filter cake and straw already return part of the potassium and nitrogen to the fields; the account leaves them out.
  • Coverage assumes manure stays in the municipality where it arises; in practice, poultry litter and hen manure travel hundreds of kilometres.

View this map’s folder on GitHub

Technical record

Technical record · No. 083

Manure and harvests

At a glance

Share of crop removal that housed-herd manure replaces, statewide (%)
  • phosphorus (P₂O₅) 46
  • nitrogen (N) 25
  • potassium (K₂O) 16
Crop removal and housed-herd manure (thousand t a year)
  • N removed 700
  • N in manure 172
  • P₂O₅ removed 194
  • P₂O₅ in manure 89
  • K₂O removed 555
  • K₂O in manure 87
Farming municipalities with manure for all the harvest’s phosphorus

114 of 527

with at least 1,000 hectares harvested

Layers

  • municipios polygon 645 municipalities: housed-herd manure, crop removal of N, P₂O₅ and K₂O and coverage (same GPKG as plate 081)
  • regioes_intermediarias polygon 11 intermediate geographic regions
  • limite_estadual polygon State boundary

Metadata

Sources
IBGE — 2024 Municipal Agricultural Production (SIDRA, tables 1612 and 1613, variables 214 and 216; retrieved from https://apisidra.ibge.gov.br/values/t/1612/n6/in%20n3%2035/v/214/p/2024/c81/all and equivalents on 18/10/2026) (2024)
IPNI Brazil/NPCT — Nutrient Balance Calculator (contents in the harvested product; Cunha, Casarin and Prochnow, Informações Agronômicas 130 and 145) (2014)
IBGE — 2024 Municipal Livestock Survey (SIDRA, tables 3939 and 94; table 94 retrieved from https://apisidra.ibge.gov.br/values/t/94/n6/in%20n3%2035/v/all/p/2024 on 18/10/2026) (2024)
IPCC — 2019 Refinement to the 2006 IPCC Guidelines for National Greenhouse Gas Inventories, vol. 4, ch. 10 (tables 10.19 and 10A.5) (2019)
MidWest Plan Service — MWPS-18, Manure Characteristics, section 1, 2nd ed. (table 6) (2004)
IBGE — Municipal Mesh 2025 (2025)
Extent
São Paulo State (SP)
CRS / Projection
SIRGAS 2000 (EPSG:4674)
EPSG:4674
Software
Node.js · d3-geo · QGIS
Method
N, P₂O₅ and K₂O in poultry, pig and dairy manure (2024 PPM × IPCC 2019 and MWPS-18) over the N, P₂O₅ and K₂O removed by the municipality’s temporary and permanent crops (2024 PAM production × IPNI Brazil contents in the harvested product), in six classes, in municipalities with at least 1,000 hectares harvested.
Version
v1.0.0
Licence
CC BY 4.0
DOI
being registered on Zenodo

Downloads

Figure to reuse

The map without a frame, with legend, scale, reference system and credit written on it: ready for papers, lectures and slides. In two versions: with the basemap (neighbours and sea) or only the mapped area, on white.

Point a camera at it to open this page.

How to cite

Cerejo, L. N. (2026). Dejetos e colheitas: o esterco confinado repõe 46% do fósforo que as colheitas levam, 25% do nitrogênio [Manure and harvests: Housed-herd manure replaces 46% of the phosphorus harvests remove, 25% of the nitrogen] (Version 1.0.0) [Data set]. Essencial. https://aikiesan.github.io/essencial-geo/en/maps/083-dejetos-e-colheitas-sp/

100%