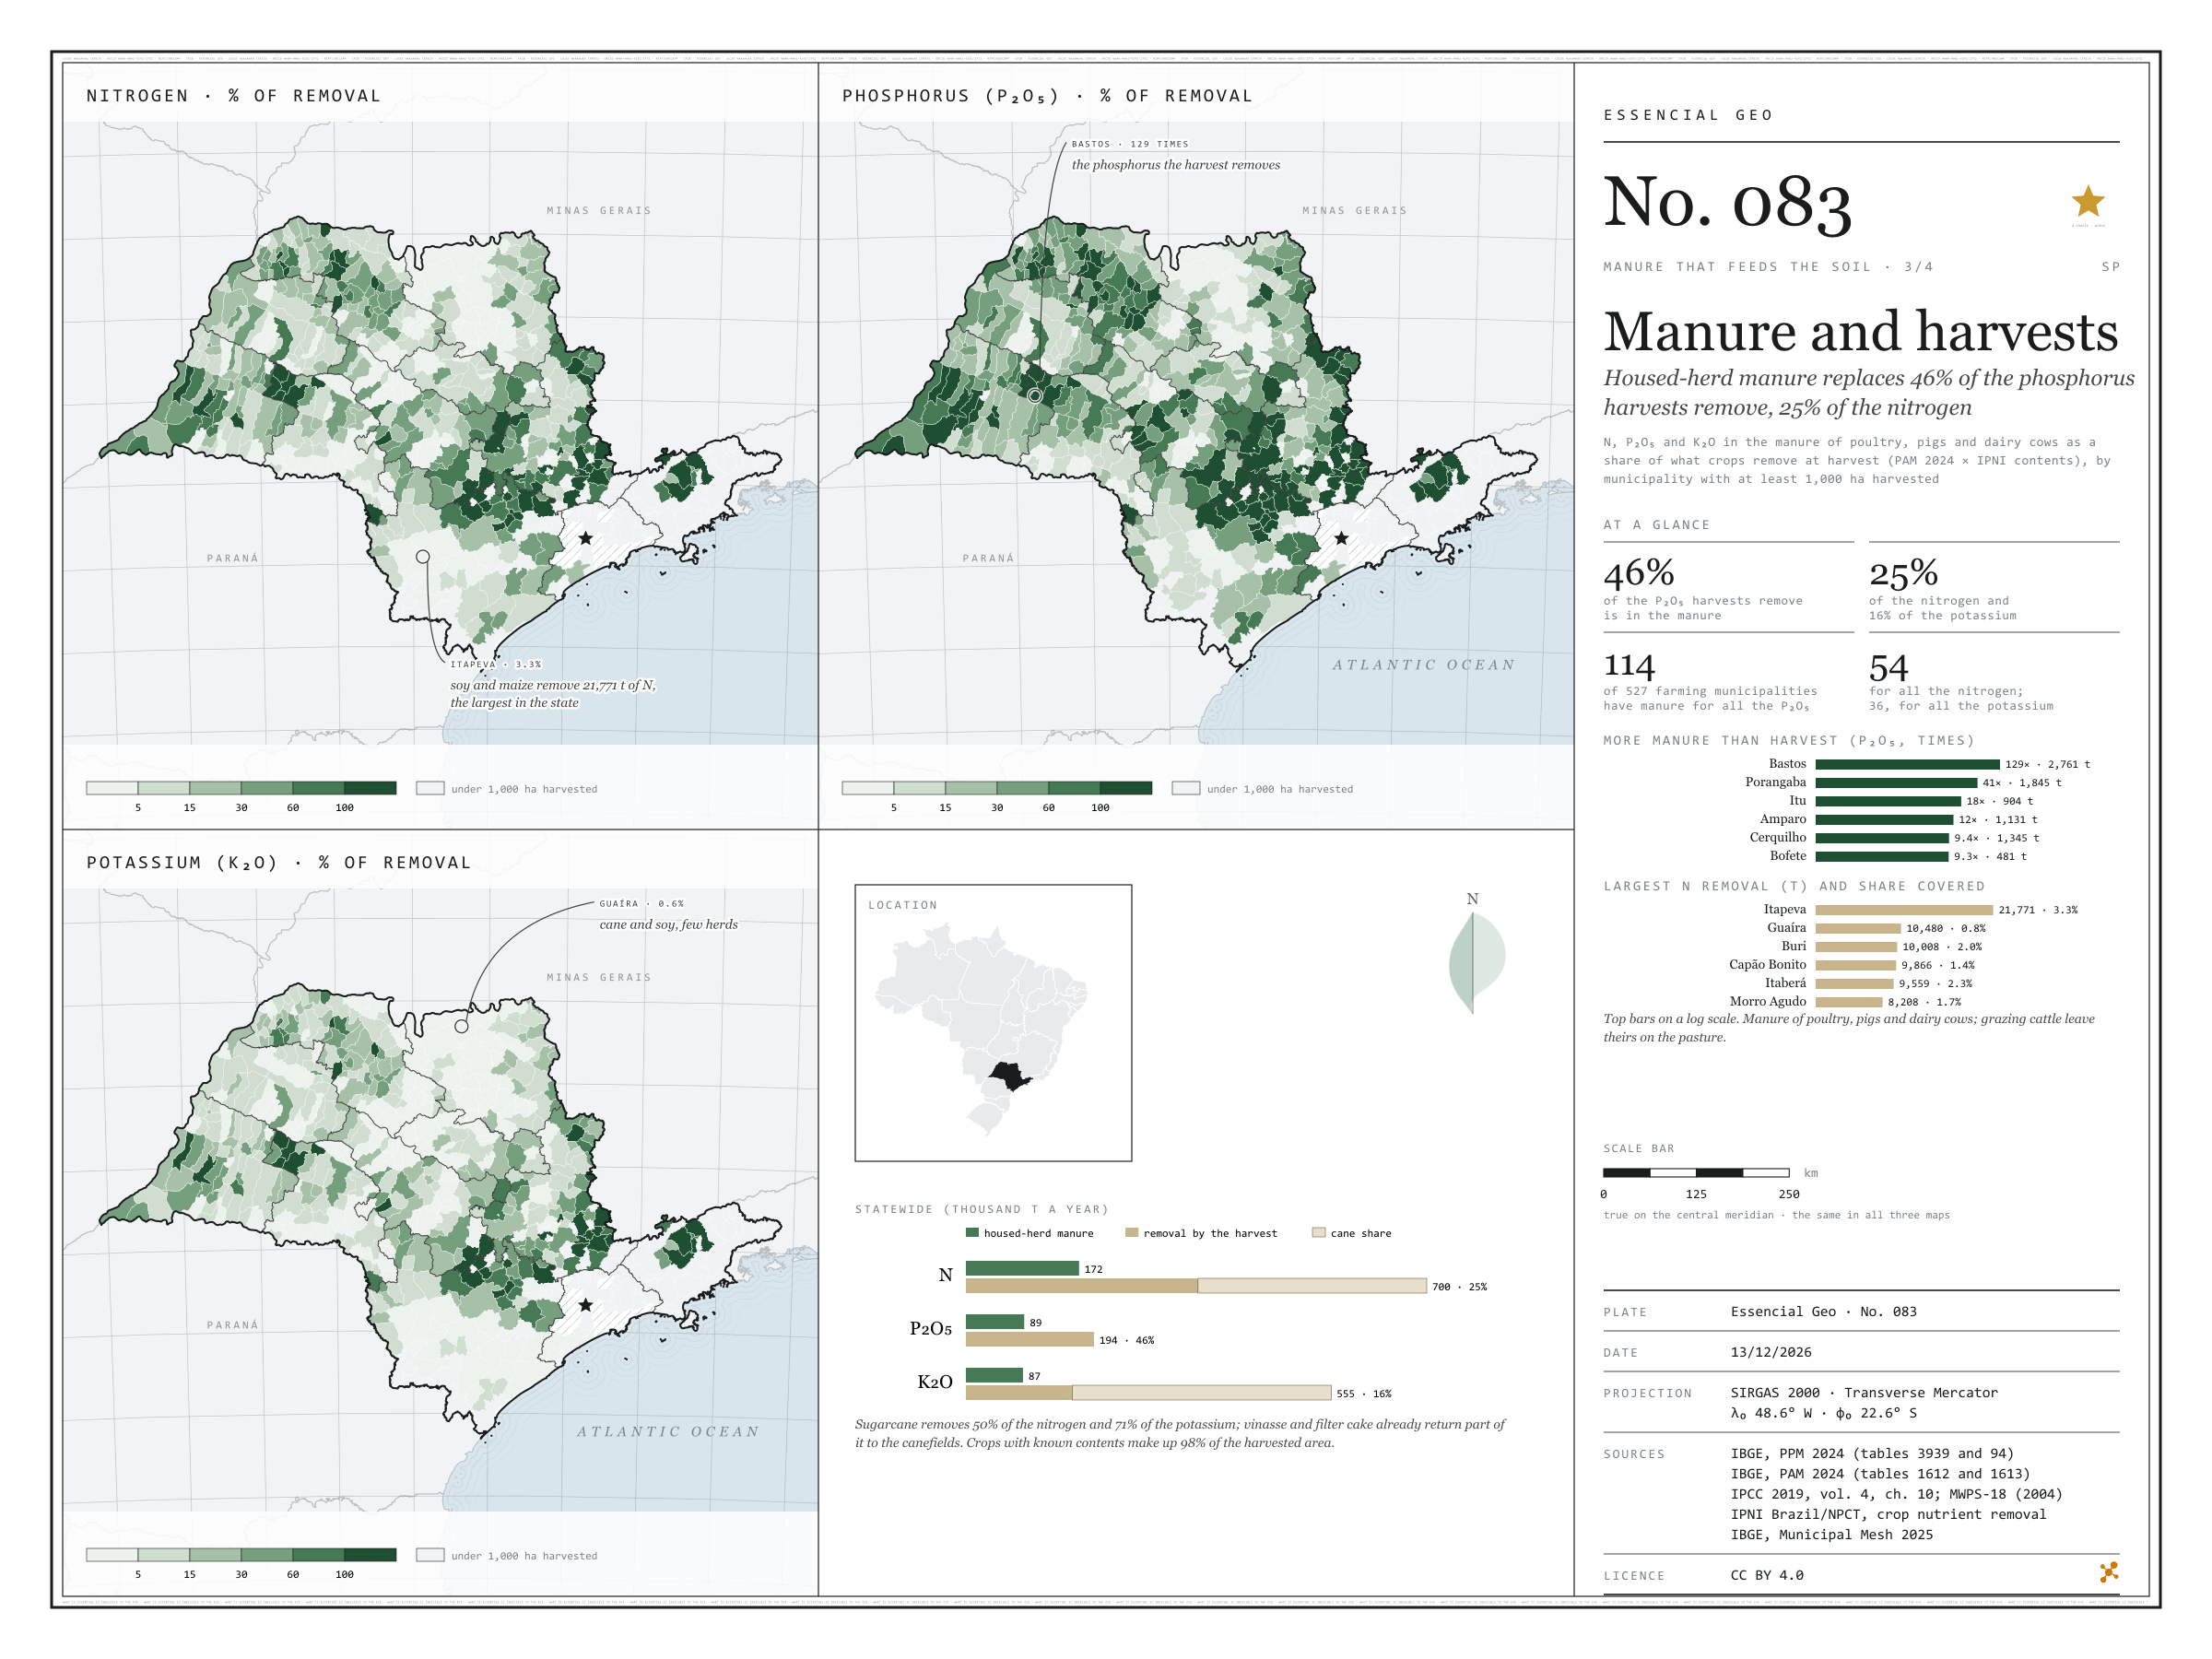
Housed-herd manure replaces 46% of the phosphorus harvests remove, 25% of the nitrogen
Fig. 083São Paulo State (SP)EPSG:4674Source: IBGE, IPNI Brazil/NPCT, IPCC, MidWest Plan Service
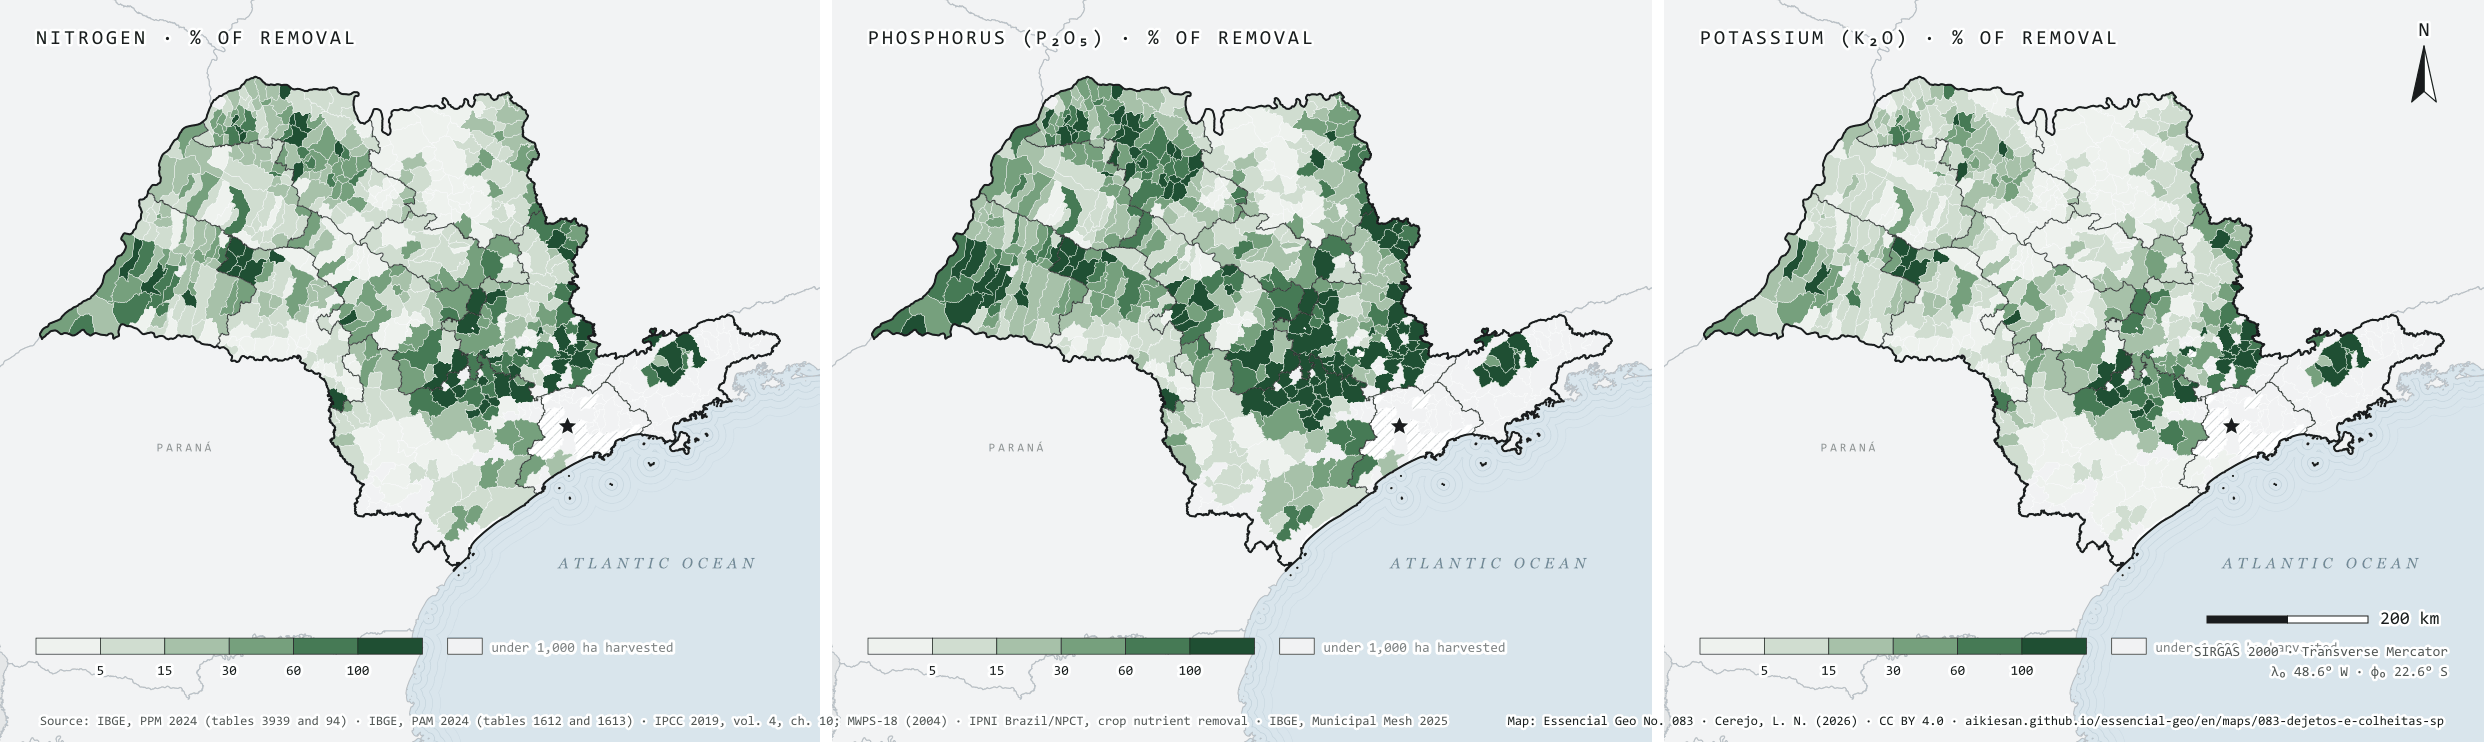
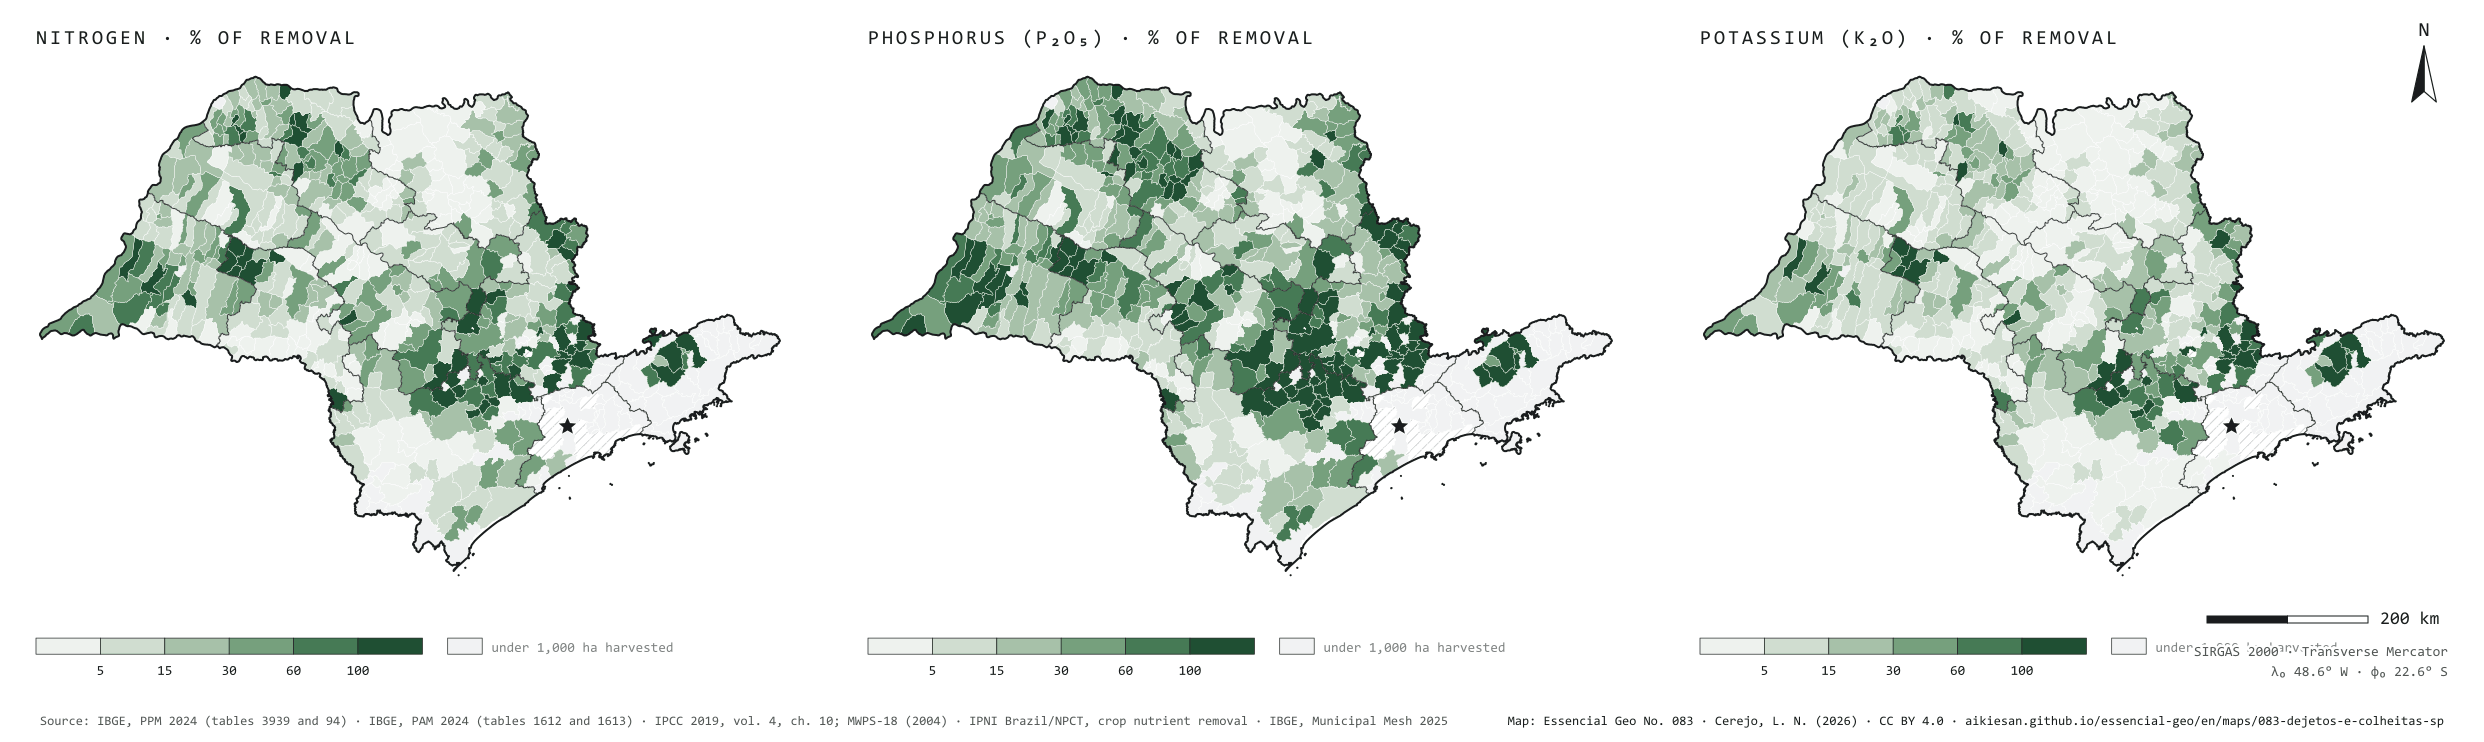
São Paulo’s harvests take from the soil, every year, about 700,000 tonnes of nitrogen, 194,000 of P₂O₅ and 555,000 of K₂O, by 2024 PAM production and IPNI contents. The manure of poultry, pigs and dairy cows, the part that can be collected, holds 172,000, 89,000 and 87,000: it replaces 46% of the phosphorus, 25% of the nitrogen and 16% of the potassium. Sugarcane weighs on the account: it removes half the nitrogen and 71% of the potassium, and part of that returns to the canefields with vinasse and filter cake. Of the 527 municipalities with at least 1,000 hectares harvested, 114 have manure to replace all the phosphorus, 54 all the nitrogen and 36 all the potassium. In the grain regions the account does not balance: Itapeva removes 21,800 tonnes of N at harvest, and local manure covers 3.3%. Third plate of the collection “Manure that feeds the soil”.
Technical record · downloads · citation
At a glance
Share of crop removal that housed-herd manure replaces, statewide (%)
phosphorus (P₂O₅)46
nitrogen (N)25
potassium (K₂O)16
Crop removal and housed-herd manure (thousand t a year)
N removed700
N in manure172
P₂O₅ removed194
P₂O₅ in manure89
K₂O removed555
K₂O in manure87
Farming municipalities with manure for all the harvest’s phosphorus
114of 527
with at least 1,000 hectares harvested
Layers
municipiospolygon645 municipalities: housed-herd manure, crop removal of N, P₂O₅ and K₂O and coverage (same GPKG as plate 081)
regioes_intermediariaspolygon11 intermediate geographic regions
N, P₂O₅ and K₂O in poultry, pig and dairy manure (2024 PPM × IPCC 2019 and MWPS-18) over the N, P₂O₅ and K₂O removed by the municipality’s temporary and permanent crops (2024 PAM production × IPNI Brazil contents in the harvested product), in six classes, in municipalities with at least 1,000 hectares harvested.
The map without a frame, with legend, scale, reference system and credit written on it: ready for papers, lectures and slides. In two versions: with the basemap (neighbours and sea) or only the mapped area, on white.
CEREJO, Lucas Nakamura. Dejetos e colheitas: o esterco confinado repõe 46% do fósforo que as colheitas levam, 25% do nitrogênio. Versão 1.0.0. [S. l.]: Essencial, 2026. Conjunto de dados. Disponível em: https://aikiesan.github.io/essencial-geo/en/maps/083-dejetos-e-colheitas-sp/. Acesso em: 10 nov. 2026.
Cerejo, L. N. (2026). Dejetos e colheitas: o esterco confinado repõe 46% do fósforo que as colheitas levam, 25% do nitrogênio [Manure and harvests: Housed-herd manure replaces 46% of the phosphorus harvests remove, 25% of the nitrogen] (Version 1.0.0) [Data set]. Essencial. https://aikiesan.github.io/essencial-geo/en/maps/083-dejetos-e-colheitas-sp/
@dataset{cerejo2026_dejetos_e_colheitas_sp,
  author    = {Cerejo, Lucas Nakamura},
  title     = {Dejetos e colheitas: O esterco confinado repõe 46% do fósforo que as colheitas levam, 25% do nitrogênio},
  year      = {2026},
  publisher = {Essencial},
  version   = {1.0.0},
  url       = {https://aikiesan.github.io/essencial-geo/en/maps/083-dejetos-e-colheitas-sp/},
  language  = {portuguese},
  note      = {English title: Manure and harvests: Housed-herd manure replaces 46% of the phosphorus harvests remove, 25% of the nitrogen. Licence CC BY 4.0}
}
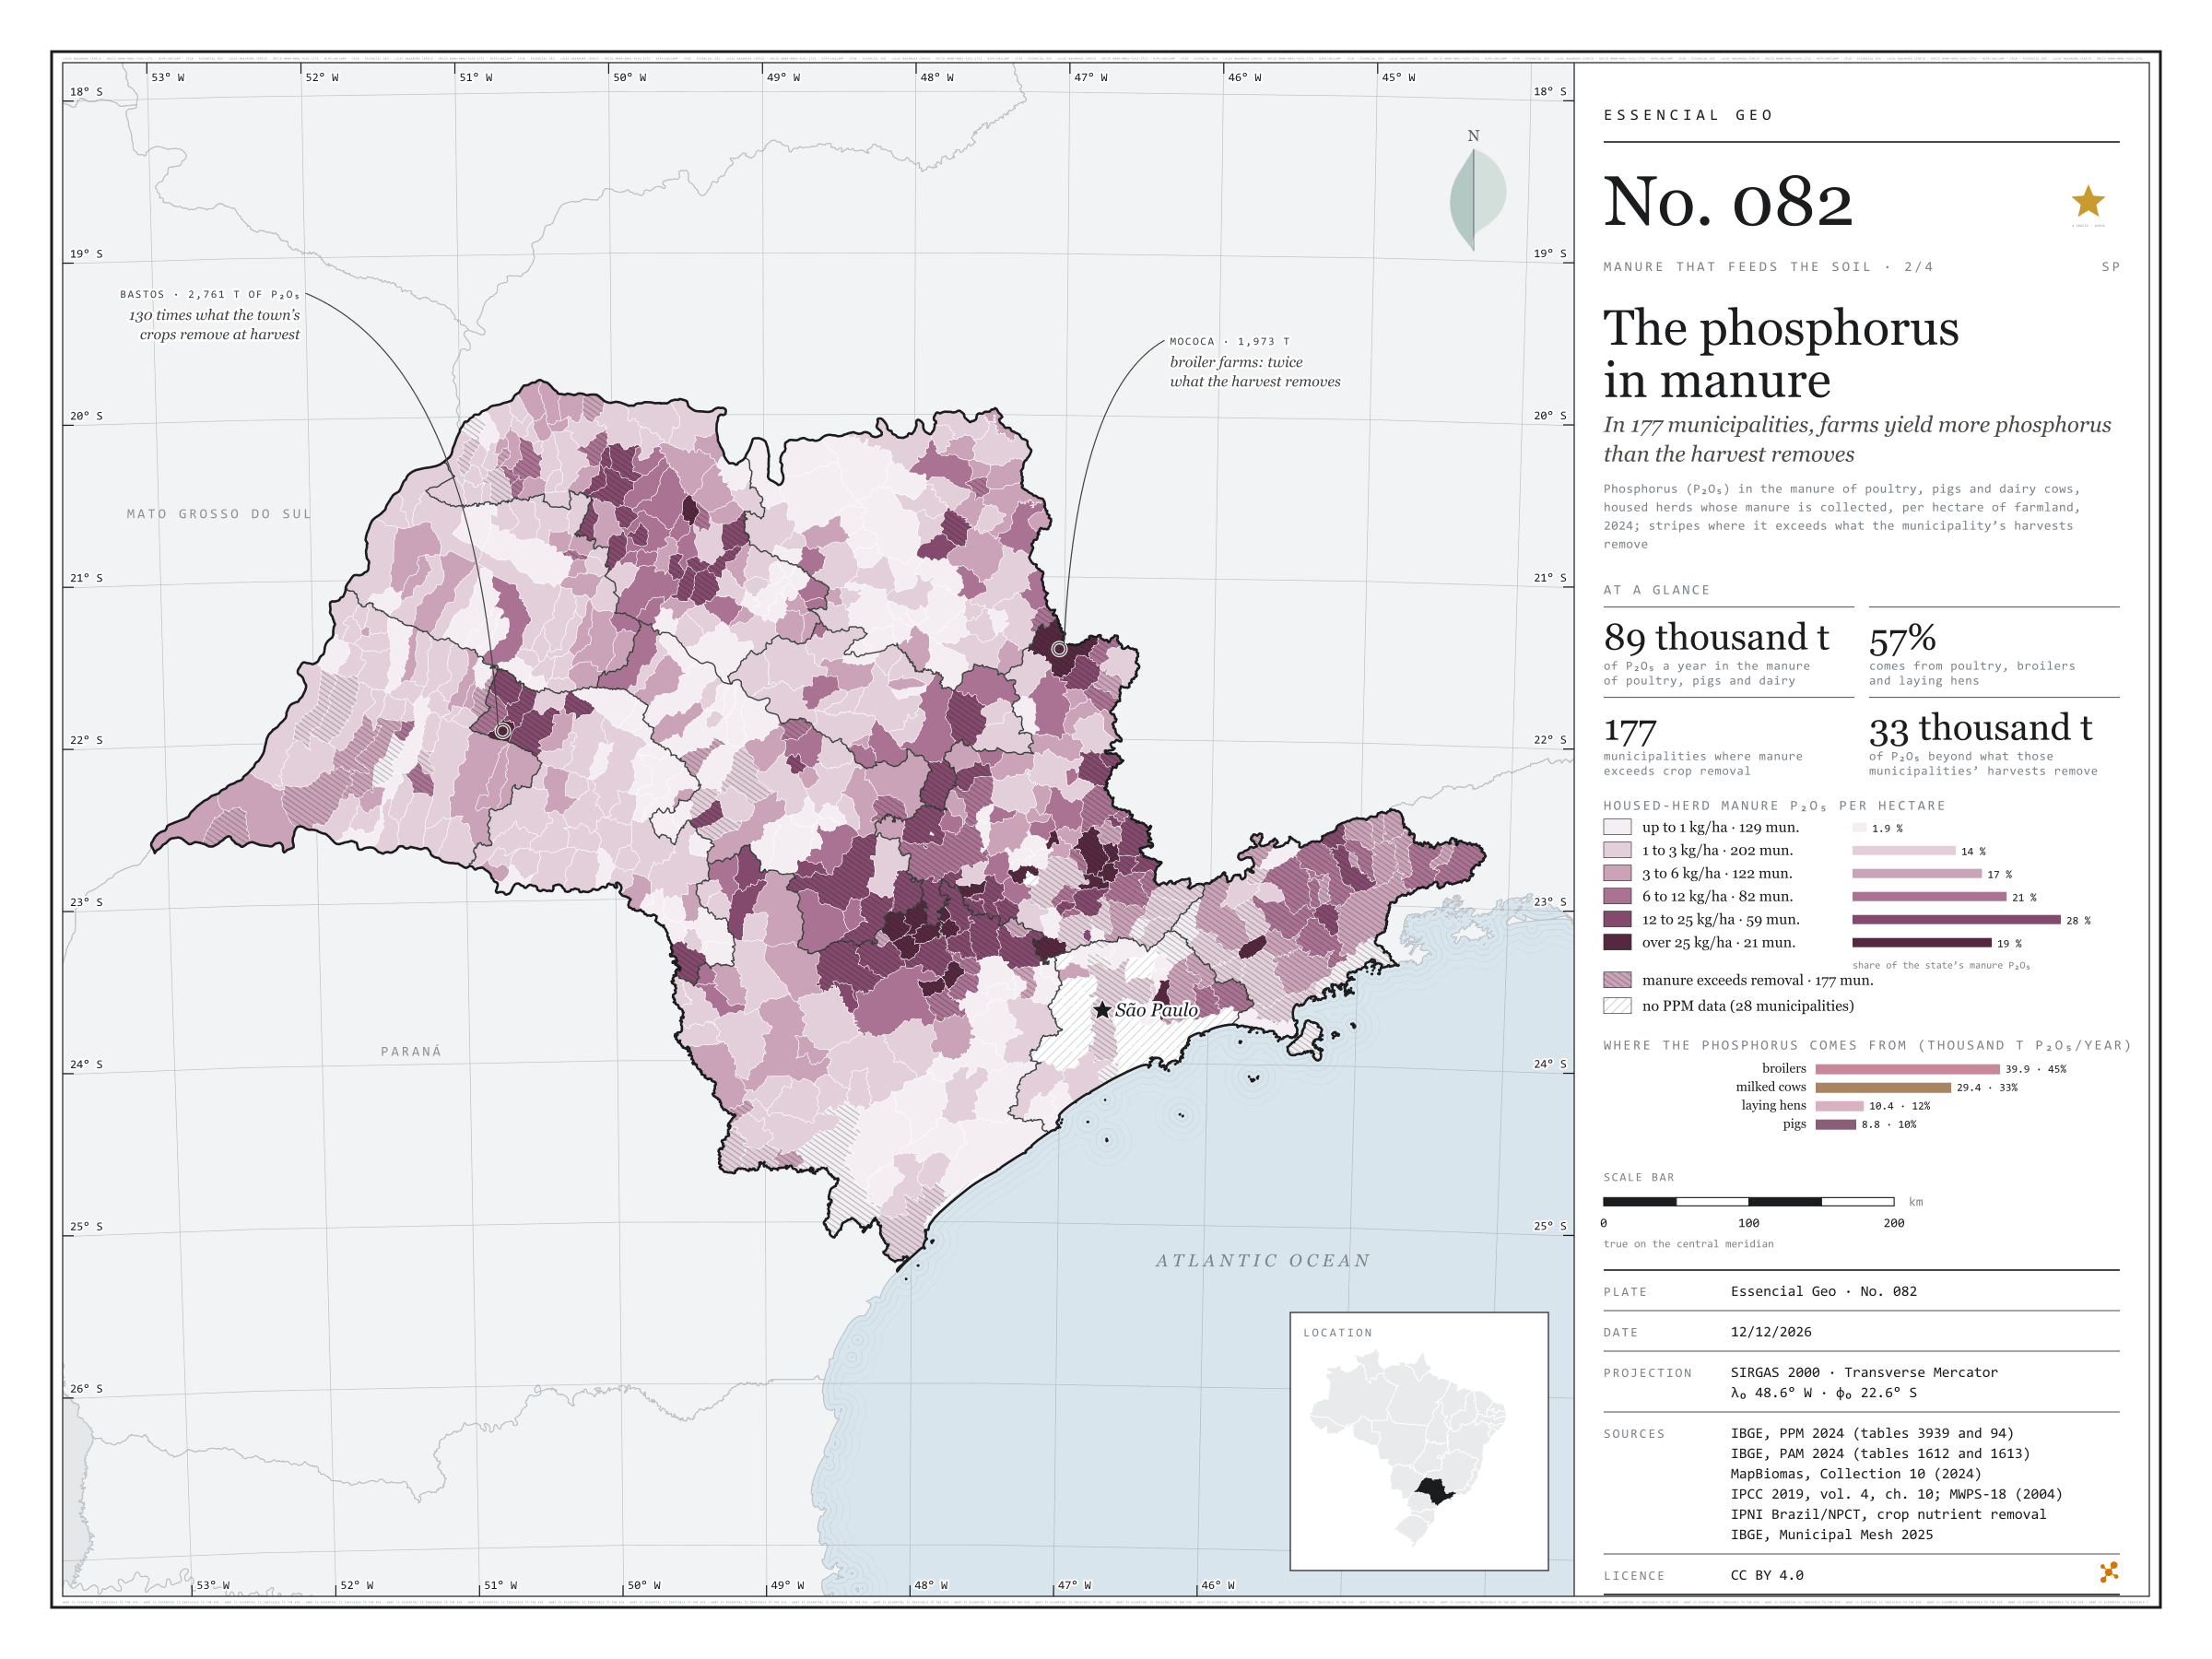
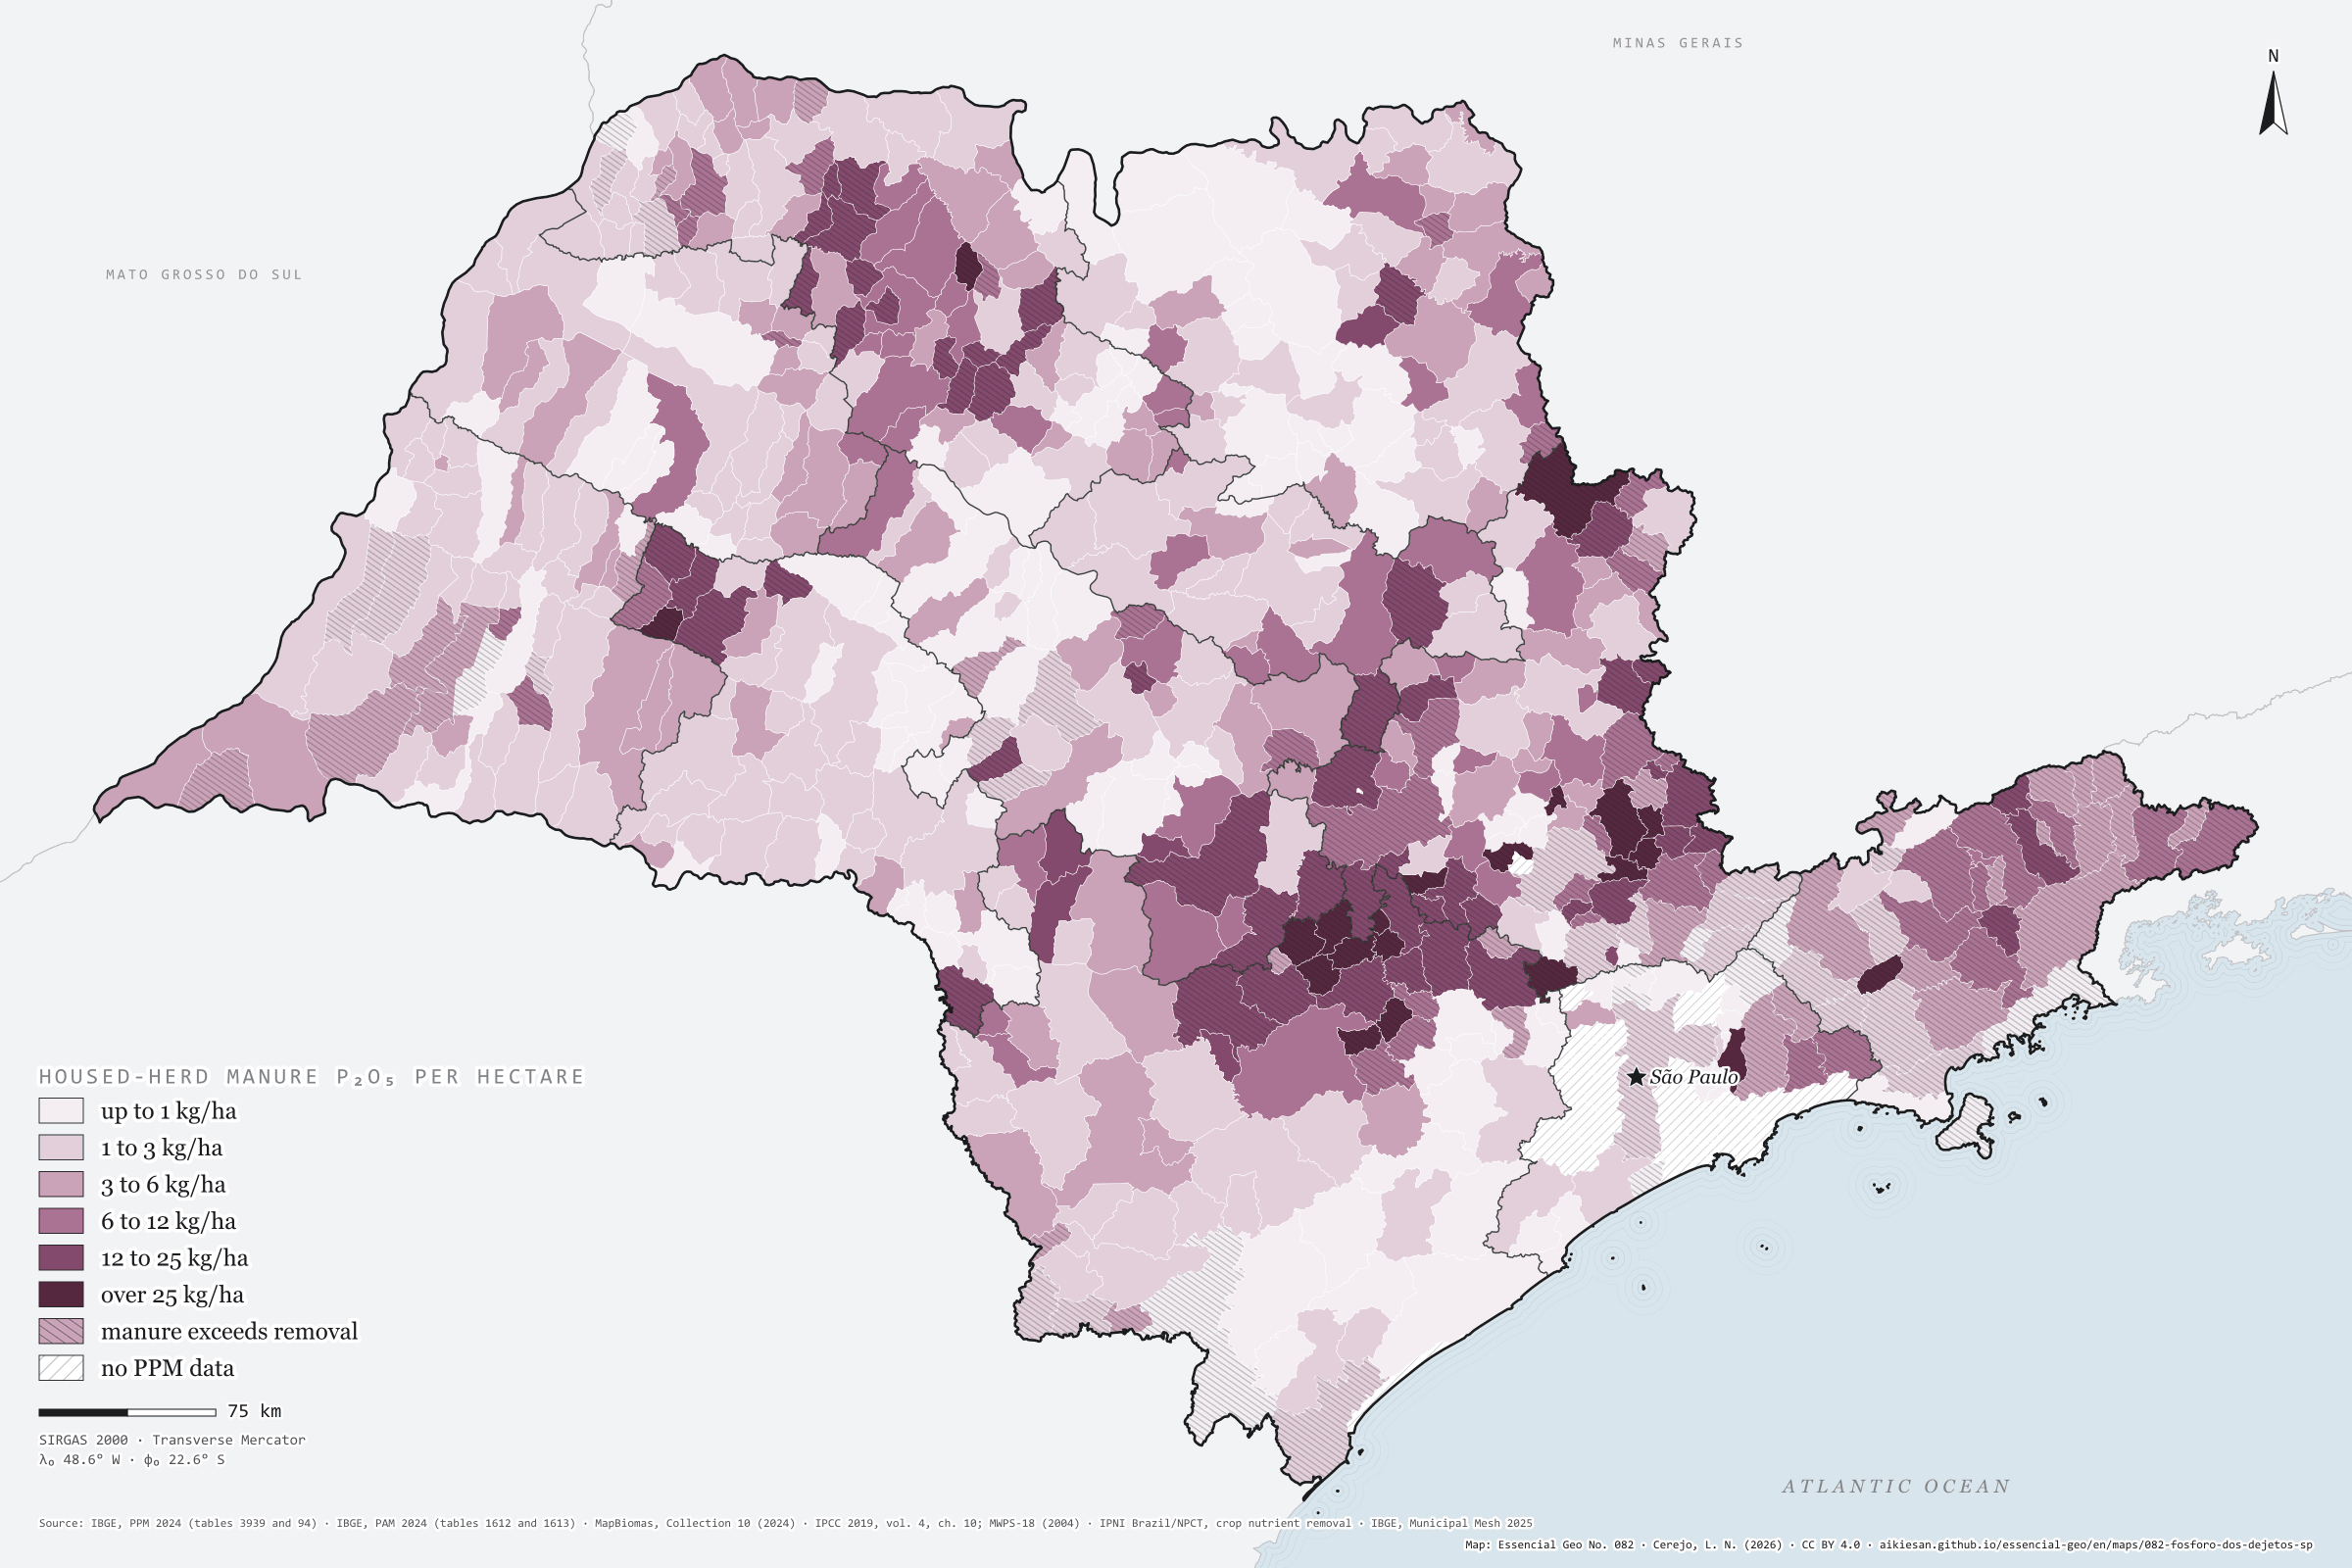
In 177 municipalities, farms yield more phosphorus than the harvest removes
Fig. 082São Paulo State (SP)EPSG:4674Source: IBGE, MapBiomas, IPCC, MidWest Plan Service, IPNI Brazil/NPCT
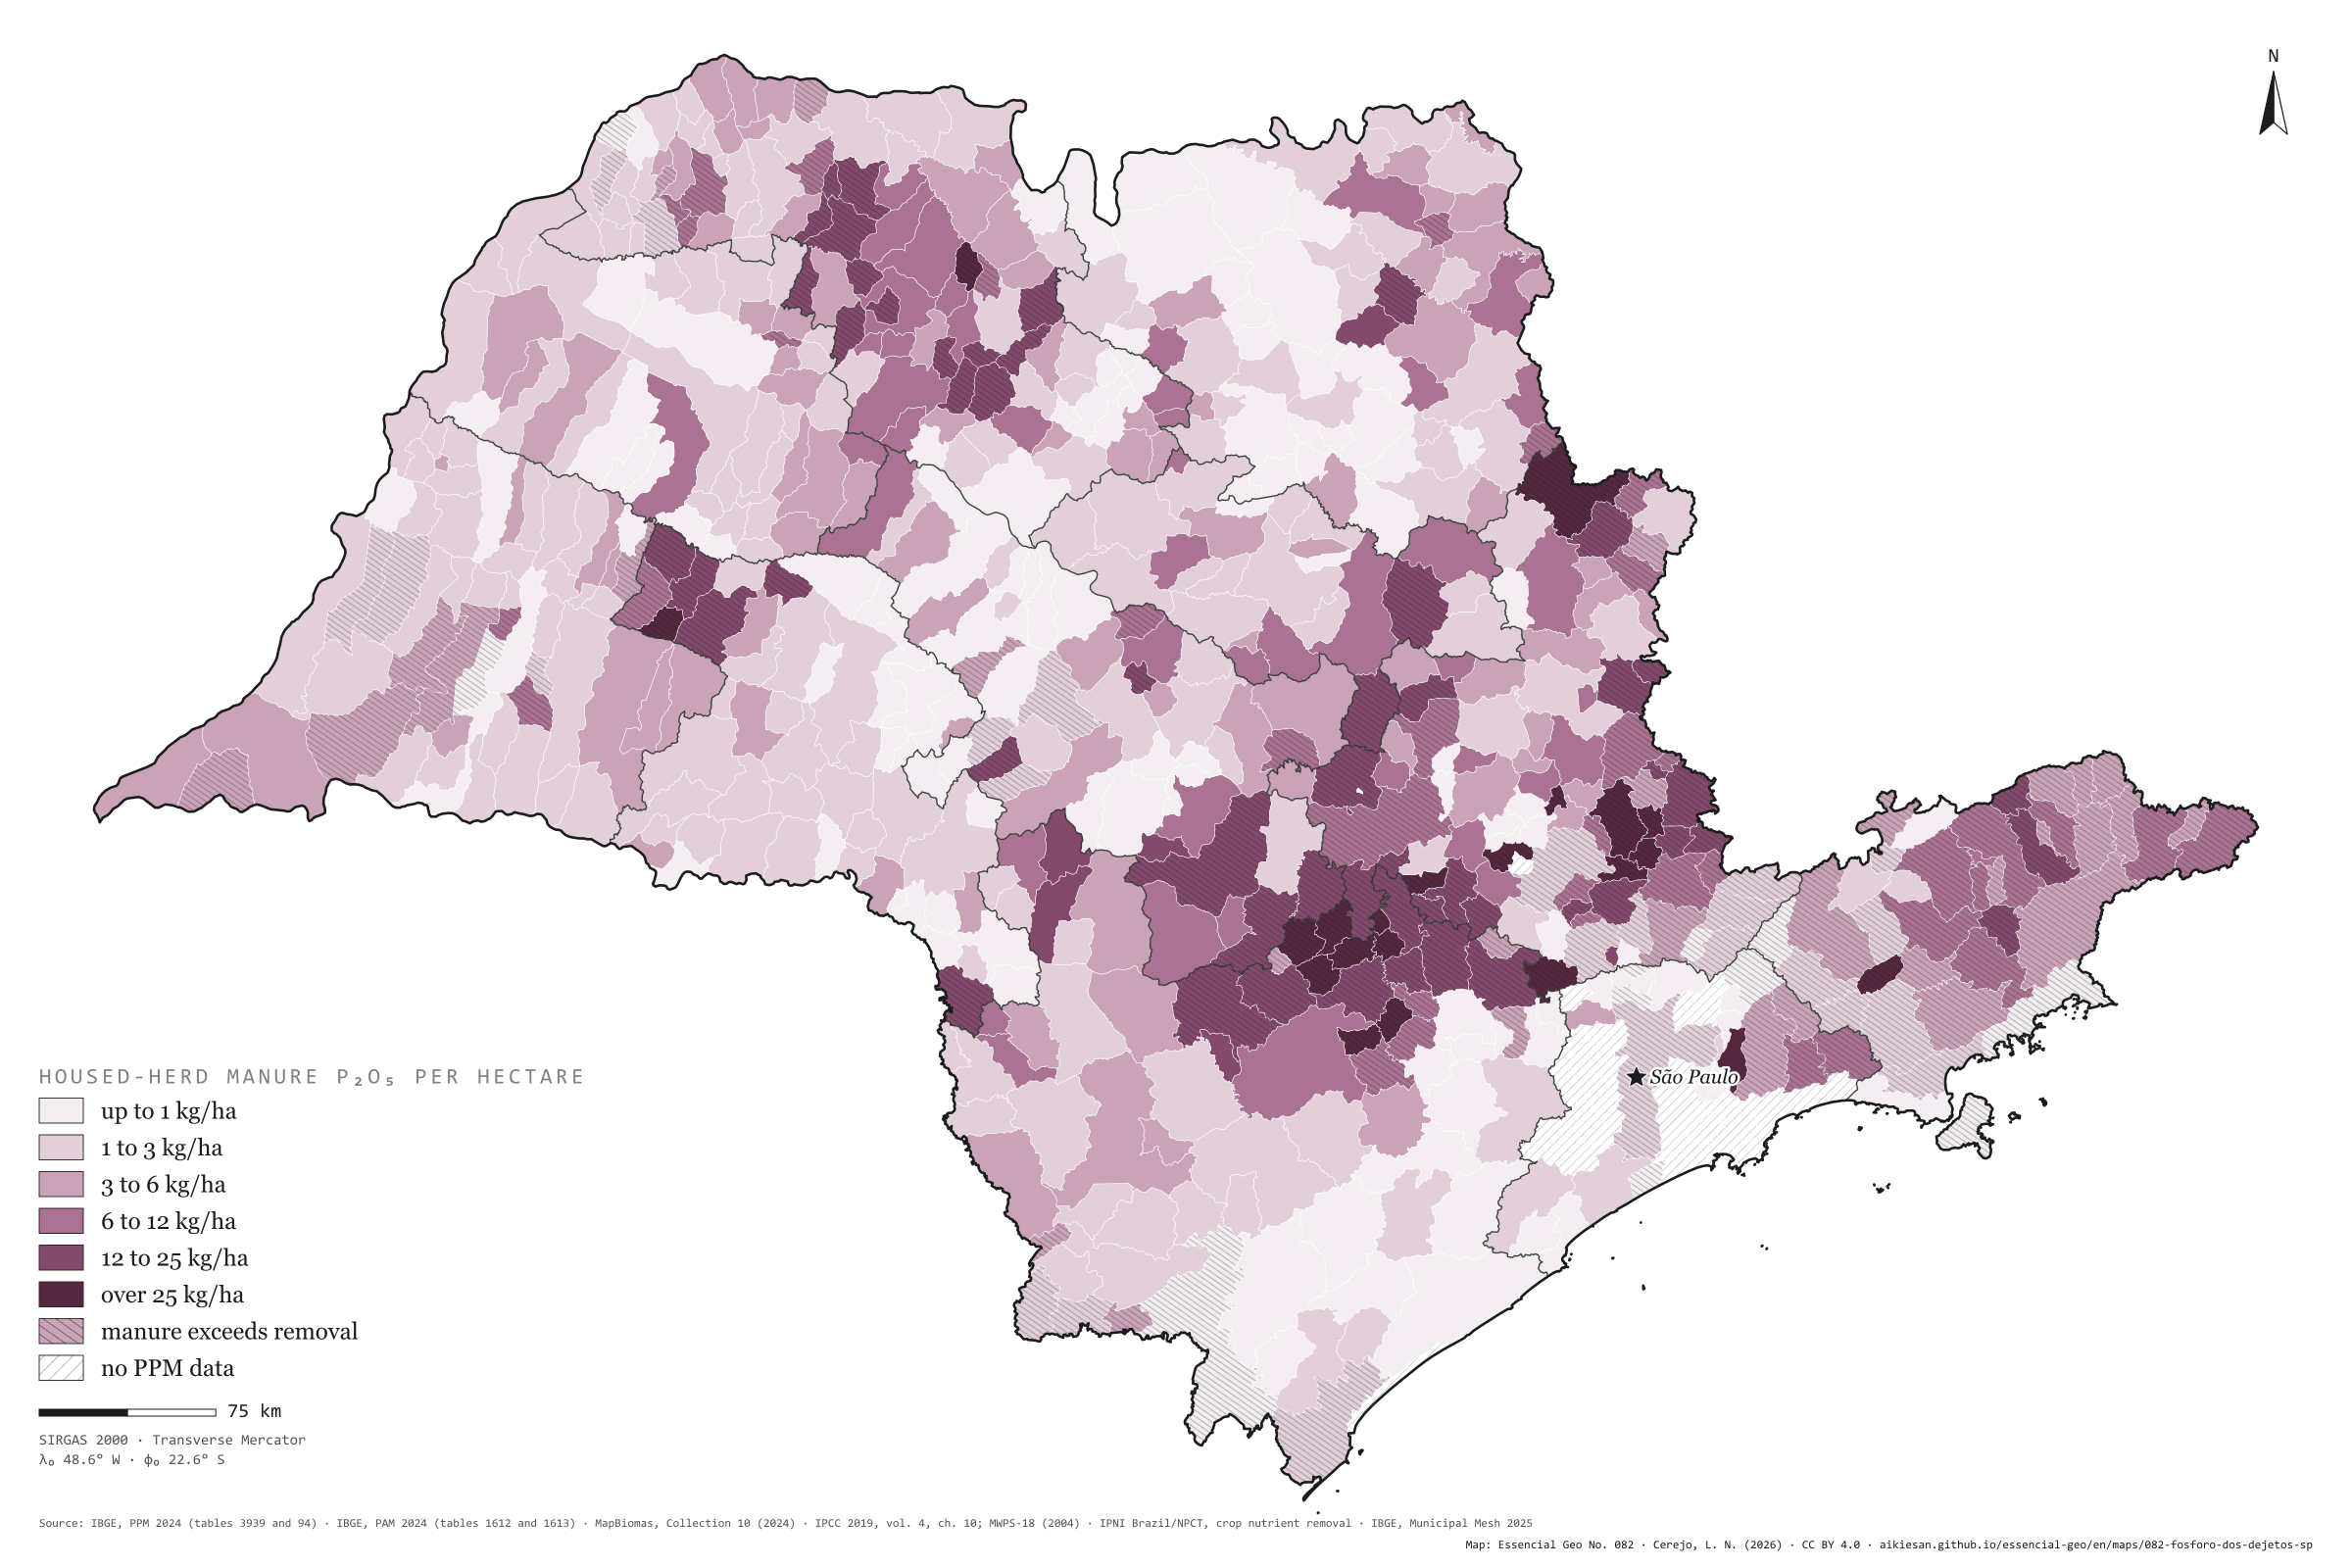
Poultry, pigs and dairy cows live in sheds and byres, and their manure can be collected: about 88,500 tonnes of P₂O₅ a year in São Paulo, 5.2 kg per farmland hectare. Broilers give 45%, milked cows 33%, laying hens 12% and pigs 10%. Phosphorus builds up where farms cluster: Bastos has 188 kg of P₂O₅ per hectare, Cerquilho 131, Jumirim 98, Cabreúva and Porangaba 81. In 177 municipalities, manure phosphorus exceeds what the municipality’s own harvests remove; together they hold 51,000 tonnes of P₂O₅ in manure, 33,000 more than their crops take. In Bastos, manure holds 130 times the phosphorus of the harvest; in Mococa, with 6.75 million broilers, twice as much. Second plate of the collection “Manure that feeds the soil”.
Technical record · downloads · citation
At a glance
Housed-herd manure P₂O₅ by the municipality’s kg per hectare class (t P₂O₅ a year)
up to 1 kg/ha1.9%
1 to 3 kg/ha13.8%
3 to 6 kg/ha17.3%
6 to 12 kg/ha20.6%
12 to 25 kg/ha27.8%
over 25 kg/ha18.6%
Manure P₂O₅ by herd (thousand t P₂O₅ a year)
broilers40
milked cows29
laying hens10
pigs8.8
Municipalities where manure phosphorus exceeds crop removal
177municipalities
33,000 t of P₂O₅ beyond what the harvests remove
Layers
municipiospolygon645 municipalities: herds, housed-herd manure N, P₂O₅ and K₂O, P₂O₅ per hectare and crop removal (same GPKG as plate 081)
regioes_intermediariaspolygon11 intermediate geographic regions
Head counts of hens, broilers, pigs, sows and milked cows in the 2024 PPM times the P₂O₅ excreted per head per year (IPCC 2019 nitrogen times the MWPS-18 P₂O₅/N ratio), per hectare of 2024 MapBiomas farmland, in six classes; stripes where that P₂O₅ exceeds the municipality’s crop removal (2024 PAM × IPNI contents).
The map without a frame, with legend, scale, reference system and credit written on it: ready for papers, lectures and slides. In two versions: with the basemap (neighbours and sea) or only the mapped area, on white.
CEREJO, Lucas Nakamura. O fósforo dos dejetos: em 177 municípios, as granjas dão mais fósforo do que a colheita leva. Versão 1.0.0. [S. l.]: Essencial, 2026. Conjunto de dados. Disponível em: https://aikiesan.github.io/essencial-geo/en/maps/082-fosforo-dos-dejetos-sp/. Acesso em: 10 nov. 2026.
Cerejo, L. N. (2026). O fósforo dos dejetos: em 177 municípios, as granjas dão mais fósforo do que a colheita leva [The phosphorus in manure: In 177 municipalities, farms yield more phosphorus than the harvest removes] (Version 1.0.0) [Data set]. Essencial. https://aikiesan.github.io/essencial-geo/en/maps/082-fosforo-dos-dejetos-sp/
@dataset{cerejo2026_fosforo_dos_dejetos_sp,
  author    = {Cerejo, Lucas Nakamura},
  title     = {O fósforo dos dejetos: Em 177 municípios, as granjas dão mais fósforo do que a colheita leva},
  year      = {2026},
  publisher = {Essencial},
  version   = {1.0.0},
  url       = {https://aikiesan.github.io/essencial-geo/en/maps/082-fosforo-dos-dejetos-sp/},
  language  = {portuguese},
  note      = {English title: The phosphorus in manure: In 177 municipalities, farms yield more phosphorus than the harvest removes. Licence CC BY 4.0}
}
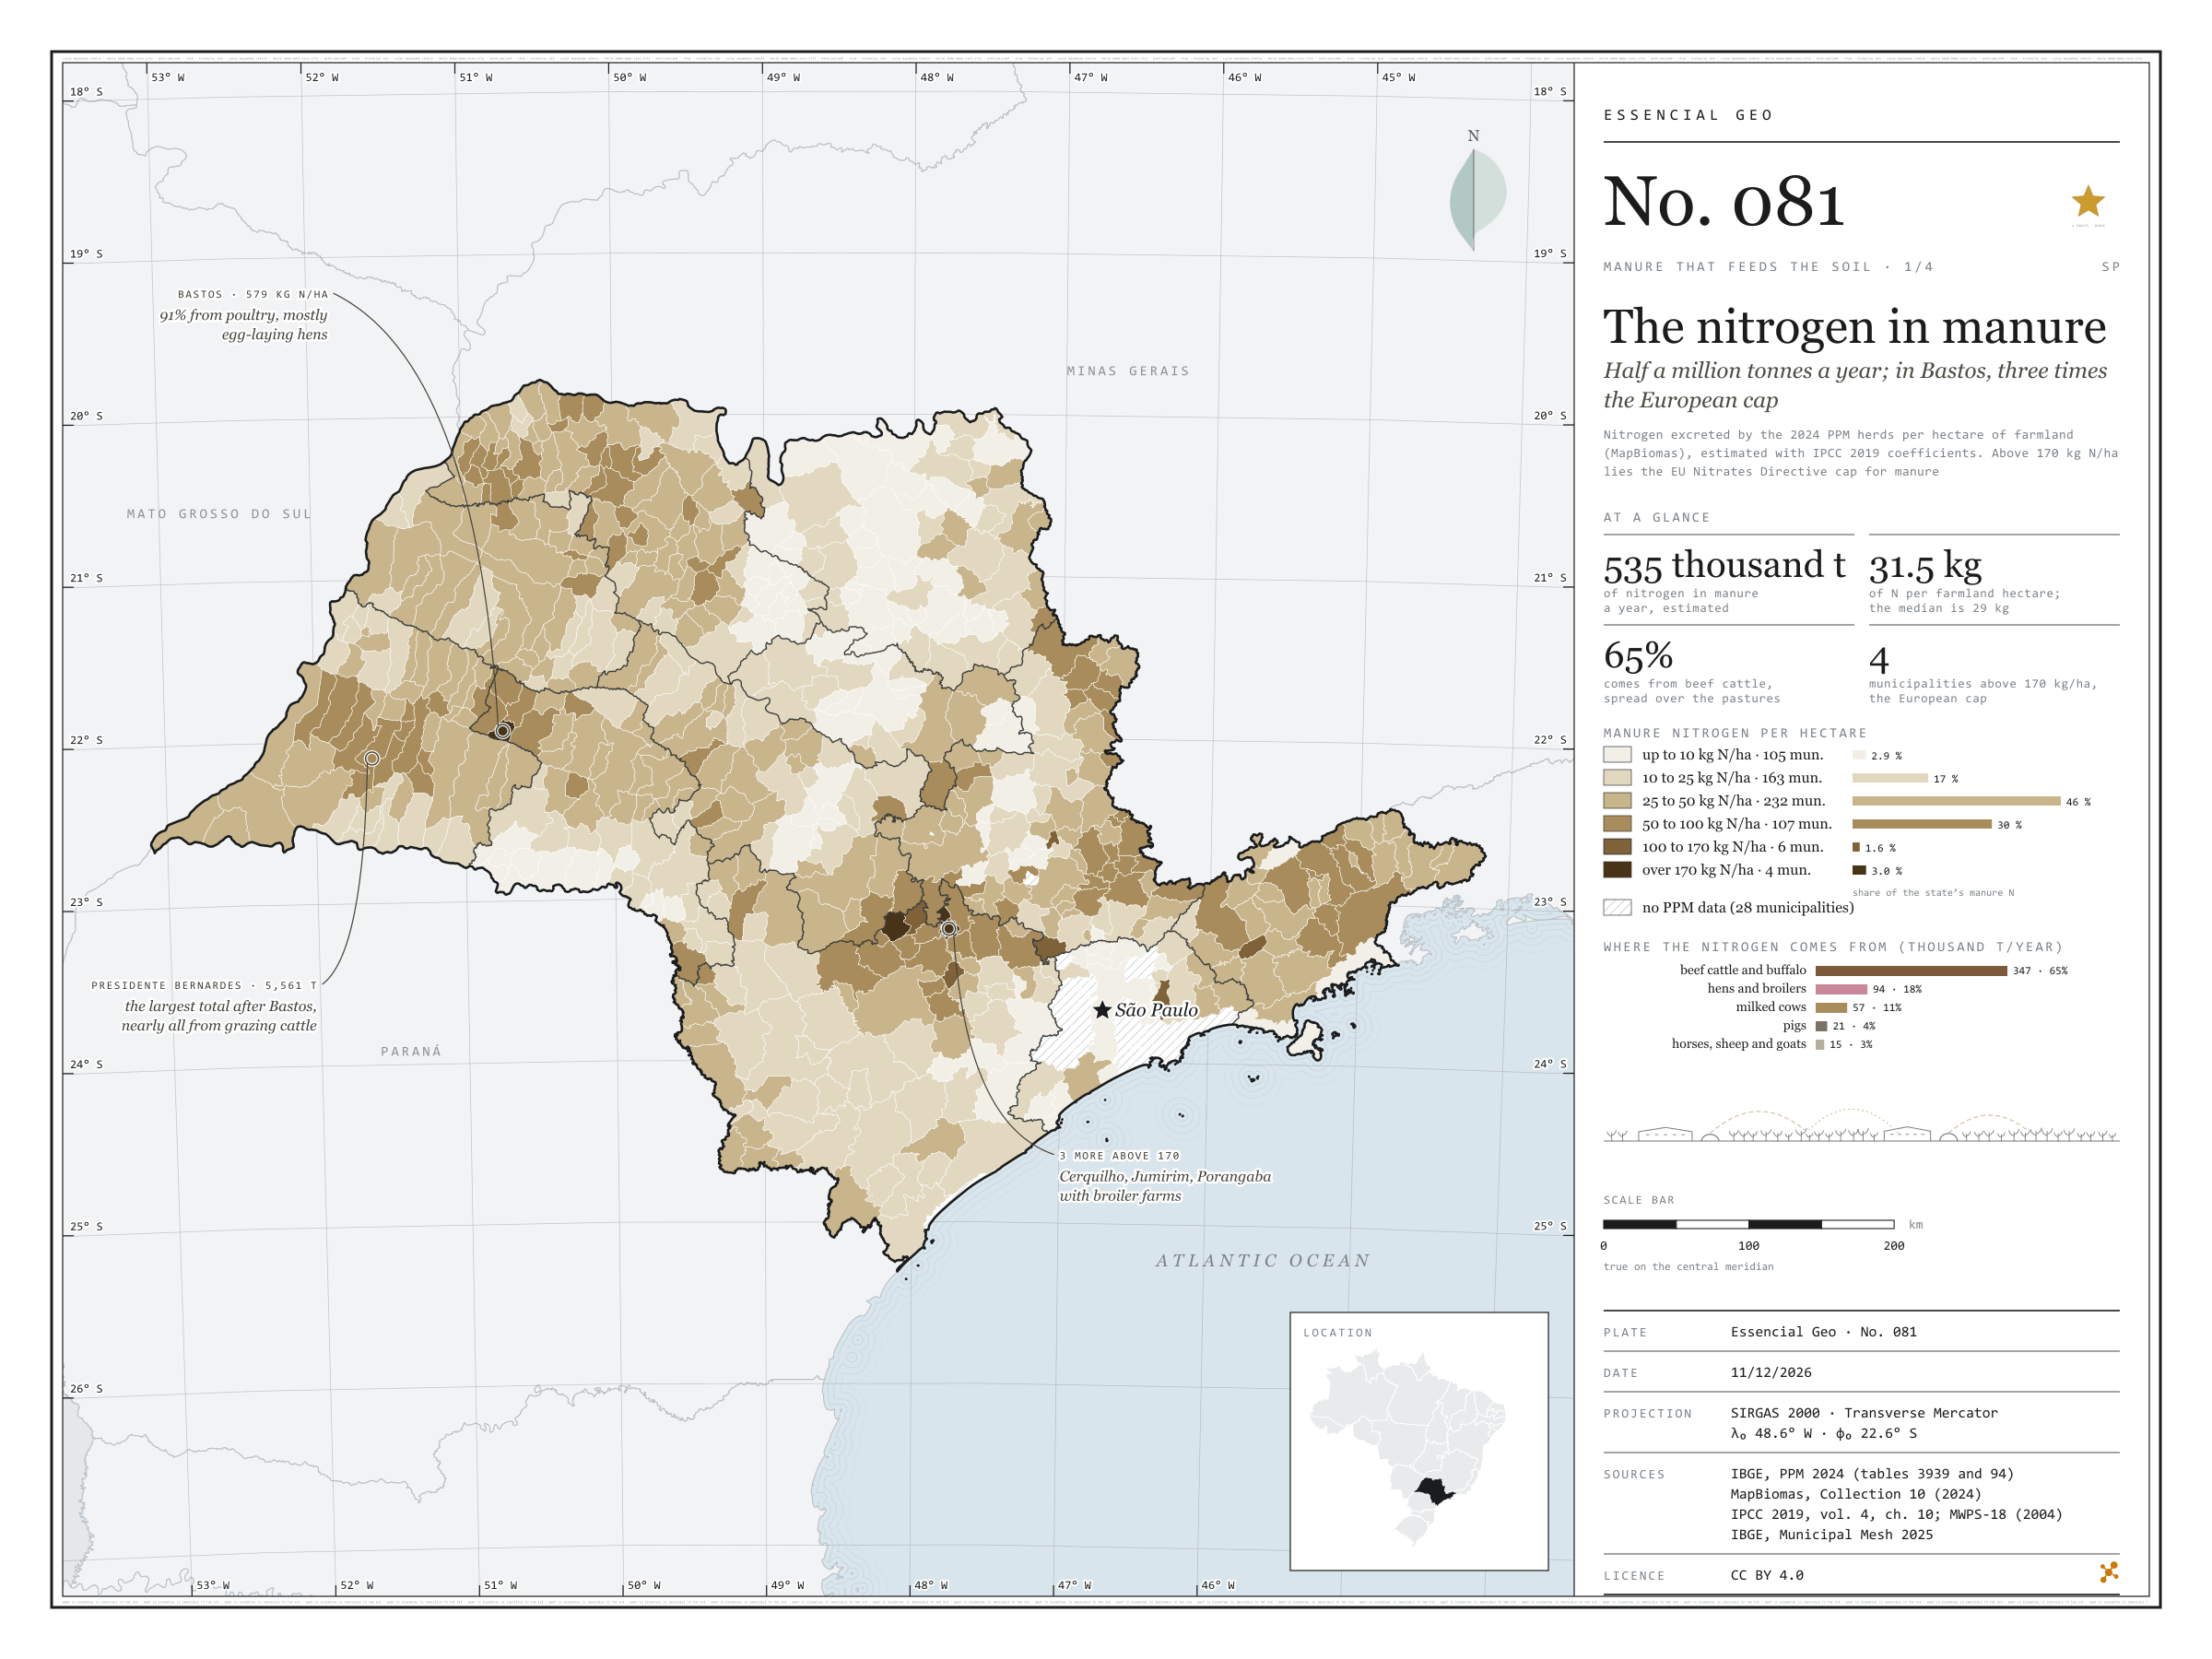
Half a million tonnes a year; in Bastos, three times the European cap
Fig. 081São Paulo State (SP)EPSG:4674Source: IBGE, MapBiomas, IPCC, MidWest Plan Service
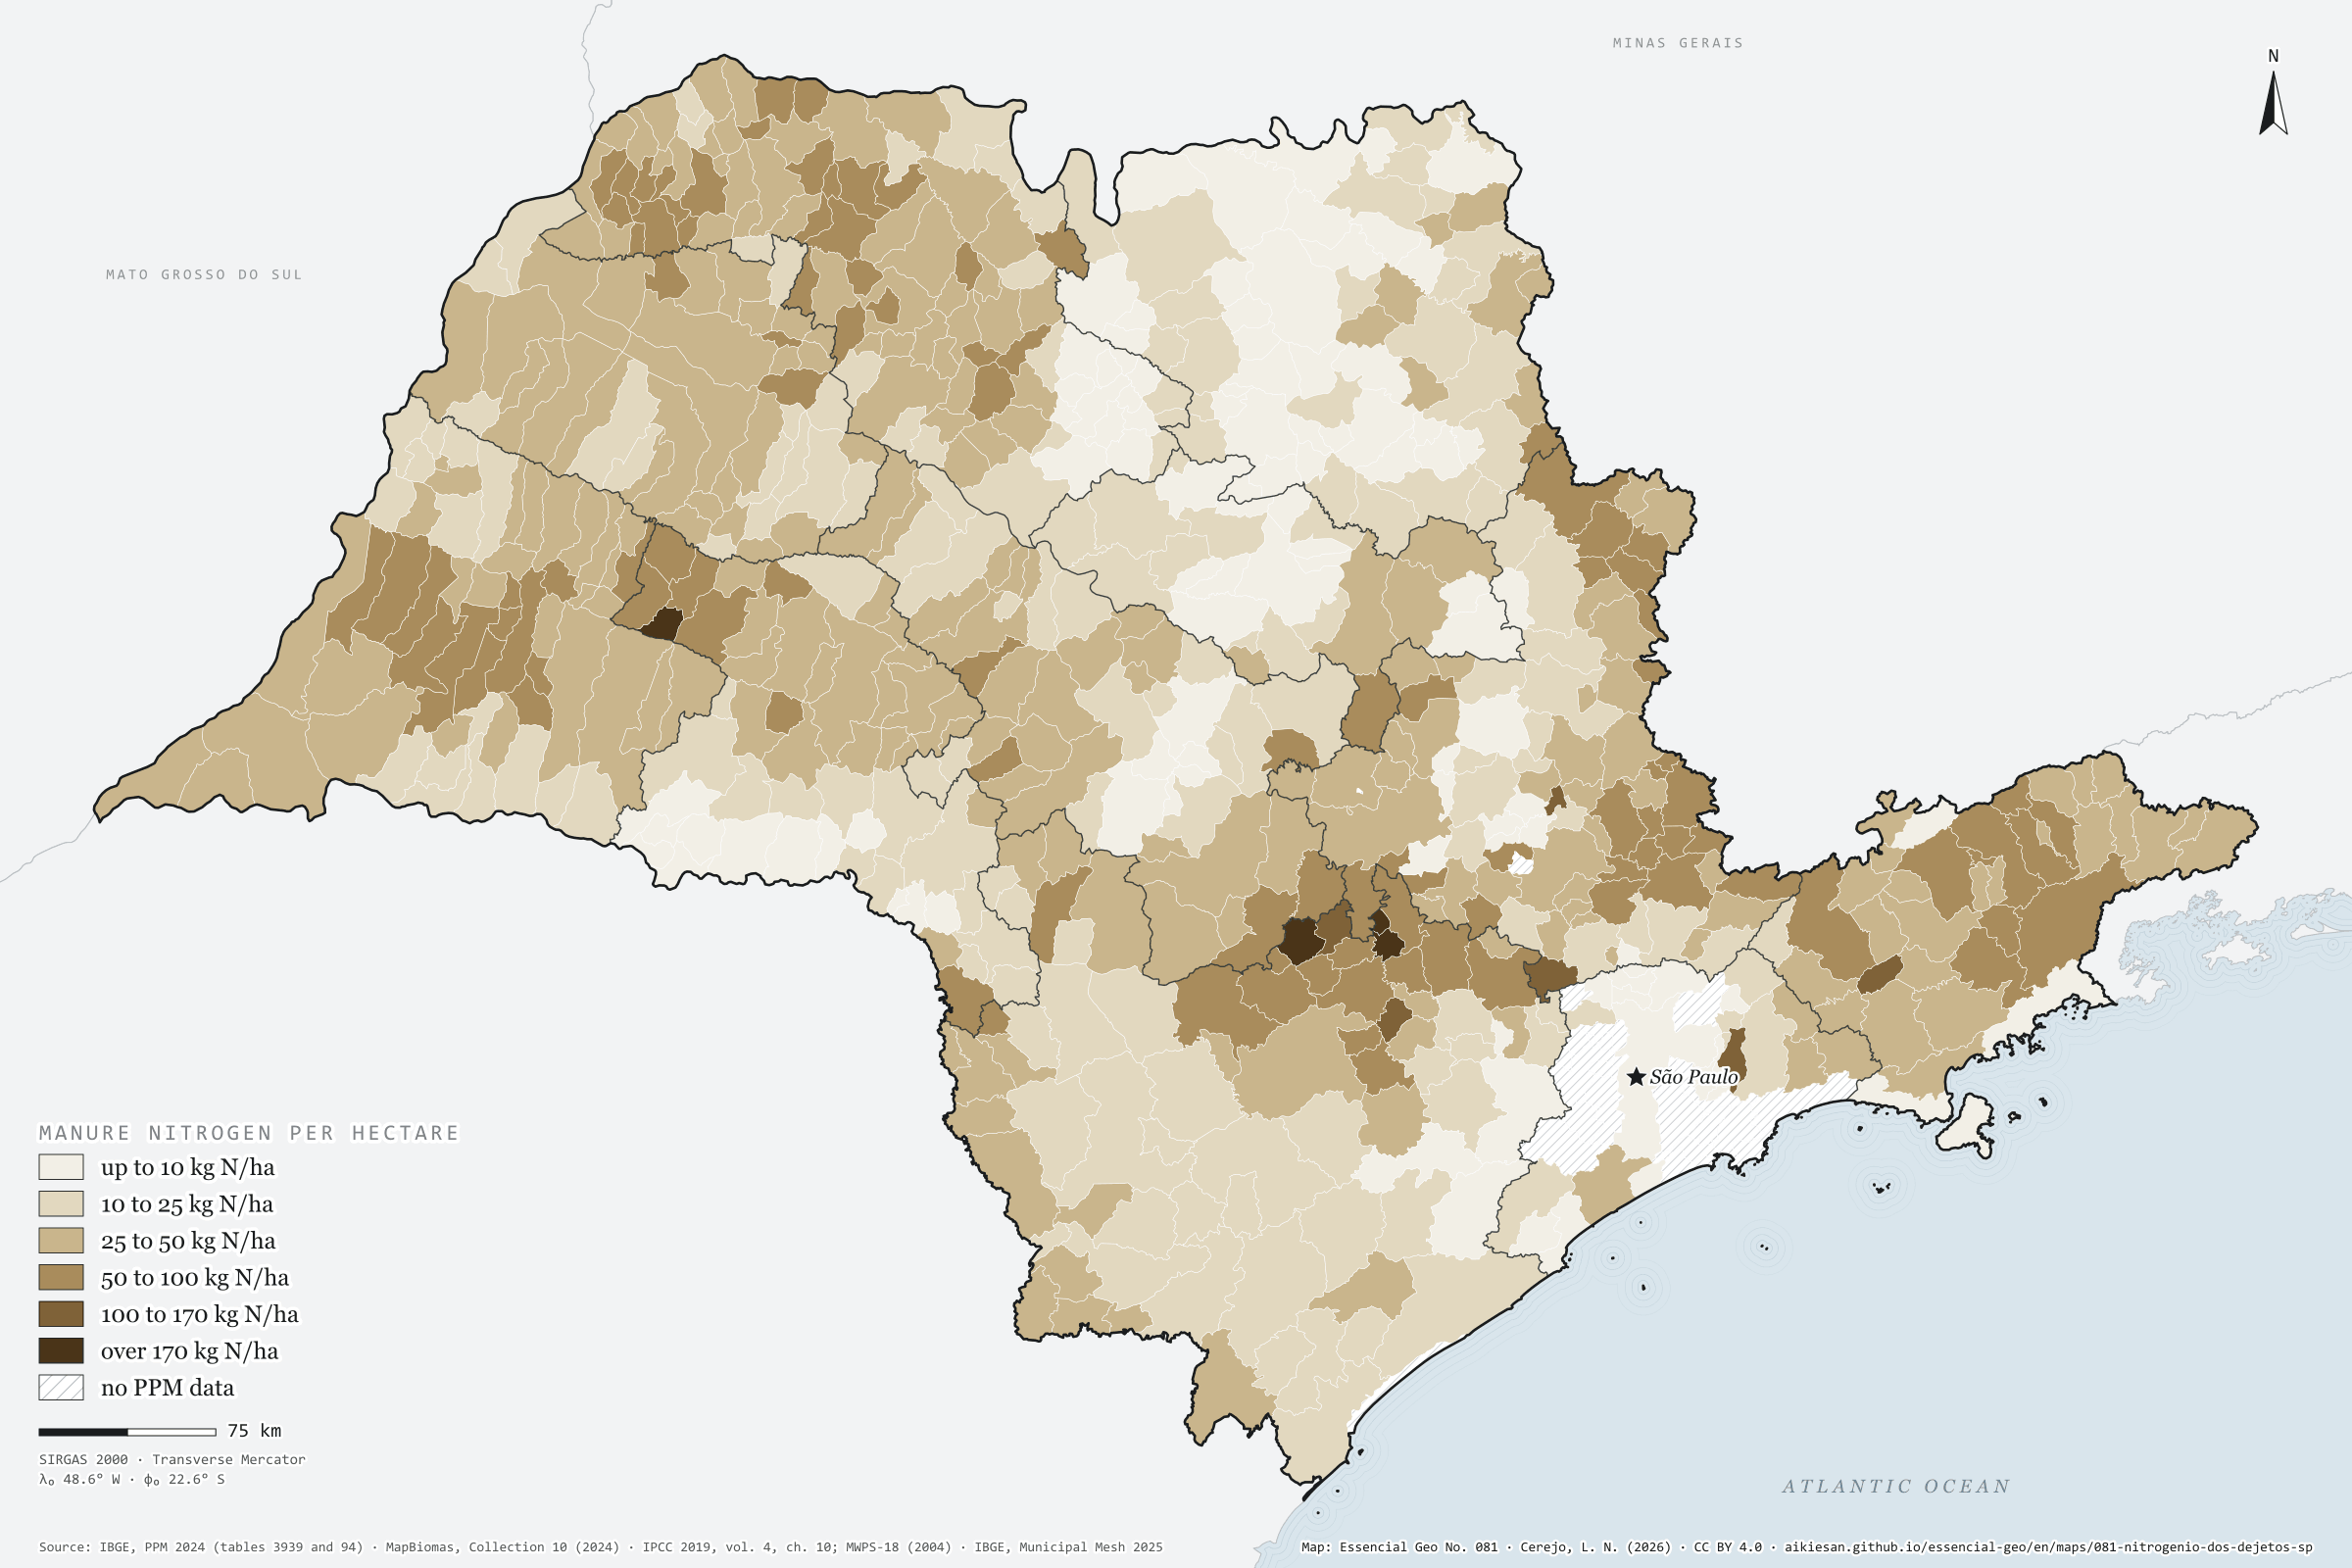
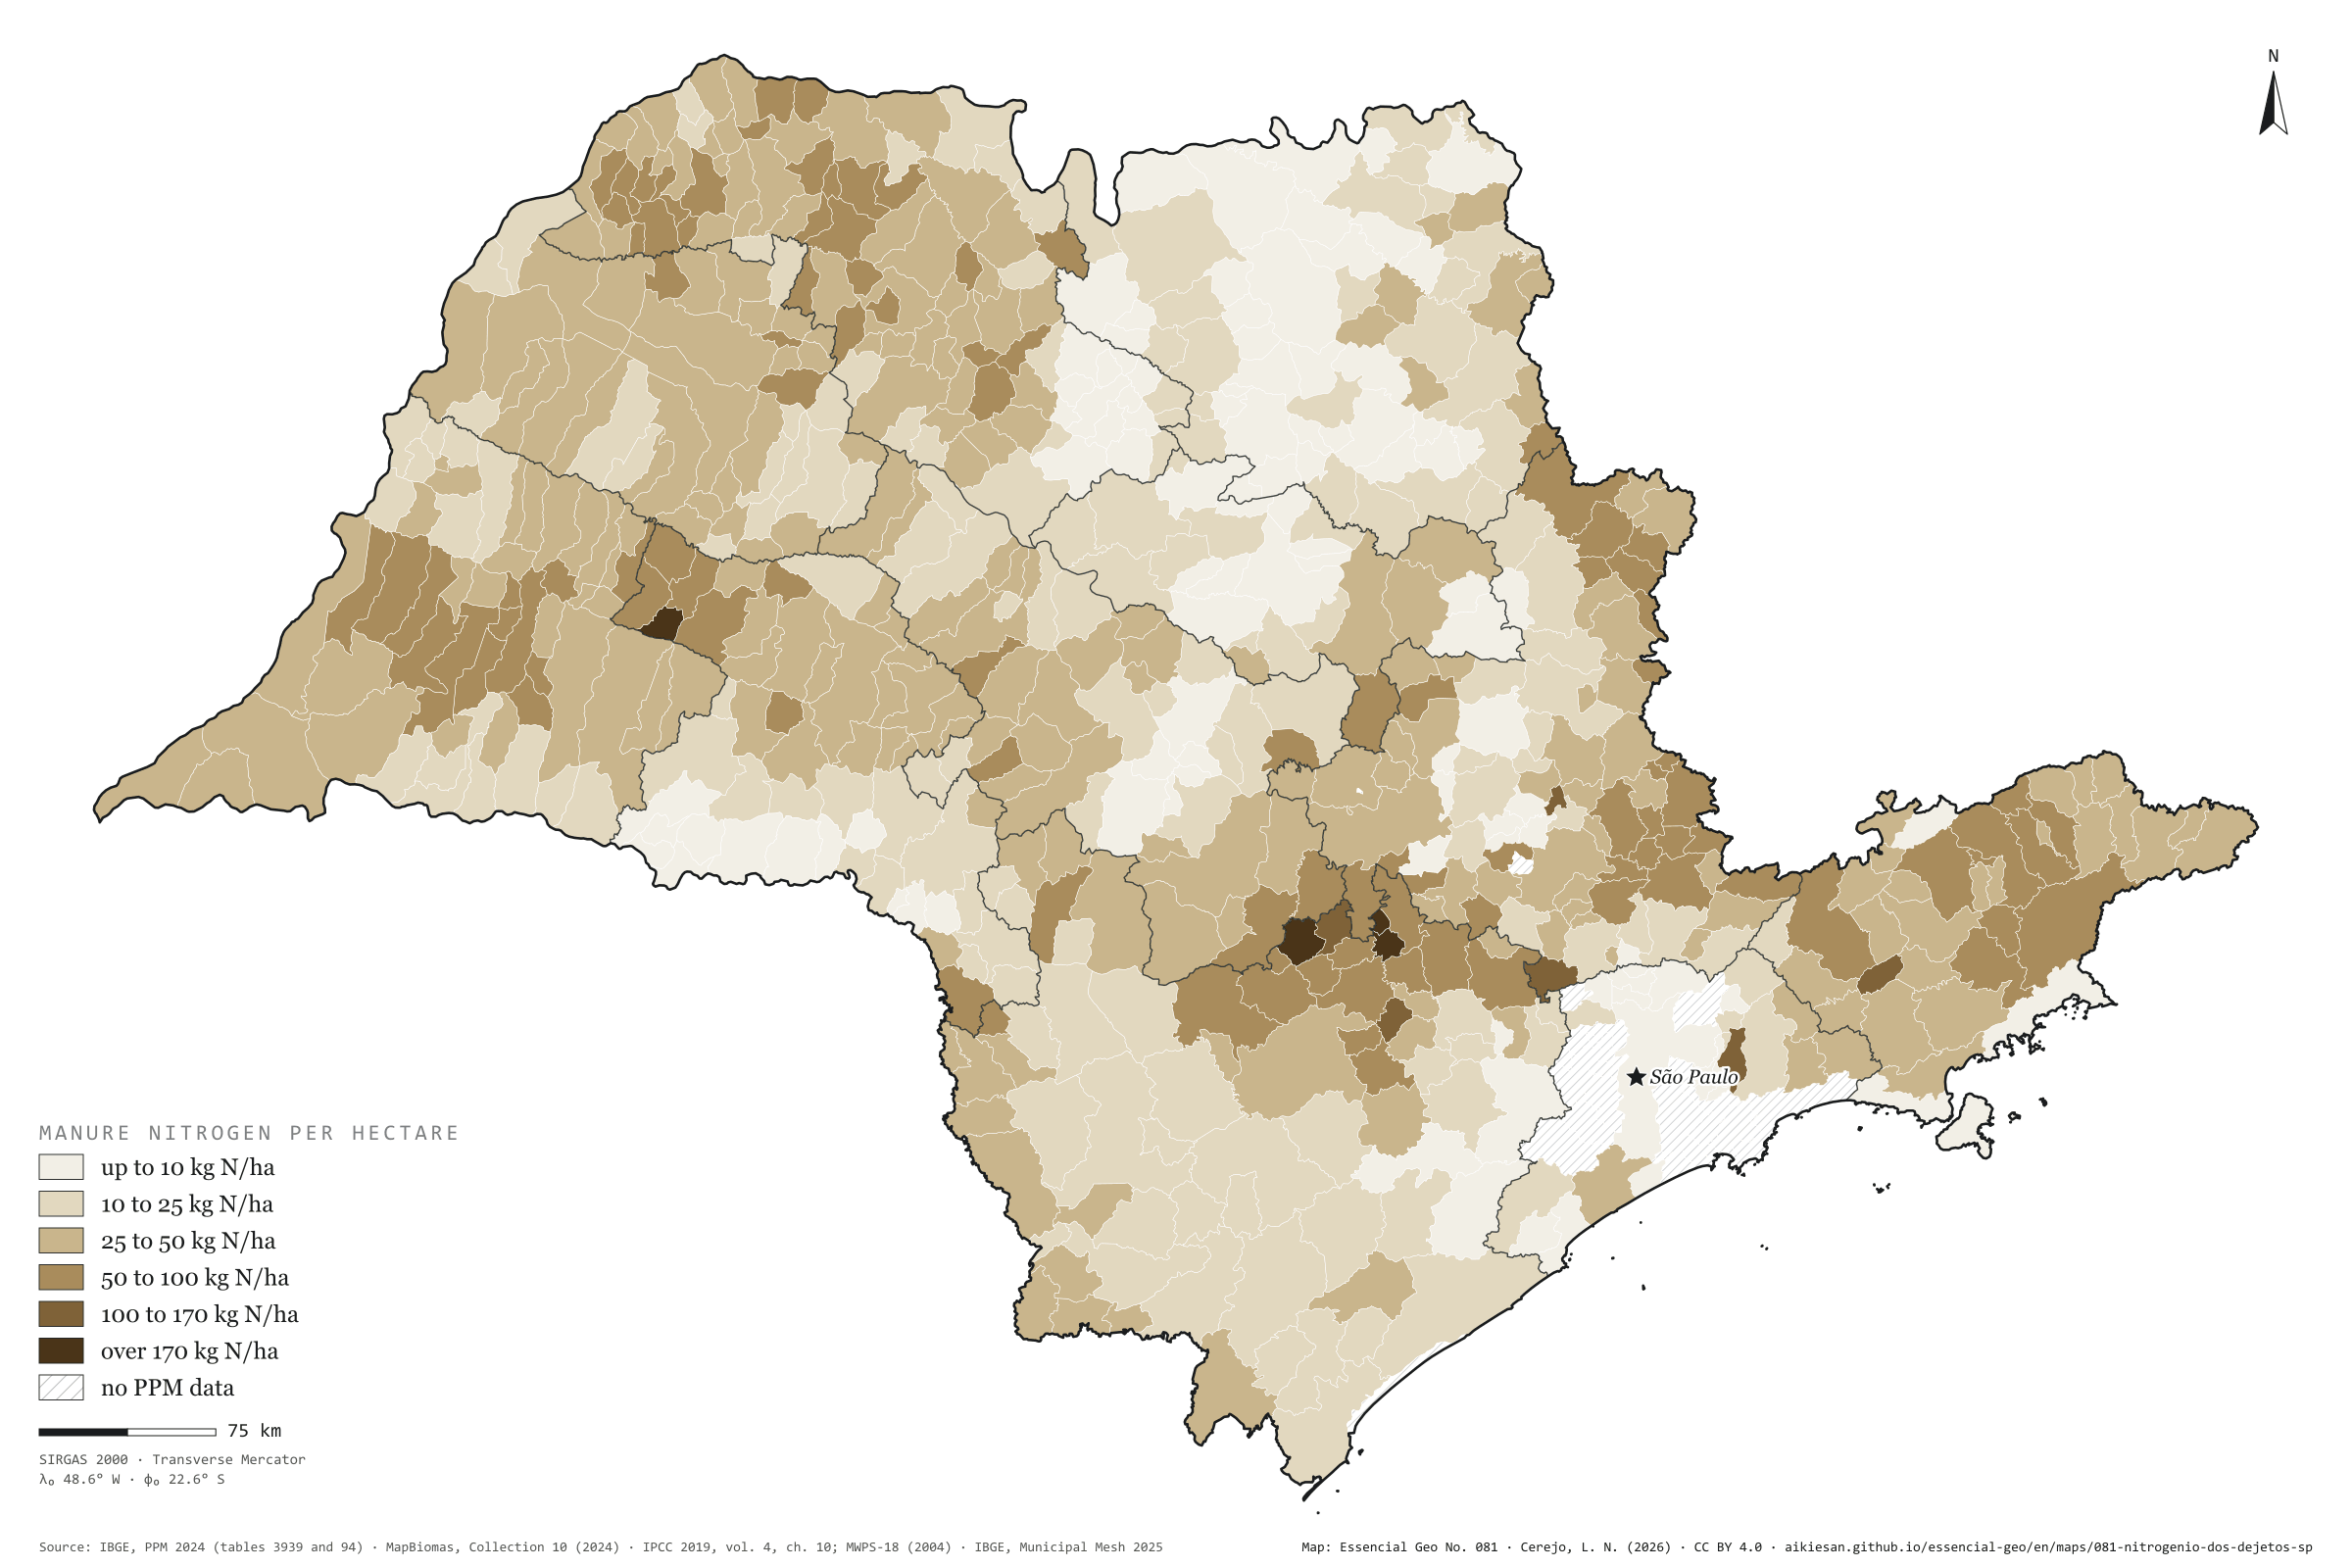
São Paulo’s herds excrete about 535,000 tonnes of nitrogen a year, by a calculation using the 2024 PPM head counts and IPCC coefficients. Over the 16.9 million hectares of MapBiomas farmland, that is 31.5 kg of N per hectare; the municipal median is 29 kg. Nearly two thirds (65%) comes from beef cattle, spread across the pastures; poultry gives 18%, dairy cows 11% and pigs 4%. The EU Nitrates Directive caps manure applied in vulnerable zones at 170 kg of N per hectare. Four São Paulo municipalities exceed it: Bastos, the egg capital, with 579 kg/ha, and Cerquilho (232), Jumirim (219) and Porangaba (171), with broiler farms. Presidente Bernardes, in the Pontal, has the largest total after Bastos: 5,600 tonnes, nearly all from grazing cattle. First plate of the collection “Manure that feeds the soil”.
Technical record · downloads · citation
At a glance
Manure nitrogen by the municipality’s kg N per hectare class (t N a year)
up to 10 kg/ha2.9%
10 to 25 kg/ha16.5%
25 to 50 kg/ha45.5%
50 to 100 kg/ha30.5%
100 to 170 kg/ha1.6%
over 170 kg/ha3%
Manure nitrogen by herd (thousand t N a year)
beef cattle and buffalo347
hens and broilers94
milked cows57
pigs21
horses, sheep and goats16
Manure nitrogen per farmland hectare
32kg/ha
535,000 t N a year, estimated
Layers
municipiospolygon645 municipalities: 2024 PPM herds, farmland and cropland; manure N, P₂O₅ and K₂O; crop removal; coverage; CP2B digestate
regioes_intermediariaspolygon11 intermediate geographic regions
Head counts of each herd in the 2024 PPM times the nitrogen excreted per head per year (IPCC 2019, Latin American means), summed by municipality and divided by the 2024 MapBiomas farmland (pasture, temporary and perennial crops, sugarcane, citrus and mixed use), in six classes; the last starts at the Nitrates Directive cap of 170 kg of N per hectare.
The map without a frame, with legend, scale, reference system and credit written on it: ready for papers, lectures and slides. In two versions: with the basemap (neighbours and sea) or only the mapped area, on white.
CEREJO, Lucas Nakamura. O nitrogênio dos dejetos: meio milhão de toneladas por ano; em Bastos, três vezes o teto europeu. Versão 1.0.0. [S. l.]: Essencial, 2026. Conjunto de dados. Disponível em: https://aikiesan.github.io/essencial-geo/en/maps/081-nitrogenio-dos-dejetos-sp/. Acesso em: 10 nov. 2026.
Cerejo, L. N. (2026). O nitrogênio dos dejetos: meio milhão de toneladas por ano; em Bastos, três vezes o teto europeu [The nitrogen in manure: Half a million tonnes a year; in Bastos, three times the European cap] (Version 1.0.0) [Data set]. Essencial. https://aikiesan.github.io/essencial-geo/en/maps/081-nitrogenio-dos-dejetos-sp/
@dataset{cerejo2026_nitrogenio_dos_dejetos_sp,
  author    = {Cerejo, Lucas Nakamura},
  title     = {O nitrogênio dos dejetos: Meio milhão de toneladas por ano; em Bastos, três vezes o teto europeu},
  year      = {2026},
  publisher = {Essencial},
  version   = {1.0.0},
  url       = {https://aikiesan.github.io/essencial-geo/en/maps/081-nitrogenio-dos-dejetos-sp/},
  language  = {portuguese},
  note      = {English title: The nitrogen in manure: Half a million tonnes a year; in Bastos, three times the European cap. Licence CC BY 4.0}
}
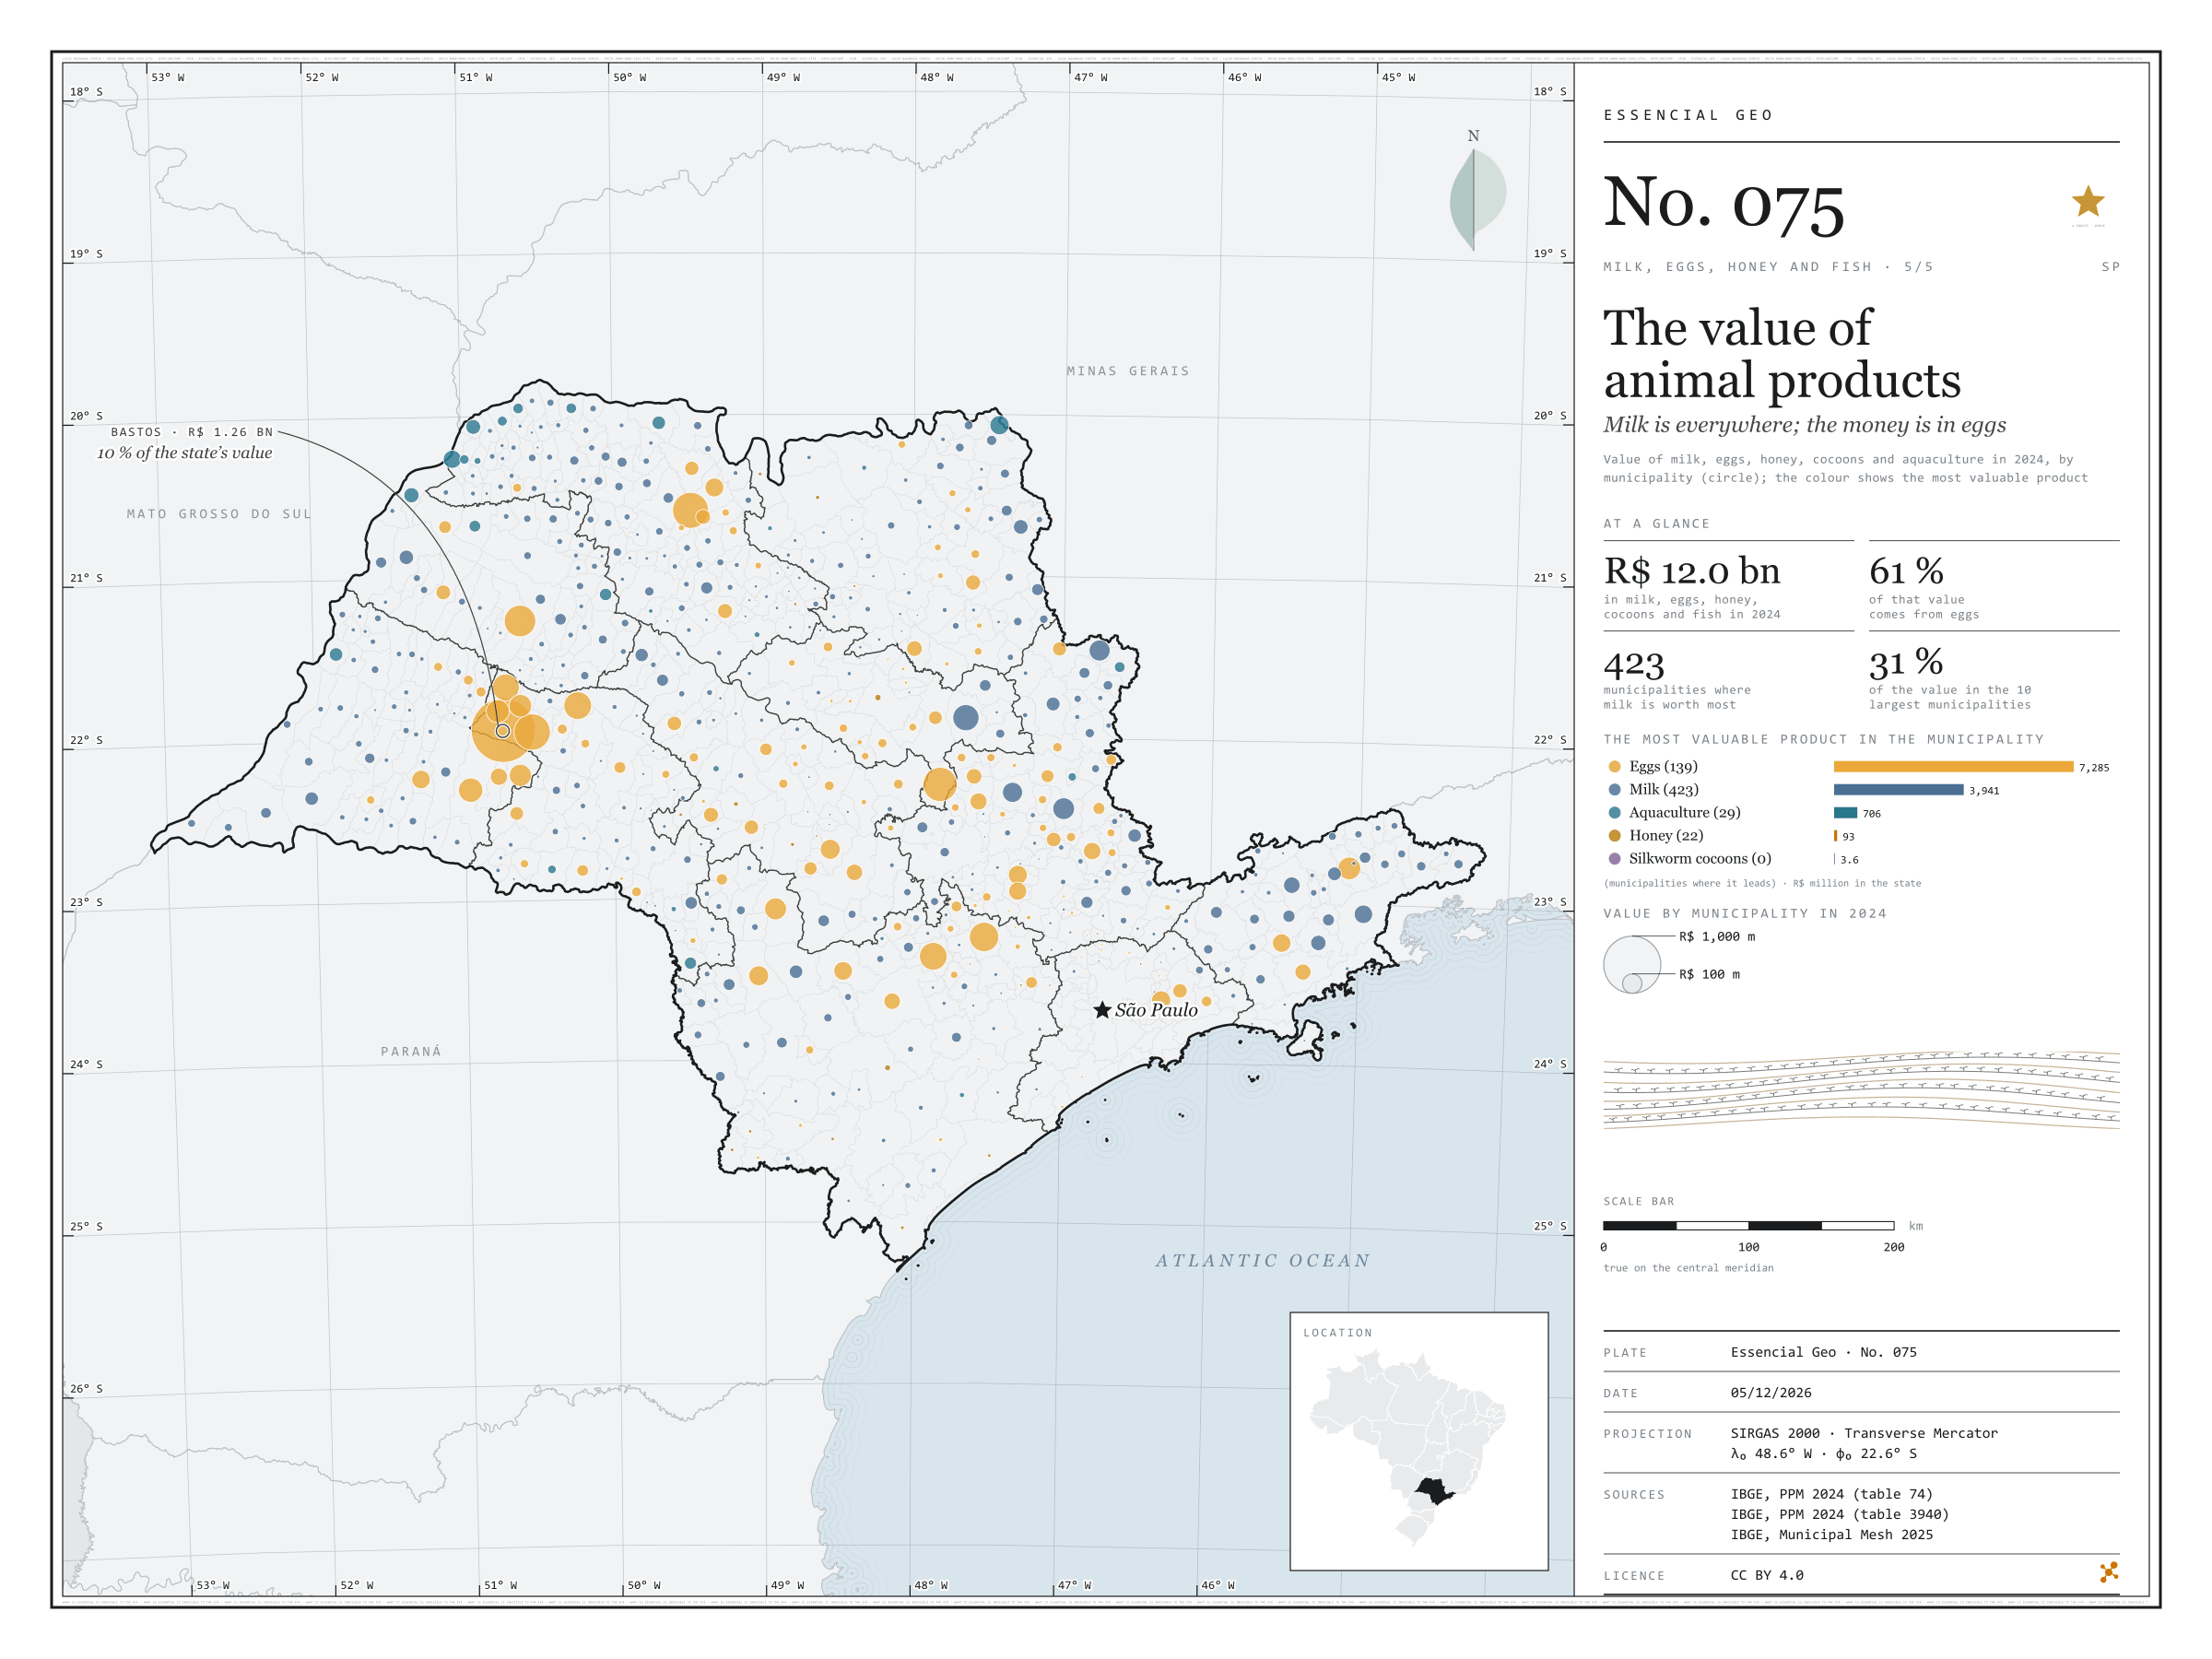
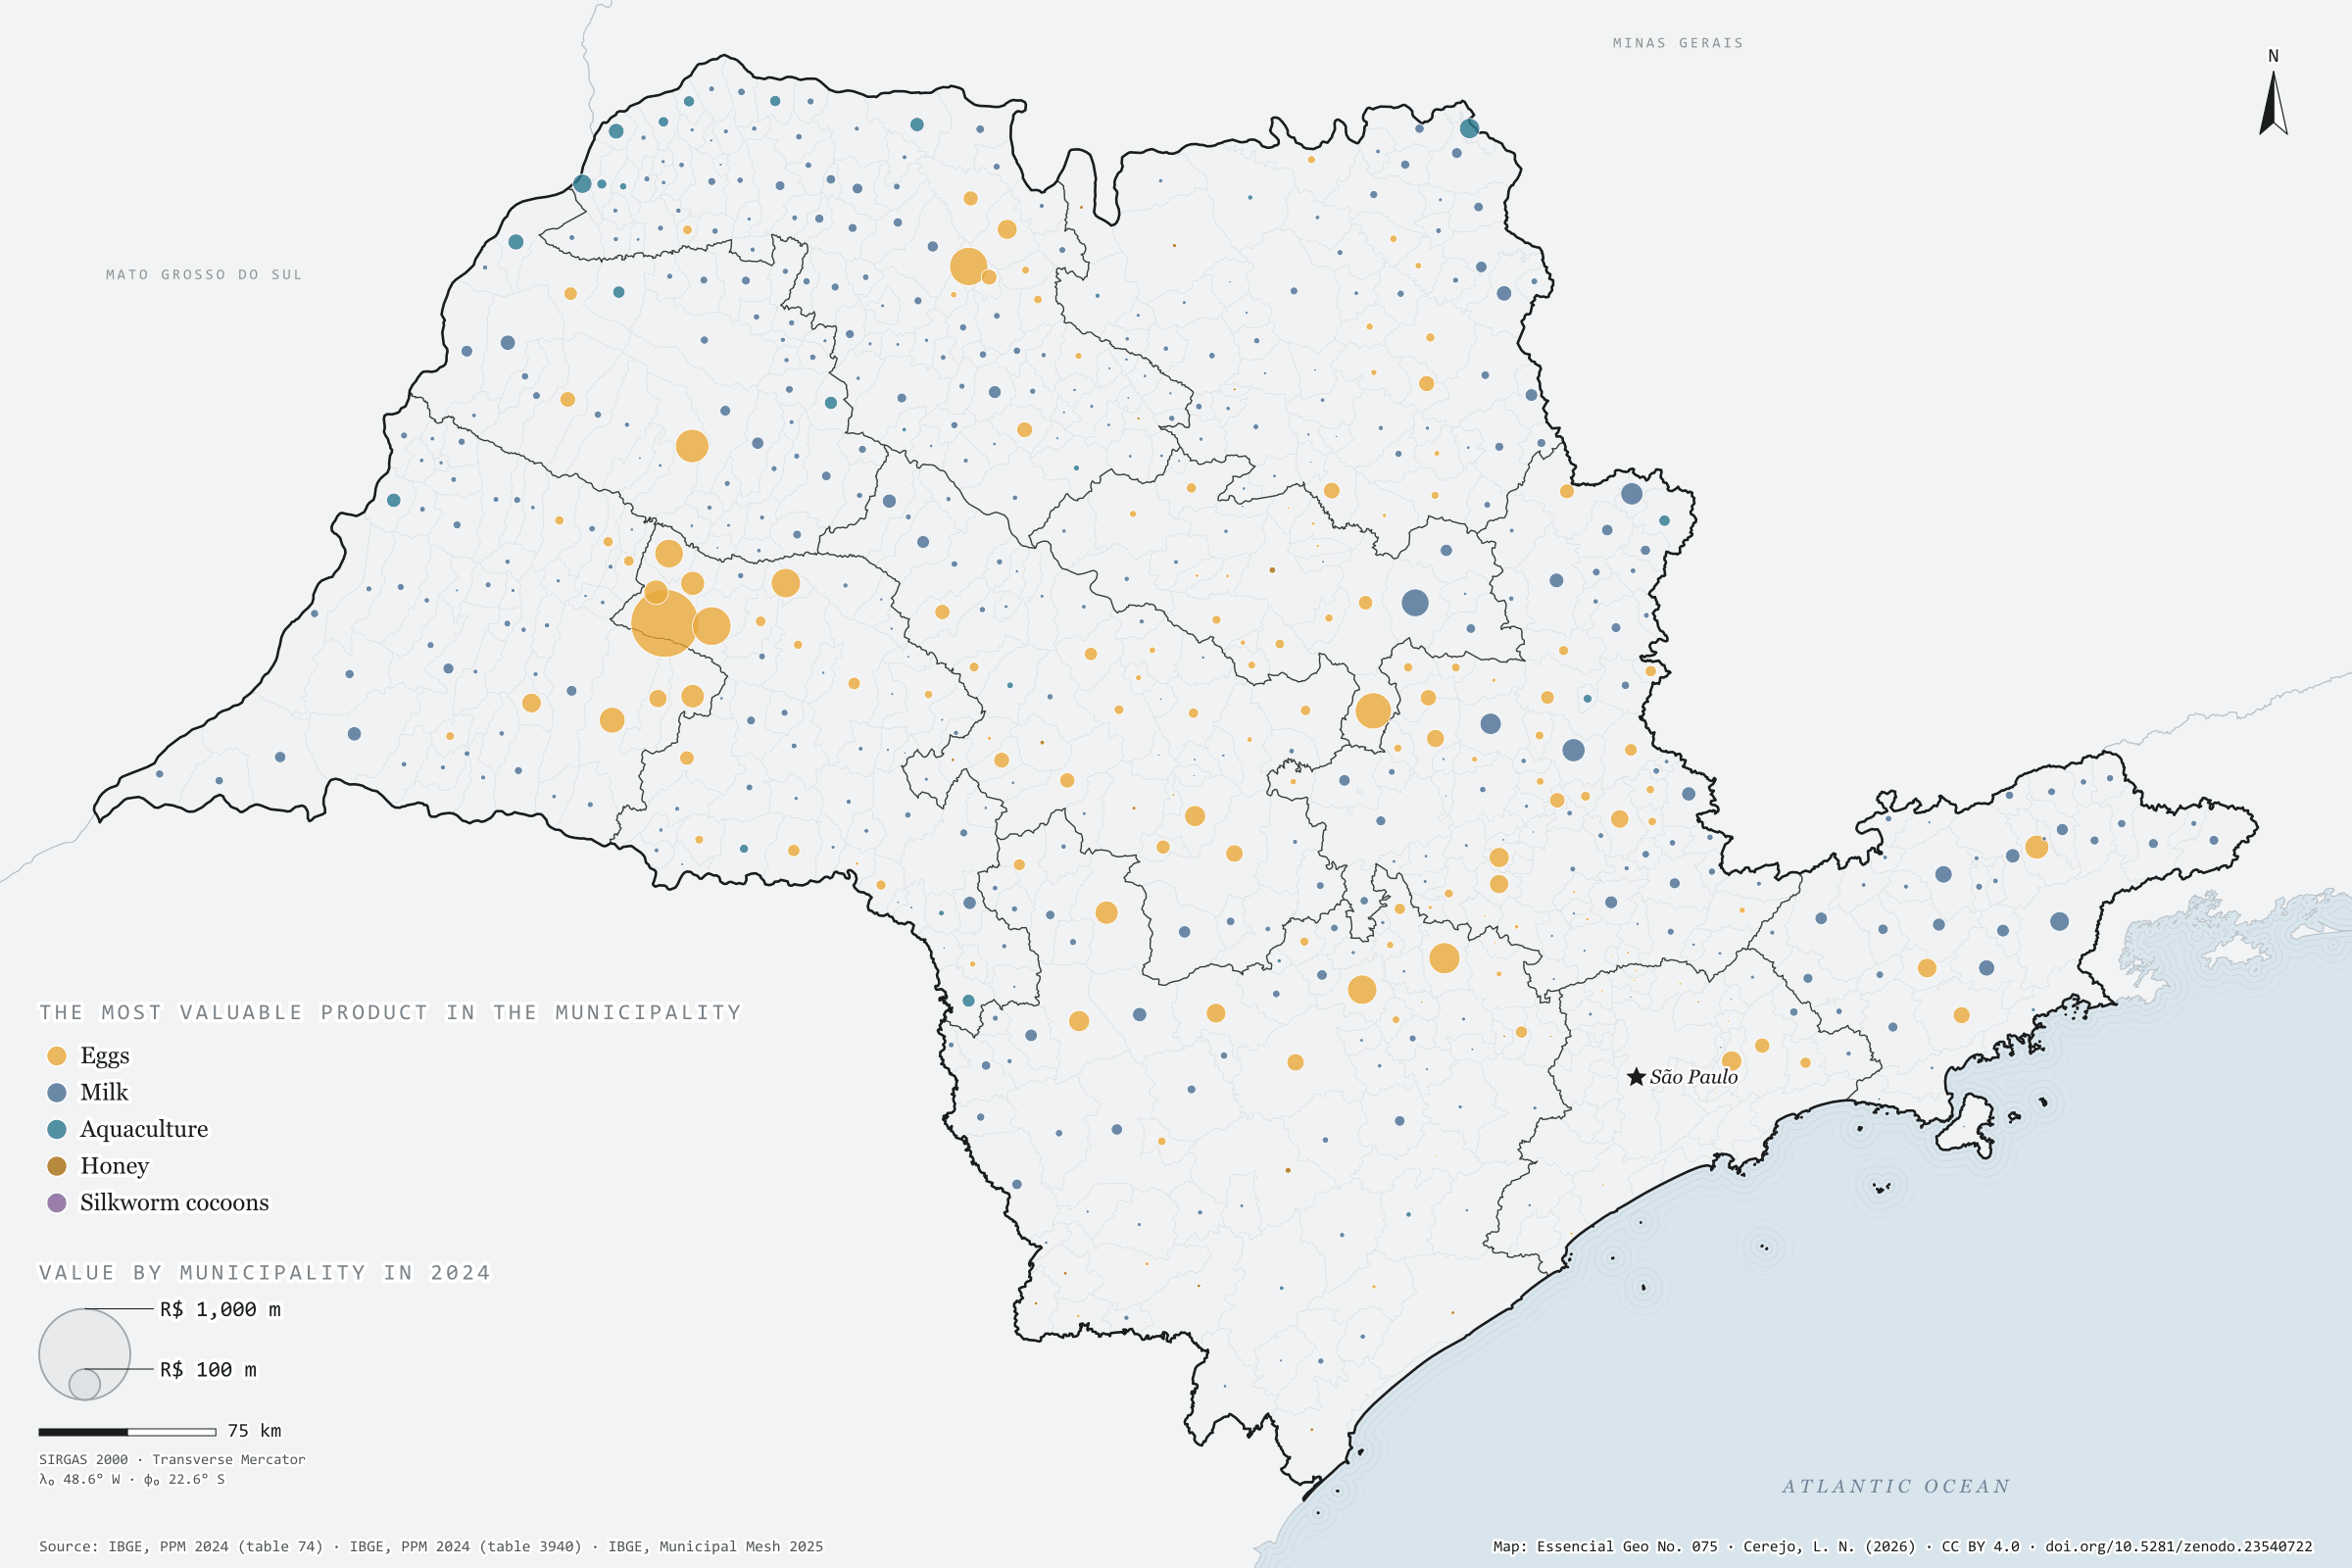
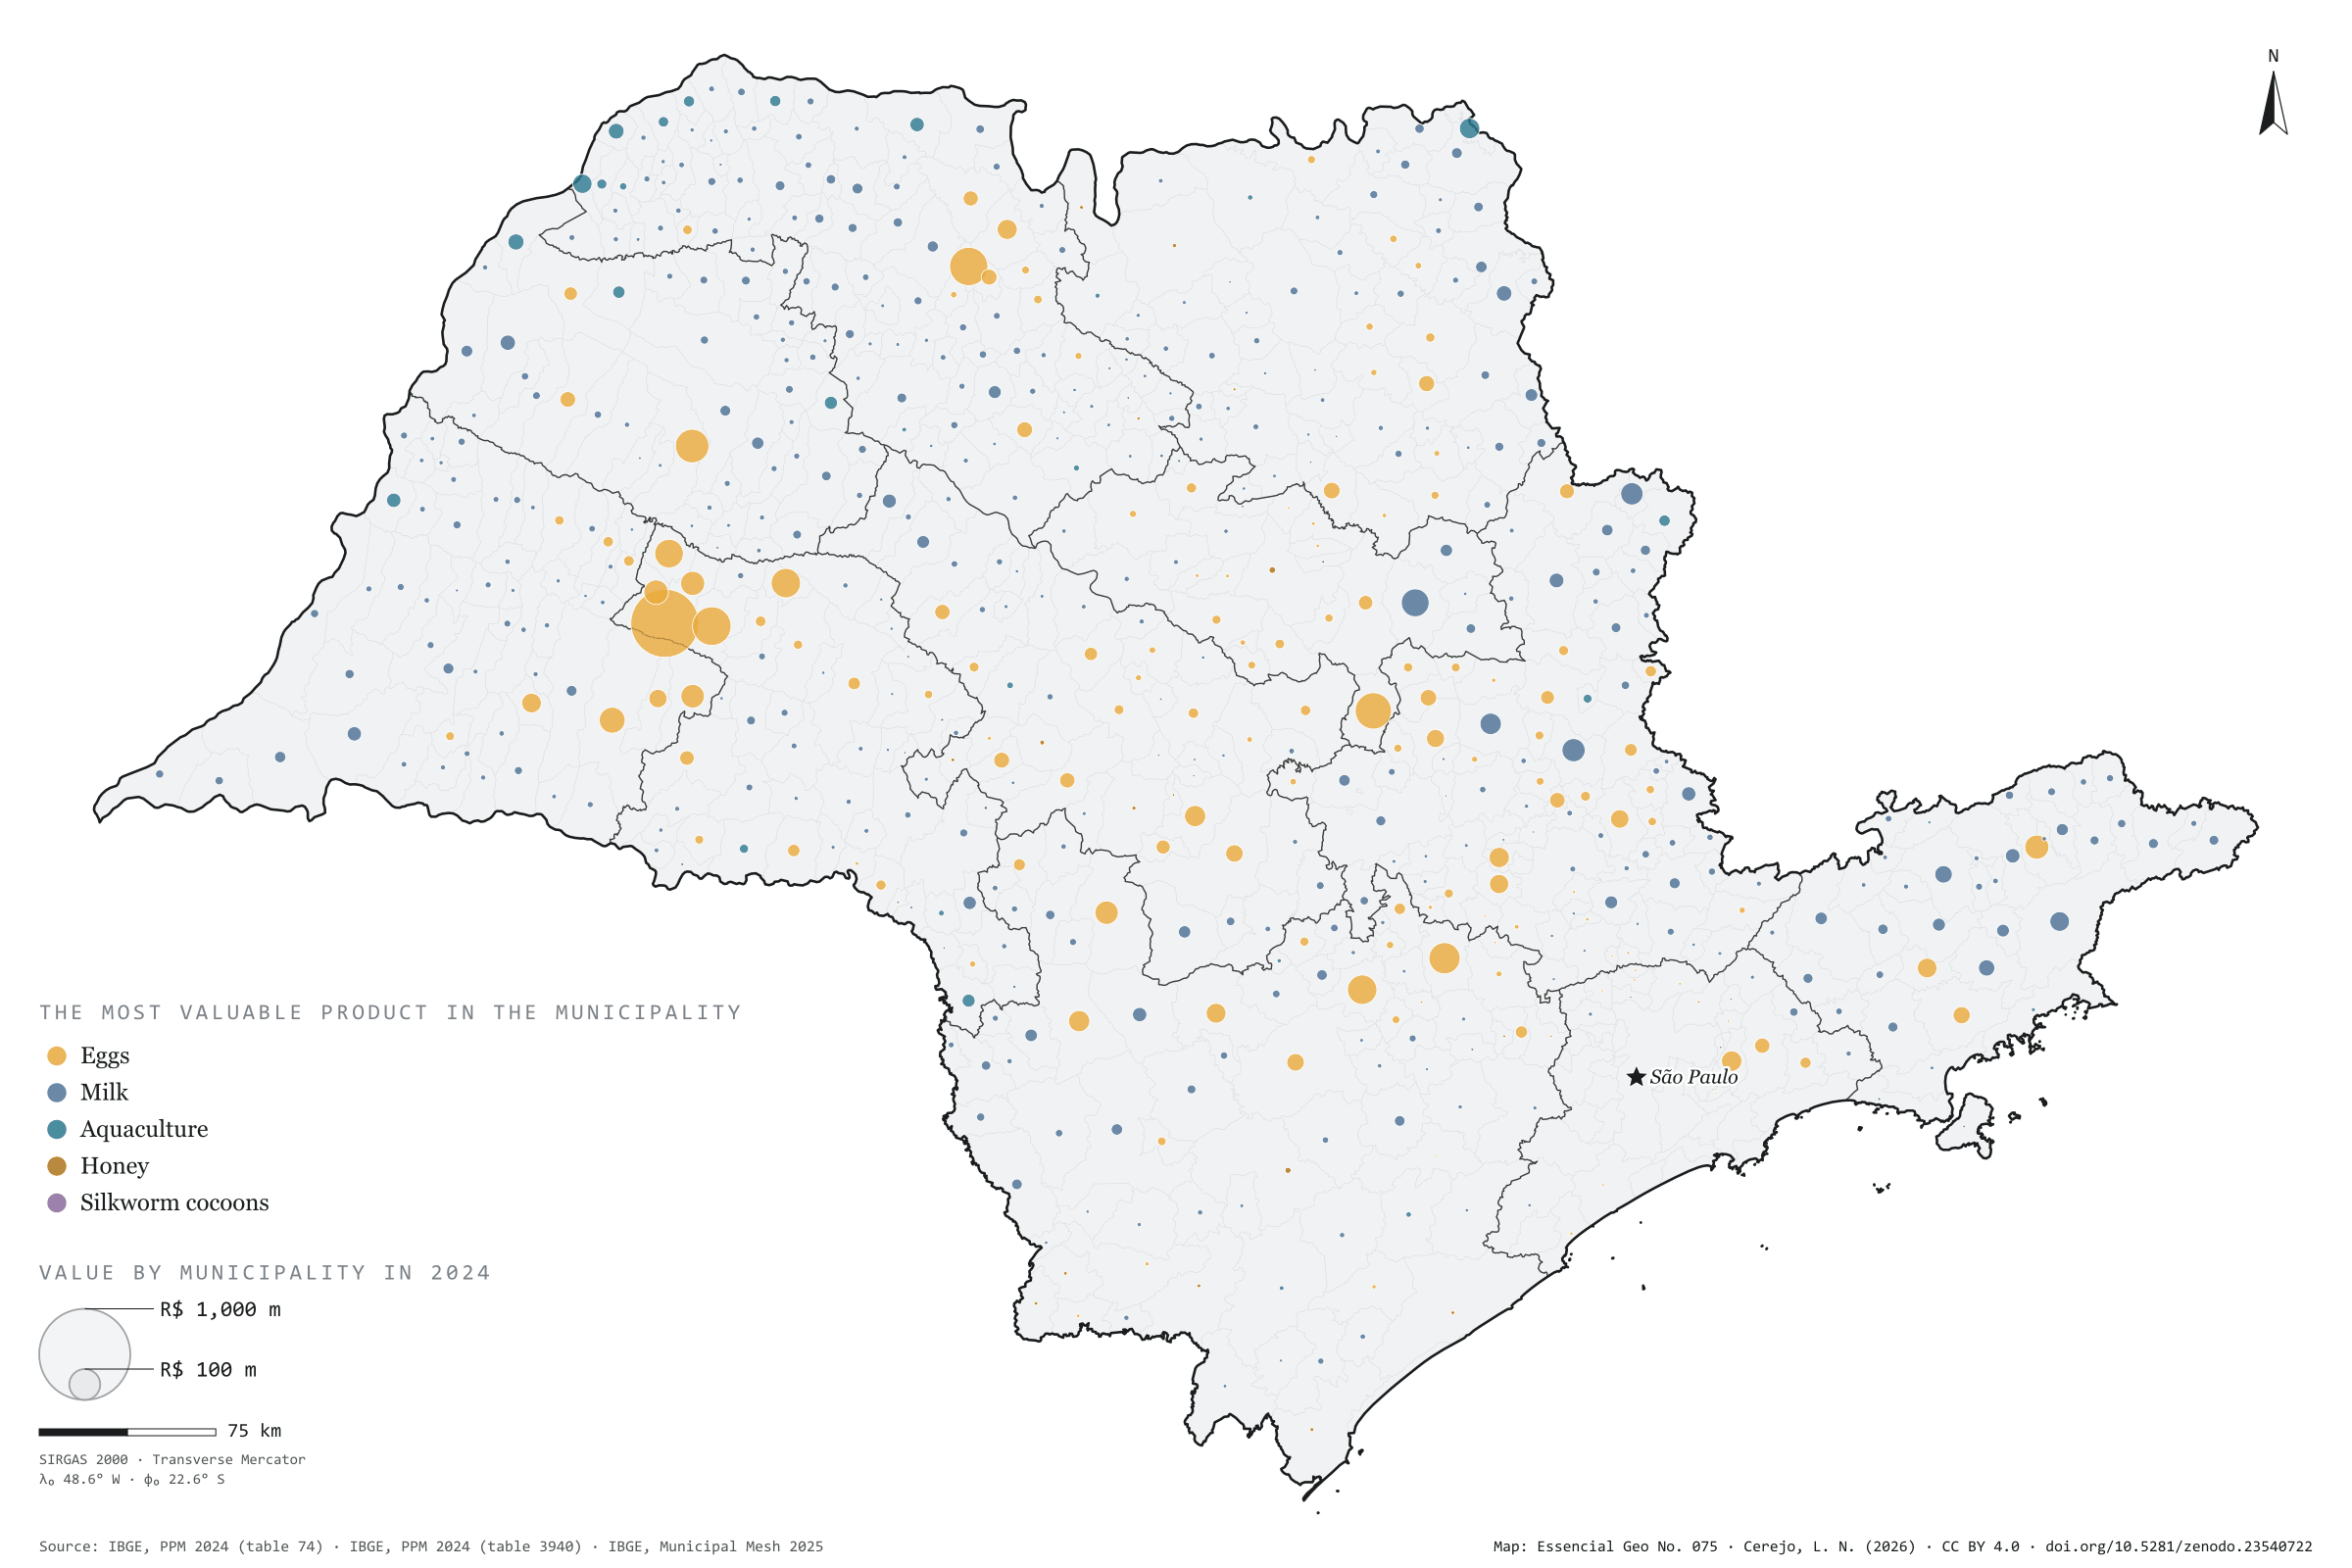
Milk, eggs, honey, silkworm cocoons and farmed fish were worth R$ 12.0 billion in São Paulo in 2024, according to the Municipal Livestock Survey. Eggs accounted for 61% of that value (R$ 7.3 billion), milk for 33% (R$ 3.9 billion), aquaculture for 6% and honey for less than 1%. On the map, however, the colour seen most is milk’s: it is the most valuable product in 423 municipalities, against 139 for eggs, 29 for aquaculture and 22 for honey. The egg money is concentrated in a few hubs. Bastos alone adds up to R$ 1.26 billion, 10% of the state, followed by Tupã, Mirassolândia and Itirapina; in the last two, eggs are more than 98% of the value. The ten largest municipalities account for 31% of the total. The survey does not include meat: the value of slaughtered animals is left out. Fifth and last plate of the collection “Milk, eggs, honey and fish”.
Technical record · downloads · citation
At a glance
Value of animal products in 2024
12,028,732thousand reais
Milk, eggs, honey, cocoons and aquaculture; meat not included
Municipalities where milk is the most valuable product
423
Eggs in 139, aquaculture in 29 and honey in 22; 32 with no reported value
Value by product in 2024 (thousand reais)
Eggs7,284,736
Milk3,941,474
Aquaculture706,286
Honey92,598
Cocoons3,638
Layers
valorpoint613 municipalities with reported value: value of each product and total (thousand reais), dominant product and its share
municipiospolygon645 municipalities, with the same fields
regioes_intermediariaspolygon11 intermediate geographic regions
Value of milk, hen and quail eggs, honey and cocoons (table 74) and aquaculture (table 3940) from PPM 2024, added up by municipality; circles with area proportional to the total, coloured by the most valuable product.
The map without a frame, with legend, scale, reference system and credit written on it: ready for papers, lectures and slides. In two versions: with the basemap (neighbours and sea) or only the mapped area, on white.
CEREJO, Lucas Nakamura. O valor da produção animal: o leite está em toda parte; o dinheiro, nos ovos. Versão 1.0.0. [S. l.]: Zenodo, 2026. Conjunto de dados. DOI: 10.5281/zenodo.23540722. Disponível em: https://doi.org/10.5281/zenodo.23540722. Acesso em: 10 nov. 2026.
Cerejo, L. N. (2026). O valor da produção animal: o leite está em toda parte; o dinheiro, nos ovos [The value of animal products: Milk is everywhere; the money is in eggs] (Version 1.0.0) [Data set]. Zenodo. https://doi.org/10.5281/zenodo.23540722
@dataset{cerejo2026_producao_animal_sp,
  author    = {Cerejo, Lucas Nakamura},
  title     = {O valor da produção animal: O leite está em toda parte; o dinheiro, nos ovos},
  year      = {2026},
  publisher = {Zenodo},
  version   = {1.0.0},
  doi       = {10.5281/zenodo.23540722},
  url       = {https://doi.org/10.5281/zenodo.23540722},
  language  = {portuguese},
  note      = {English title: The value of animal products: Milk is everywhere; the money is in eggs. Licence CC BY 4.0}
}
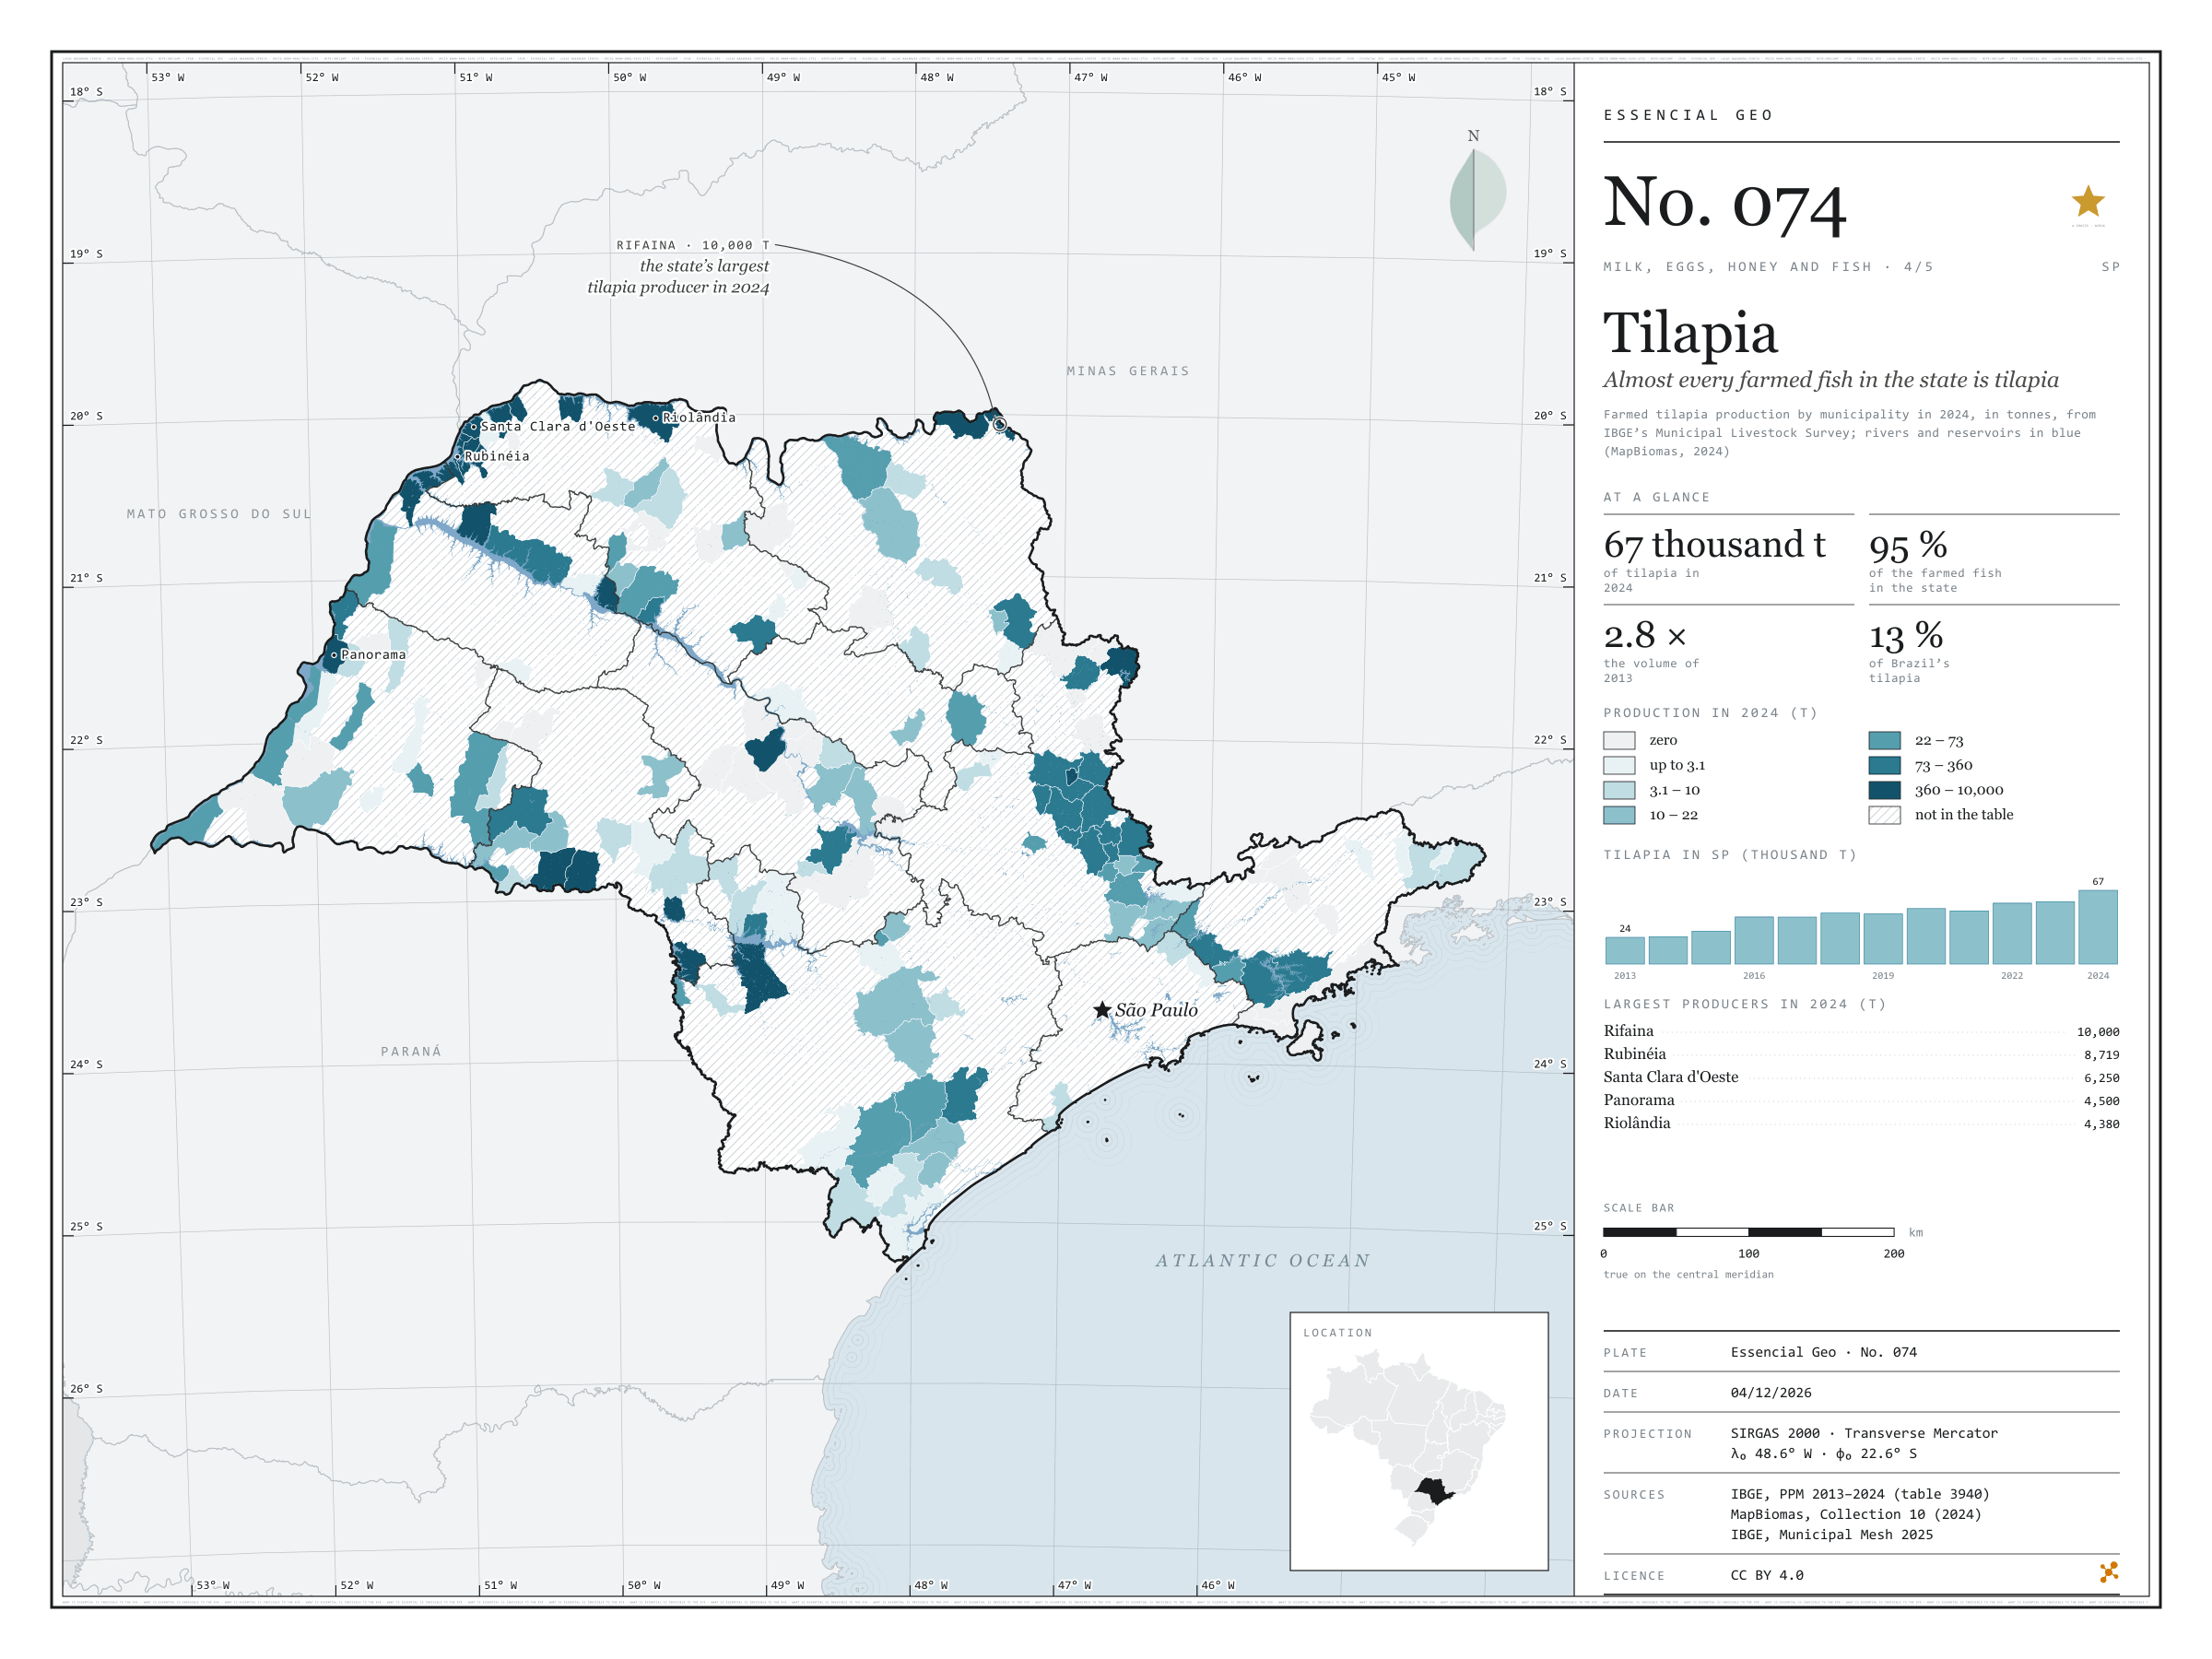
Fig. 074São Paulo state (SP)EPSG:4674Source: IBGE, MapBiomas
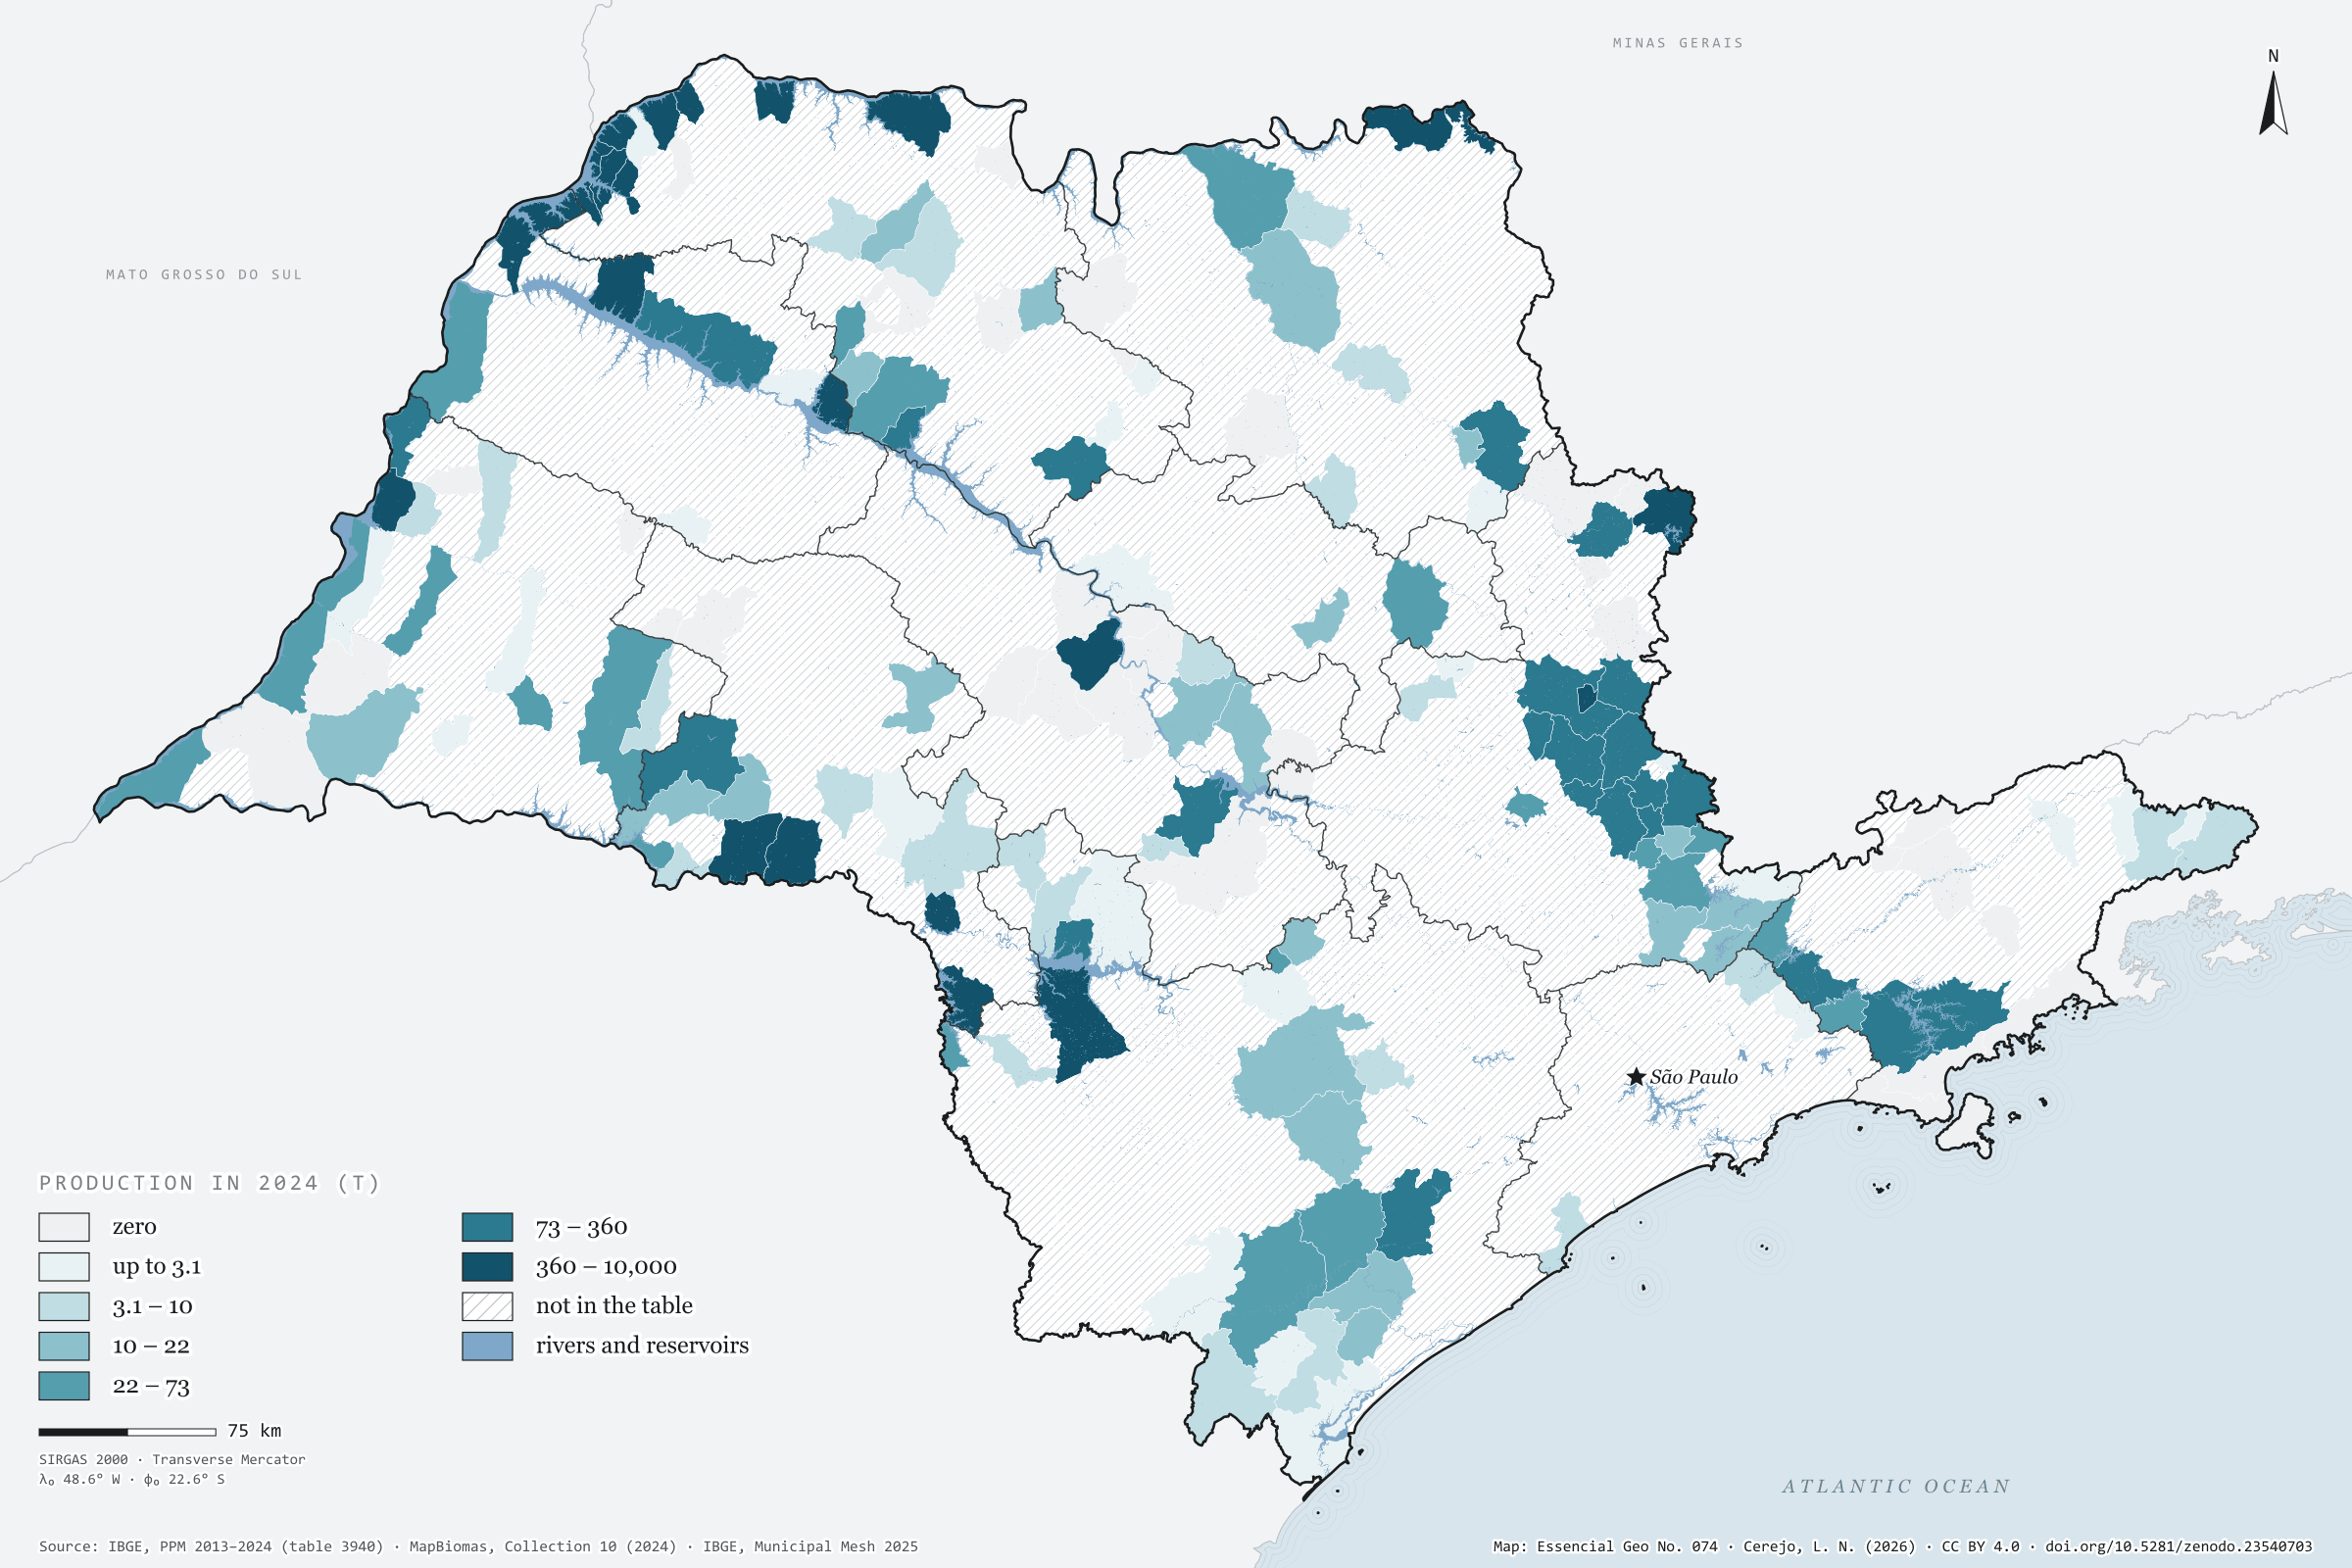
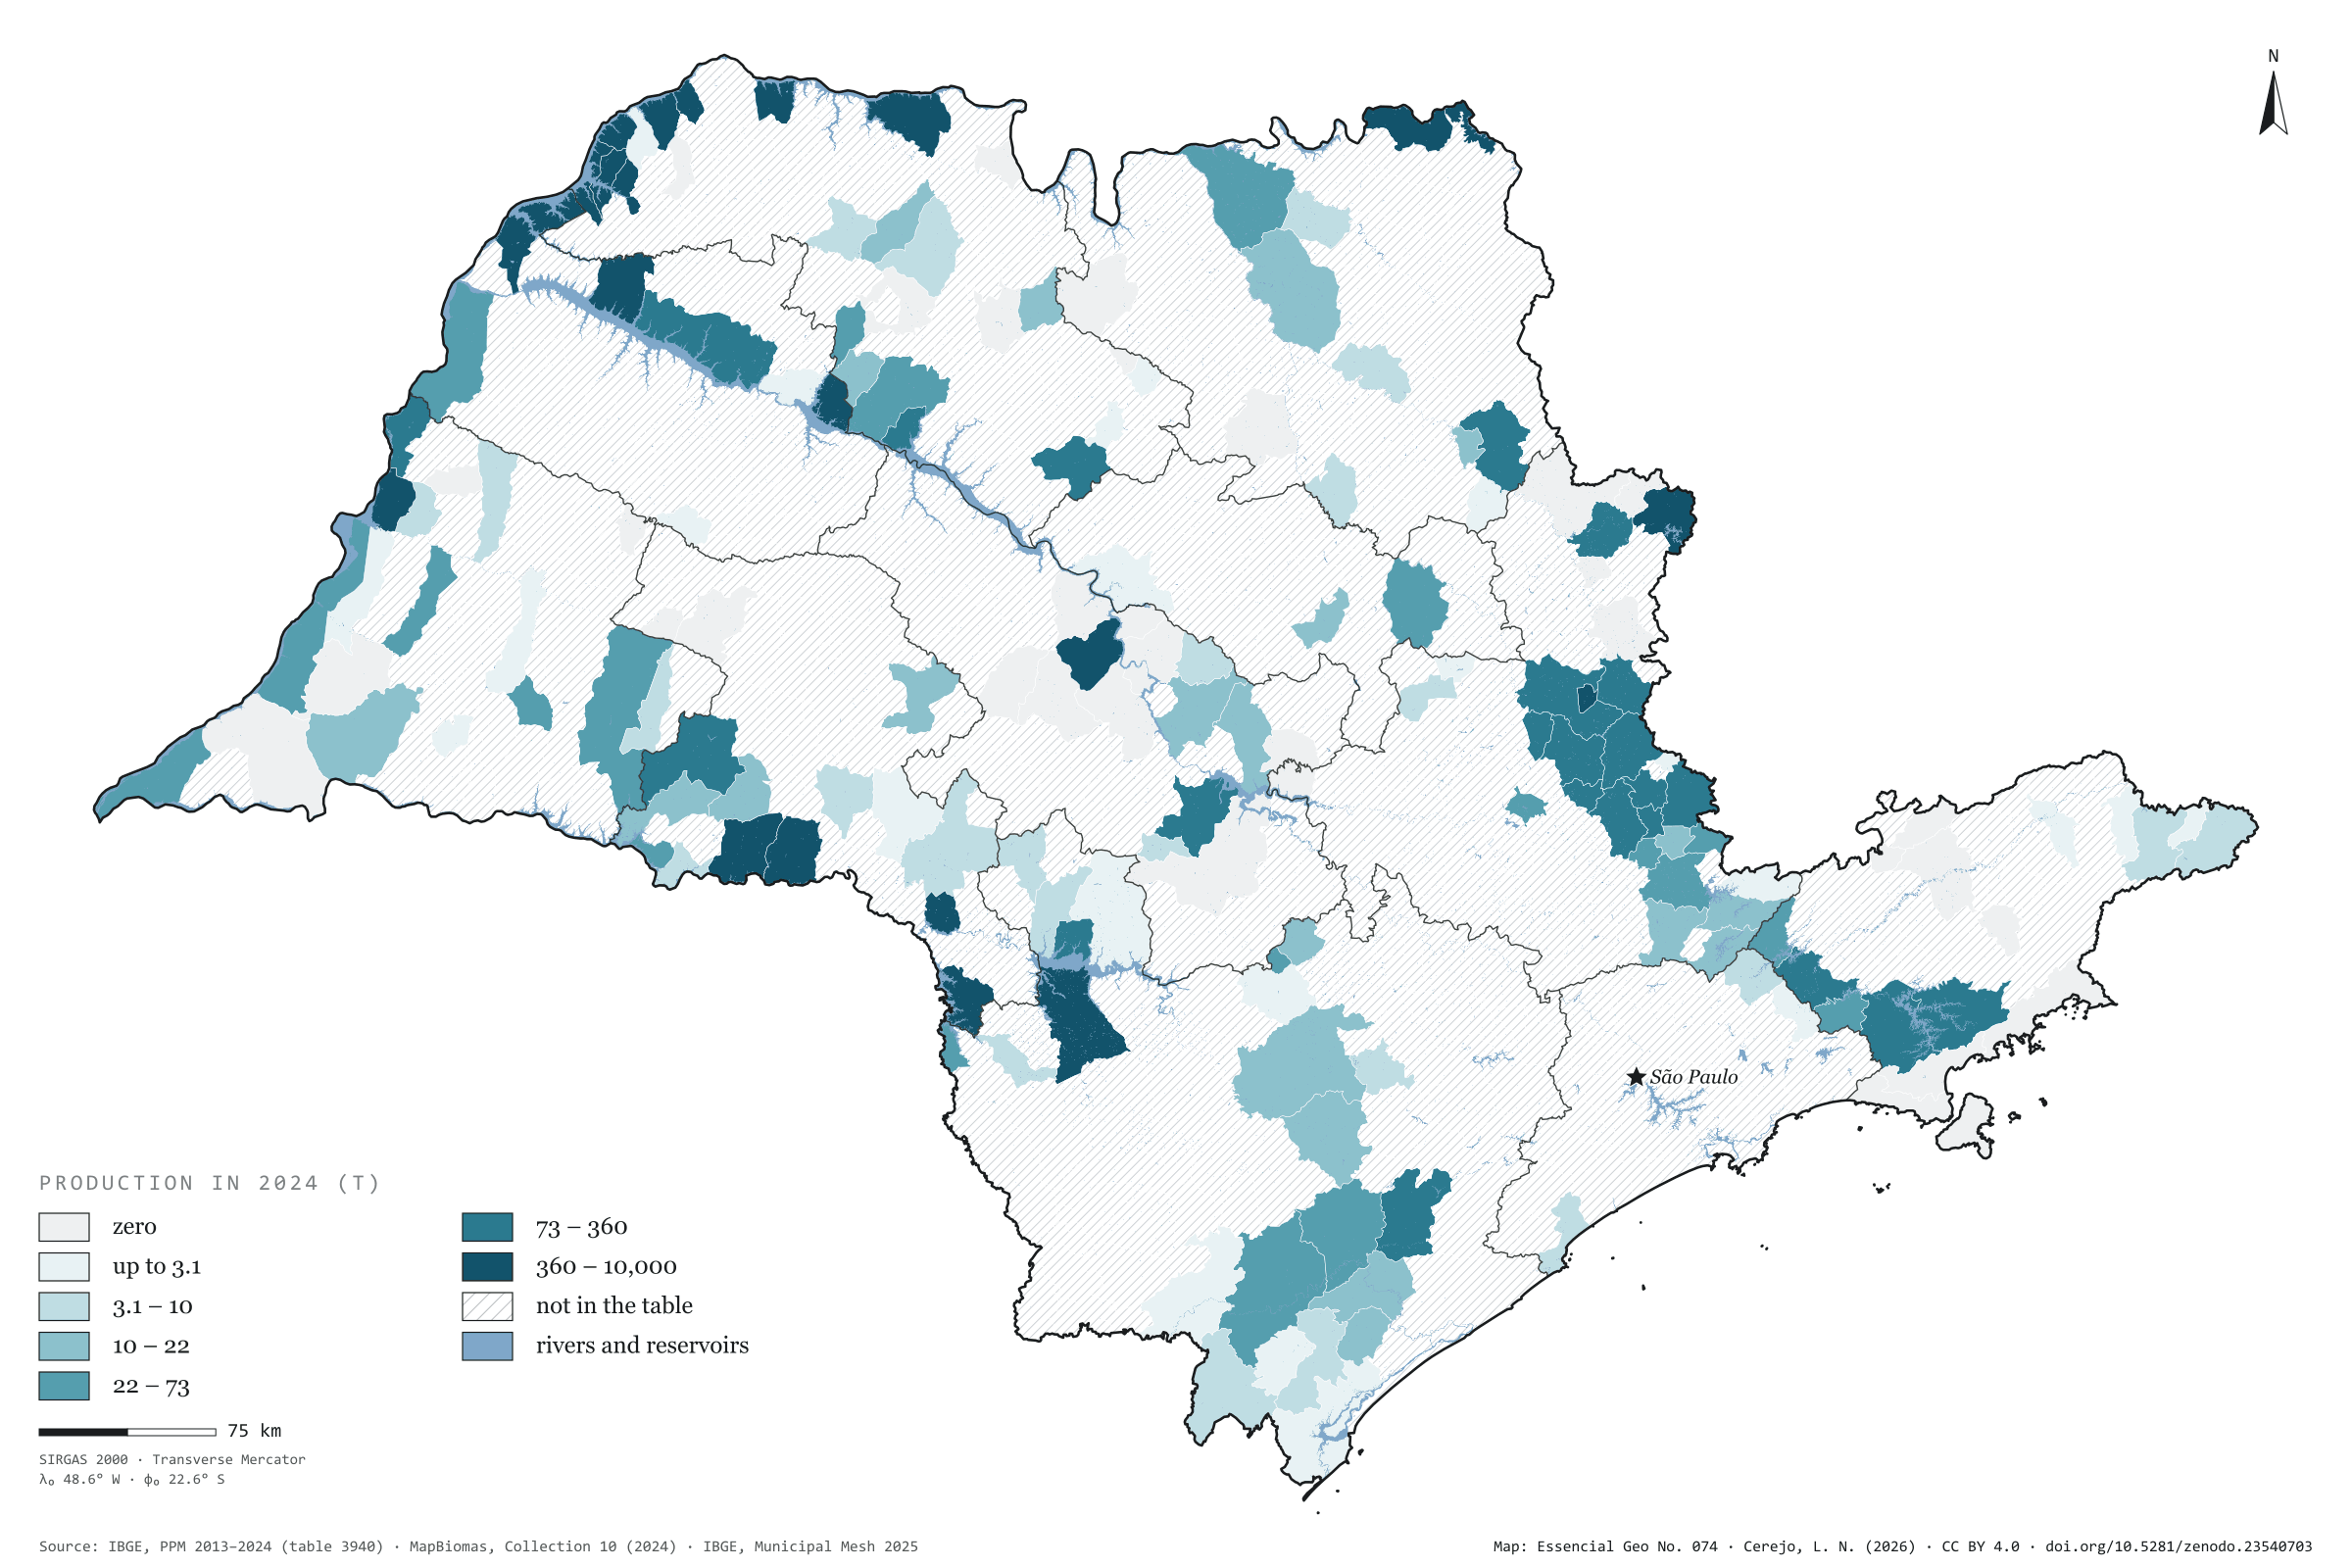
São Paulo farmed 67,000 tonnes of tilapia in 2024, 2.8 times the volume of 2013, the first year of the Municipal Livestock Survey’s aquaculture series. Tilapia is 95% of all fish farmed in the state. Brazil grew even faster, from 169,000 to 499,000 tonnes, and the state’s share stood at 13.4%. Farming is concentrated: 134 municipalities report production, and the ten largest account for 72%. The largest sit on the reservoirs of the Grande and Paraná rivers. Rifaina, on the border with Minas Gerais, leads with 10,000 tonnes, followed by Rubinéia, Santa Clara d'Oeste, Panorama and Riolândia. The São José do Rio Preto region, in the north-west, produces 42% of the total on its own. On the map, MapBiomas water shows the rivers and reservoirs, and hatching marks the 476 municipalities with no reported production. Fourth plate of the collection “Milk, eggs, honey and fish”.
Technical record · downloads · citation
At a glance
Tilapia in 2024
67,058,737kg
In 2013 it was 24,329,347 kg; the share of Brazil went from 14.4% to 13.4%
Tilapia’s share of farmed fish in SP
95%
Out of 70,548,417 kg of fish of all species in 2024
Largest producers in 2024 (kg)
Rifaina10,000,000
Rubinéia8,718,900
Santa Clara d'Oeste6,250,000
Panorama4,500,000
Riolândia4,379,950
Layers
municipiospolygon645 municipalities: tilapia production in 2013 and 2024 (kg) and data status in 2024
regioes_intermediariaspolygon11 intermediate geographic regions
Tilapia production from PPM 2024 by municipality in six quantile classes; state series from 2013 to 2024; rivers, lakes and reservoirs from the MapBiomas 2024 water classes over the map.
The map without a frame, with legend, scale, reference system and credit written on it: ready for papers, lectures and slides. In two versions: with the basemap (neighbours and sea) or only the mapped area, on white.
CEREJO, Lucas Nakamura. Tilápia: quase todo peixe criado no estado é tilápia. Versão 1.0.0. [S. l.]: Zenodo, 2026. Conjunto de dados. DOI: 10.5281/zenodo.23540703. Disponível em: https://doi.org/10.5281/zenodo.23540703. Acesso em: 10 nov. 2026.
Cerejo, L. N. (2026). Tilápia: quase todo peixe criado no estado é tilápia [Tilapia: Almost every farmed fish in the state is tilapia] (Version 1.0.0) [Data set]. Zenodo. https://doi.org/10.5281/zenodo.23540703
@dataset{cerejo2026_tilapia_sp,
  author    = {Cerejo, Lucas Nakamura},
  title     = {Tilápia: Quase todo peixe criado no estado é tilápia},
  year      = {2026},
  publisher = {Zenodo},
  version   = {1.0.0},
  doi       = {10.5281/zenodo.23540703},
  url       = {https://doi.org/10.5281/zenodo.23540703},
  language  = {portuguese},
  note      = {English title: Tilapia: Almost every farmed fish in the state is tilapia. Licence CC BY 4.0}
}
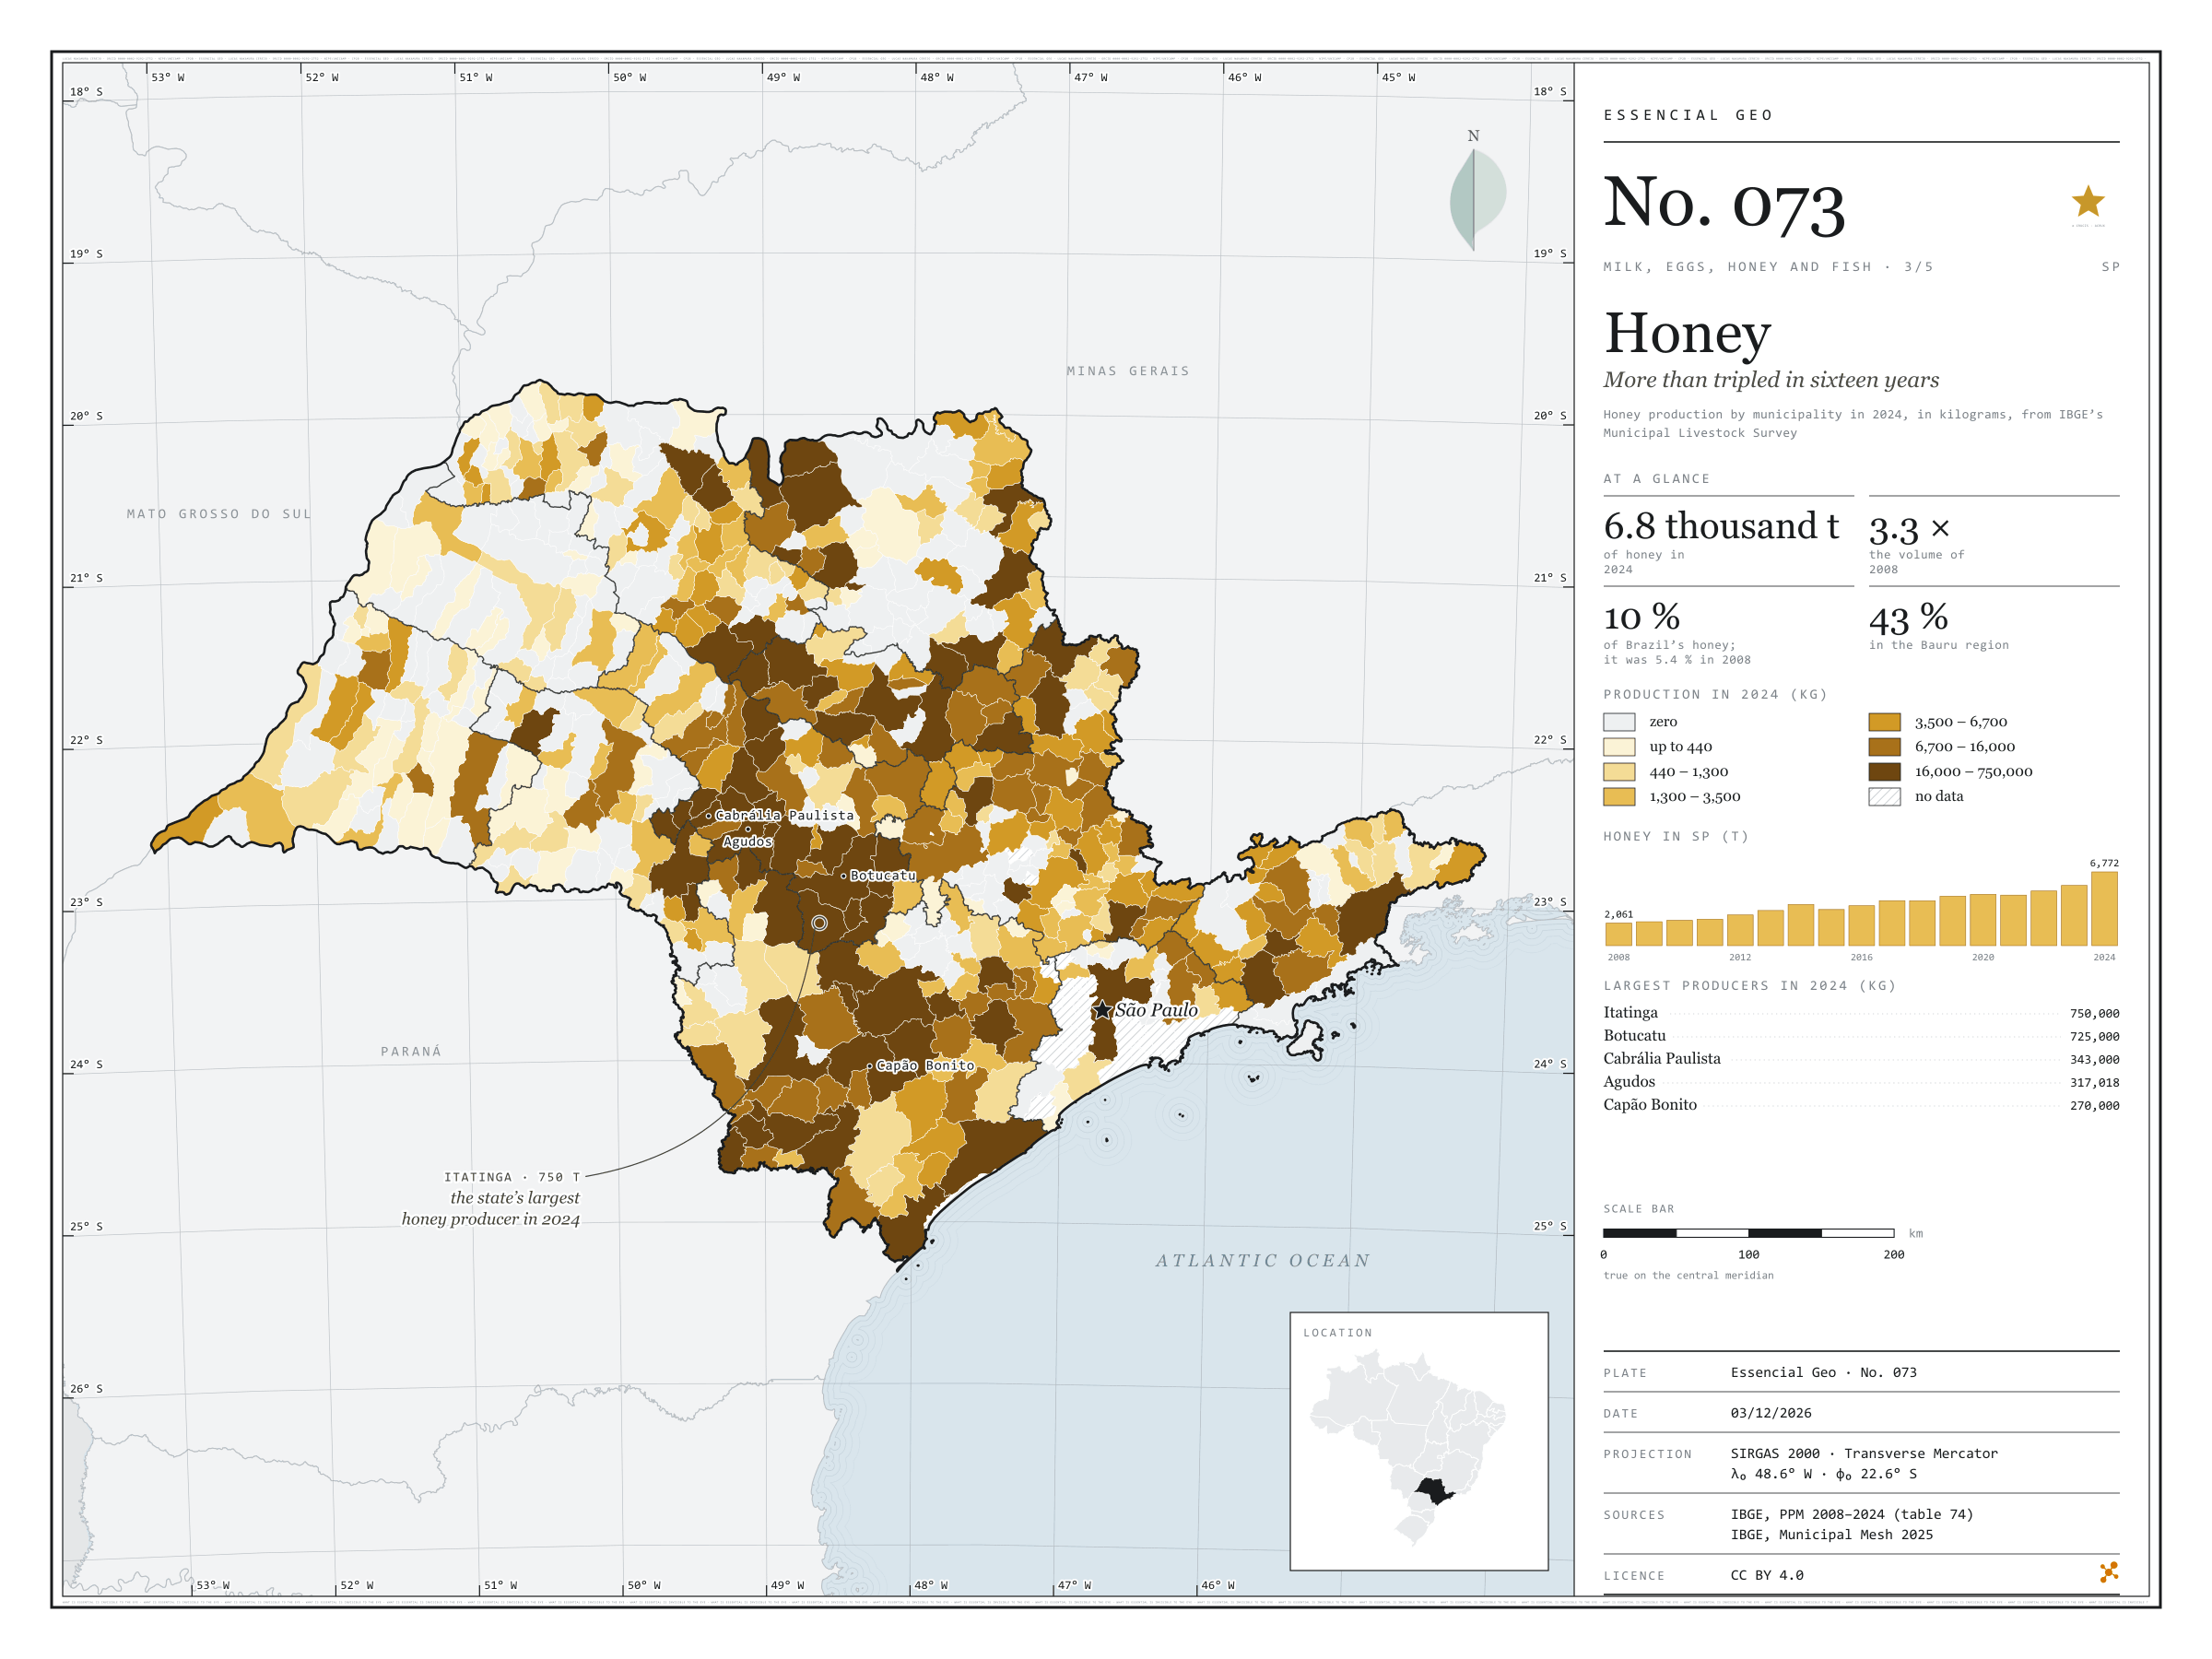
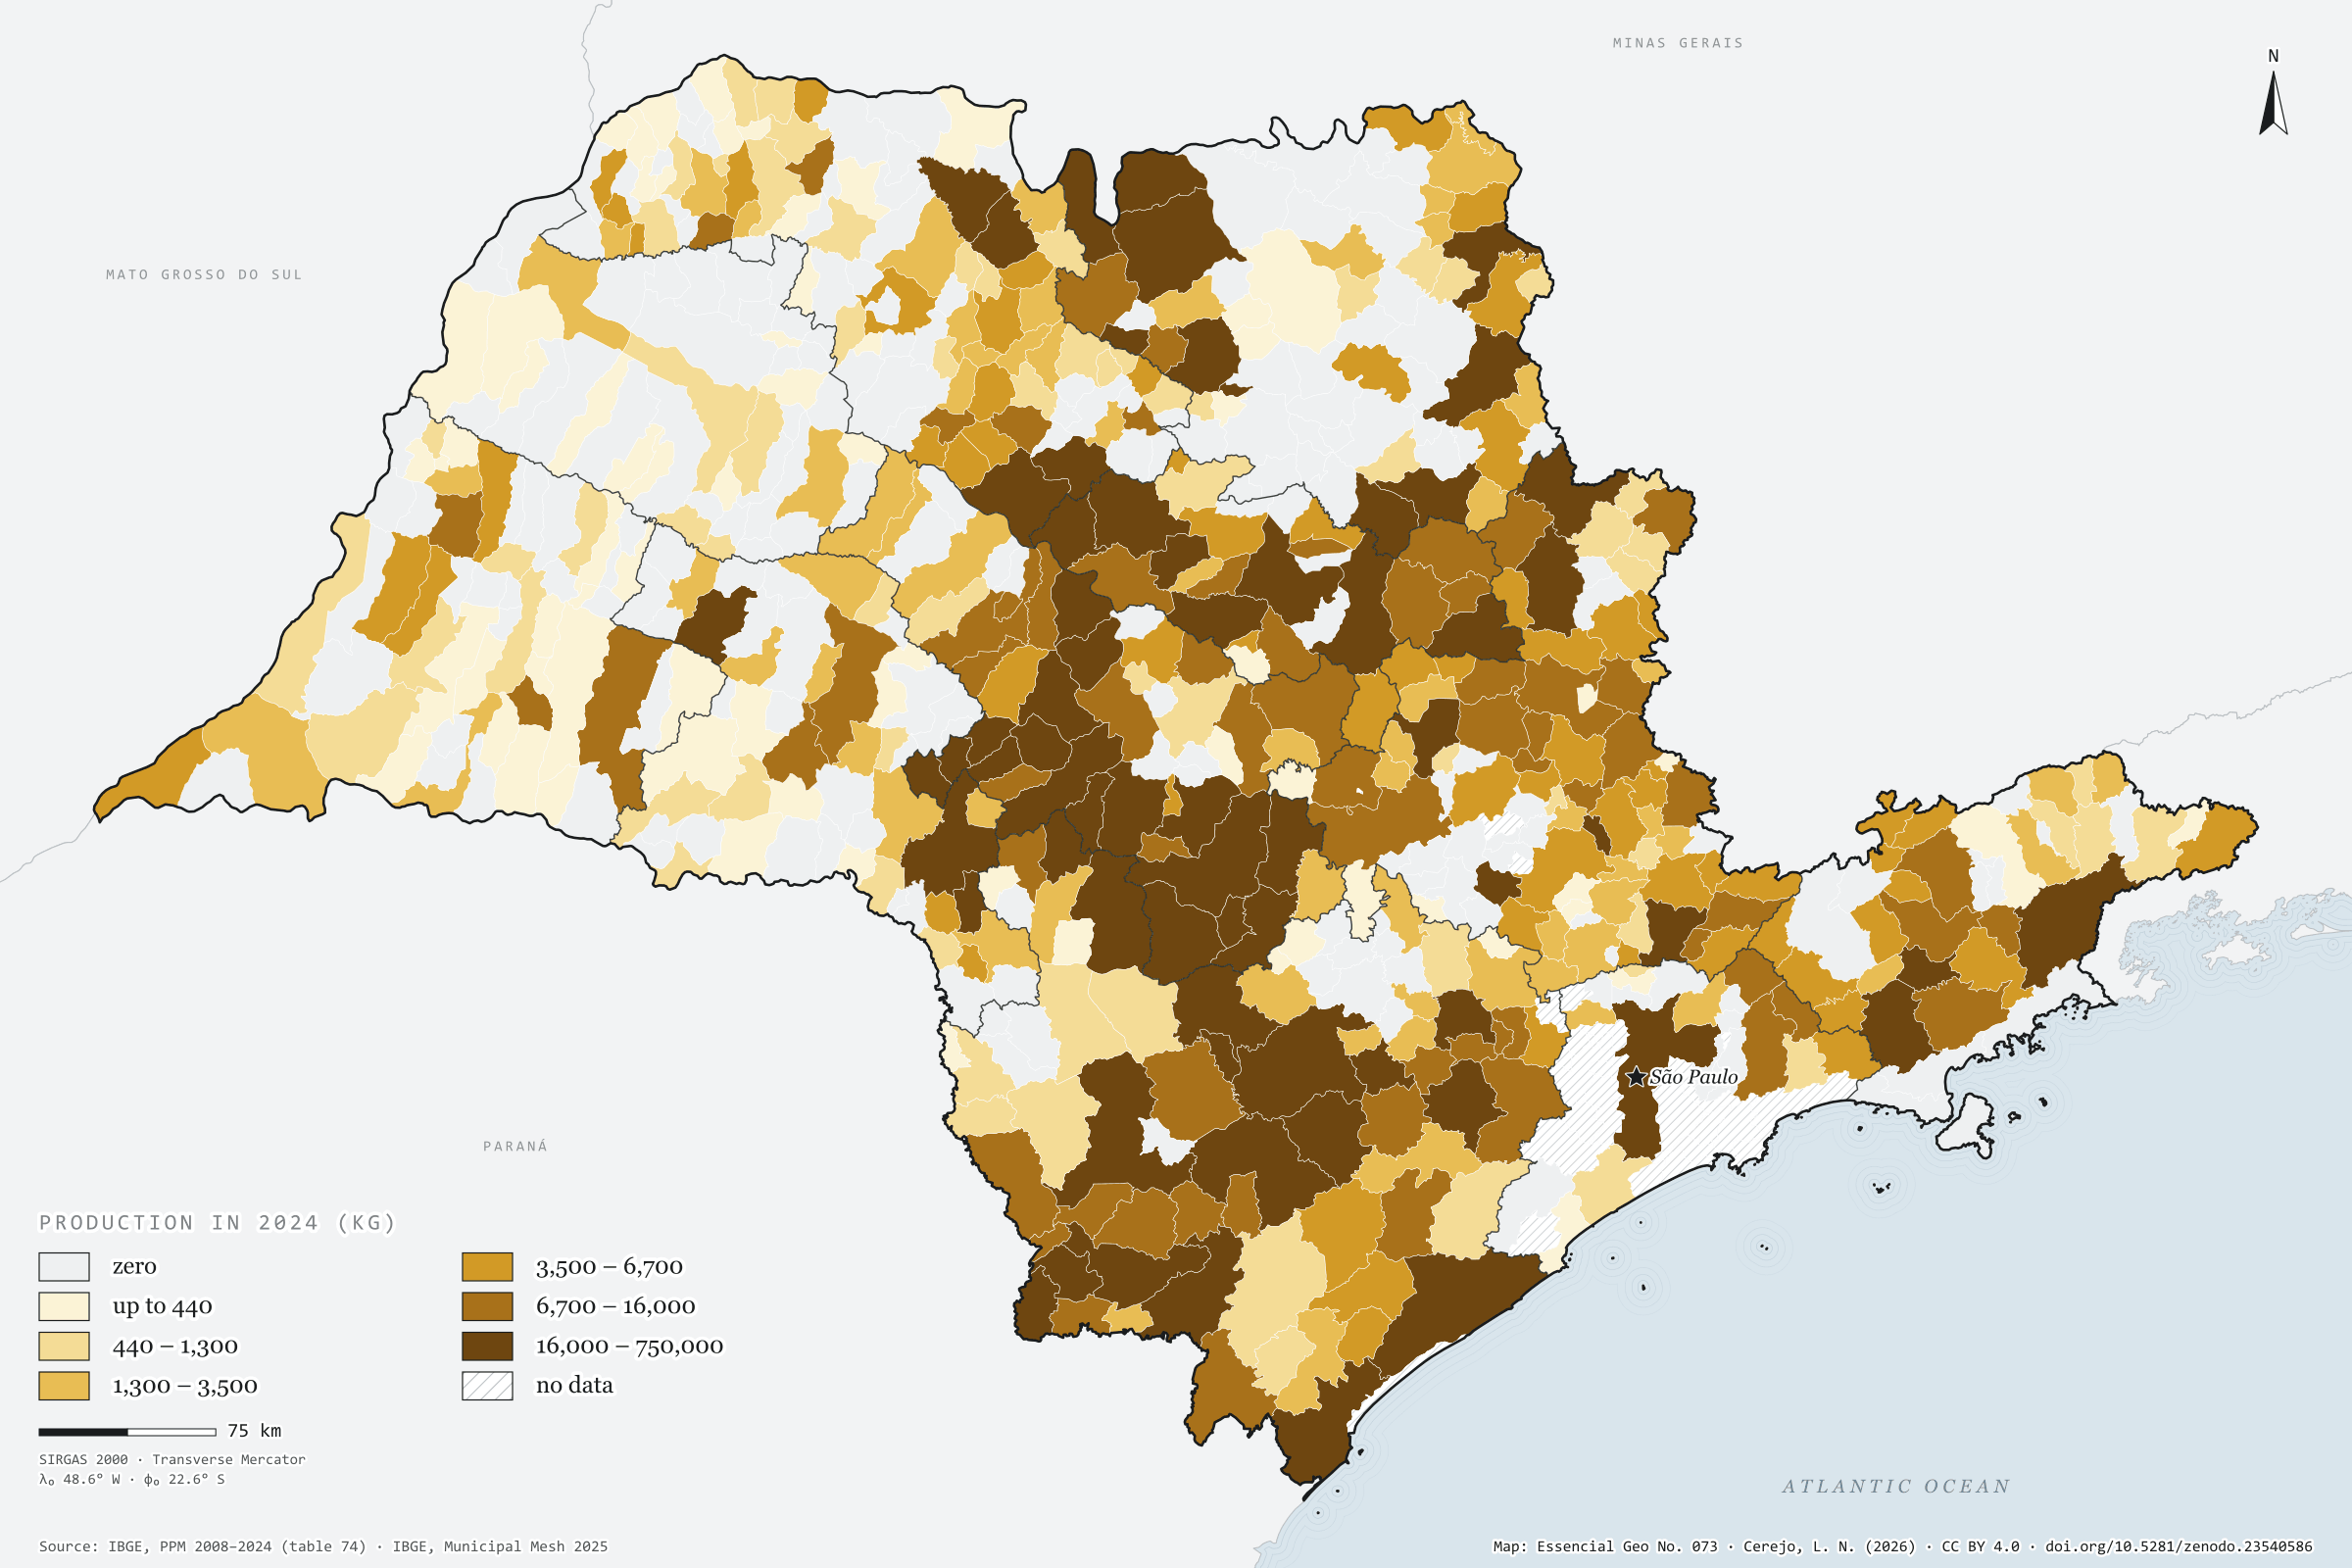
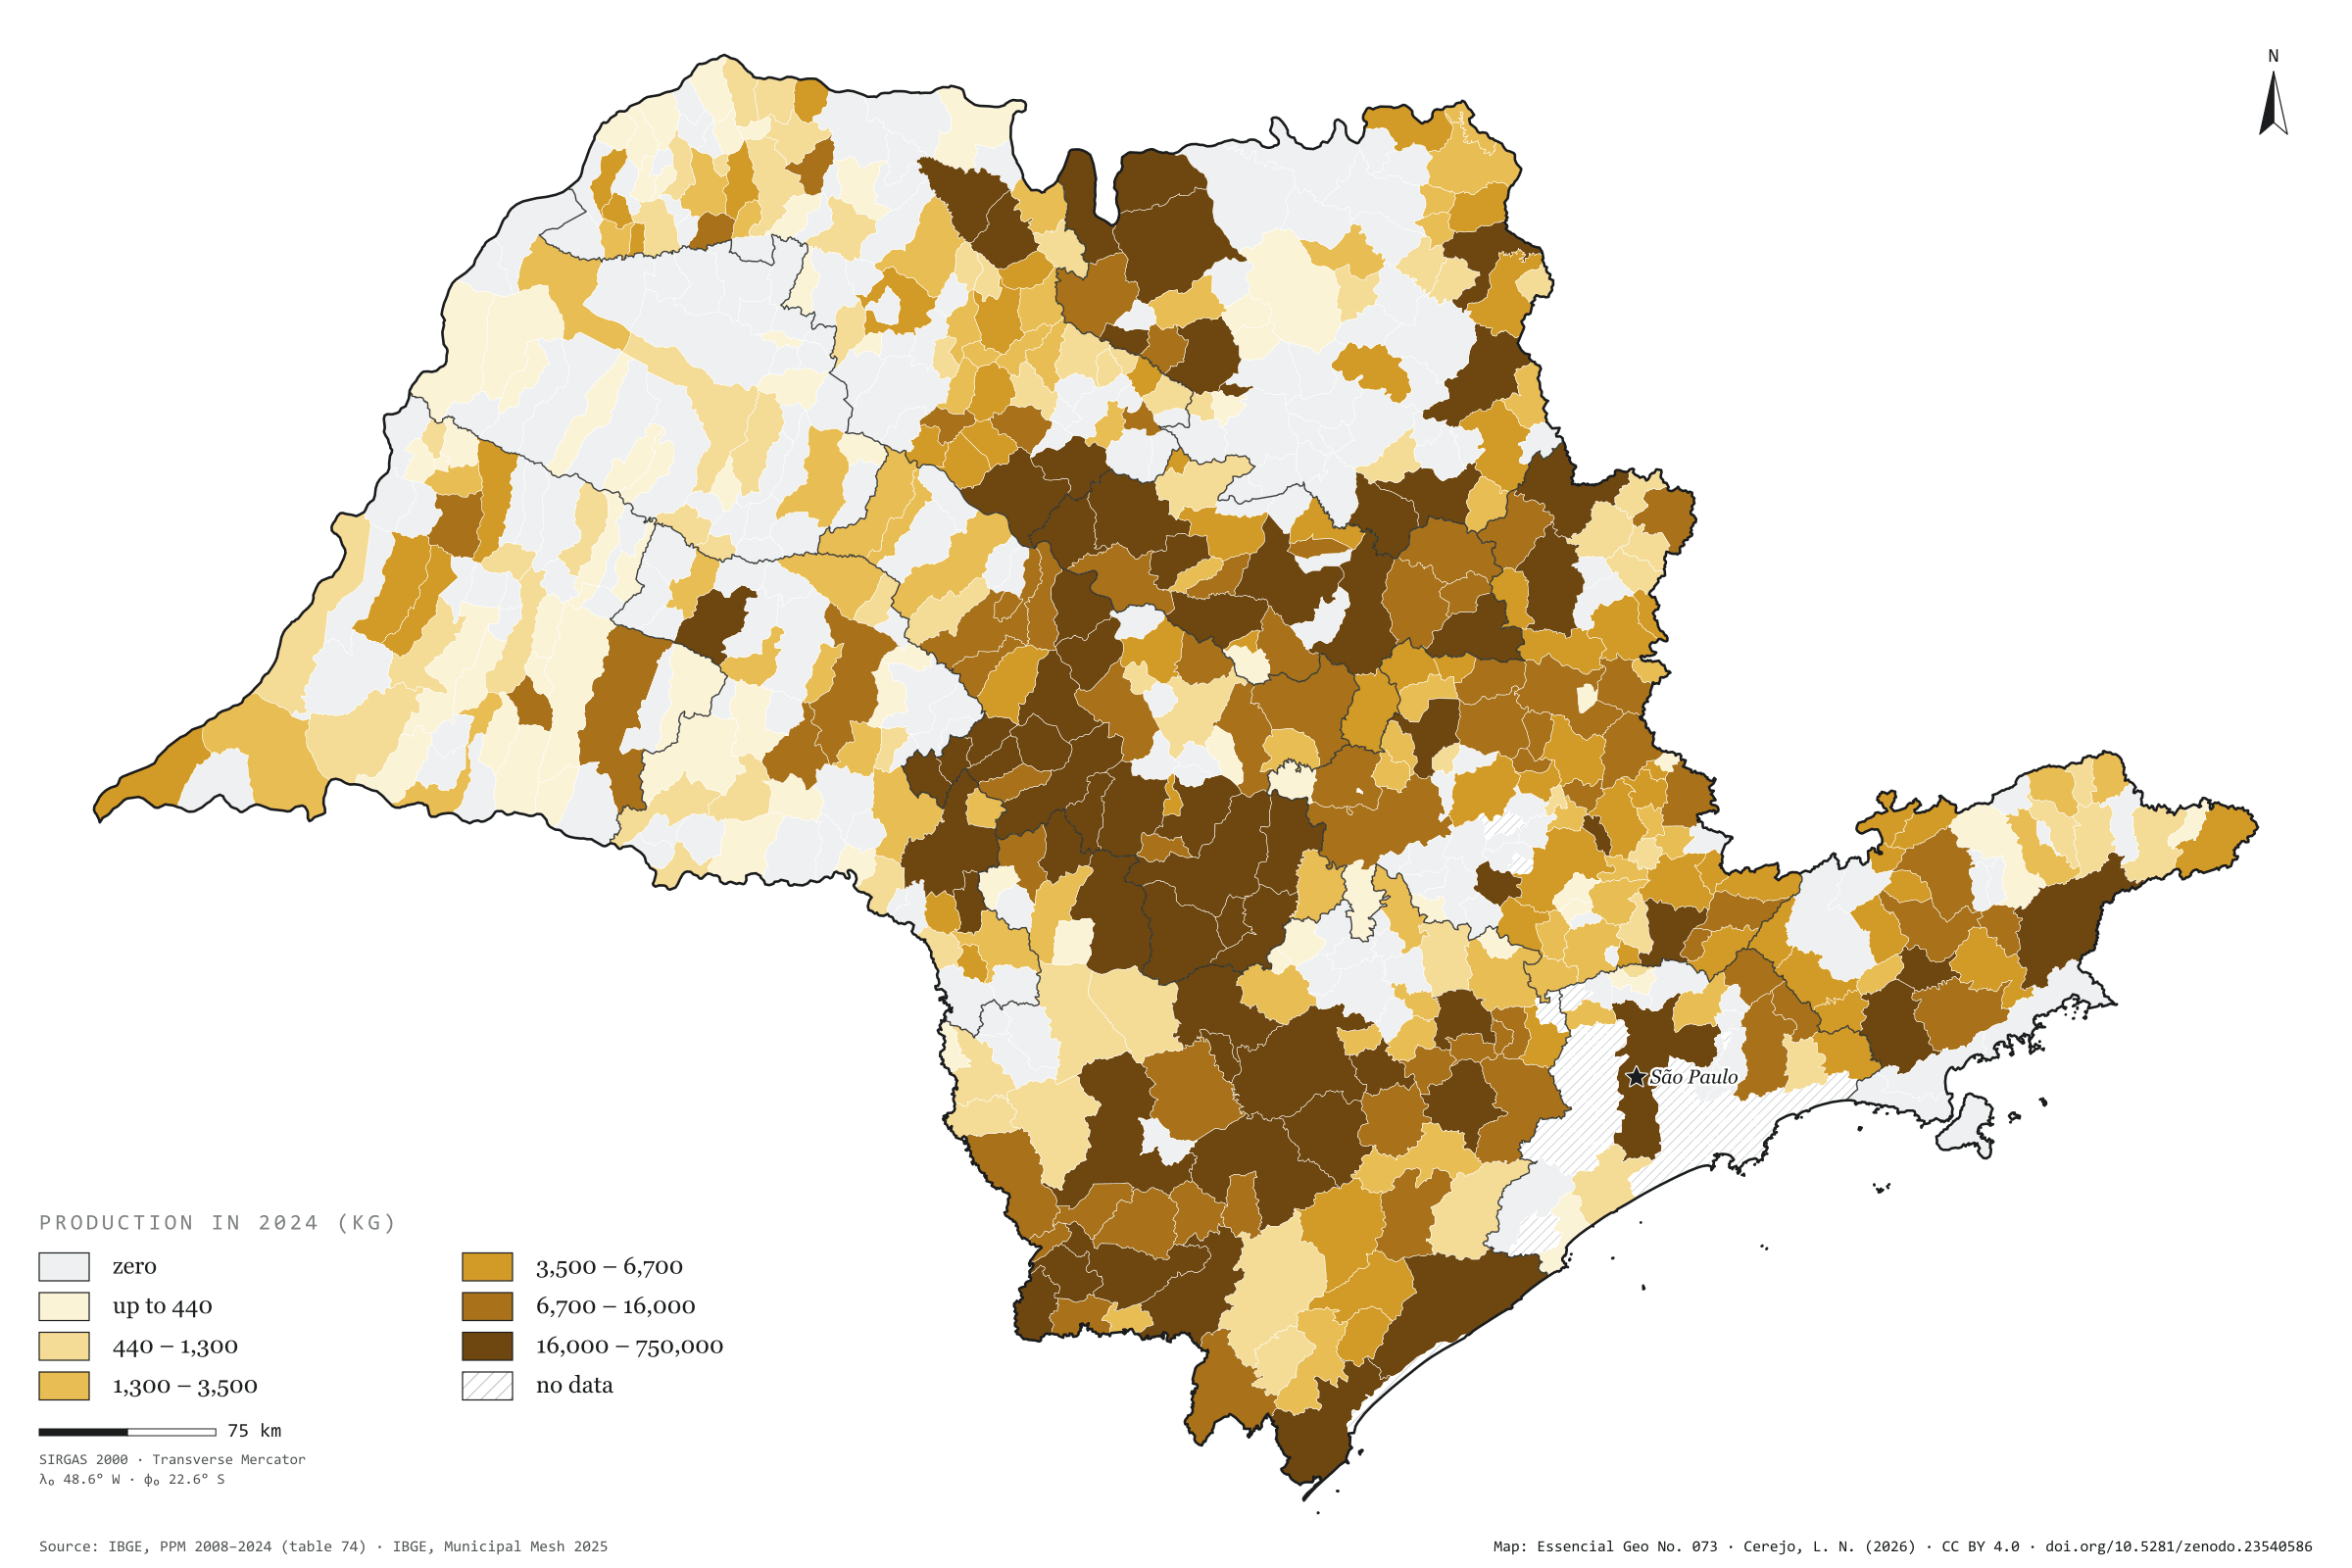
São Paulo produced 6,800 tonnes of honey in 2024, 3.3 times what it produced in 2008. Production grew in almost every year and jumped by 23% from 2023 to 2024 alone. In Brazil the growth was smaller, from 37,800 to 67,300 tonnes, and the state’s share almost doubled, from 5.4% to 10.1%. Honey is concentrated in the centre-south of the state, around Botucatu: the Bauru intermediate region produces 43% of the total. Itatinga, with 750 tonnes, and Botucatu, with 725, add up to 22% of the state’s honey; Cabrália Paulista, Agudos and Capão Bonito follow, and the ten largest produce 49%. The number of producing municipalities is the same in both years, 408: the growth came from those already producing. The west, by contrast, barely shows. Third plate of the collection “Milk, eggs, honey and fish”.
Technical record · downloads · citation
At a glance
Honey in 2024
6,772,329kg
In 2008 it was 2,061,425 kg; the share of Brazil went from 5.4% to 10.1%
Honey in the Bauru intermediate region
43%
2,930,210 kg in 2024
Largest producers in 2024 (kg)
Itatinga750,000
Botucatu725,000
Cabrália Paulista343,000
Agudos317,018
Capão Bonito270,000
Layers
municipiospolygon645 municipalities: honey production in 2008 and 2024 (kg) and data status in 2024
regioes_intermediariaspolygon11 intermediate geographic regions
The map without a frame, with legend, scale, reference system and credit written on it: ready for papers, lectures and slides. In two versions: with the basemap (neighbours and sea) or only the mapped area, on white.
CEREJO, Lucas Nakamura. Mel: mais que triplicou em dezesseis anos. Versão 1.0.0. [S. l.]: Zenodo, 2026. Conjunto de dados. DOI: 10.5281/zenodo.23540586. Disponível em: https://doi.org/10.5281/zenodo.23540586. Acesso em: 10 nov. 2026.
Cerejo, L. N. (2026). Mel: mais que triplicou em dezesseis anos [Honey: More than tripled in sixteen years] (Version 1.0.0) [Data set]. Zenodo. https://doi.org/10.5281/zenodo.23540586
@dataset{cerejo2026_mel_sp,
  author    = {Cerejo, Lucas Nakamura},
  title     = {Mel: Mais que triplicou em dezesseis anos},
  year      = {2026},
  publisher = {Zenodo},
  version   = {1.0.0},
  doi       = {10.5281/zenodo.23540586},
  url       = {https://doi.org/10.5281/zenodo.23540586},
  language  = {portuguese},
  note      = {English title: Honey: More than tripled in sixteen years. Licence CC BY 4.0}
}
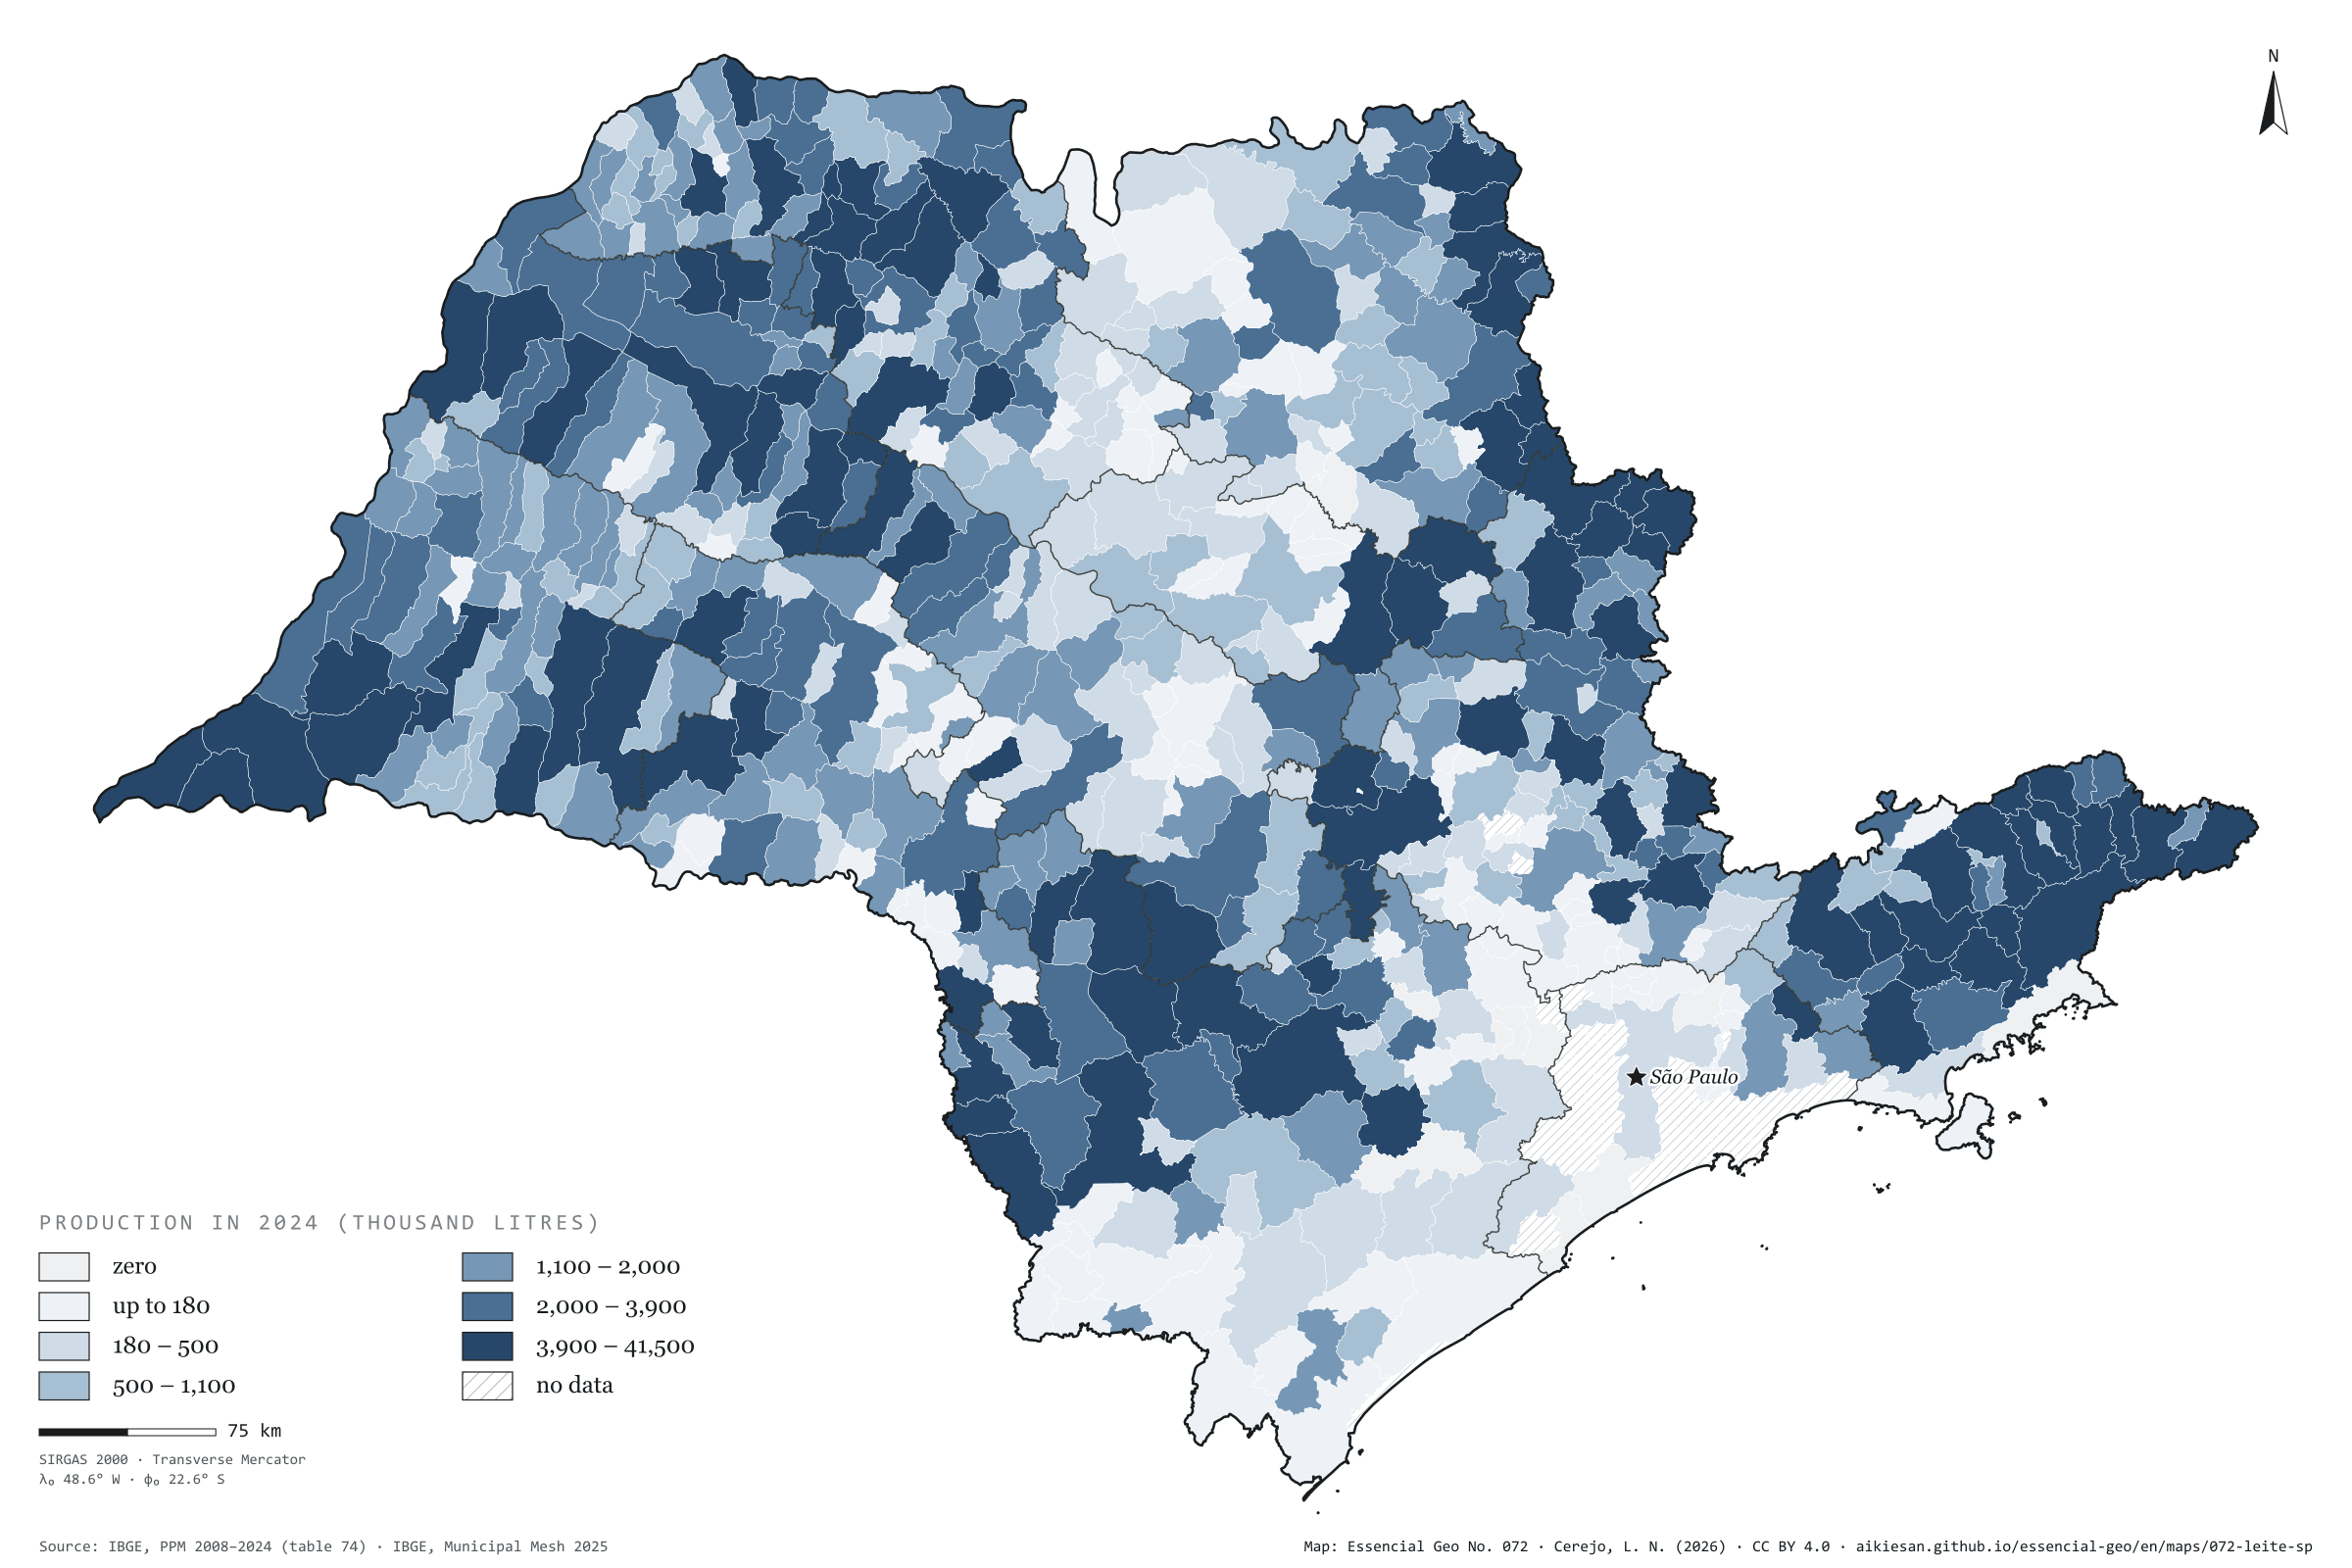
Fig. 072São Paulo state (SP)EPSG:4674Source: IBGE, CP2B (Unicamp)
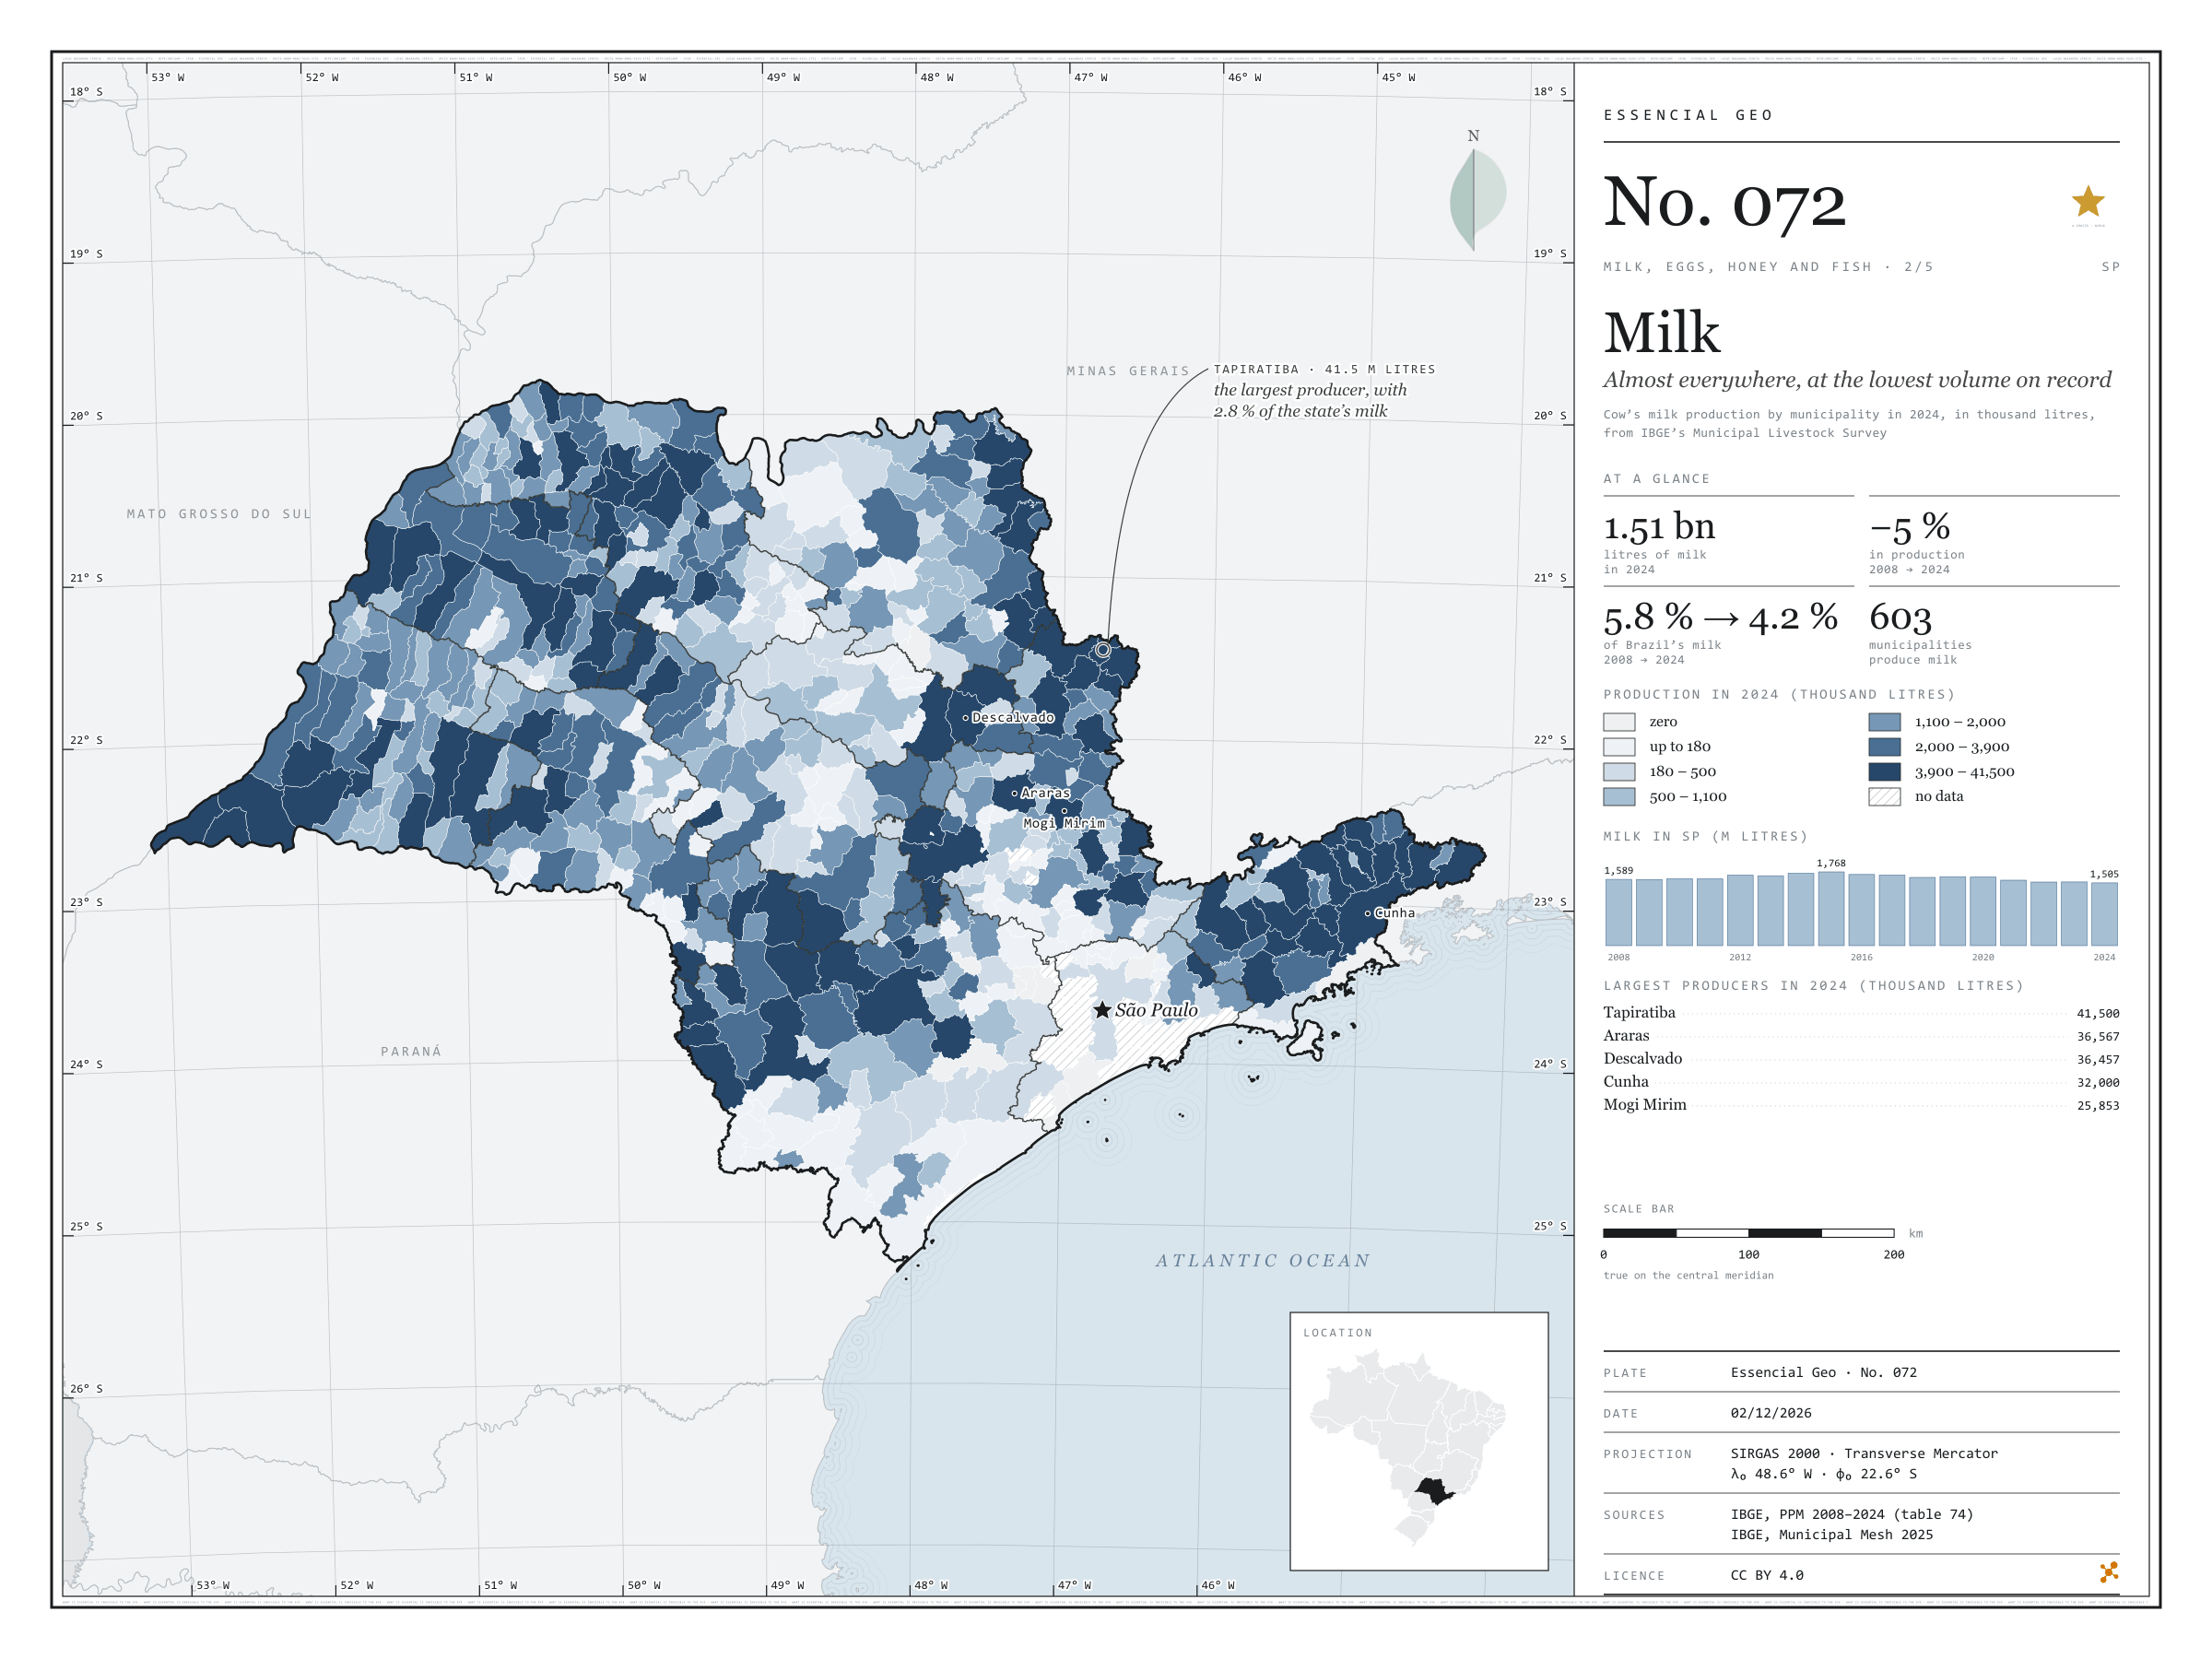
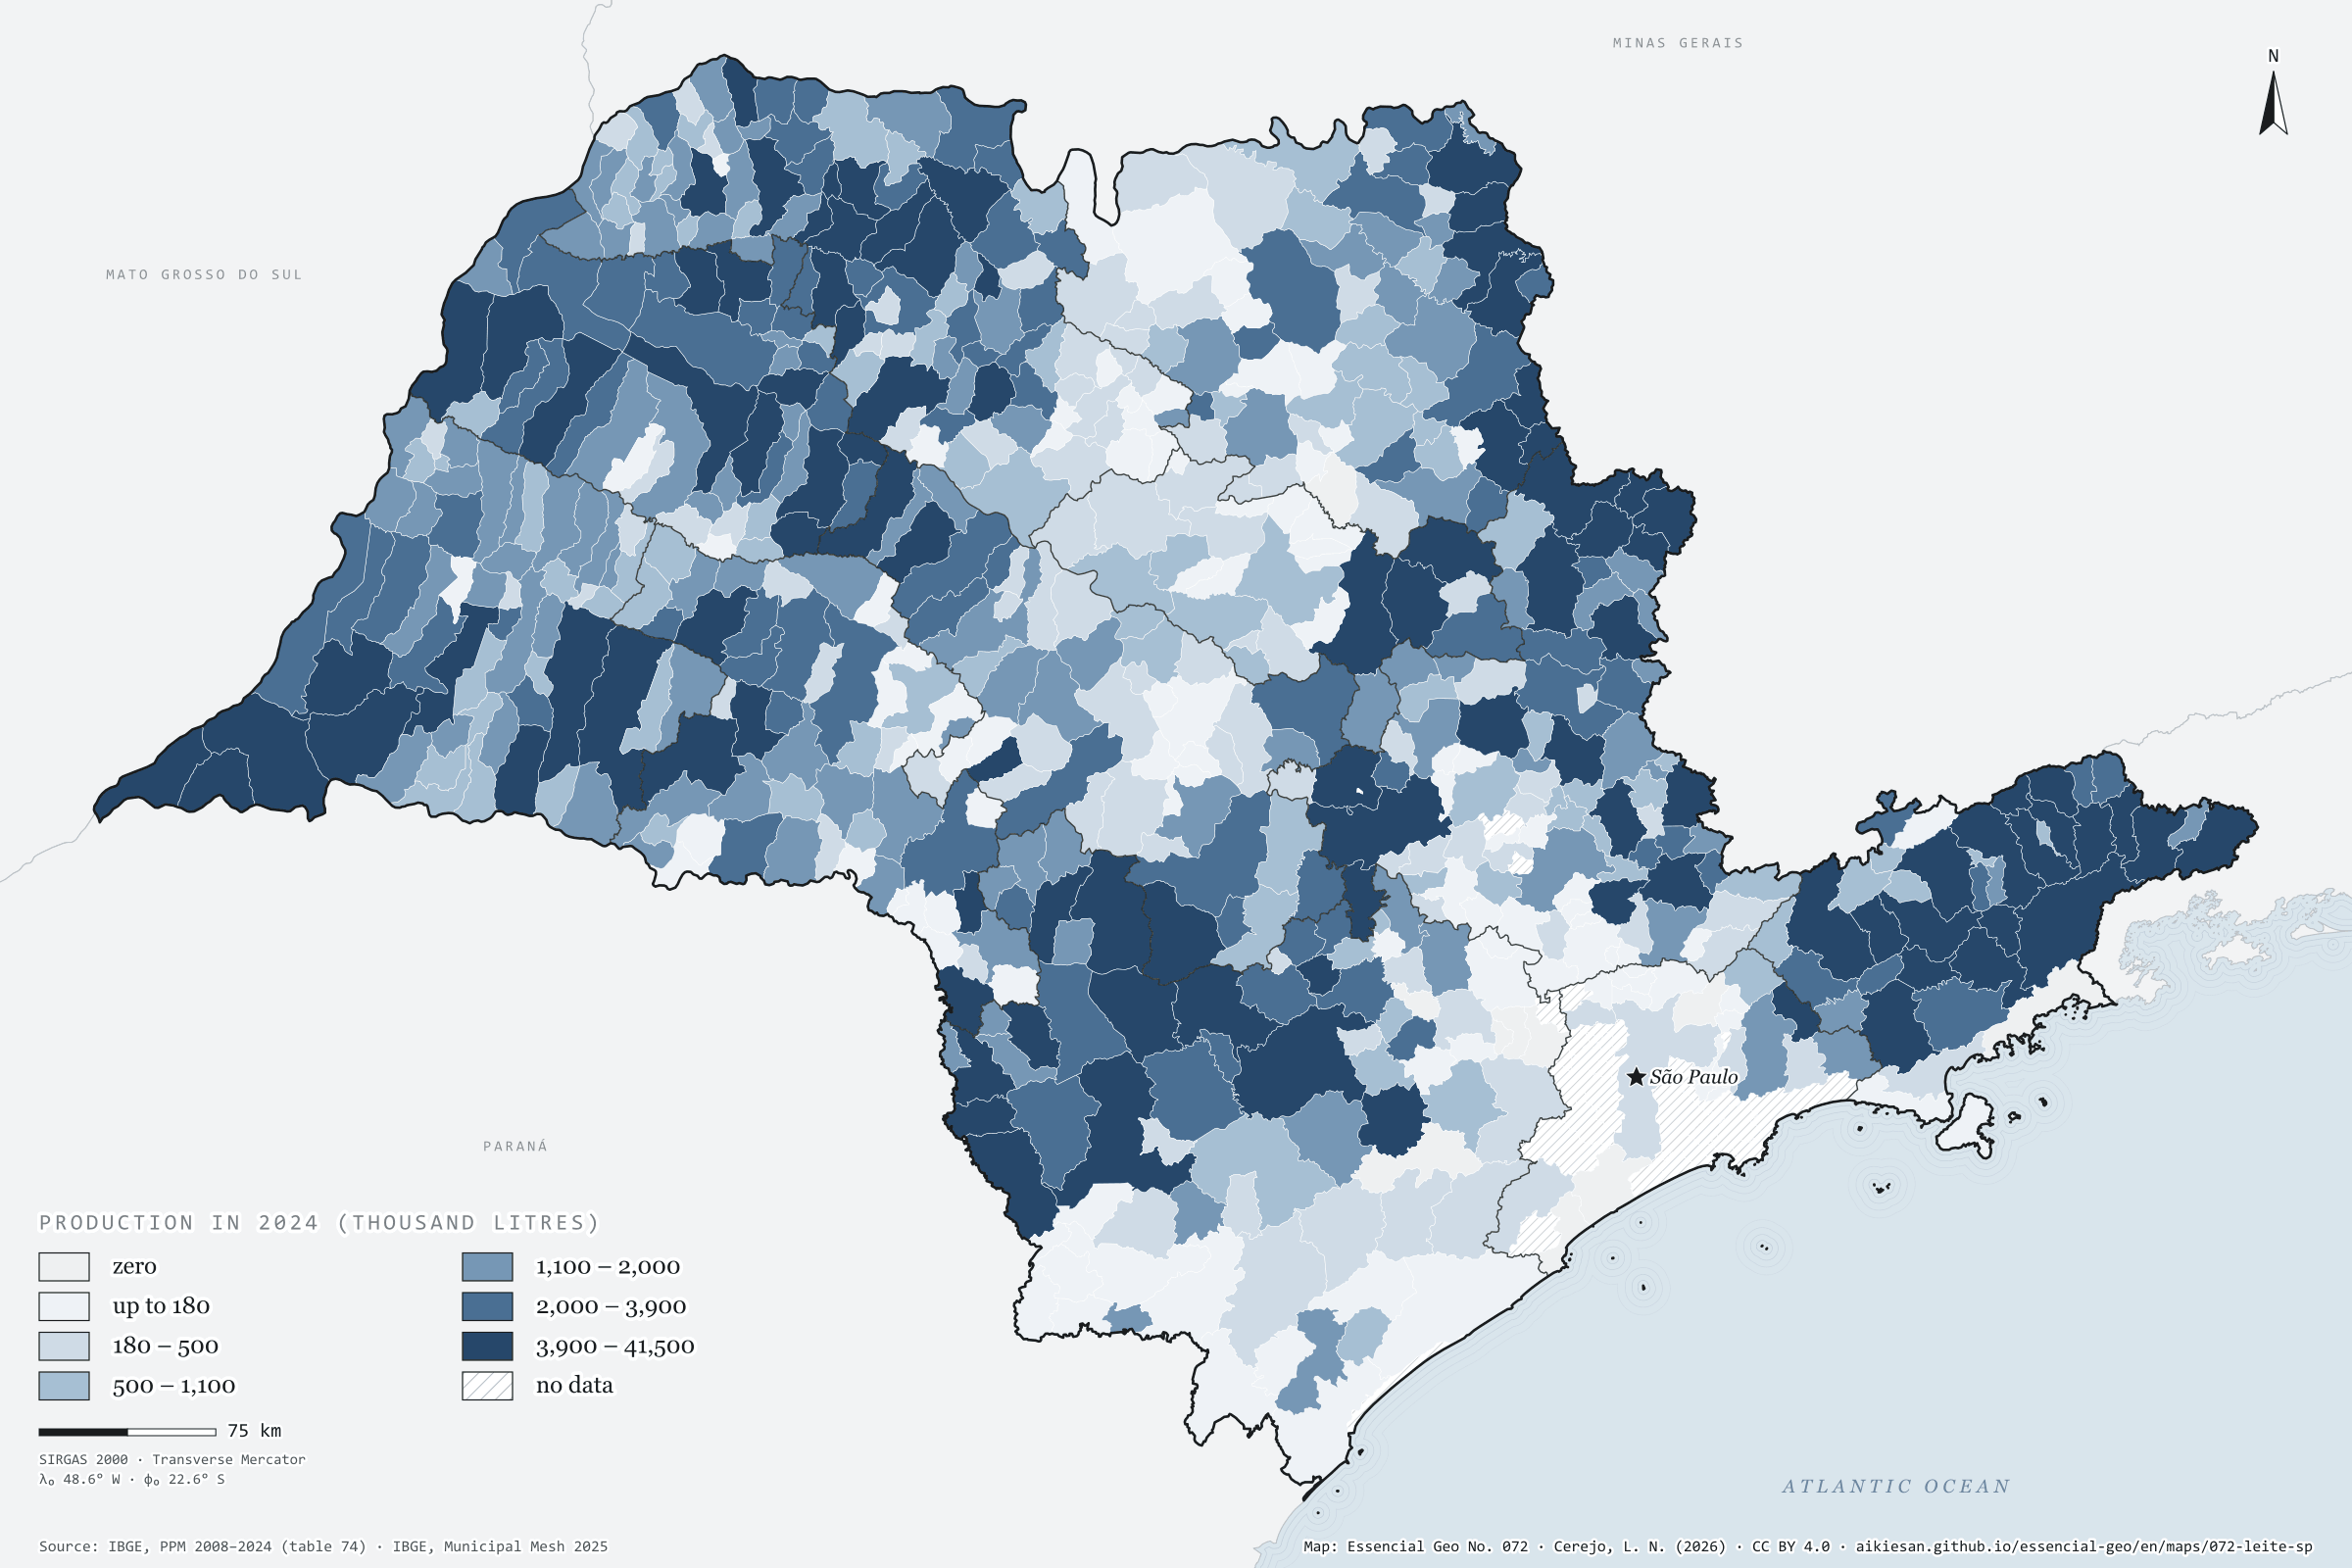
São Paulo produced 1.51 billion litres of cow’s milk in 2024, the lowest volume since 2008. The peak came in 2015, at 1.77 billion; since then production has fallen by 15%, while Brazil’s rose to 35.7 billion litres. The state’s share went from 5.8% in 2008 to 4.2%. Milk is the most widespread animal product in the state: 603 of the 645 municipalities report some, and the ten largest add up to only 18%. Tapiratiba, in the north-east, leads with 41.5 million litres, 2.8% of the total, followed by Araras, Descalvado and Cunha. The darkest tones appear in the west, the north-east and the Paraíba valley, where Cunha and São Luiz do Paraitinga are among the six largest. The Campinas and São José dos Campos regions produce a third of the state’s milk. Second plate of the collection “Milk, eggs, honey and fish”.
Technical record · downloads · citation
At a glance
Cow’s milk in 2024
1,505,077thousand litres
In 2008 it was 1,588,943 thousand litres, and at the 2015 peak 1,768,416; the share of Brazil went from 5.8% to 4.2%
Municipalities producing milk
603
Out of 645; the ten largest account for 17.7% of the total
Largest producers in 2024 (thousand litres)
Tapiratiba41,500
Araras36,567
Descalvado36,457
Cunha32,000
Mogi Mirim25,853
Layers
municipiospolygon645 municipalities: milk production in 2008 and 2024 (thousand litres), data status in 2024 and dairy-cattle biomethane
regioes_intermediariaspolygon11 intermediate geographic regions
Cow’s milk production from PPM 2024 by municipality in six quantile classes; state series from 2008 to 2024; biomethane potential of dairy-cattle manure (in the files only) at the accessible level of the CP2B method.
The map without a frame, with legend, scale, reference system and credit written on it: ready for papers, lectures and slides. In two versions: with the basemap (neighbours and sea) or only the mapped area, on white.
CEREJO, Lucas Nakamura. Leite: em quase todo o estado, no menor volume da série. Versão 1.0.0. [S. l.]: Essencial, 2026. Conjunto de dados. Disponível em: https://aikiesan.github.io/essencial-geo/en/maps/072-leite-sp/. Acesso em: 10 nov. 2026.
Cerejo, L. N. (2026). Leite: em quase todo o estado, no menor volume da série [Milk: Almost everywhere, at the lowest volume on record] (Version 1.0.0) [Data set]. Essencial. https://aikiesan.github.io/essencial-geo/en/maps/072-leite-sp/
@dataset{cerejo2026_leite_sp,
  author    = {Cerejo, Lucas Nakamura},
  title     = {Leite: Em quase todo o estado, no menor volume da série},
  year      = {2026},
  publisher = {Essencial},
  version   = {1.0.0},
  url       = {https://aikiesan.github.io/essencial-geo/en/maps/072-leite-sp/},
  language  = {portuguese},
  note      = {English title: Milk: Almost everywhere, at the lowest volume on record. Licence CC BY 4.0}
}
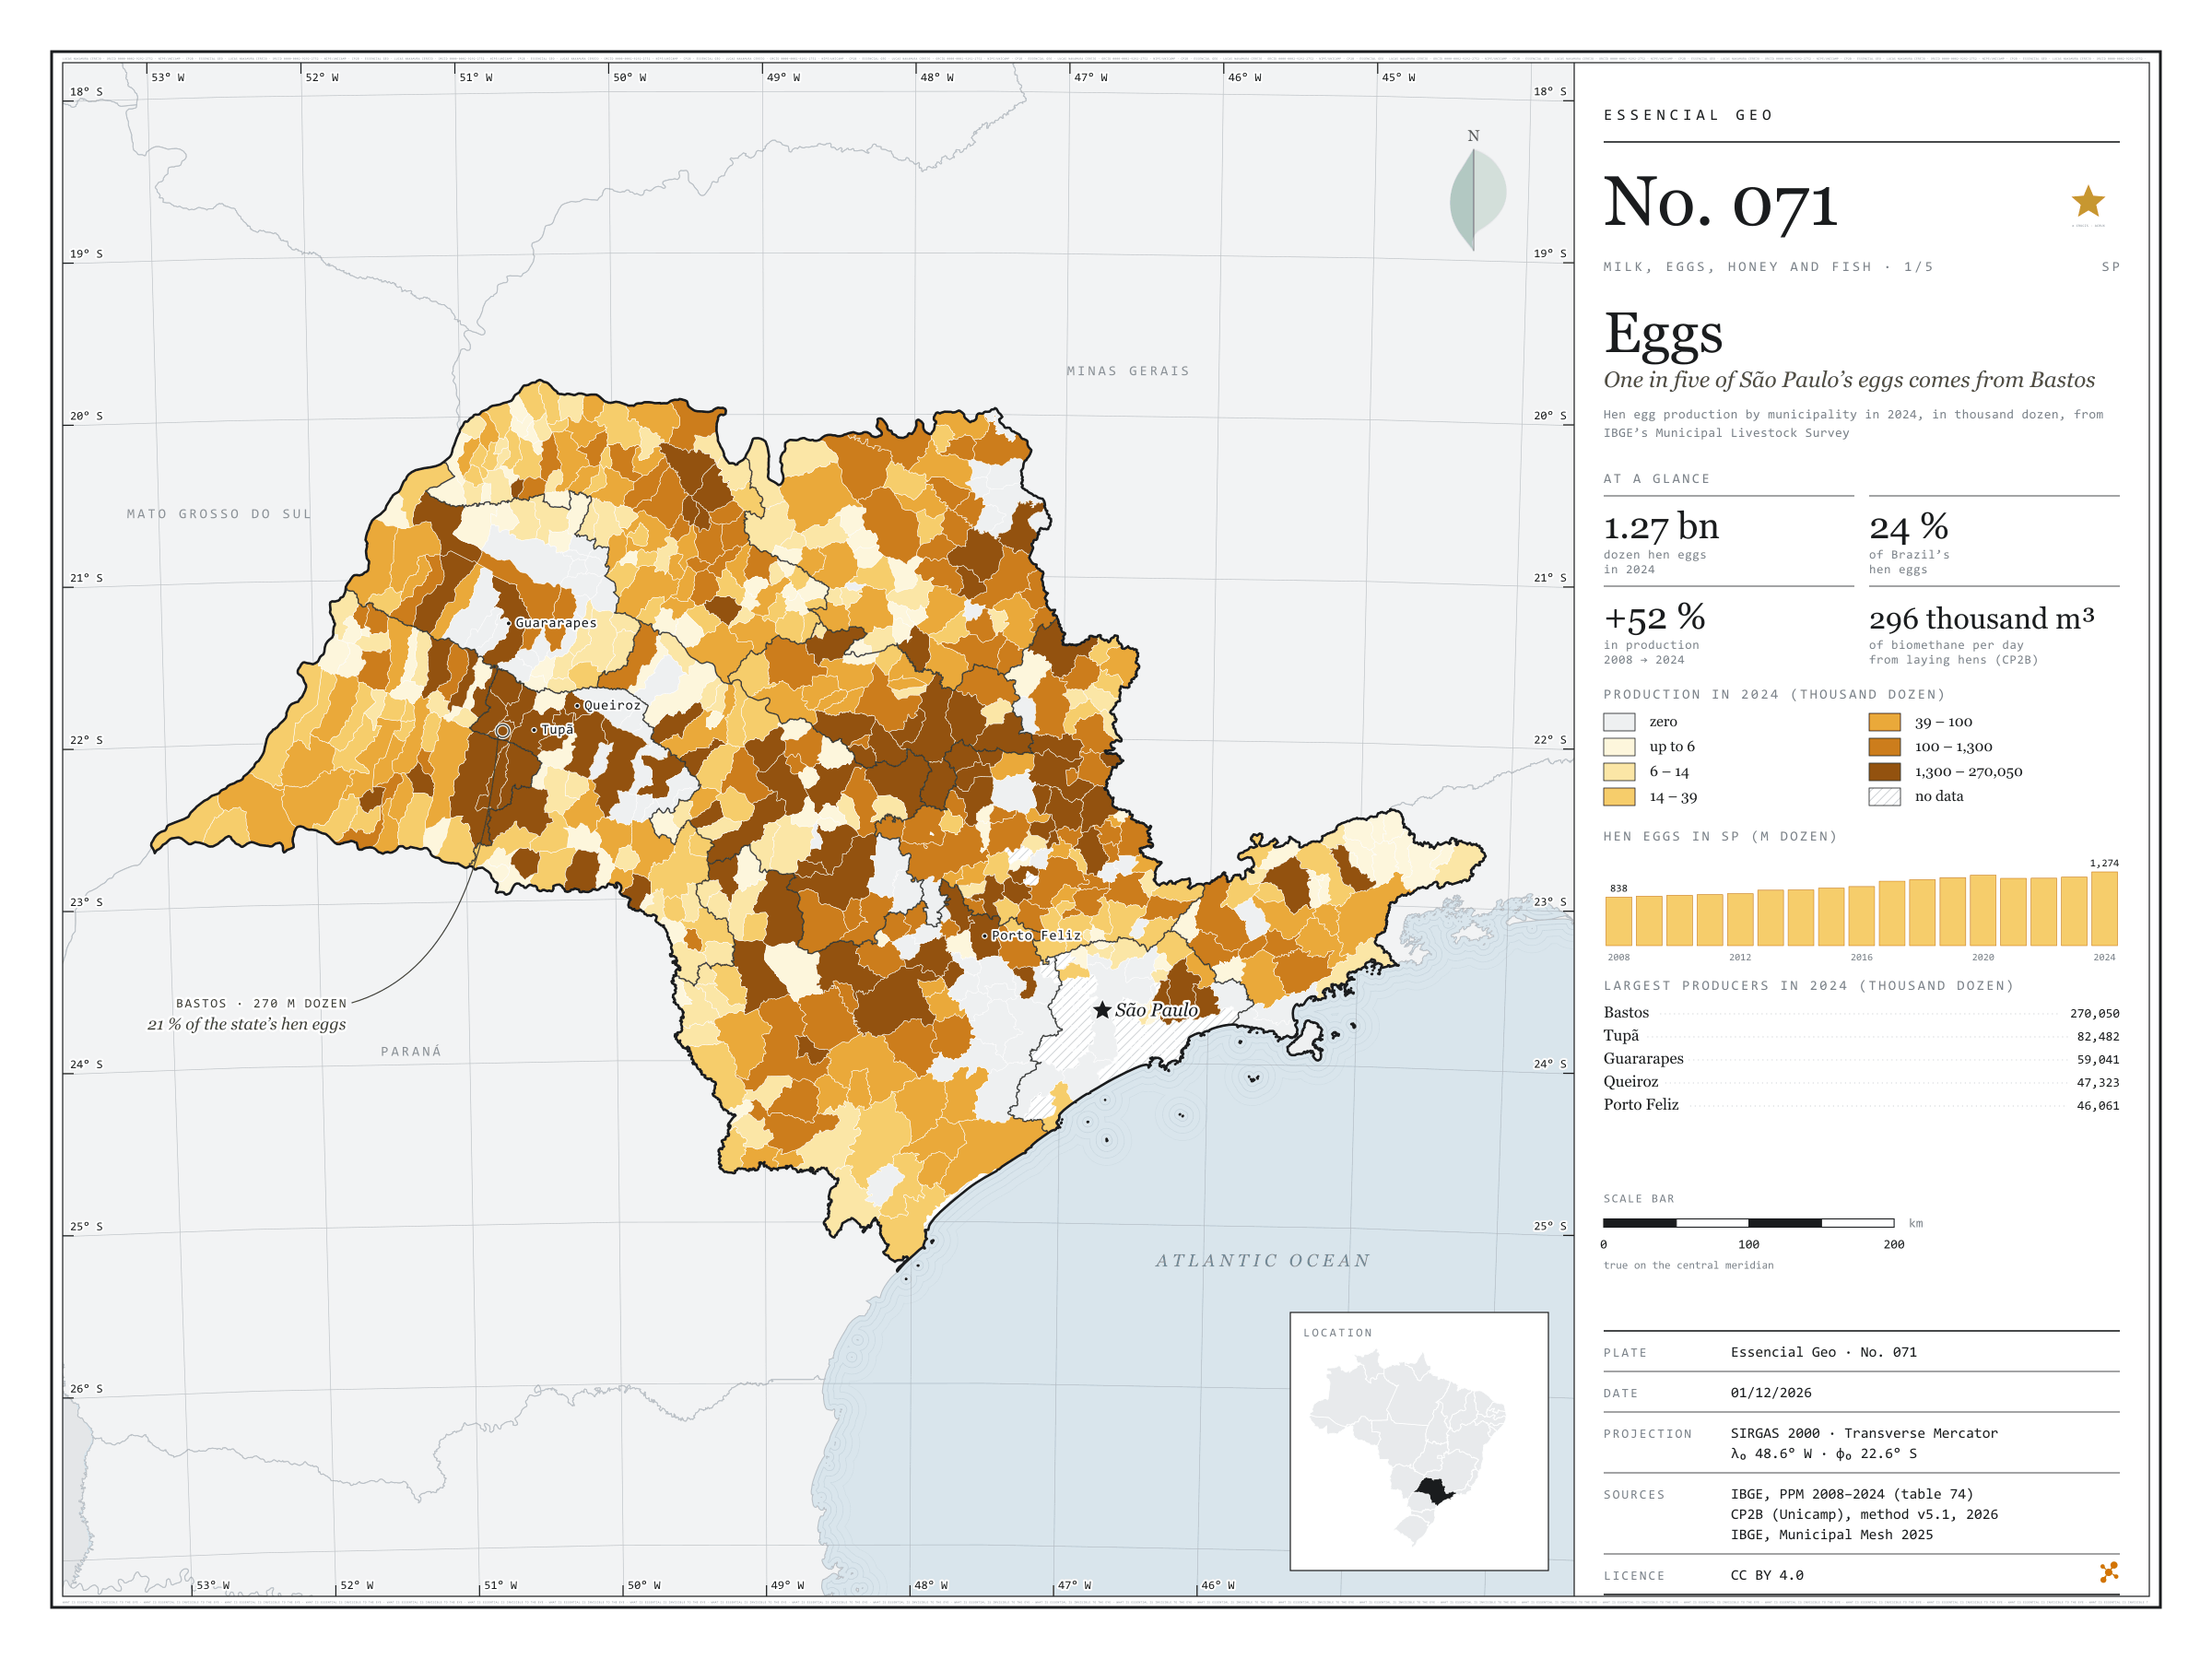
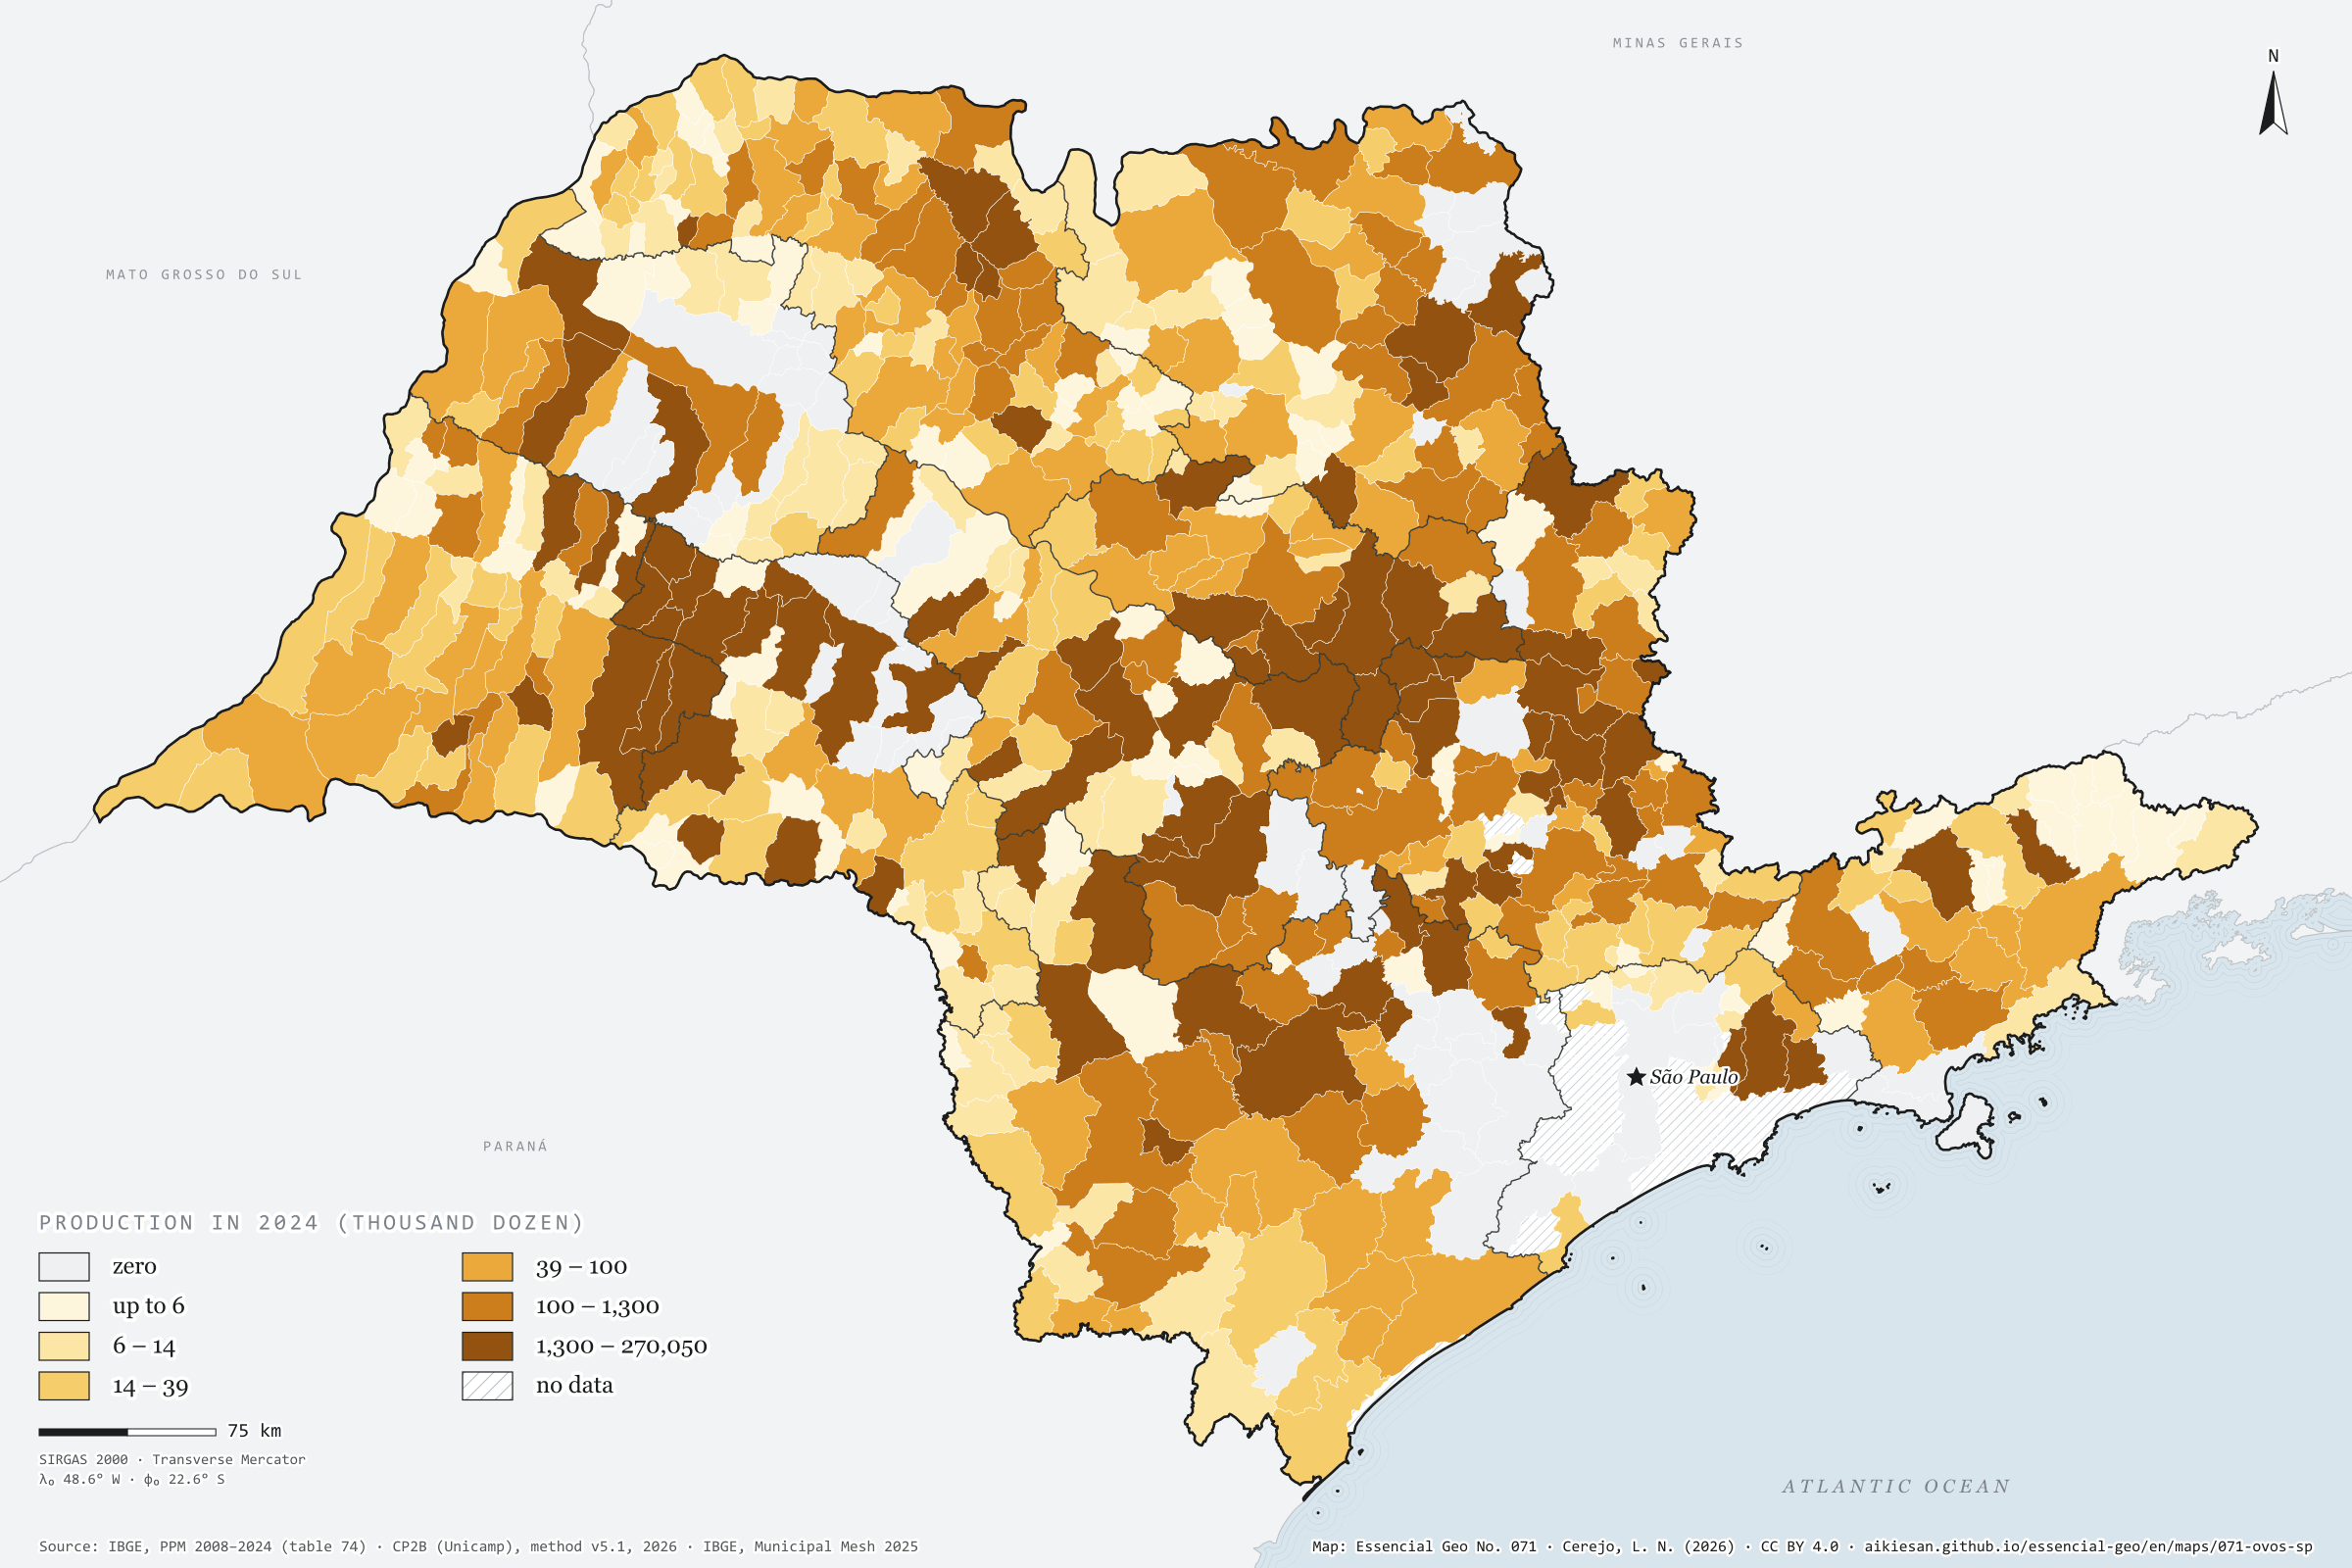
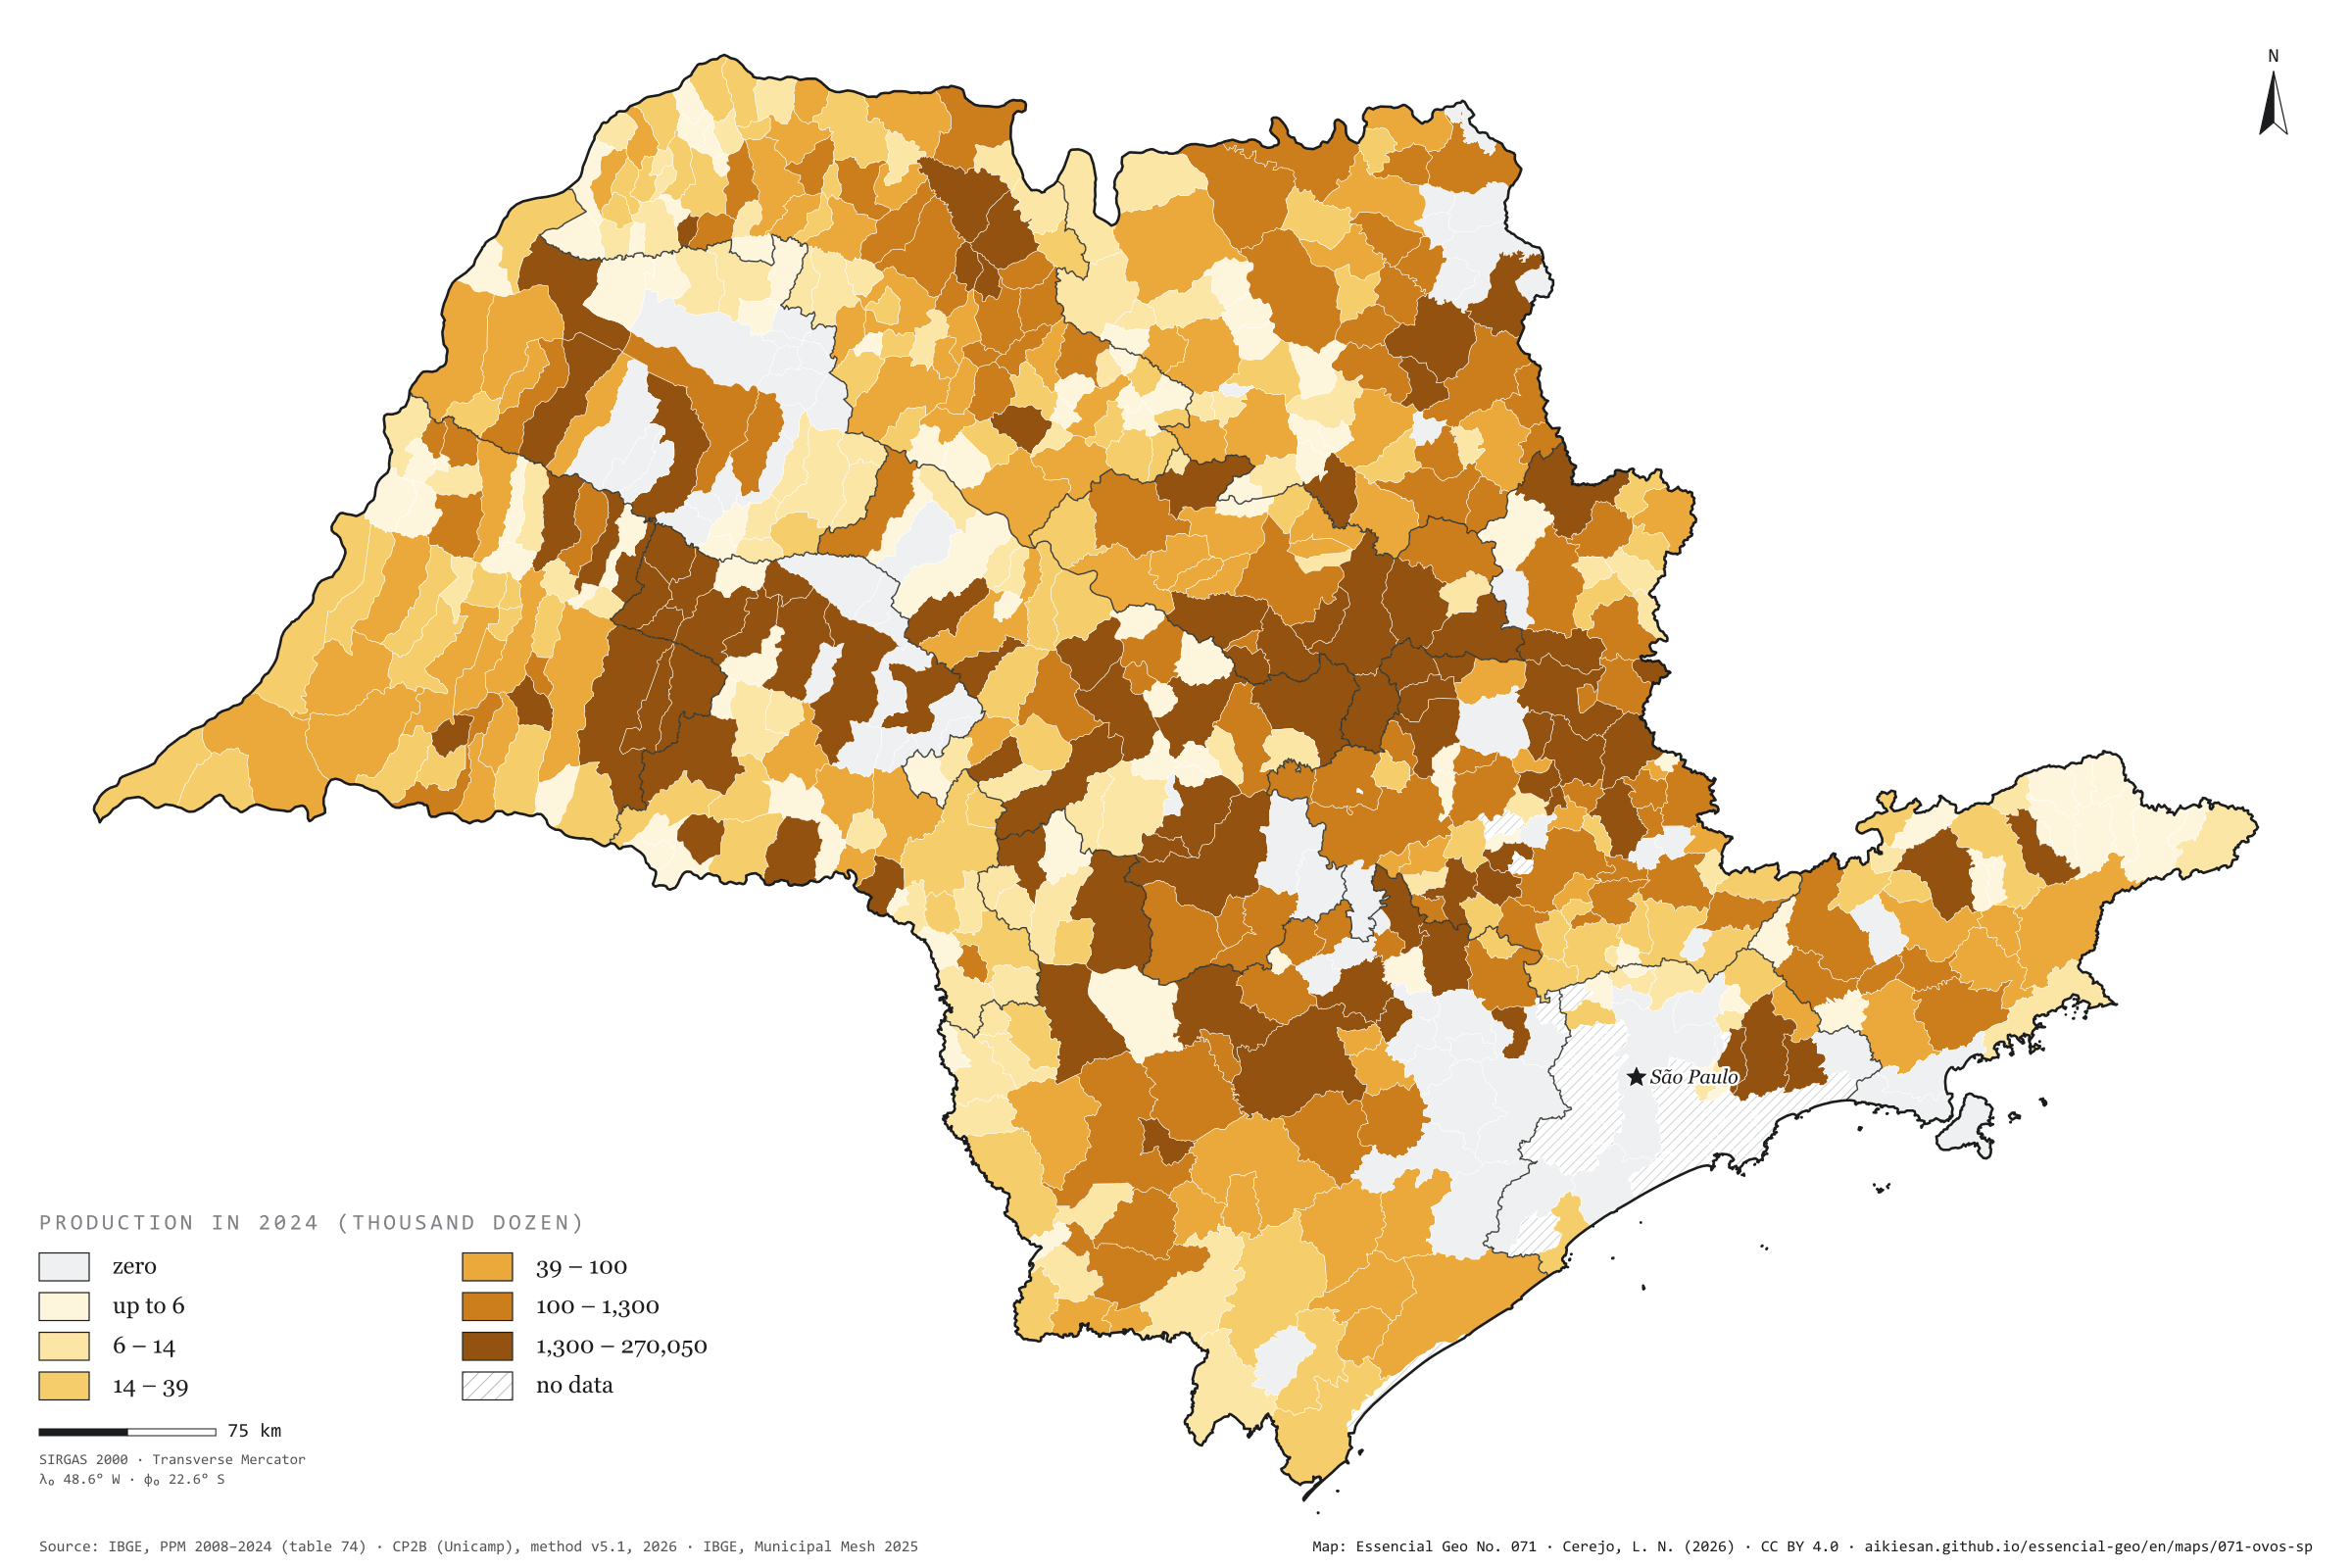
Fig. 071São Paulo state (SP)EPSG:4674Source: IBGE, CP2B (Unicamp)
São Paulo produced 1.27 billion dozen hen eggs in 2024, 52% more than in 2008 and 23.6% of Brazil’s total. Bastos alone, in the Marília region, produced 270 million dozen, one in five of the state’s eggs. With Tupã and its neighbours, the Marília region accounts for 42% of production, and the ten largest municipalities for 54%. Even so, 540 municipalities report some production, and eggs appear across almost the whole map; only Greater São Paulo and the coast lack data. Laying-hen manure is also a residue: by the CP2B method it could yield 296,000 m³ of biomethane a day across the state, 62,600 of them in Bastos. Quail eggs went the other way, falling from 82.8 to 37.3 million dozen. First plate of the collection “Milk, eggs, honey and fish”.
Technical record · downloads · citation
At a glance
Hen eggs in 2024
1,274,158thousand dozen
In 2008 it was 837,888 thousand dozen; the share of Brazil went from 27.3% to 23.6%
Biomethane from laying-hen manure
296,316m³/day
Accessible level of the CP2B method, reference scenario; 62,572 m³/day in Bastos
Largest producers in 2024 (thousand dozen)
Bastos270,050
Tupã82,482
Guararapes59,041
Queiroz47,323
Porto Feliz46,061
Layers
municipiospolygon645 municipalities: hen egg production in 2008 and 2024 (thousand dozen), data status in 2024 and laying-hen biomethane
regioes_intermediariaspolygon11 intermediate geographic regions
Hen egg production from PPM 2024 by municipality in six quantile classes; state series from 2008 to 2024; biomethane potential of laying-hen manure at the accessible level of the CP2B method.
The map without a frame, with legend, scale, reference system and credit written on it: ready for papers, lectures and slides. In two versions: with the basemap (neighbours and sea) or only the mapped area, on white.
CEREJO, Lucas Nakamura. Ovos: um em cada cinco ovos paulistas sai de Bastos. Versão 1.0.0. [S. l.]: Essencial, 2026. Conjunto de dados. Disponível em: https://aikiesan.github.io/essencial-geo/en/maps/071-ovos-sp/. Acesso em: 10 nov. 2026.
Cerejo, L. N. (2026). Ovos: um em cada cinco ovos paulistas sai de Bastos [Eggs: One in five of São Paulo’s eggs comes from Bastos] (Version 1.0.0) [Data set]. Essencial. https://aikiesan.github.io/essencial-geo/en/maps/071-ovos-sp/
@dataset{cerejo2026_ovos_sp,
  author    = {Cerejo, Lucas Nakamura},
  title     = {Ovos: Um em cada cinco ovos paulistas sai de Bastos},
  year      = {2026},
  publisher = {Essencial},
  version   = {1.0.0},
  url       = {https://aikiesan.github.io/essencial-geo/en/maps/071-ovos-sp/},
  language  = {portuguese},
  note      = {English title: Eggs: One in five of São Paulo’s eggs comes from Bastos. Licence CC BY 4.0}
}
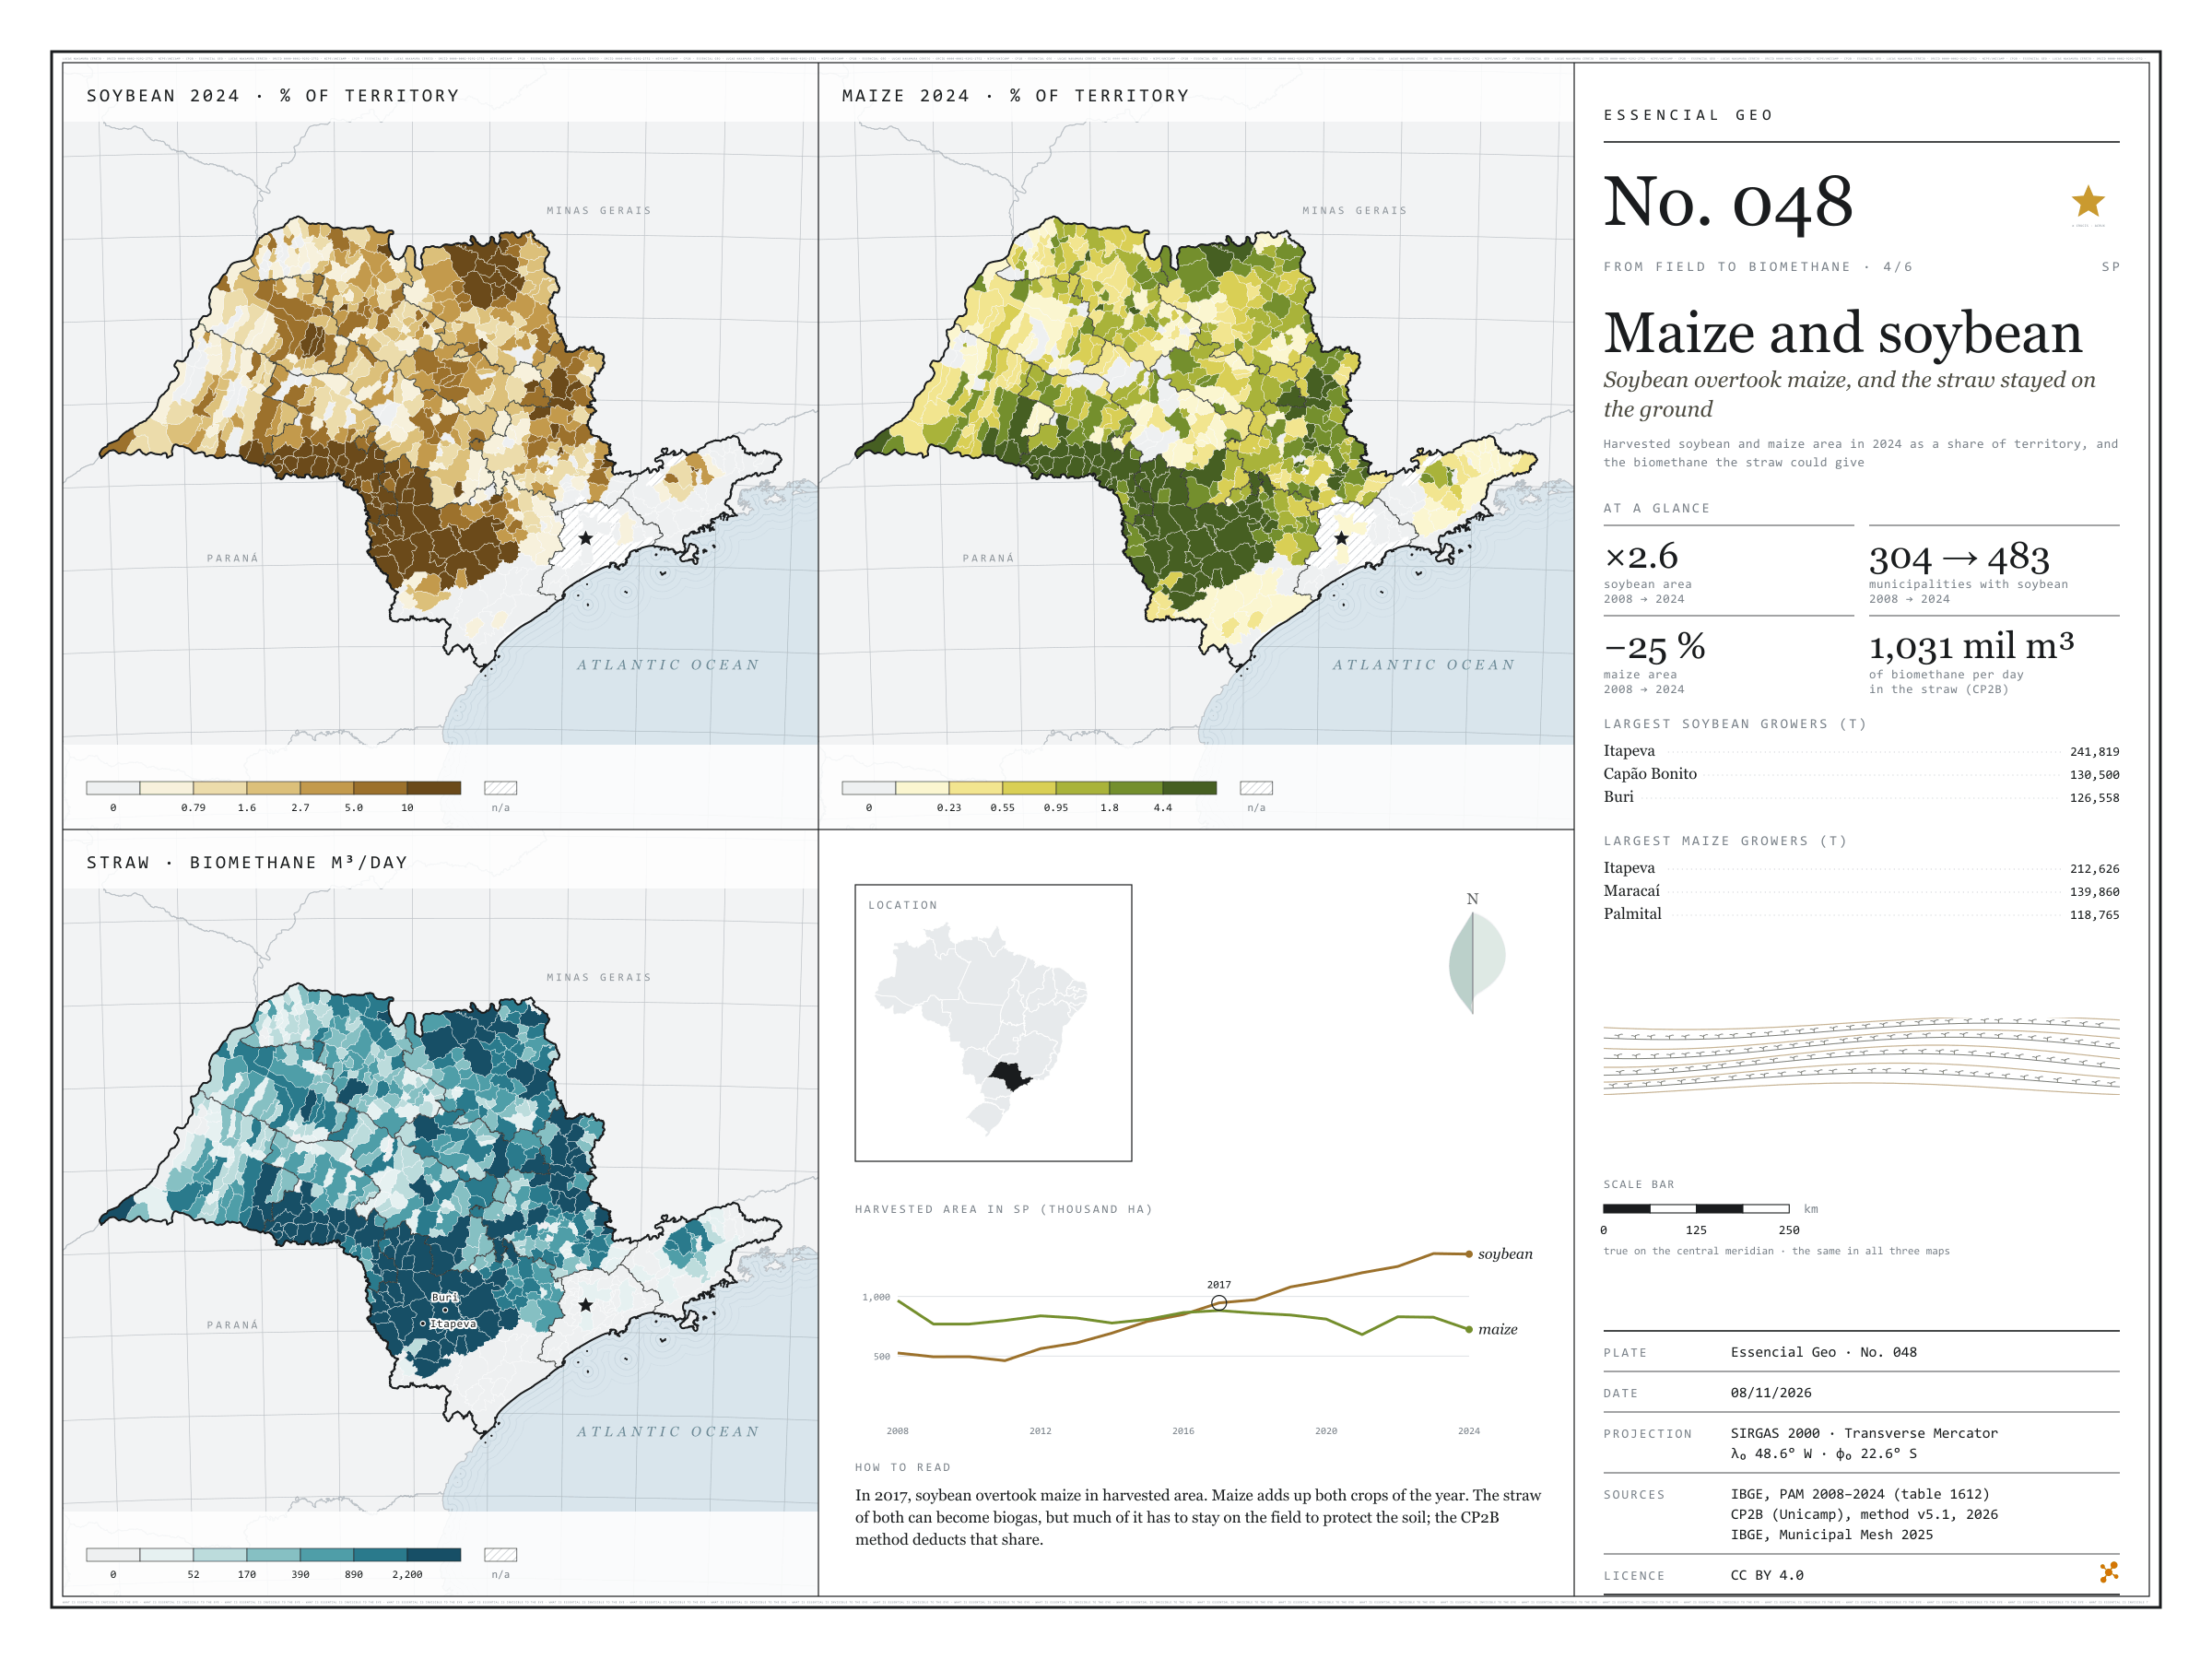
Soybean overtook maize, and the straw stayed on the ground
Fig. 048São Paulo state (SP)EPSG:4674Source: IBGE, CP2B (Unicamp)
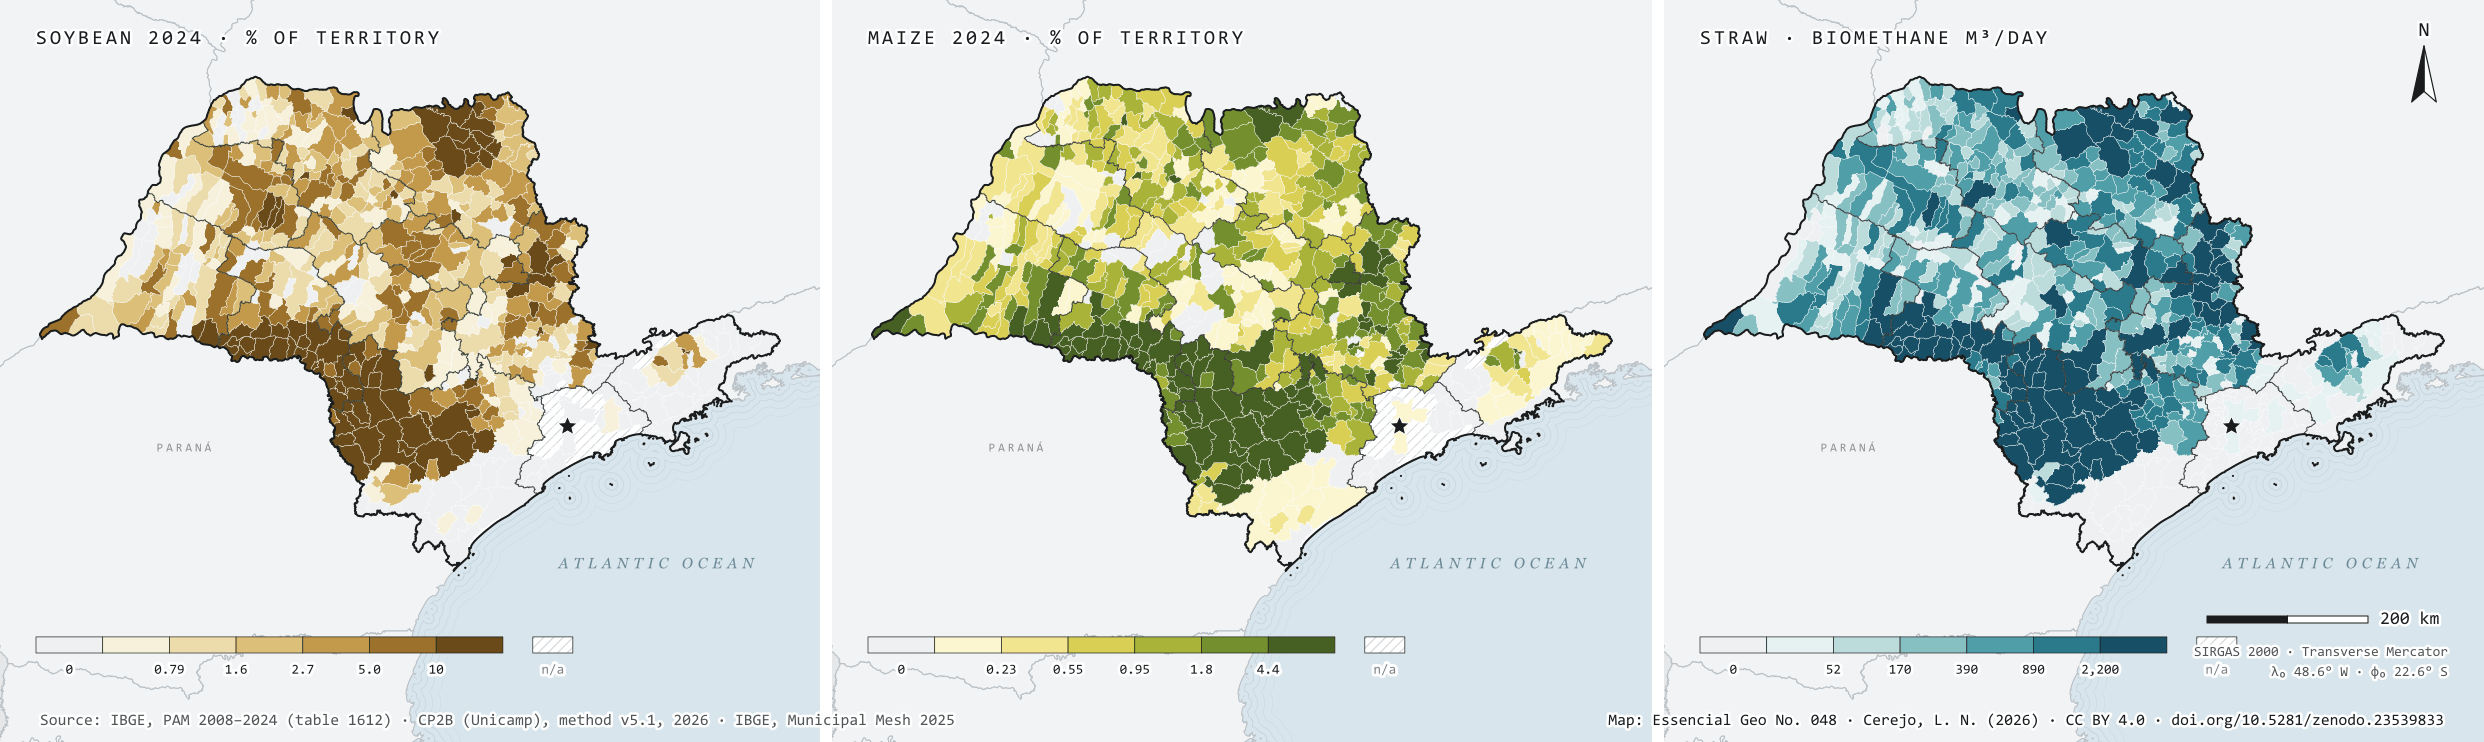
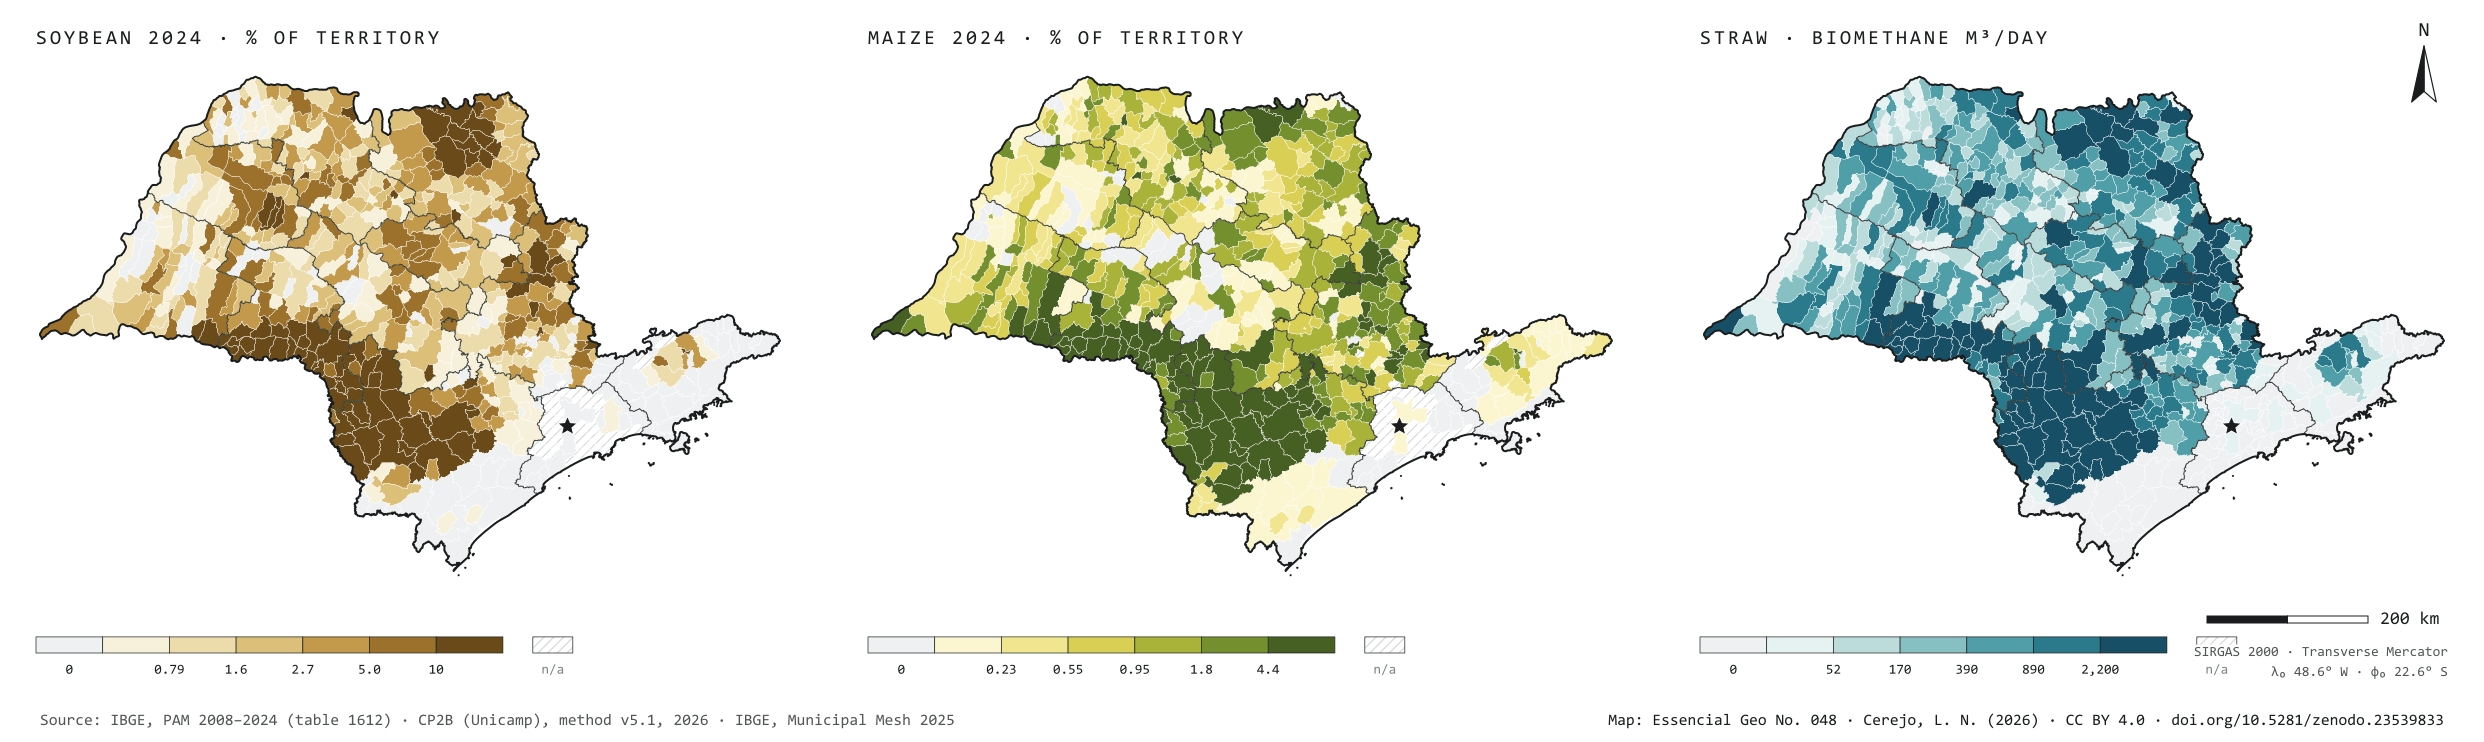
In 2008, São Paulo harvested 525,940 hectares of soybean and 965,907 of maize. In 2024, 1.36 million hectares of soybean, 2.6 times more, and 723,128 of maize, 25% less; soybean overtook maize in 2017. It spread from 304 to 483 municipalities and grew above all in the south of the state. In the Sorocaba region the area went from 82,000 to 468,000 hectares, and Itapeva is the largest grower of both grains. In Ibirarema and Salto Grande, harvested soybean covers almost two thirds of the municipality. The straw of both grains could give 1.03 million m³ of biomethane a day under the CP2B method, 41% of it in the Sorocaba region. That is what remains after leaving on the field the share that protects the soil. Fourth plate of the collection “From field to biomethane”.
Technical record · downloads · citation
At a glance
Harvested soybean area in 2024
1,355,595ha
It was 525,940 ha in 2008; maize fell from 965,907 to 723,128 ha
Biomethane from maize and soybean straw
1,031,325m³/day
Accessible level of the CP2B method, reference scenario: 528,467 from maize and 502,858 from soybean
Largest soybean growers in 2024 (t)
Itapeva241,819
Capão Bonito130,500
Buri126,558
Itaberá103,650
Itapetininga99,000
Layers
municipiospolygon645 municipalities: harvested area and production of soybean and maize in 2008 and 2024, share of territory in 2024 (%) and straw biomethane (m³/day)
regioes_intermediariaspolygon11 intermediate geographic regions
Harvested soybean and maize area from PAM 2024 divided by municipal area, in six quantile classes; straw biomethane potential at the accessible level of the CP2B method, in six quantile classes.
The map without a frame, with legend, scale, reference system and credit written on it: ready for papers, lectures and slides. In two versions: with the basemap (neighbours and sea) or only the mapped area, on white.
CEREJO, Lucas Nakamura. Milho e soja: a soja passou o milho, e a palha ficou no chão. Versão 1.0.0. [S. l.]: Zenodo, 2026. Conjunto de dados. DOI: 10.5281/zenodo.23539833. Disponível em: https://doi.org/10.5281/zenodo.23539833. Acesso em: 10 nov. 2026.
Cerejo, L. N. (2026). Milho e soja: a soja passou o milho, e a palha ficou no chão [Maize and soybean: Soybean overtook maize, and the straw stayed on the ground] (Version 1.0.0) [Data set]. Zenodo. https://doi.org/10.5281/zenodo.23539833
@dataset{cerejo2026_milho_e_soja_sp,
  author    = {Cerejo, Lucas Nakamura},
  title     = {Milho e soja: A soja passou o milho, e a palha ficou no chão},
  year      = {2026},
  publisher = {Zenodo},
  version   = {1.0.0},
  doi       = {10.5281/zenodo.23539833},
  url       = {https://doi.org/10.5281/zenodo.23539833},
  language  = {portuguese},
  note      = {English title: Maize and soybean: Soybean overtook maize, and the straw stayed on the ground. Licence CC BY 4.0}
}
Fig. 047São Paulo state (SP)EPSG:4674Source: IBGE, CP2B (Unicamp)
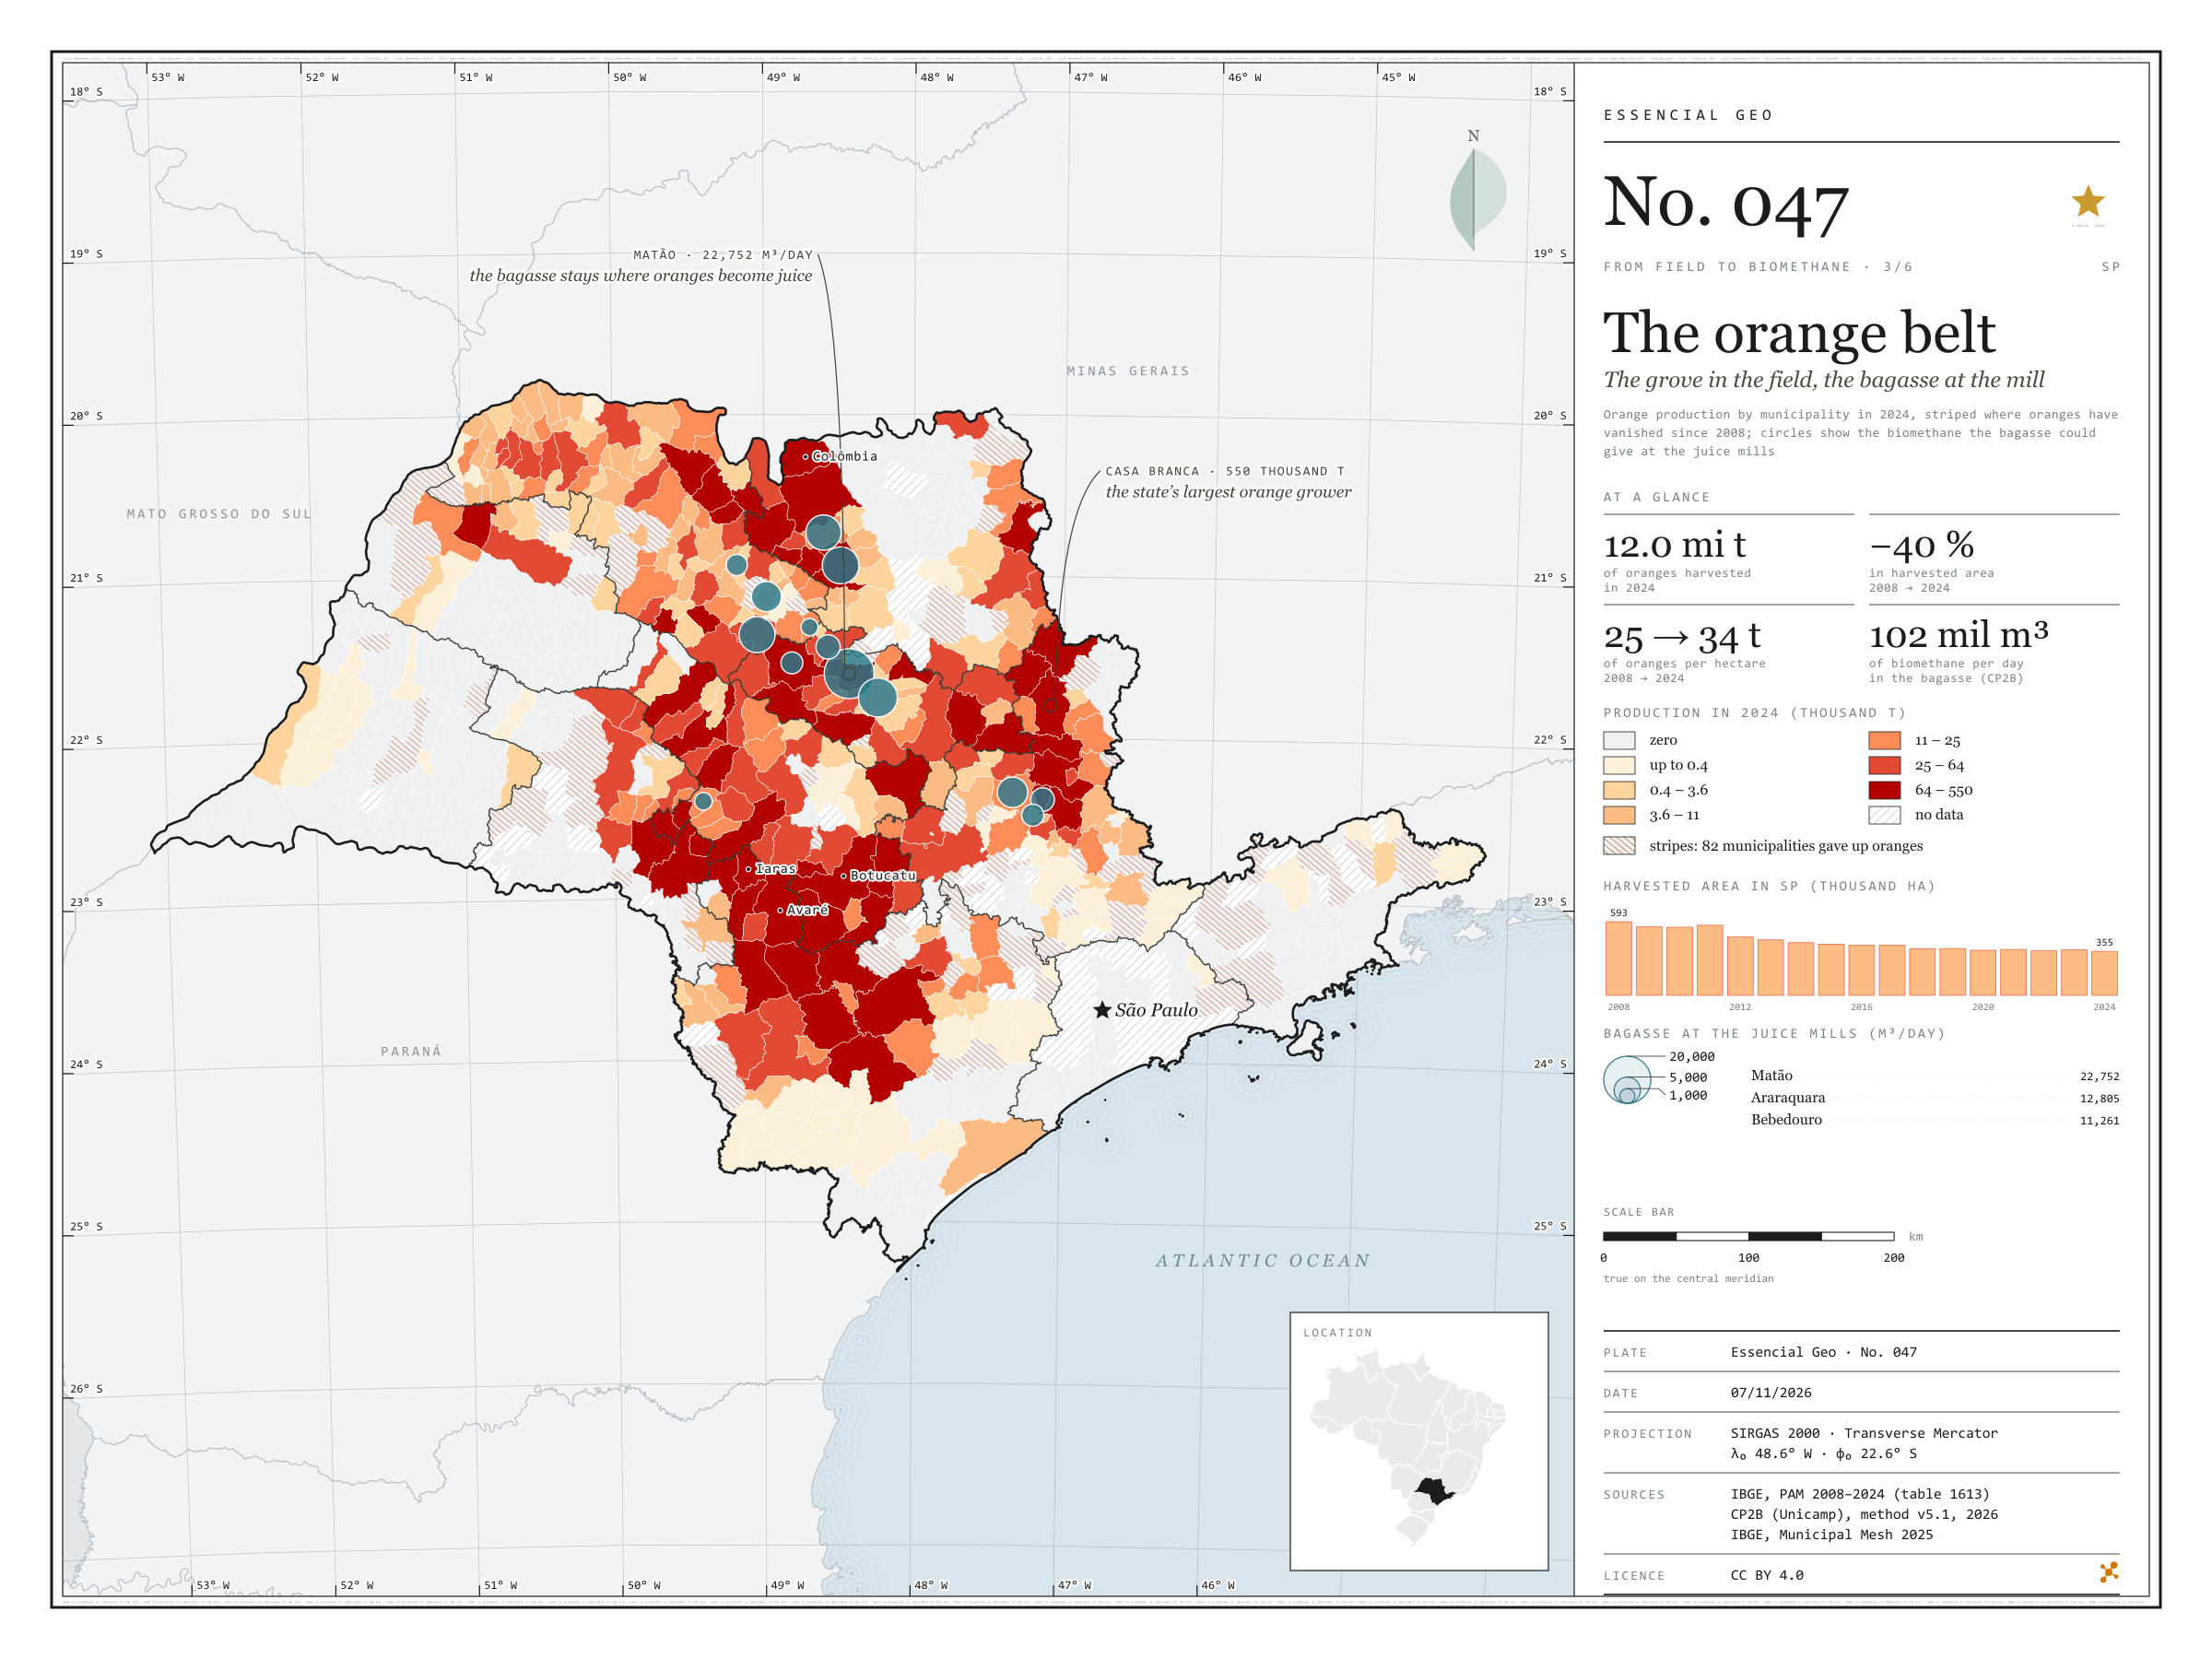
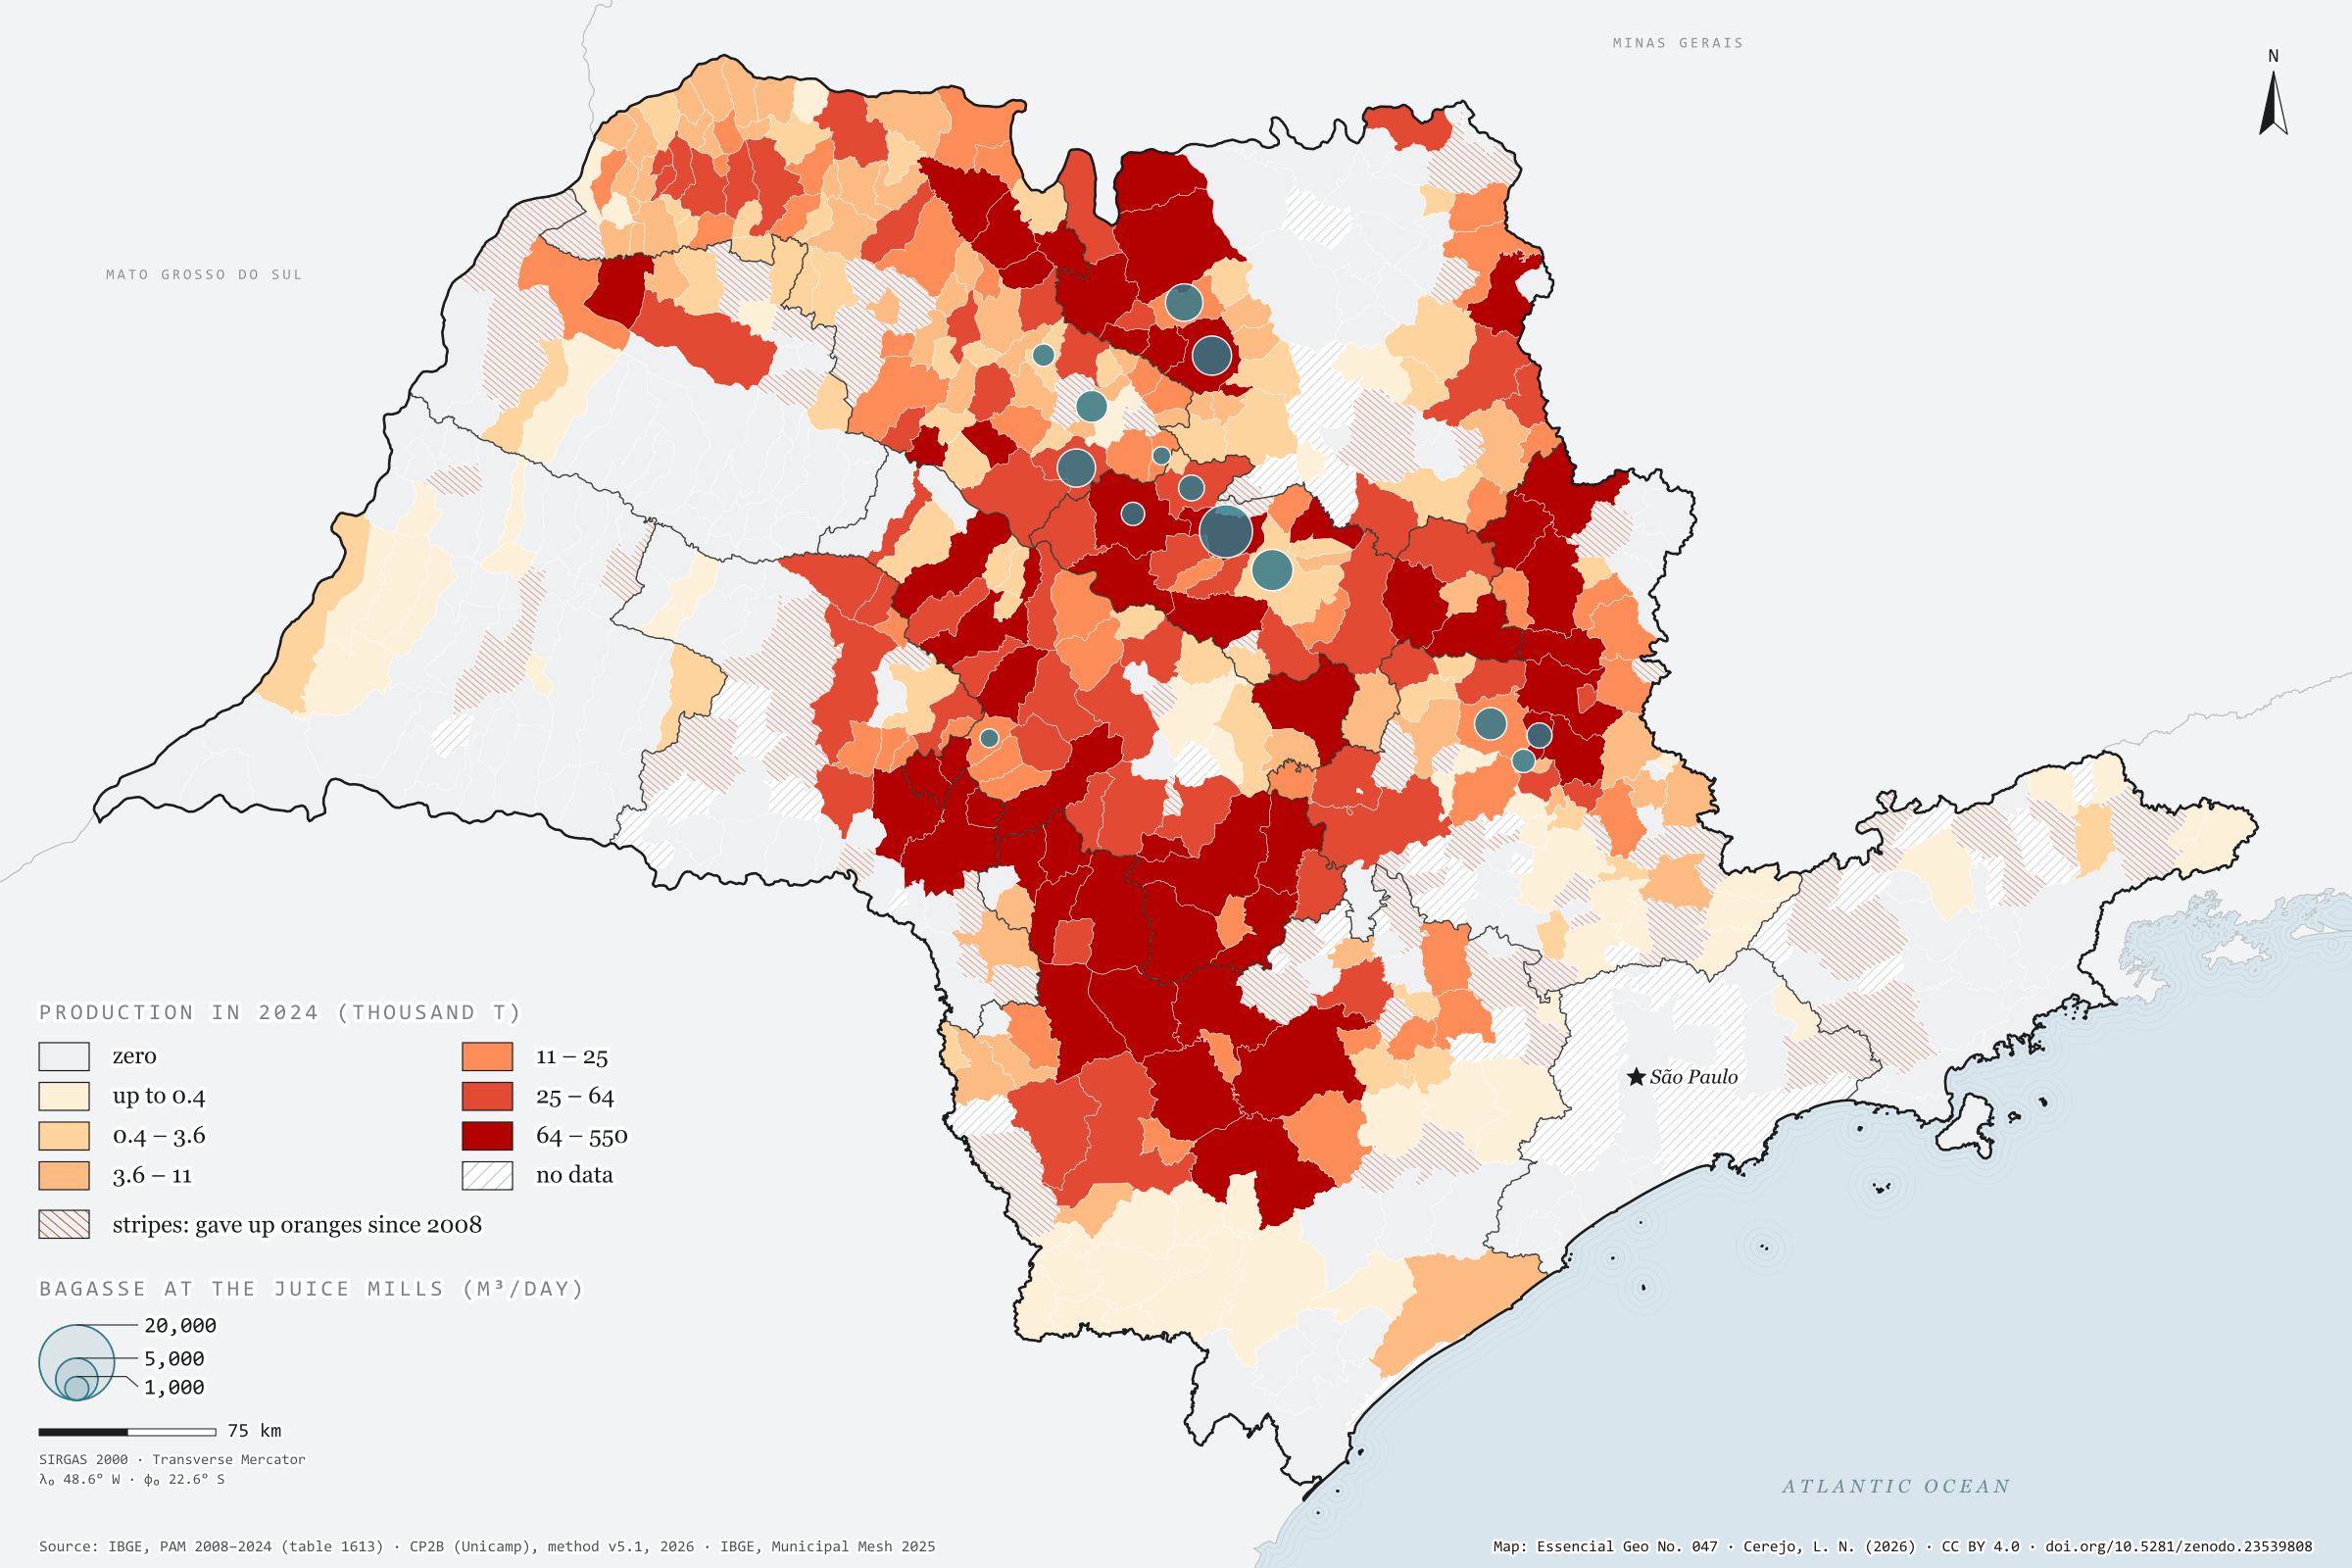
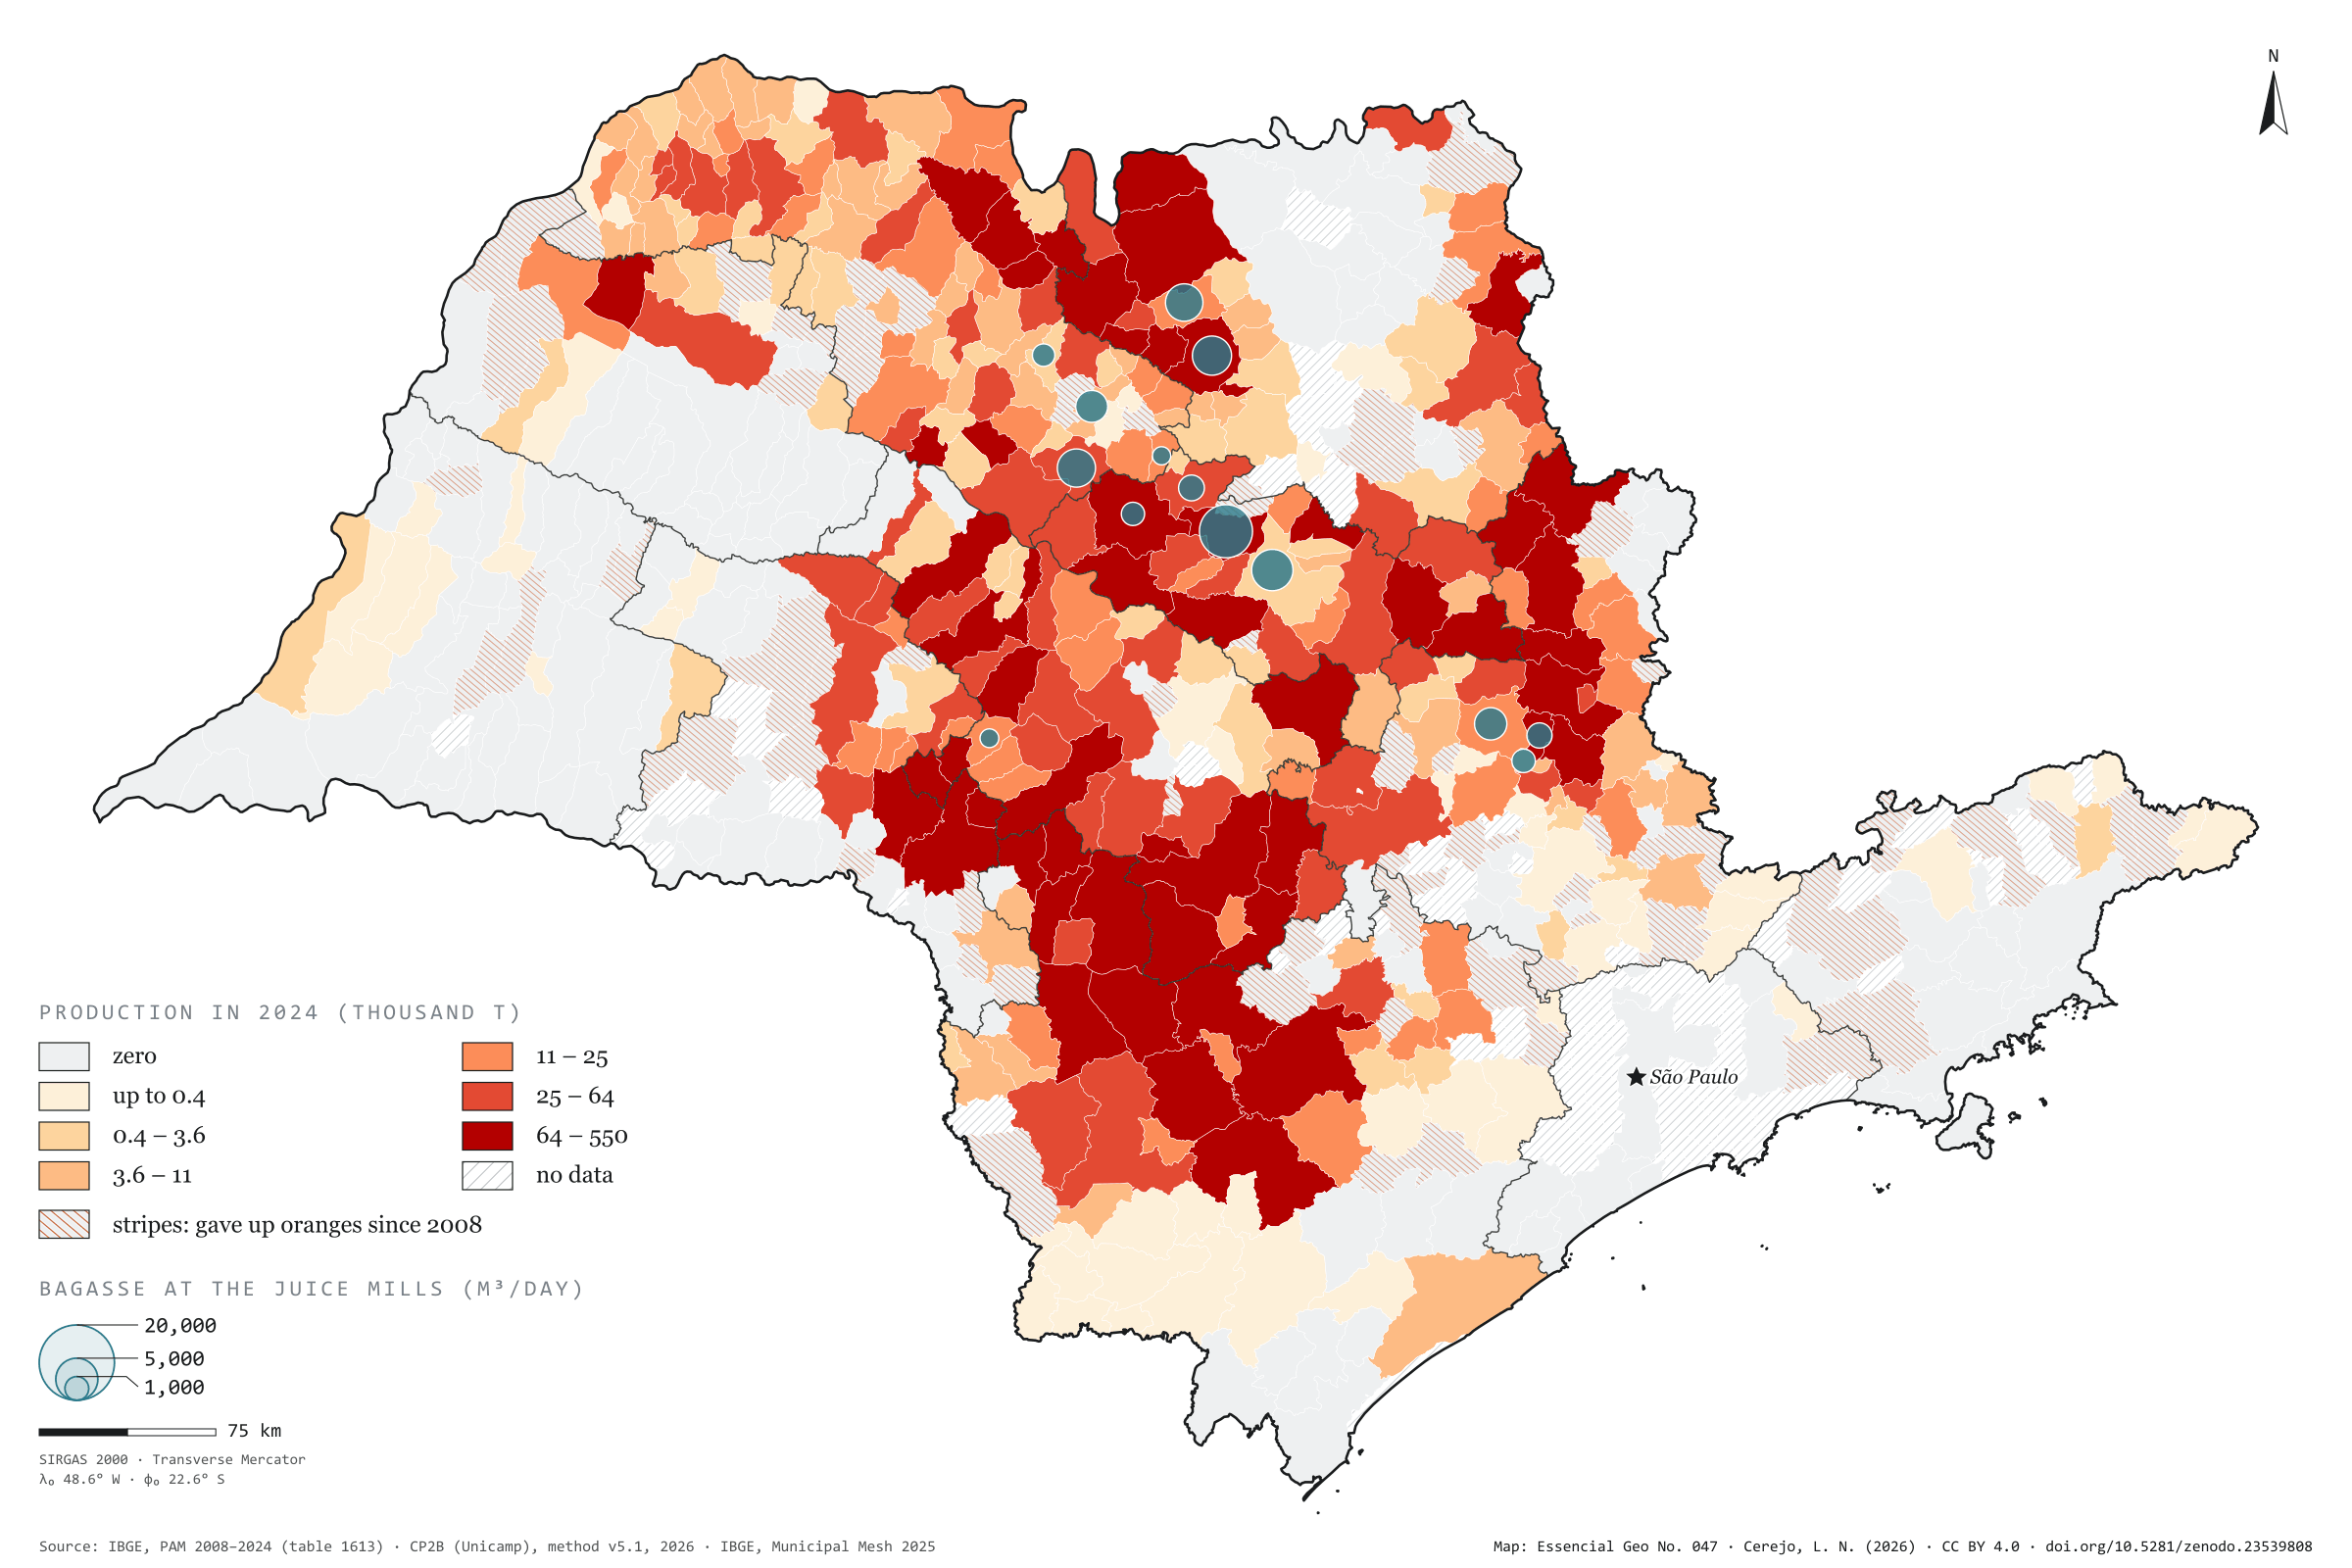
São Paulo harvested 12.0 million tonnes of oranges in 2024, from 354,562 hectares. In 2008 it was 14.5 million tonnes from 592,566 hectares: the area fell by 40%, and each hectare now gives 34 tonnes instead of 25. The belt has also moved south-west. The Araraquara region harvested 3.4 million tonnes and now harvests 1.2; the Sorocaba region rose from 1.0 to 2.4 million and is the state’s largest. Casa Branca leads, with 550,000 tonnes, followed by Botucatu and Avaré, and 82 municipalities have given up oranges. The bagasse, however, stays where the fruit becomes juice. The CP2B method places it in 14 municipalities with mills, and Matão, which harvests 108,000 tonnes, receives the largest potential: 22,752 m³ of biomethane a day, out of 101,834. Third plate of the collection “From field to biomethane”.
Technical record · downloads · citation
At a glance
Orange production in 2024
12,002,362t
In 2008 it was 14,537,610 t, harvested from 592,566 ha; in 2024, from 354,562 ha
Biomethane from orange bagasse
101,834m³/day
Accessible level of the CP2B method, reference scenario, in 14 municipalities with juice mills
Largest growers in 2024 (t)
Casa Branca550,000
Botucatu436,780
Avaré414,710
Iaras346,800
Colômbia337,621
Layers
bagaco_nas_fabricaspoint14 municipalities that receive the bagasse in the CP2B method, with the biomethane (m³/day)
municipiospolygon645 municipalities: harvested area and orange production in 2008 and 2024, share of territory, whether oranges were given up, and bagasse biomethane
regioes_intermediariaspolygon11 intermediate geographic regions
Orange production from PAM 2024 by municipality in six quantile classes; stripes where there was harvested area in 2008 and none in 2024; circles with the bagasse biomethane potential at the accessible level of the CP2B method, allocated to the juice mills.
The map without a frame, with legend, scale, reference system and credit written on it: ready for papers, lectures and slides. In two versions: with the basemap (neighbours and sea) or only the mapped area, on white.
CEREJO, Lucas Nakamura. O cinturão da laranja: o pomar no campo, o bagaço na fábrica. Versão 1.0.0. [S. l.]: Zenodo, 2026. Conjunto de dados. DOI: 10.5281/zenodo.23539808. Disponível em: https://doi.org/10.5281/zenodo.23539808. Acesso em: 10 nov. 2026.
Cerejo, L. N. (2026). O cinturão da laranja: o pomar no campo, o bagaço na fábrica [The orange belt: The grove in the field, the bagasse at the mill] (Version 1.0.0) [Data set]. Zenodo. https://doi.org/10.5281/zenodo.23539808
@dataset{cerejo2026_laranja_sp,
  author    = {Cerejo, Lucas Nakamura},
  title     = {O cinturão da laranja: O pomar no campo, o bagaço na fábrica},
  year      = {2026},
  publisher = {Zenodo},
  version   = {1.0.0},
  doi       = {10.5281/zenodo.23539808},
  url       = {https://doi.org/10.5281/zenodo.23539808},
  language  = {portuguese},
  note      = {English title: The orange belt: The grove in the field, the bagasse at the mill. Licence CC BY 4.0}
}
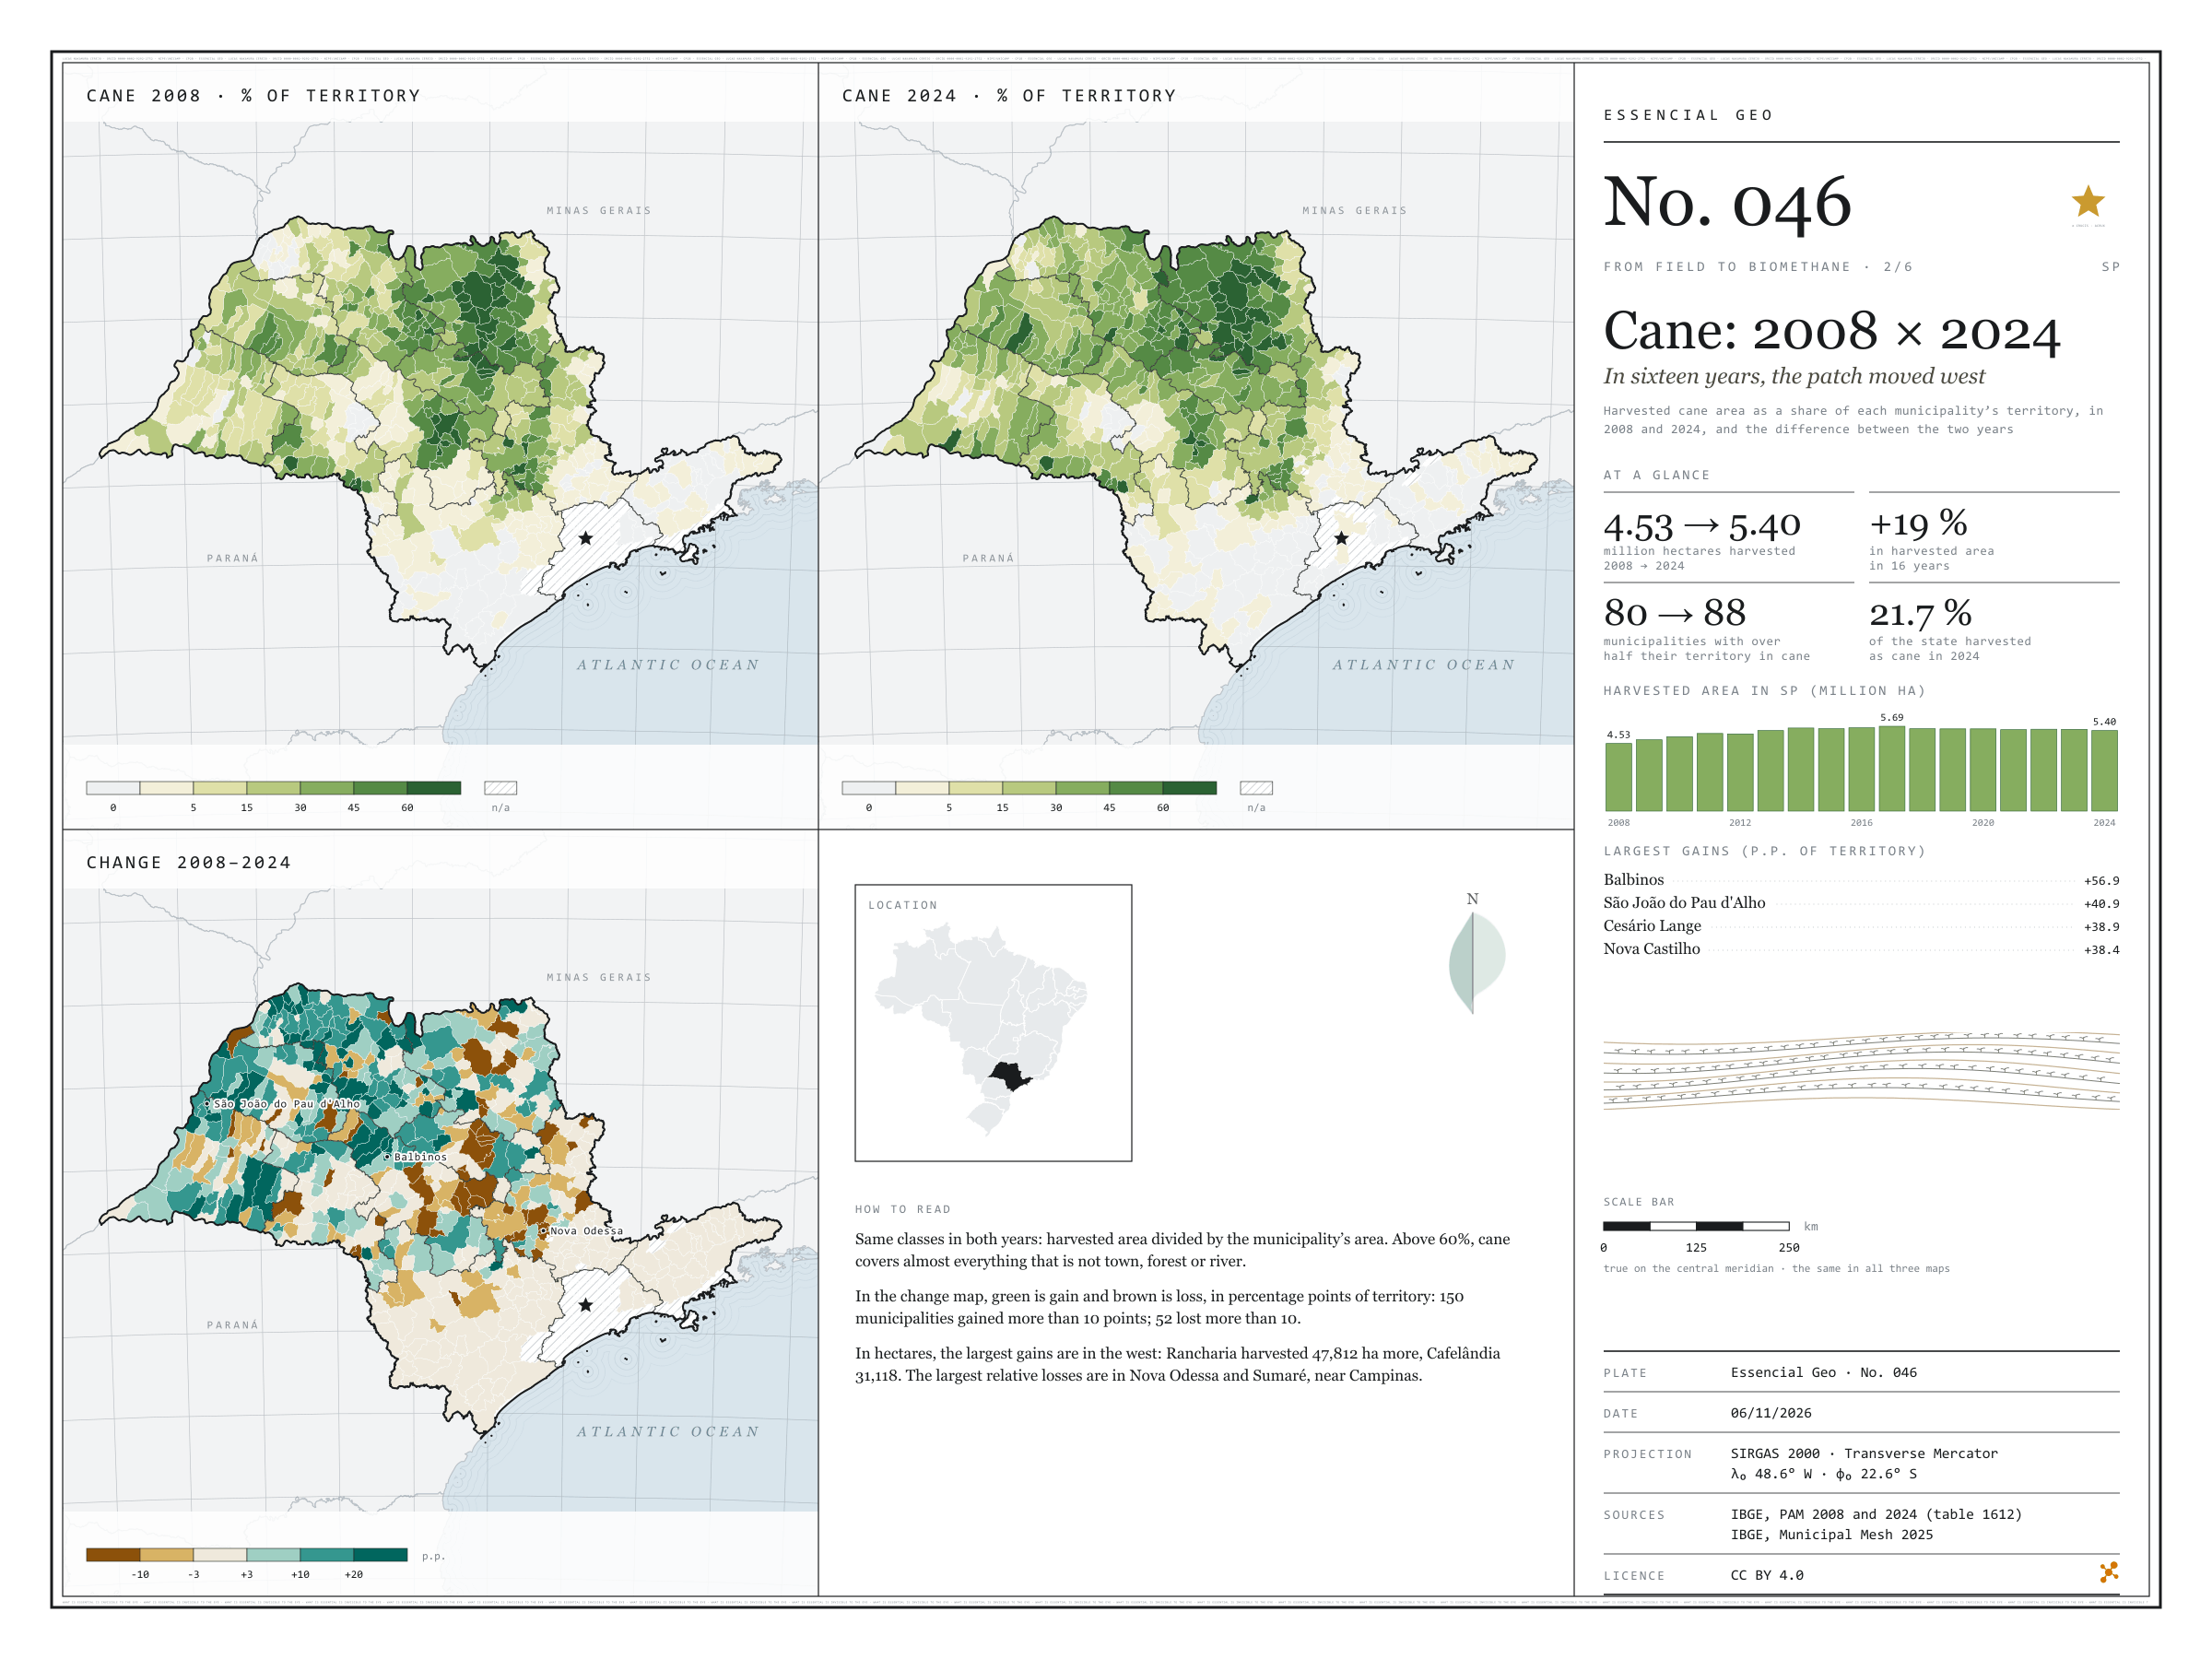
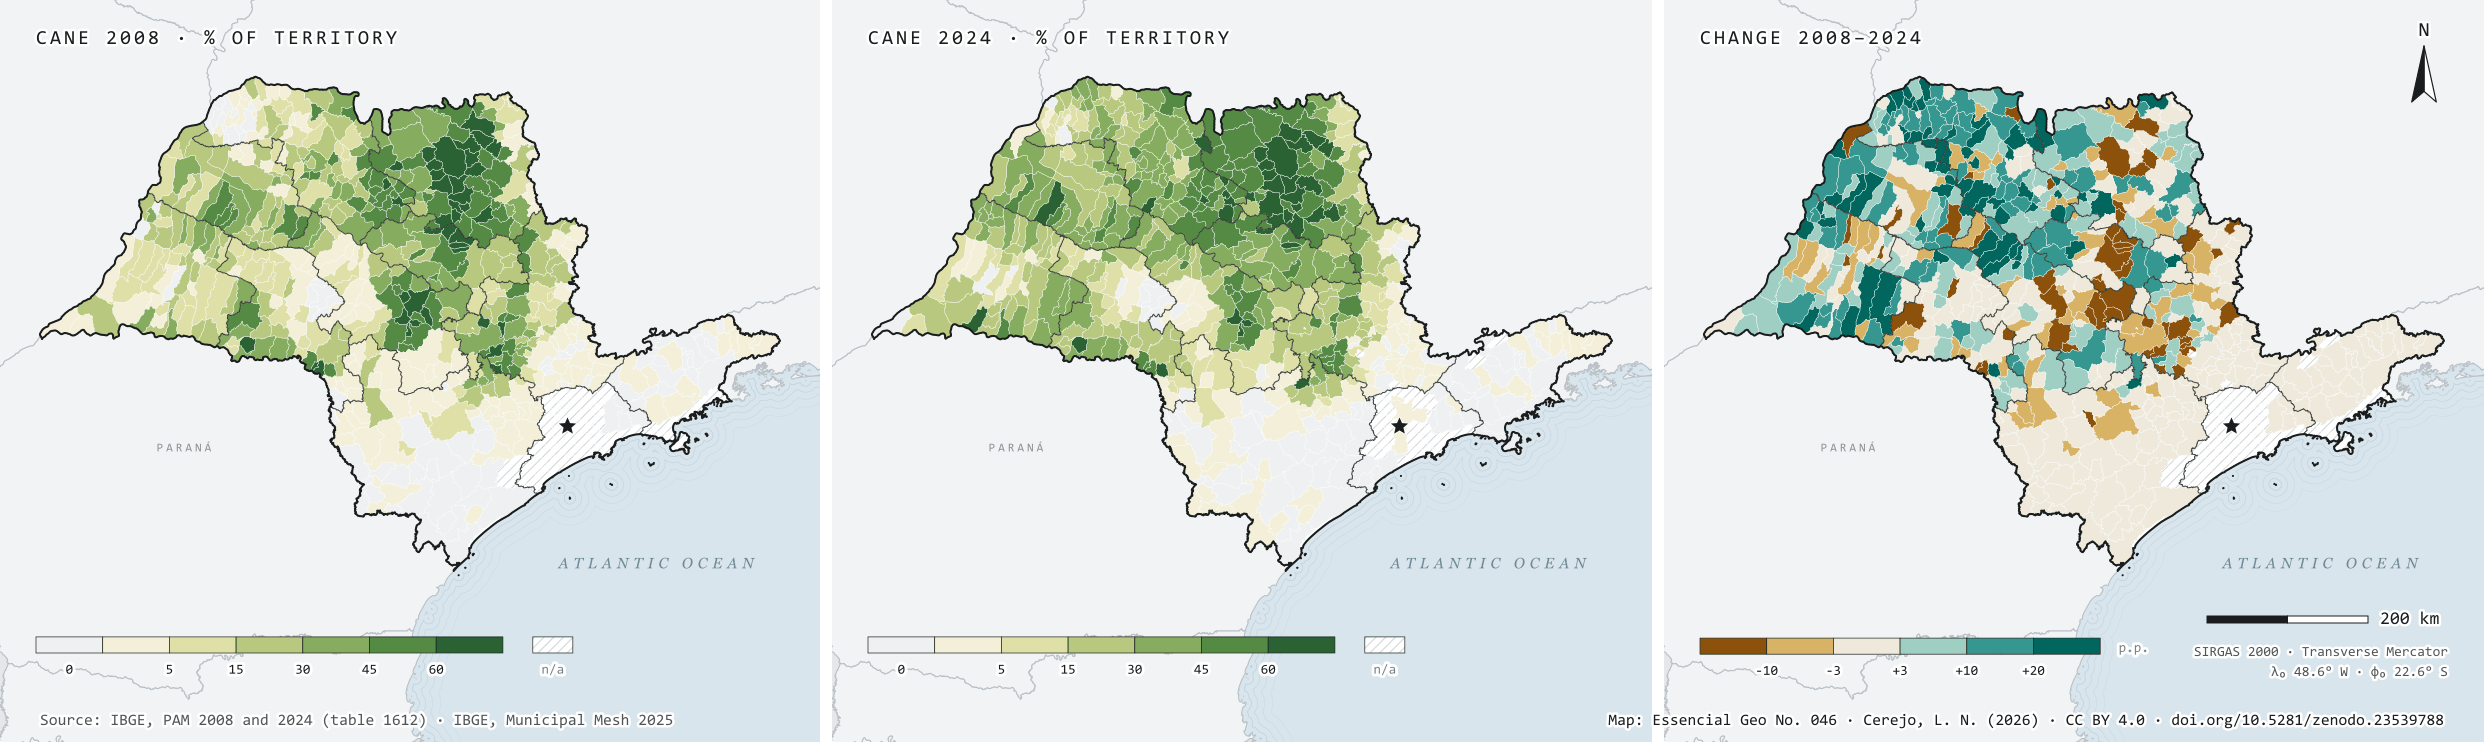
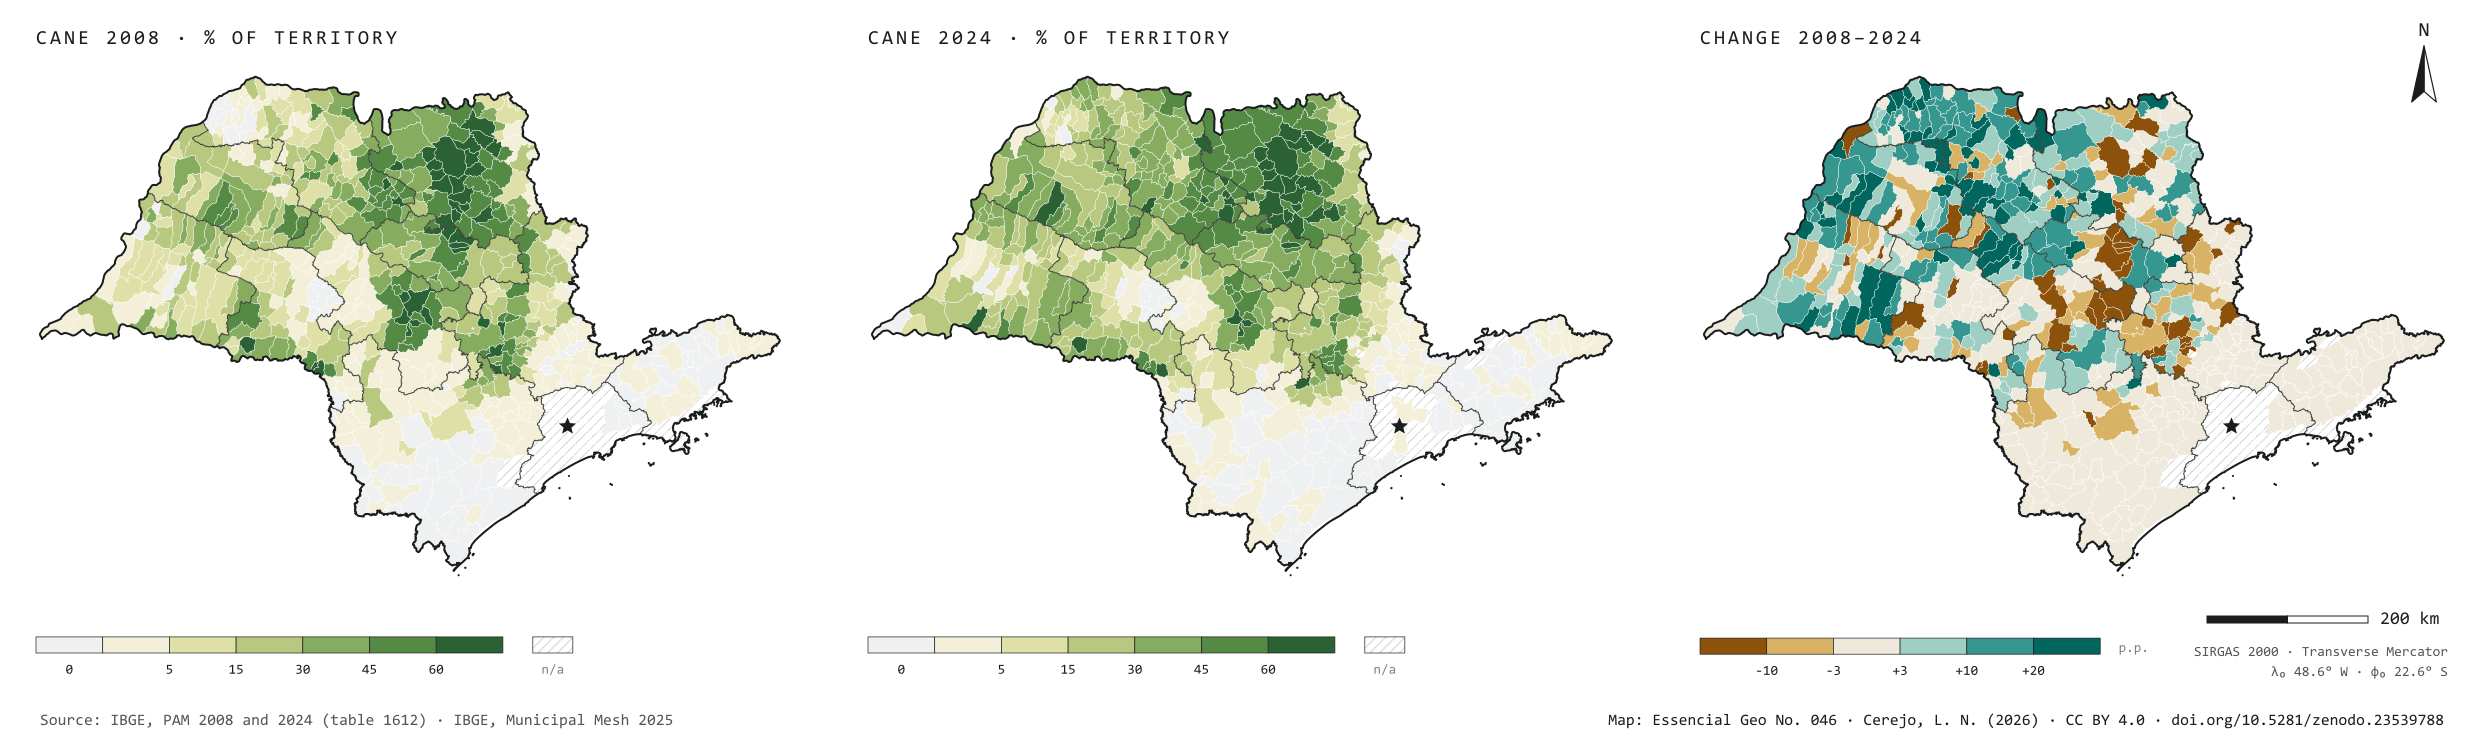
In 2008, São Paulo’s cane fields were harvested over 4.53 million hectares; in 2024, over 5.40 million, 19% more, and cane went from 18.3% to 21.7% of the state’s territory. Harvested area peaked in 2017, at 5.69 million hectares, and has been slowly receding since. The plate sets the two years side by side, with the same classes, and maps the difference: 150 municipalities gained more than 10 percentage points of territory under cane, 104 of them in the São José do Rio Preto, Araçatuba and Presidente Prudente regions, in the west; Rancharia harvested 47,812 hectares more. The Campinas region was the only one to lose much: 63,632 hectares fewer, with the steepest falls in Nova Odessa and Sumaré. Second plate of the collection “From field to biomethane”.
Technical record · downloads · citation
At a glance
Harvested area in 2024
5,398,676ha
It was 4,530,784 ha in 2008: 19% more in sixteen years
Municipalities that gained over 10 p.p.
150
Another 52 lost more than 10 percentage points of territory under cane
Largest gains in harvested area, 2008–2024 (ha)
Rancharia47,812
Cafelândia31,118
José Bonifácio28,000
Martinópolis25,500
Mirandópolis23,000
Layers
municipiospolygon645 municipalities: harvested area and production of cane in 2008 and 2024, share of territory in each year (%) and change (p.p.)
regioes_intermediariaspolygon11 intermediate geographic regions
Harvested cane area from PAM in 2008 and 2024 divided by municipal area, in the same six classes for both years; the change is given in percentage points of territory.
The map without a frame, with legend, scale, reference system and credit written on it: ready for papers, lectures and slides. In two versions: with the basemap (neighbours and sea) or only the mapped area, on white.
CEREJO, Lucas Nakamura. Cana: 2008 × 2024: em dezesseis anos, a mancha andou para o oeste. Versão 1.0.0. [S. l.]: Zenodo, 2026. Conjunto de dados. DOI: 10.5281/zenodo.23539788. Disponível em: https://doi.org/10.5281/zenodo.23539788. Acesso em: 10 nov. 2026.
Cerejo, L. N. (2026). Cana: 2008 × 2024: em dezesseis anos, a mancha andou para o oeste [Cane: 2008 × 2024: In sixteen years, the patch moved west] (Version 1.0.0) [Data set]. Zenodo. https://doi.org/10.5281/zenodo.23539788
@dataset{cerejo2026_cana_2008_2024_sp,
  author    = {Cerejo, Lucas Nakamura},
  title     = {Cana: 2008 × 2024: Em dezesseis anos, a mancha andou para o oeste},
  year      = {2026},
  publisher = {Zenodo},
  version   = {1.0.0},
  doi       = {10.5281/zenodo.23539788},
  url       = {https://doi.org/10.5281/zenodo.23539788},
  language  = {portuguese},
  note      = {English title: Cane: 2008 × 2024: In sixteen years, the patch moved west. Licence CC BY 4.0}
}
Fig. 045São Paulo state (SP)EPSG:4674Source: MapBiomas, IBGE
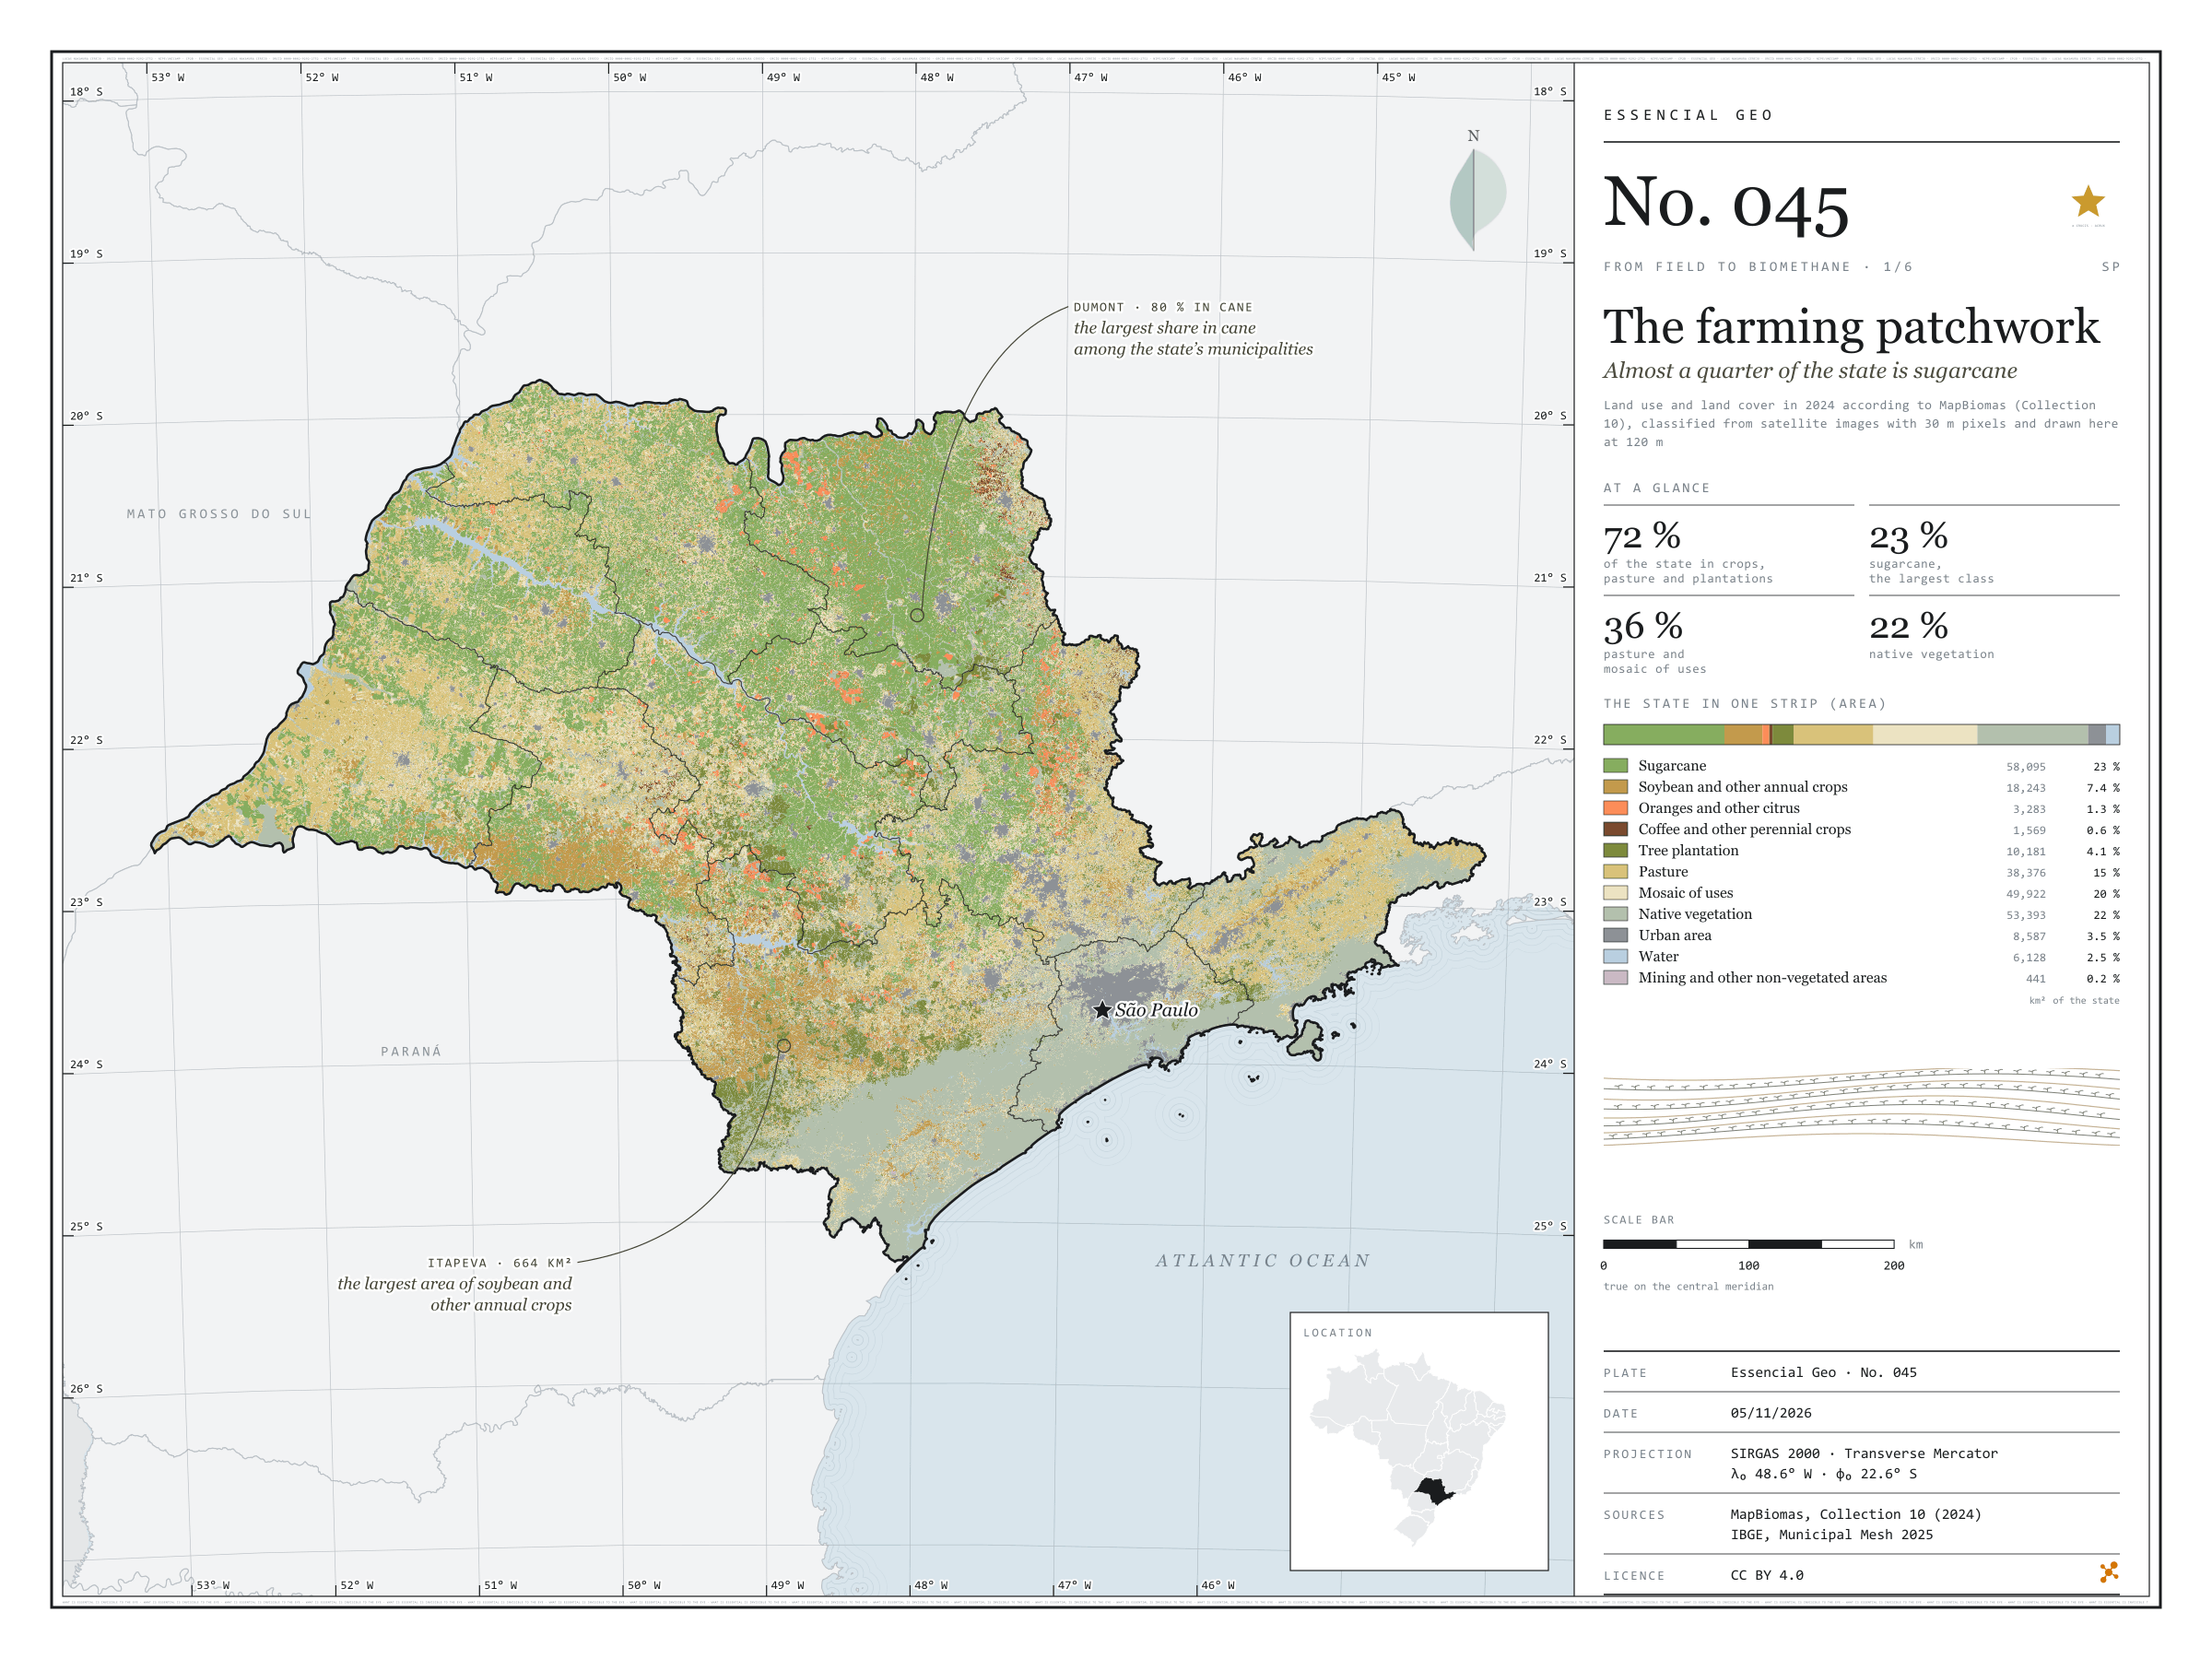
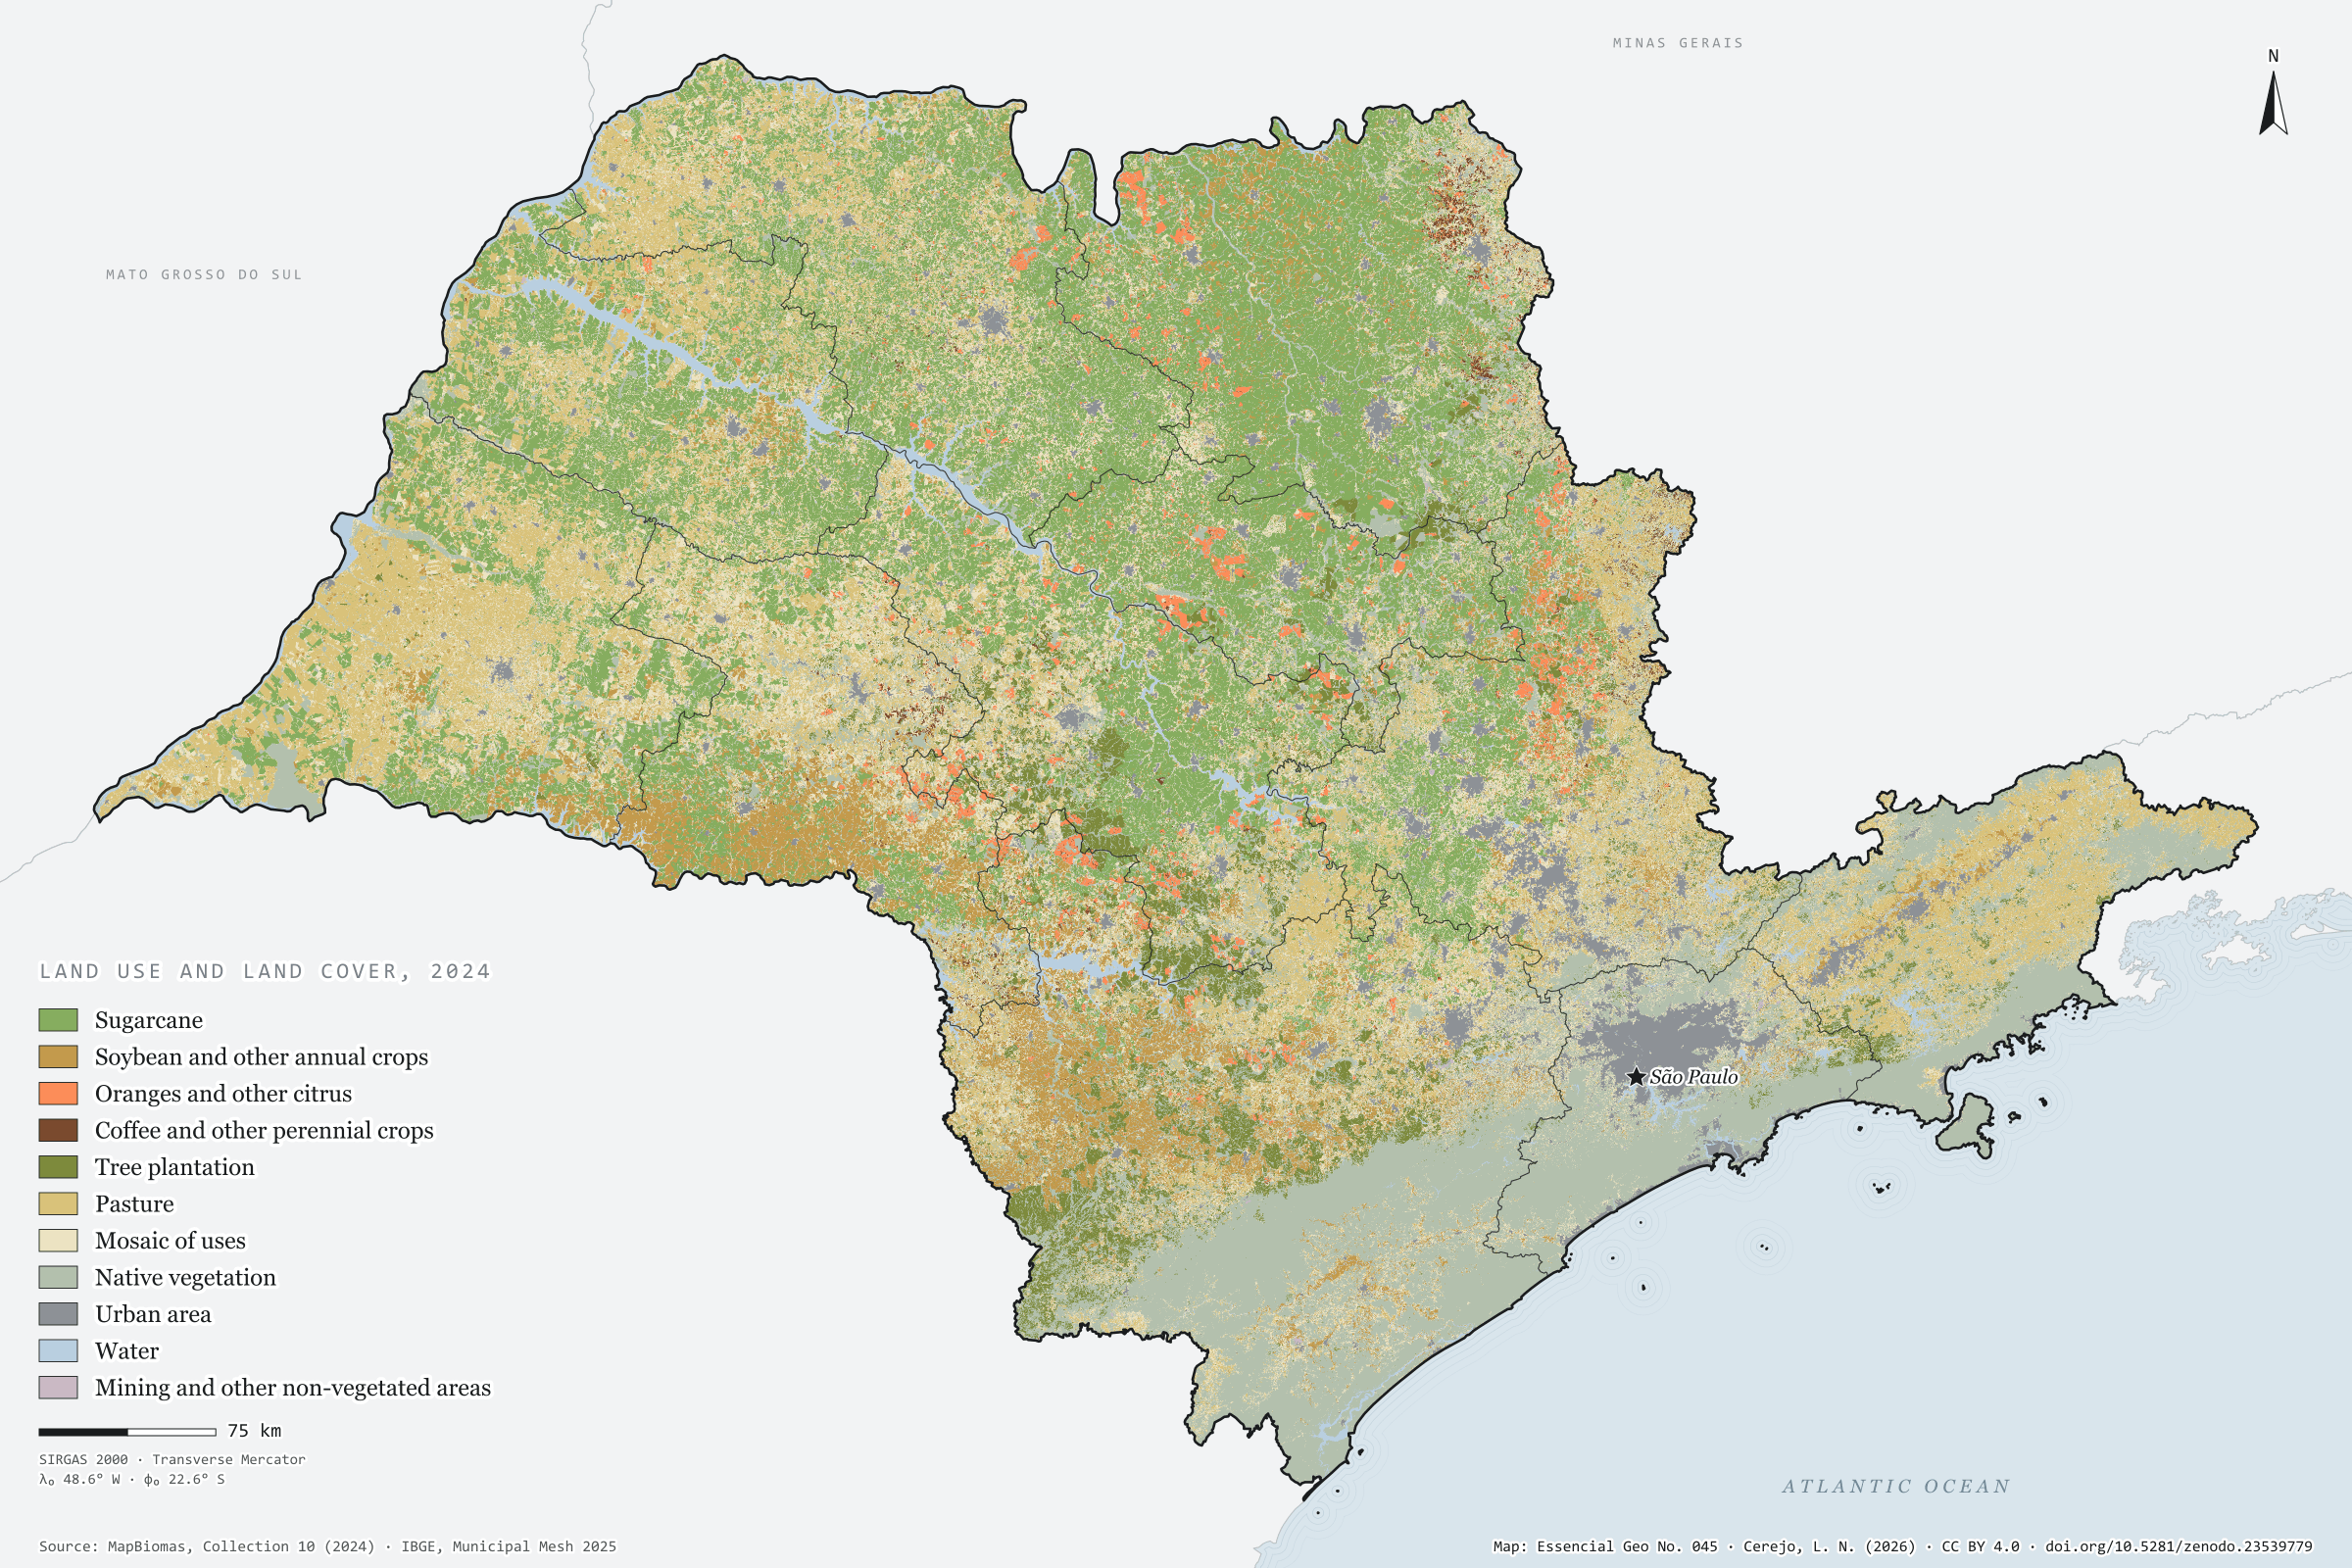
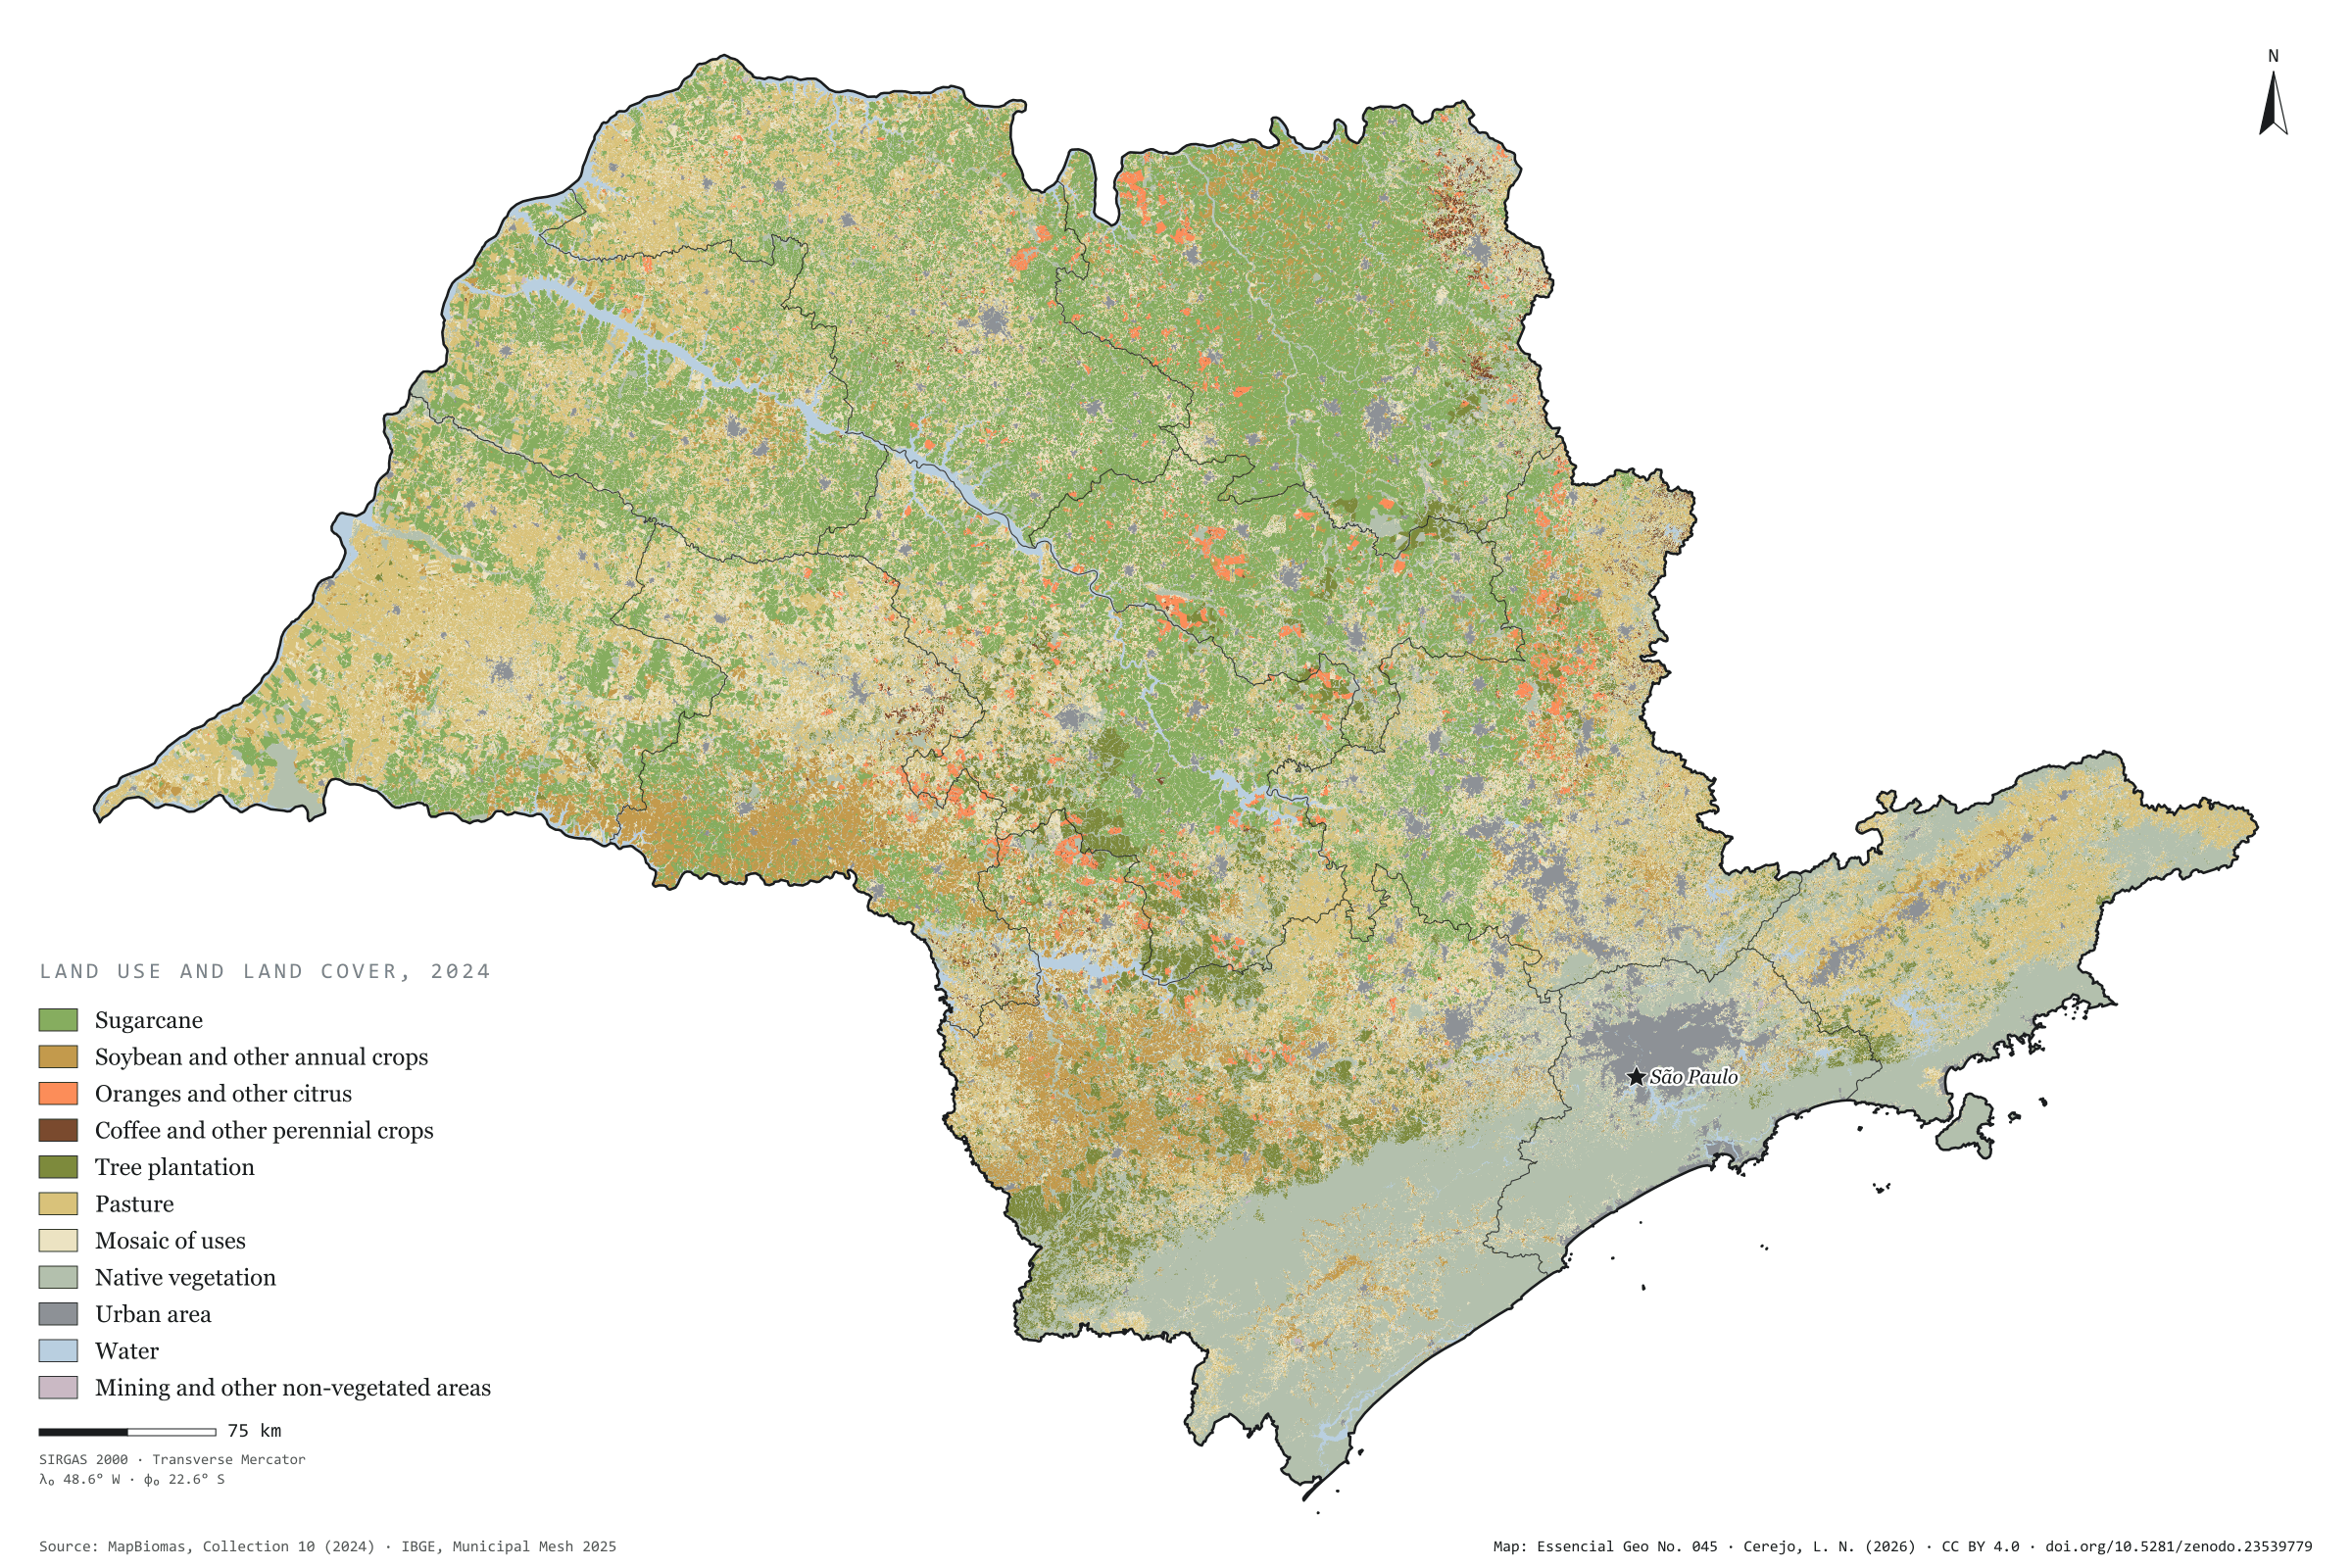
In 2024, 72% of São Paulo’s territory was cropland, pasture, tree plantation or a mosaic of these uses, according to MapBiomas. Sugarcane is the largest class: 58,000 km², almost a quarter of the state, and the leading use in 255 of the 645 municipalities. In the Ribeirão Preto region it covers half the land, and in Dumont, 80%. Soybean and other annual crops add up to 7%, mostly in the south, in the Marília region and around Itapeva. Pasture, at 15%, dominates the west: it covers 36% of the Presidente Prudente region. Oranges, coffee and other perennial crops take up less than 2%. Native vegetation, 22% of the state, lies mostly in the Serra do Mar and the Ribeira valley. First plate of the collection “From field to biomethane”, which follows the crops to the gas their residues could give.
Technical record · downloads · citation
At a glance
The state by land use (km²)
Sugarcane23.4%
Native vegetation21.5%
Mosaic of uses20.1%
Pasture15.5%
Soybean and other annual crops7.3%
Tree plantation4.1%
Urban area3.5%
Water2.5%
Citrus, coffee and other perennials2%
Other non-vegetated areas0.2%
Largest share of the municipality in sugarcane (%)
Dumont80
Guariba78
Pontal77
Dobrada76
Ariranha75
Layers
municipiospolygon645 municipalities: area (km²) and share of the municipality (%) of each of the eleven classes, total of farming uses and class with the largest area
regioes_intermediariaspolygon11 intermediate geographic regions
MapBiomas 2024 classification (Collection 10), 30 m pixels, grouped into eleven classes; areas by municipality counted on the 30 m pixels, on the GRS80 ellipsoid; map drawn with the most frequent class in blocks of 4 × 4 pixels (120 m).
The map without a frame, with legend, scale, reference system and credit written on it: ready for papers, lectures and slides. In two versions: with the basemap (neighbours and sea) or only the mapped area, on white.
CEREJO, Lucas Nakamura. O tabuleiro agrícola: quase um quarto do estado é cana. Versão 1.0.0. [S. l.]: Zenodo, 2026. Conjunto de dados. DOI: 10.5281/zenodo.23539779. Disponível em: https://doi.org/10.5281/zenodo.23539779. Acesso em: 10 nov. 2026.
Cerejo, L. N. (2026). O tabuleiro agrícola: quase um quarto do estado é cana [The farming patchwork: Almost a quarter of the state is sugarcane] (Version 1.0.0) [Data set]. Zenodo. https://doi.org/10.5281/zenodo.23539779
@dataset{cerejo2026_tabuleiro_agricola_sp,
  author    = {Cerejo, Lucas Nakamura},
  title     = {O tabuleiro agrícola: Quase um quarto do estado é cana},
  year      = {2026},
  publisher = {Zenodo},
  version   = {1.0.0},
  doi       = {10.5281/zenodo.23539779},
  url       = {https://doi.org/10.5281/zenodo.23539779},
  language  = {portuguese},
  note      = {English title: The farming patchwork: Almost a quarter of the state is sugarcane. Licence CC BY 4.0}
}
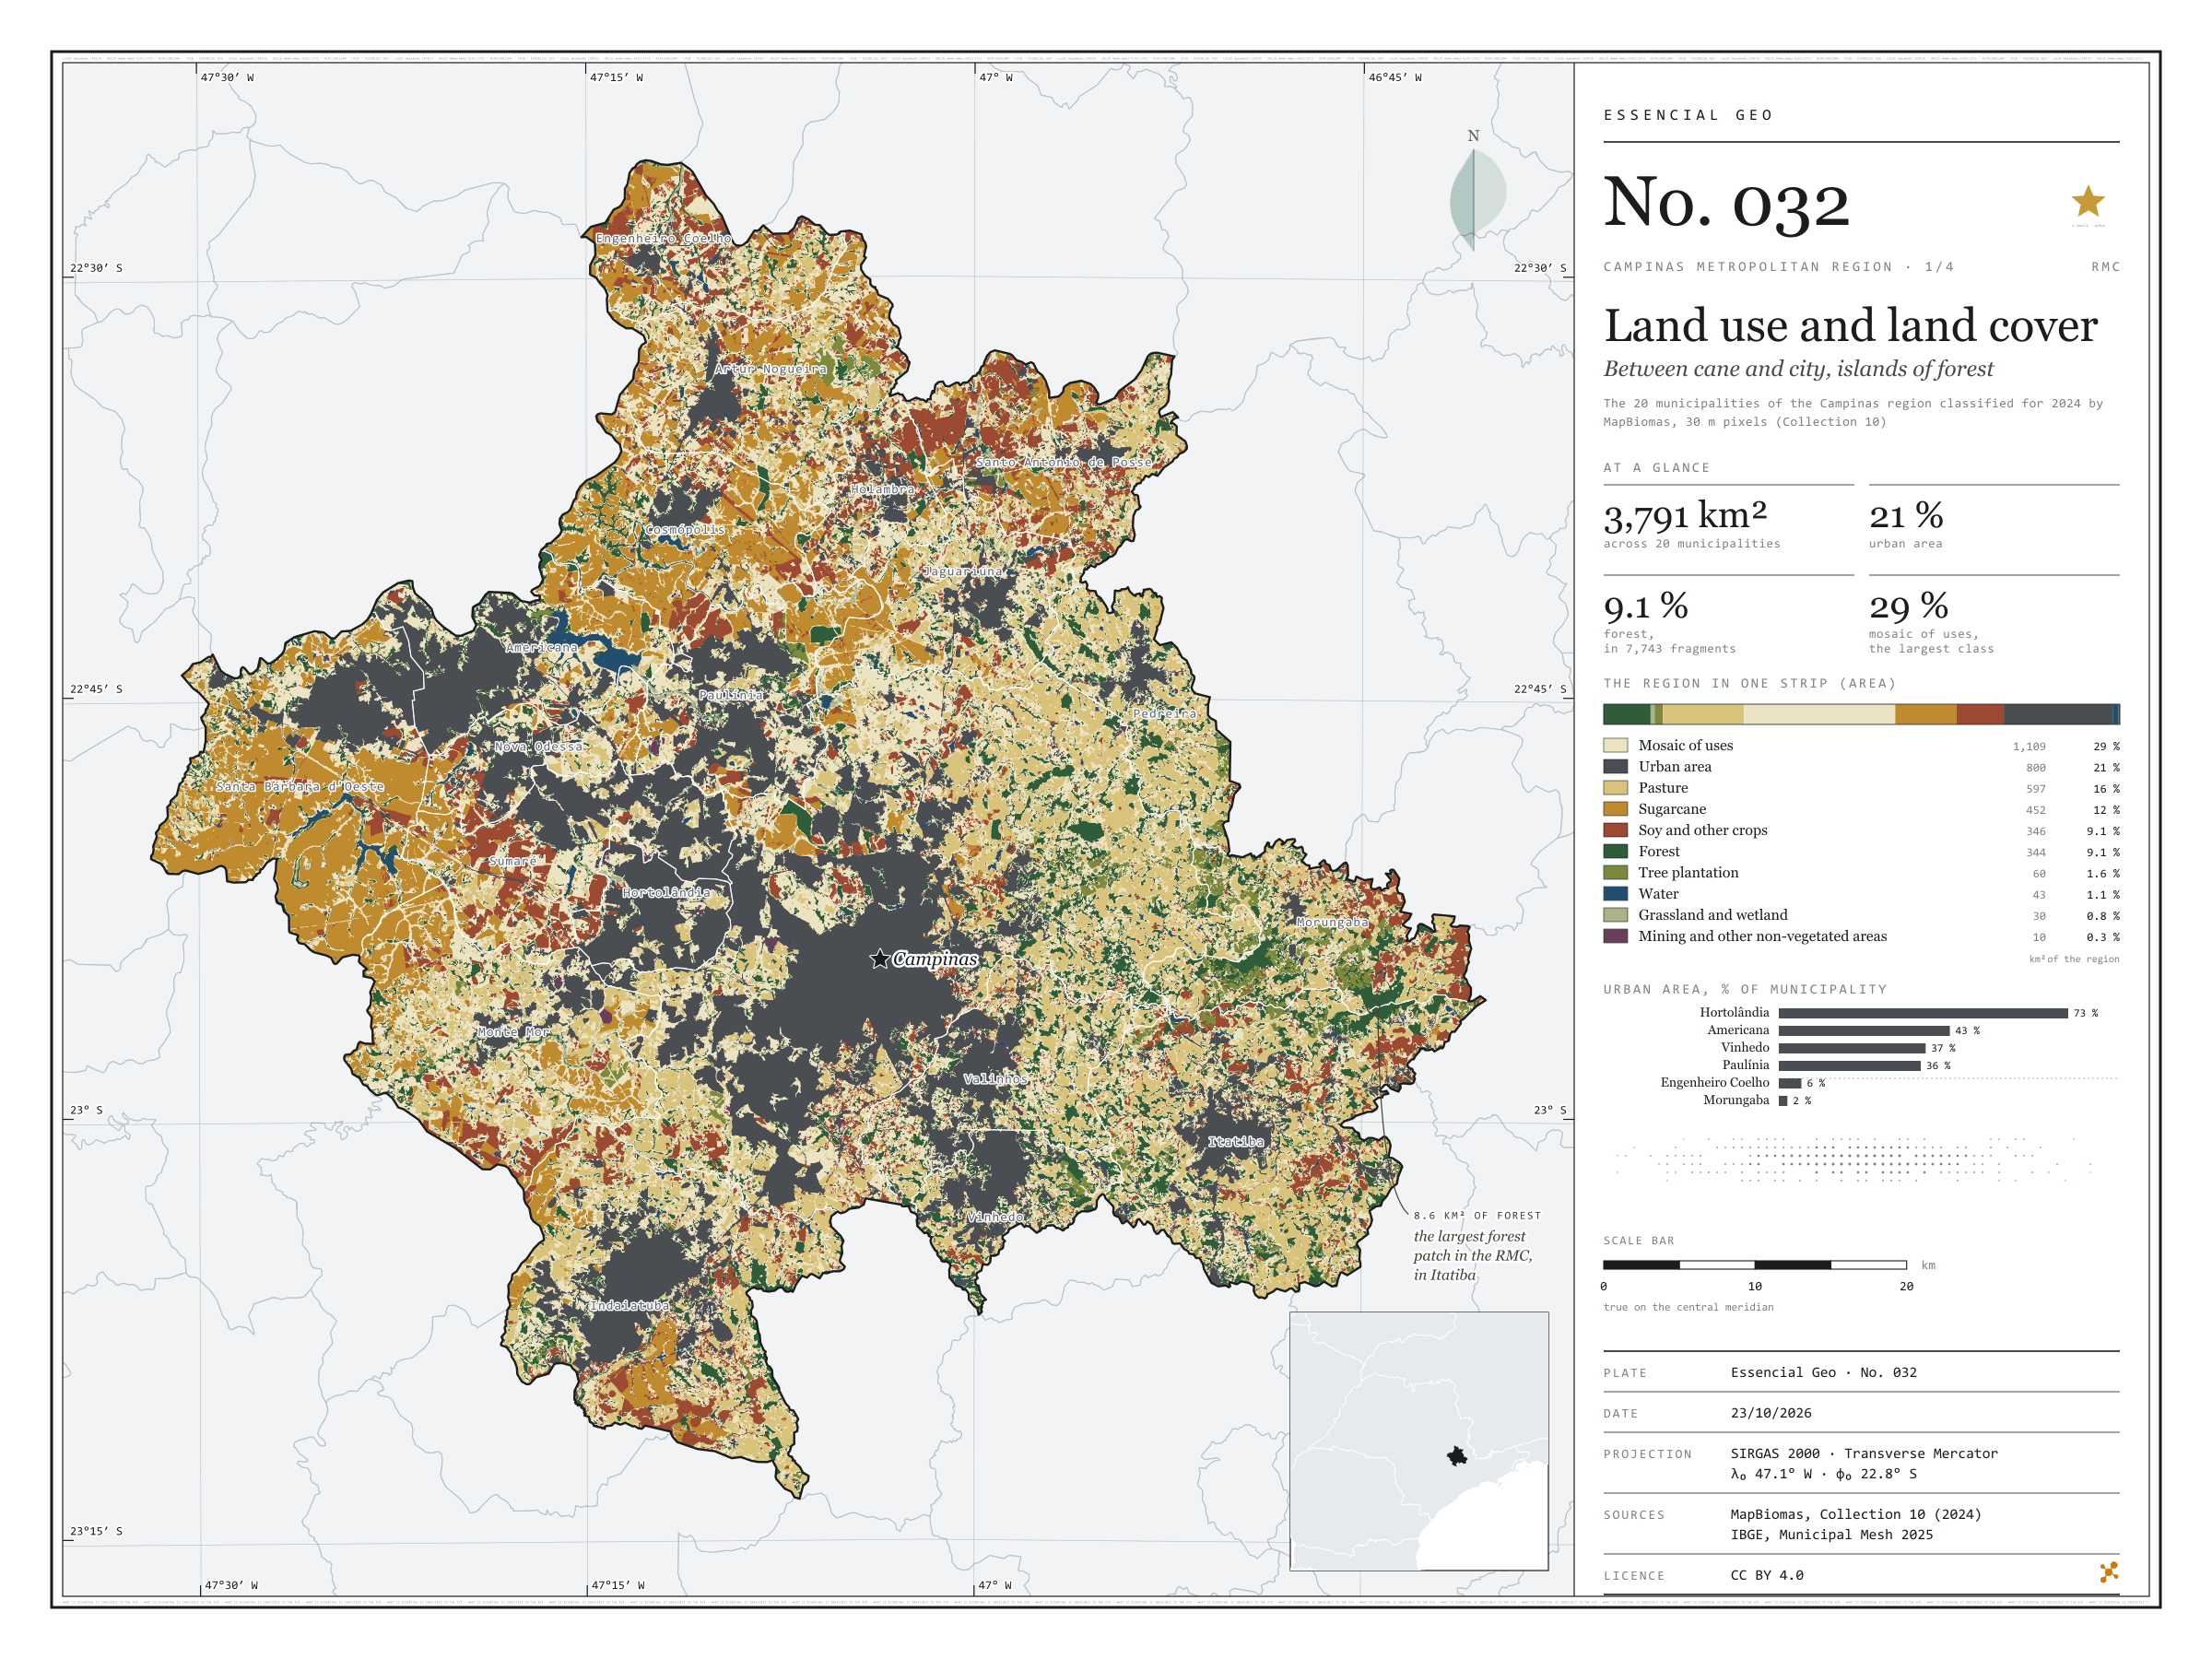
Fig. 032Campinas Metropolitan Region (SP)EPSG:4674Source: MapBiomas, IBGE
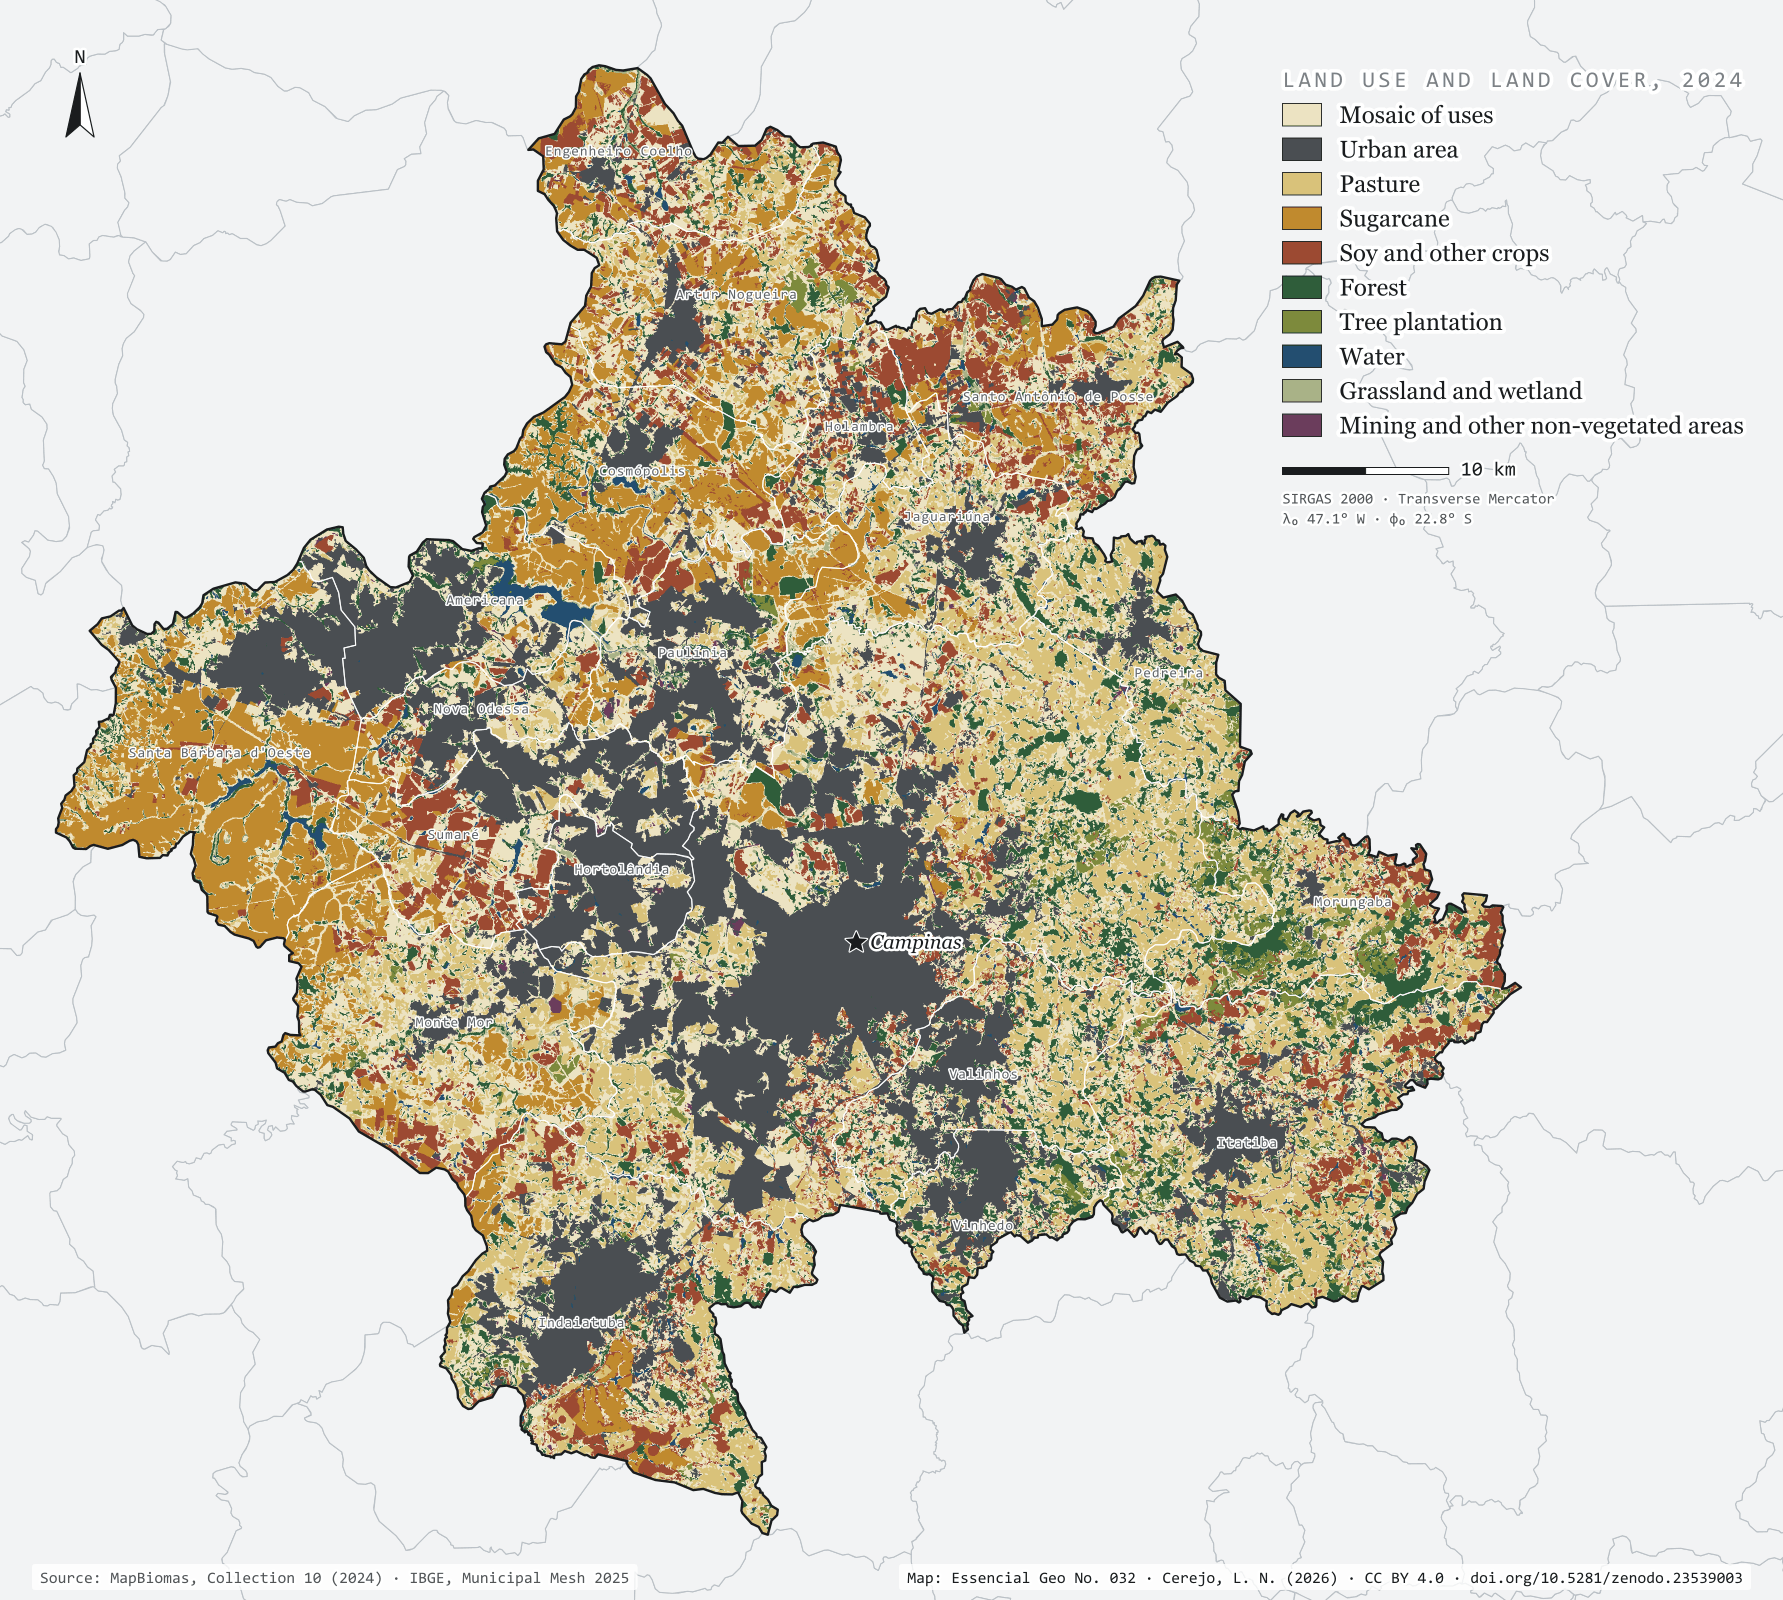
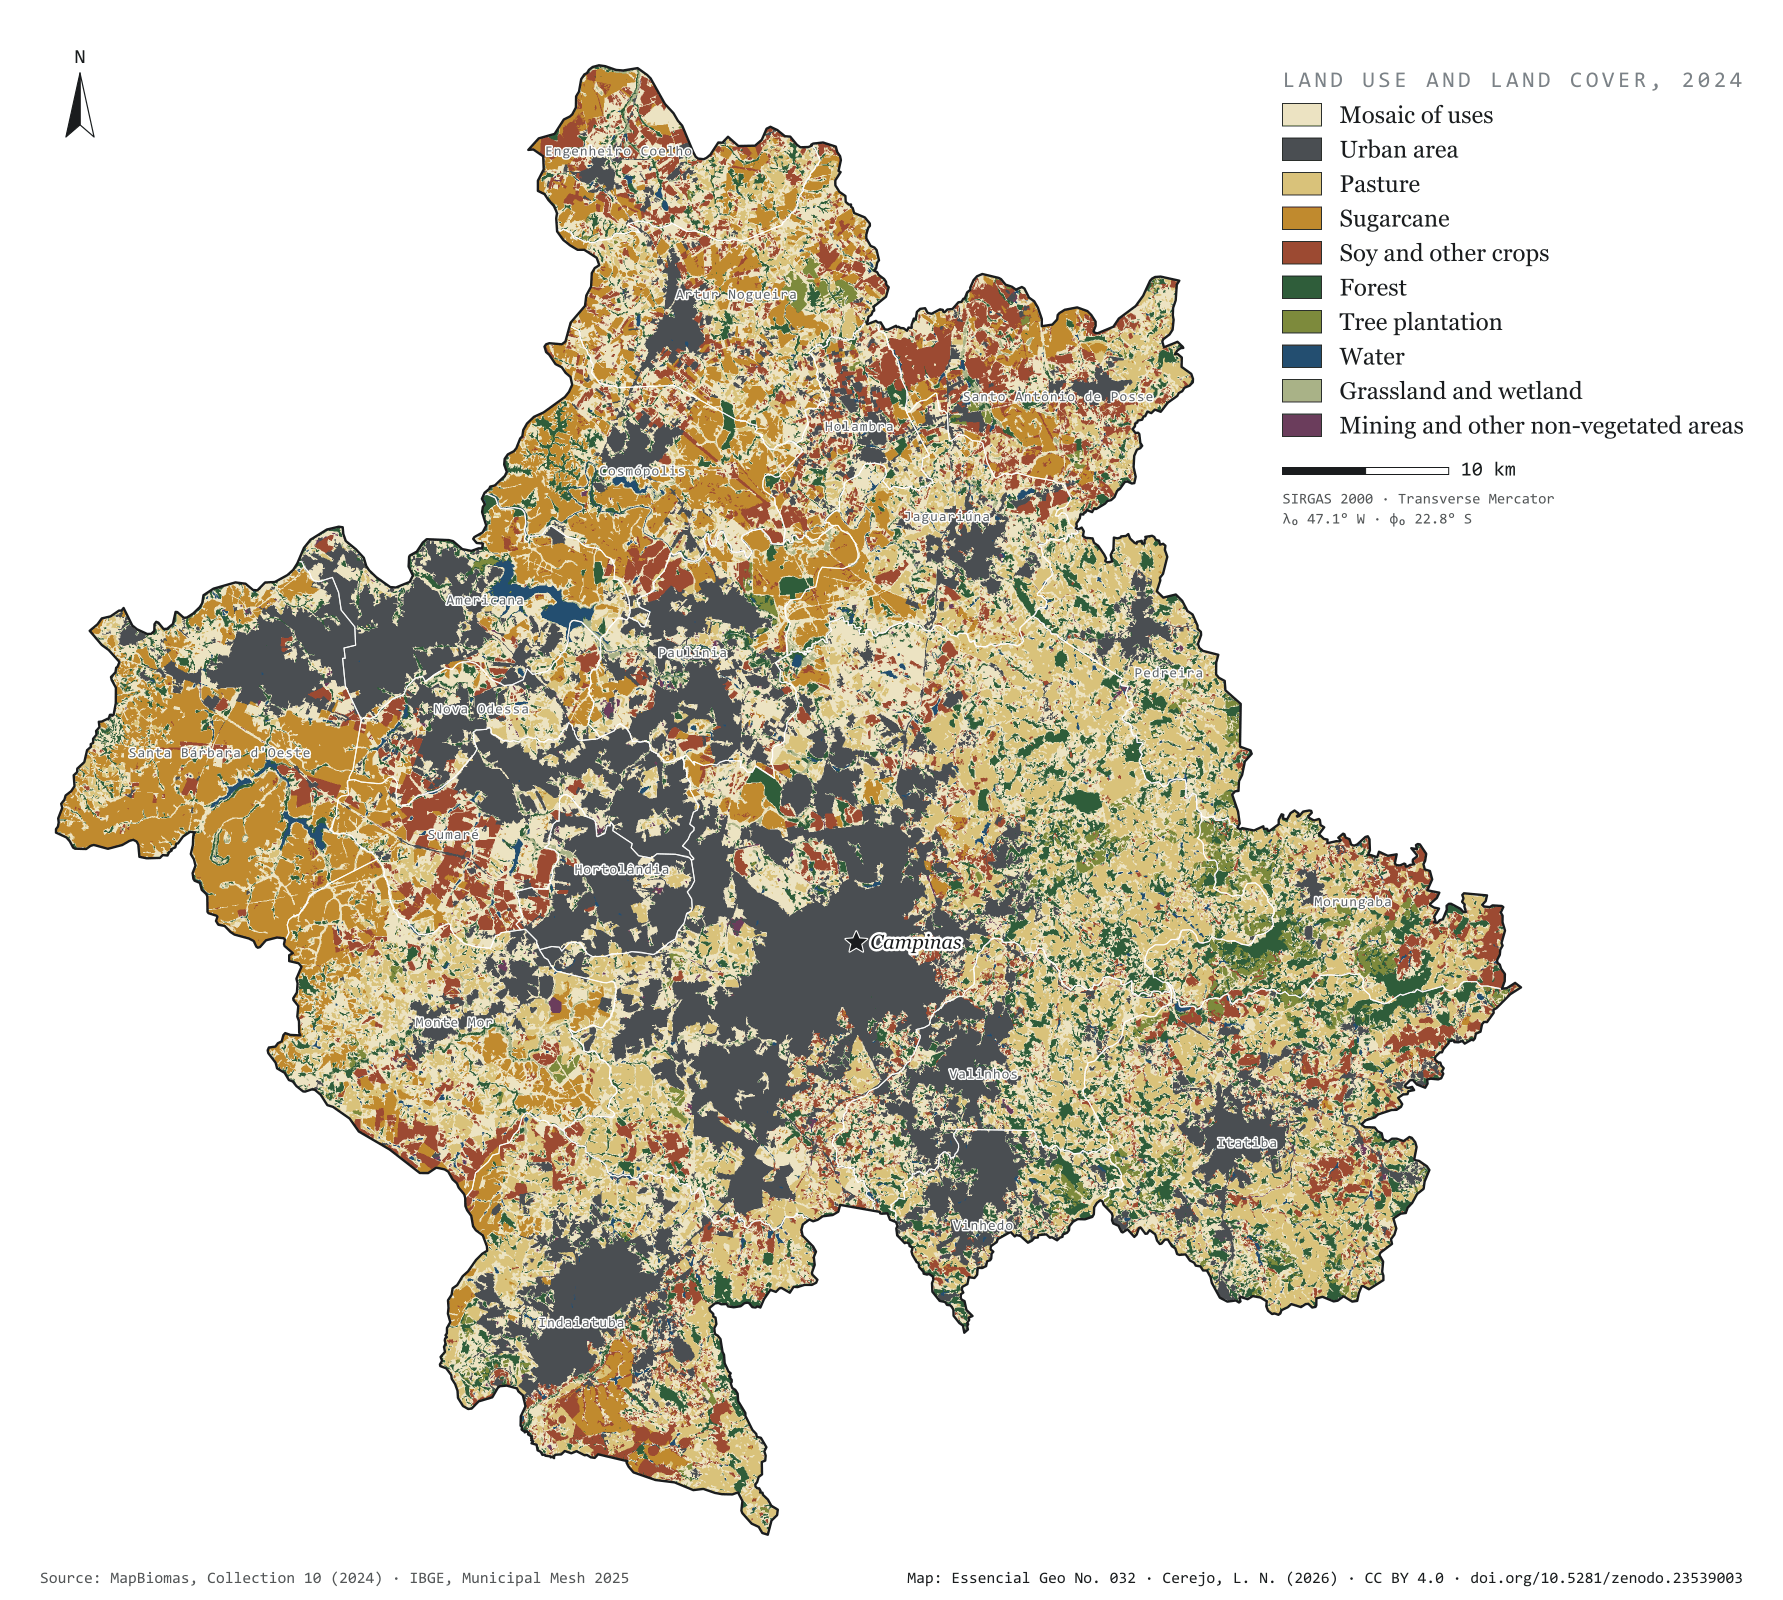
The grey patch of the city already covers 21.1% of the 3,791 km² of the Campinas Metropolitan Region, and 72.6% of Hortolândia. To the west, sugarcane takes half of Santa Bárbara d'Oeste (49.3%) and 39.7% of Cosmópolis. To the east, in the hills of Morungaba, Itatiba and Pedreira, the forest holds out in islands: 7,743 forest fragments, only 31 of them larger than 1 km². The largest, in Itatiba, covers 8.6 km². The most common class is none of these but the mosaic of uses (29.3%): pastures, small fields and country plots that the satellite cannot tell apart at 30 m. First plate of the collection “Campinas Metropolitan Region”.
Technical record · downloads · citation
At a glance
The region by land use and cover class (km²) (km²)
Mosaico de usos29.3%
Área urbanizada21.1%
Pastagem15.7%
Cana11.9%
Soja e outras lavouras9.1%
Formação florestal9.1%
Silvicultura1.6%
Água1.1%
Campo e área úmida0.8%
Mineração e outras áreas sem vegetação0.3%
Urban share of the municipality (top five) (%)
Hortolândia73
Americana43
Vinhedo37
Paulínia36
Sumaré35
Largest forest fragment
8.6km²
In Itatiba; there are 7,743 fragments, 31 of them over 1 km²
Layers
cobertura_2024rasterGeoTIFF of the 2024 classification clipped to the region, with the original MapBiomas codes and the plate’s palette in a .qml style
municipiospolygon20 municipalities: area and km² and % of each of the ten classes
MapBiomas Collection 10 classification for 2024, 30 m pixels, grouped into ten classes; each pixel’s area measured on the ellipsoid and summed for the region and for each municipality.
The map without a frame, with legend, scale, reference system and credit written on it: ready for papers, lectures and slides. In two versions: with the basemap (neighbours and sea) or only the mapped area, on white.
CEREJO, Lucas Nakamura. Uso e cobertura da terra: entre a cana e a cidade, ilhas de mata. Versão 1.0.0. [S. l.]: Zenodo, 2026. Conjunto de dados. DOI: 10.5281/zenodo.23539003. Disponível em: https://doi.org/10.5281/zenodo.23539003. Acesso em: 10 nov. 2026.
Cerejo, L. N. (2026). Uso e cobertura da terra: entre a cana e a cidade, ilhas de mata [Land use and land cover: Between cane and city, islands of forest] (Version 1.0.0) [Data set]. Zenodo. https://doi.org/10.5281/zenodo.23539003
@dataset{cerejo2026_uso_da_terra_rmc,
  author    = {Cerejo, Lucas Nakamura},
  title     = {Uso e cobertura da terra: Entre a cana e a cidade, ilhas de mata},
  year      = {2026},
  publisher = {Zenodo},
  version   = {1.0.0},
  doi       = {10.5281/zenodo.23539003},
  url       = {https://doi.org/10.5281/zenodo.23539003},
  language  = {portuguese},
  note      = {English title: Land use and land cover: Between cane and city, islands of forest. Licence CC BY 4.0}
}
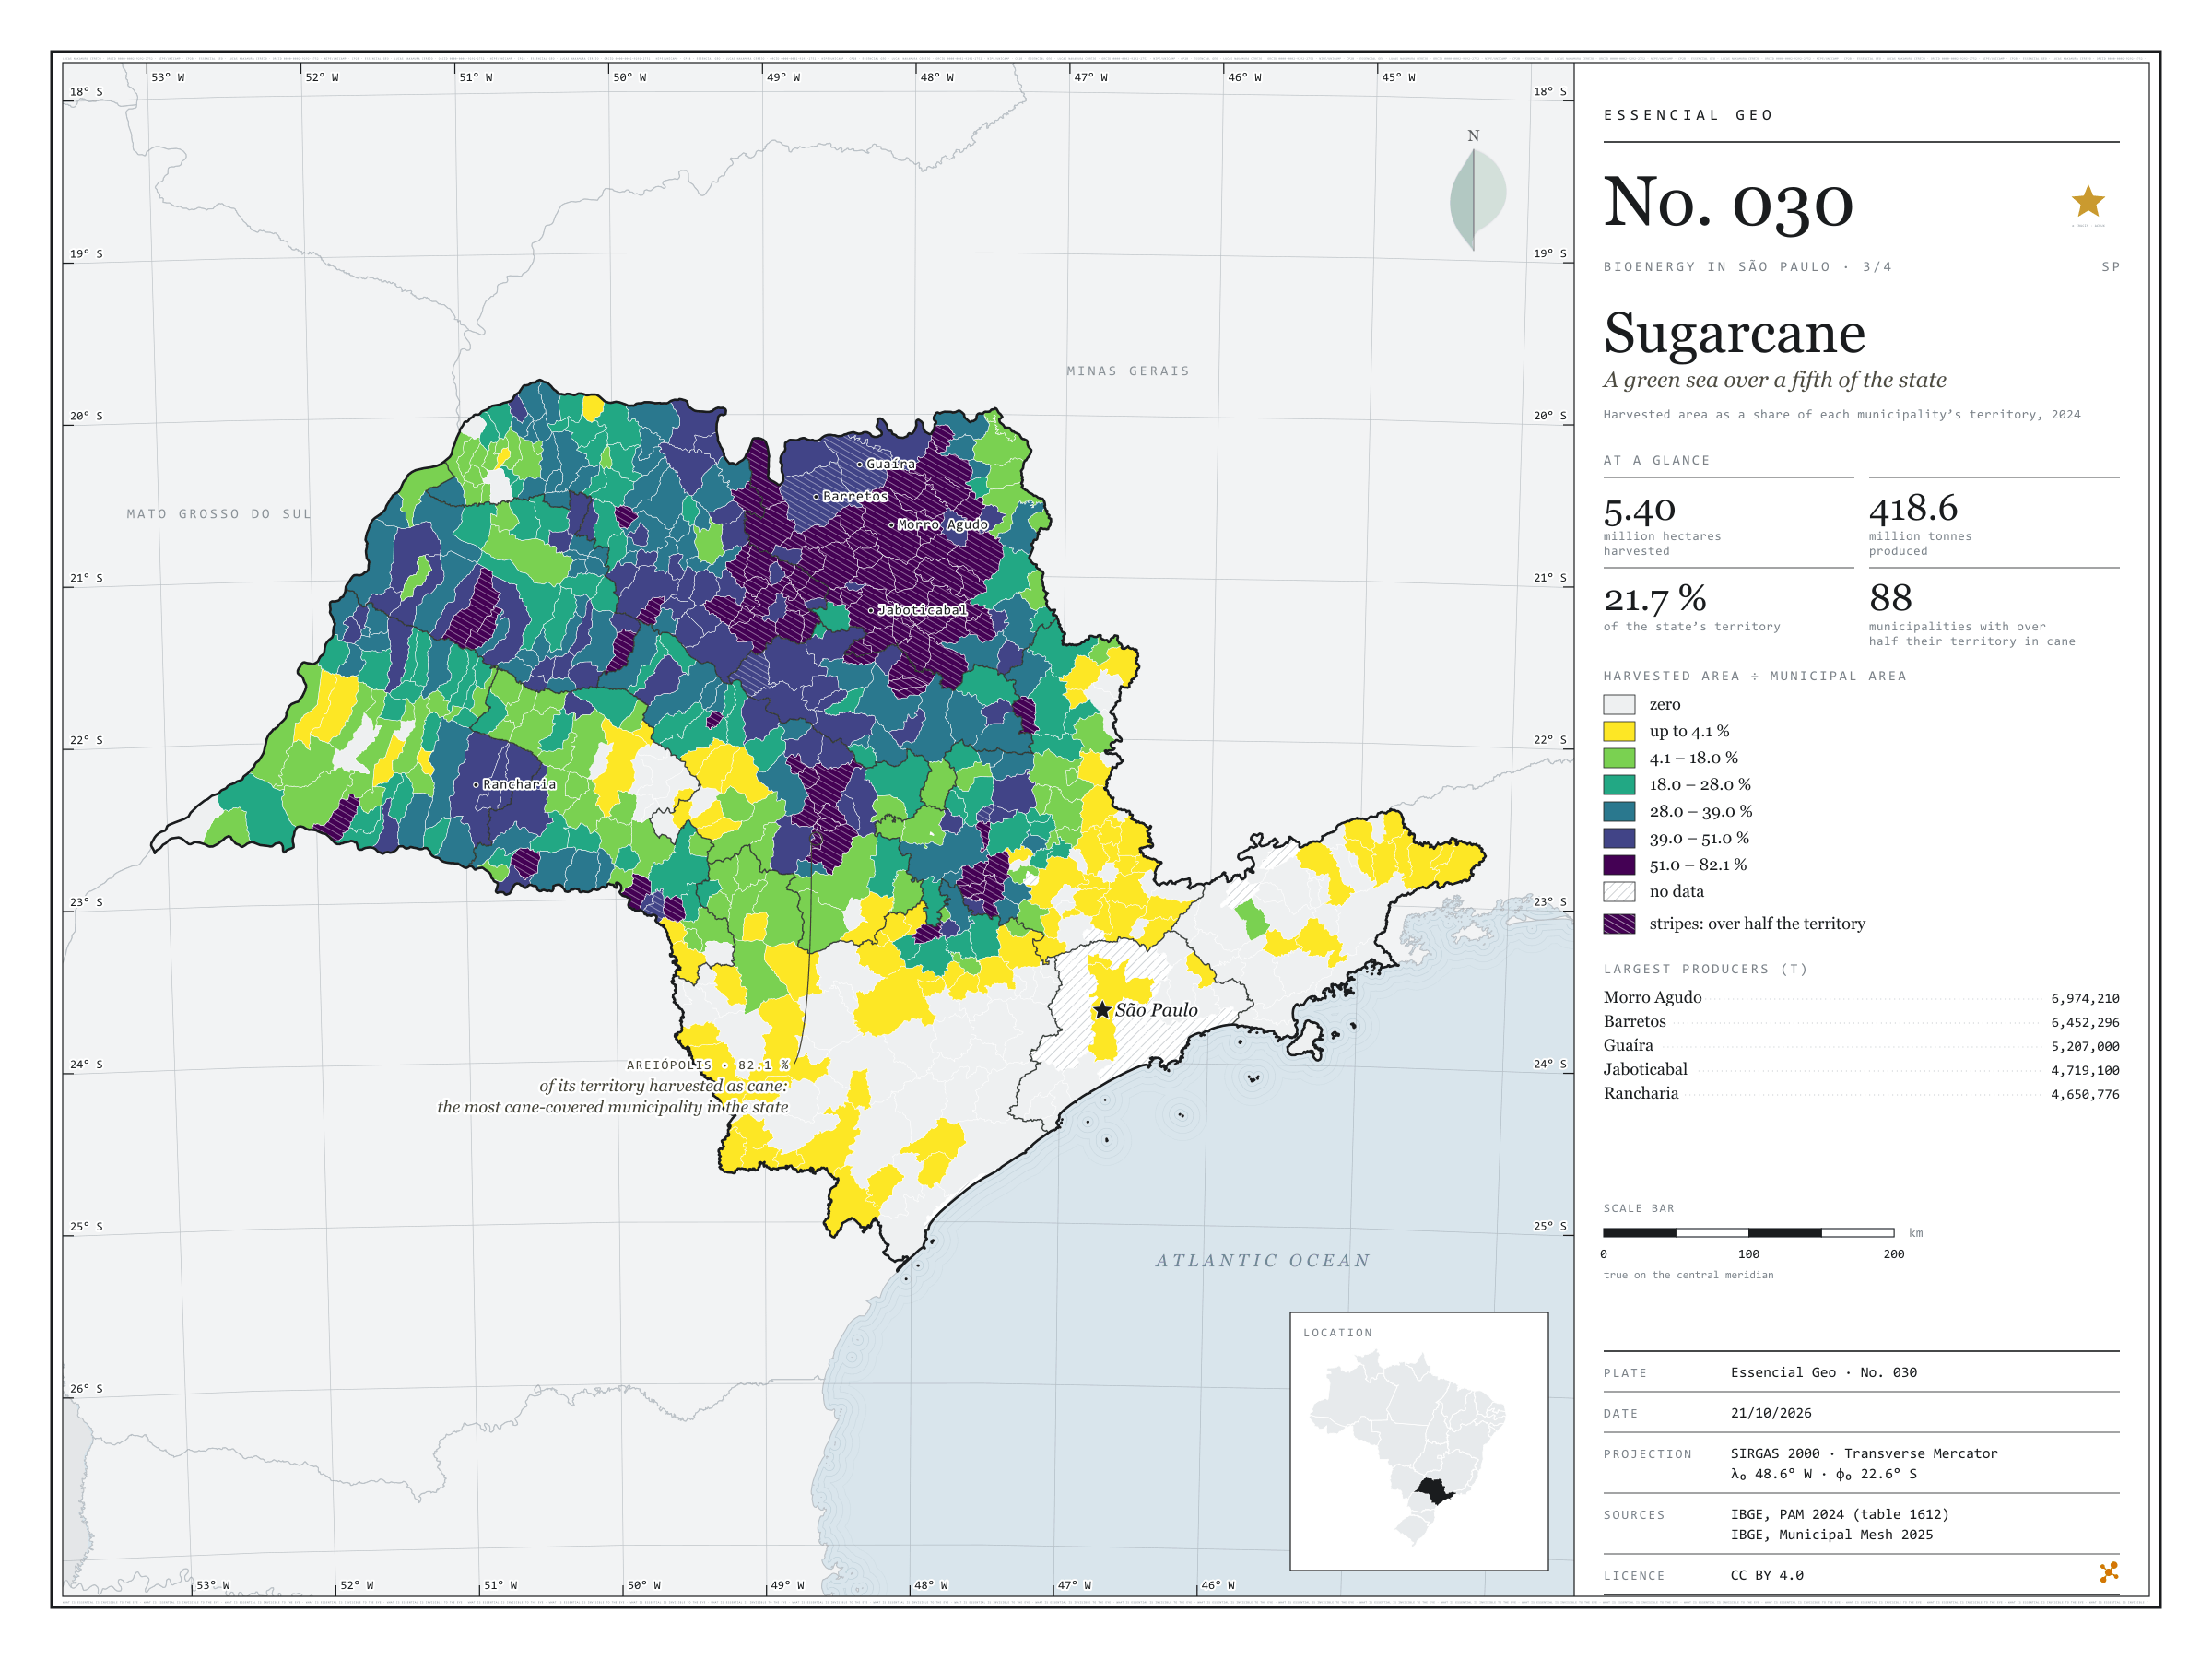
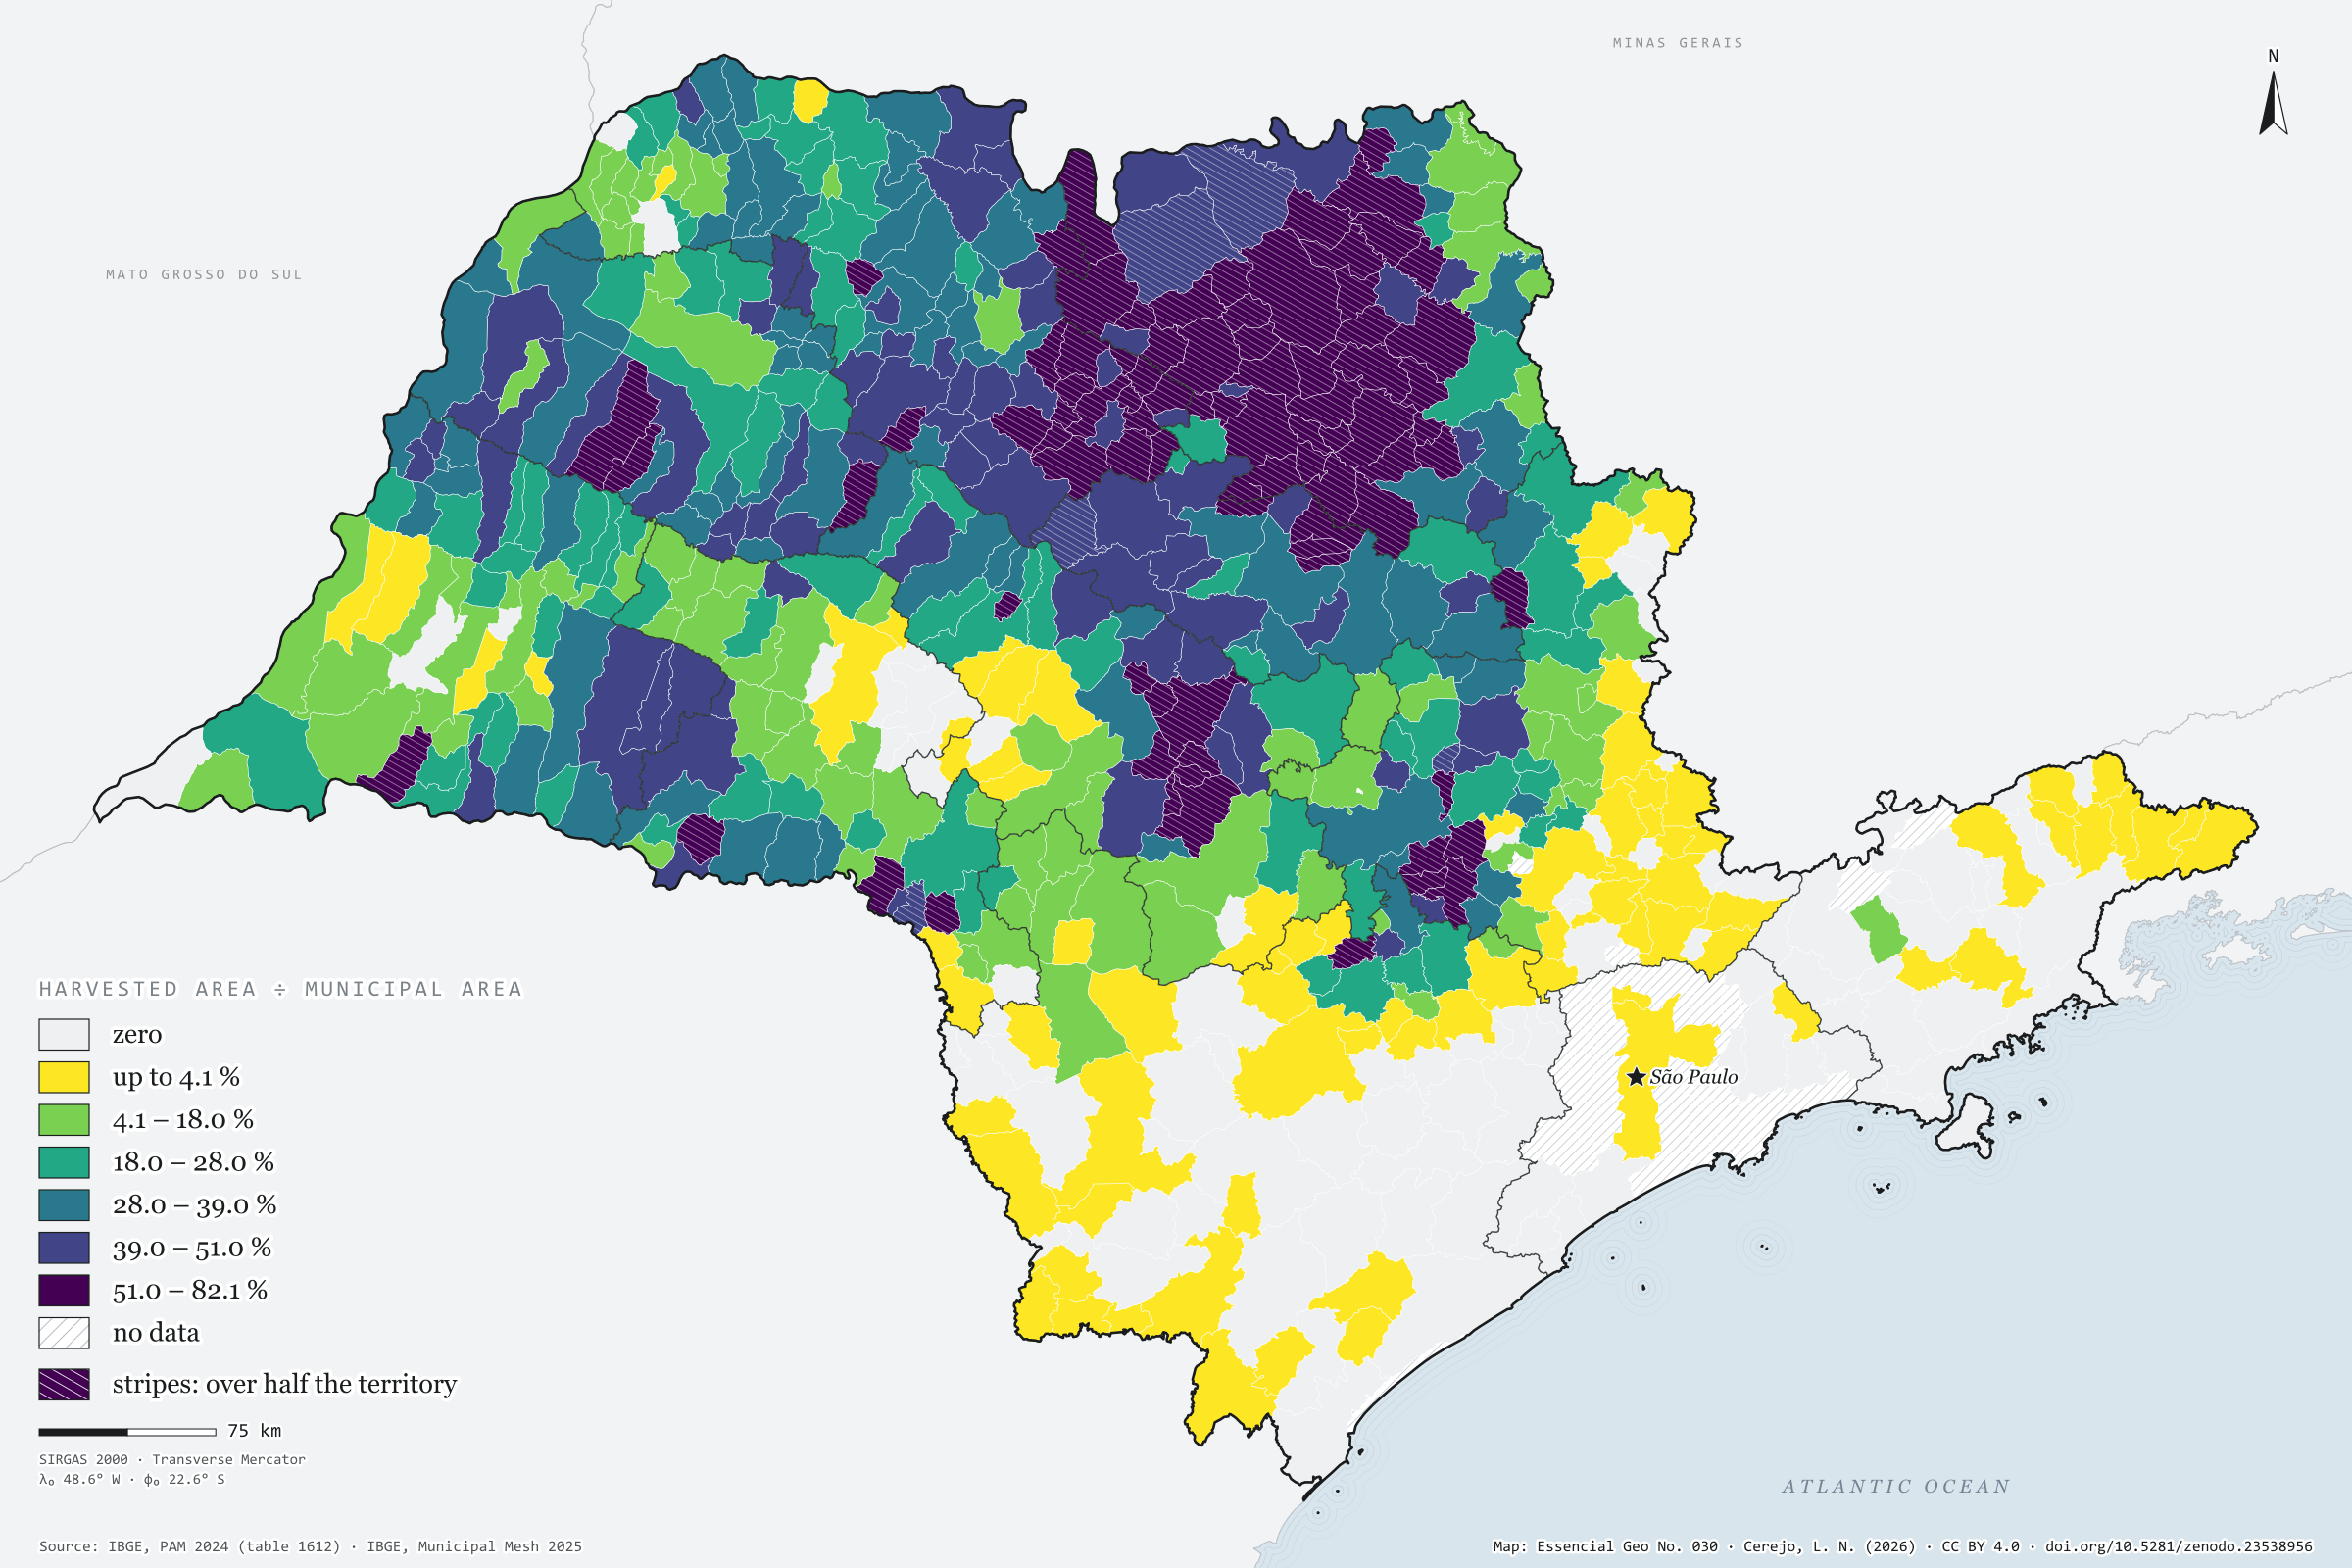
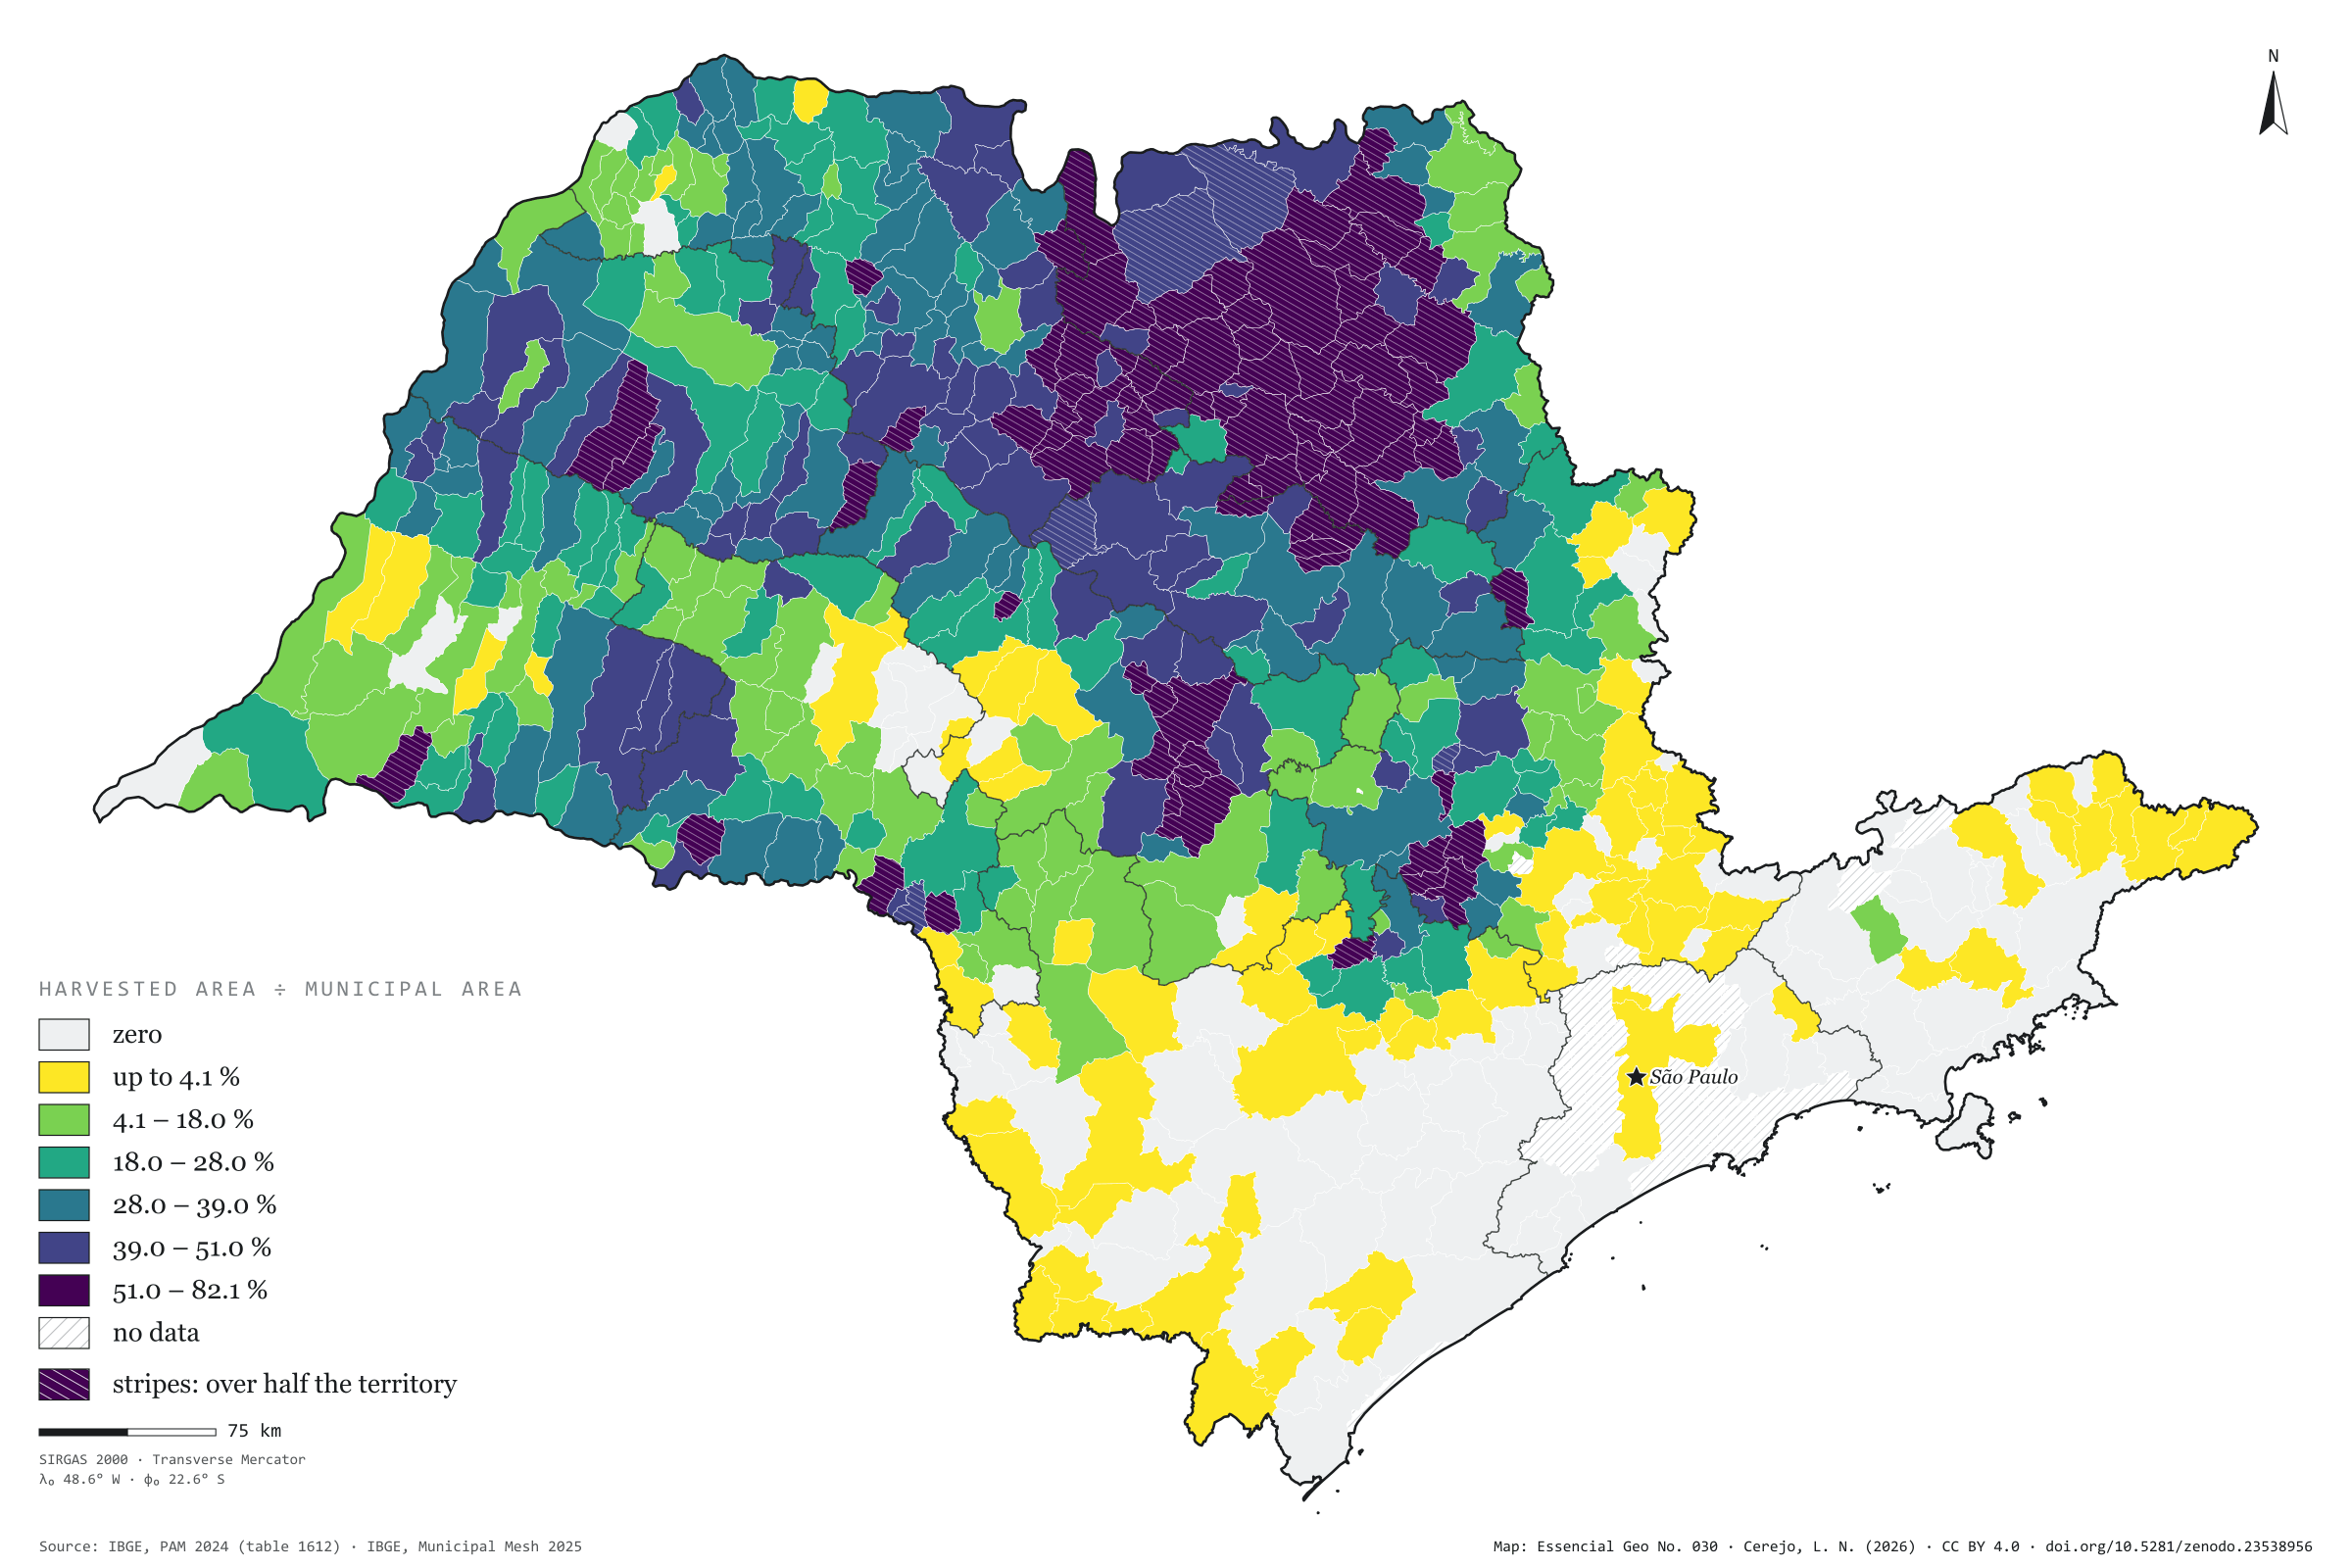
In 2024, São Paulo’s cane fields were harvested over 5.40 million hectares, 21.7% of the state, and yielded 418.6 million tonnes of cane. In 88 municipalities the harvested area exceeds half the territory; in Areiópolis it reaches 82%, and in Jaboticabal 81%. The map shows the dark patch that covers the north and centre of the state and has Morro Agudo as its largest producer (7.0 million tonnes), and it shows where the patch ends: in the Paraíba valley, the Ribeira valley and Greater São Paulo, cane all but disappears. Every tonne harvested leaves bagasse and straw, and every litre of ethanol leaves vinasse; this is the map São Paulo’s bioenergy rests on. Third plate of the collection “Bioenergy in São Paulo”.
Technical record · downloads · citation
At a glance
Harvested area
5,398,676ha
21.7% of the state’s territory; 508 municipalities with harvested cane
Production
418,569,112t
In 88 municipalities, harvested cane covers more than half the territory
Largest producers (t)
Morro Agudo6,974,210
Barretos6,452,296
Guaíra5,207,000
Jaboticabal4,719,100
Rancharia4,650,776
Layers
municipiospolygon645 municipalities: harvested area (ha), production (t), share of territory (%) and yield (t/ha)
regioes_intermediariaspolygon11 intermediate geographic regions
Harvested area and production of sugarcane from PAM 2024 joined to the Municipal Mesh by IBGE code; harvested area divided by municipal area, in six quantile classes.
The map without a frame, with legend, scale, reference system and credit written on it: ready for papers, lectures and slides. In two versions: with the basemap (neighbours and sea) or only the mapped area, on white.
CEREJO, Lucas Nakamura. Cana-de-açúcar: um mar verde sobre um quinto do estado. Versão 1.0.0. [S. l.]: Zenodo, 2026. Conjunto de dados. DOI: 10.5281/zenodo.23538956. Disponível em: https://doi.org/10.5281/zenodo.23538956. Acesso em: 10 nov. 2026.
Cerejo, L. N. (2026). Cana-de-açúcar: um mar verde sobre um quinto do estado [Sugarcane: A green sea over a fifth of the state] (Version 1.0.0) [Data set]. Zenodo. https://doi.org/10.5281/zenodo.23538956
@dataset{cerejo2026_cana_de_acucar_sp,
  author    = {Cerejo, Lucas Nakamura},
  title     = {Cana-de-açúcar: Um mar verde sobre um quinto do estado},
  year      = {2026},
  publisher = {Zenodo},
  version   = {1.0.0},
  doi       = {10.5281/zenodo.23538956},
  url       = {https://doi.org/10.5281/zenodo.23538956},
  language  = {portuguese},
  note      = {English title: Sugarcane: A green sea over a fifth of the state. Licence CC BY 4.0}
}