Skip to content
Essencial

No. 048 Land use From field to biomethane 4/5

Maize and soybean

Soybean overtook maize, and the straw stayed on the ground

Record, downloads and citation
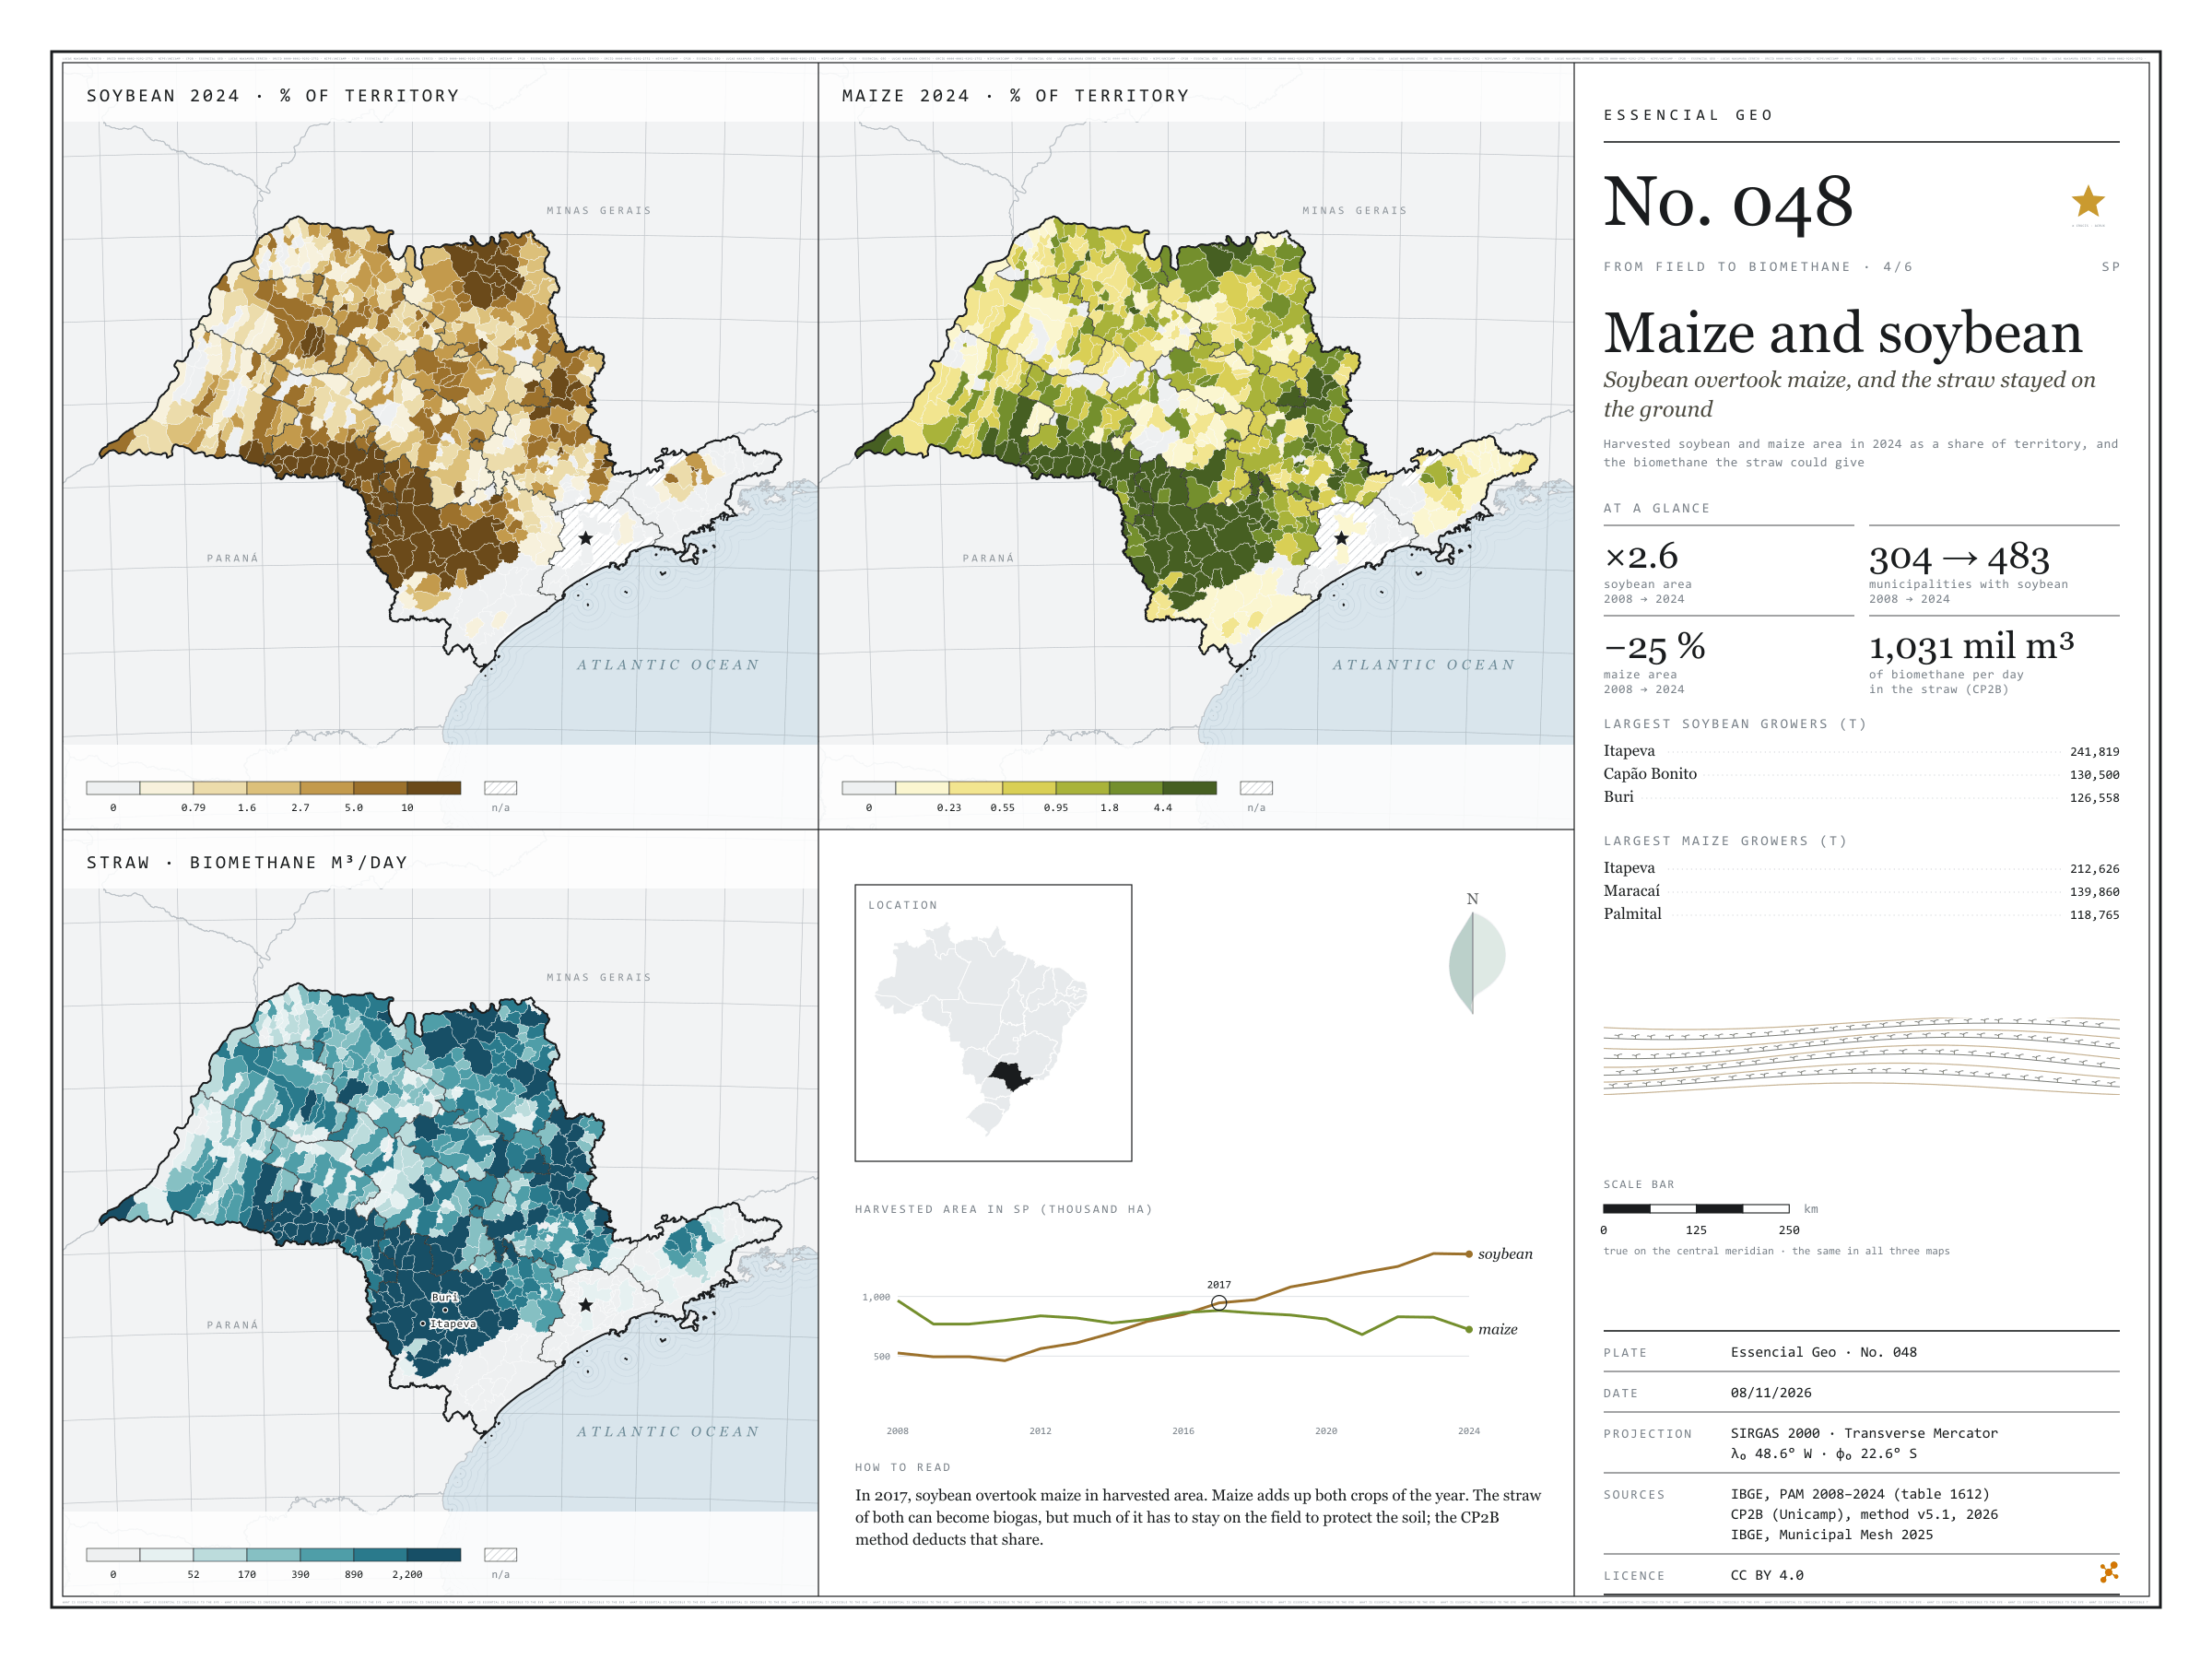
Fig. 048 São Paulo state (SP) EPSG:4674 Source: IBGE, CP2B (Unicamp)

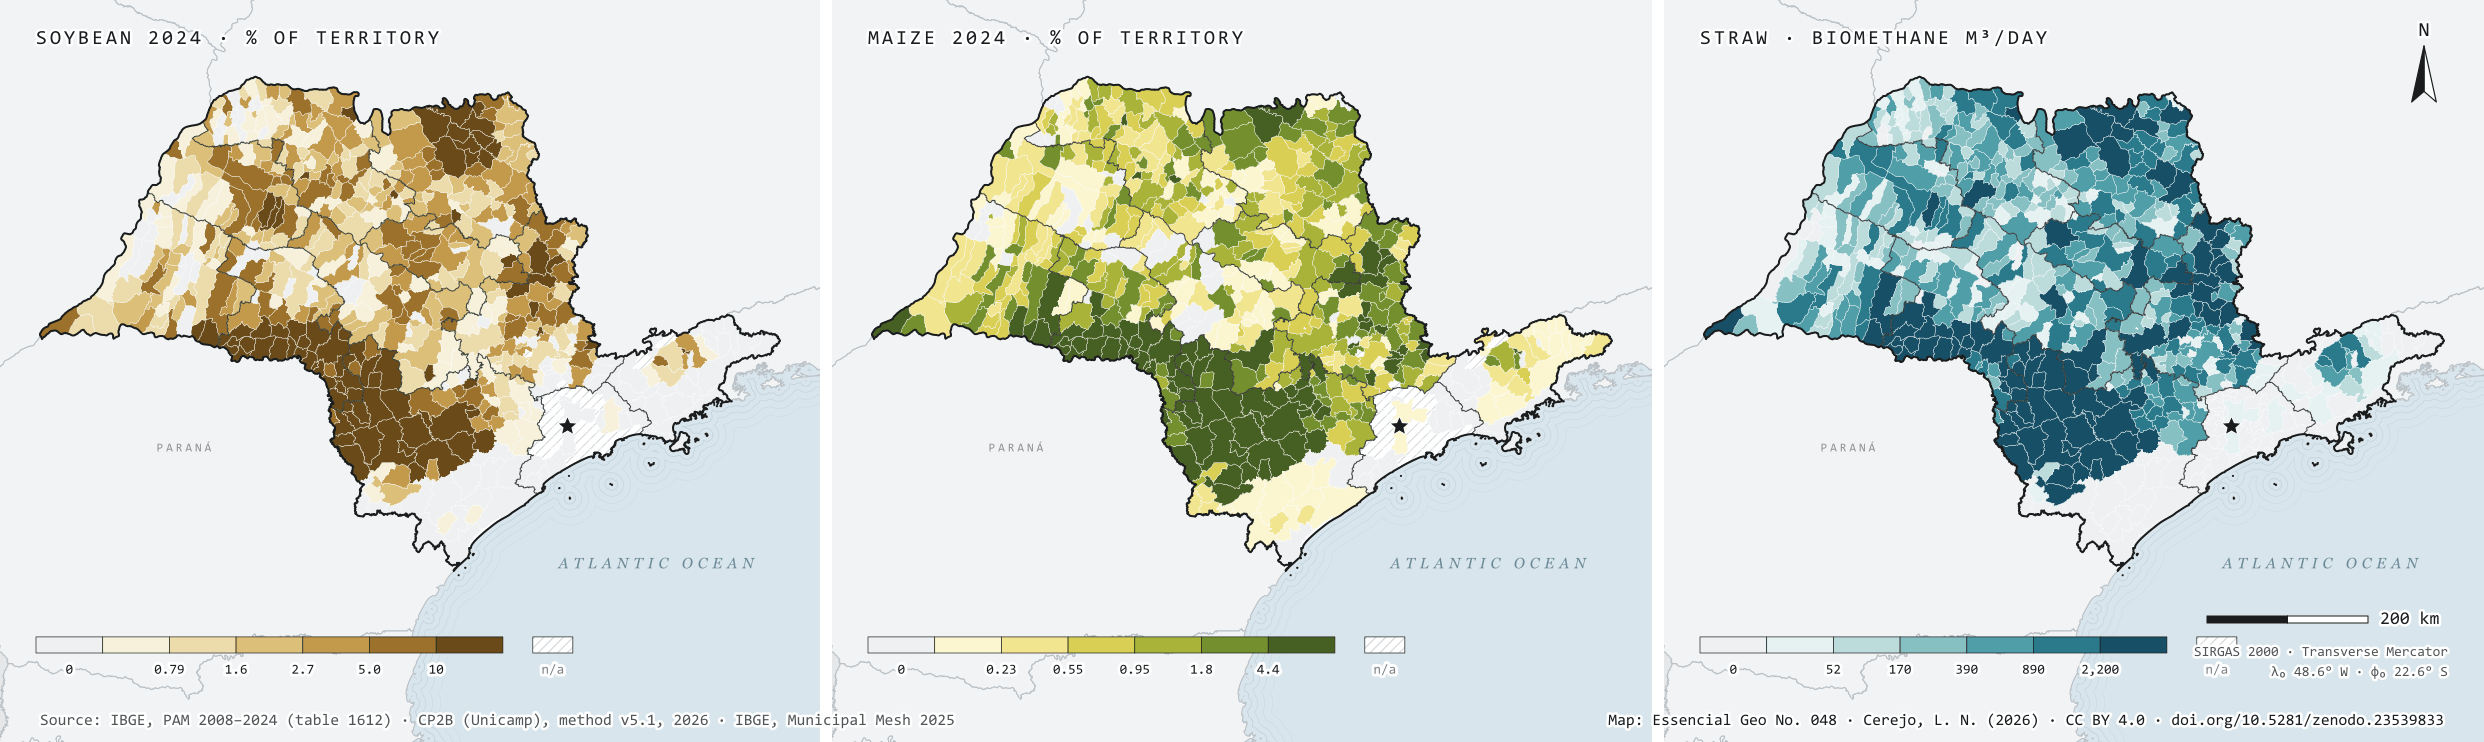
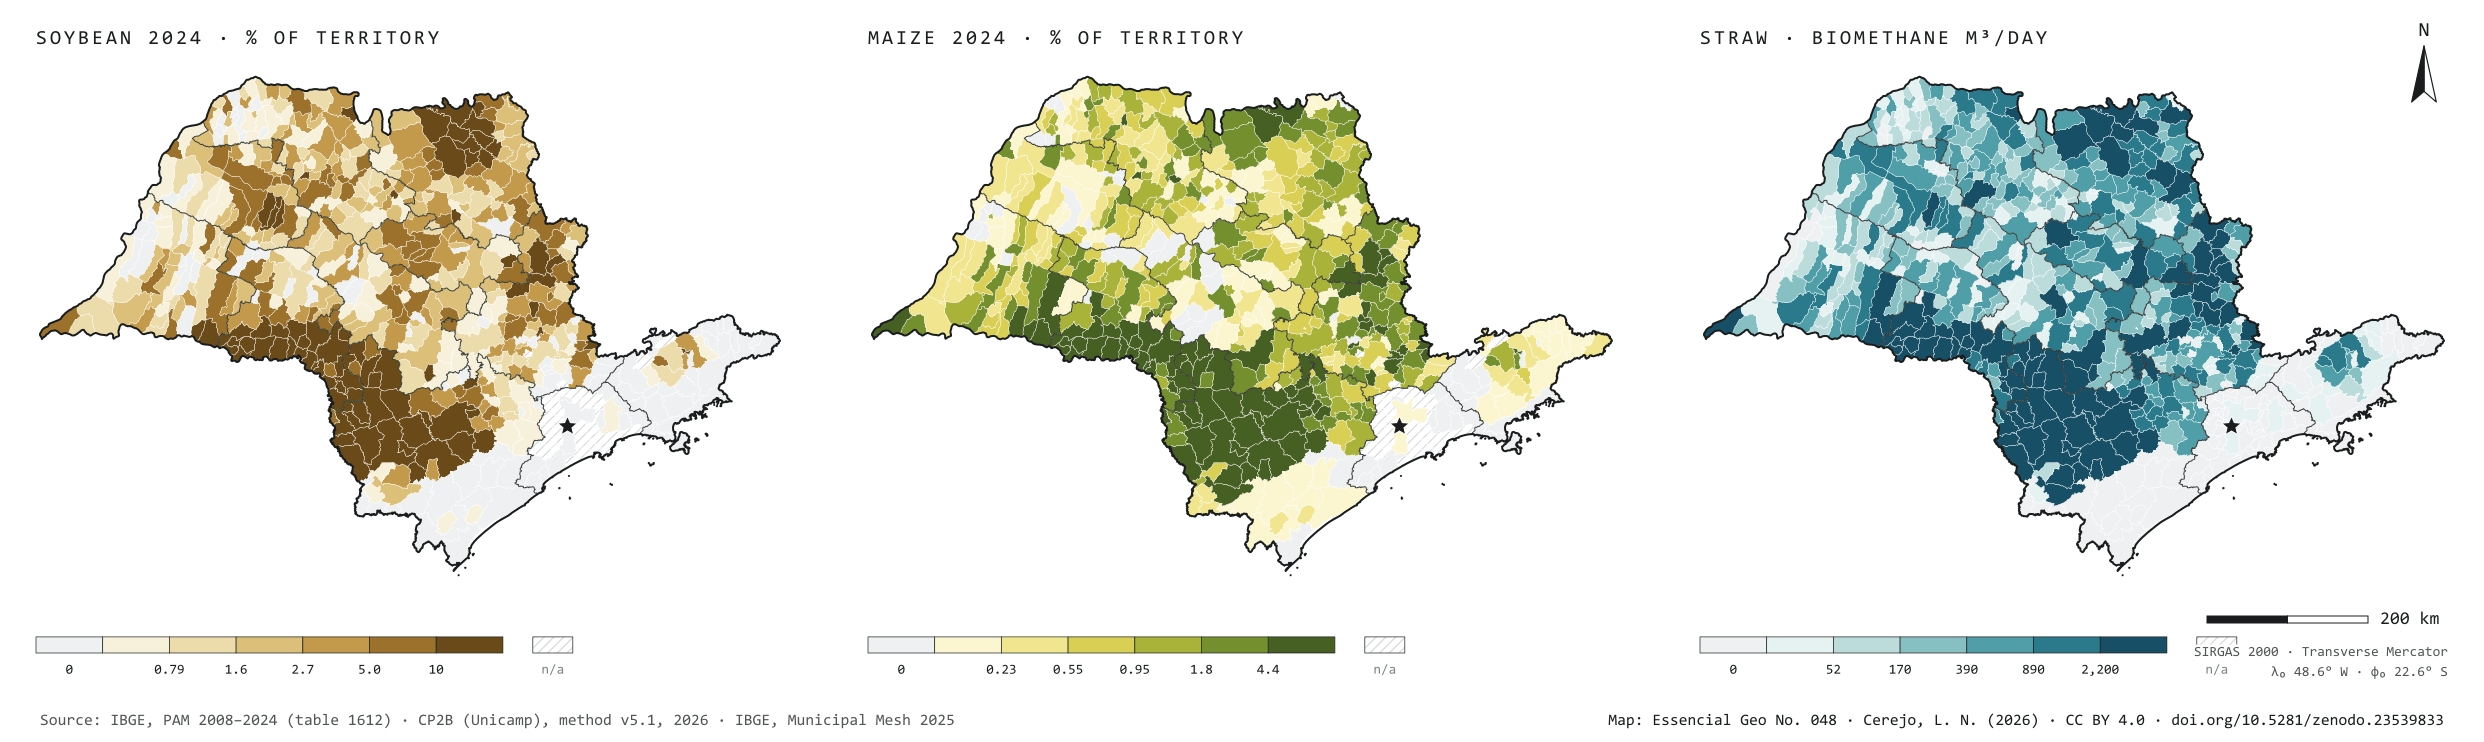
In 2008, São Paulo harvested 525,940 hectares of soybean and 965,907 of maize. In 2024, 1.36 million hectares of soybean, 2.6 times more, and 723,128 of maize, 25% less; soybean overtook maize in 2017. It spread from 304 to 483 municipalities and grew above all in the south of the state. In the Sorocaba region the area went from 82,000 to 468,000 hectares, and Itapeva is the largest grower of both grains. In Ibirarema and Salto Grande, harvested soybean covers almost two thirds of the municipality. The straw of both grains could give 1.03 million m³ of biomethane a day under the CP2B method, 41% of it in the Sorocaba region. That is what remains after leaving on the field the share that protects the soil. Fourth plate of the collection “From field to biomethane”.

Technical record · downloads · citation

At a glance

Harvested soybean area in 2024

1,355,595 ha

It was 525,940 ha in 2008; maize fell from 965,907 to 723,128 ha

Biomethane from maize and soybean straw

1,031,325 m³/day

Accessible level of the CP2B method, reference scenario: 528,467 from maize and 502,858 from soybean

Largest soybean growers in 2024 (t)
  • Itapeva 241,819
  • Capão Bonito 130,500
  • Buri 126,558
  • Itaberá 103,650
  • Itapetininga 99,000

Layers

  • municipios polygon 645 municipalities: harvested area and production of soybean and maize in 2008 and 2024, share of territory in 2024 (%) and straw biomethane (m³/day)
  • regioes_intermediarias polygon 11 intermediate geographic regions
  • limite_estadual polygon State boundary

Metadata

Sources
IBGE — Municipal Agricultural Production (PAM), table 1612: temporary crops (2008 a 2024)
CP2B (Unicamp) — biogas and biomethane potential by municipality, method v5.1 (2026)
IBGE — Municipal Mesh 2025 (2025)
Extent
São Paulo state (SP)
CRS / Projection
SIRGAS 2000 (EPSG:4674)
EPSG:4674
Software
Python · GeoPandas · GDAL · QGIS · Node.js · d3-geo
Method
Harvested soybean and maize area from PAM 2024 divided by municipal area, in six quantile classes; straw biomethane potential at the accessible level of the CP2B method, in six quantile classes.
Version
v1.0.0
Licence
CC BY 4.0

Downloads

Figure to reuse

The map without a frame, with legend, scale, reference system and credit written on it: ready for papers, lectures and slides. In two versions: with the basemap (neighbours and sea) or only the mapped area, on white.

Point a camera at it to open this page.

How to cite

Cerejo, L. N. (2026). Milho e soja: a soja passou o milho, e a palha ficou no chão [Maize and soybean: Soybean overtook maize, and the straw stayed on the ground] (Version 1.0.0) [Data set]. Zenodo. https://doi.org/10.5281/zenodo.23539833

How to read this plate area, projection, scale, legend and source · 3 terms
1 Area
São Paulo state (SP) The area the plate covers. Outside it, neighbours and sea are drawn in grey, just for orientation.
2 Coordinates and projection
SIRGAS 2000 (EPSG:4674) The layers are in SIRGAS 2000; the drawing’s projection is written in the colophon at the foot of the panel.
3 Scale
Graphic scale bar in the panel The scale bar is true on the central meridian; away from it, measured distances vary a little.
4 Legend and layers
3 layers in the GeoPackage · polygon Read the legend before the map: it tells you whether a colour is a rate or a class, and whether a circle is a total.
5 Sources
IBGE (2008 a 2024); CP2B (Unicamp) (2026); IBGE (2025) Every figure comes from a public source, with its year. The data sheet gives each one’s address.

Terms on this plate

Harvest year
Cane years are not calendar years: in the Centre-South the harvest runs from April to March; in the Northeast, from September to August. That is why the two regions crush in opposite months.
Cane straw
Tops and leaves left in the field by mechanised harvesting since cane burning ended. Some can be collected for energy; some must stay to protect the soil.
Biomethane
Biogas upgraded, with most of the CO₂ removed, to ANP’s specification, at which point it replaces natural gas in the pipeline, in industry and in the lorry’s tank.

Download

Layers, table and figures, under CC BY 4.0. Cite with the DOI.

Full record and citation

Method notes · No. 048

Maize and soybean in São Paulo, 2024, and the biomethane in the straw

Português · English

Plate No. 048, the fourth of six in the collection From field to biomethane: the two grains that share the south of the state, and the straw left on the field after harvest.

What the files contain

Layer (GPKG)GeometryContents
municipiospolygon645 municipalities: CD_MUN, NM_MUN, intermediate region, area_km2; for soja (soybean) and milho (maize), harvested area (_area_2008_ha, _area_2024_ha) and production (_producao_2008_t, _producao_2024_t); soja_pct and milho_pct (harvested area in 2024 ÷ municipal area, in %); palha_milho_m3_dia, palha_soja_m3_dia and palhas_m3_dia
regioes_intermediariaspolygon11 intermediate geographic regions
limite_estadualpolygonoutline of the state

The GPKG is zipped and attached to the agro-sp-2026 release. The municipios layer carries the plate’s three QGIS styles: soja (the default), milho and palhas.

The CSV holds the same table, in UTF-8, without geometry. An empty cell means no data; 0 means zero.

Method

  1. Table 1612 of the Municipal Agricultural Production survey on SIDRA: Harvested area and Quantity produced, products Soybean (grain) and Maize (grain), years 2008 to 2024, municipal level, São Paulo state. Maize adds up both crops of the year.
  2. Share of territory = harvested area in 2024 ÷ (municipal area × 100), in %, in six quantile classes of the municipalities with positive area.
  3. Straw: potential of the maize straw and soybean straw substrates in the CP2B method v5.1 (Unicamp, version of 24/09/2026), reference scenario, level N4 (accessible), in m³ of biomethane equivalent per day, in six quantile classes.
  4. The chart in the fourth panel adds up the state’s harvested area year by year; the circle marks the first year soybean exceeded maize.

Limitations

  • The CP2B potential is modelled: it starts from the straw the harvest leaves, deducts the share that must stay on the soil and what is lost in collection, and accounts for the distance to where the gas would be produced. In 108 municipalities the straw gives zero at the accessible level.
  • The 2024 soybean harvest was 3.63 million tonnes, 27% below 2023; the map shows harvested area, which varies less than production from one year to the next.
  • 45 municipalities have no data in the 2024 PAM, most of them in Greater São Paulo and on the coast.
  • Soybean and maize areas can overlap: the same field can give soybean in summer and maize as a second crop.

Data licence

Open data from IBGE, free to use with attribution. The CP2B (Unicamp) potential is published here with the centre’s permission; cite “CP2B (Unicamp), method v5.1, 2026”.

View this map’s folder on GitHub

Technical record

Technical record · No. 048

Maize and soybean

At a glance

Harvested soybean area in 2024

1,355,595 ha

It was 525,940 ha in 2008; maize fell from 965,907 to 723,128 ha

Biomethane from maize and soybean straw

1,031,325 m³/day

Accessible level of the CP2B method, reference scenario: 528,467 from maize and 502,858 from soybean

Largest soybean growers in 2024 (t)
  • Itapeva 241,819
  • Capão Bonito 130,500
  • Buri 126,558
  • Itaberá 103,650
  • Itapetininga 99,000

Layers

  • municipios polygon 645 municipalities: harvested area and production of soybean and maize in 2008 and 2024, share of territory in 2024 (%) and straw biomethane (m³/day)
  • regioes_intermediarias polygon 11 intermediate geographic regions
  • limite_estadual polygon State boundary

Metadata

Sources
IBGE — Municipal Agricultural Production (PAM), table 1612: temporary crops (2008 a 2024)
CP2B (Unicamp) — biogas and biomethane potential by municipality, method v5.1 (2026)
IBGE — Municipal Mesh 2025 (2025)
Extent
São Paulo state (SP)
CRS / Projection
SIRGAS 2000 (EPSG:4674)
EPSG:4674
Software
Python · GeoPandas · GDAL · QGIS · Node.js · d3-geo
Method
Harvested soybean and maize area from PAM 2024 divided by municipal area, in six quantile classes; straw biomethane potential at the accessible level of the CP2B method, in six quantile classes.
Version
v1.0.0
Licence
CC BY 4.0

Downloads

Figure to reuse

The map without a frame, with legend, scale, reference system and credit written on it: ready for papers, lectures and slides. In two versions: with the basemap (neighbours and sea) or only the mapped area, on white.

Point a camera at it to open this page.

How to cite

Cerejo, L. N. (2026). Milho e soja: a soja passou o milho, e a palha ficou no chão [Maize and soybean: Soybean overtook maize, and the straw stayed on the ground] (Version 1.0.0) [Data set]. Zenodo. https://doi.org/10.5281/zenodo.23539833

100%