Waste and sewage
The city is a gas crop too
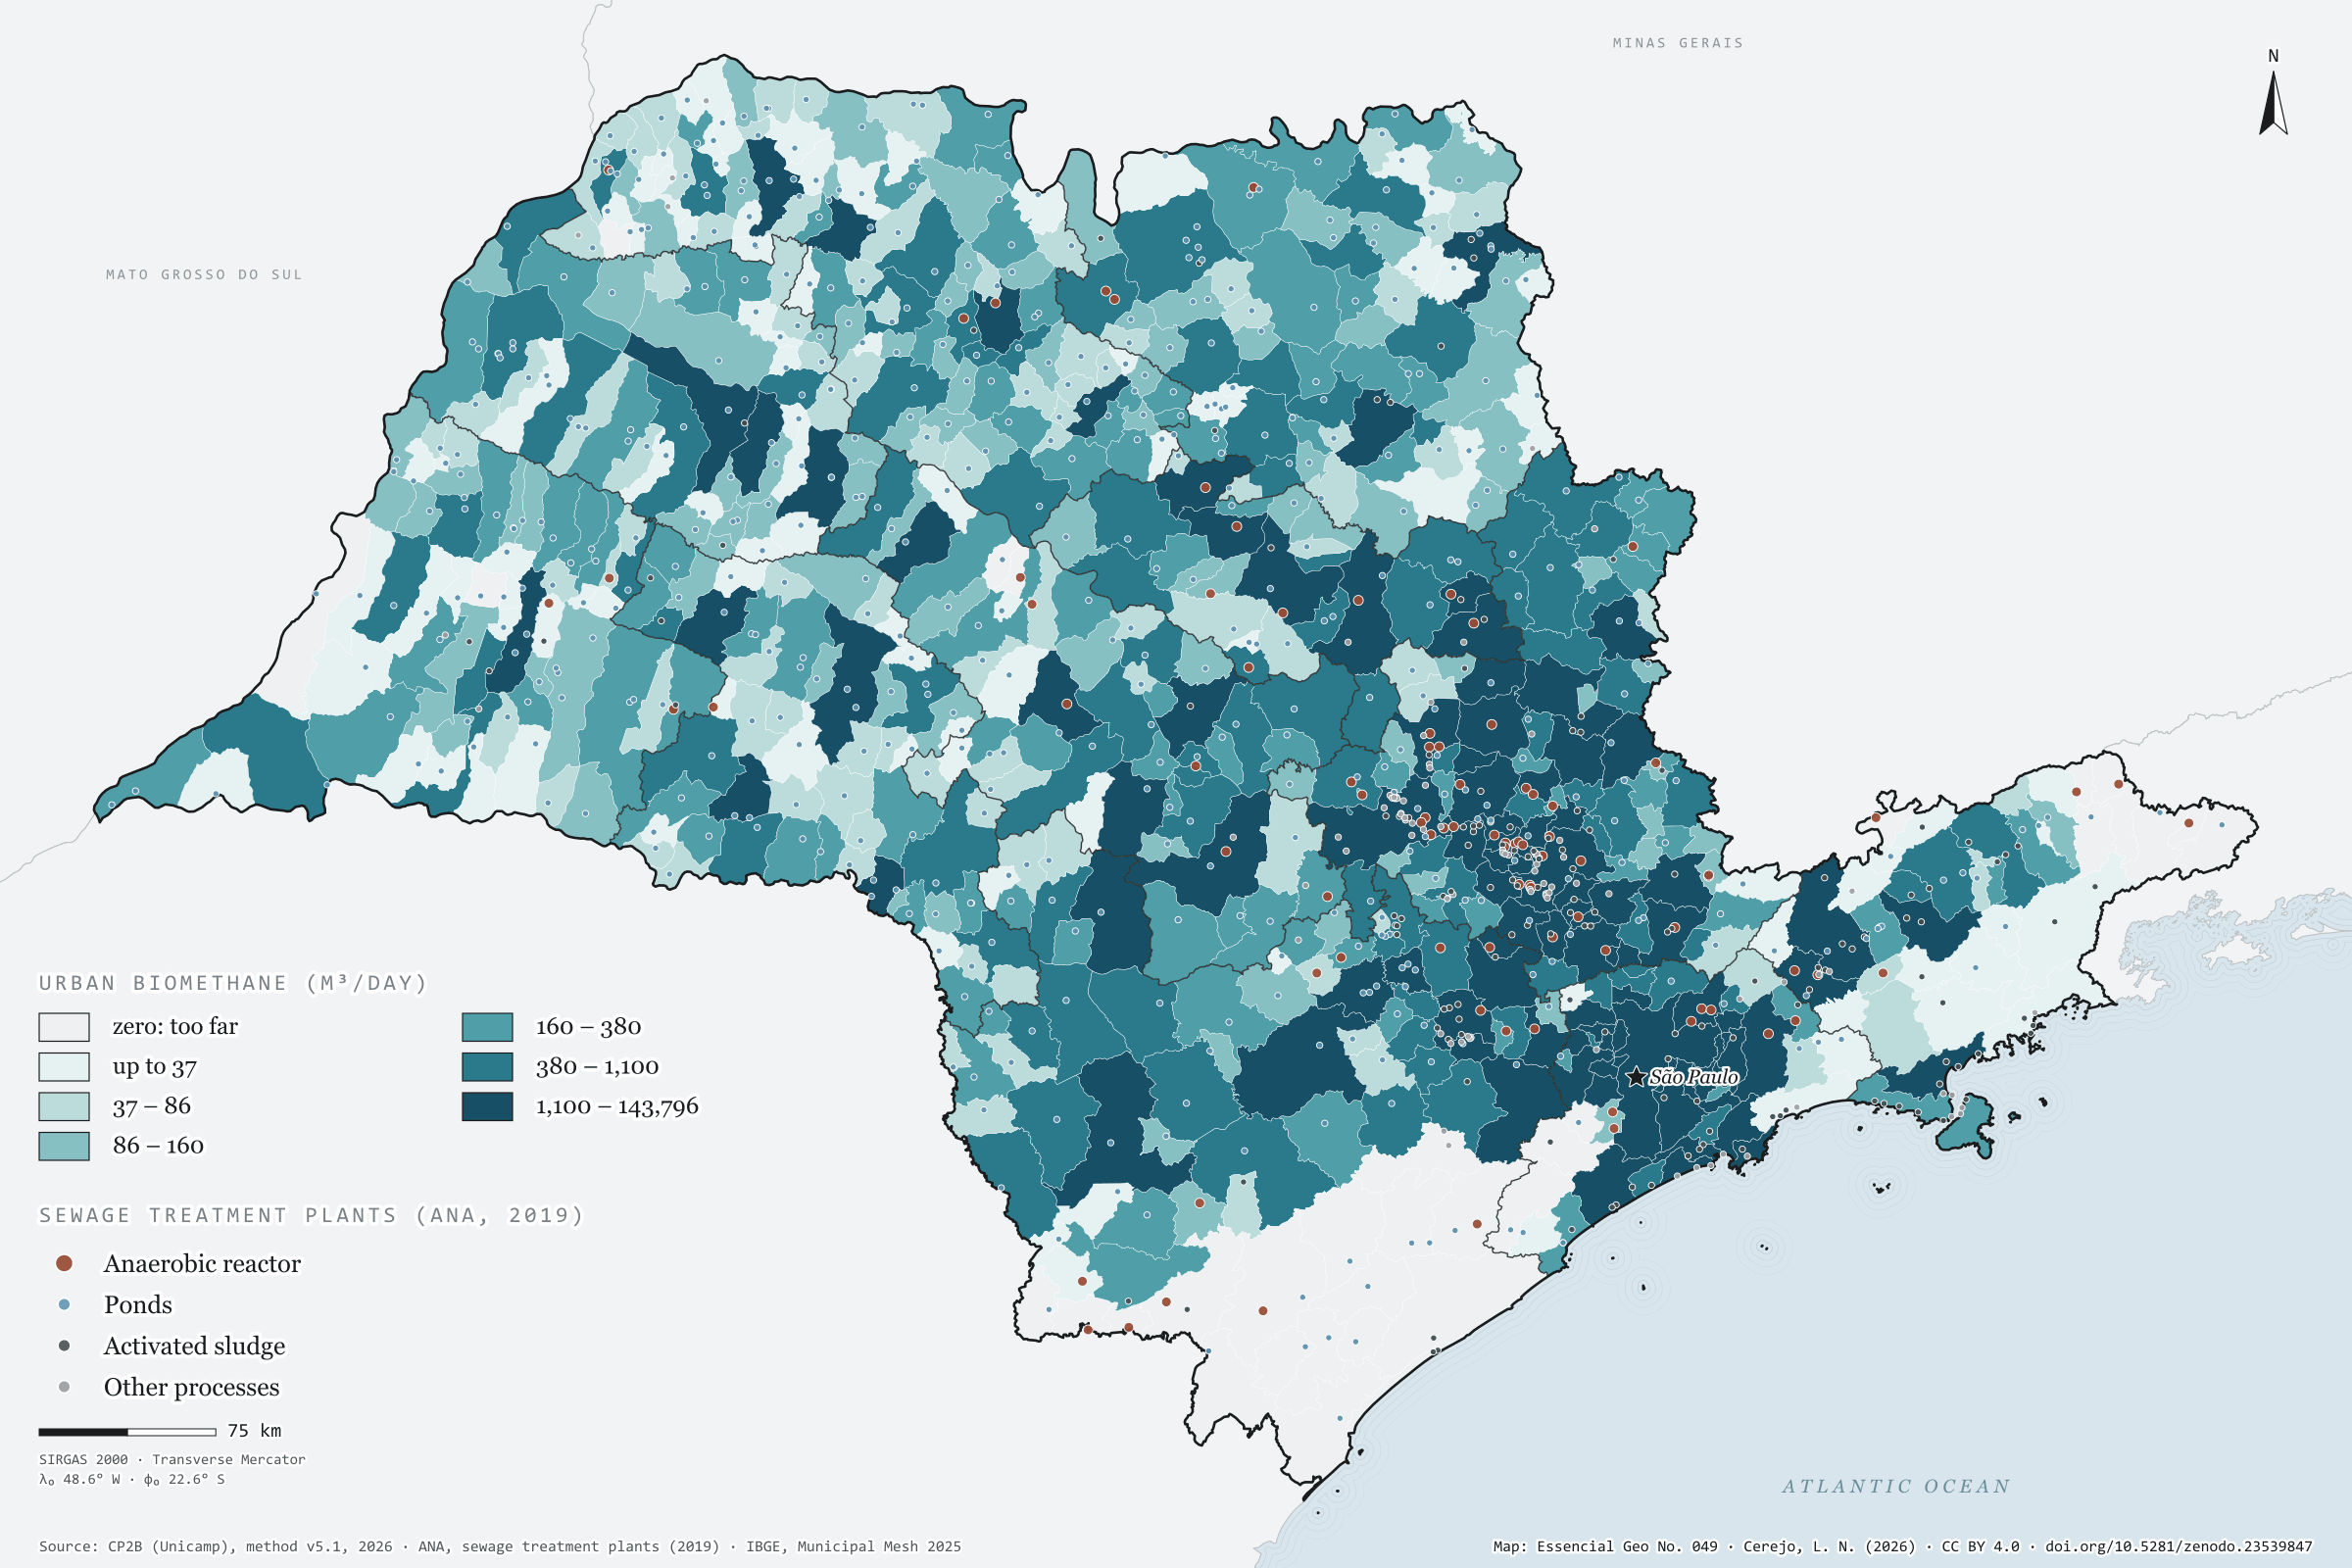
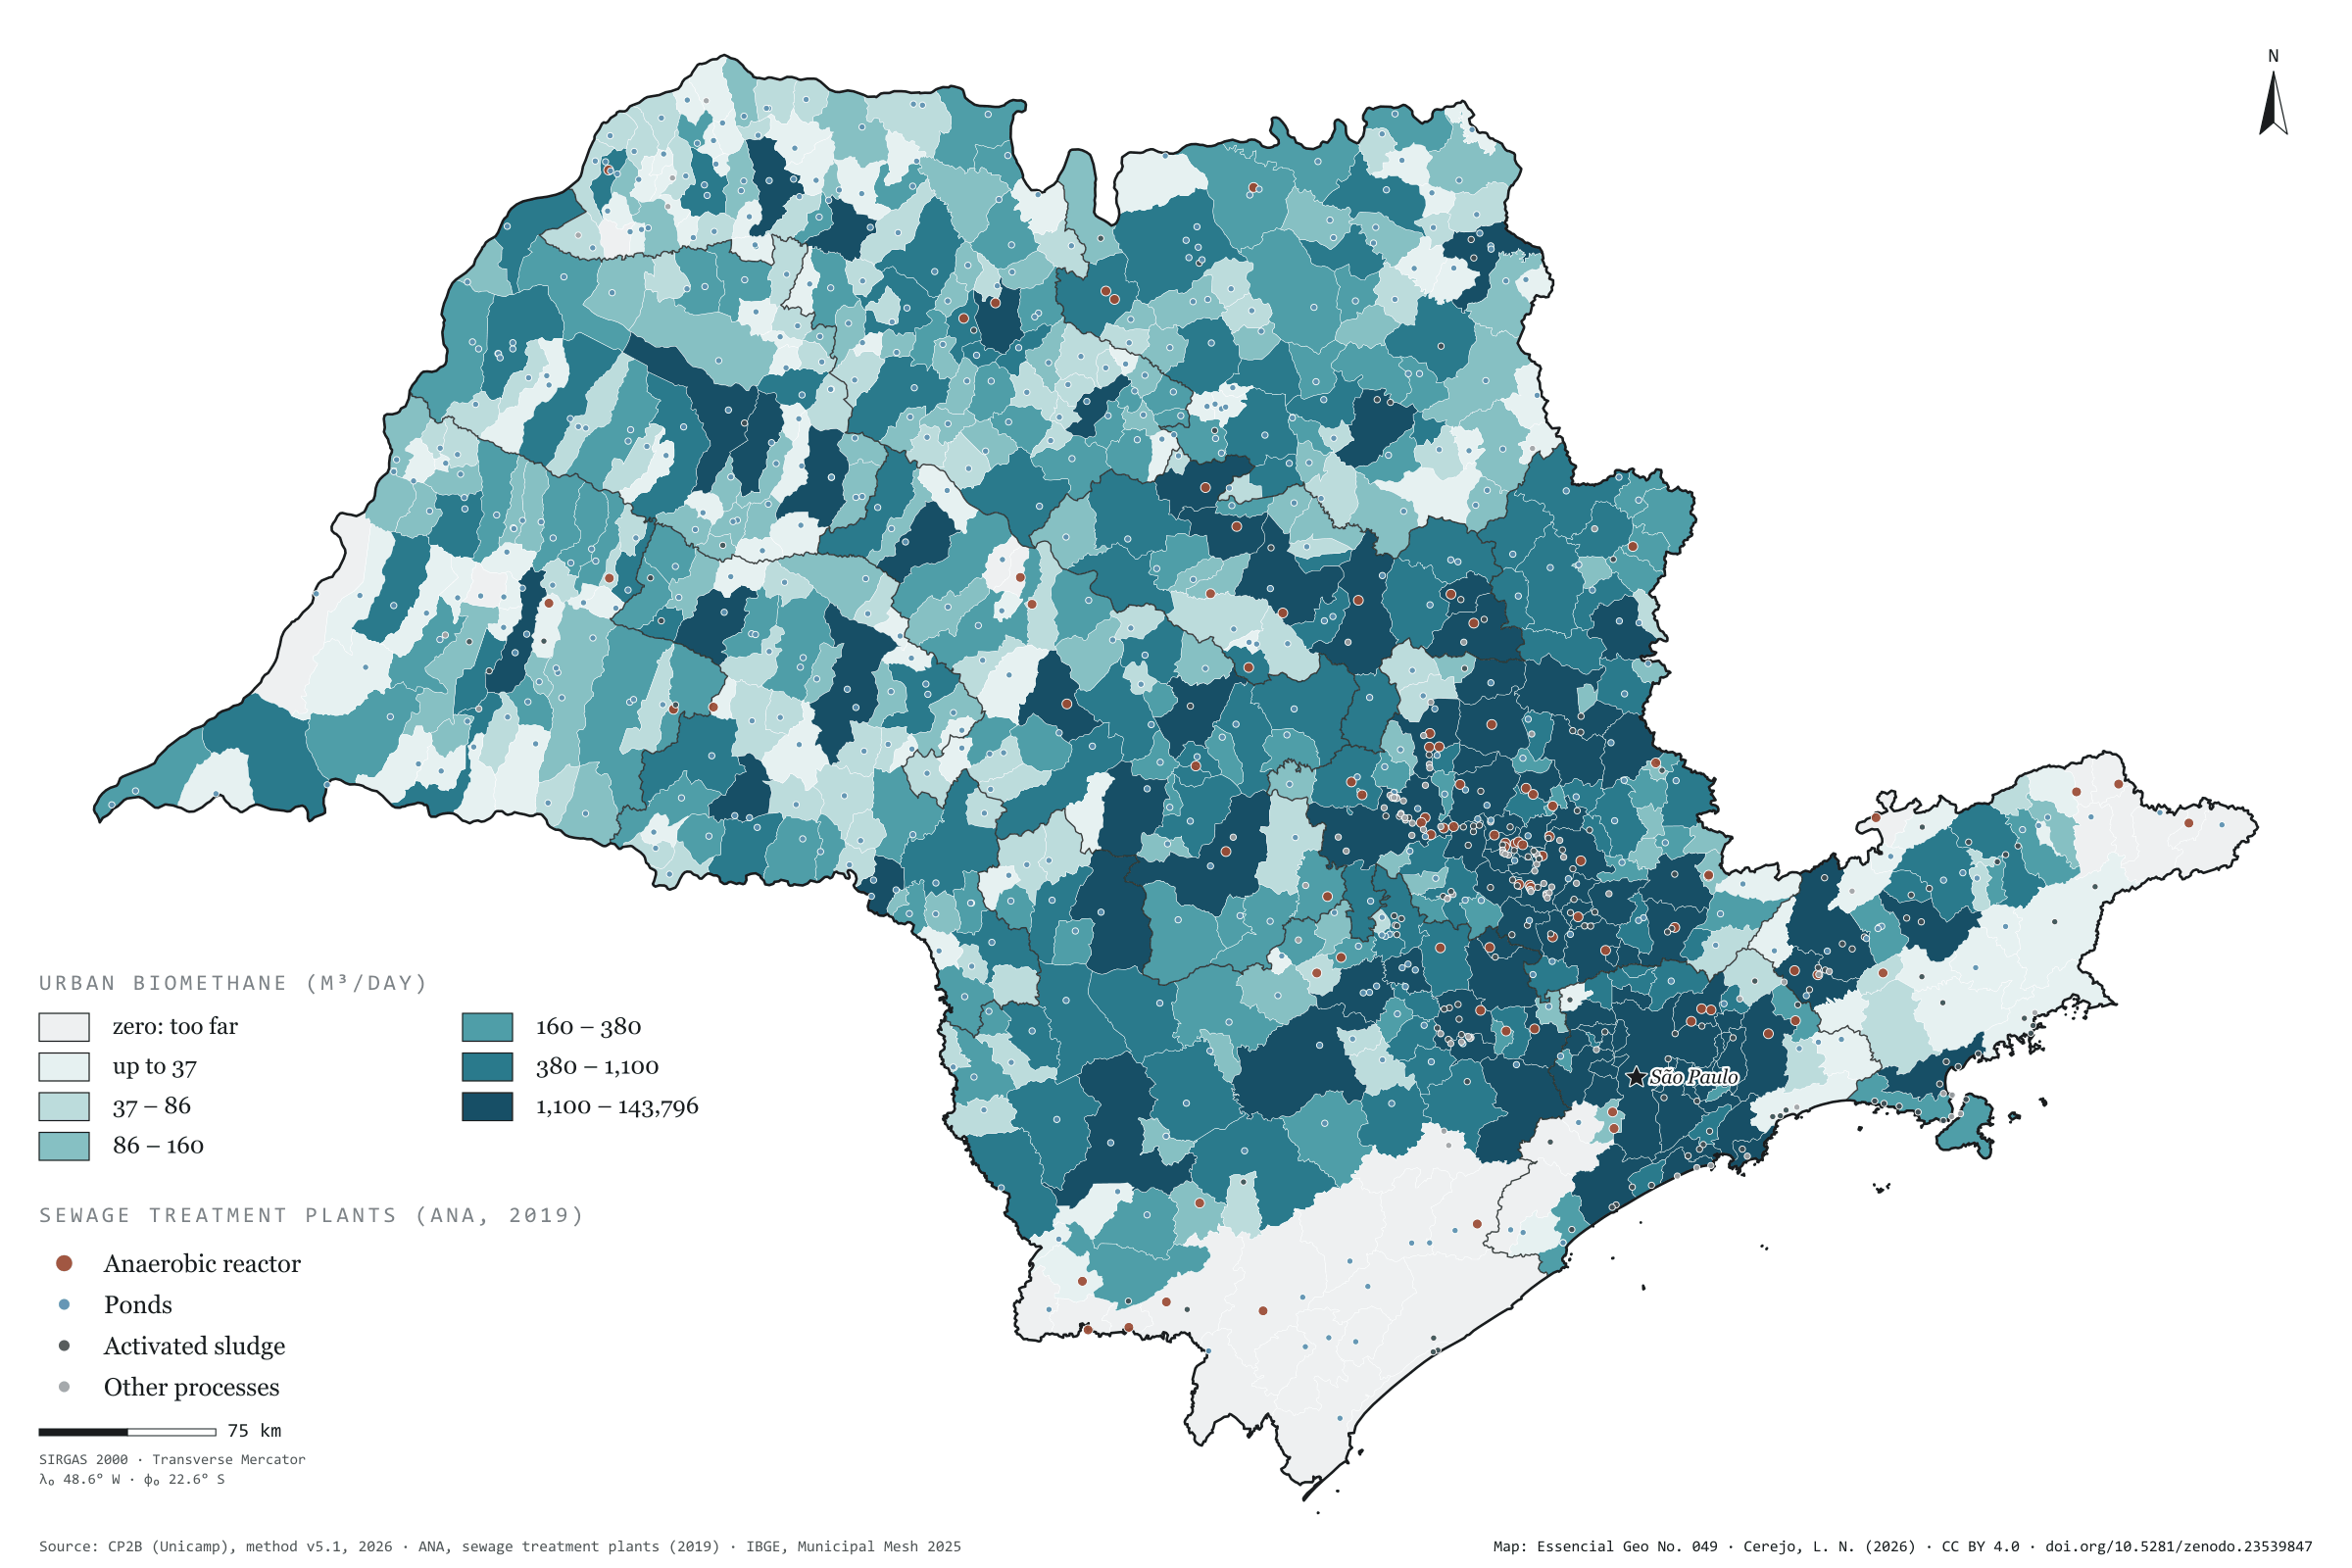
Record, downloads and citationThe organic waste, sewage sludge and prunings of São Paulo’s towns and cities could give 621,000 m³ of biomethane a day under the CP2B method: 434,000 from waste, 121,000 from sludge and 66,000 from prunings. That is little next to the countryside, under 4% of the state total, but it lies where almost everyone lives. The city of São Paulo accounts for 23% and its region for 39%. Half the methane the waste could generate is already captured at landfills, and the method deducts that share. The map also shows the 873 sewage treatment plants registered by ANA, serving 608 municipalities. Most treat sewage in ponds (552); 87 use anaerobic reactors, which produce biogas during treatment. Fifth plate of the collection “From field to biomethane”.
Technical record · downloads · citation
At a glance
- Organic waste 69.8%
- Sewage sludge 19.5%
- Urban prunings 10.6%
446,934 m³ CH₄/day
Layers
- etes point 873 sewage treatment plants: name, status, process, family, BOD removal and municipalities served
- municipios polygon 645 municipalities: biomethane from waste, sludge and prunings (m³/day) and waste methane already used at landfills
- regioes_intermediarias polygon 11 intermediate geographic regions
- limite_estadual polygon State boundary
Metadata
- Sources
- CP2B (Unicamp) — biogas and biomethane potential by municipality, method v5.1 (2026)
ANA — Sewage treatment plants (2019 database) (2019)
IBGE — Municipal Mesh 2025 (2025) - Extent
- São Paulo state (SP)
- CRS / Projection
- SIRGAS 2000 (EPSG:4674)
EPSG:4674 - Software
- Python · GeoPandas · GDAL · QGIS · Node.js · d3-geo
- Method
- Biomethane potential of organic waste, sewage sludge and urban prunings at the accessible level of the CP2B method, by municipality, in six quantile classes; ANA sewage treatment plants, one per code, coloured by process family.
- Version
- v1.0.0
- Licence
- CC BY 4.0
Downloads
- GPKG Four layers, SIRGAS 2000, with QGIS styles (.gpkg) 18.6 MB
- CSV Urban biomethane by municipality (.csv) 42 kB
- CSV Sewage treatment plants, with coordinates (.csv) 152 kB
- SVG Vector plate, for printing (.svg) 2.3 MB
- PNG Plate (PNG, 2400 px) (.png) 0.3 MB

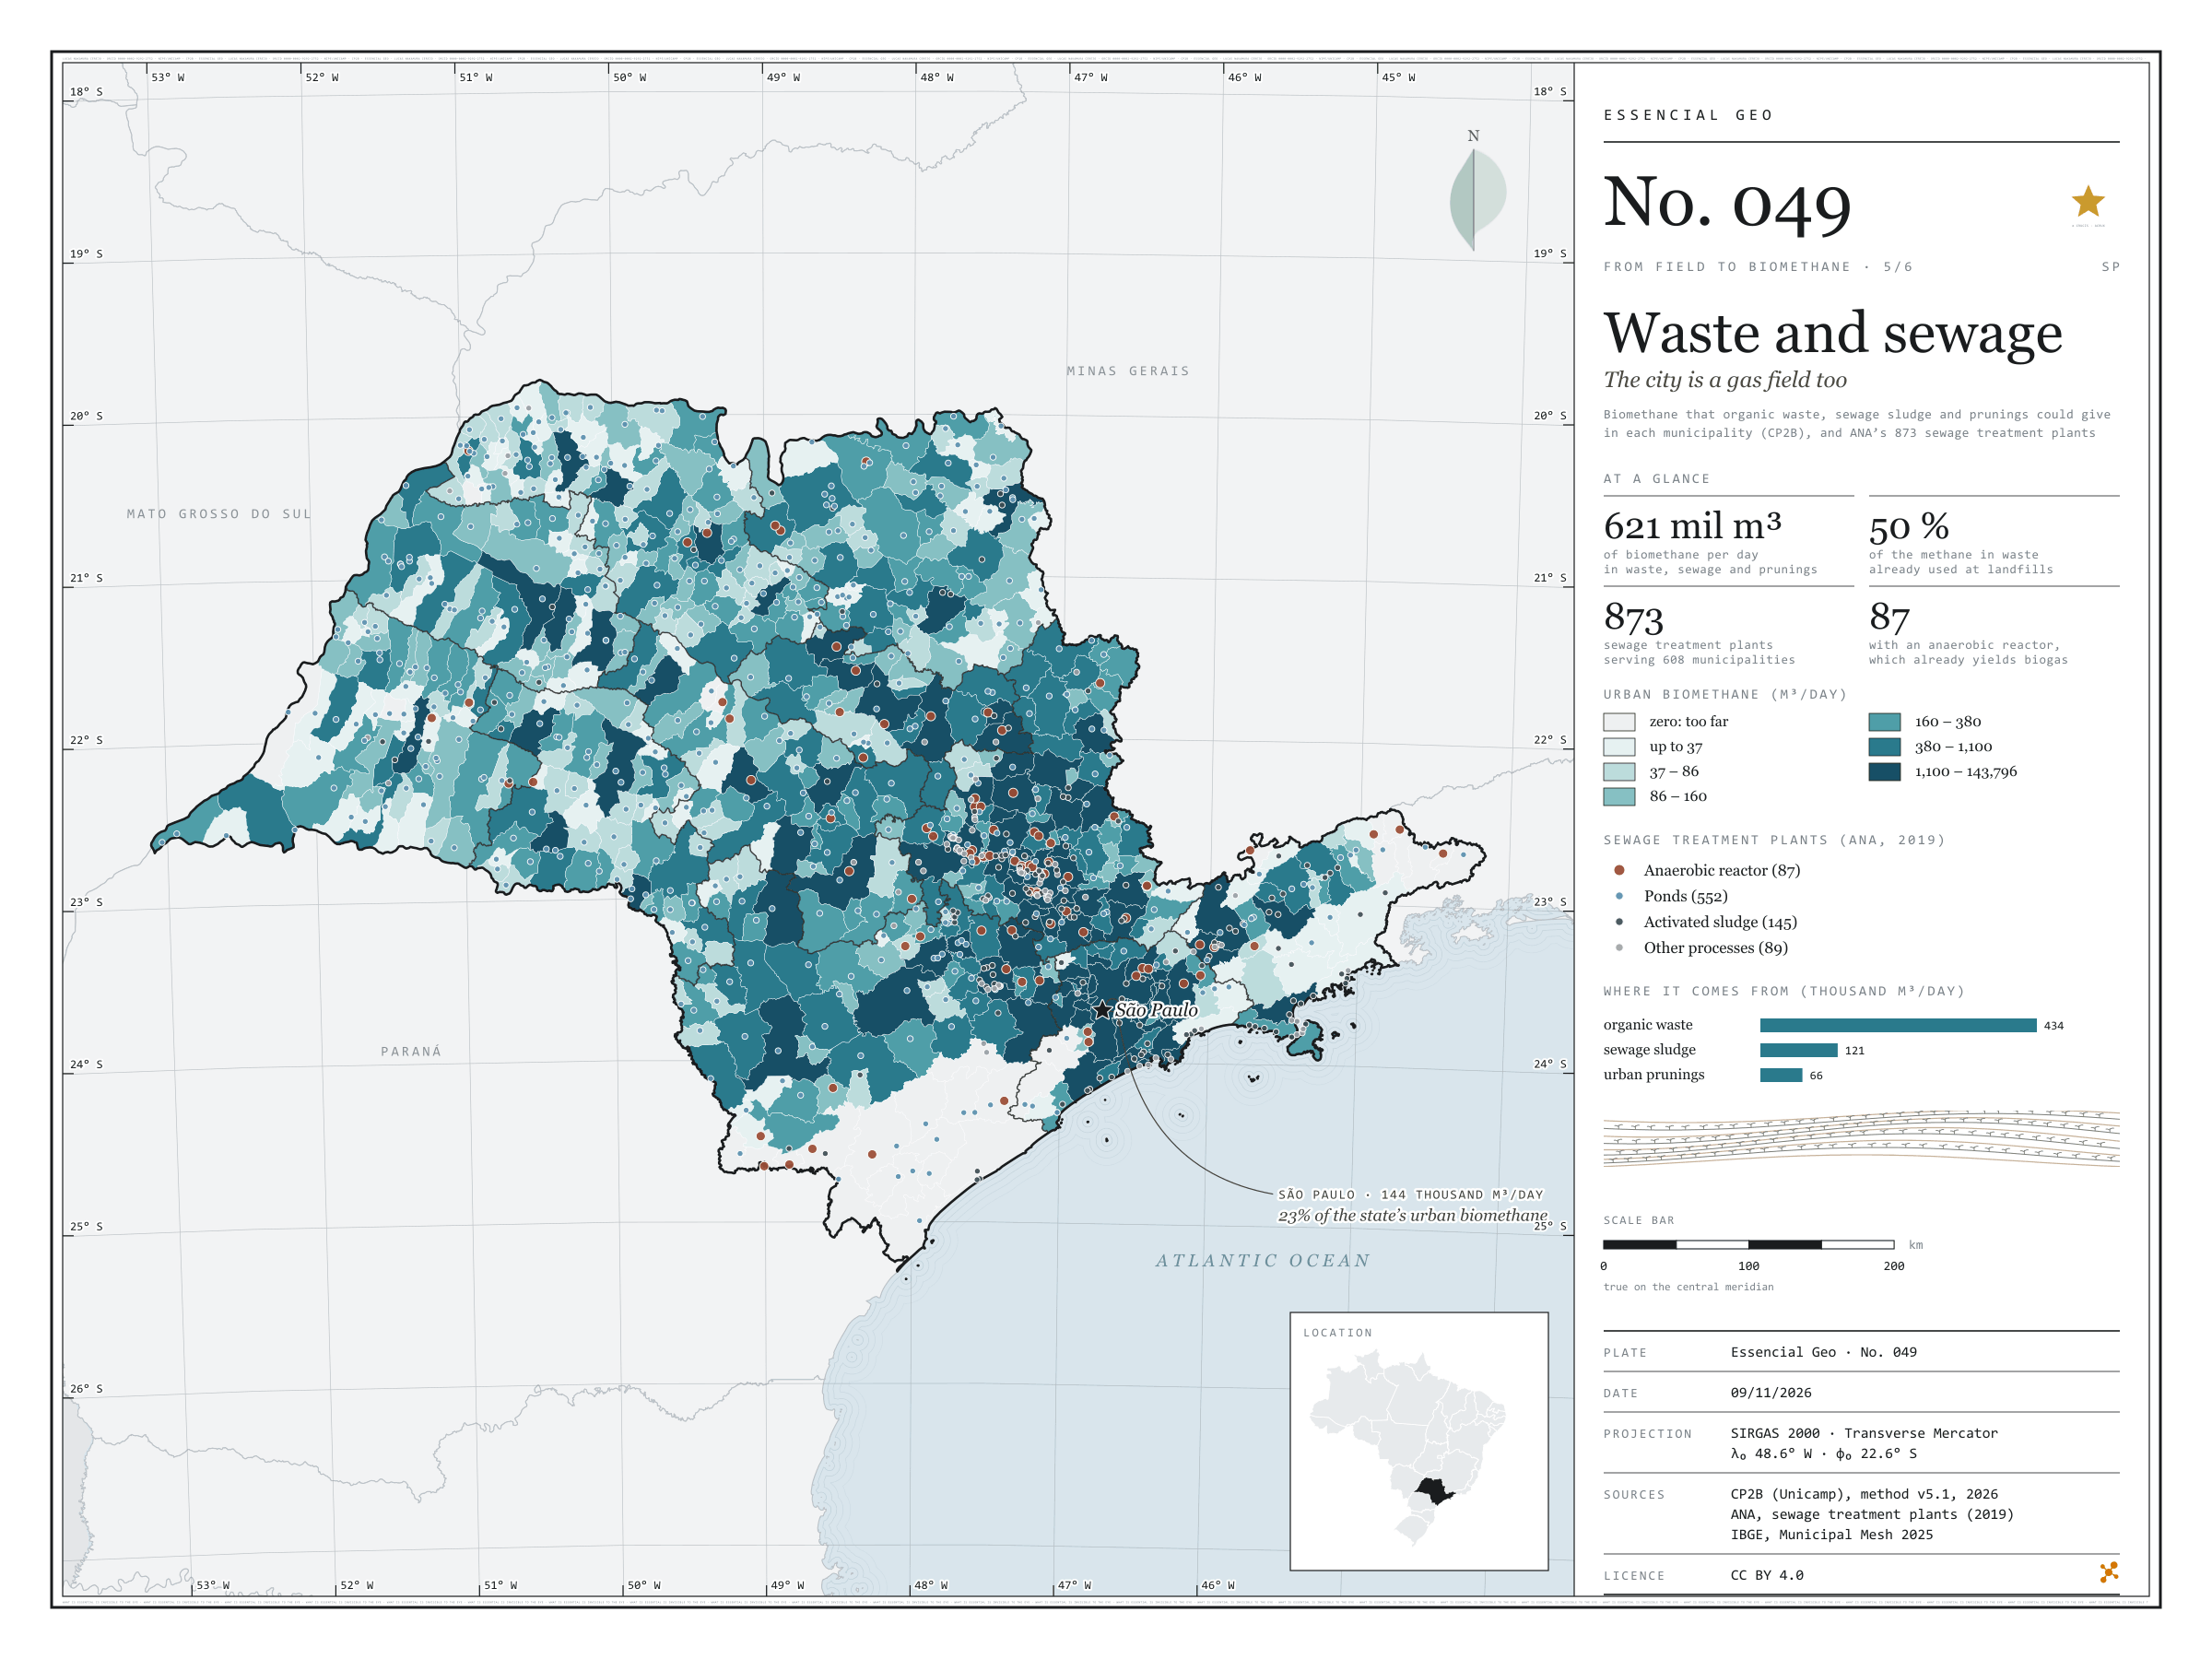
Figure to reuse
The map without a frame, with legend, scale, reference system and credit written on it: ready for papers, lectures and slides. In two versions: with the basemap (neighbours and sea) or only the mapped area, on white.
With basemap (PNG) Without basemap (PNG) QR code (SVG)
Point a camera at it to open this page.
How to cite
CEREJO, Lucas Nakamura. Lixo e esgoto: a cidade também é lavoura de gás. Versão 1.0.0. [S. l.]: Zenodo, 2026. Conjunto de dados. DOI: 10.5281/zenodo.23539847. Disponível em: https://doi.org/10.5281/zenodo.23539847. Acesso em: 10 nov. 2026.
Cerejo, L. N. (2026). Lixo e esgoto: a cidade também é lavoura de gás [Waste and sewage: The city is a gas crop too] (Version 1.0.0) [Data set]. Zenodo. https://doi.org/10.5281/zenodo.23539847
@dataset{cerejo2026_lixo_e_esgoto_sp,
  author    = {Cerejo, Lucas Nakamura},
  title     = {Lixo e esgoto: A cidade também é lavoura de gás},
  year      = {2026},
  publisher = {Zenodo},
  version   = {1.0.0},
  doi       = {10.5281/zenodo.23539847},
  url       = {https://doi.org/10.5281/zenodo.23539847},
  language  = {portuguese},
  note      = {English title: Waste and sewage: The city is a gas crop too. Licence CC BY 4.0}
}