The orange belt
The grove in the field, the bagasse at the mill
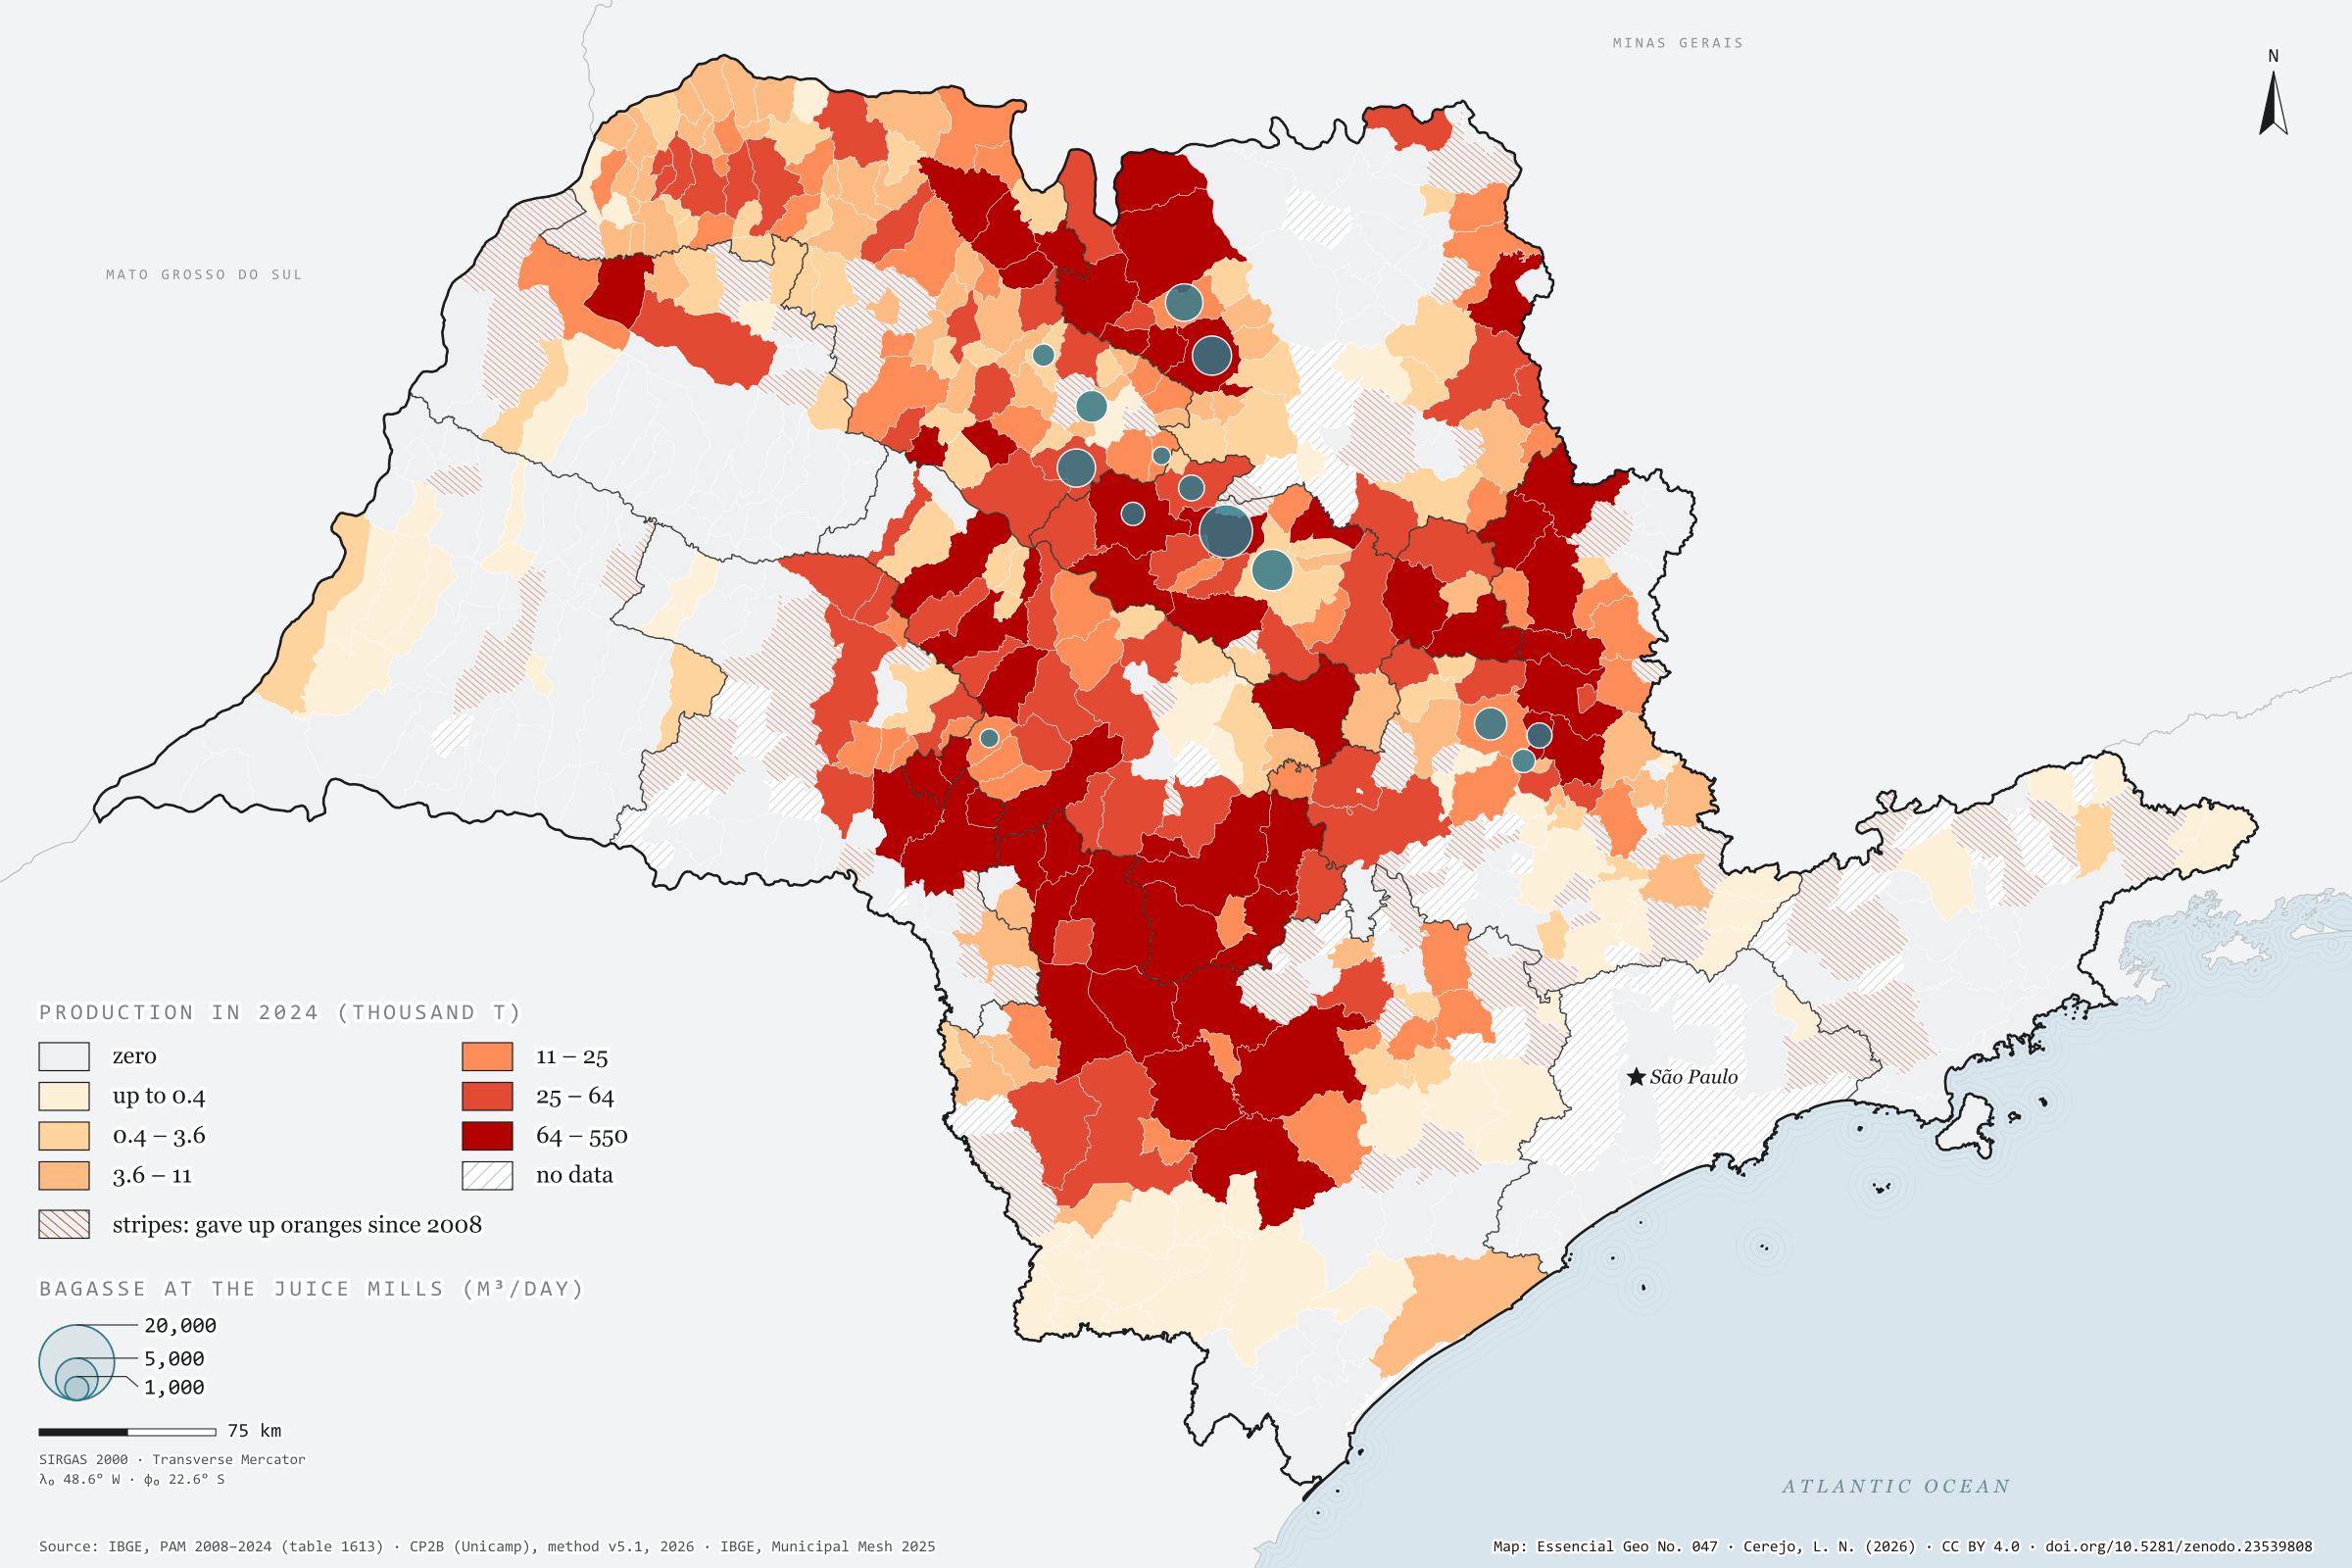
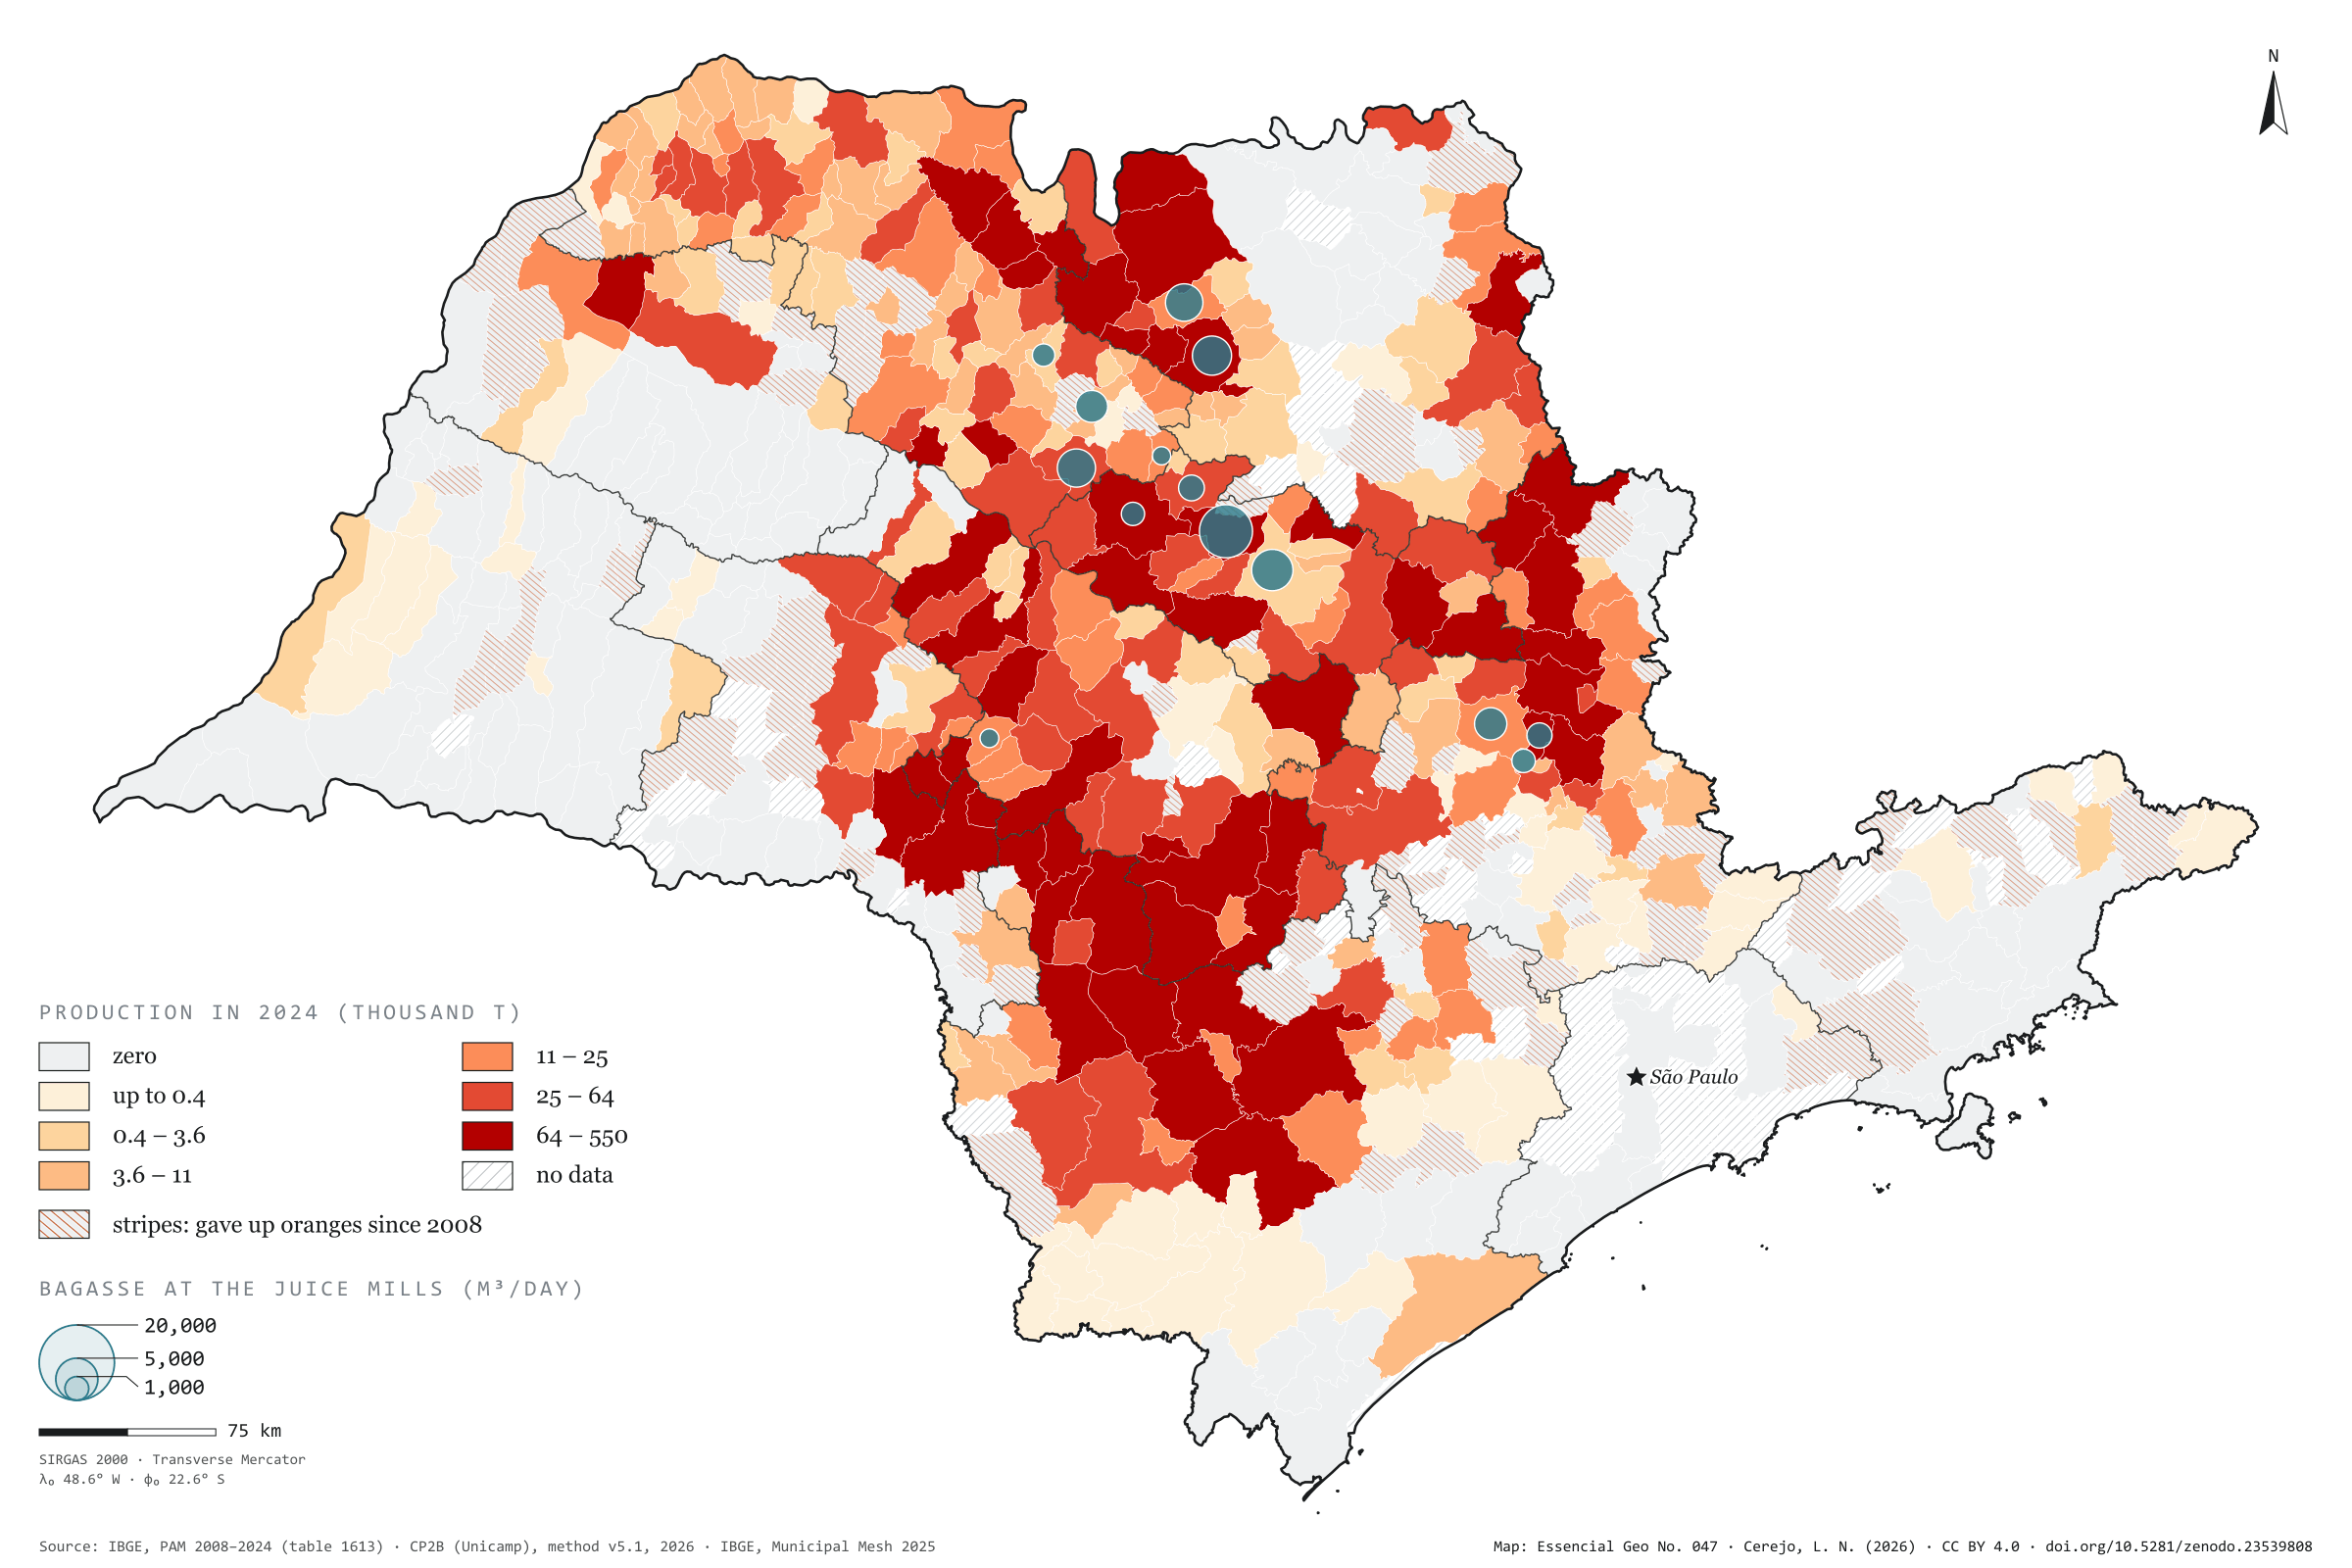
Record, downloads and citationSão Paulo harvested 12.0 million tonnes of oranges in 2024, from 354,562 hectares. In 2008 it was 14.5 million tonnes from 592,566 hectares: the area fell by 40%, and each hectare now gives 34 tonnes instead of 25. The belt has also moved south-west. The Araraquara region harvested 3.4 million tonnes and now harvests 1.2; the Sorocaba region rose from 1.0 to 2.4 million and is the state’s largest. Casa Branca leads, with 550,000 tonnes, followed by Botucatu and Avaré, and 82 municipalities have given up oranges. The bagasse, however, stays where the fruit becomes juice. The CP2B method places it in 14 municipalities with mills, and Matão, which harvests 108,000 tonnes, receives the largest potential: 22,752 m³ of biomethane a day, out of 101,834. Third plate of the collection “From field to biomethane”.
Technical record · downloads · citation
At a glance
12,002,362 t
101,834 m³/day
Layers
- bagaco_nas_fabricas point 14 municipalities that receive the bagasse in the CP2B method, with the biomethane (m³/day)
- municipios polygon 645 municipalities: harvested area and orange production in 2008 and 2024, share of territory, whether oranges were given up, and bagasse biomethane
- regioes_intermediarias polygon 11 intermediate geographic regions
- limite_estadual polygon State boundary
Metadata
- Sources
- IBGE — Municipal Agricultural Production (PAM), table 1613: permanent crops (2008 a 2024)
CP2B (Unicamp) — biogas and biomethane potential by municipality, method v5.1 (2026)
IBGE — Municipal Mesh 2025 (2025) - Extent
- São Paulo state (SP)
- CRS / Projection
- SIRGAS 2000 (EPSG:4674)
EPSG:4674 - Software
- Python · GeoPandas · GDAL · QGIS · Node.js · d3-geo
- Method
- Orange production from PAM 2024 by municipality in six quantile classes; stripes where there was harvested area in 2008 and none in 2024; circles with the bagasse biomethane potential at the accessible level of the CP2B method, allocated to the juice mills.
- Version
- v1.0.0
- Licence
- CC BY 4.0
Downloads
- GPKG Four layers, SIRGAS 2000, with QGIS styles (.gpkg) 18.5 MB
- CSV Oranges in 2008 and 2024 and bagasse biomethane by municipality (.csv) 53 kB
- SVG Vector plate, for printing (.svg) 2.3 MB
- PNG Plate (PNG, 2400 px) (.png) 0.3 MB

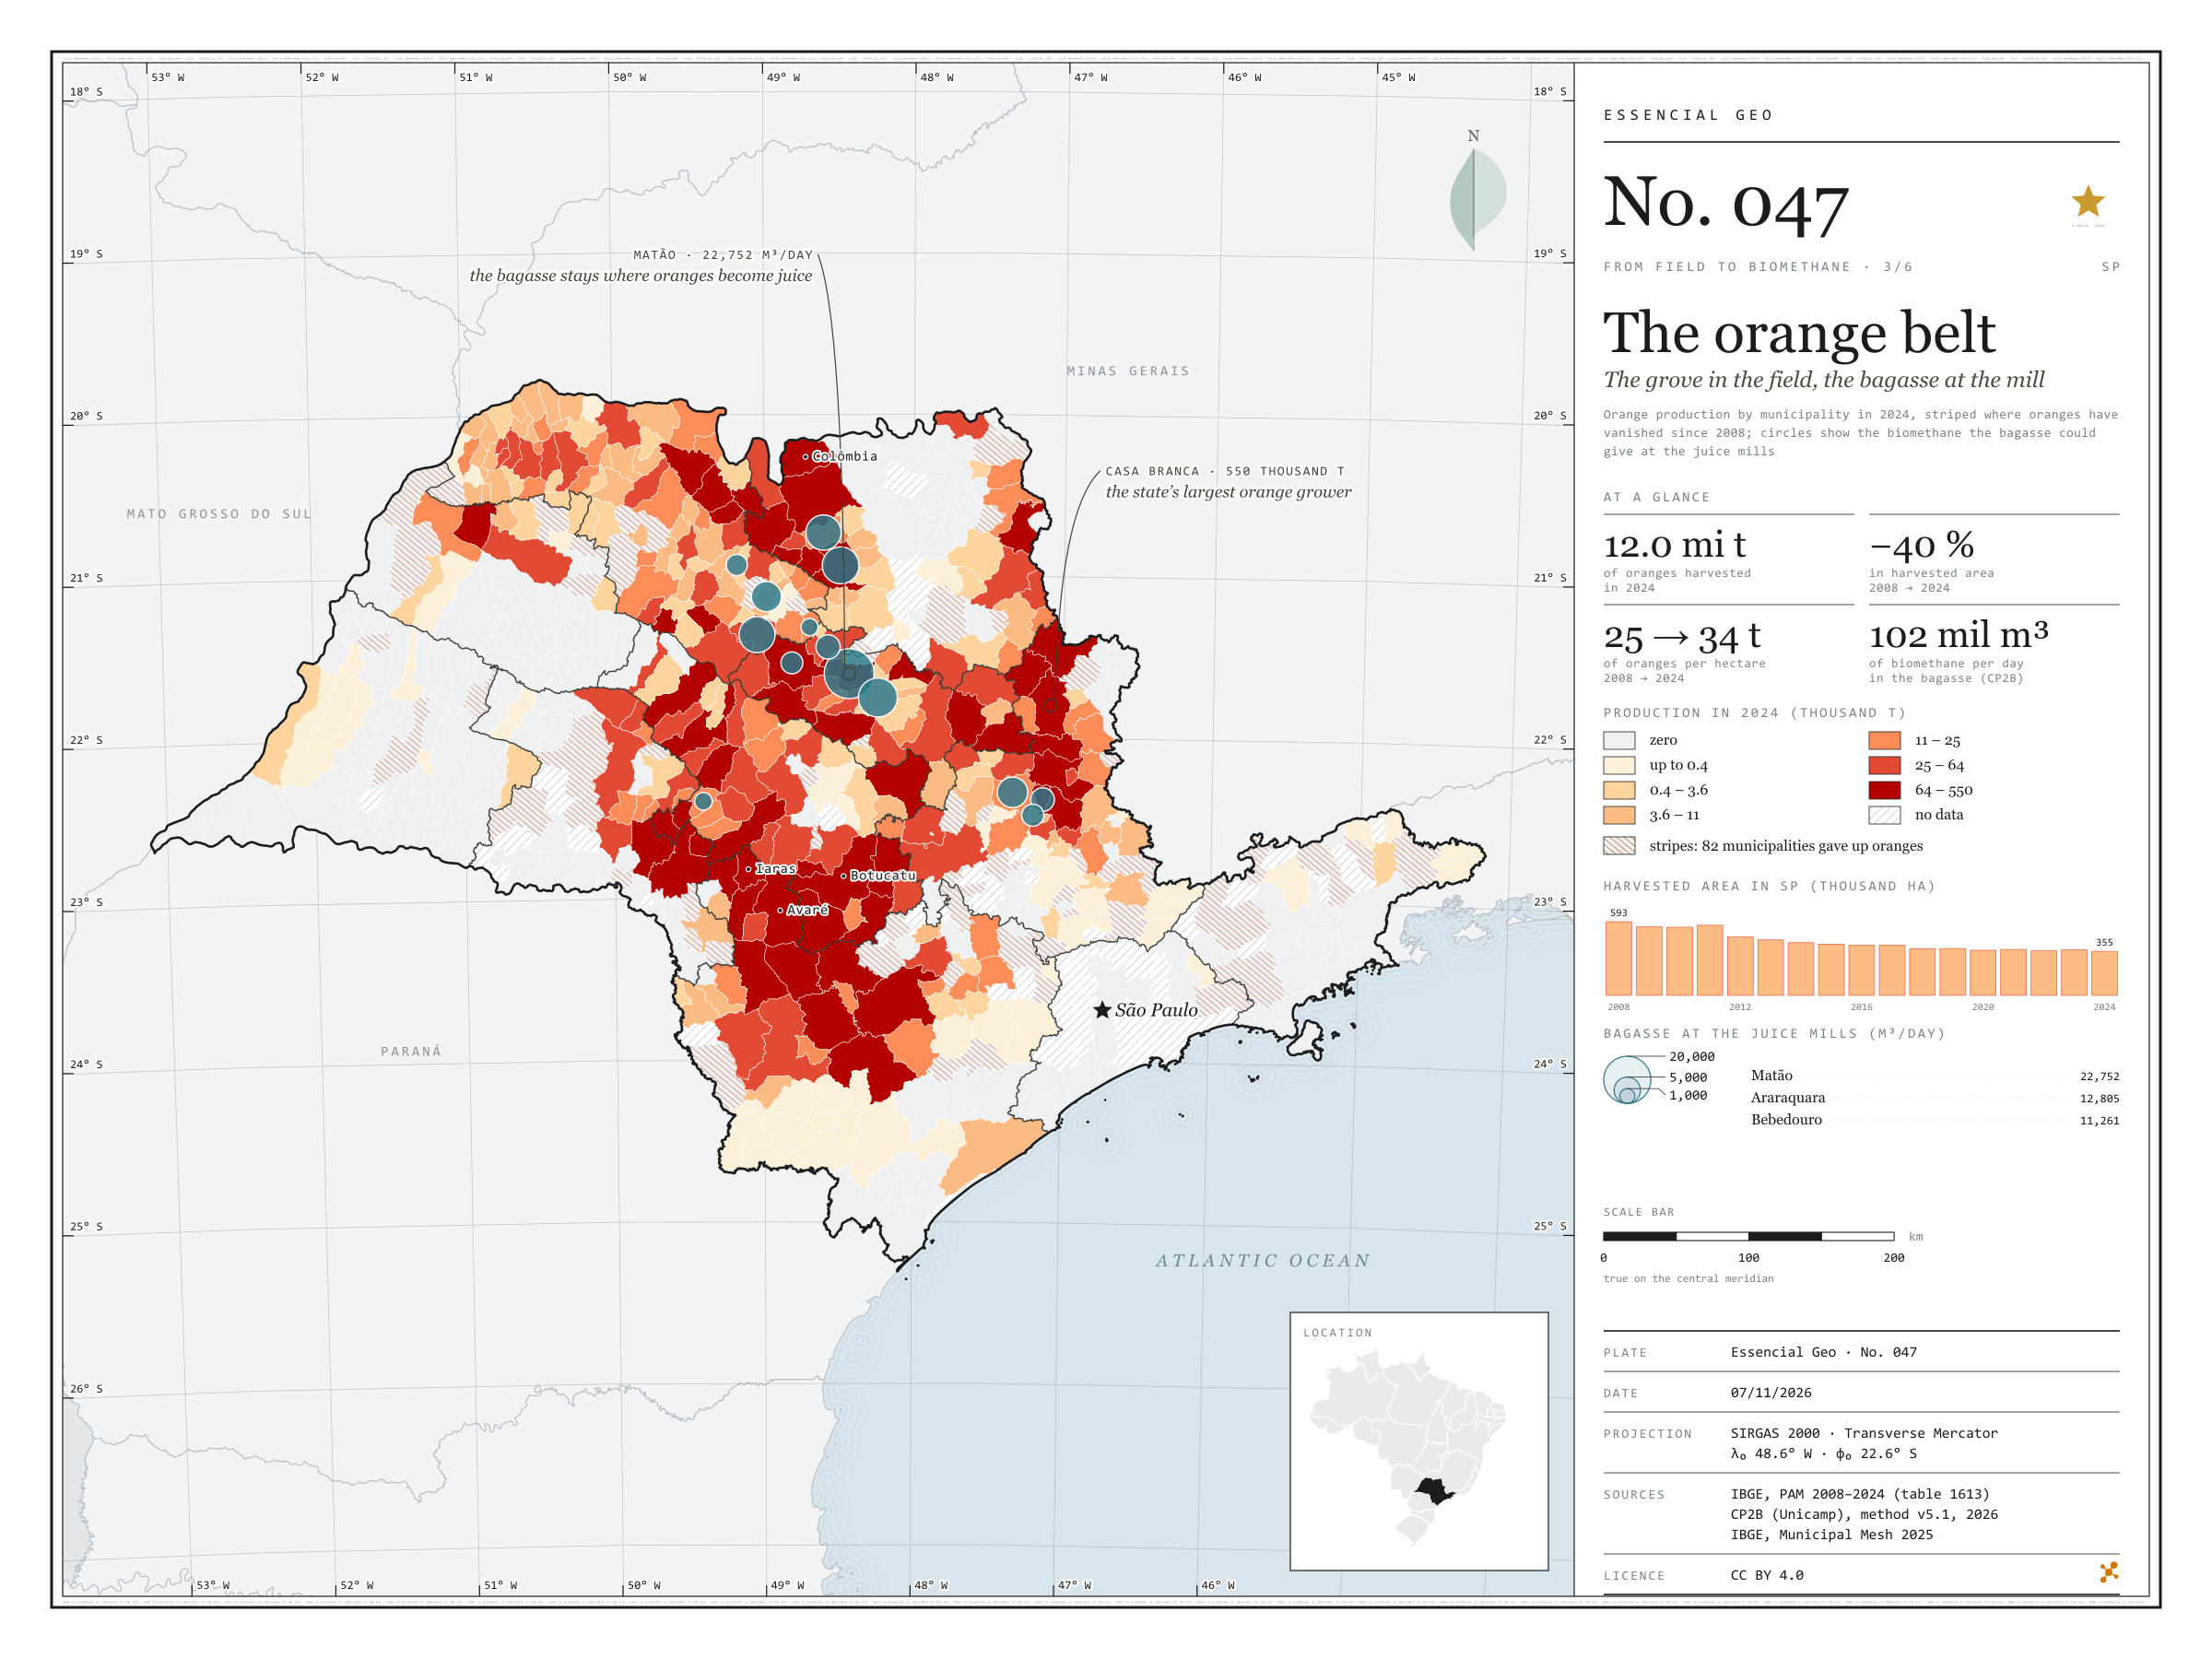
Figure to reuse
The map without a frame, with legend, scale, reference system and credit written on it: ready for papers, lectures and slides. In two versions: with the basemap (neighbours and sea) or only the mapped area, on white.
With basemap (PNG) Without basemap (PNG) QR code (SVG)
Point a camera at it to open this page.
How to cite
CEREJO, Lucas Nakamura. O cinturão da laranja: o pomar no campo, o bagaço na fábrica. Versão 1.0.0. [S. l.]: Zenodo, 2026. Conjunto de dados. DOI: 10.5281/zenodo.23539808. Disponível em: https://doi.org/10.5281/zenodo.23539808. Acesso em: 10 nov. 2026.
Cerejo, L. N. (2026). O cinturão da laranja: o pomar no campo, o bagaço na fábrica [The orange belt: The grove in the field, the bagasse at the mill] (Version 1.0.0) [Data set]. Zenodo. https://doi.org/10.5281/zenodo.23539808
@dataset{cerejo2026_laranja_sp,
  author    = {Cerejo, Lucas Nakamura},
  title     = {O cinturão da laranja: O pomar no campo, o bagaço na fábrica},
  year      = {2026},
  publisher = {Zenodo},
  version   = {1.0.0},
  doi       = {10.5281/zenodo.23539808},
  url       = {https://doi.org/10.5281/zenodo.23539808},
  language  = {portuguese},
  note      = {English title: The orange belt: The grove in the field, the bagasse at the mill. Licence CC BY 4.0}
}