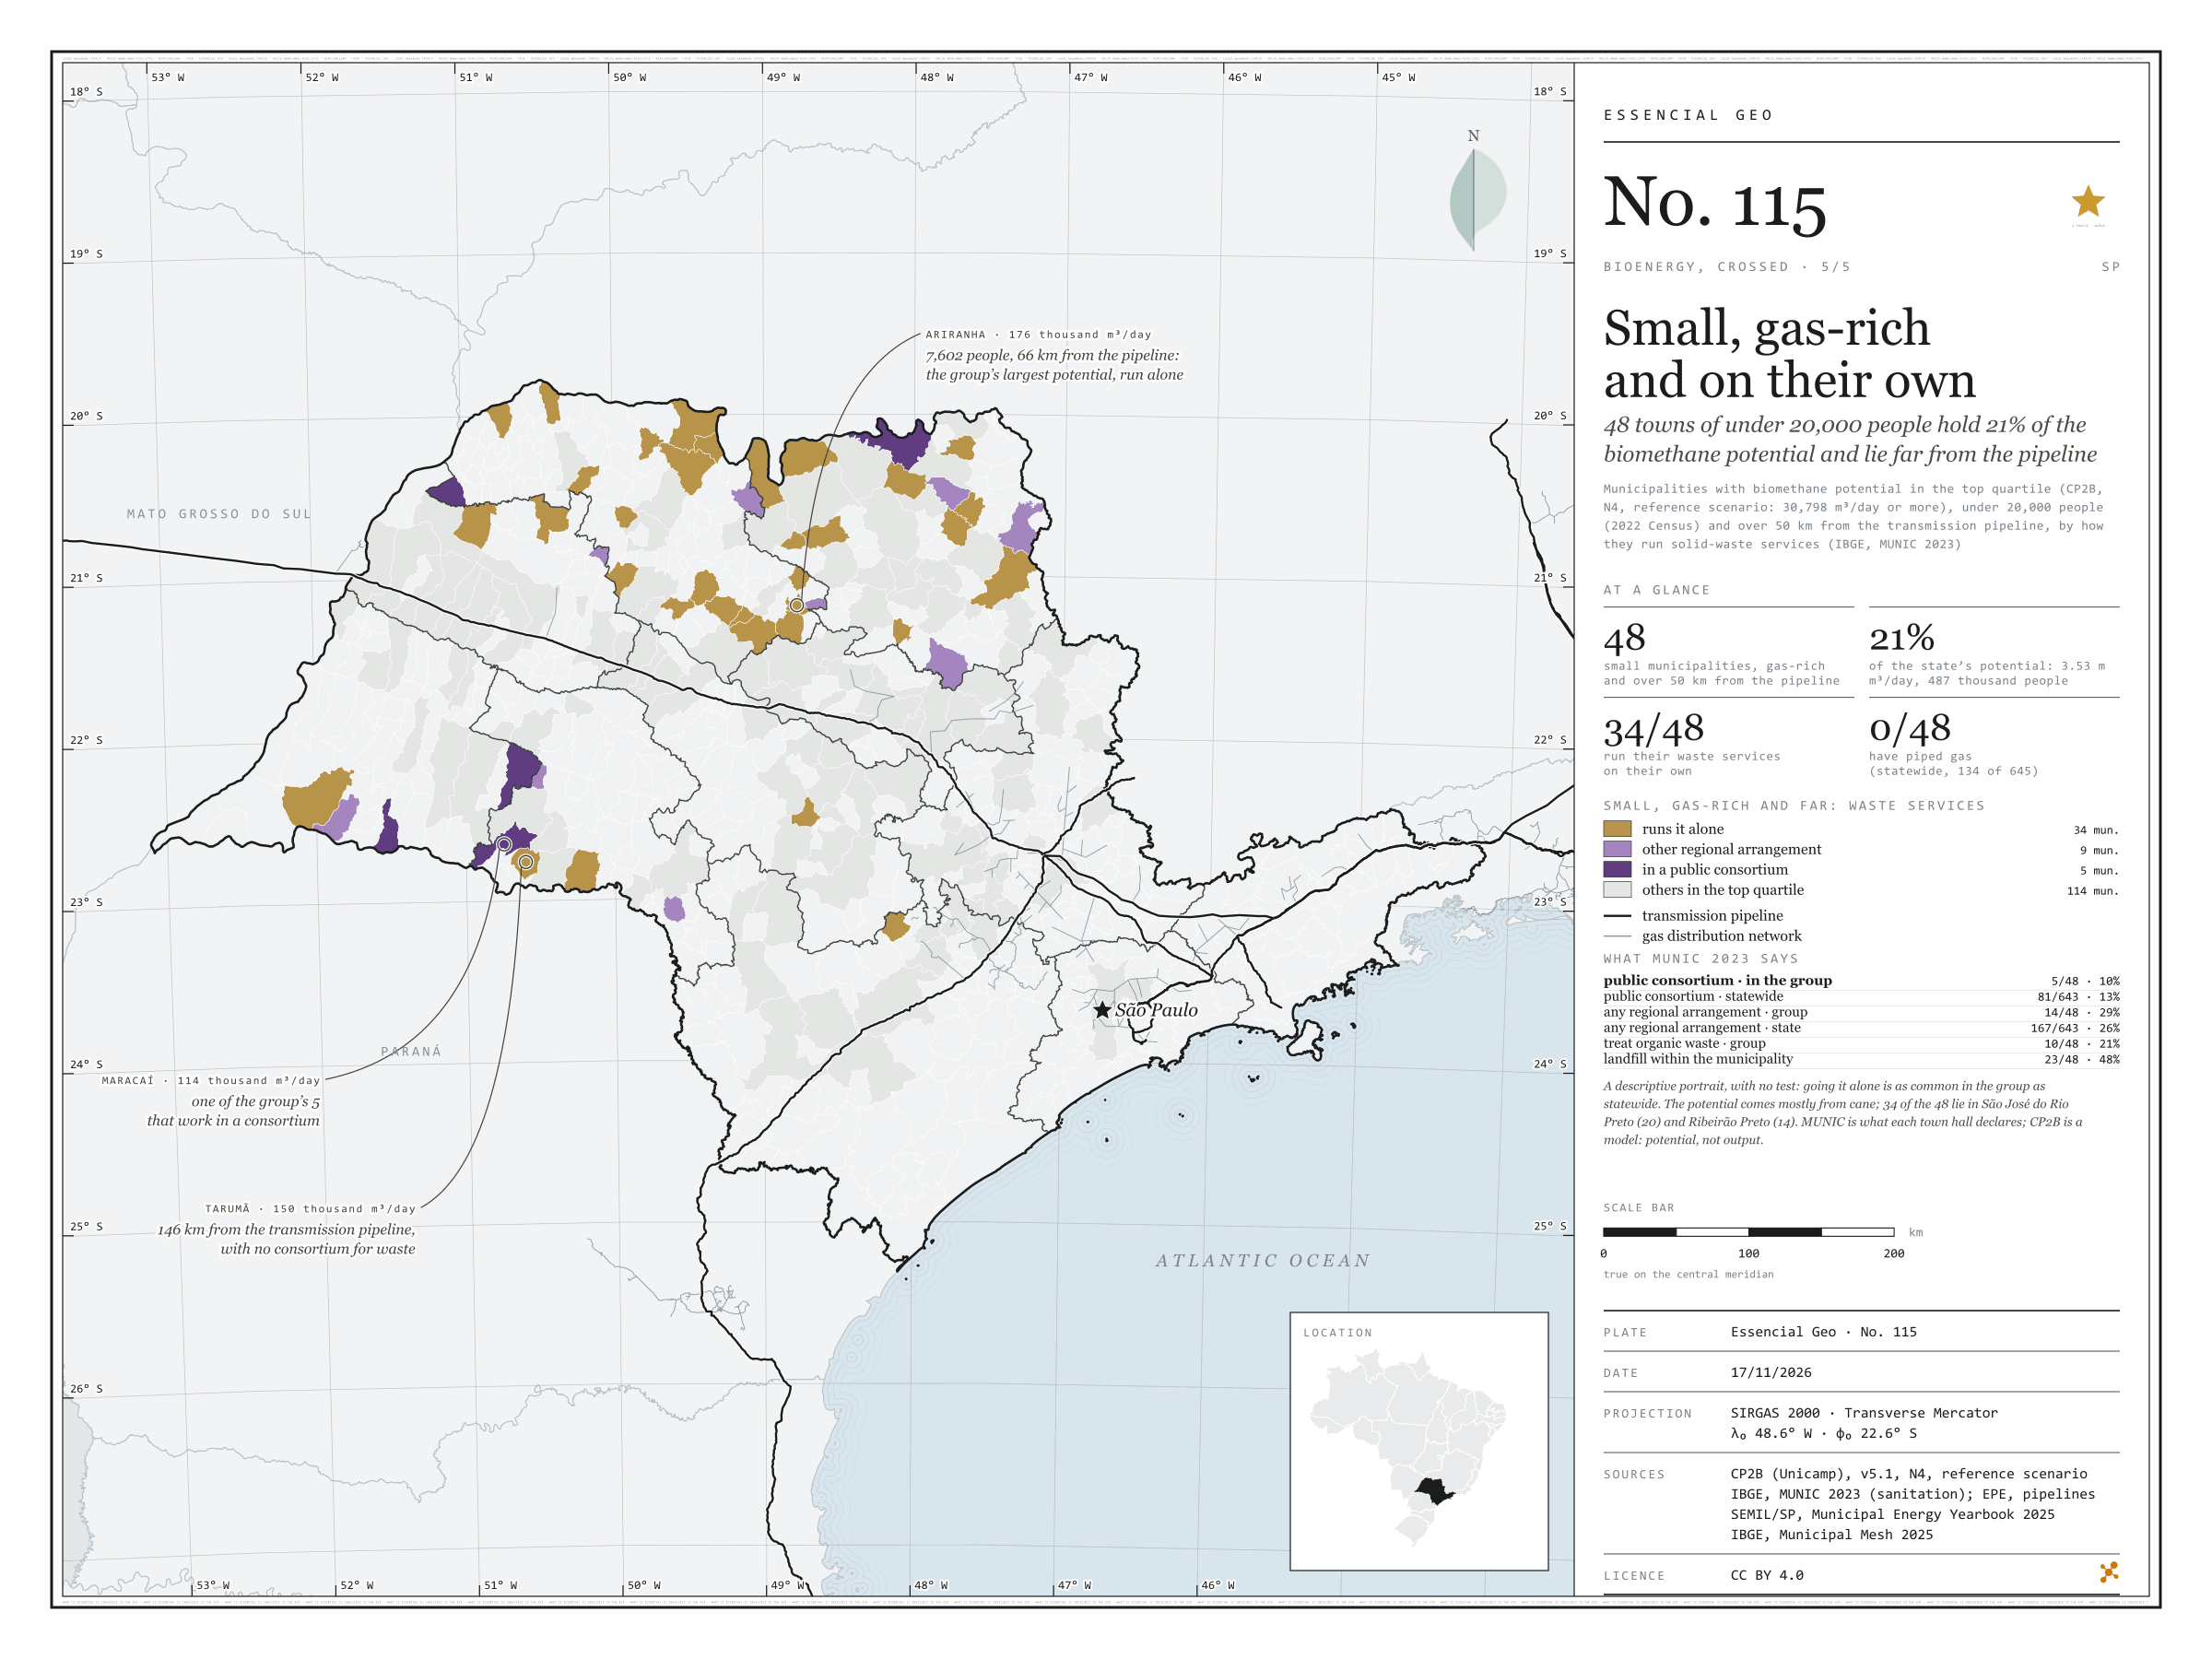
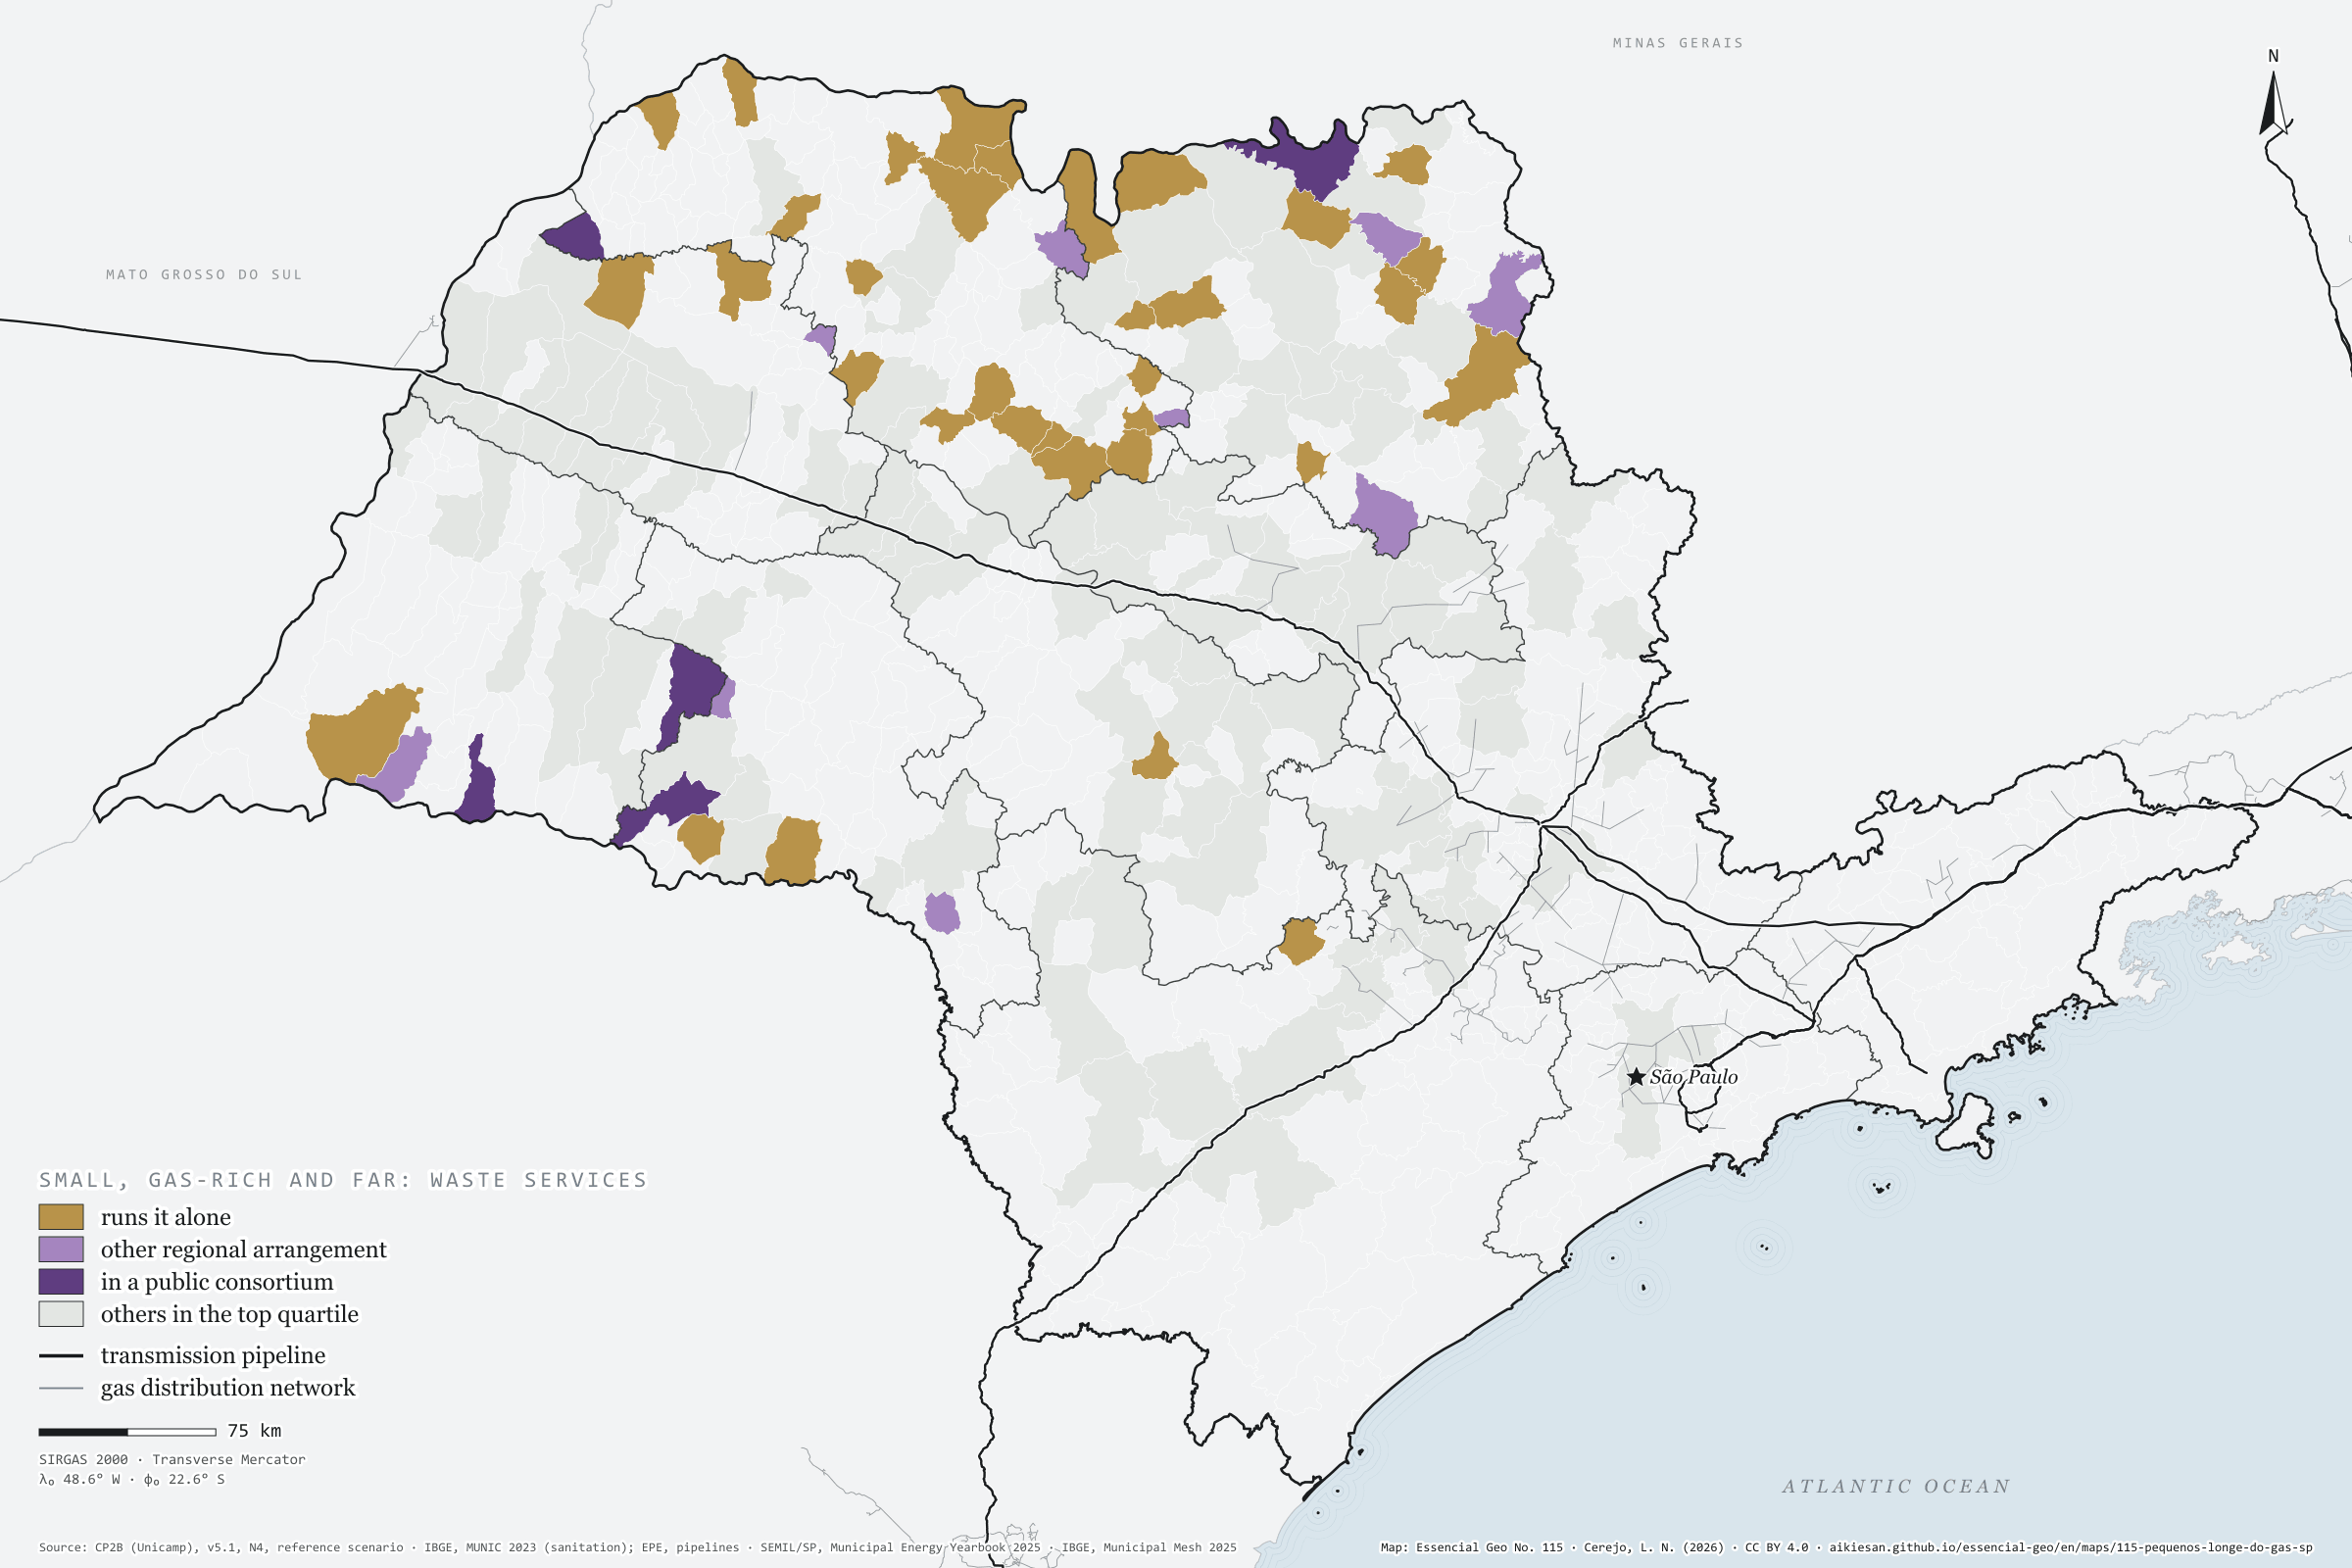
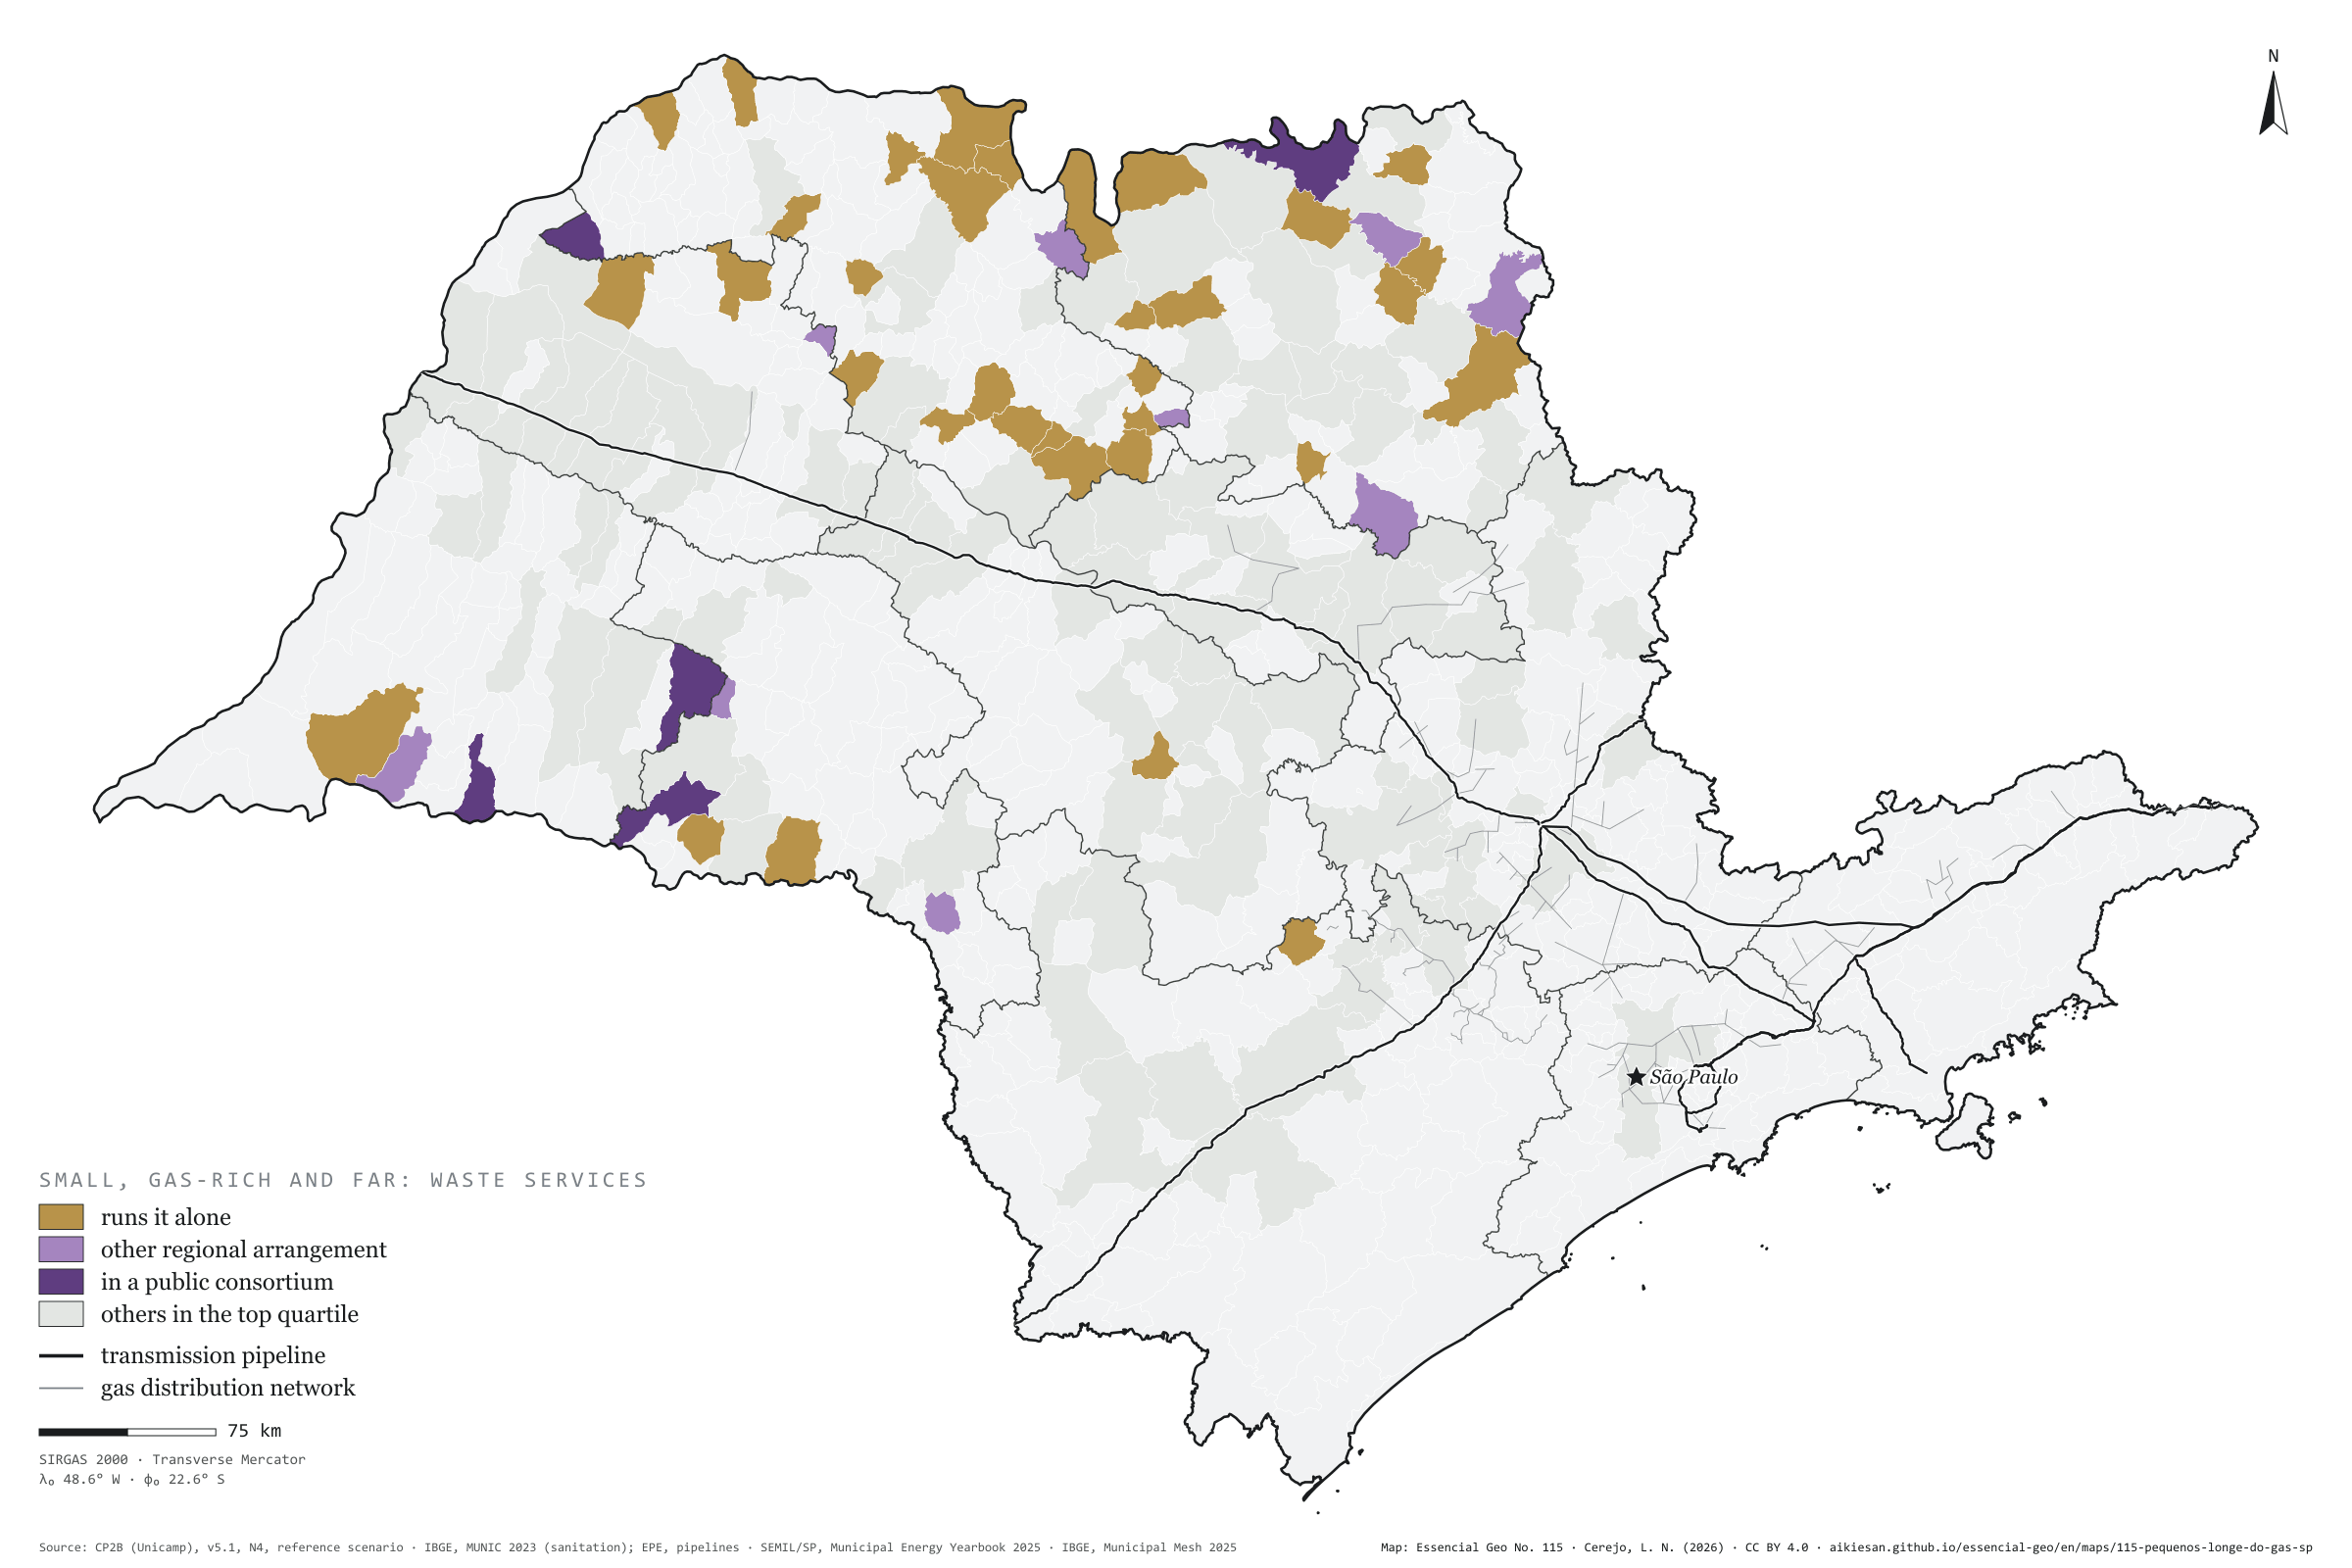
48 towns of under 20,000 people hold 21% of the biomethane potential and lie far from the pipeline
Fig. 115São Paulo State (SP)EPSG:4674Source: CP2B (Unicamp), IBGE, EPE, SEMIL/SP, Municipal Energy Yearbook 2025 (base year 2024): sales of hydrous ethanol, petrol C, diesel oil and piped natural gas by municipality
48 São Paulo municipalities combine three things: biomethane potential in the state’s top quarter, fewer than 20,000 people and over 50 km from the transmission pipeline. Together they hold 21% of the state’s accessible potential, 3.53 million m³ a day, for 487 thousand people, mostly from cane. According to MUNIC 2023, 34 of them run solid-waste services on their own, 9 have another regional arrangement and 5 are in a public consortium; none uses piped gas. Going it alone is as common in the group as statewide: this is a descriptive portrait, with no test. Ariranha, with 7,602 people, has the group’s largest potential, 176 thousand m³/day. Fifth plate of the collection “Bioenergy, crossed”.
Technical record · downloads · citation
At a glance
Small, high-potential municipalities far from the pipeline
48municipalities
of 162 in the top quarter of potential
Share of the state’s accessible potential
21%
3.53 million m³/day
Run waste services on their own
34municipalities
of 48; 5 in a public consortium
Layers
municipiospolygon645 municipalities with the variables of all five plates, the bivariate classes and the LISA clusters (same GPKG as plates 111 to 115)
gasodutoslineGas transmission pipelines and distribution network (EPE)
regioes_intermediariaspolygon11 intermediate geographic regions
Municipalities with CP2B biomethane potential (v5.1, N4, reference scenario) in the state’s top quarter (30,798 m³/day or more), fewer than 20,000 people (2022 Census) and over 50 km in a straight line from the transmission pipeline (EPE), classified by how they run solid-waste management as declared in MUNIC 2023; no statistical test.
The map without a frame, with legend, scale, reference system and credit written on it: ready for papers, lectures and slides. In two versions: with the basemap (neighbours and sea) or only the mapped area, on white.
CEREJO, Lucas Nakamura. Pequenos, cheios de gás e sozinhos: 48 municípios de menos de 20 mil habitantes têm 21 % do potencial de biometano e ficam longe do gasoduto. Versão 1.0.0. [S. l.]: Essencial, 2026. Conjunto de dados. Disponível em: https://aikiesan.github.io/essencial-geo/en/maps/115-pequenos-longe-do-gas-sp/. Acesso em: 10 nov. 2026.
Cerejo, L. N. (2026). Pequenos, cheios de gás e sozinhos: 48 municípios de menos de 20 mil habitantes têm 21 % do potencial de biometano e ficam longe do gasoduto [Small, gas-rich and on their own: 48 towns of under 20,000 people hold 21% of the biomethane potential and lie far from the pipeline] (Version 1.0.0) [Data set]. Essencial. https://aikiesan.github.io/essencial-geo/en/maps/115-pequenos-longe-do-gas-sp/
@dataset{cerejo2026_pequenos_longe_do_gas_sp,
  author    = {Cerejo, Lucas Nakamura},
  title     = {Pequenos, cheios de gás e sozinhos: 48 municípios de menos de 20 mil habitantes têm 21 % do potencial de biometano e ficam longe do gasoduto},
  year      = {2026},
  publisher = {Essencial},
  version   = {1.0.0},
  url       = {https://aikiesan.github.io/essencial-geo/en/maps/115-pequenos-longe-do-gas-sp/},
  language  = {portuguese},
  note      = {English title: Small, gas-rich and on their own: 48 towns of under 20,000 people hold 21% of the biomethane potential and lie far from the pipeline. Licence CC BY 4.0}
}
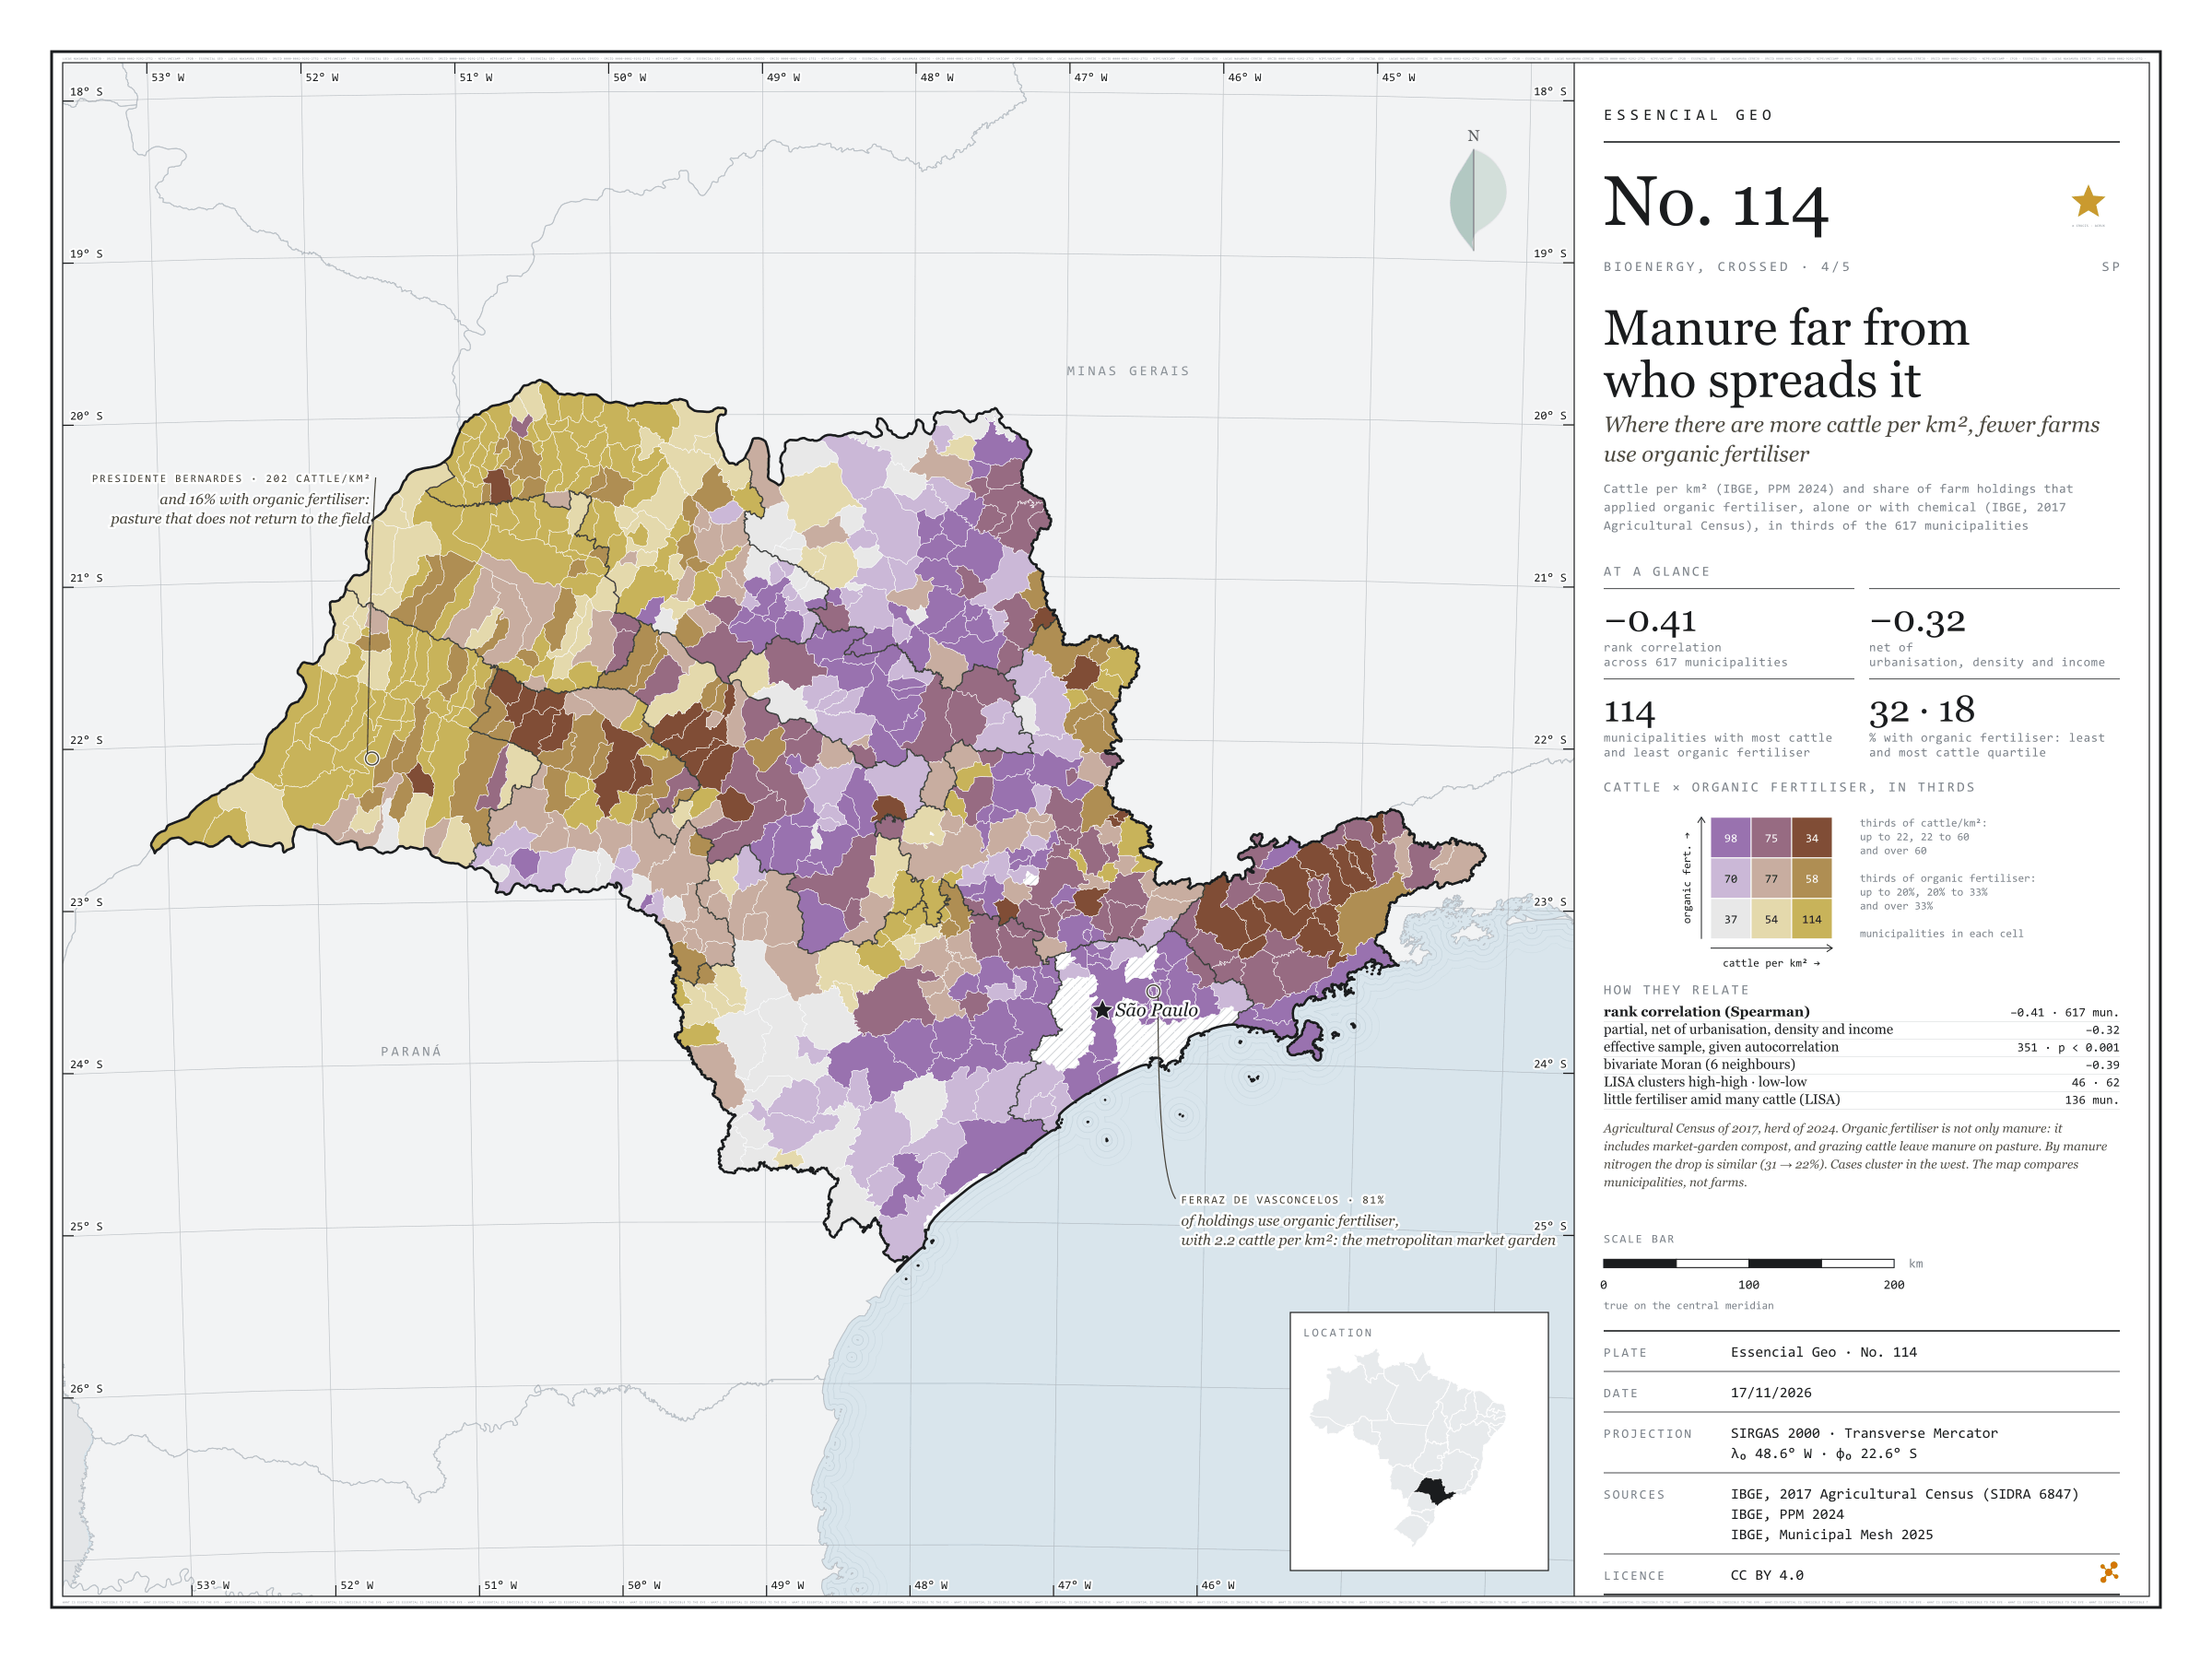
Where there are more cattle per km², fewer farms use organic fertiliser
Fig. 114São Paulo State (SP)EPSG:4674Source: IBGE
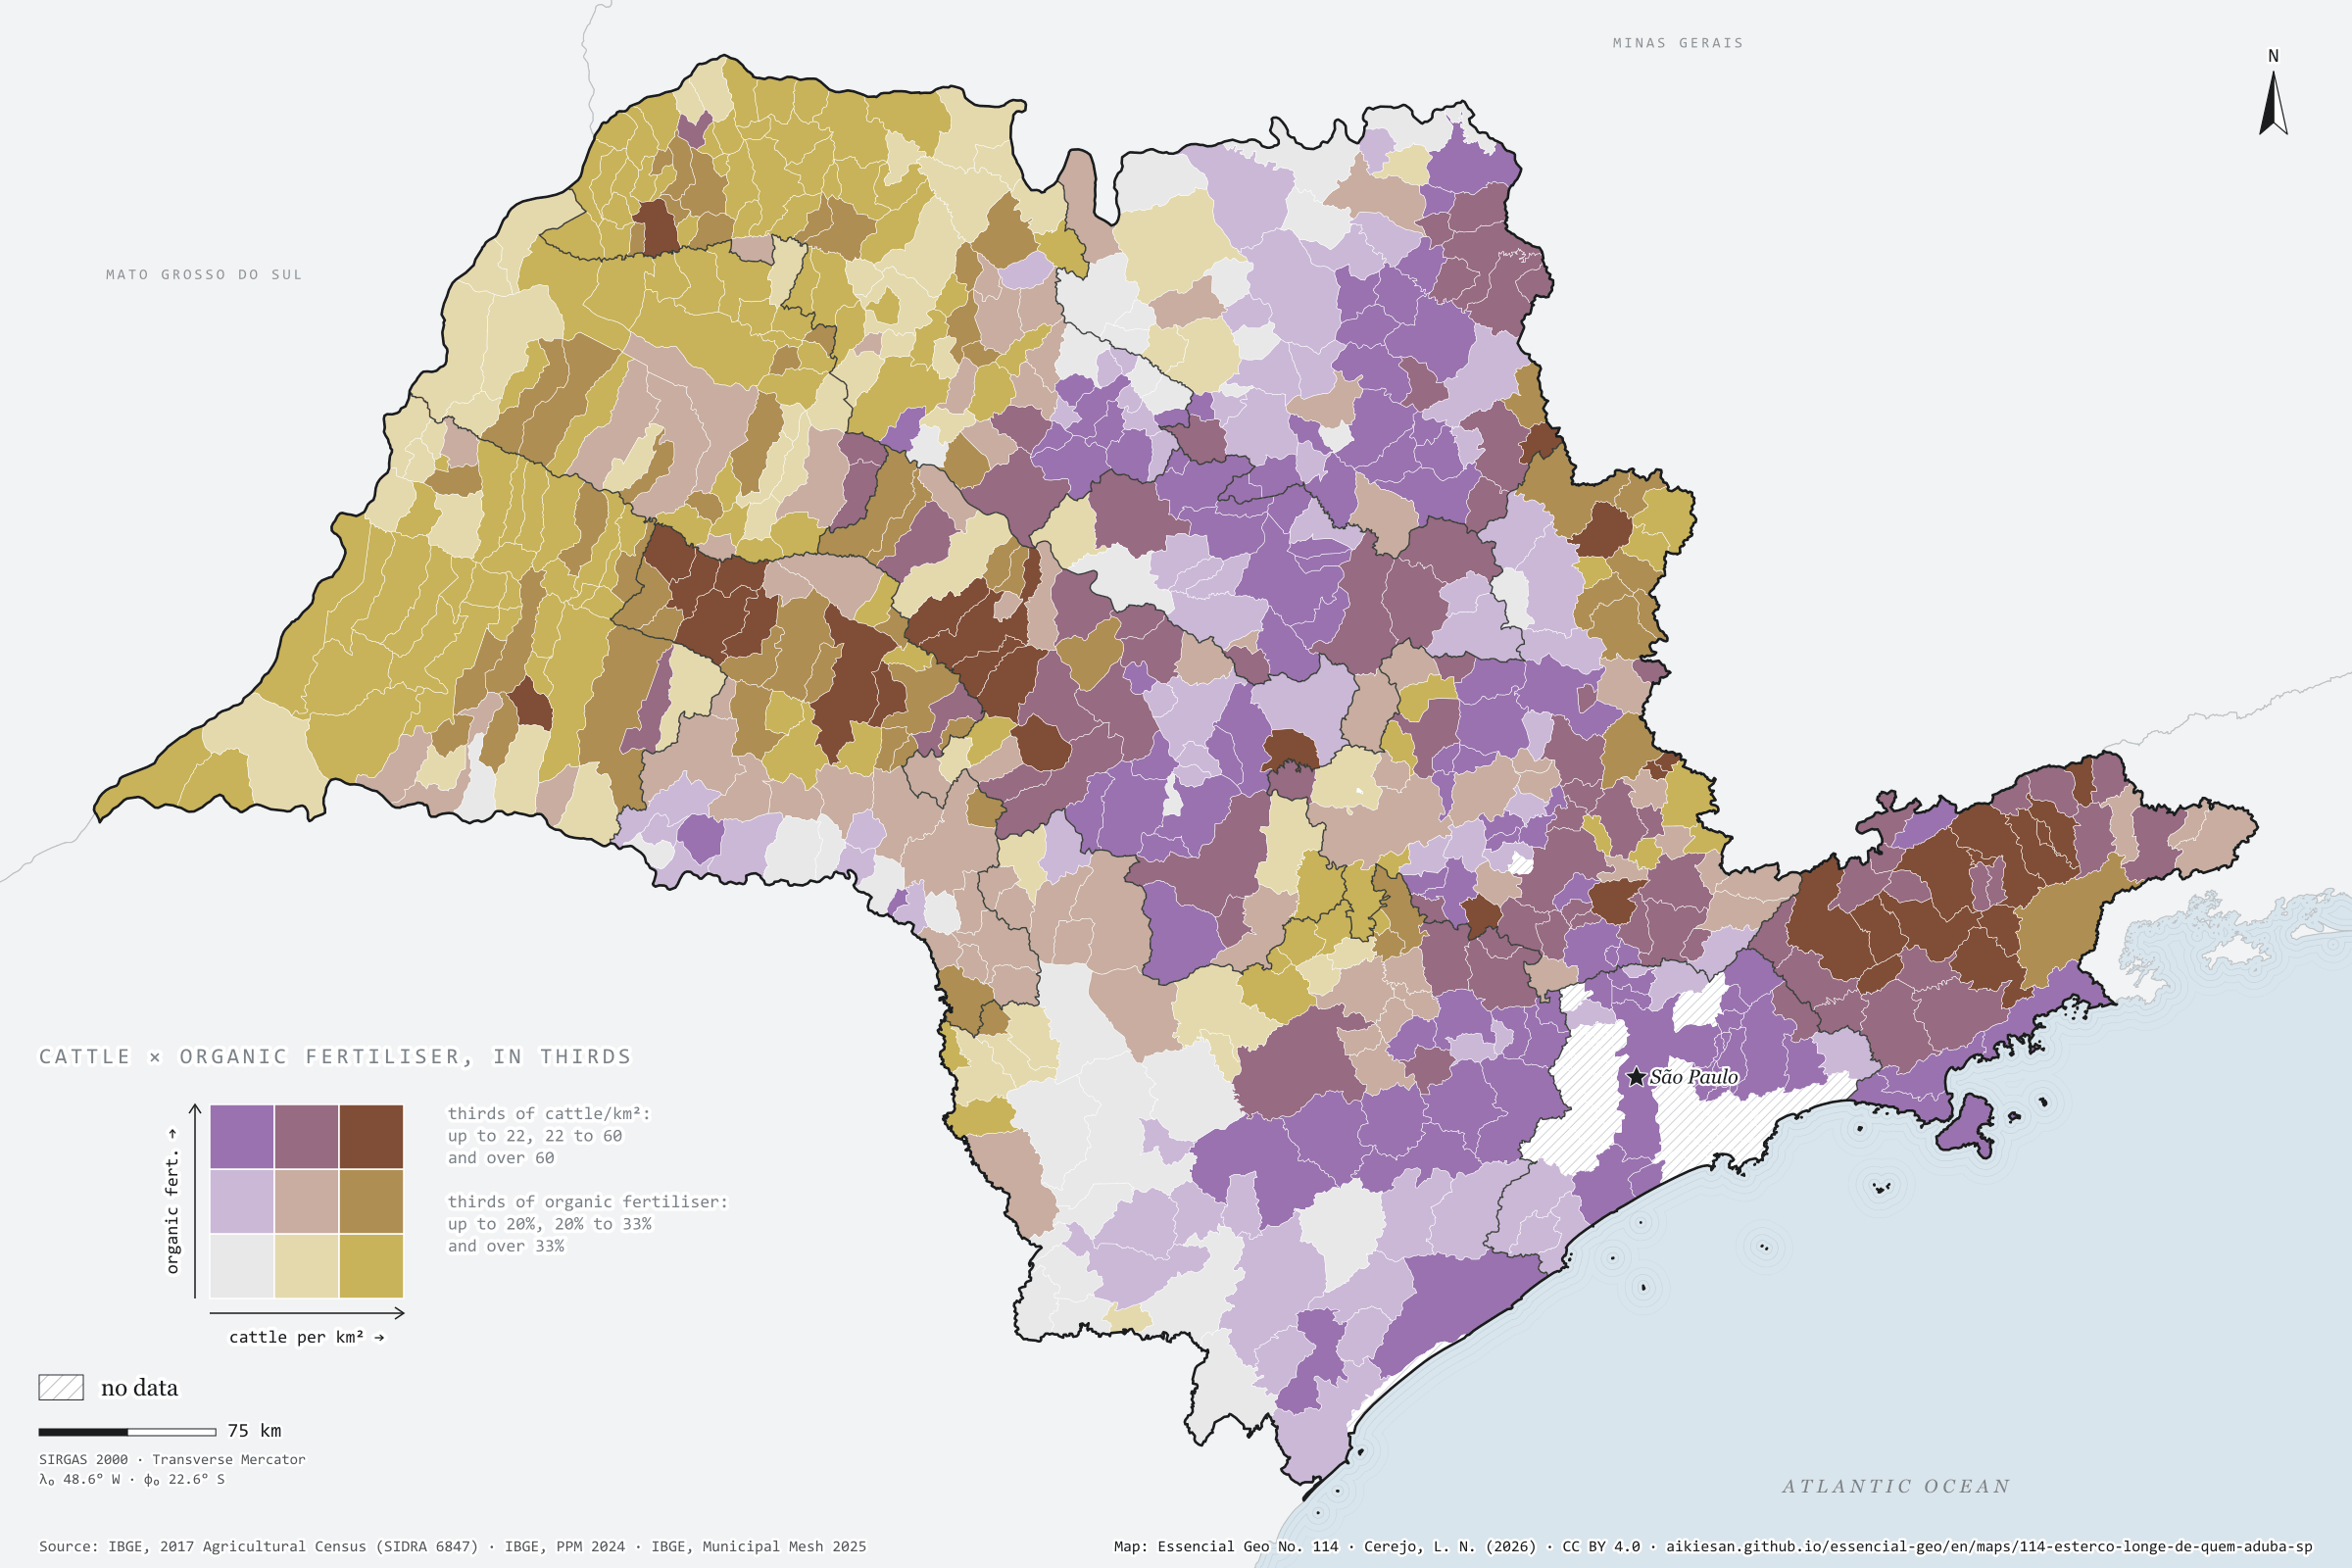
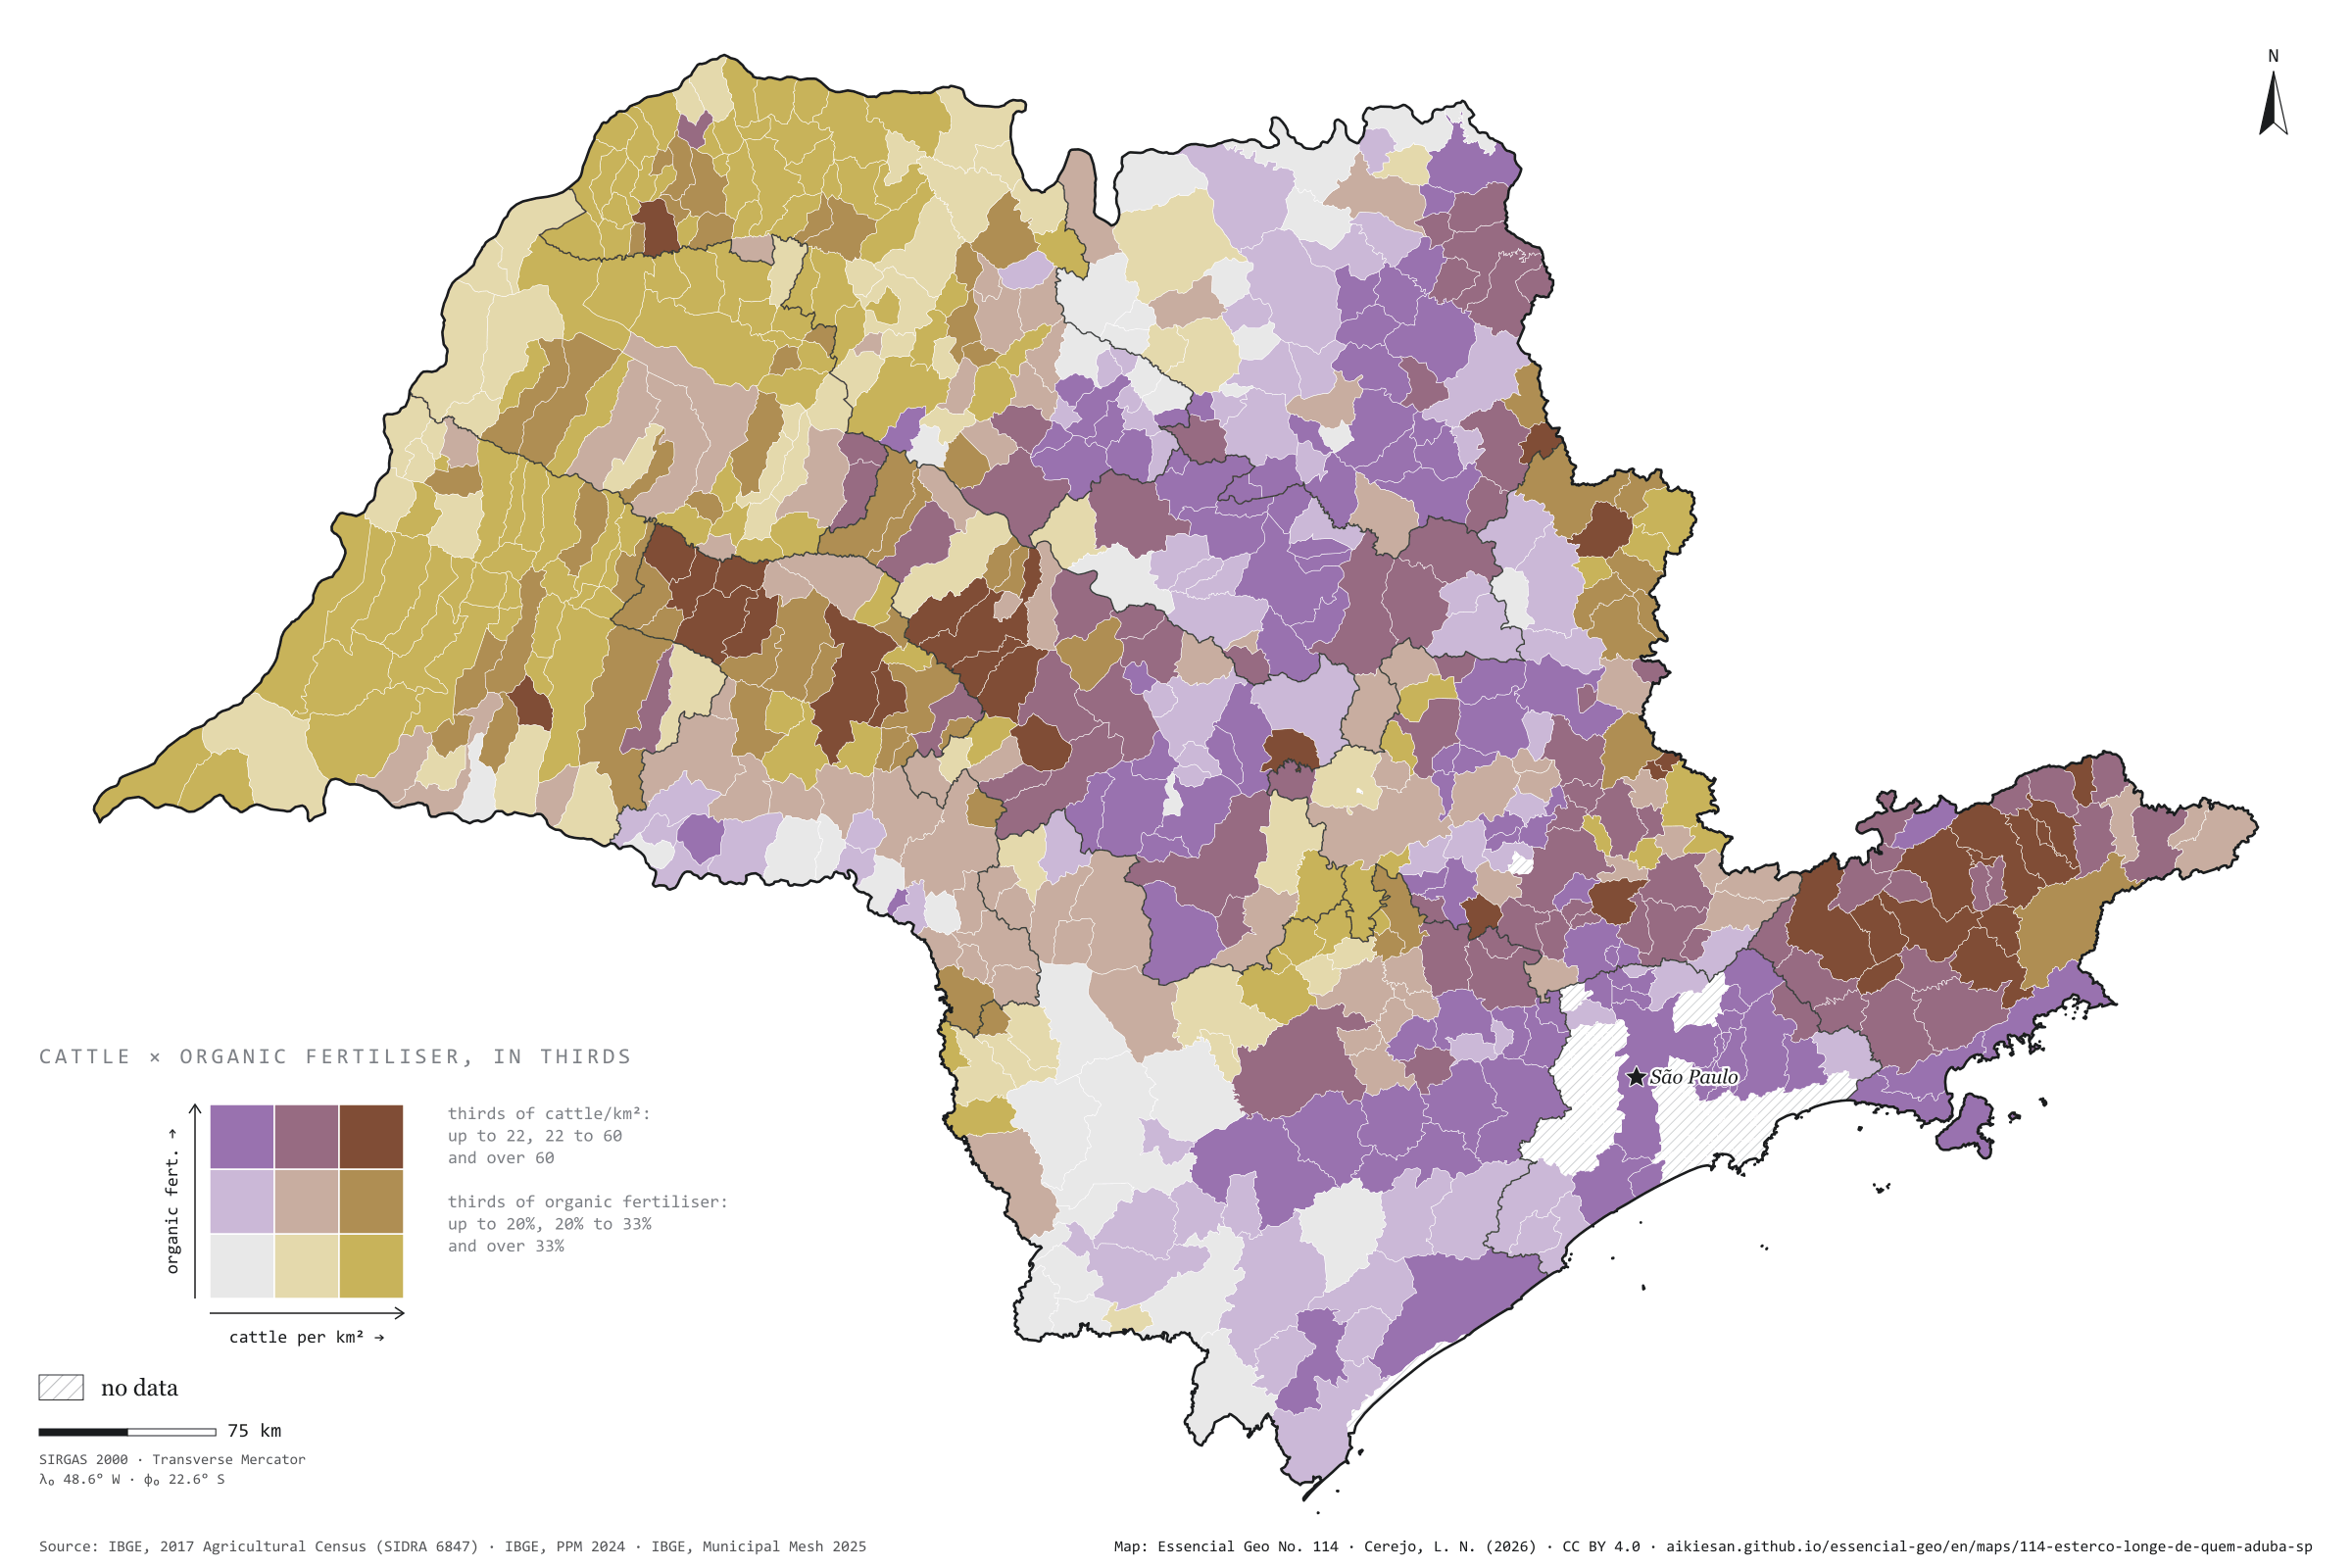
Where there are more cattle per km², fewer farm holdings use organic fertiliser. Across the 617 São Paulo municipalities with data, the rank correlation between the 2024 cattle herd and the share of holdings that applied organic fertiliser in the 2017 Agricultural Census is −0.41, and −0.32 net of urbanisation, density and income. In the quarter of municipalities with fewest cattle, the median is 32%; in the quarter with most, 18%. Grazing cattle leave their manure on pasture, and organic fertiliser includes compost from market gardens near towns: Ferraz de Vasconcelos, with 2.2 cattle per km², has 81%; Presidente Bernardes, with 202, 16%. Fourth plate of the collection “Bioenergy, crossed”.
Technical record · downloads · citation
At a glance
Rank correlation between cattle and organic fertiliser
-0.4
partial −0.32; 617 municipalities
Holdings using organic fertiliser, most-cattle quarter (median)
18%
32% in the fewest-cattle quarter
Municipalities with little fertiliser amid many cattle (LISA)
136municipalities
mostly in São José do Rio Preto (50) and Presidente Prudente (36)
Layers
municipiospolygon645 municipalities with the variables of all five plates, the bivariate classes and the LISA clusters (same GPKG as plates 111 to 115)
gasodutoslineGas transmission pipelines and distribution network (EPE)
regioes_intermediariaspolygon11 intermediate geographic regions
Cattle per km² (IBGE, PPM 2024) and share of farm holdings that applied organic fertiliser, alone or with chemical (IBGE, 2017 Agricultural Census), each in thirds of municipalities, crossed in a 3 × 3 bivariate map; Spearman rank correlations, raw and partial, and bivariate LISA.
The map without a frame, with legend, scale, reference system and credit written on it: ready for papers, lectures and slides. In two versions: with the basemap (neighbours and sea) or only the mapped area, on white.
CEREJO, Lucas Nakamura. O esterco longe de quem aduba: onde há mais boi por km², menos estabelecimentos usam adubo orgânico. Versão 1.0.0. [S. l.]: Essencial, 2026. Conjunto de dados. Disponível em: https://aikiesan.github.io/essencial-geo/en/maps/114-esterco-longe-de-quem-aduba-sp/. Acesso em: 10 nov. 2026.
Cerejo, L. N. (2026). O esterco longe de quem aduba: onde há mais boi por km², menos estabelecimentos usam adubo orgânico [Manure far from who spreads it: Where there are more cattle per km², fewer farms use organic fertiliser] (Version 1.0.0) [Data set]. Essencial. https://aikiesan.github.io/essencial-geo/en/maps/114-esterco-longe-de-quem-aduba-sp/
@dataset{cerejo2026_esterco_longe_de_quem_aduba_sp,
  author    = {Cerejo, Lucas Nakamura},
  title     = {O esterco longe de quem aduba: Onde há mais boi por km², menos estabelecimentos usam adubo orgânico},
  year      = {2026},
  publisher = {Essencial},
  version   = {1.0.0},
  url       = {https://aikiesan.github.io/essencial-geo/en/maps/114-esterco-longe-de-quem-aduba-sp/},
  language  = {portuguese},
  note      = {English title: Manure far from who spreads it: Where there are more cattle per km², fewer farms use organic fertiliser. Licence CC BY 4.0}
}
Where more native vegetation remains, more wood goes to paper and pulp
Fig. 113São Paulo State (SP)EPSG:4674Source: IBGE, MapBiomas
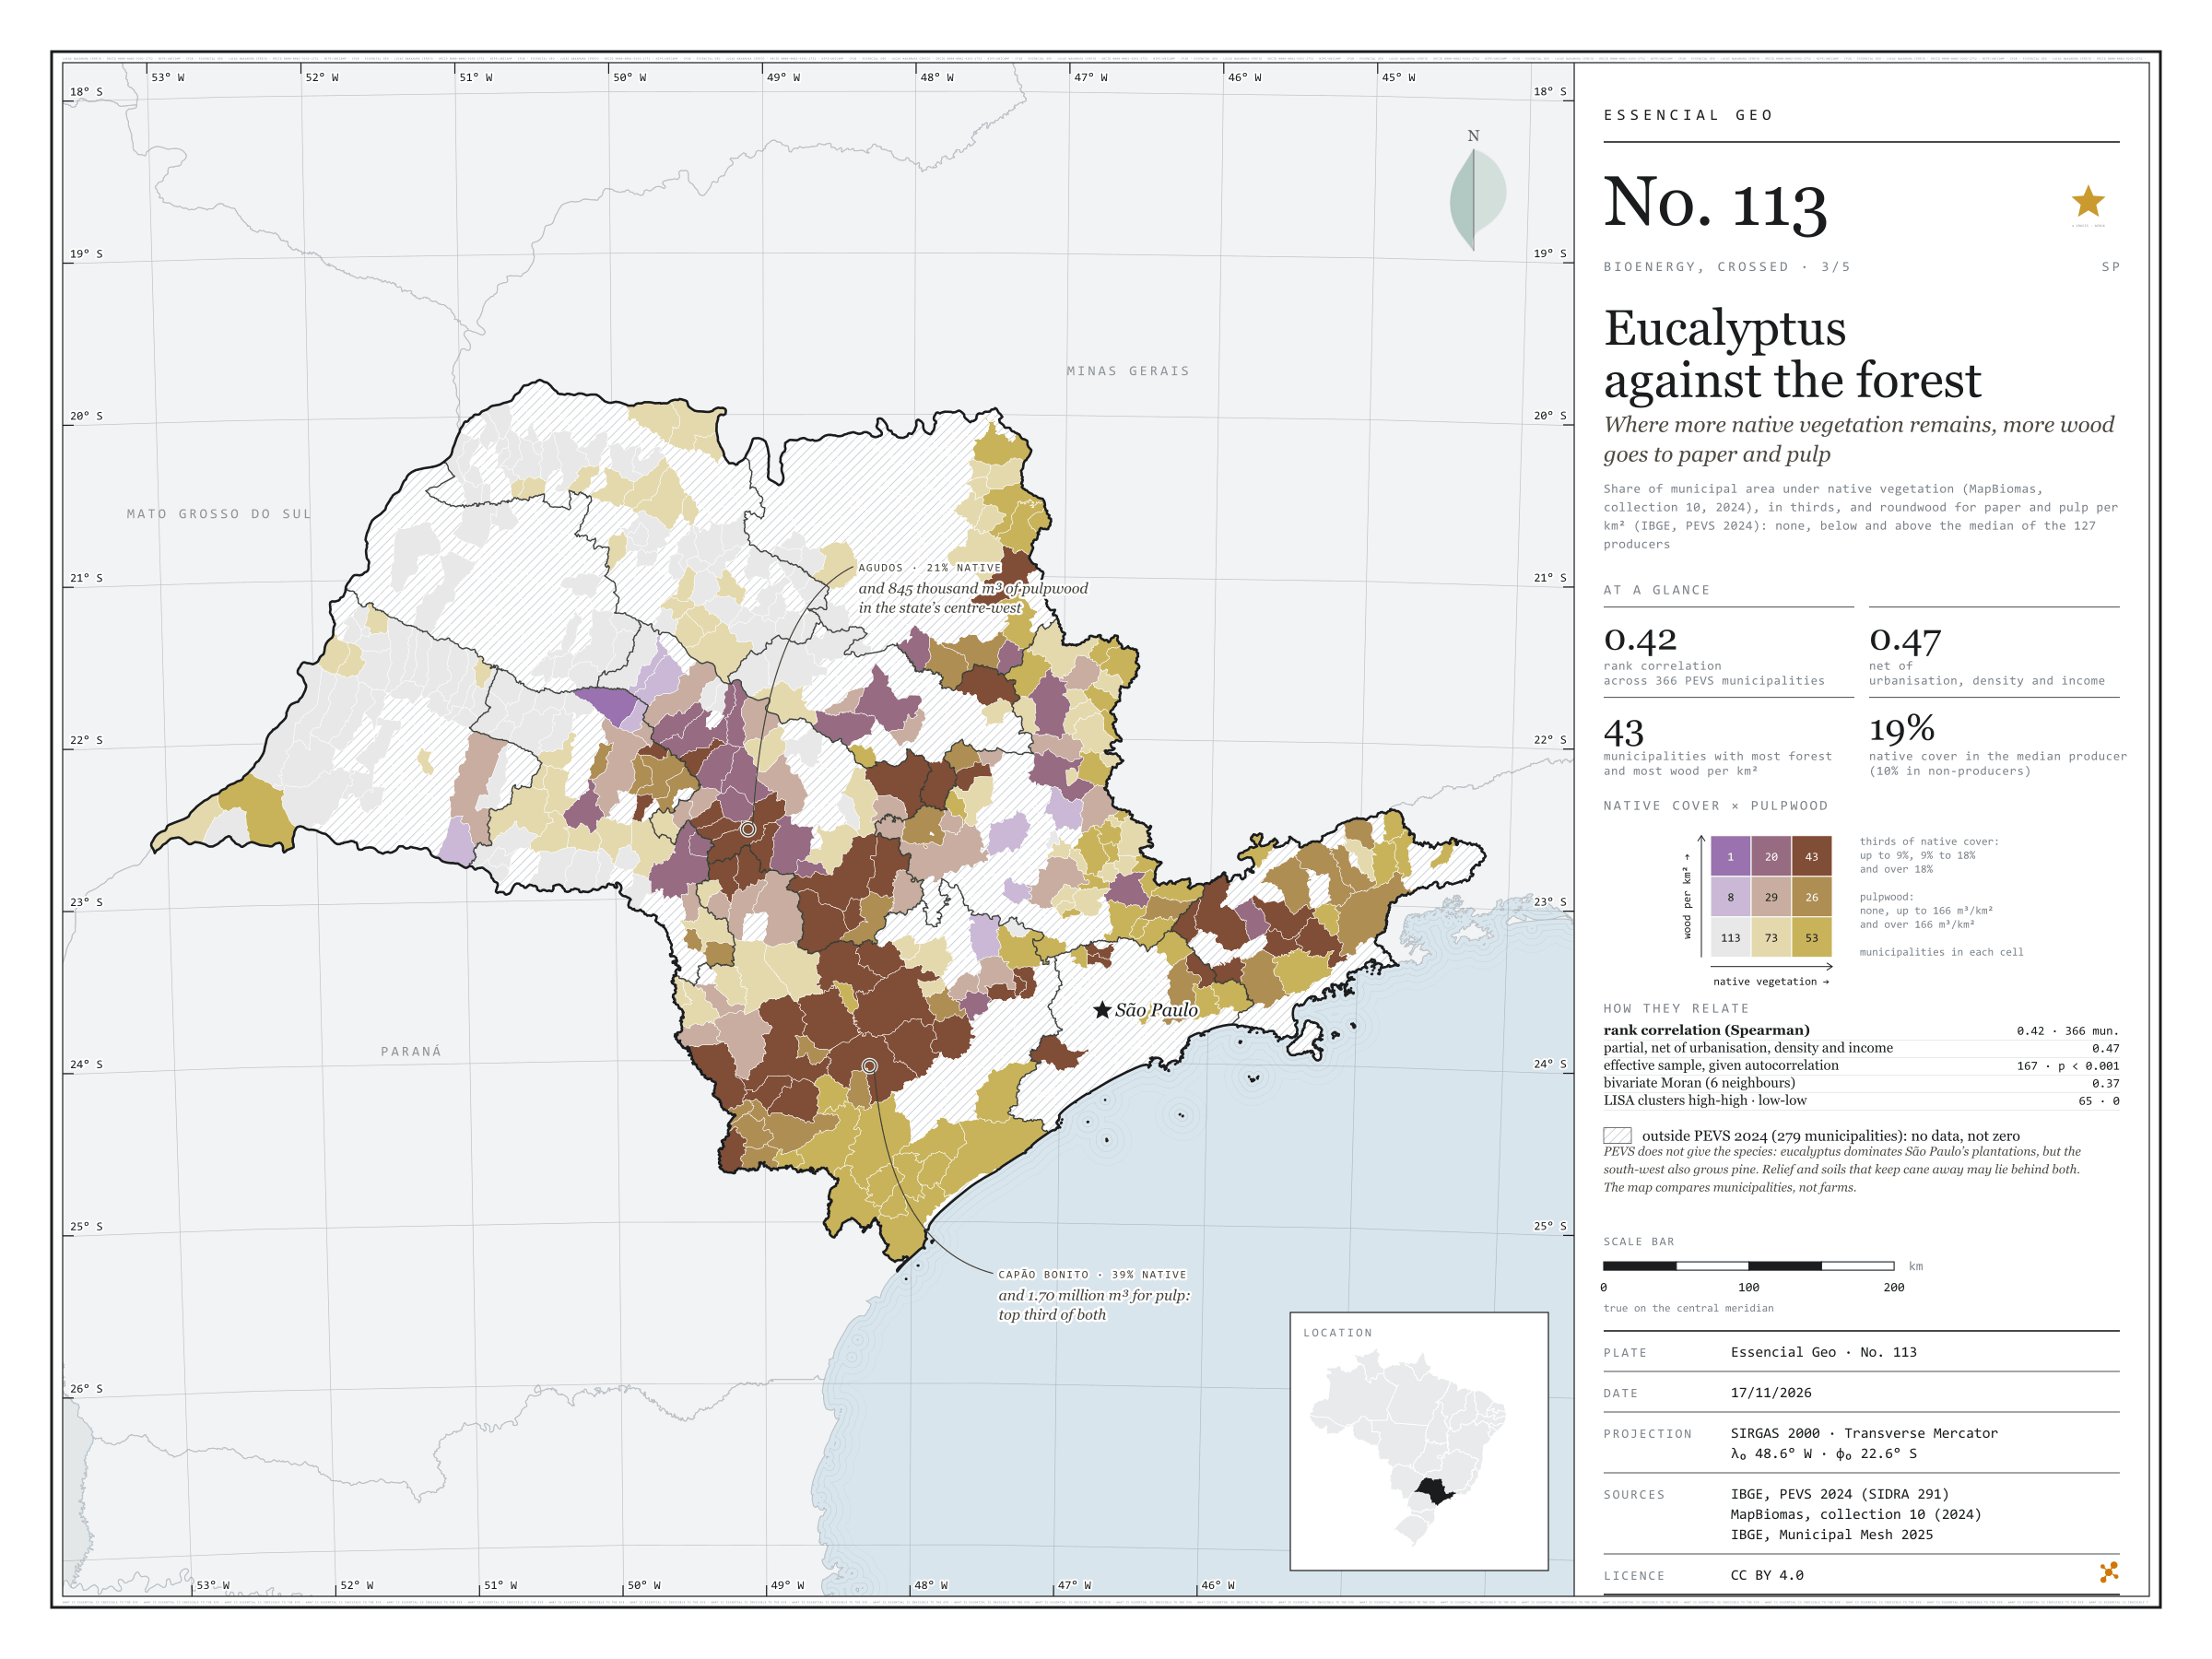
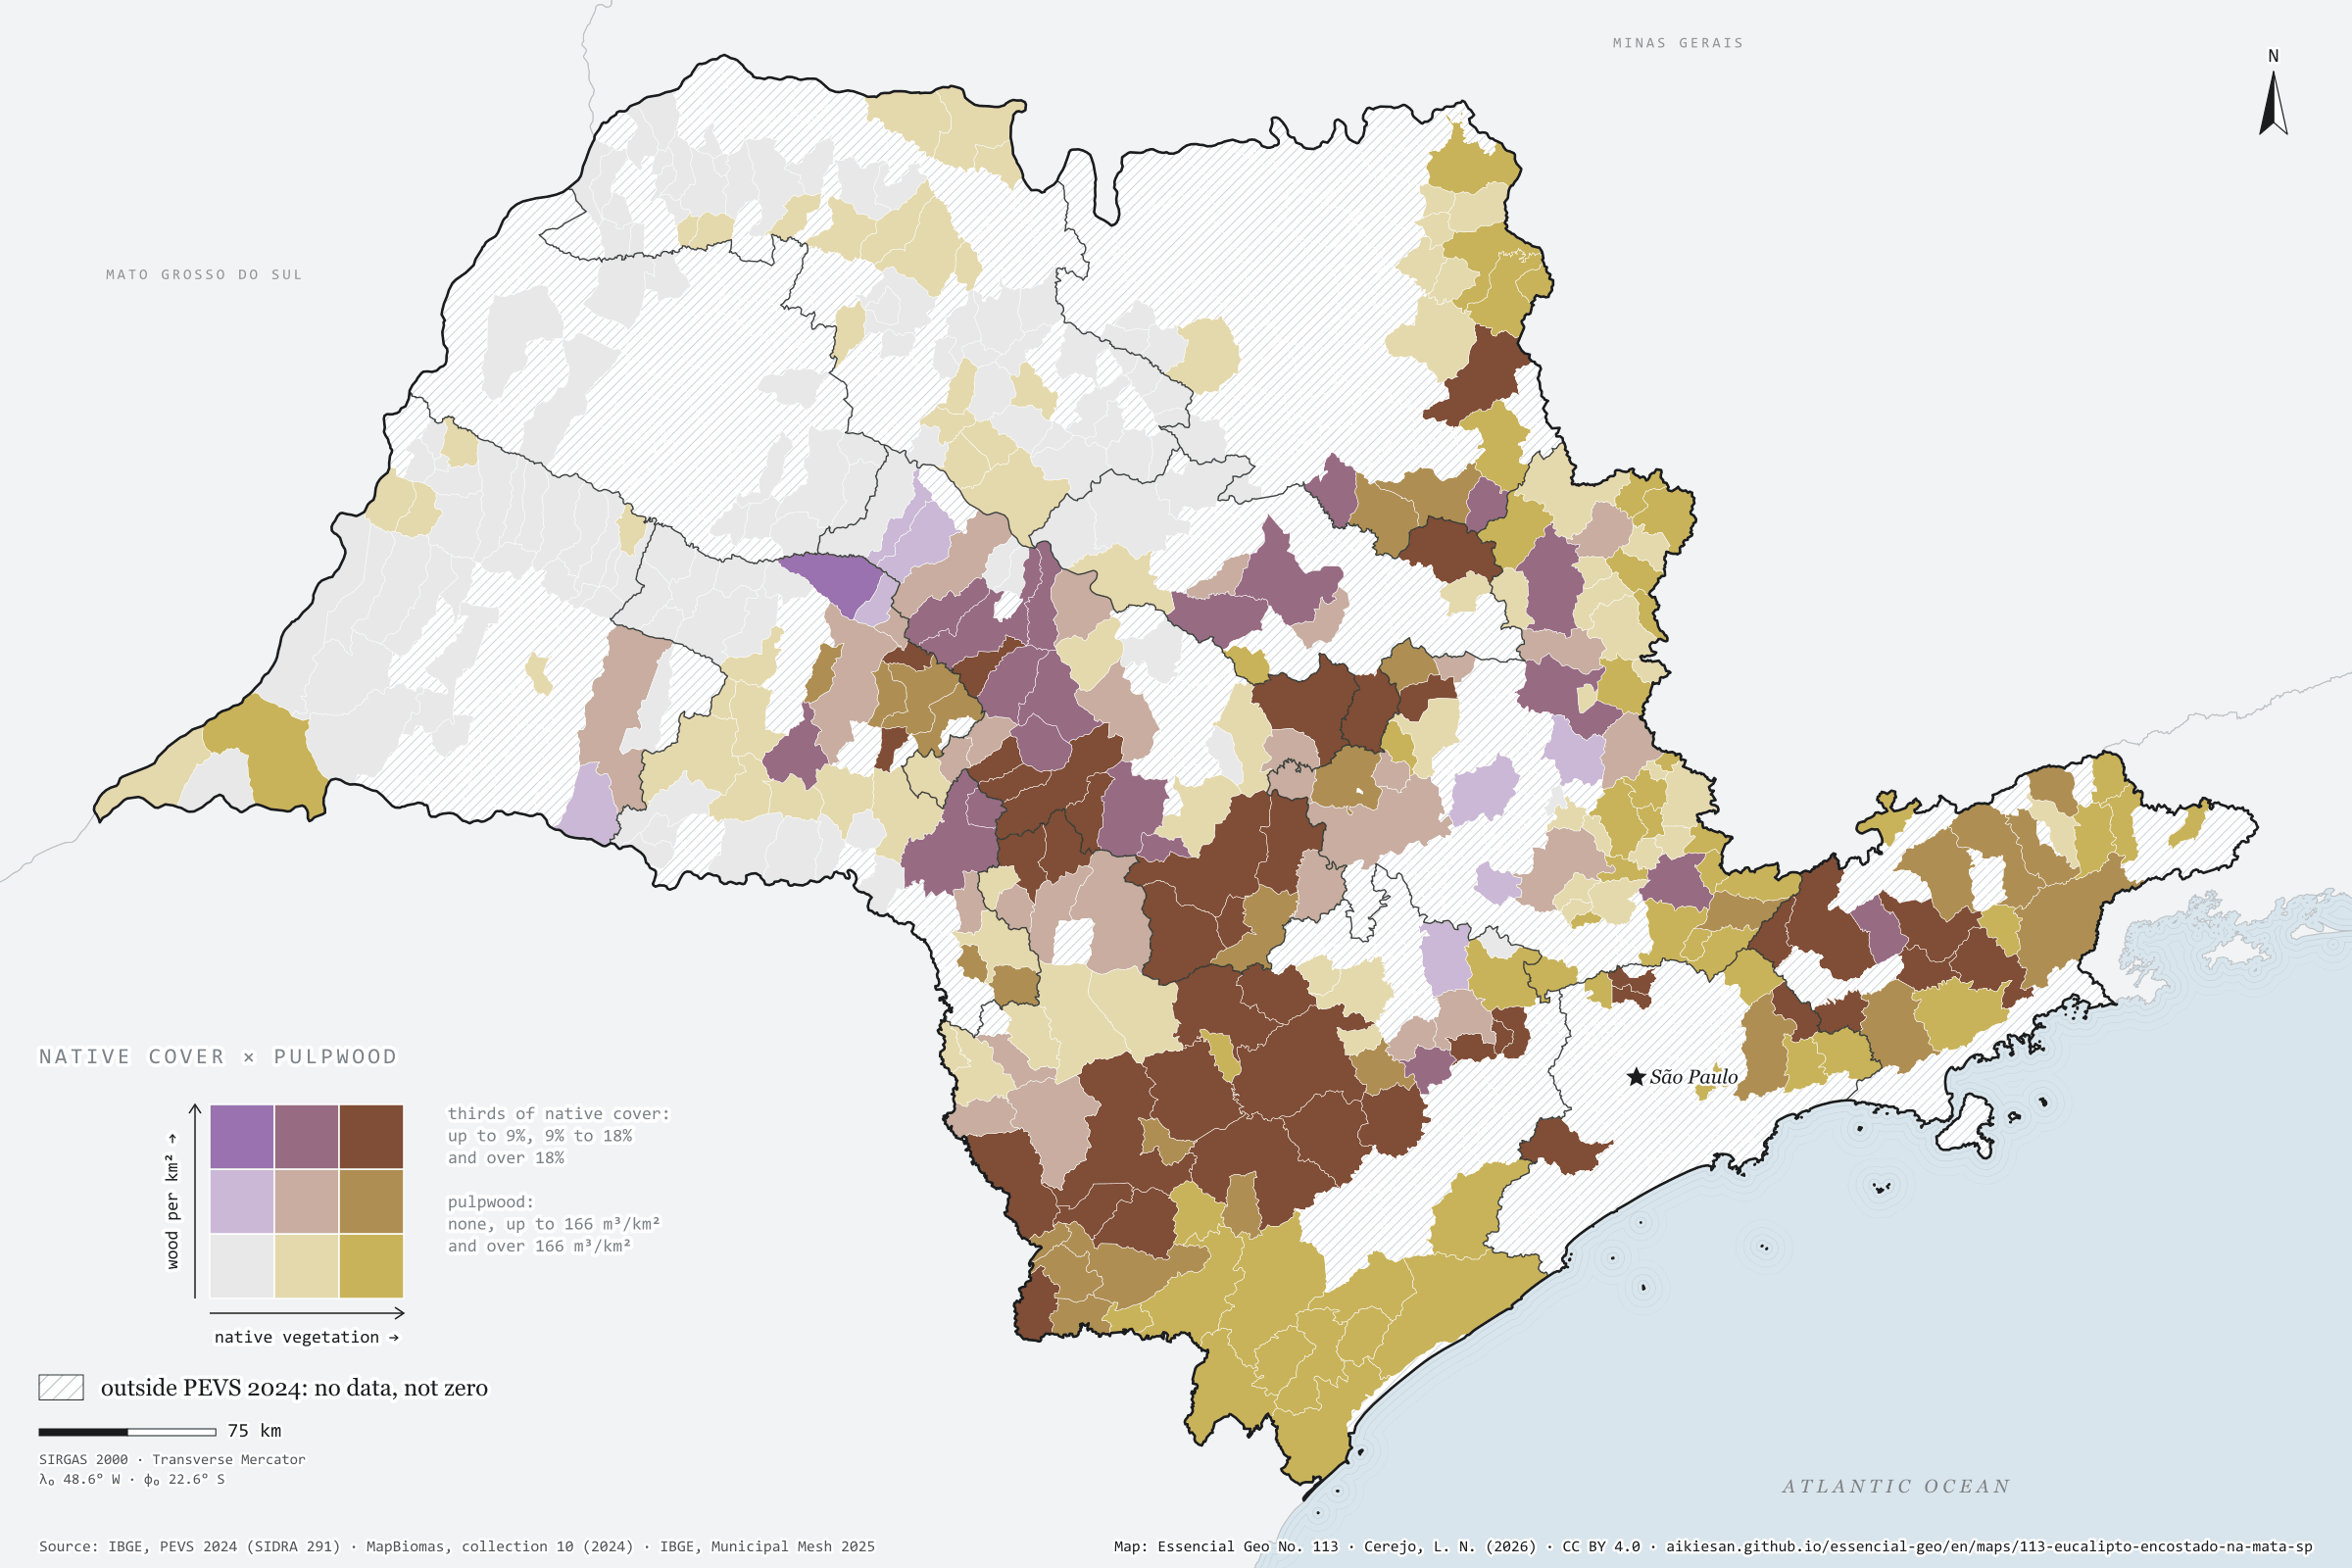
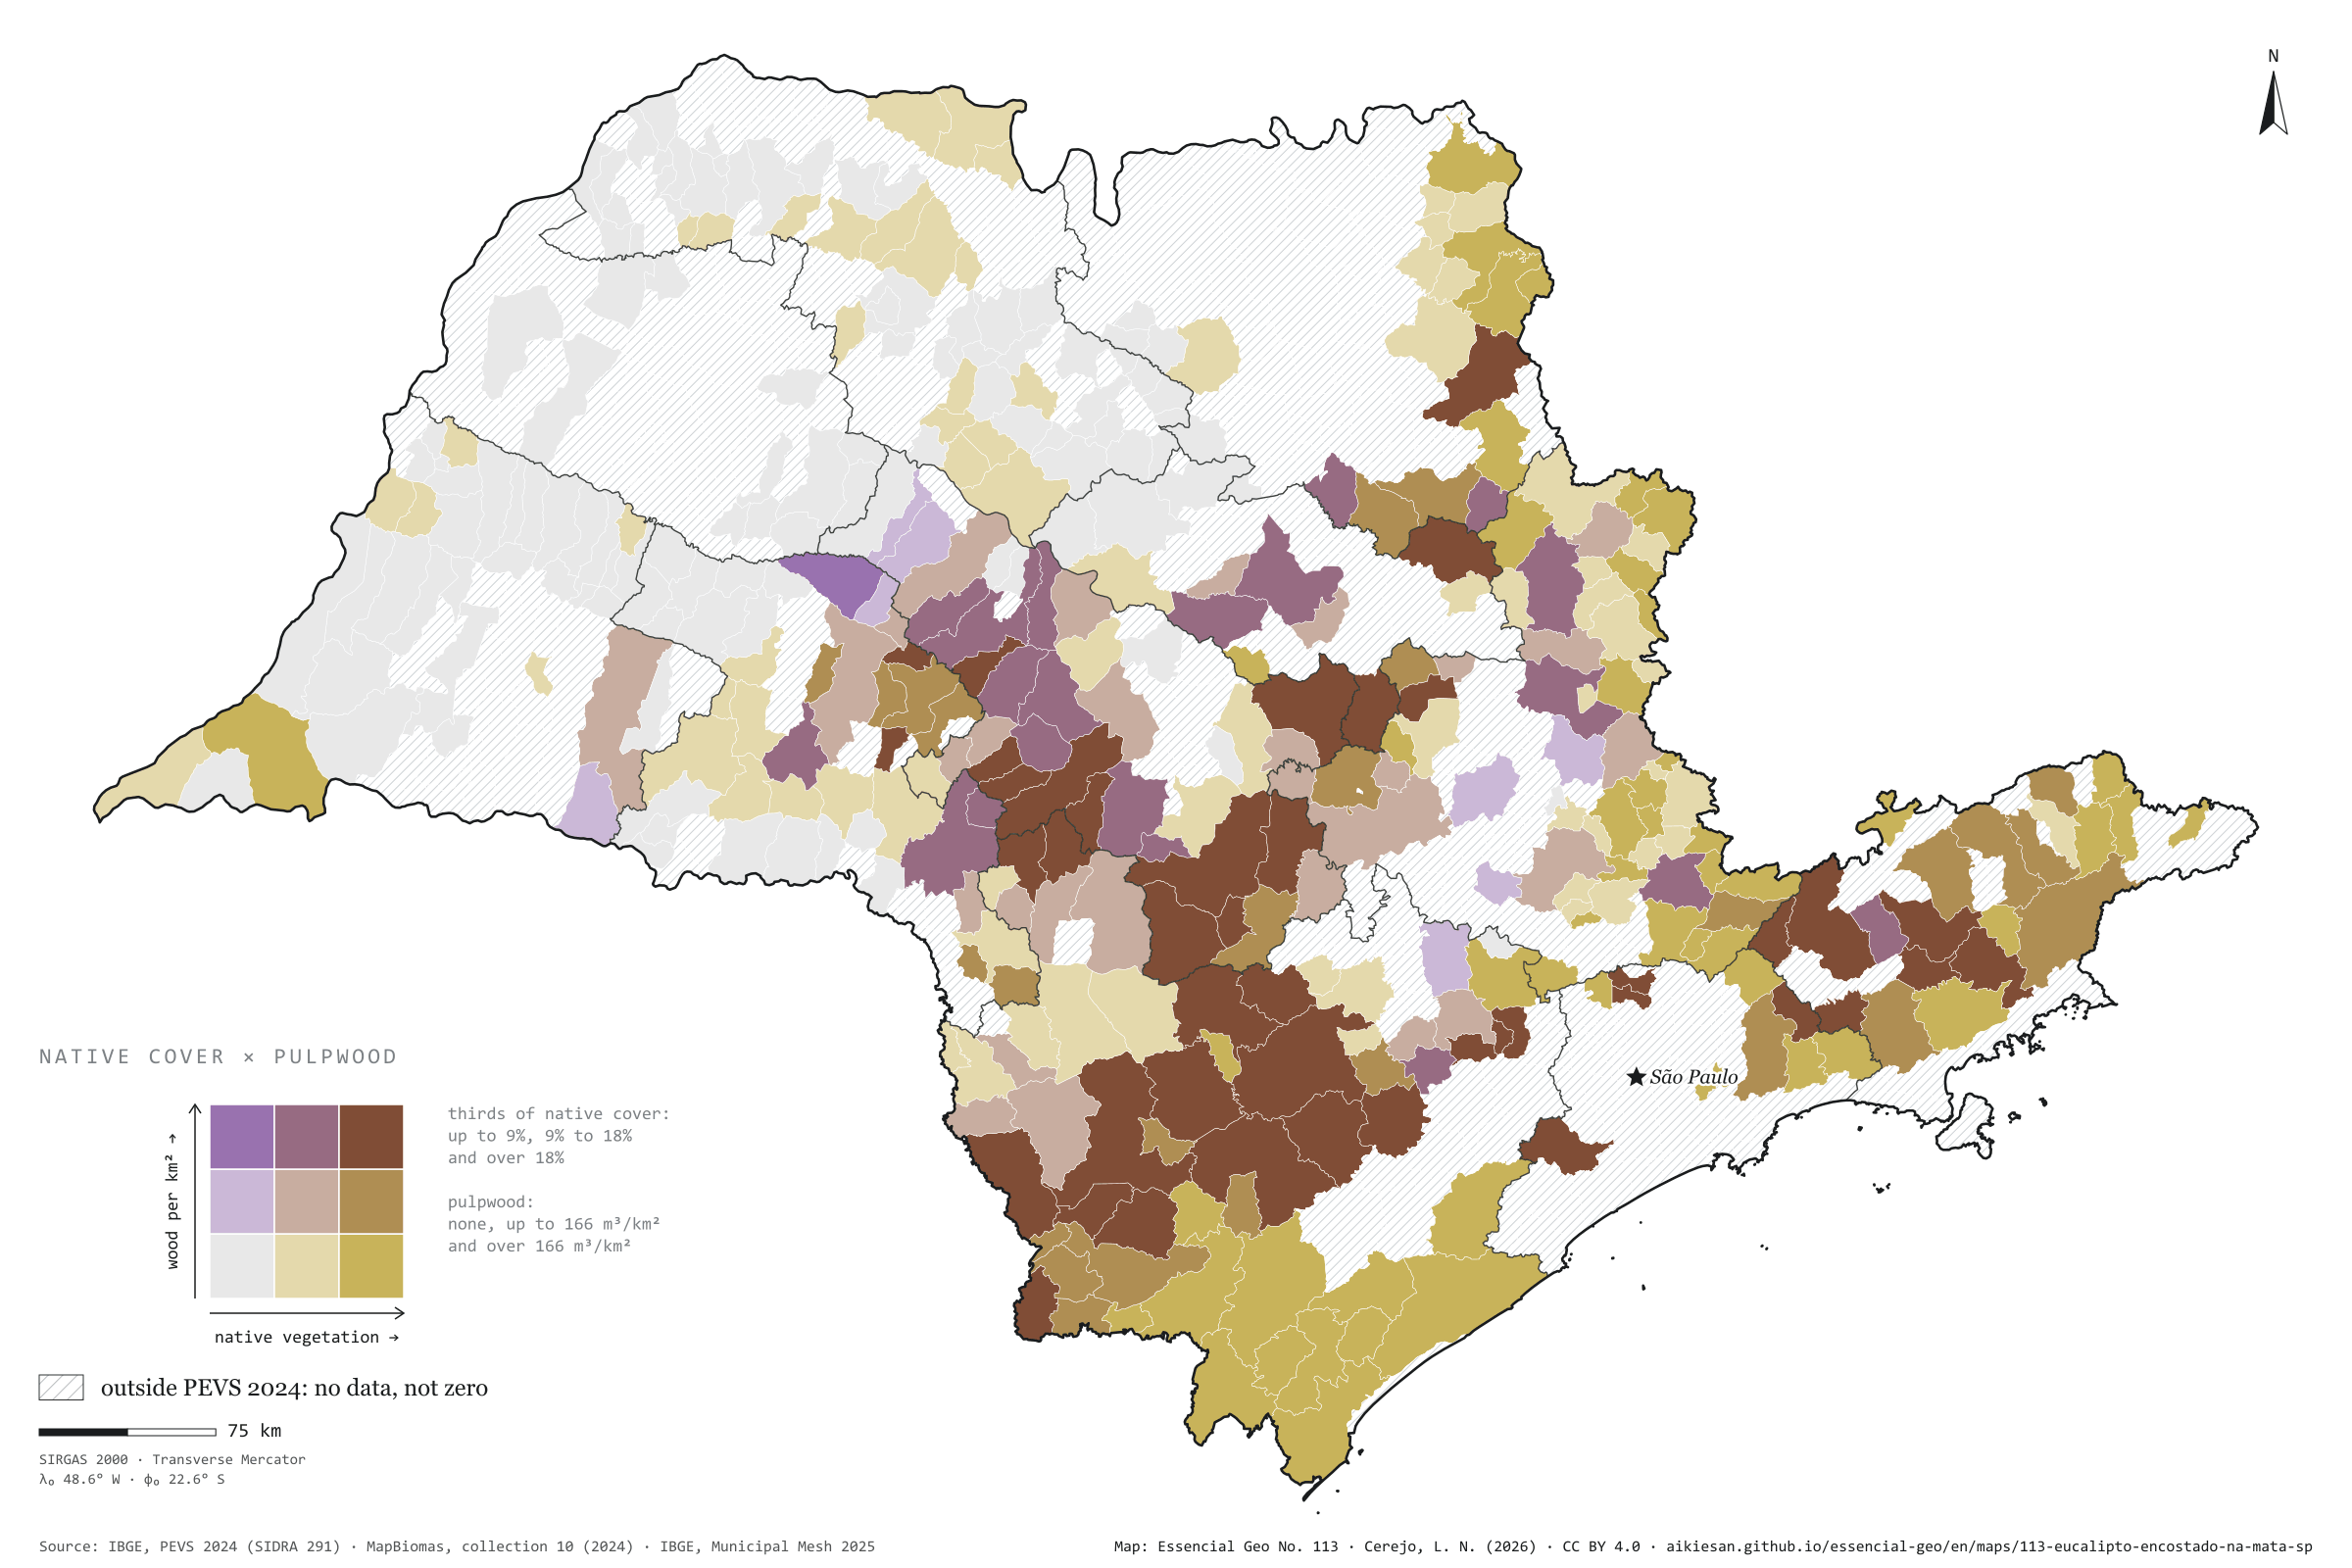
In São Paulo municipalities that harvest plantation wood for paper and pulp, the more native vegetation remains, the more wood comes out per km². Across the 366 municipalities in PEVS 2024, the rank correlation is 0.42, and 0.47 net of urbanisation, density and income. The median producer has 18.7% of its area under native vegetation; surveyed municipalities that do not produce, 9.8%. The 127 producers harvested 24.8 million m³, mostly in the south-west, around Sorocaba, and the centre-west, around Bauru. Capão Bonito combines 39% native cover with 1.70 million m³. Relief and soils that keep cane away may lie behind both. Third plate of the collection “Bioenergy, crossed”.
Technical record · downloads · citation
At a glance
Rank correlation between native cover and pulpwood
0.4
partial 0.47; 366 PEVS municipalities
Native cover in the median producer
19%
9.8% in non-producers
Pulpwood in 2024
25million m³
127 producing municipalities
Layers
municipiospolygon645 municipalities with the variables of all five plates, the bivariate classes and the LISA clusters (same GPKG as plates 111 to 115)
gasodutoslineGas transmission pipelines and distribution network (EPE)
regioes_intermediariaspolygon11 intermediate geographic regions
Share of municipal area under native vegetation (MapBiomas, collection 10, 2024), in thirds, crossed with plantation roundwood for paper and pulp per km² (IBGE, PEVS 2024): none, below and above the producers’ median; 3 × 3 bivariate map only in PEVS municipalities; Spearman rank correlations, raw and partial, and bivariate LISA.
The map without a frame, with legend, scale, reference system and credit written on it: ready for papers, lectures and slides. In two versions: with the basemap (neighbours and sea) or only the mapped area, on white.
CEREJO, Lucas Nakamura. Eucalipto encostado na mata: onde sobra mais vegetação nativa, mais madeira sai para o papel e a celulose. Versão 1.0.0. [S. l.]: Essencial, 2026. Conjunto de dados. Disponível em: https://aikiesan.github.io/essencial-geo/en/maps/113-eucalipto-encostado-na-mata-sp/. Acesso em: 10 nov. 2026.
Cerejo, L. N. (2026). Eucalipto encostado na mata: onde sobra mais vegetação nativa, mais madeira sai para o papel e a celulose [Eucalyptus against the forest: Where more native vegetation remains, more wood goes to paper and pulp] (Version 1.0.0) [Data set]. Essencial. https://aikiesan.github.io/essencial-geo/en/maps/113-eucalipto-encostado-na-mata-sp/
@dataset{cerejo2026_eucalipto_encostado_na_mata_sp,
  author    = {Cerejo, Lucas Nakamura},
  title     = {Eucalipto encostado na mata: Onde sobra mais vegetação nativa, mais madeira sai para o papel e a celulose},
  year      = {2026},
  publisher = {Essencial},
  version   = {1.0.0},
  url       = {https://aikiesan.github.io/essencial-geo/en/maps/113-eucalipto-encostado-na-mata-sp/},
  language  = {portuguese},
  note      = {English title: Eucalyptus against the forest: Where more native vegetation remains, more wood goes to paper and pulp. Licence CC BY 4.0}
}
In 300 municipalities, biomethane potential exceeds, in energy, the diesel sold at the pumps
Fig. 112São Paulo State (SP)EPSG:4674Source: CP2B (Unicamp), SEMIL/SP, Municipal Energy Yearbook 2025 (base year 2024): sales of hydrous ethanol, petrol C, diesel oil and piped natural gas by municipality, SENATRAN, IBGE
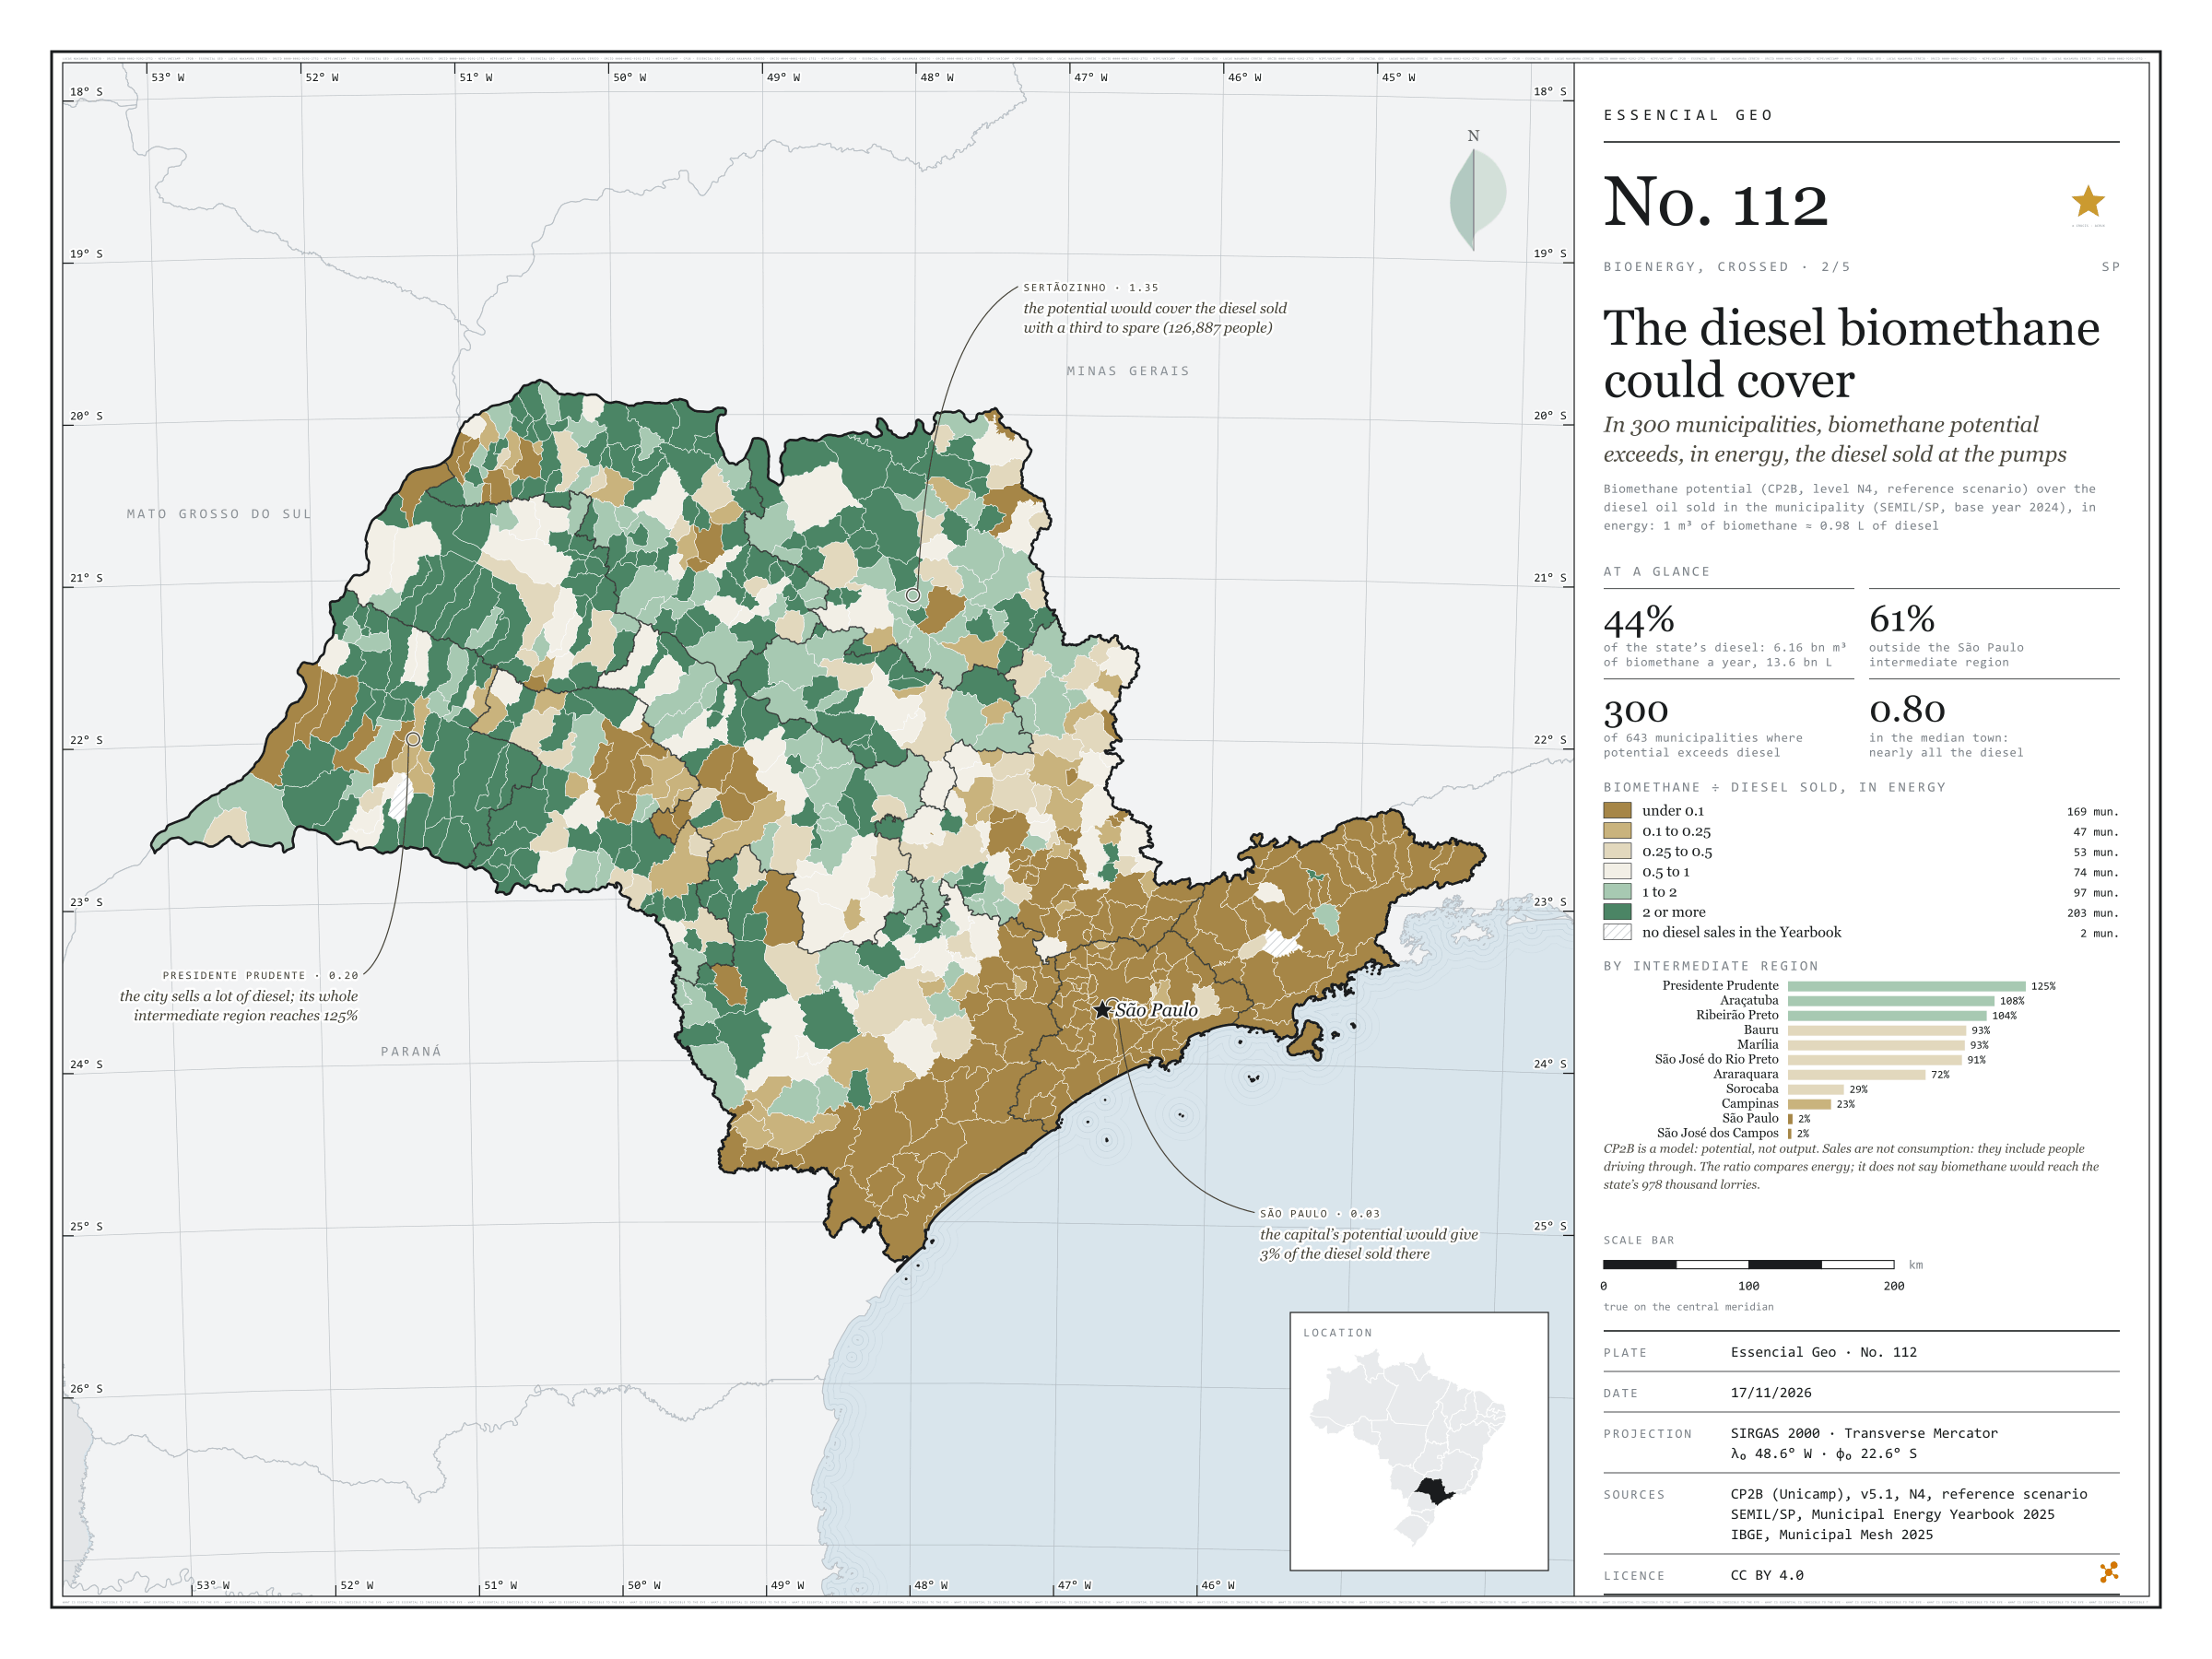
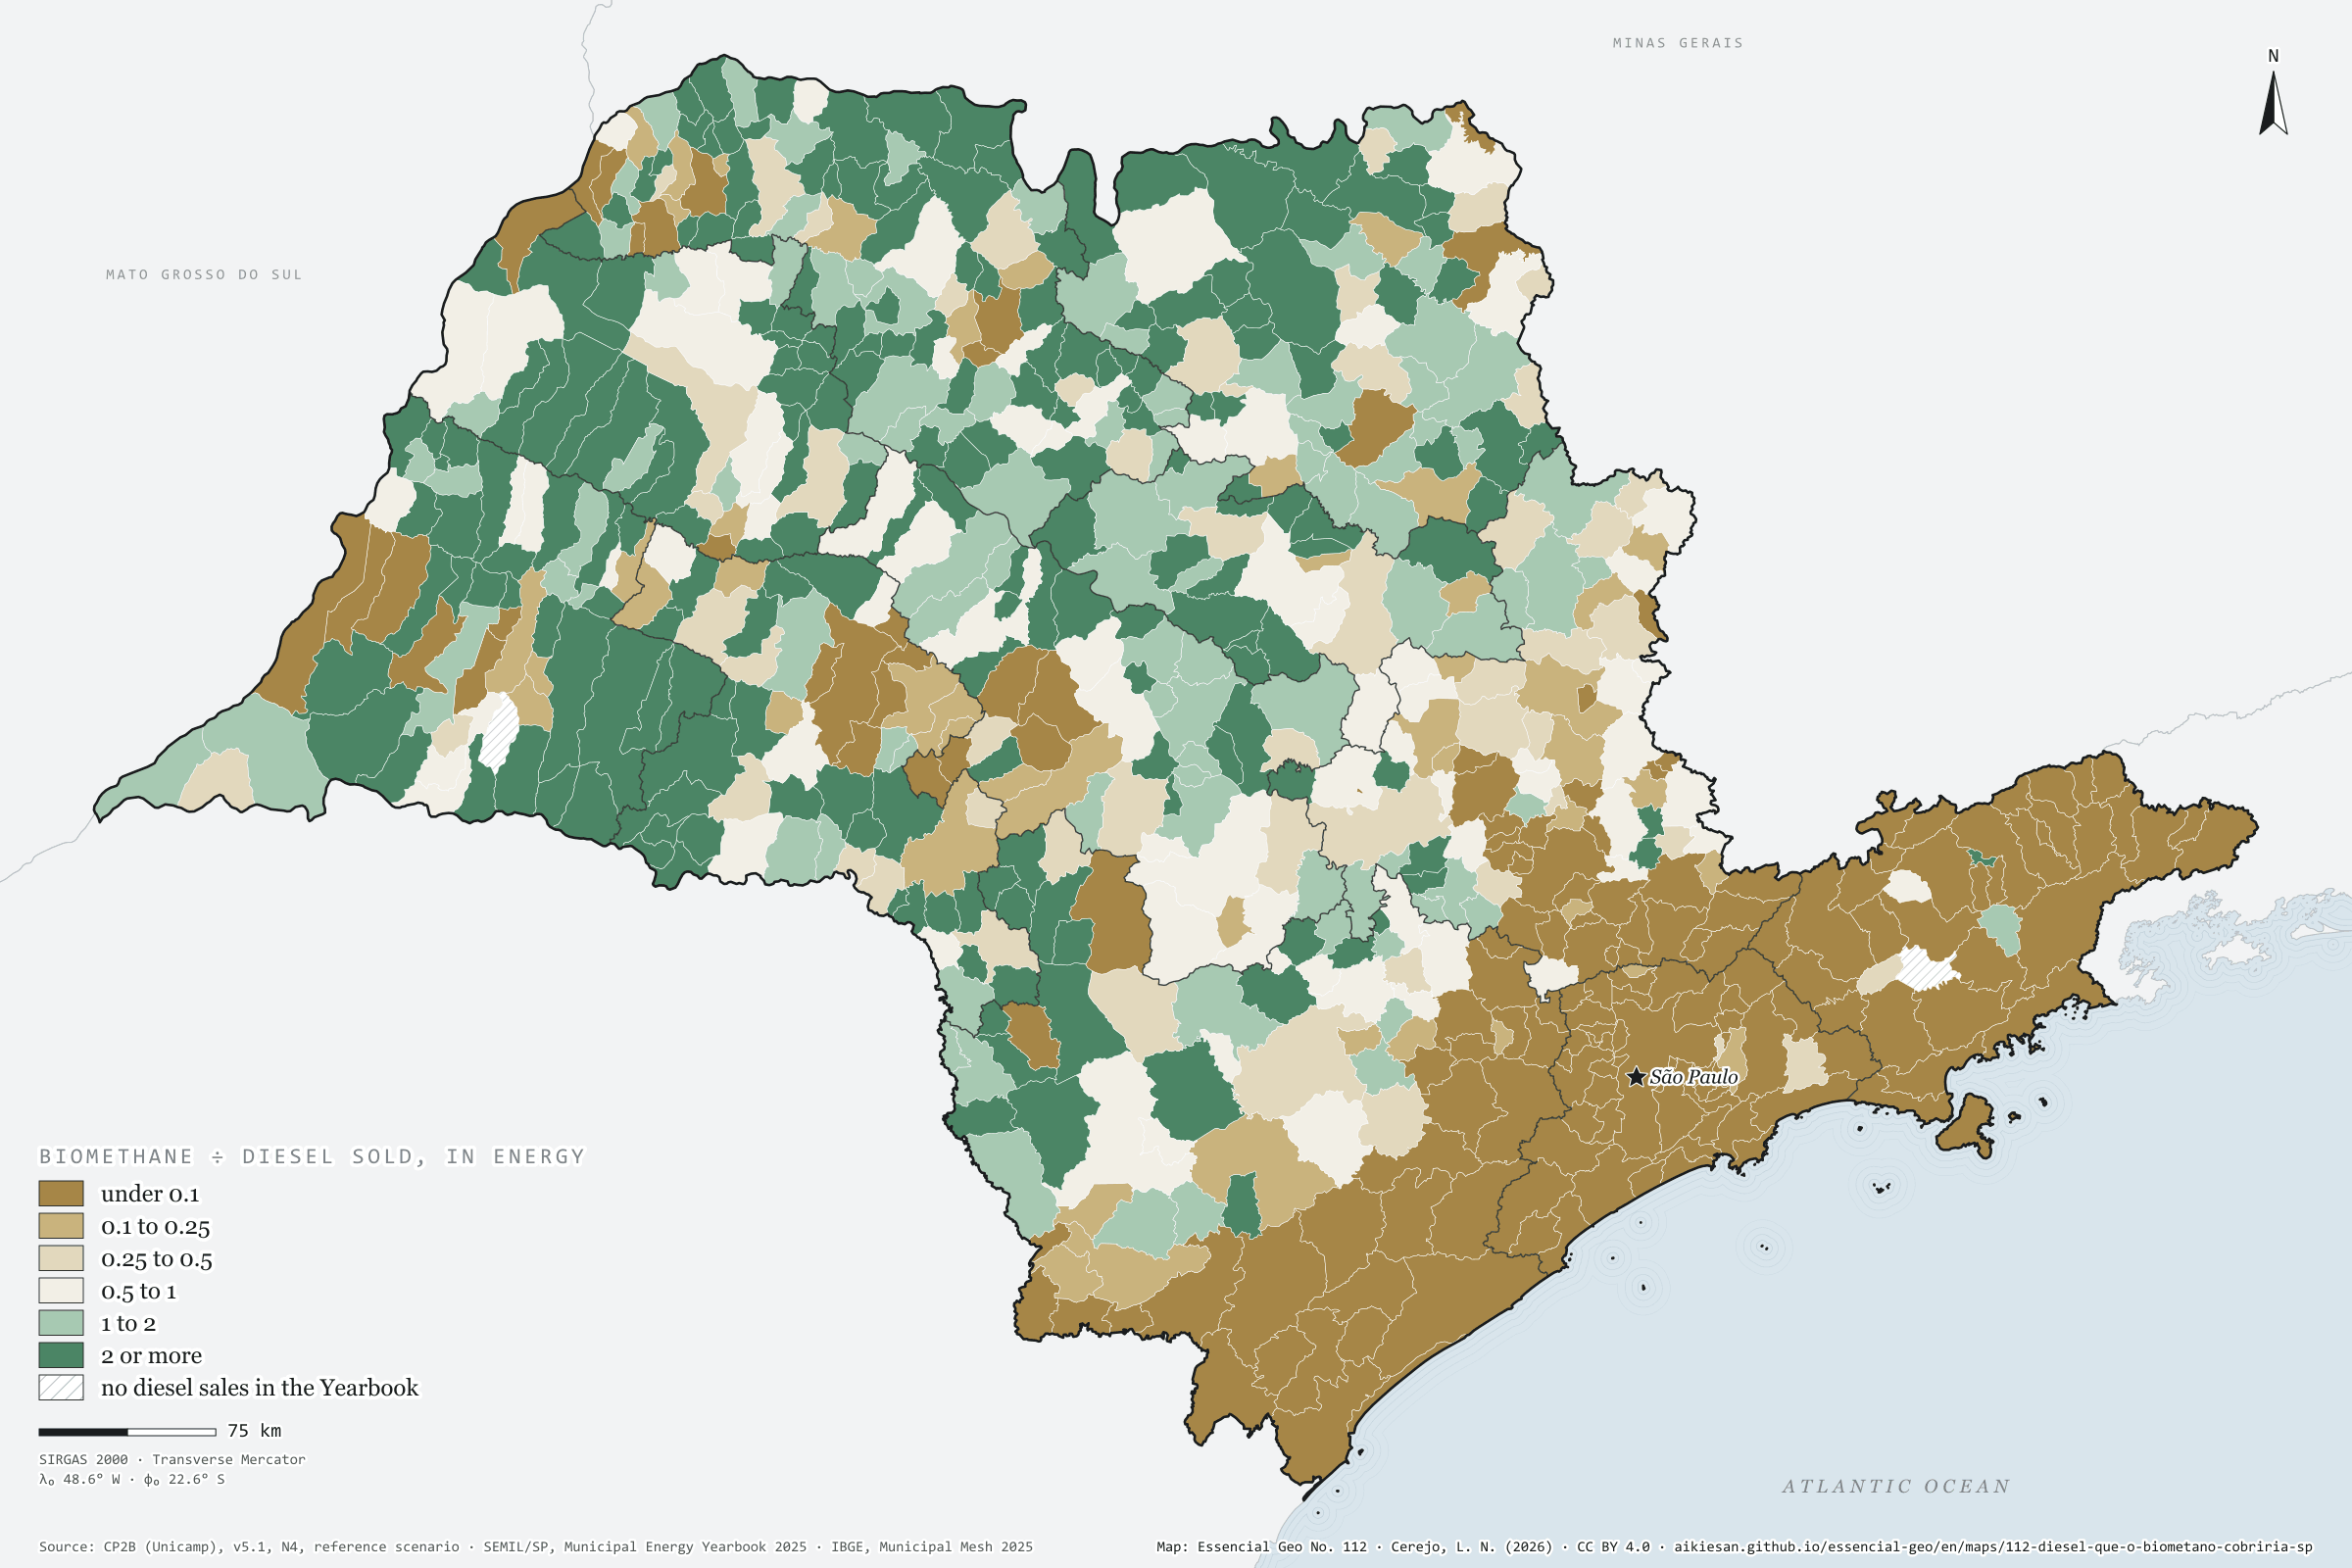
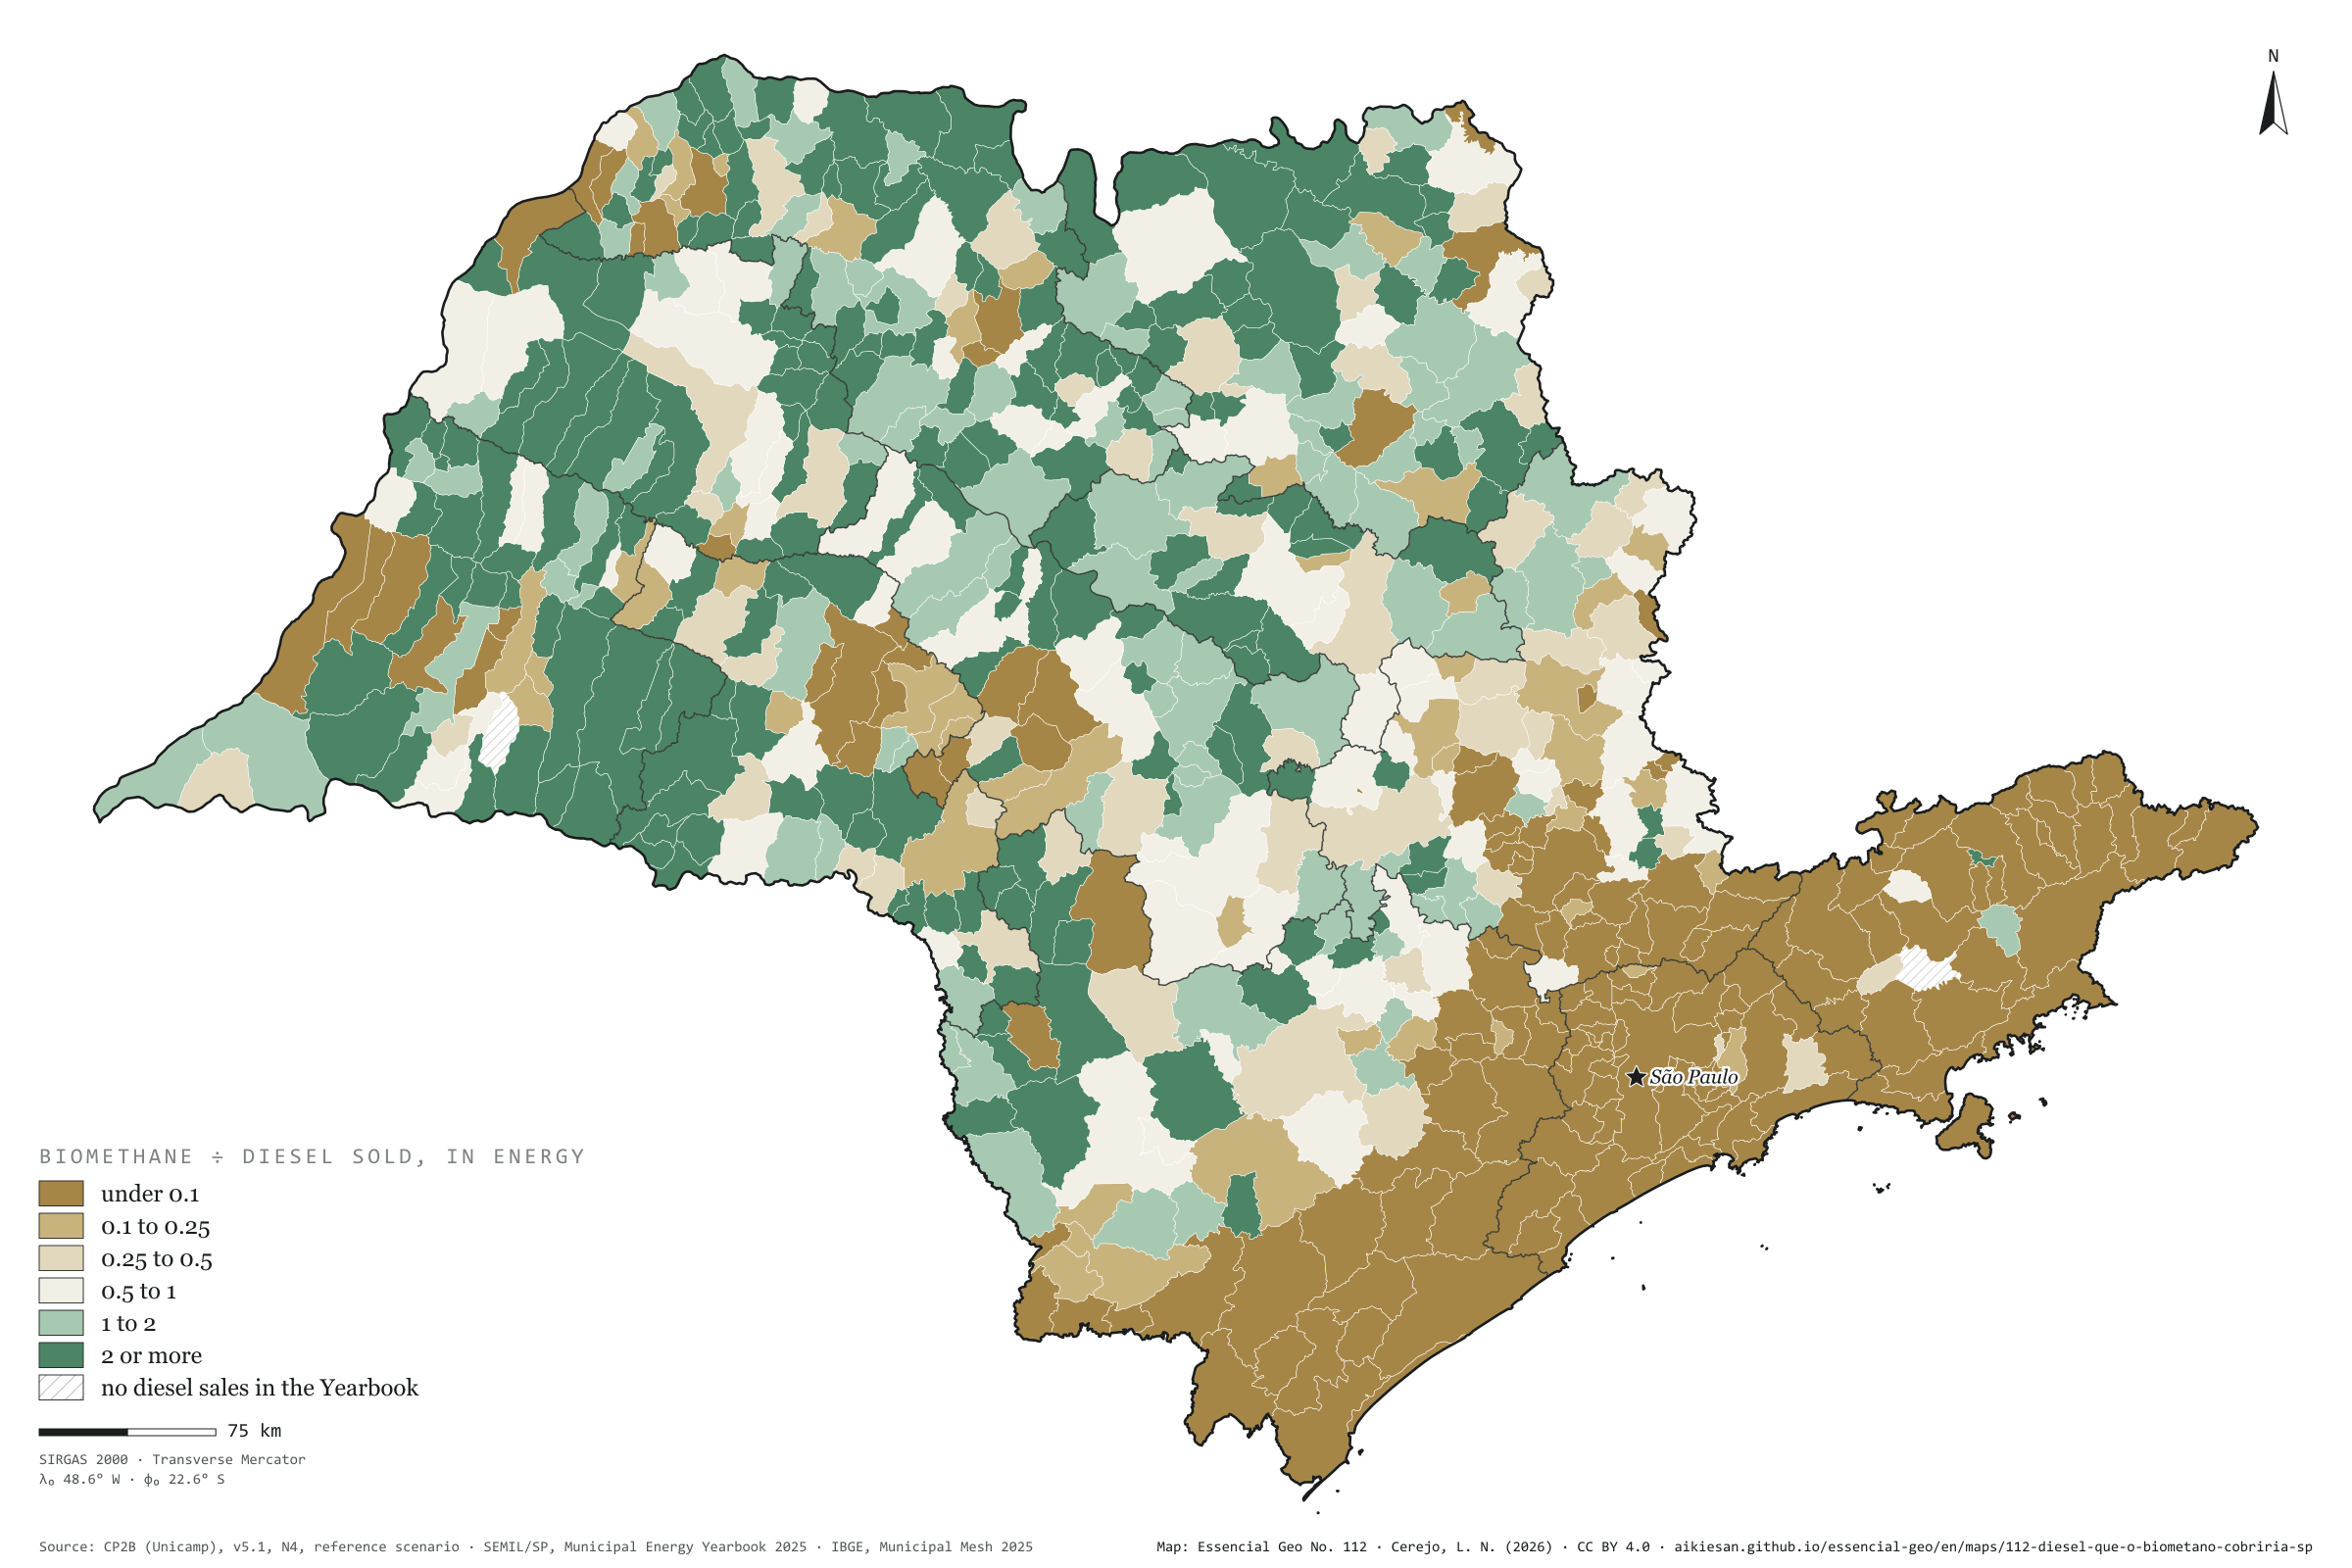
If all of São Paulo’s accessible biomethane potential became fuel, 6.16 billion m³ a year, it would cover in energy 44% of the 13.6 billion litres of diesel sold in the state in 2024; outside the São Paulo intermediate region, 61%. In 300 of the 643 municipalities the potential exceeds the diesel sold, and in the median municipality it reaches 80%. Sertãozinho would cover its own diesel with a third to spare; the whole Presidente Prudente region reaches 125%; the capital, 3%. It is an energy sum, not a plan: CP2B is a model, and diesel sales are not consumption. Second plate of the collection “Bioenergy, crossed”.
Technical record · downloads · citation
At a glance
State diesel that biomethane could cover, in energy
44%
61% outside the São Paulo region
Municipalities where potential exceeds diesel sold
300municipalities
out of 643
Ratio in the median municipality
0.8
Layers
municipiospolygon645 municipalities with the variables of all five plates, the bivariate classes and the LISA clusters (same GPKG as plates 111 to 115)
gasodutoslineGas transmission pipelines and distribution network (EPE)
regioes_intermediariaspolygon11 intermediate geographic regions
CP2B biomethane potential (v5.1, level N4, reference scenario) in m³ a year, converted into energy-equivalent litres of diesel (1 m³ ≈ 0.98 L), over the diesel oil sold in the municipality (SEMIL/SP, base year 2024); six classes of the ratio; sums by intermediate region.
The map without a frame, with legend, scale, reference system and credit written on it: ready for papers, lectures and slides. In two versions: with the basemap (neighbours and sea) or only the mapped area, on white.
CEREJO, Lucas Nakamura. O diesel que o biometano cobriria: em 300 municípios, o potencial de biometano passa, em energia, do diesel que os postos vendem. Versão 1.0.0. [S. l.]: Essencial, 2026. Conjunto de dados. Disponível em: https://aikiesan.github.io/essencial-geo/en/maps/112-diesel-que-o-biometano-cobriria-sp/. Acesso em: 10 nov. 2026.
Cerejo, L. N. (2026). O diesel que o biometano cobriria: em 300 municípios, o potencial de biometano passa, em energia, do diesel que os postos vendem [The diesel biomethane could cover: In 300 municipalities, biomethane potential exceeds, in energy, the diesel sold at the pumps] (Version 1.0.0) [Data set]. Essencial. https://aikiesan.github.io/essencial-geo/en/maps/112-diesel-que-o-biometano-cobriria-sp/
@dataset{cerejo2026_diesel_que_o_biometano_cobriria_sp,
  author    = {Cerejo, Lucas Nakamura},
  title     = {O diesel que o biometano cobriria: Em 300 municípios, o potencial de biometano passa, em energia, do diesel que os postos vendem},
  year      = {2026},
  publisher = {Essencial},
  version   = {1.0.0},
  url       = {https://aikiesan.github.io/essencial-geo/en/maps/112-diesel-que-o-biometano-cobriria-sp/},
  language  = {portuguese},
  note      = {English title: The diesel biomethane could cover: In 300 municipalities, biomethane potential exceeds, in energy, the diesel sold at the pumps. Licence CC BY 4.0}
}
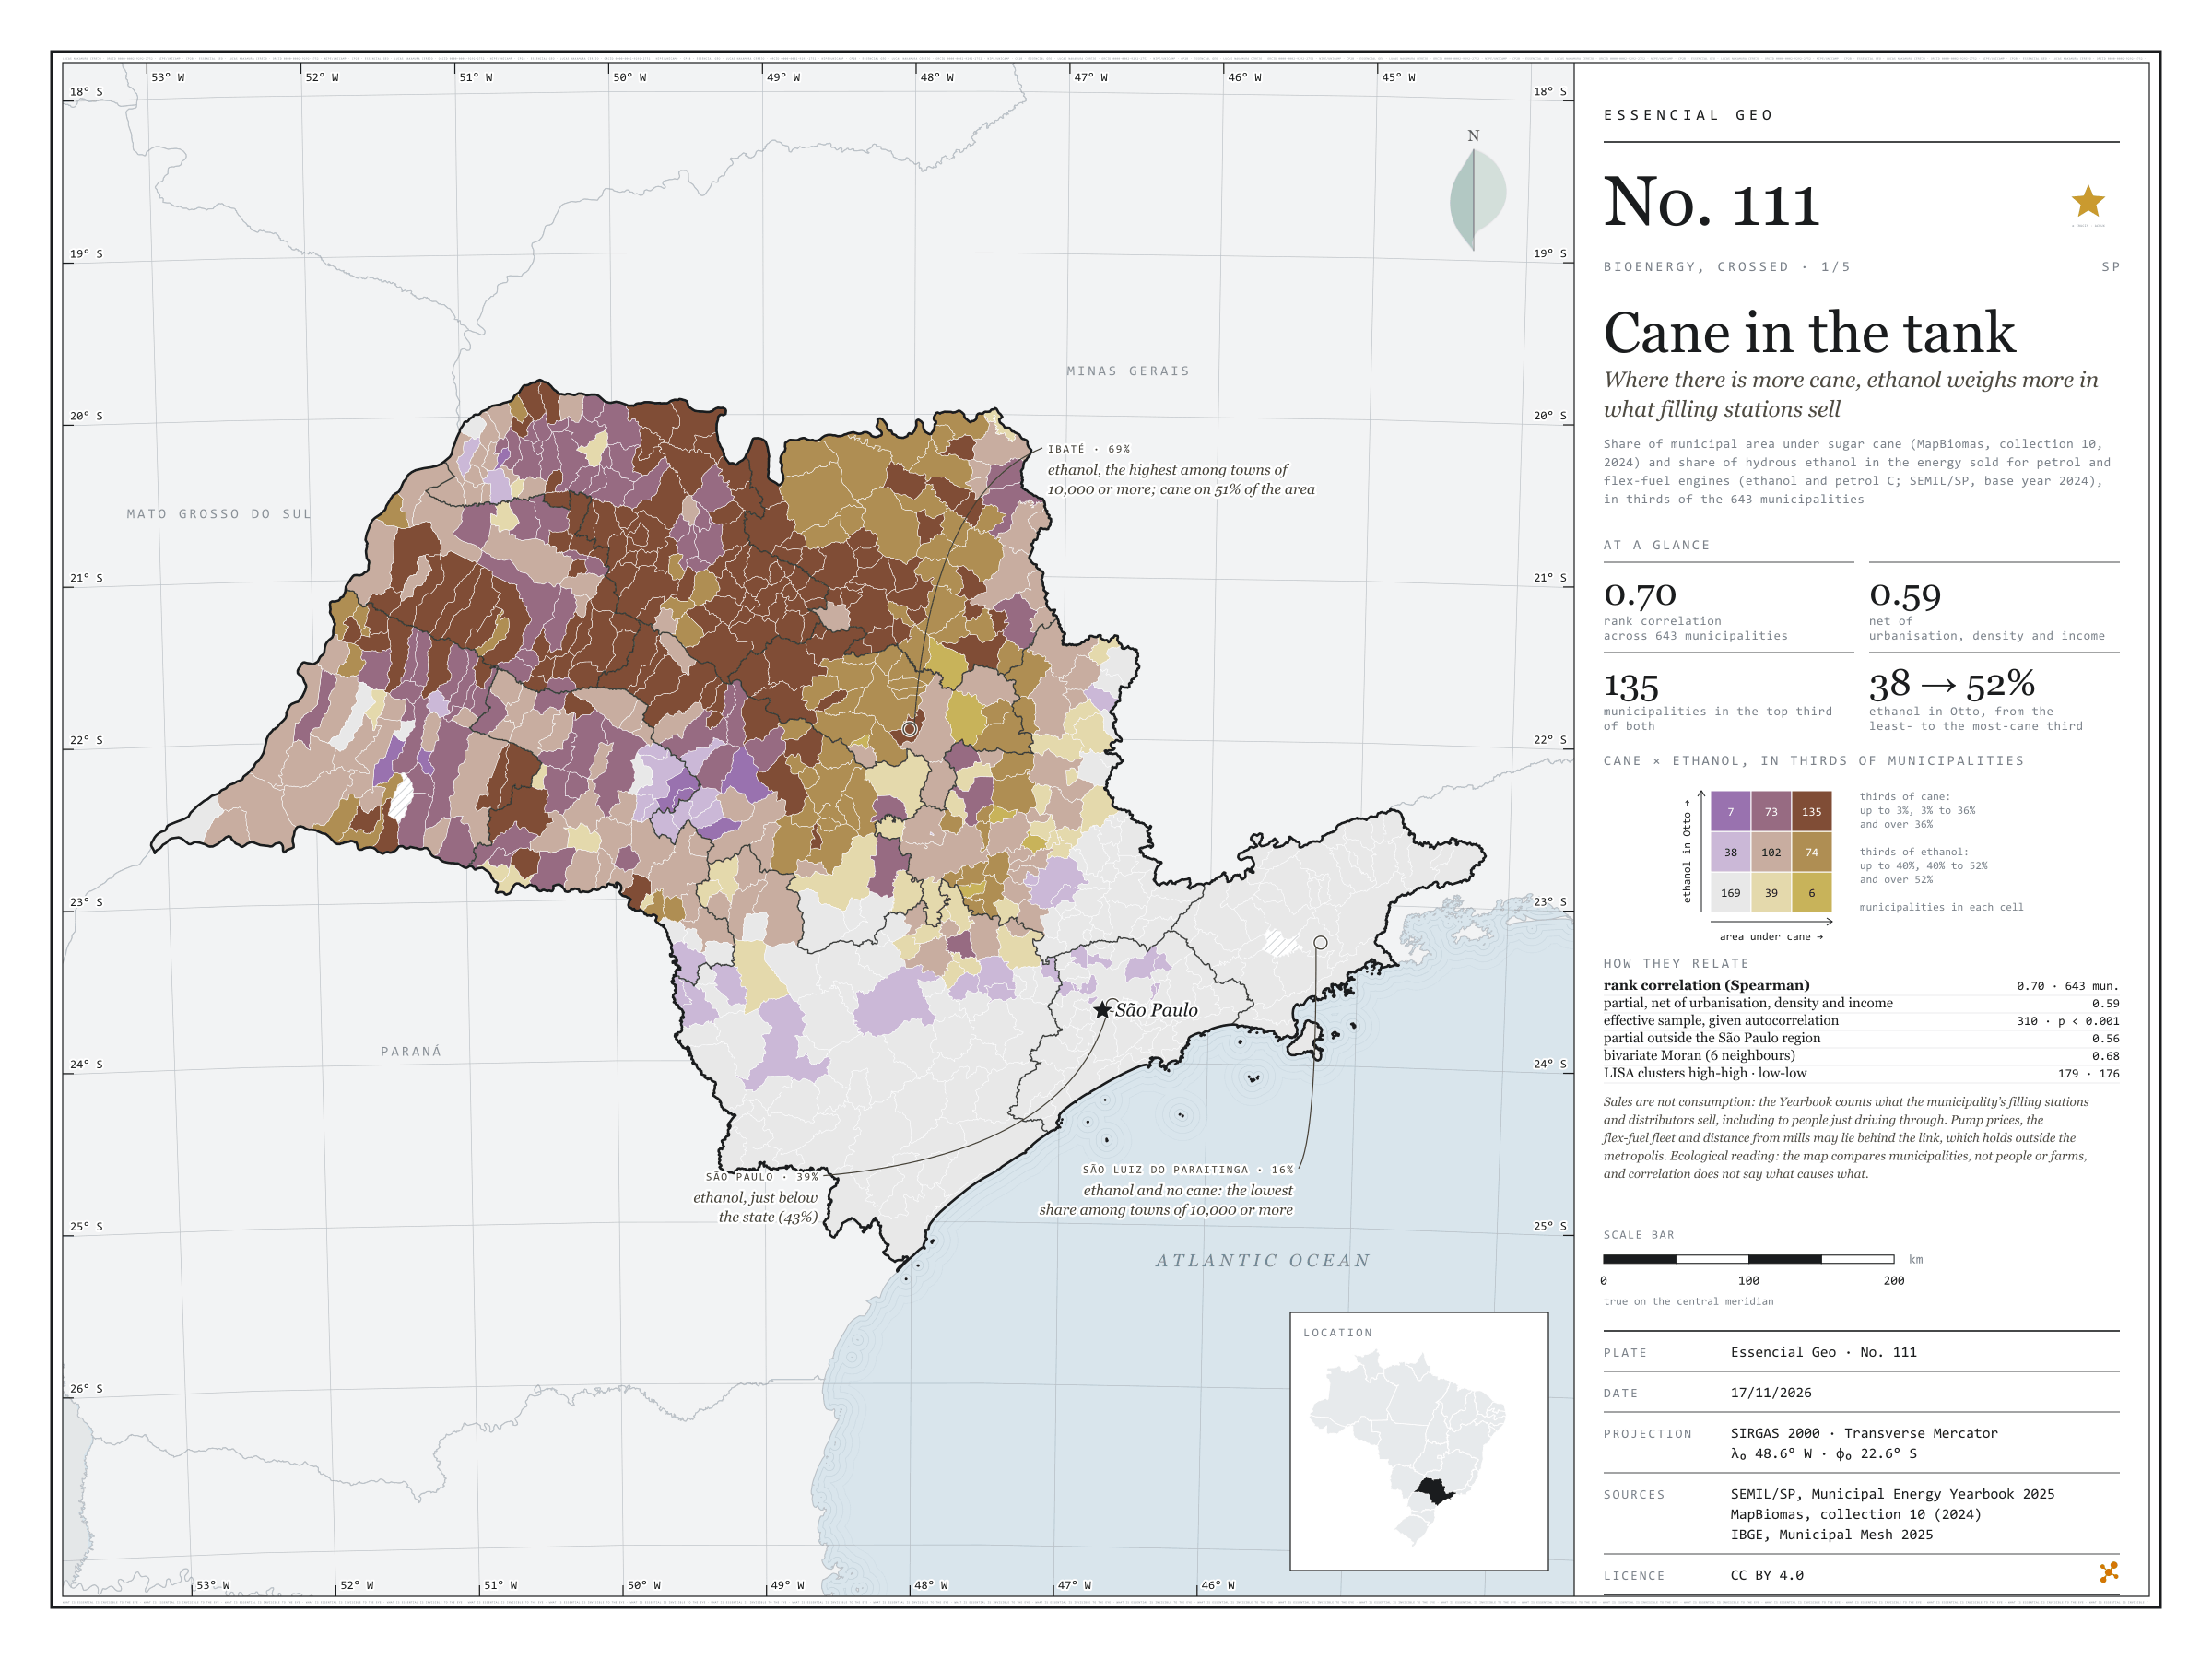
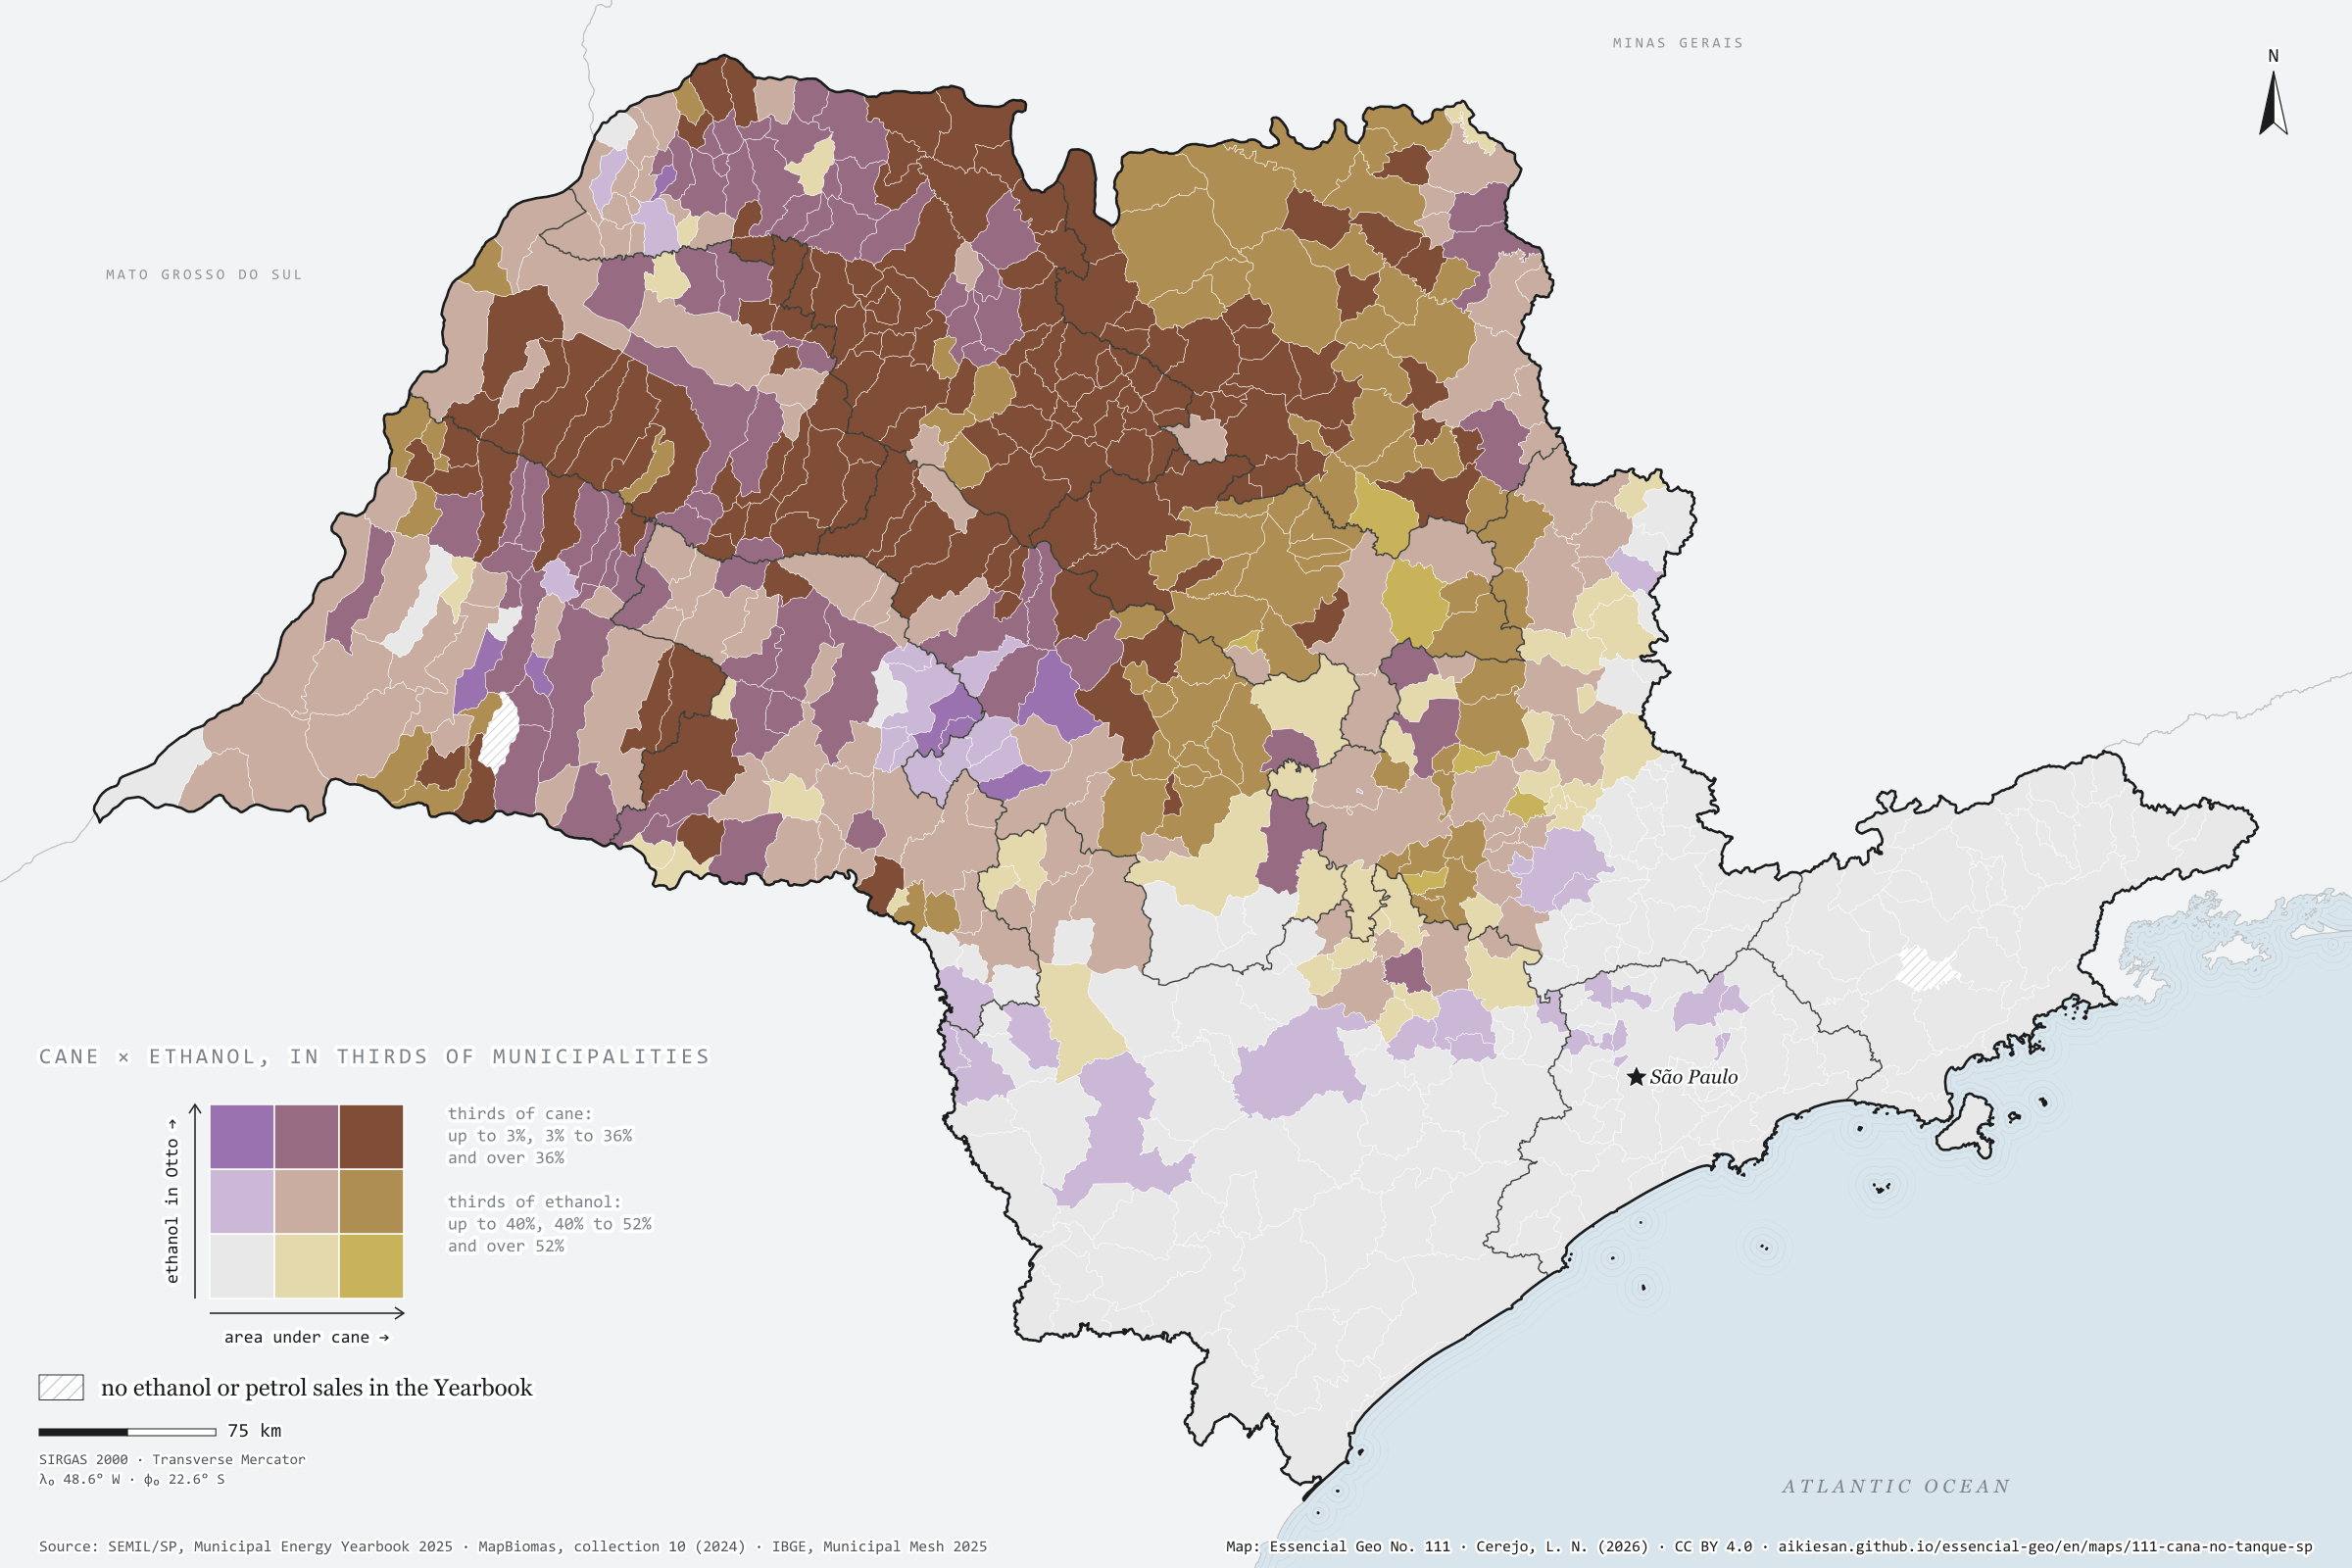
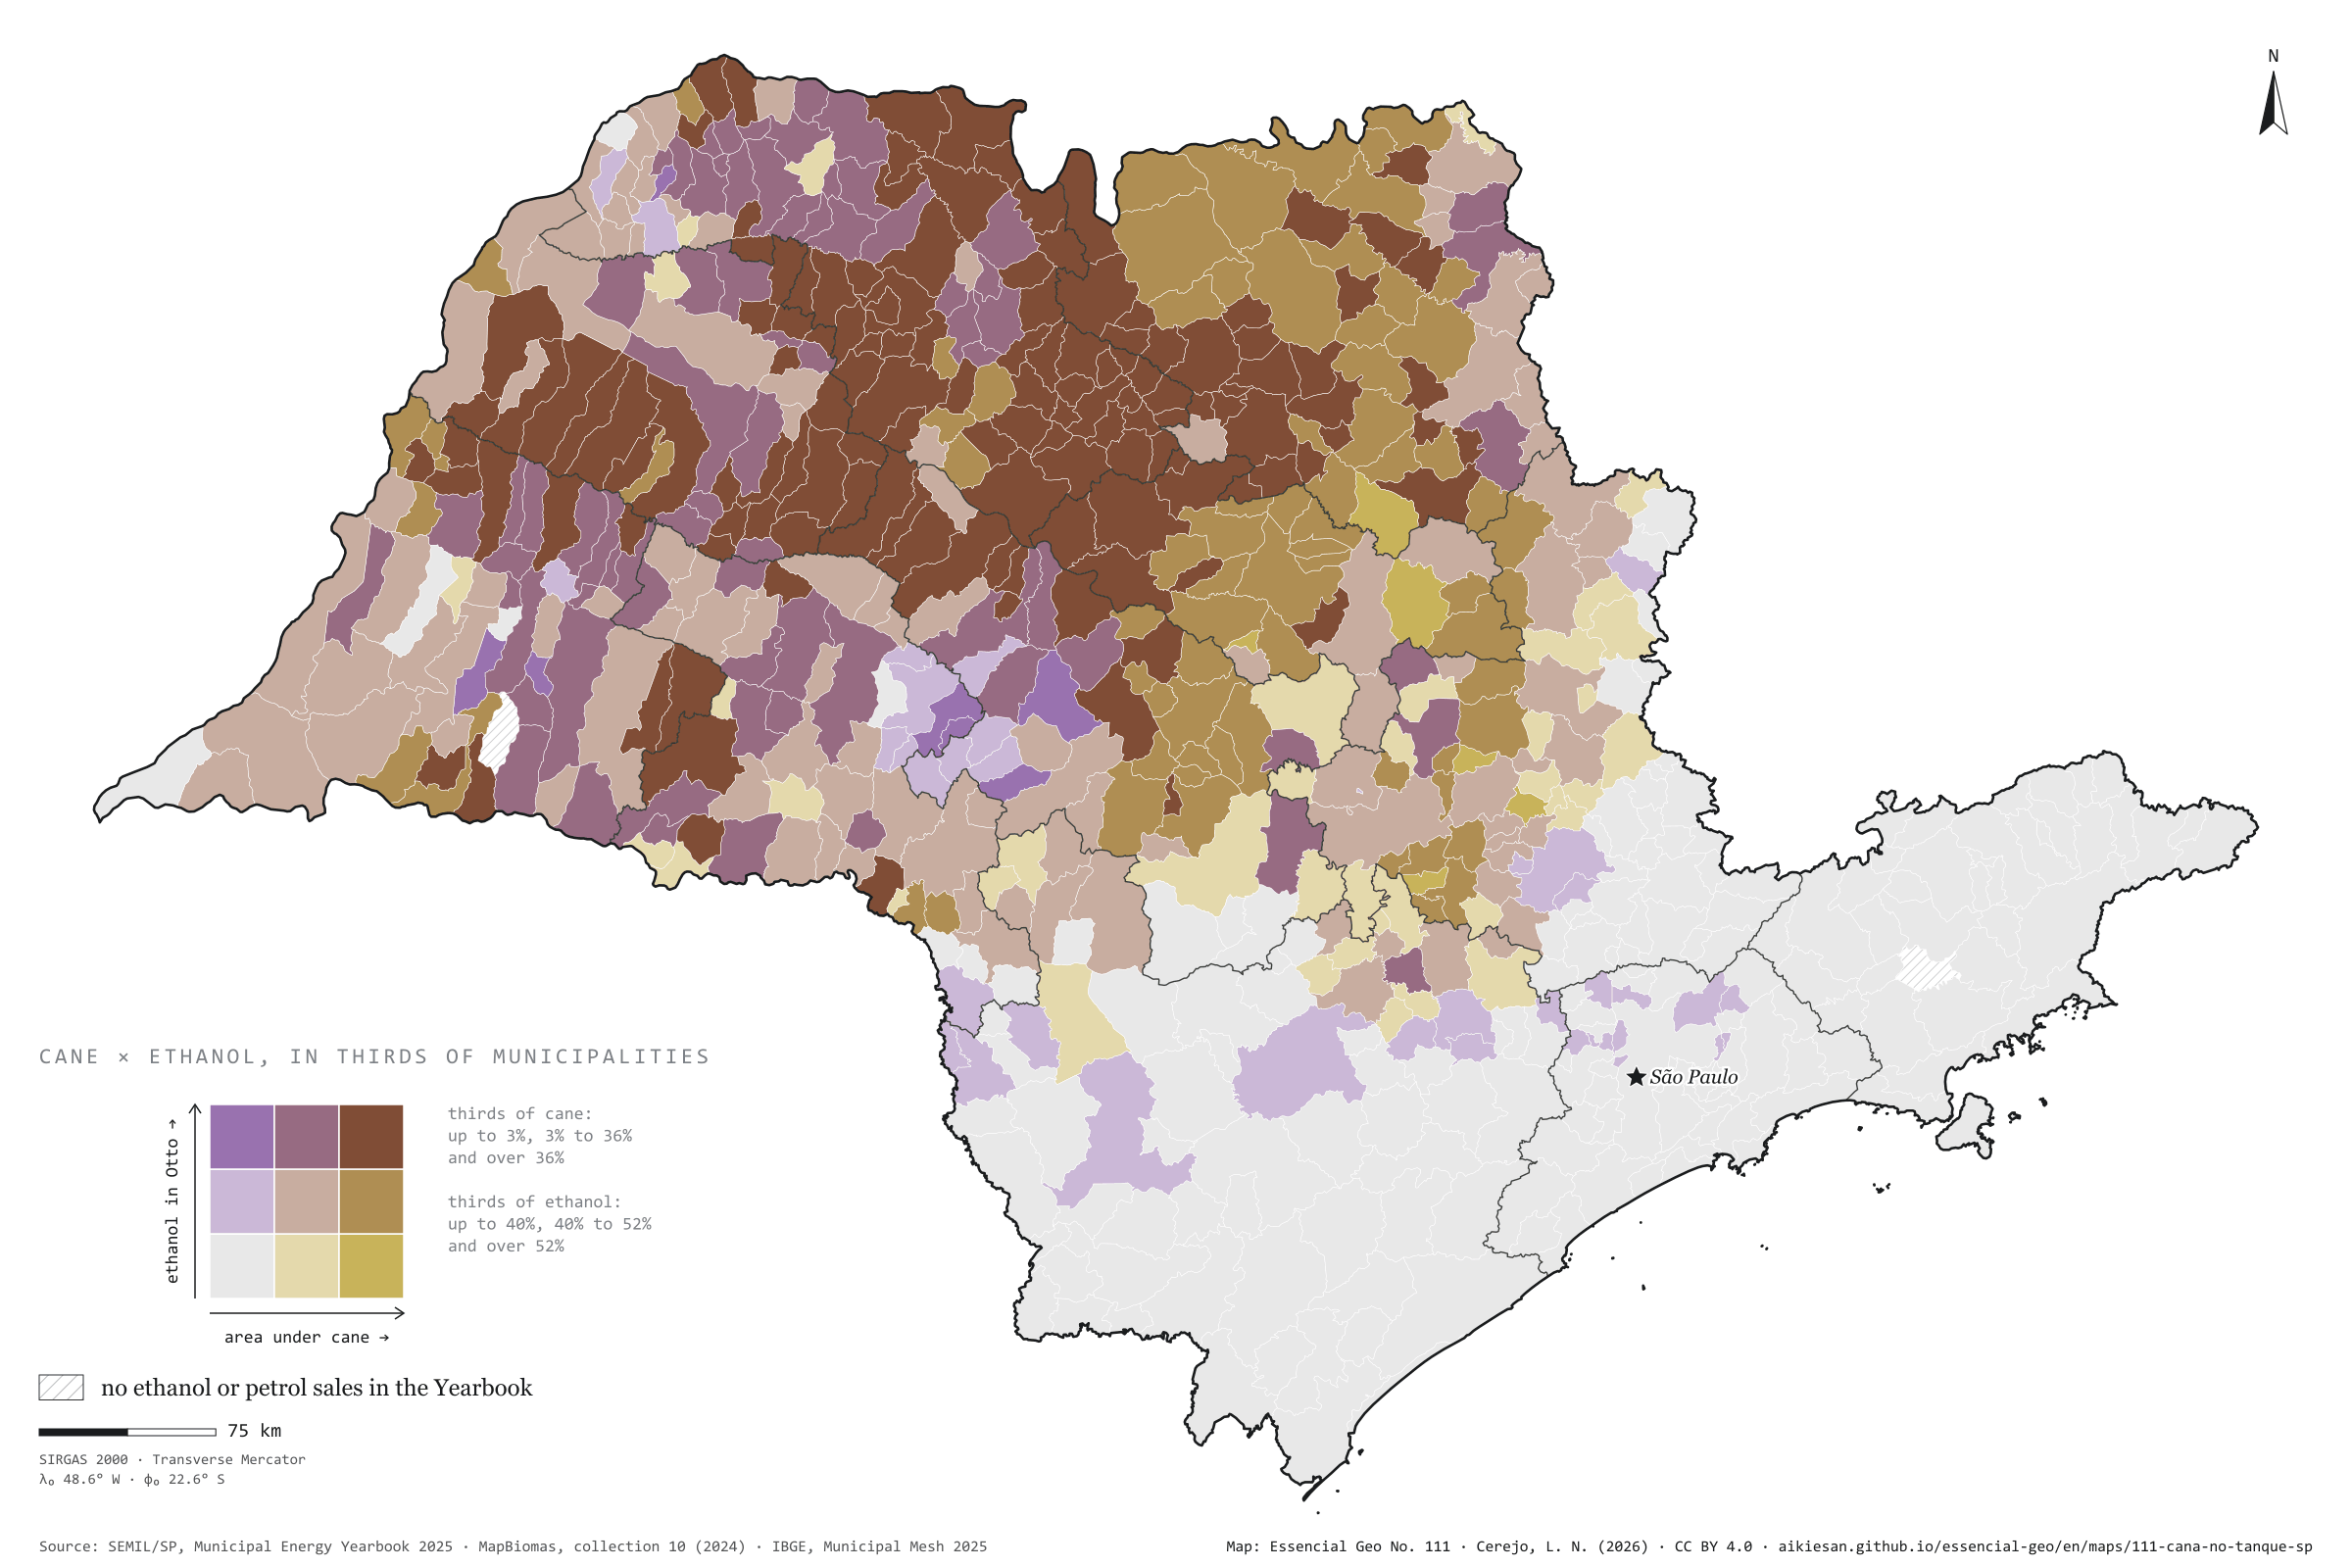
Where there is more cane, ethanol weighs more in what filling stations sell
Fig. 111São Paulo State (SP)EPSG:4674Source: SEMIL/SP, Municipal Energy Yearbook 2025 (base year 2024): sales of hydrous ethanol, petrol C, diesel oil and piped natural gas by municipality, MapBiomas, IBGE
In São Paulo municipalities with more cane, ethanol weighs more in the fuel sold for petrol and flex-fuel engines. In energy, hydrous ethanol was 43% of Otto-cycle sales statewide in 2024; in the third of municipalities with least cane, 38%; in the third with most, 52%. The rank correlation is 0.70 and stays at 0.59 net of urbanisation, density and income. In Ibaté, with cane on 51% of its area, ethanol reaches 69%; in São Luiz do Paraitinga, with no cane, it is 16%. Sales are not consumption, and prices, the fleet and distance from mills may lie behind it. First plate of the collection “Bioenergy, crossed”.
Technical record · downloads · citation
At a glance
Rank correlation between cane and ethanol
0.7
partial 0.59; 643 municipalities
Ethanol in Otto-cycle sales, most-cane third
52%
38% in the least-cane third; 43% statewide
Municipalities in the top third of both
135municipalities
Layers
municipiospolygon645 municipalities with the variables of all five plates, the bivariate classes and the LISA clusters (same GPKG as plates 111 to 115)
gasodutoslineGas transmission pipelines and distribution network (EPE)
regioes_intermediariaspolygon11 intermediate geographic regions
Share of municipal area under sugar cane (MapBiomas, collection 10, 2024) and hydrous ethanol’s share of the energy sold in the Otto cycle (ethanol and petrol C, SEMIL/SP, base year 2024), each in thirds of municipalities, crossed in a 3 × 3 bivariate map; Spearman rank correlations, raw and partial, and bivariate LISA.
The map without a frame, with legend, scale, reference system and credit written on it: ready for papers, lectures and slides. In two versions: with the basemap (neighbours and sea) or only the mapped area, on white.
CEREJO, Lucas Nakamura. Cana no tanque: onde há mais canavial, o etanol pesa mais no que os postos vendem. Versão 1.0.0. [S. l.]: Essencial, 2026. Conjunto de dados. Disponível em: https://aikiesan.github.io/essencial-geo/en/maps/111-cana-no-tanque-sp/. Acesso em: 10 nov. 2026.
Cerejo, L. N. (2026). Cana no tanque: onde há mais canavial, o etanol pesa mais no que os postos vendem [Cane in the tank: Where there is more cane, ethanol weighs more in what filling stations sell] (Version 1.0.0) [Data set]. Essencial. https://aikiesan.github.io/essencial-geo/en/maps/111-cana-no-tanque-sp/
@dataset{cerejo2026_cana_no_tanque_sp,
  author    = {Cerejo, Lucas Nakamura},
  title     = {Cana no tanque: Onde há mais canavial, o etanol pesa mais no que os postos vendem},
  year      = {2026},
  publisher = {Essencial},
  version   = {1.0.0},
  url       = {https://aikiesan.github.io/essencial-geo/en/maps/111-cana-no-tanque-sp/},
  language  = {portuguese},
  note      = {English title: Cane in the tank: Where there is more cane, ethanol weighs more in what filling stations sell. Licence CC BY 4.0}
}
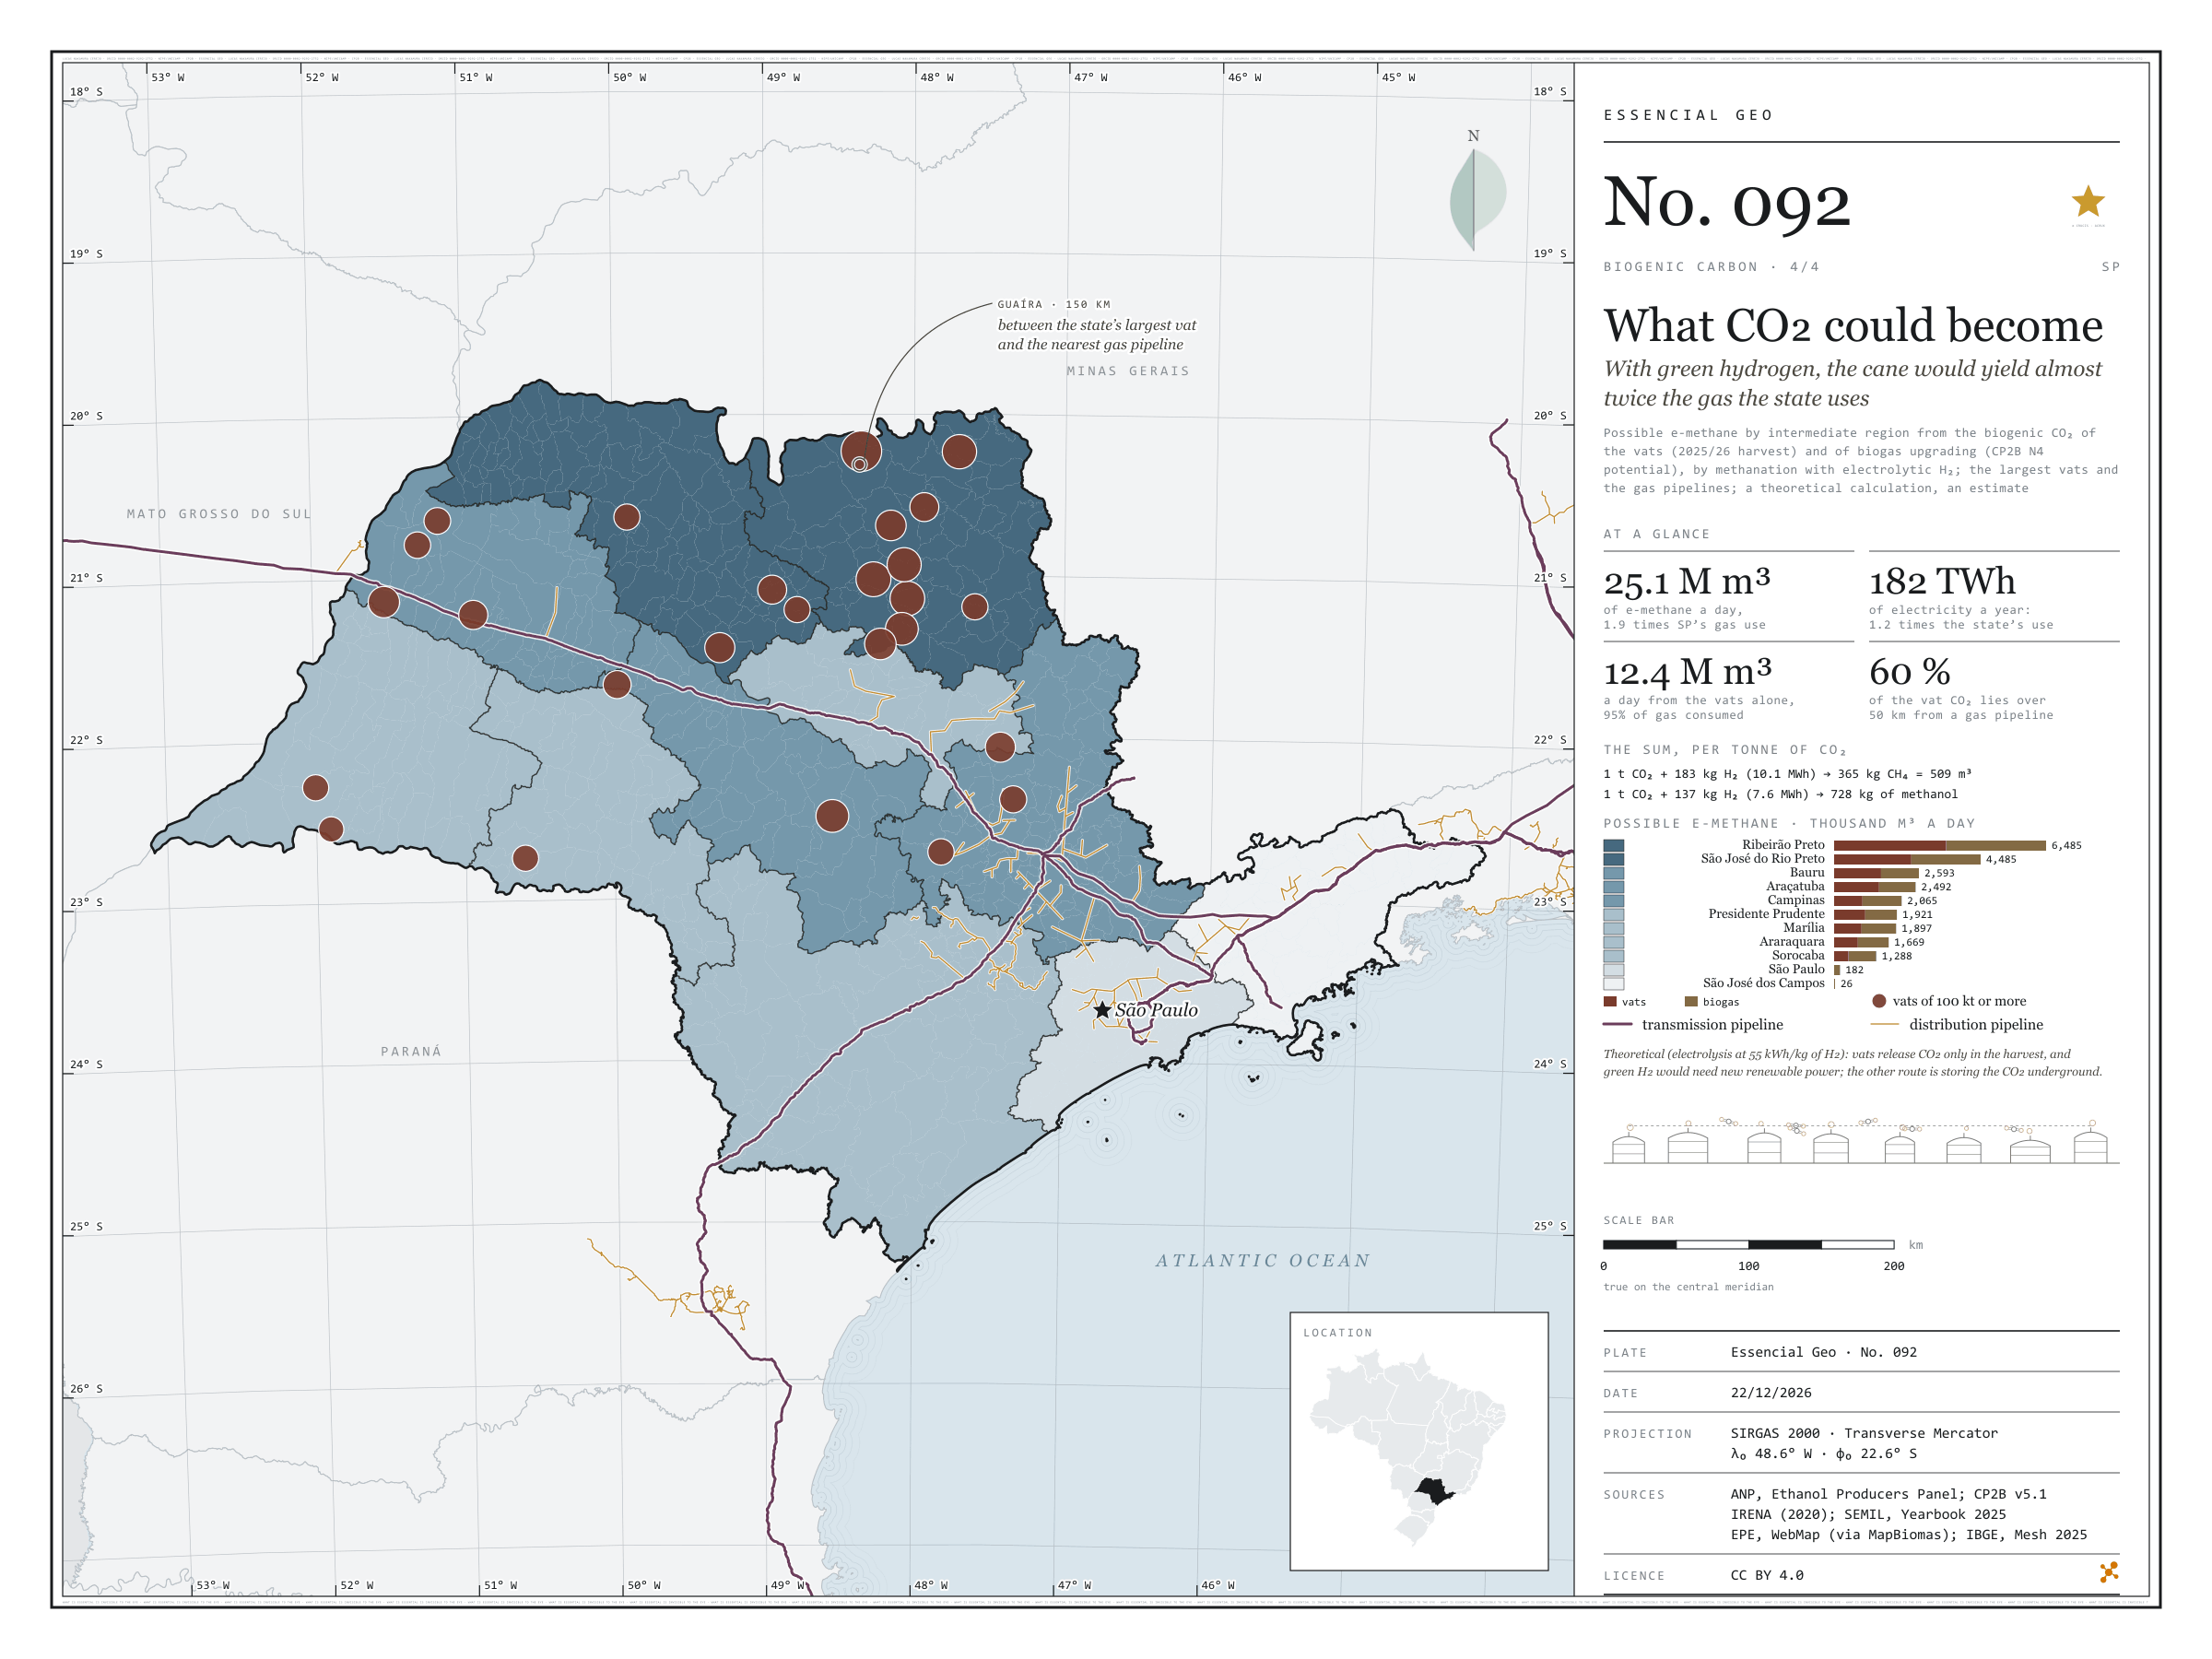
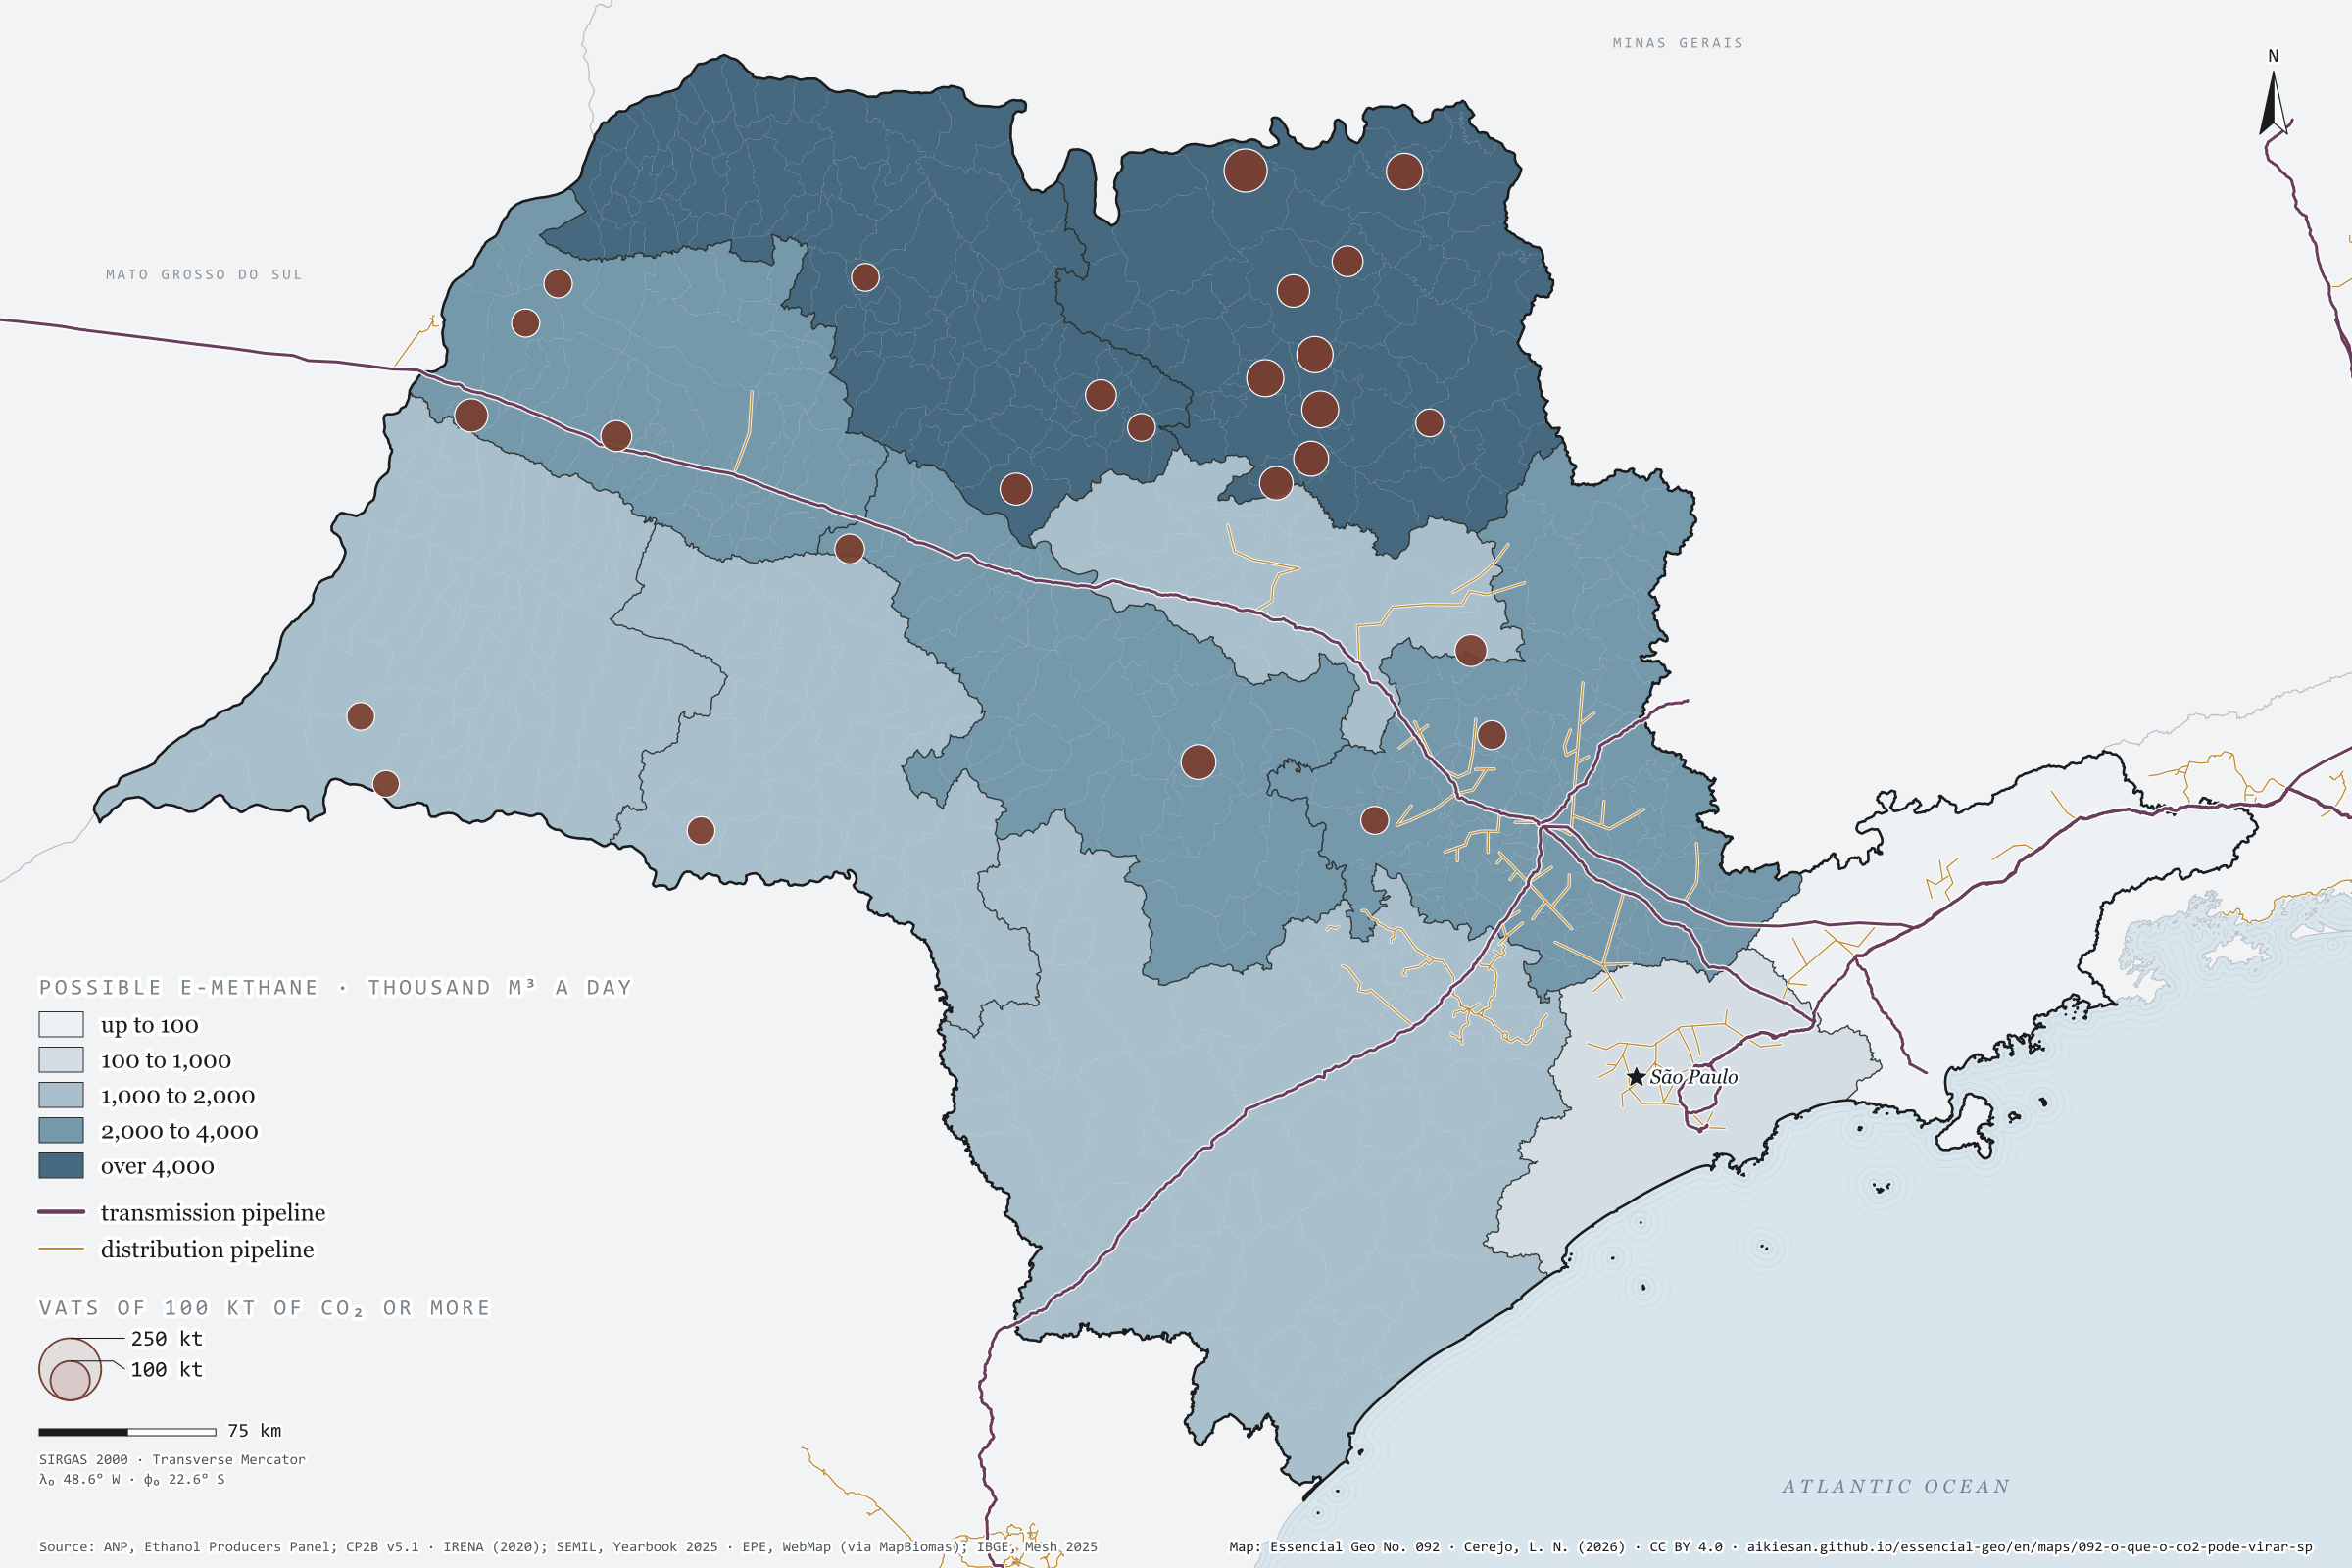
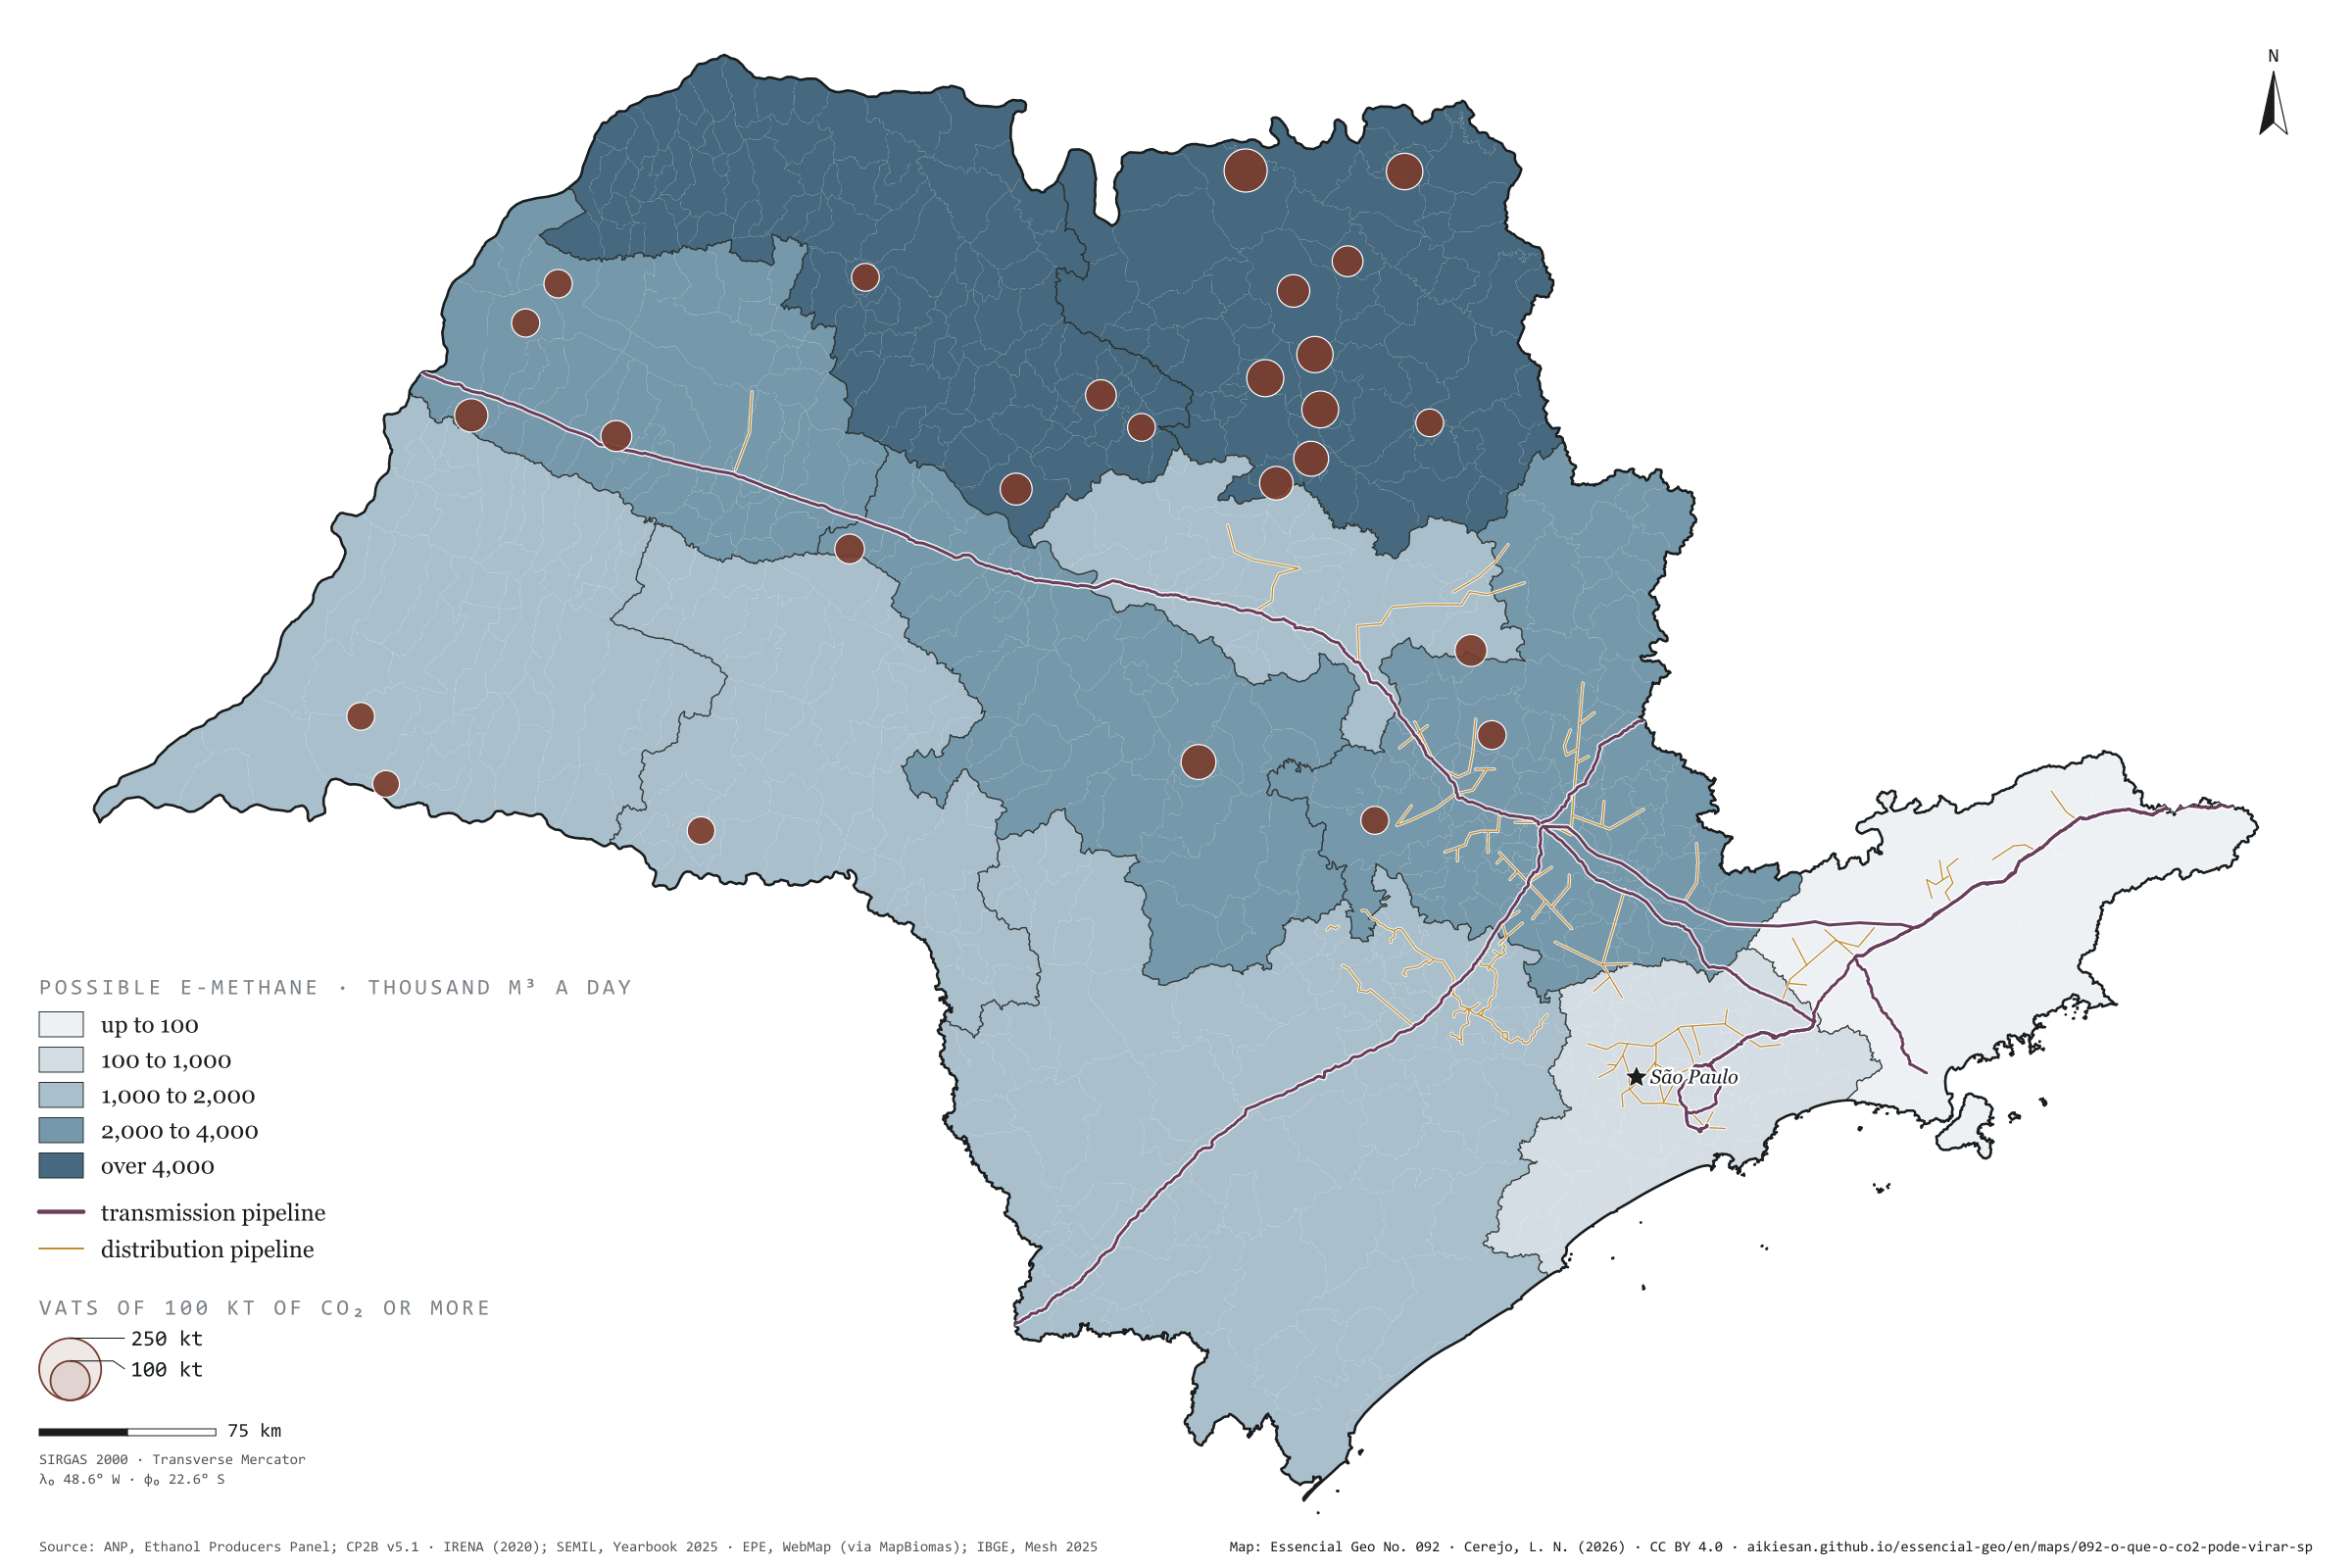
With green hydrogen, the cane would yield almost twice the gas the state uses
Fig. 092São Paulo State (SP)EPSG:4674Source: ANP, CP2B (Unicamp), IRENA (2020), SEMIL (SP), EPE, IBGE
With hydrogen, biogenic CO₂ can become fuel. One tonne of CO₂ plus 183 kg of H₂ gives 365 kg of methane, about 509 m³; with 137 kg of H₂, it gives 728 kg of methanol. Adding the vat CO₂ of the 2025/26 harvest (8.9 million t) to what upgrading the possible biogas would separate (9.1 million), São Paulo would have 18 million t a year: enough for 25 million m³ of e-methane a day, almost twice the natural gas the state used in 2024, or for 13 million t of methanol. But the sum calls for 3.3 million t of green hydrogen and 182 TWh of electricity, 1.2 times the state’s use. The Ribeirão Preto region holds 26% of the total, and 60% of the vat CO₂ lies over 50 km from a gas pipeline. It is a theoretical calculation and an estimate. Last plate of the collection “Biogenic carbon”.
Technical record · downloads · citation
At a glance
Possible e-methane by region (thousand m³ a day)
Ribeirão Preto6,485
São José do Rio Preto4,485
Bauru2,593
Araçatuba2,492
Campinas2,065
Presidente Prudente1,921
Marília1,897
Araraquara1,669
Sorocaba1,288
São Paulo182
São José dos Campos26
Vat CO₂ by distance to the gas pipeline (t a harvest)
up to 10 km13.5%
10 to 25 km12.4%
25 to 50 km13.9%
over 50 km60.2%
Layers
regioes_carbonopolygon11 intermediate regions: biogenic CO₂, H₂, electricity, possible e-methane and e-methanol, and the largest source
usinas_etanolpoint145 ethanol mills, with estimated CO₂ (plate 089)
gasodutos_transportelineExisting transmission pipelines (same database as plate 057)
gasodutos_distribuicaolinePiped gas distribution networks
Biogenic CO₂ by intermediate region (vats in the 2025/26 harvest, plate 089, plus upgrading of the possible biogas, plate 090), converted into e-methane (CO₂ + 4 H₂ → CH₄ + 2 H₂O) and e-methanol (CO₂ + 3 H₂ → CH₃OH + H₂O) at full conversion, with the hydrogen turned into electricity at 55 kWh per kg (electrolysis); distance from each municipality to the nearest gas pipeline.
The map without a frame, with legend, scale, reference system and credit written on it: ready for papers, lectures and slides. In two versions: with the basemap (neighbours and sea) or only the mapped area, on white.
CEREJO, Lucas Nakamura. O que o CO₂ poderia virar: com hidrogênio verde, a cana renderia quase duas vezes o gás consumido no estado. Versão 1.0.0. [S. l.]: Essencial, 2026. Conjunto de dados. Disponível em: https://aikiesan.github.io/essencial-geo/en/maps/092-o-que-o-co2-pode-virar-sp/. Acesso em: 10 nov. 2026.
Cerejo, L. N. (2026). O que o CO₂ poderia virar: com hidrogênio verde, a cana renderia quase duas vezes o gás consumido no estado [What CO₂ could become: With green hydrogen, the cane would yield almost twice the gas the state uses] (Version 1.0.0) [Data set]. Essencial. https://aikiesan.github.io/essencial-geo/en/maps/092-o-que-o-co2-pode-virar-sp/
@dataset{cerejo2026_o_que_o_co2_pode_virar_sp,
  author    = {Cerejo, Lucas Nakamura},
  title     = {O que o CO₂ poderia virar: Com hidrogênio verde, a cana renderia quase duas vezes o gás consumido no estado},
  year      = {2026},
  publisher = {Essencial},
  version   = {1.0.0},
  url       = {https://aikiesan.github.io/essencial-geo/en/maps/092-o-que-o-co2-pode-virar-sp/},
  language  = {portuguese},
  note      = {English title: What CO₂ could become: With green hydrogen, the cane would yield almost twice the gas the state uses. Licence CC BY 4.0}
}
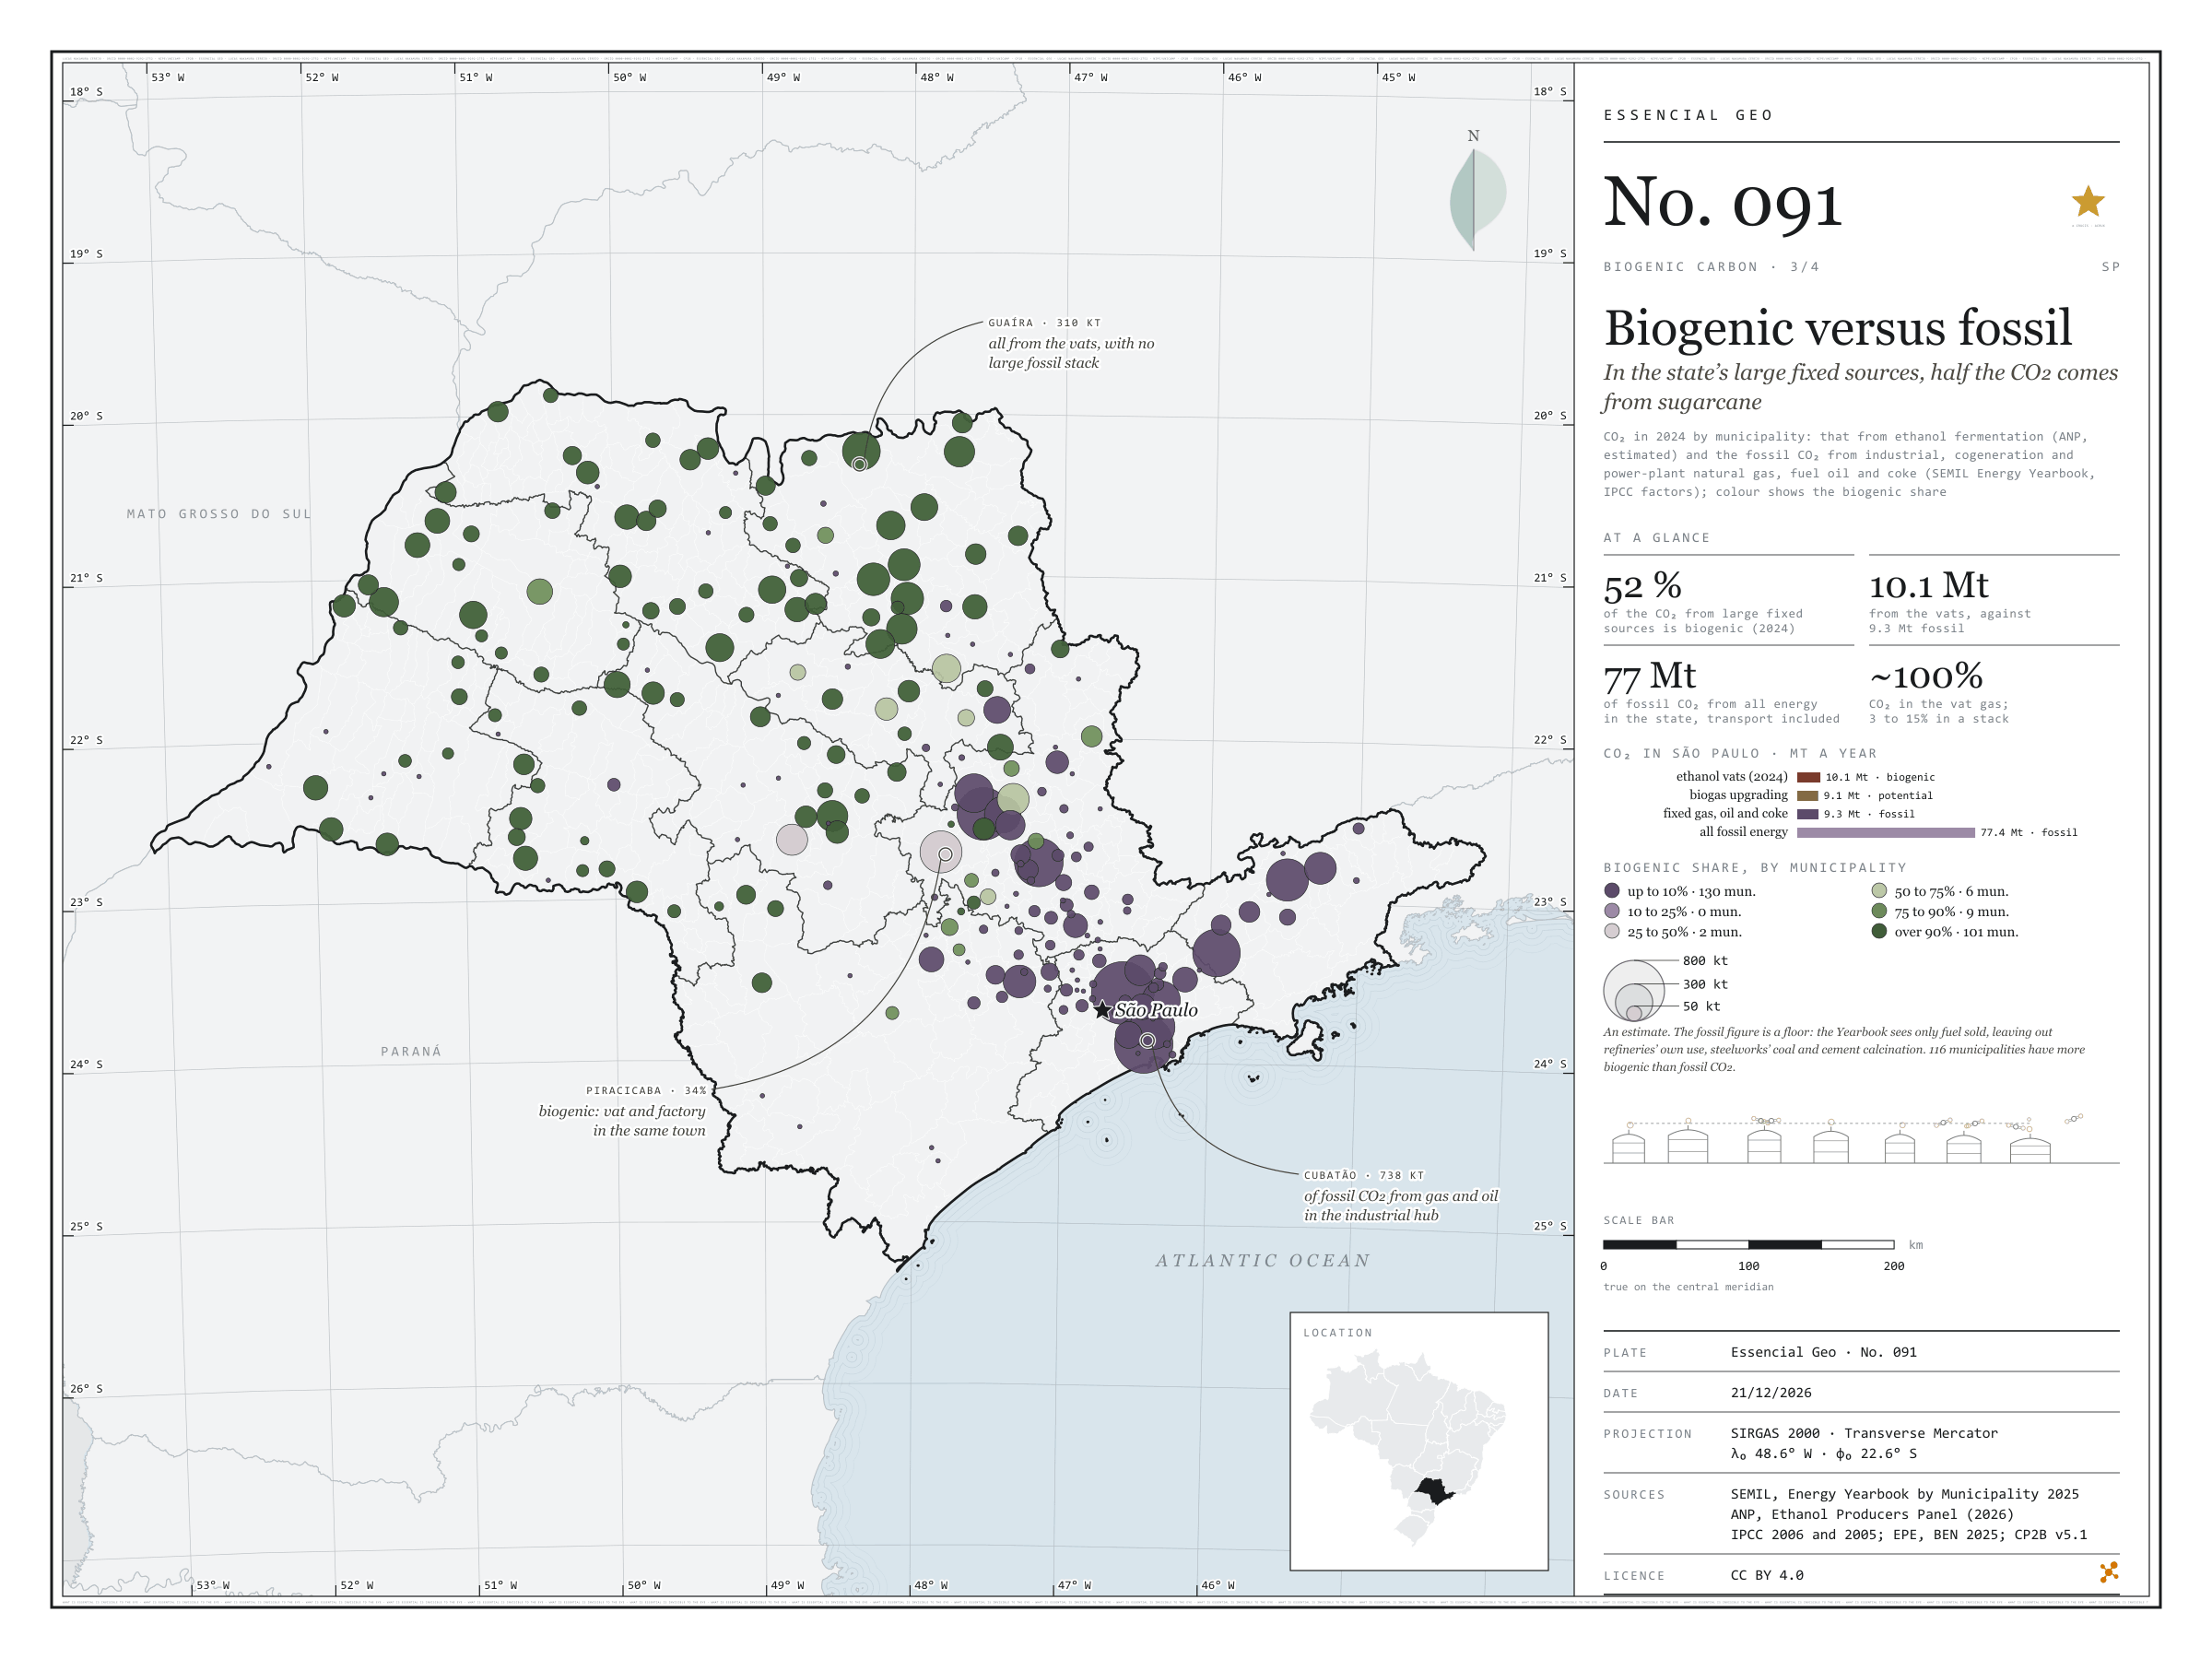
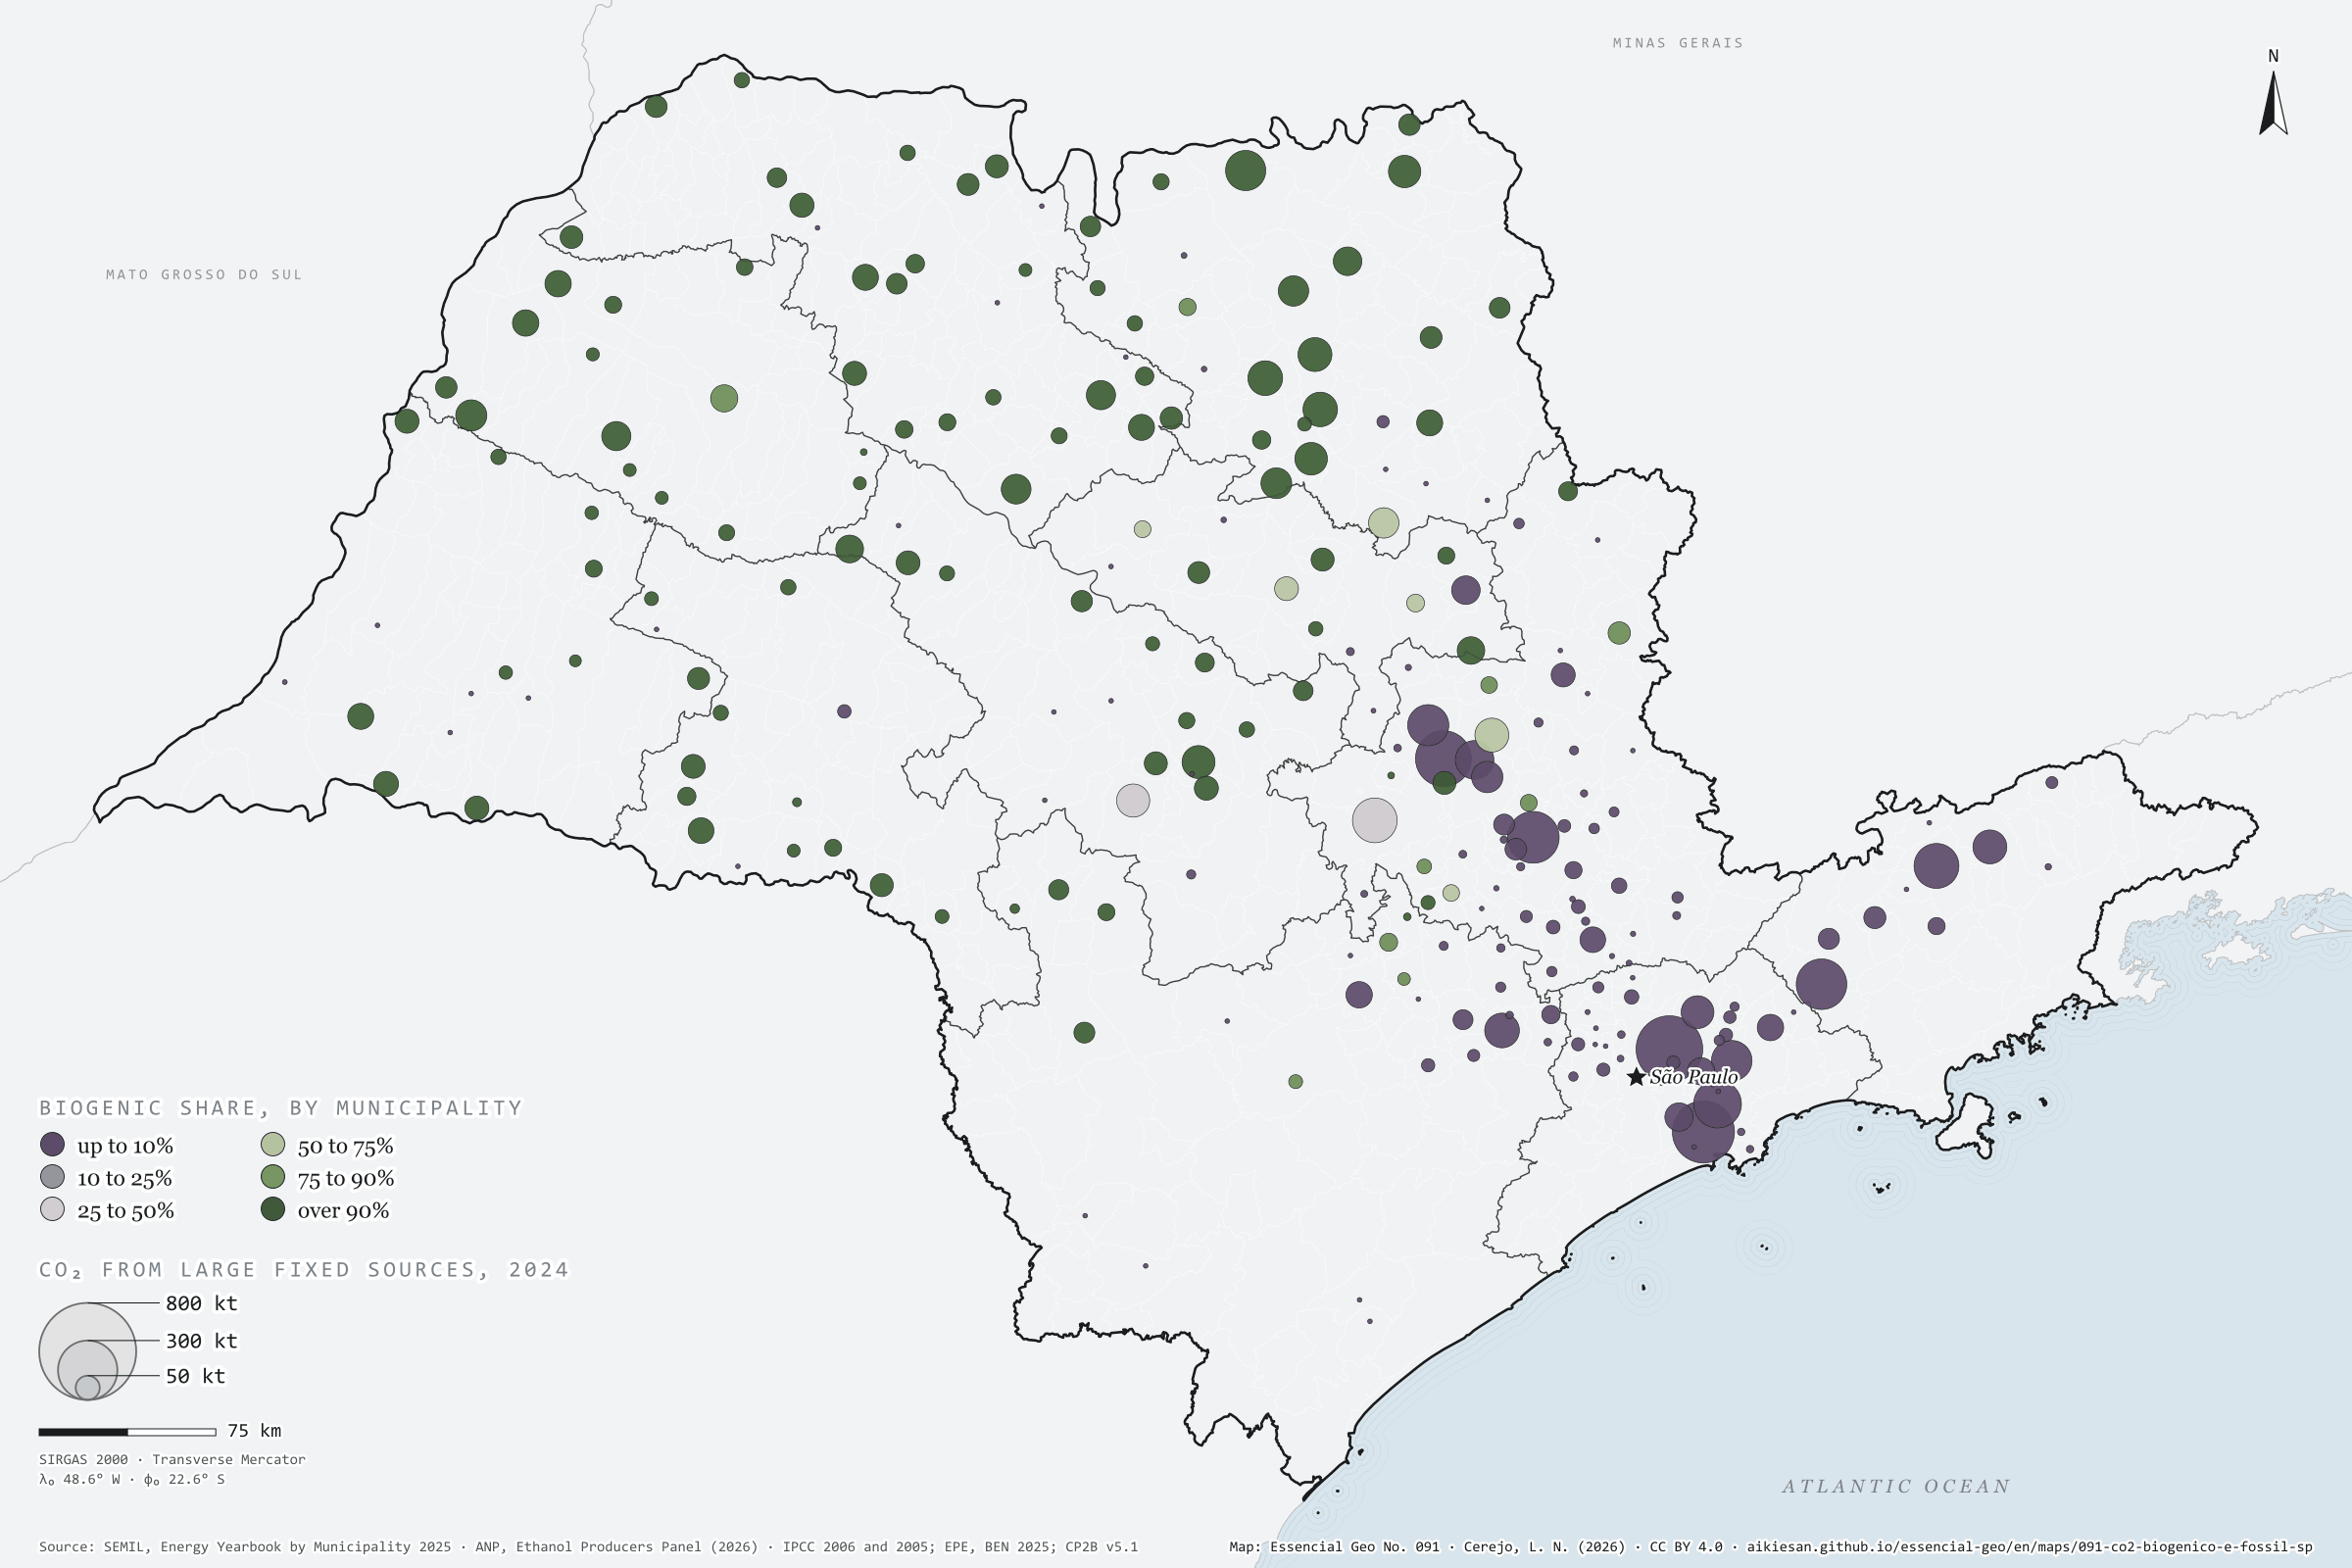
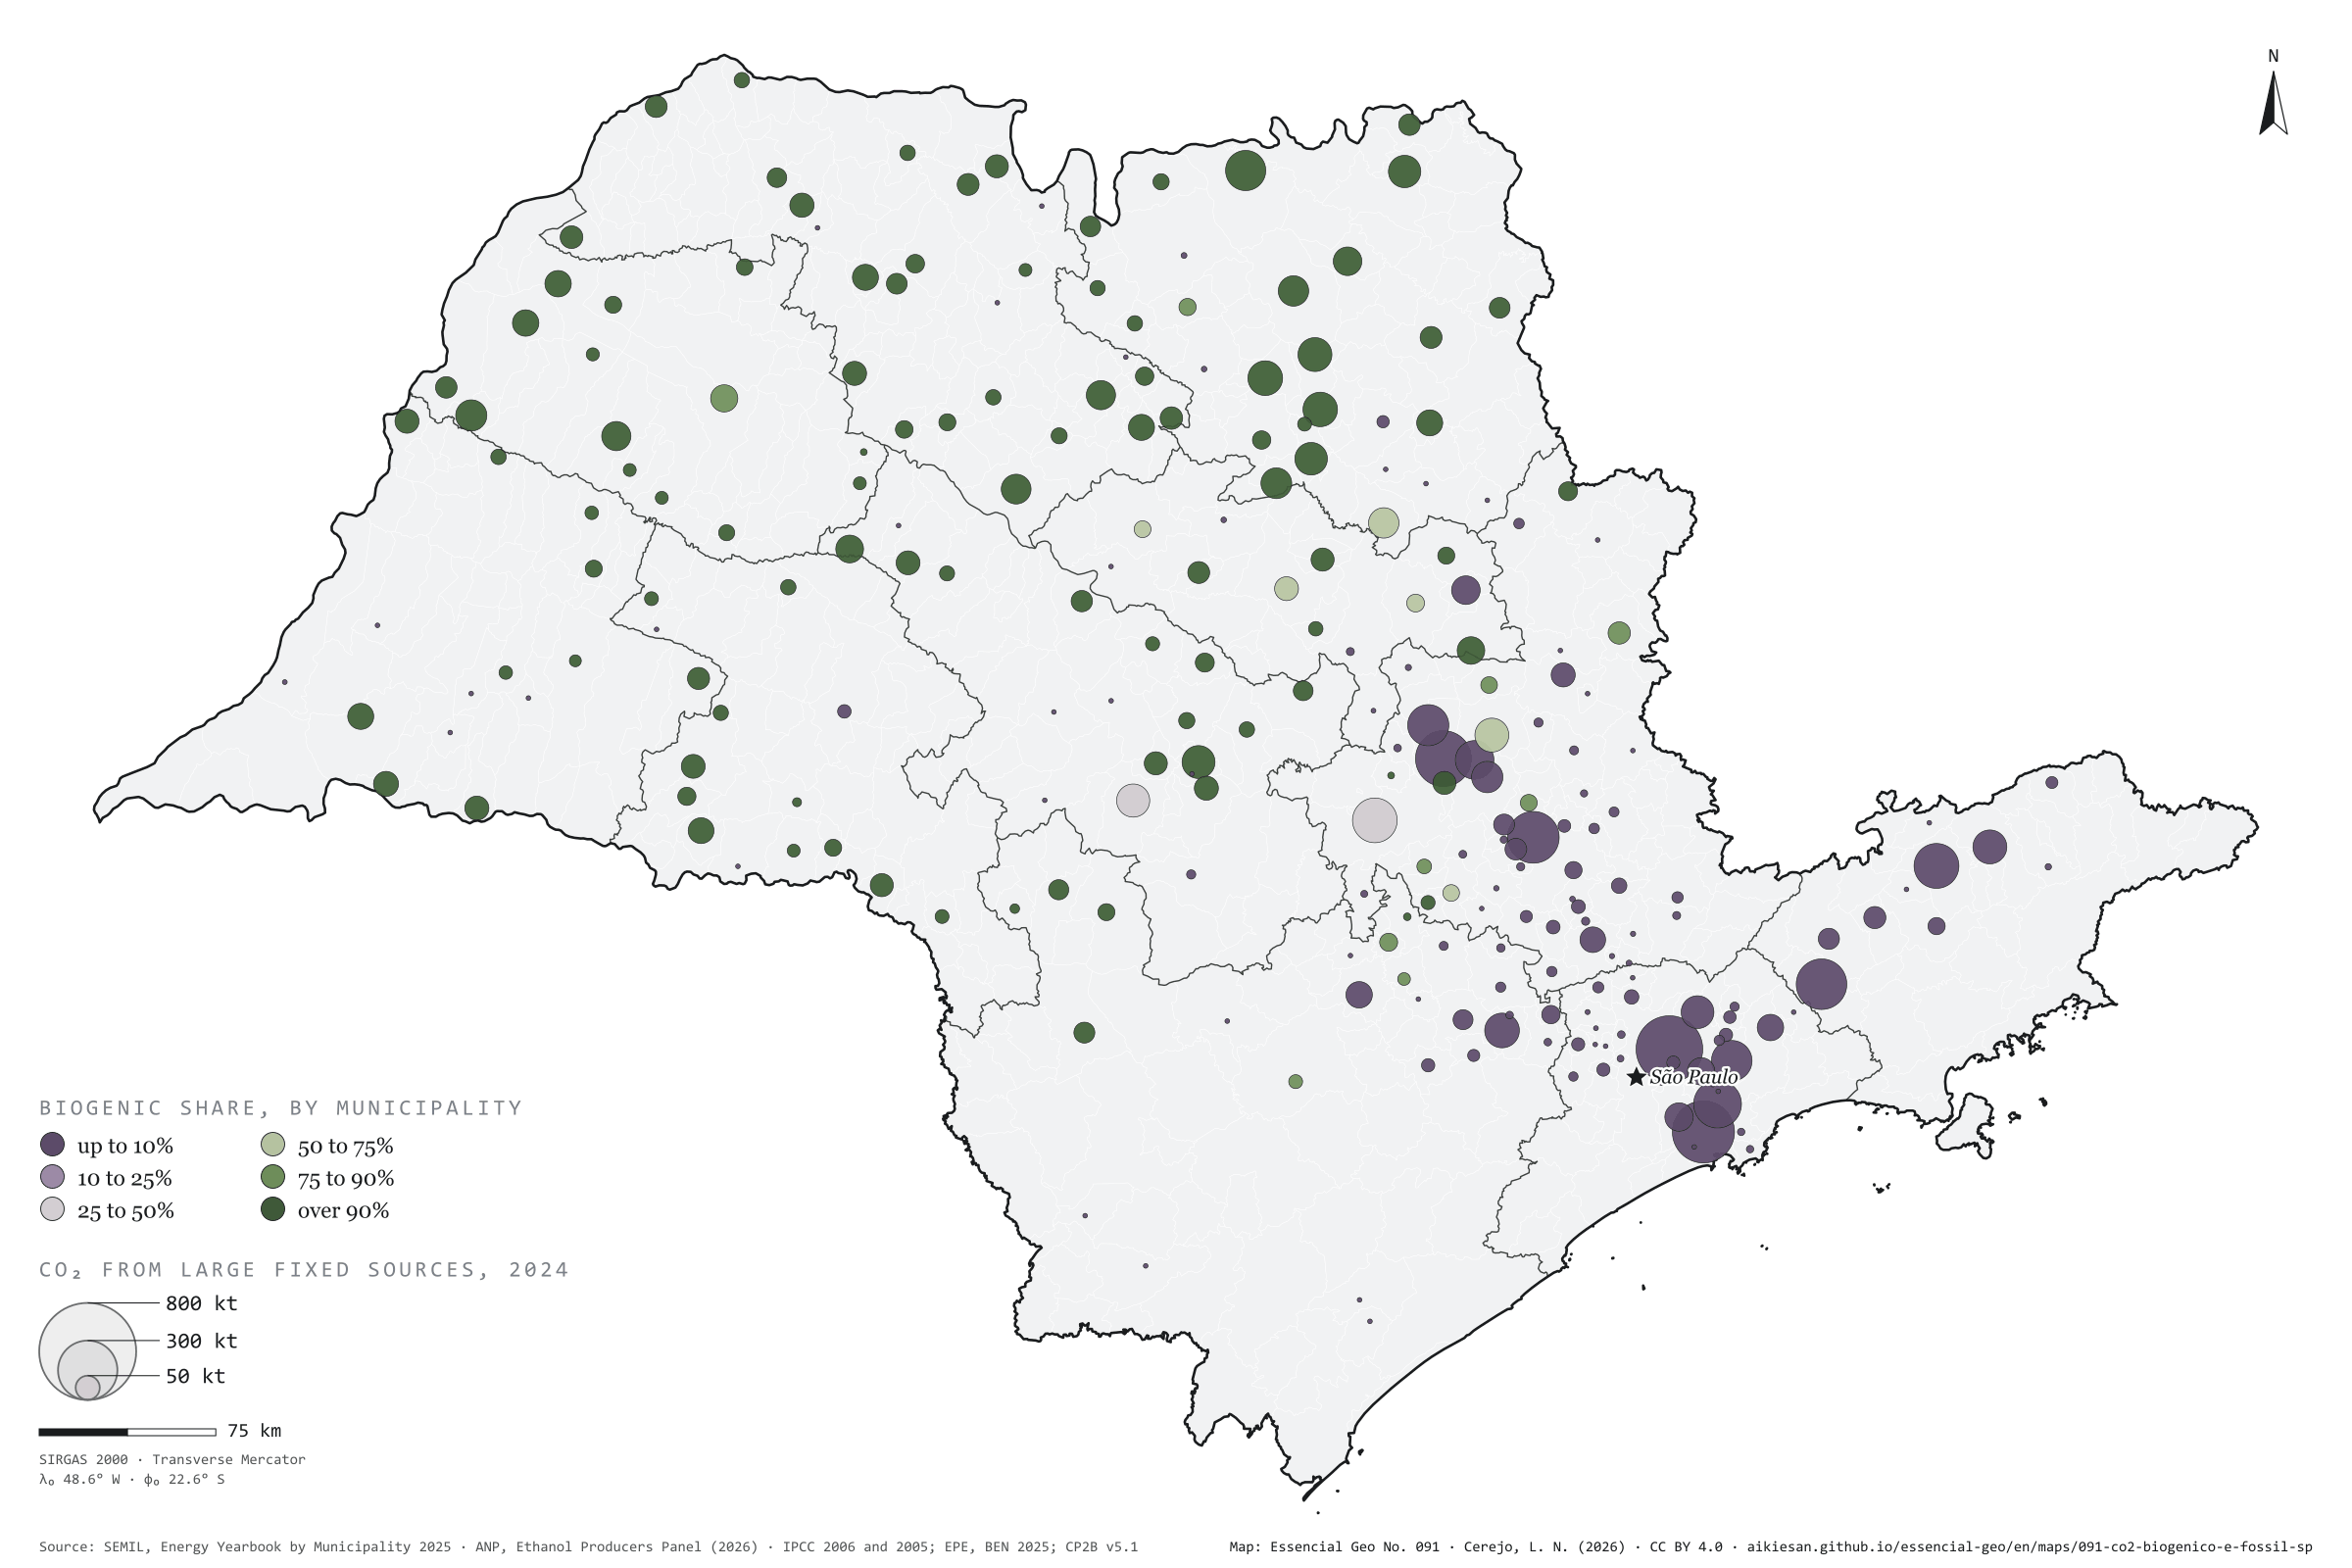
In the state’s large fixed sources, half the CO₂ comes from sugarcane
Fig. 091São Paulo State (SP)EPSG:4674Source: SEMIL (SP), ANP, IPCC (2006), IPCC (2005), EPE, IBGE
The gas leaving an ethanol vat is almost 100% CO₂; a combustion stack carries 3% to 15%. That is why mills are among the easiest sources to capture. In 2024, São Paulo’s vats released about 10.1 million t of biogenic CO₂. Natural gas burnt by industry, cogeneration and power plants, fuel oil and coke added up to 9.3 million t of fossil CO₂, on the SEMIL Energy Yearbook and IPCC factors. In these large fixed sources, 52% of the CO₂ comes from sugarcane. The map splits: across the cane-growing interior, 116 municipalities have more biogenic than fossil CO₂; fossil CO₂ concentrates in the capital (850,000 t), Cubatão (738,000), Santa Gertrudes, Paulínia and Jacareí. In Piracicaba the two mix: 34% is biogenic. The fossil figure here is a floor. Third plate of the collection “Biogenic carbon”.
Technical record · downloads · citation
At a glance
CO₂ from large fixed sources in 2024 (t)
ethanol vats (biogenic)52.1%
gas, oil and coke (fossil)47.9%
Largest fixed fossil sources (t of CO₂ in 2024)
São Paulo849,580
Cubatão738,384
Santa Gertrudes597,415
Paulínia513,832
Jacareí489,794
Layers
municipiospolygon645 municipalities: fossil CO₂ (gas, oil, coke and all energy), vat CO₂ in 2024 and biogenic share (same GPKG as plate 089)
Fossil CO₂ in 2024 by municipality: industrial, cogeneration and power-generation natural gas use and fuel oil and petroleum coke use (SEMIL Energy Yearbook), times the BEN net calorific value and the IPCC 2006 emission factor; biogenic CO₂ in 2024: ethanol fermentation estimated as in plate 089; biogenic share = biogenic ÷ (biogenic + fossil).
The map without a frame, with legend, scale, reference system and credit written on it: ready for papers, lectures and slides. In two versions: with the basemap (neighbours and sea) or only the mapped area, on white.
CEREJO, Lucas Nakamura. Biogênico contra fóssil: nas grandes fontes fixas do estado, metade do CO₂ vem da cana. Versão 1.0.0. [S. l.]: Essencial, 2026. Conjunto de dados. Disponível em: https://aikiesan.github.io/essencial-geo/en/maps/091-co2-biogenico-e-fossil-sp/. Acesso em: 10 nov. 2026.
Cerejo, L. N. (2026). Biogênico contra fóssil: nas grandes fontes fixas do estado, metade do CO₂ vem da cana [Biogenic versus fossil: In the state’s large fixed sources, half the CO₂ comes from sugarcane] (Version 1.0.0) [Data set]. Essencial. https://aikiesan.github.io/essencial-geo/en/maps/091-co2-biogenico-e-fossil-sp/
@dataset{cerejo2026_co2_biogenico_e_fossil_sp,
  author    = {Cerejo, Lucas Nakamura},
  title     = {Biogênico contra fóssil: Nas grandes fontes fixas do estado, metade do CO₂ vem da cana},
  year      = {2026},
  publisher = {Essencial},
  version   = {1.0.0},
  url       = {https://aikiesan.github.io/essencial-geo/en/maps/091-co2-biogenico-e-fossil-sp/},
  language  = {portuguese},
  note      = {English title: Biogenic versus fossil: In the state’s large fixed sources, half the CO₂ comes from sugarcane. Licence CC BY 4.0}
}
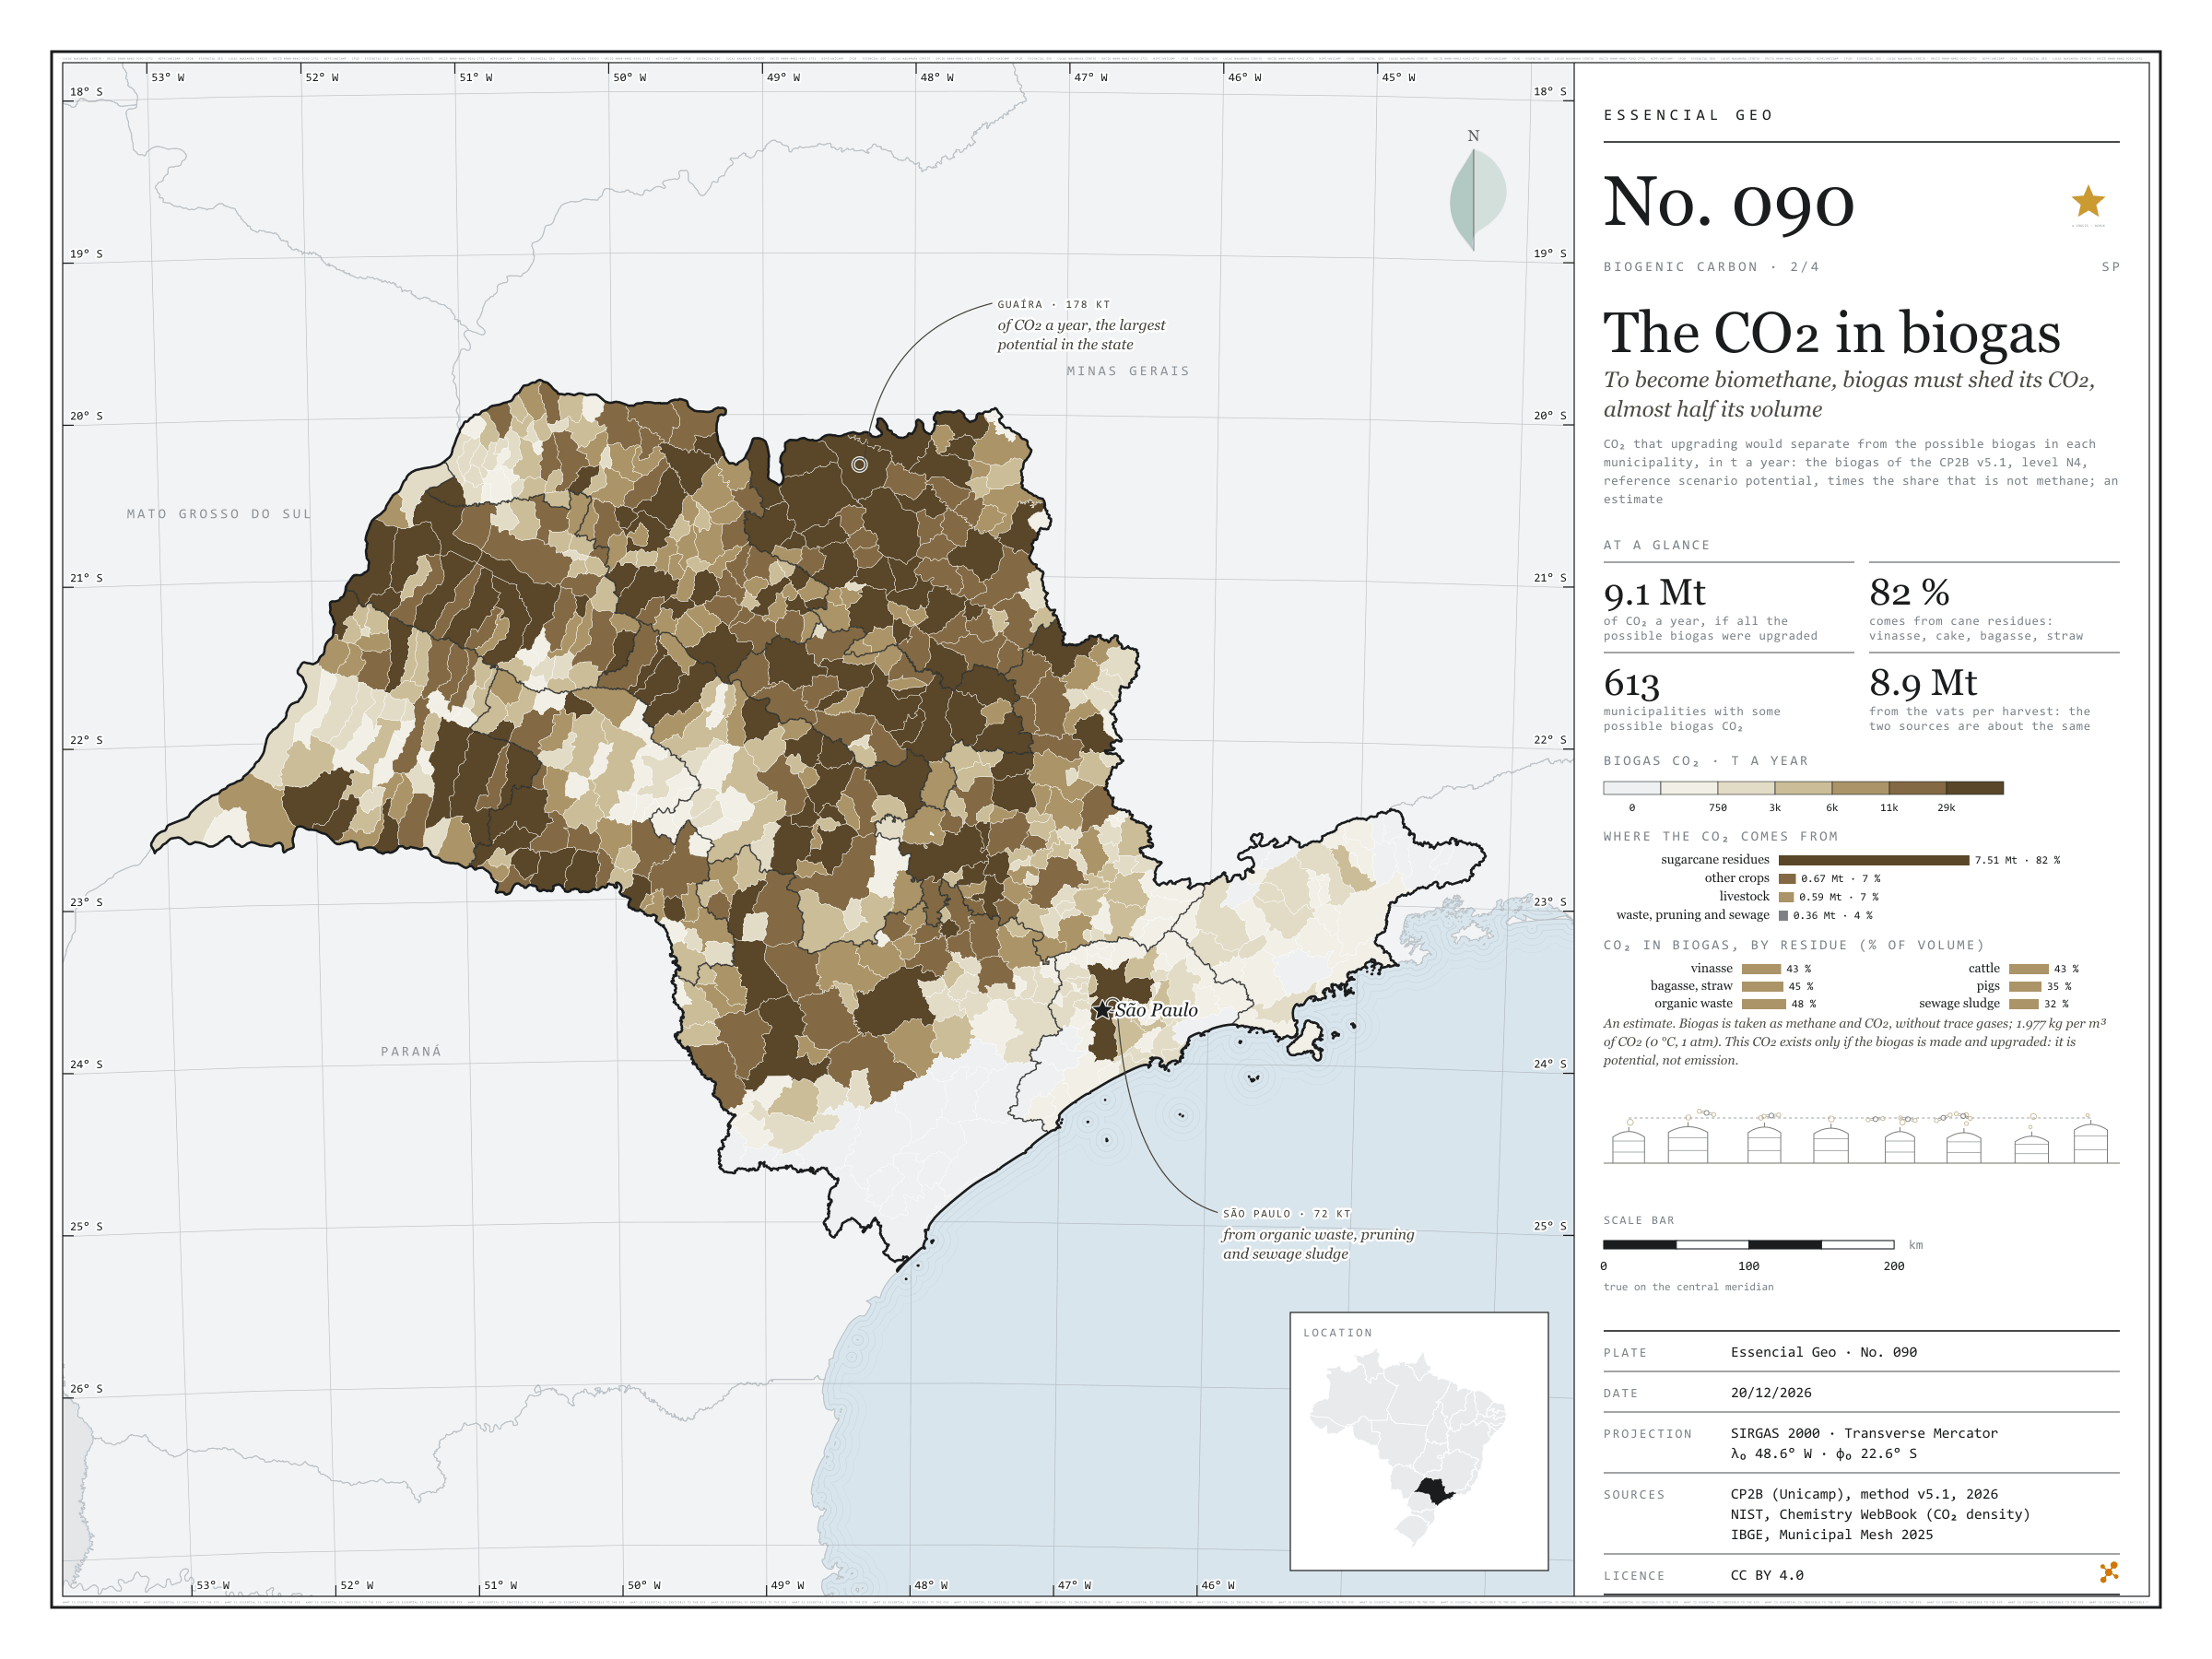
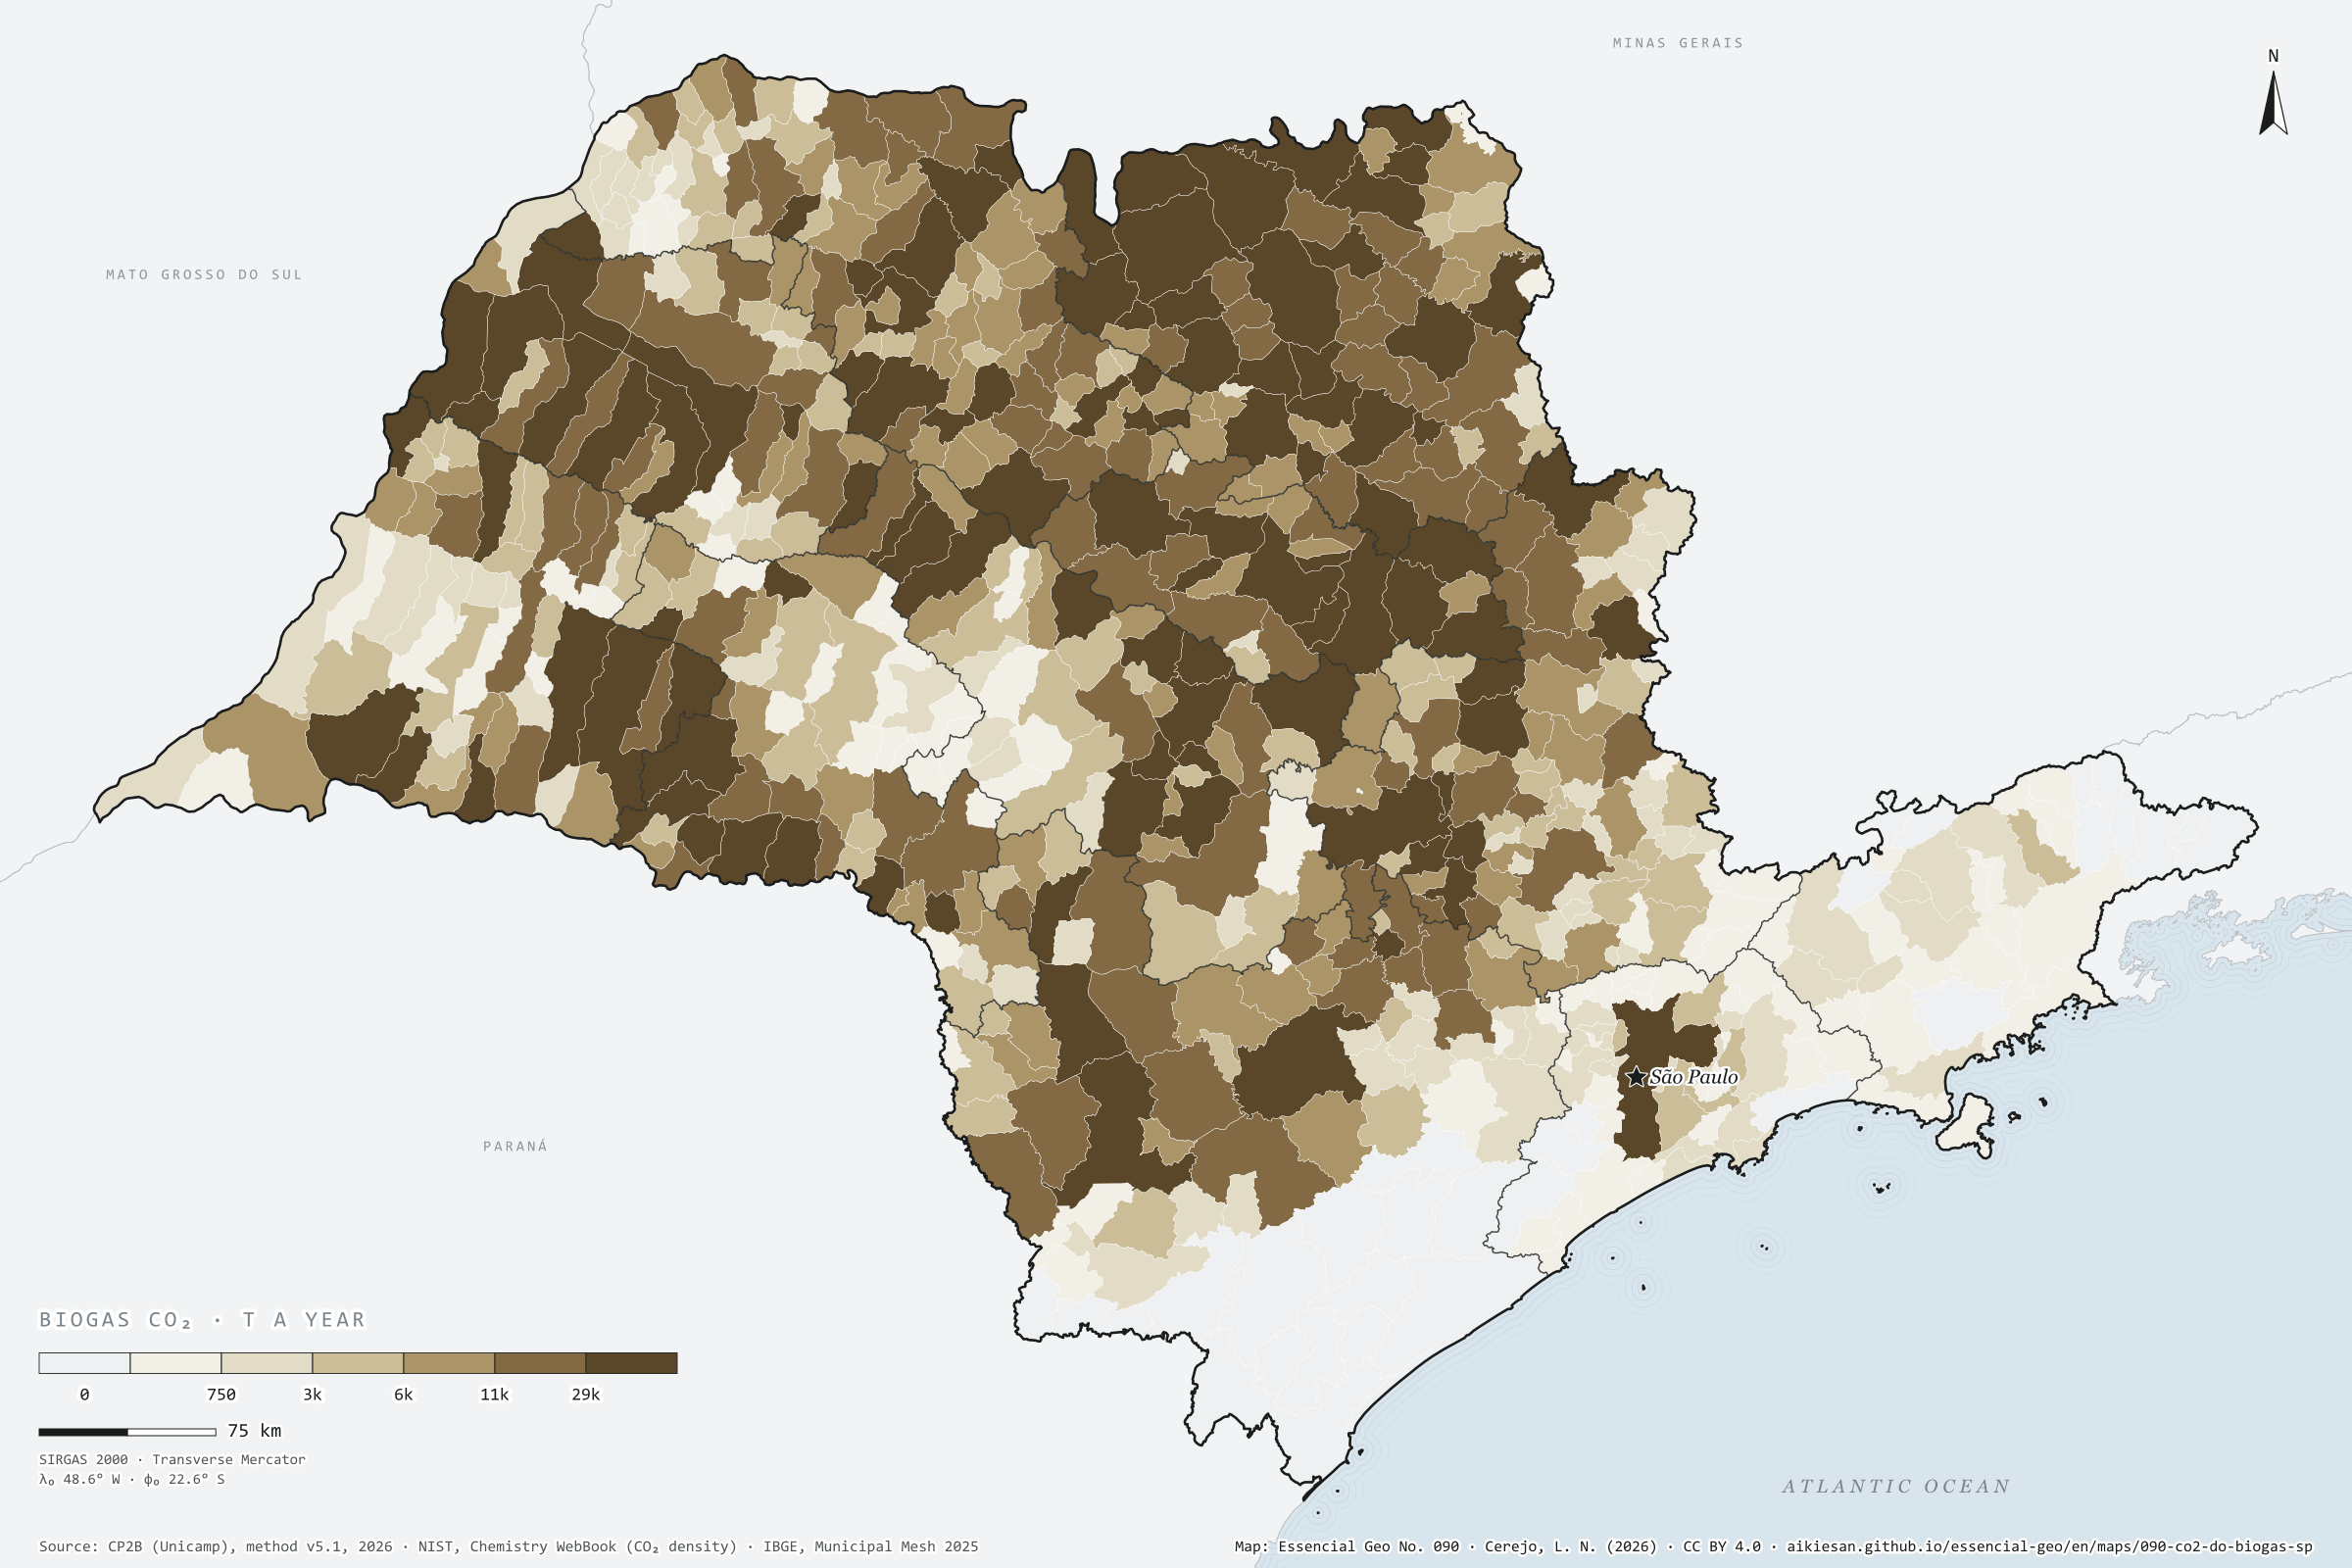
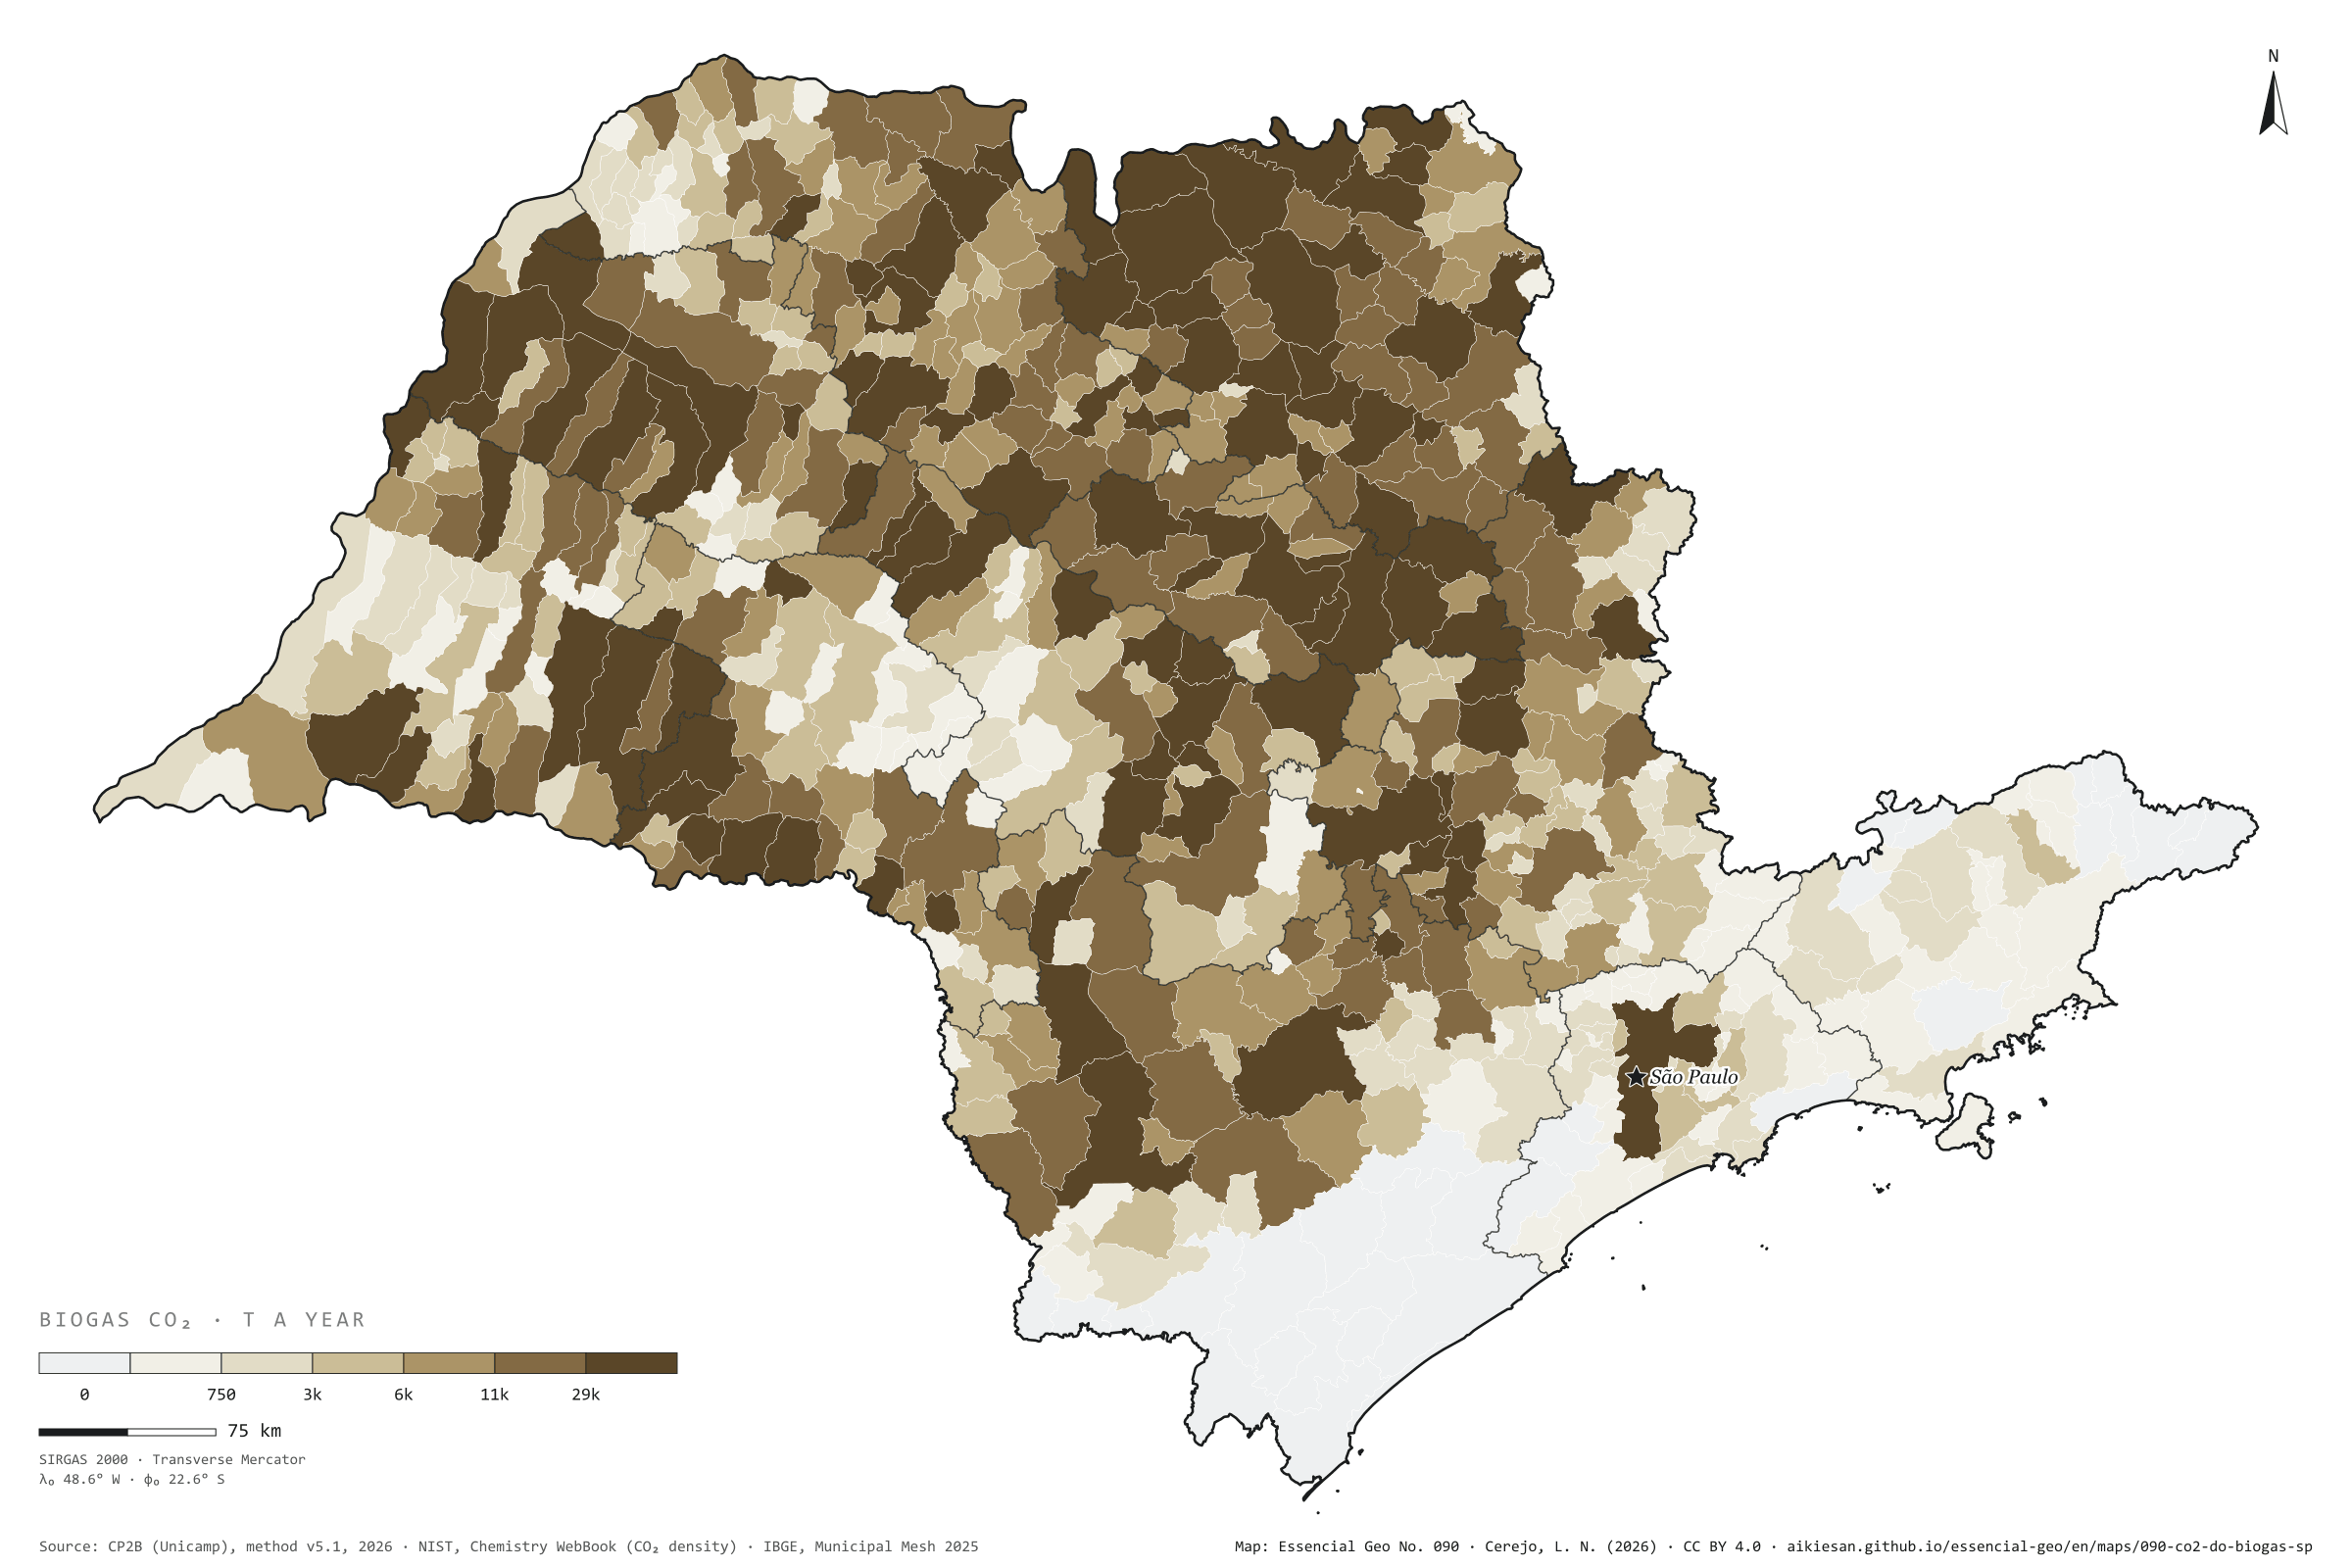
To become biomethane, biogas must shed its CO₂, almost half its volume
Fig. 090São Paulo State (SP)EPSG:4674Source: CP2B (Unicamp), NIST, IBGE
Biogas leaves the digester as methane and CO₂; the CO₂ takes up 32% to 48% of the volume, depending on the residue. To become biomethane, which can enter the gas grid, biogas goes through upgrading, which separates out this CO₂, a concentrated, biogenic gas. If all the possible biogas in São Paulo were made and upgraded, on the CP2B potential (level N4, reference scenario), about 9.1 million t of CO₂ a year would come out, almost as much as the ethanol vats release in a harvest. 82% would come from cane residues: vinasse, filter cake, bagasse and straw. Guaíra leads with 178,000 t, followed by Morro Agudo with 154,000 and Sertãozinho with 136,000; the capital reaches 72,000 t from organic waste, pruning and sewage sludge. It is a potential, not a current emission, and an estimate. Second plate of the collection “Biogenic carbon”.
Technical record · downloads · citation
At a glance
Where the biogas CO₂ would come from (t a year)
sugarcane residues82.2%
other crops7.4%
livestock6.5%
waste, pruning and sewage3.9%
Largest municipalities (t of CO₂ a year)
Guaíra177,918
Morro Agudo154,321
Sertãozinho136,382
Pontal119,943
Pitangueiras112,591
Layers
municipiospolygon645 municipalities: biogas upgrading CO₂, total and by group (cane, crops, livestock, urban), and N4 biogas (same GPKG as plate 089)
For each municipality and residue, the biogas of the CP2B v5.1 potential (level N4, reference scenario) times the share of the volume that is not methane (1 − the residue’s CH₄ fraction), converted to mass at 1.977 kg of CO₂ per normal m³; summed by municipality and by residue group.
The map without a frame, with legend, scale, reference system and credit written on it: ready for papers, lectures and slides. In two versions: with the basemap (neighbours and sea) or only the mapped area, on white.
CEREJO, Lucas Nakamura. O CO₂ do biogás: para virar biometano, o biogás solta o CO₂, quase metade do volume. Versão 1.0.0. [S. l.]: Essencial, 2026. Conjunto de dados. Disponível em: https://aikiesan.github.io/essencial-geo/en/maps/090-co2-do-biogas-sp/. Acesso em: 10 nov. 2026.
Cerejo, L. N. (2026). O CO₂ do biogás: para virar biometano, o biogás solta o CO₂, quase metade do volume [The CO₂ in biogas: To become biomethane, biogas must shed its CO₂, almost half its volume] (Version 1.0.0) [Data set]. Essencial. https://aikiesan.github.io/essencial-geo/en/maps/090-co2-do-biogas-sp/
@dataset{cerejo2026_co2_do_biogas_sp,
  author    = {Cerejo, Lucas Nakamura},
  title     = {O CO₂ do biogás: Para virar biometano, o biogás solta o CO₂, quase metade do volume},
  year      = {2026},
  publisher = {Essencial},
  version   = {1.0.0},
  url       = {https://aikiesan.github.io/essencial-geo/en/maps/090-co2-do-biogas-sp/},
  language  = {portuguese},
  note      = {English title: The CO₂ in biogas: To become biomethane, biogas must shed its CO₂, almost half its volume. Licence CC BY 4.0}
}