Skip to content
Essencial

No. 092 Energy · biomass Biogenic carbon 4/4

What CO₂ could become

With green hydrogen, the cane would yield almost twice the gas the state uses

Record, downloads and citation
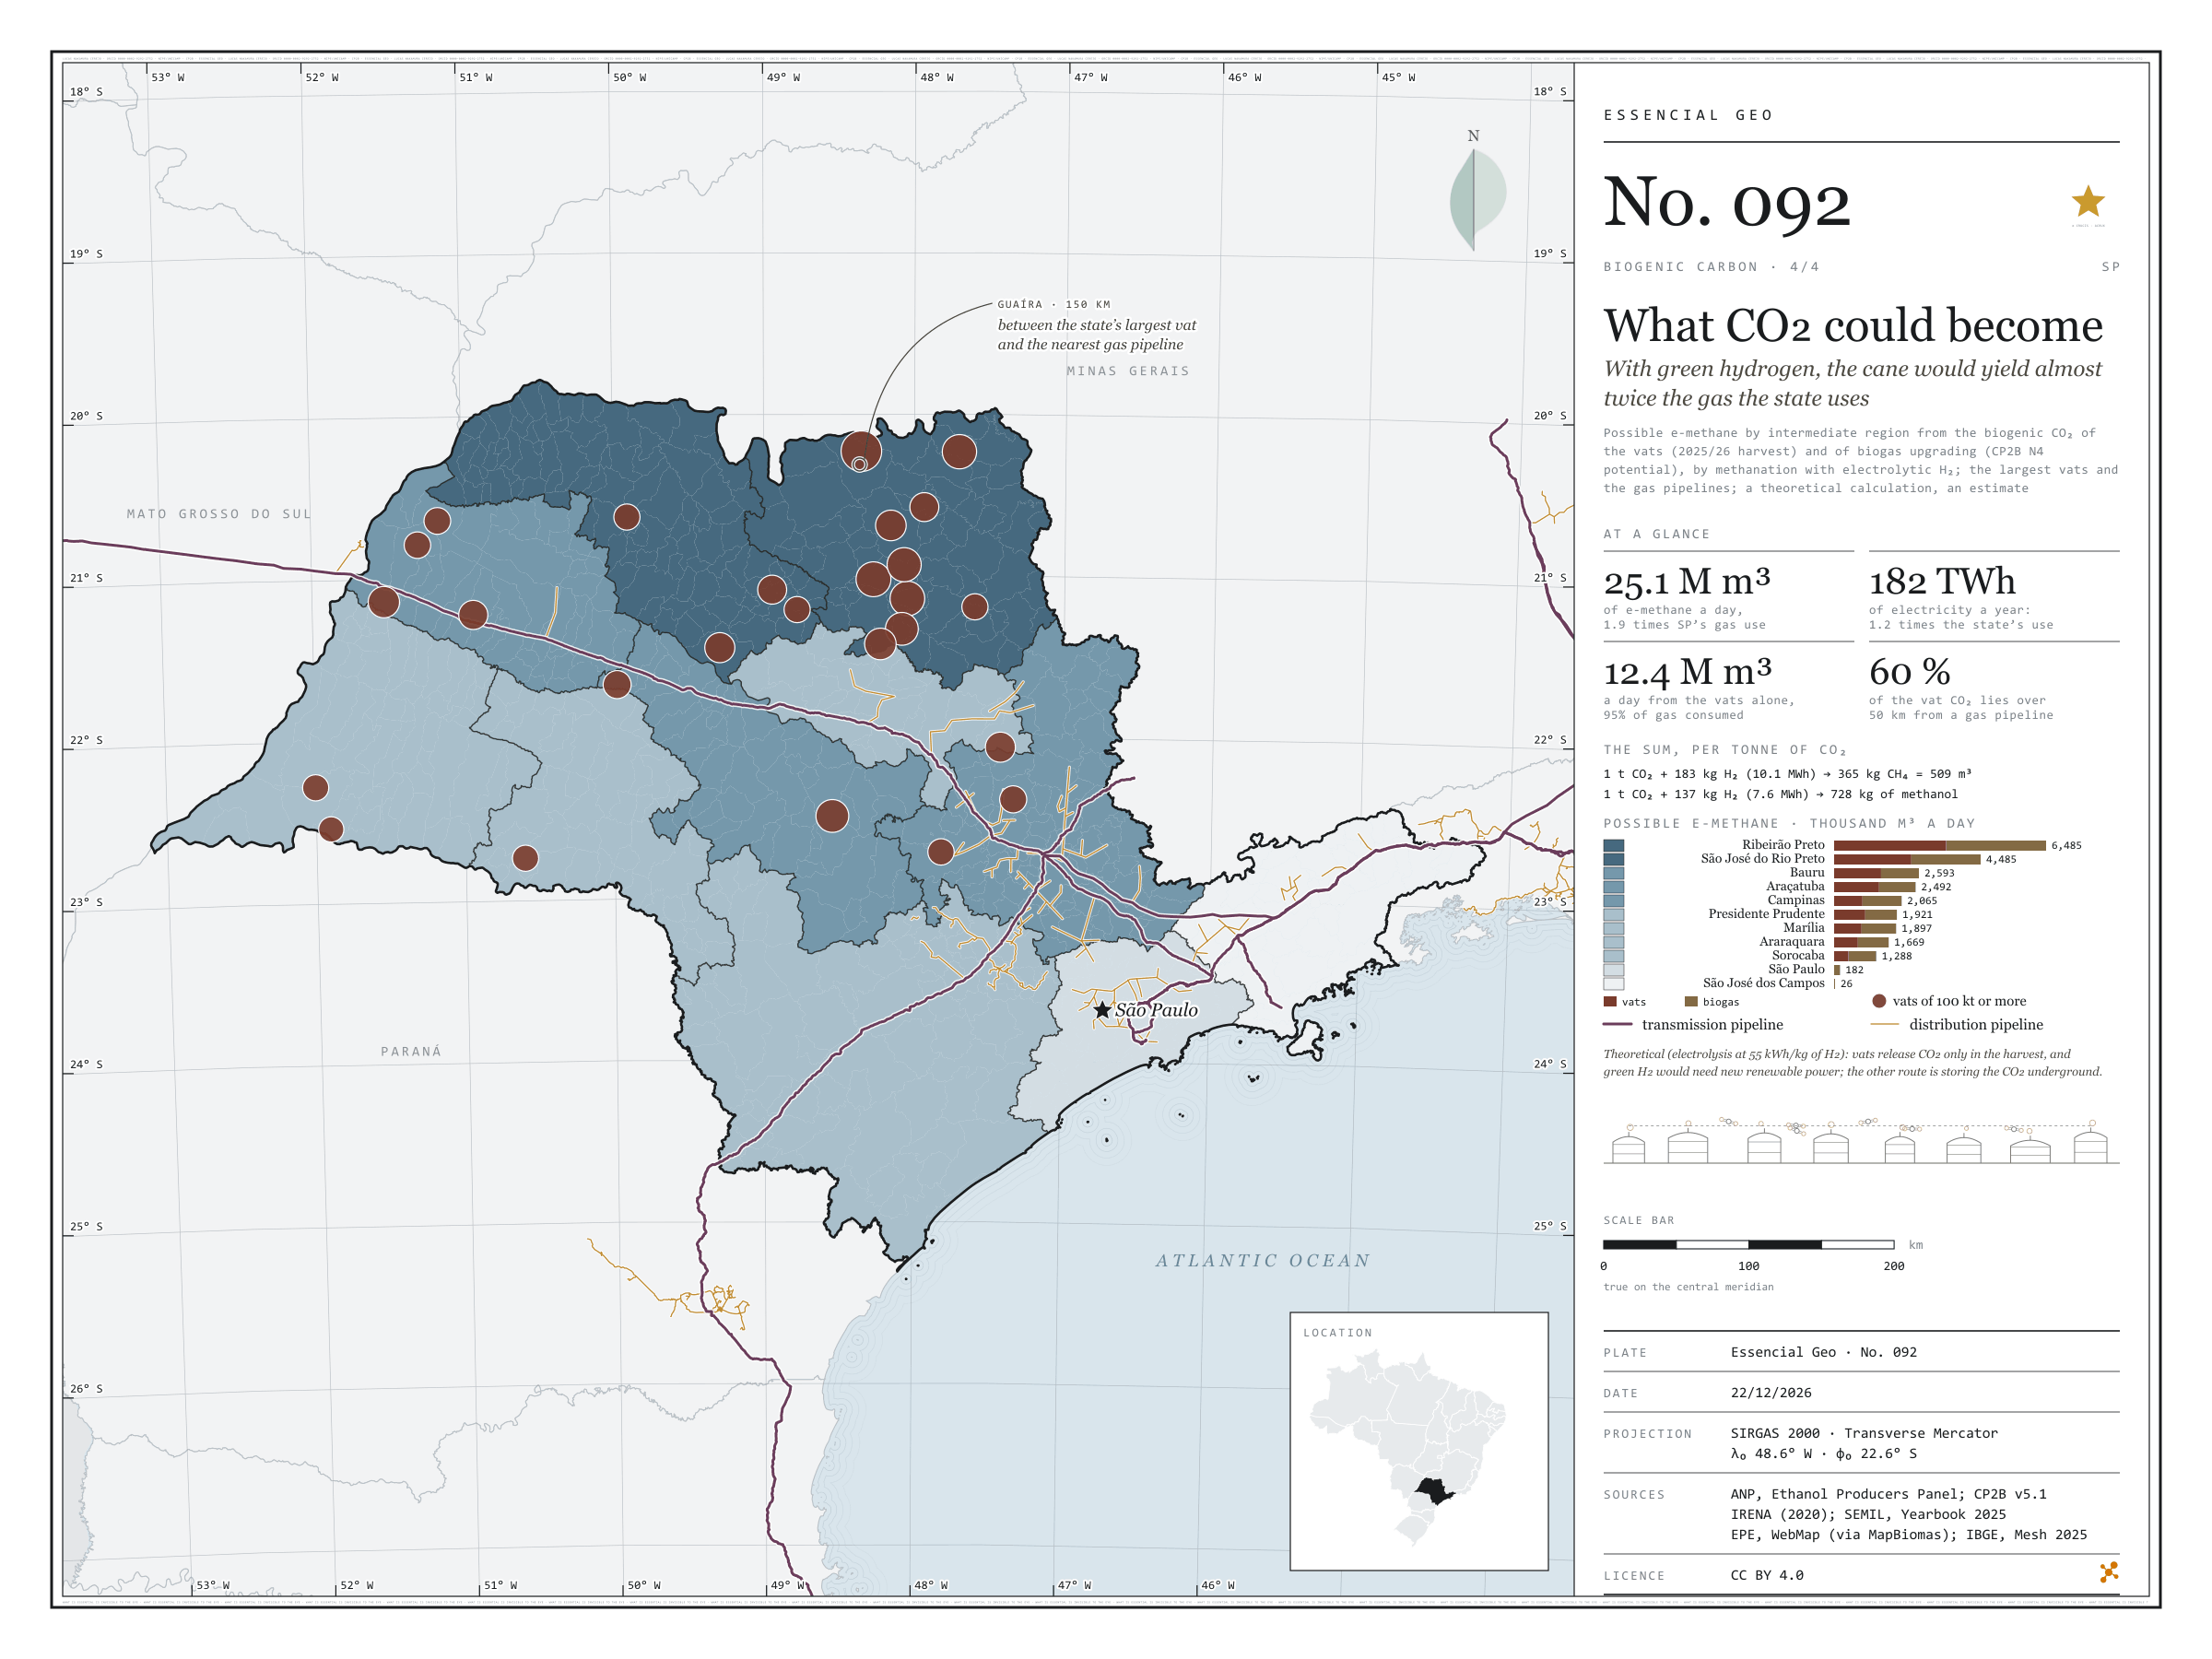
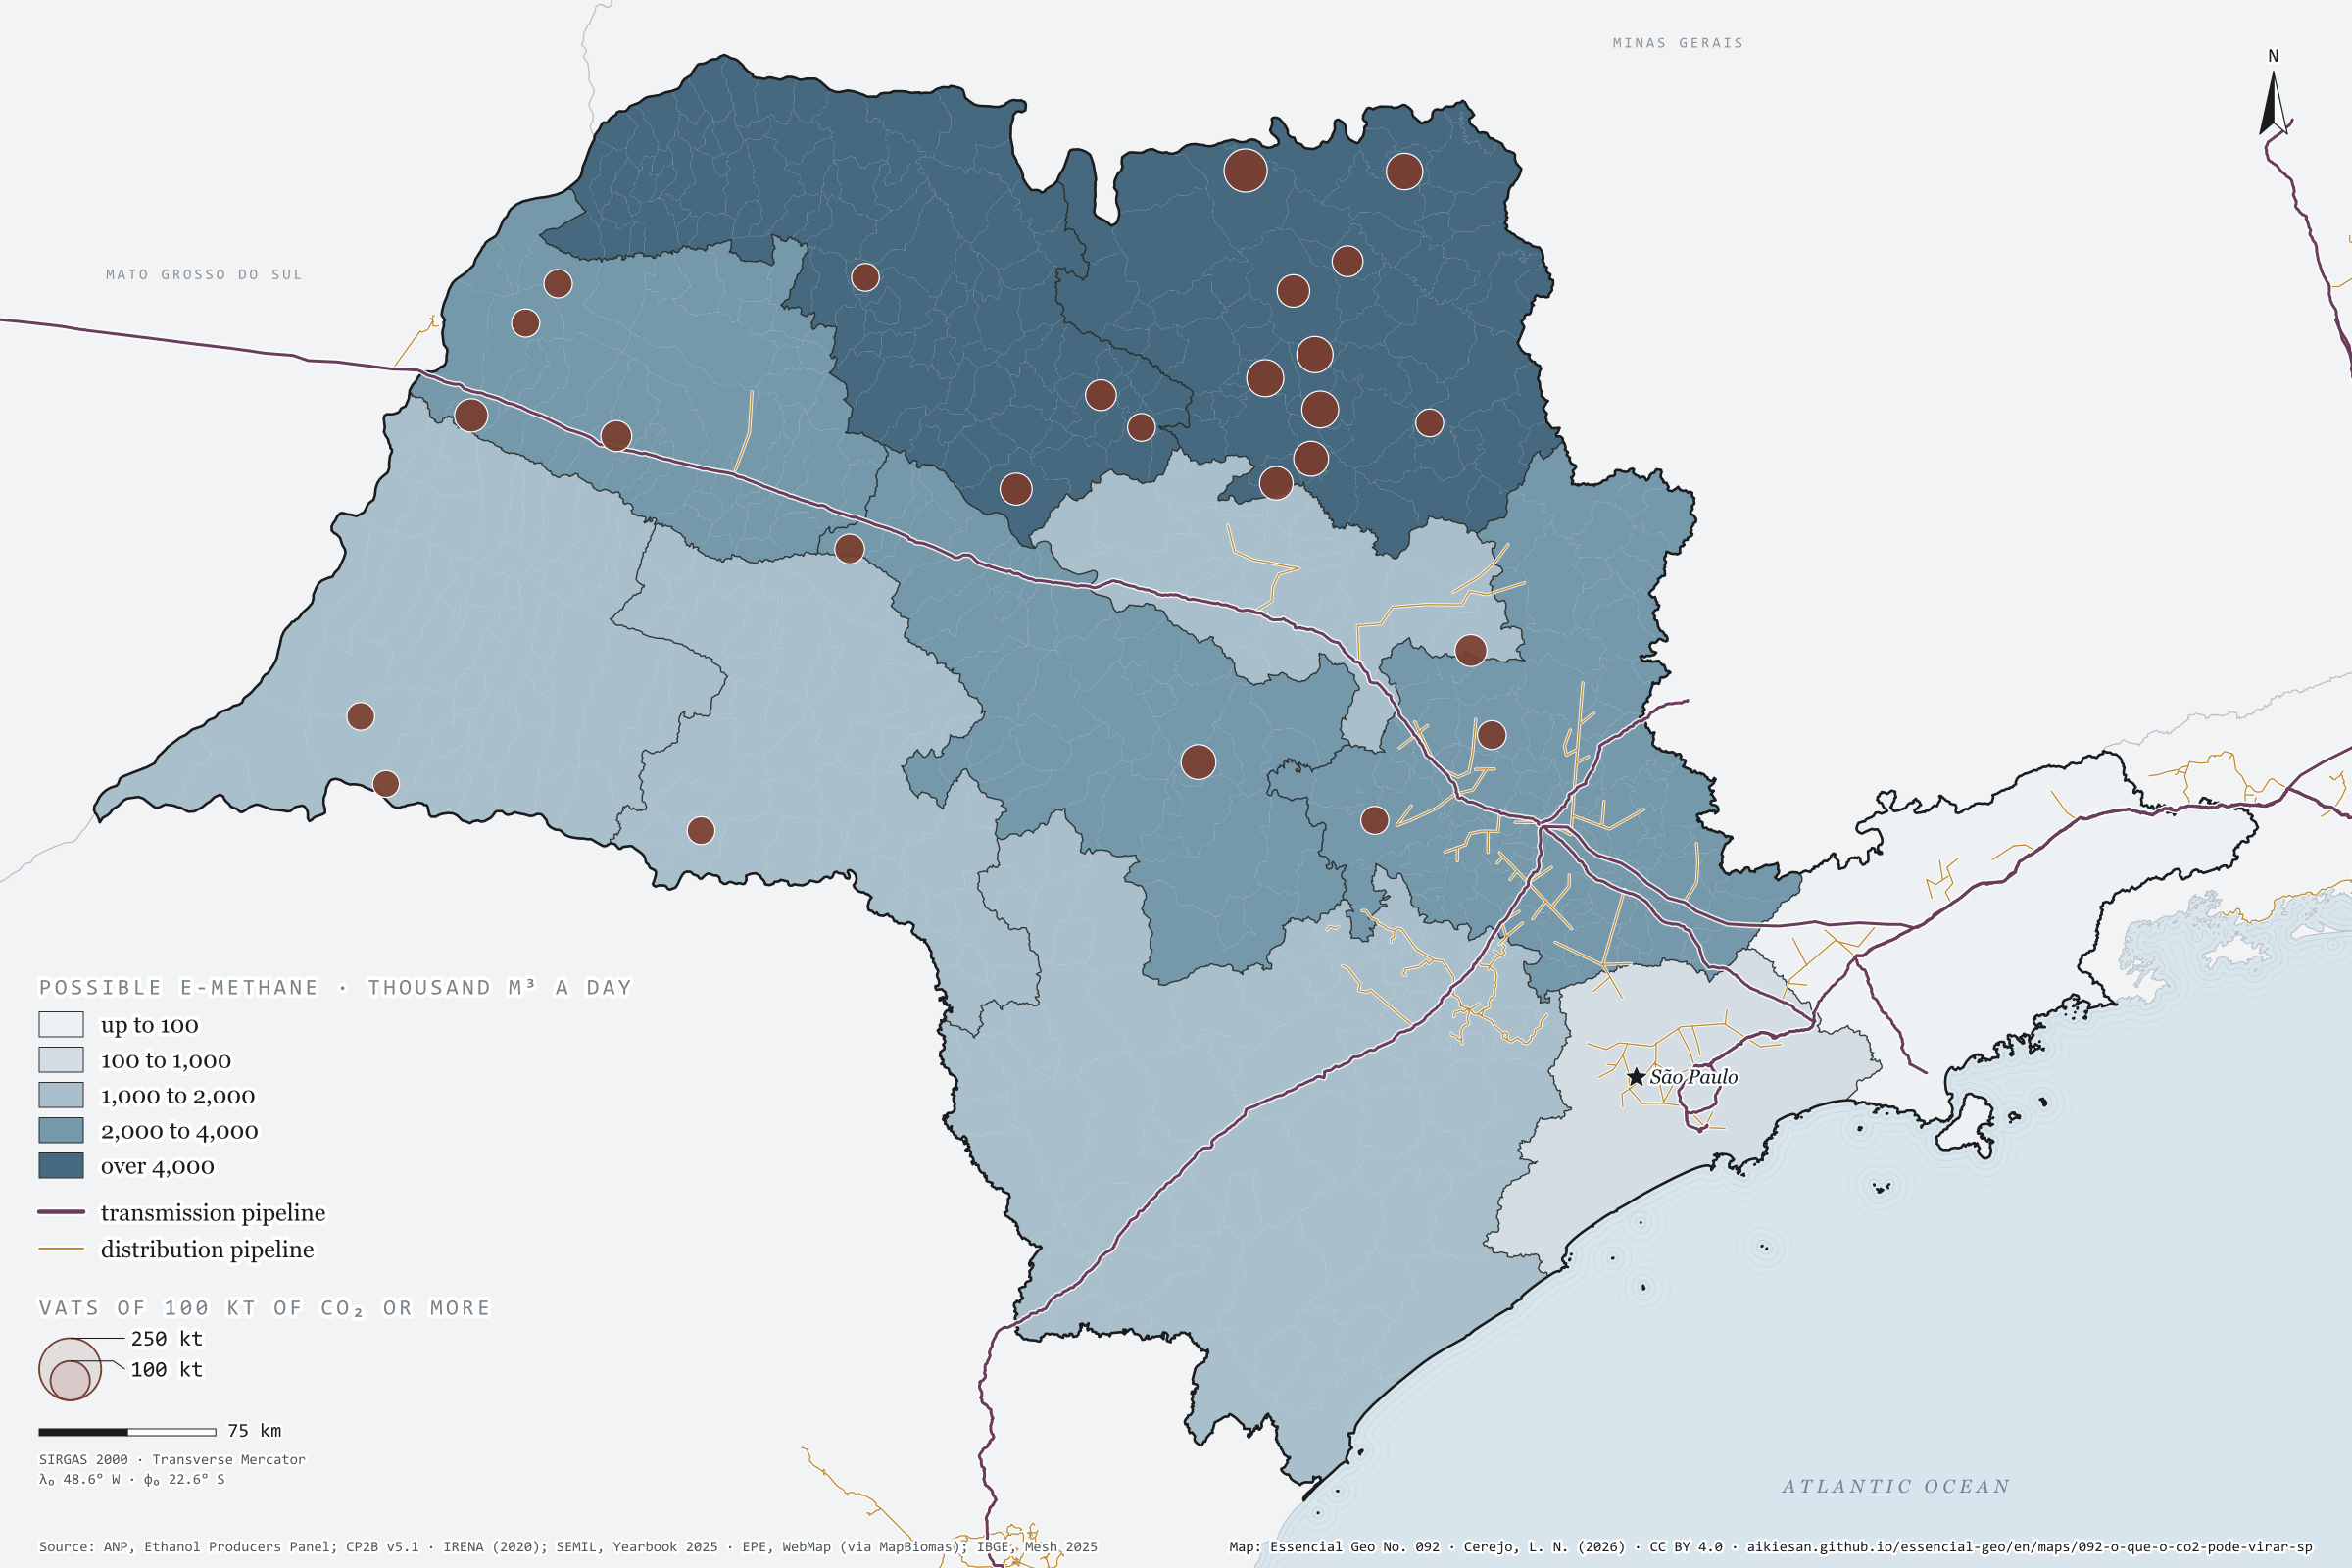
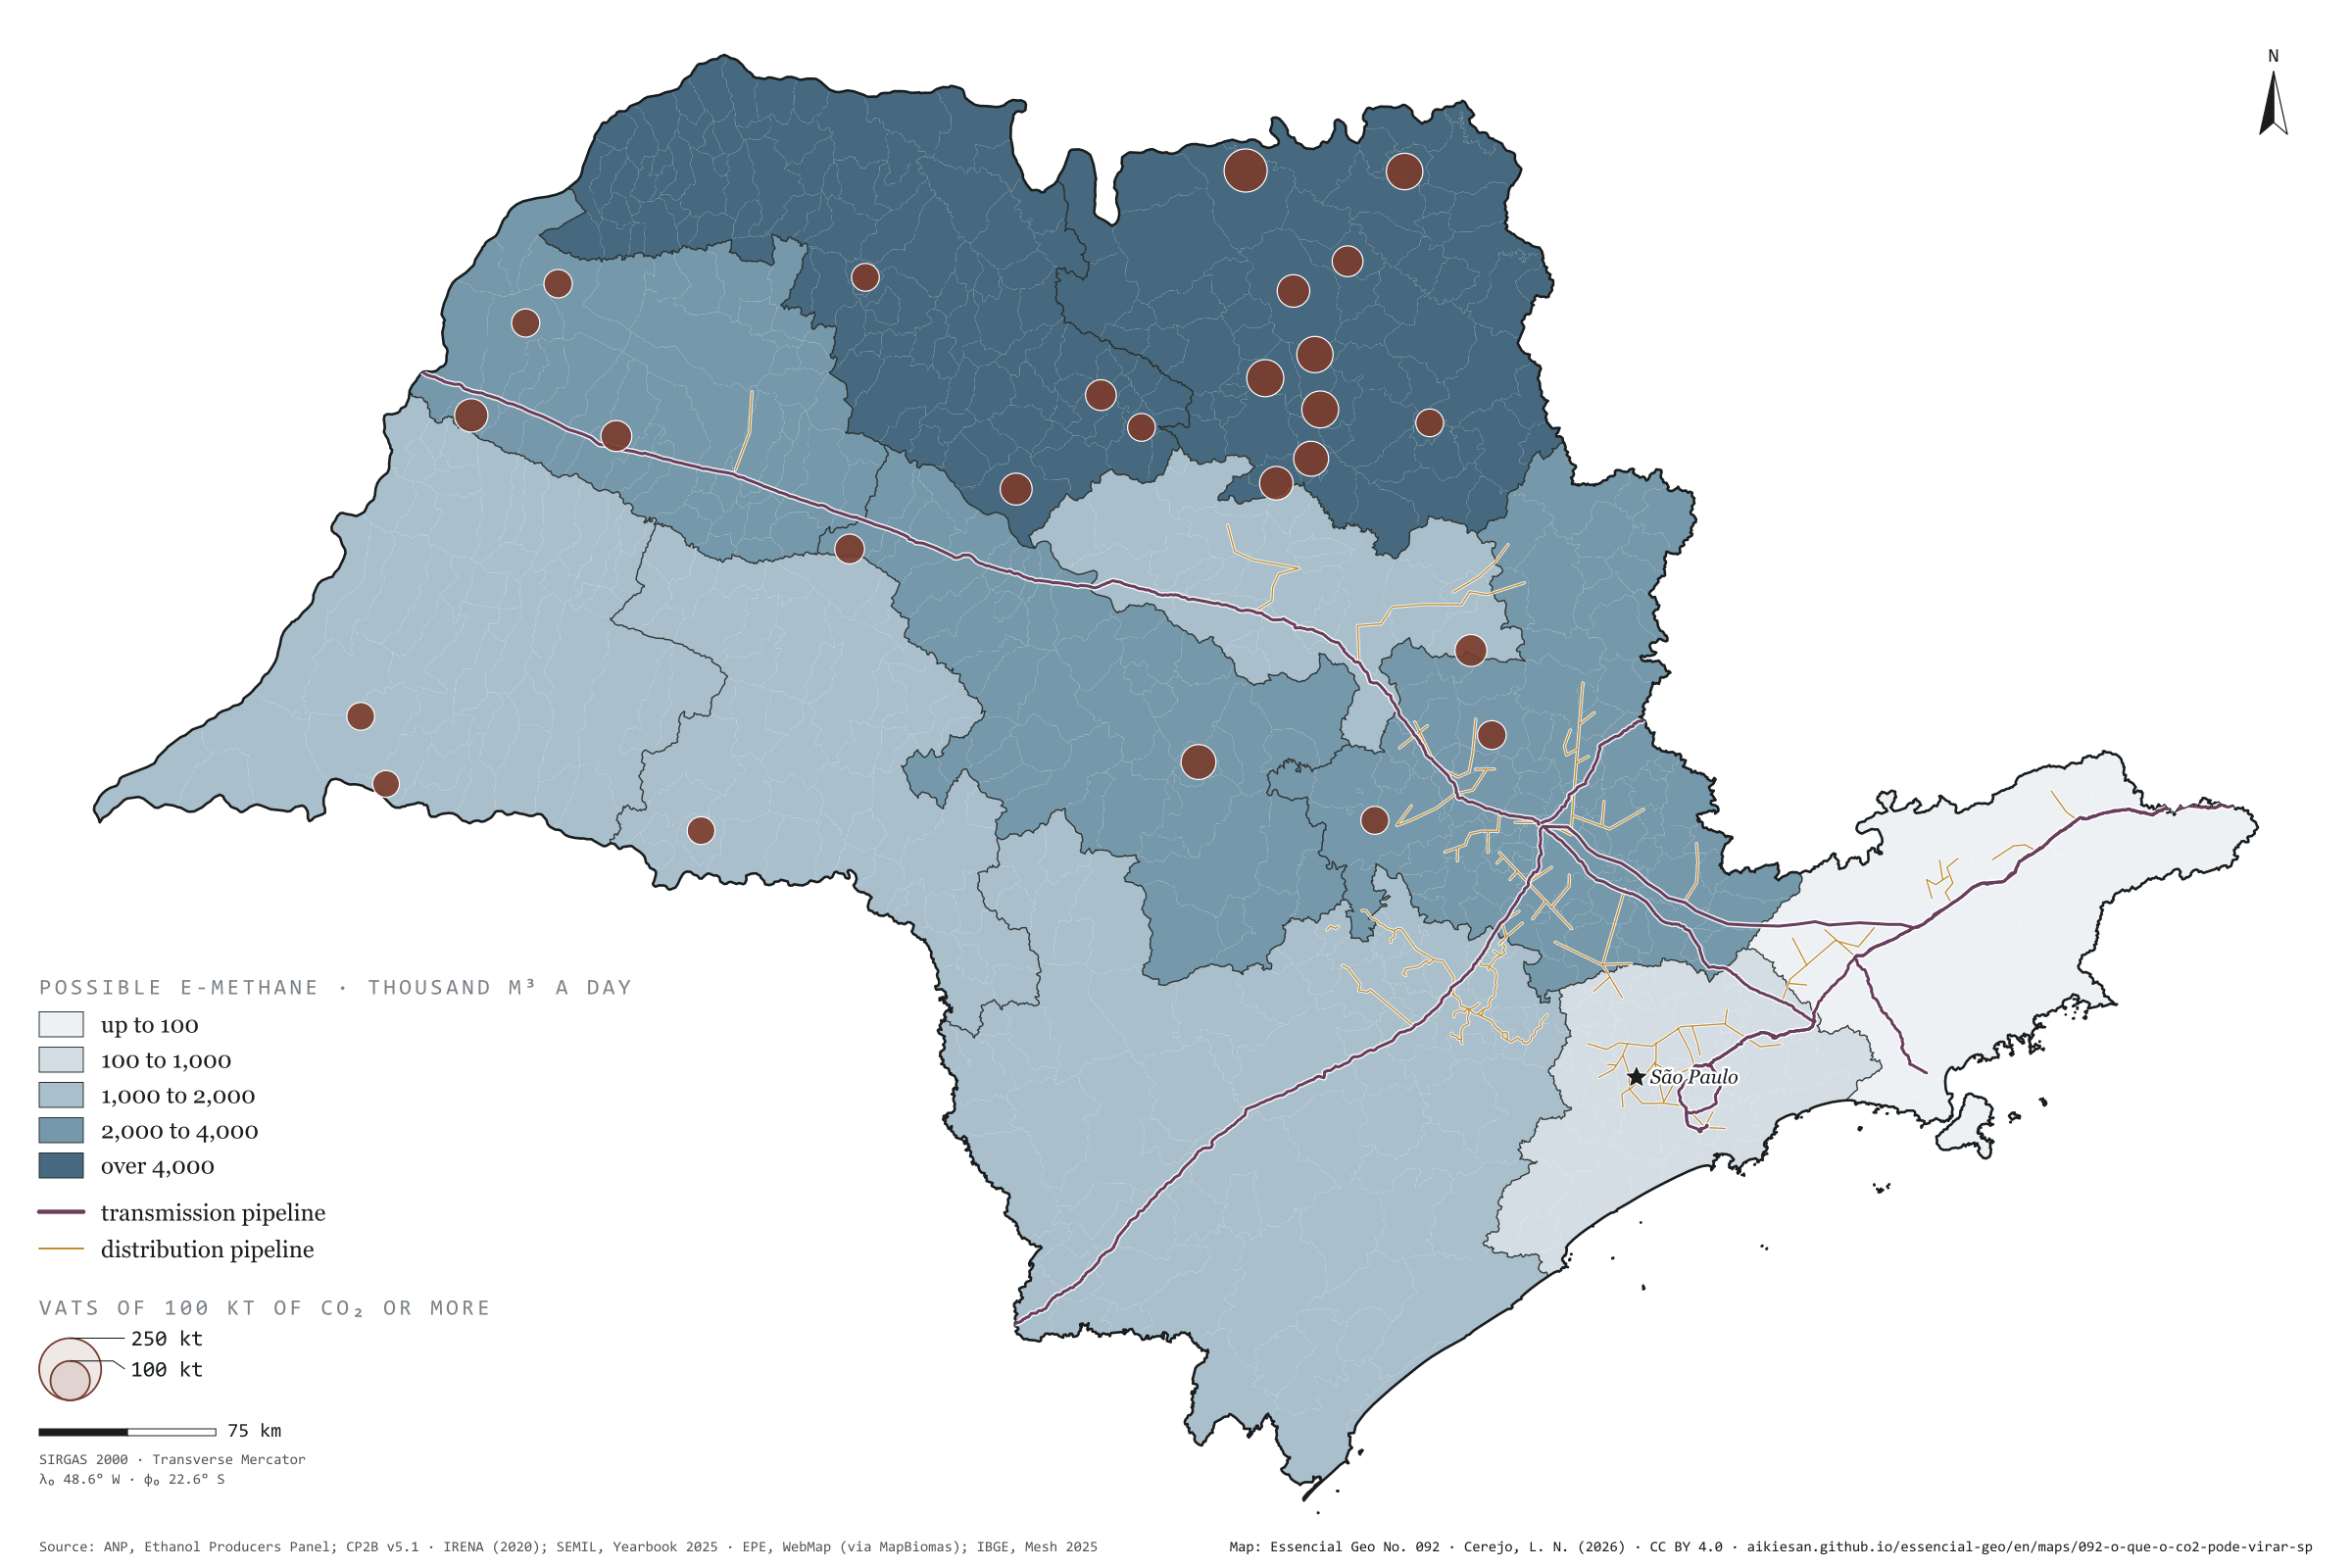
Fig. 092 São Paulo State (SP) EPSG:4674 Source: ANP, CP2B (Unicamp), IRENA (2020), SEMIL (SP), EPE, IBGE

With hydrogen, biogenic CO₂ can become fuel. One tonne of CO₂ plus 183 kg of H₂ gives 365 kg of methane, about 509 m³; with 137 kg of H₂, it gives 728 kg of methanol. Adding the vat CO₂ of the 2025/26 harvest (8.9 million t) to what upgrading the possible biogas would separate (9.1 million), São Paulo would have 18 million t a year: enough for 25 million m³ of e-methane a day, almost twice the natural gas the state used in 2024, or for 13 million t of methanol. But the sum calls for 3.3 million t of green hydrogen and 182 TWh of electricity, 1.2 times the state’s use. The Ribeirão Preto region holds 26% of the total, and 60% of the vat CO₂ lies over 50 km from a gas pipeline. It is a theoretical calculation and an estimate. Last plate of the collection “Biogenic carbon”.

Technical record · downloads · citation

At a glance

Possible e-methane by region (thousand m³ a day)
  • Ribeirão Preto 6,485
  • São José do Rio Preto 4,485
  • Bauru 2,593
  • Araçatuba 2,492
  • Campinas 2,065
  • Presidente Prudente 1,921
  • Marília 1,897
  • Araraquara 1,669
  • Sorocaba 1,288
  • São Paulo 182
  • São José dos Campos 26
Vat CO₂ by distance to the gas pipeline (t a harvest)
  • up to 10 km 13.5%
  • 10 to 25 km 12.4%
  • 25 to 50 km 13.9%
  • over 50 km 60.2%

Layers

  • regioes_carbono polygon 11 intermediate regions: biogenic CO₂, H₂, electricity, possible e-methane and e-methanol, and the largest source
  • usinas_etanol point 145 ethanol mills, with estimated CO₂ (plate 089)
  • gasodutos_transporte line Existing transmission pipelines (same database as plate 057)
  • gasodutos_distribuicao line Piped gas distribution networks

Metadata

Extent
São Paulo State (SP)
CRS / Projection
SIRGAS 2000 (EPSG:4674)
EPSG:4674
Software
Node.js · d3-geo · QGIS
Method
Biogenic CO₂ by intermediate region (vats in the 2025/26 harvest, plate 089, plus upgrading of the possible biogas, plate 090), converted into e-methane (CO₂ + 4 H₂ → CH₄ + 2 H₂O) and e-methanol (CO₂ + 3 H₂ → CH₃OH + H₂O) at full conversion, with the hydrogen turned into electricity at 55 kWh per kg (electrolysis); distance from each municipality to the nearest gas pipeline.
Version
v1.0.0
Licence
CC BY 4.0
DOI
being registered on Zenodo

Downloads

Figure to reuse

The map without a frame, with legend, scale, reference system and credit written on it: ready for papers, lectures and slides. In two versions: with the basemap (neighbours and sea) or only the mapped area, on white.

Point a camera at it to open this page.

How to cite

Cerejo, L. N. (2026). O que o CO₂ poderia virar: com hidrogênio verde, a cana renderia quase duas vezes o gás consumido no estado [What CO₂ could become: With green hydrogen, the cane would yield almost twice the gas the state uses] (Version 1.0.0) [Data set]. Essencial. https://aikiesan.github.io/essencial-geo/en/maps/092-o-que-o-co2-pode-virar-sp/

How to read this plate area, projection, scale, legend and source · 3 terms
1 Area
São Paulo State (SP) The area the plate covers. Outside it, neighbours and sea are drawn in grey, just for orientation.
2 Coordinates and projection
SIRGAS 2000 (EPSG:4674) The layers are in SIRGAS 2000; the drawing’s projection is written in the colophon at the foot of the panel.
3 Scale
Graphic scale bar in the panel The scale bar is true on the central meridian; away from it, measured distances vary a little.
4 Legend and layers
4 layers in the GeoPackage · polygon, point, line Read the legend before the map: it tells you whether a colour is a rate or a class, and whether a circle is a total.
5 Sources
ANP (2026); CP2B (Unicamp) (2026); IRENA (2020) (2020); SEMIL (SP) (2025); EPE (2022); IBGE (2025) Every figure comes from a public source, with its year. The data sheet gives each one’s address.

Terms on this plate

Harvest year
Cane years are not calendar years: in the Centre-South the harvest runs from April to March; in the Northeast, from September to August. That is why the two regions crush in opposite months.
Biogas
The gas from the airless breakdown (anaerobic digestion) of organic waste: manure, vinasse, sewage sludge, rubbish. It is 50% to 70% methane; the rest is mostly CO₂.
Biogenic CO₂
CO₂ from recently grown biomass, such as that from ethanol fermentation and biogas upgrading: it returns to the air what the plant took shortly before. It can be captured and used.

Download

Layers, table and figures, under CC BY 4.0. Cite with the DOI.

Full record and citation

Method notes · No. 092

What São Paulo’s biogenic CO₂ could become

Português · English

Plate No. 092, the last of four in the collection Biogenic carbon: how much fuel the CO₂ from vats and biogas would make with green hydrogen, and how much electricity that would take.

What the files contain

  • dados/sp_carbono_regioes.csv: one row per intermediate region, with co2_fermentacao_t, co2_biogas_t, co2_biogenico_t, h2_t (hydrogen needed to methanate all the CO₂), eletricidade_gwh, emetano_nm3_dia, emetano_mi_m3_ano, emetanol_t (if the same CO₂ became methanol), co2_fermentacao_ate_25km_t (vat CO₂ in municipalities within 25 km of a pipeline) and maior_fonte (the municipality with the most vat CO₂).
  • sp_carbono_biogenico.gpkg.zip (in the carbono-sp-2026 release): the regioes_carbono layer (style emetano, with the map’s classes), the mills and the pipelines; in the municipios layer, emetano_nm3_dia, km_gasoduto and km_gasoduto_transporte.

Assumptions

per t of CO₂source
Methanation (Sabatier): CO₂ + 4 H₂ → CH₄ + 2 H₂O183 kg of H₂ → 365 kg of CH₄ = 509 m³ (0 °C, 1 atm)stoichiometry, IUPAC molar masses
Methanol synthesis: CO₂ + 3 H₂ → CH₃OH + H₂O137 kg of H₂ → 728 kg of methanolstoichiometry
Water electrolysis55 kWh per kg of H₂ (range of 50 to 83 kWh/kg for today’s electrolysers)IRENA (2020)
Electricity per t of CO₂10.1 MWh (e-methane) or 7.6 MWh (e-methanol)55 kWh/kg × H₂

Conversion is taken as complete, with no losses in the reactor, compression or capture; the figures are therefore a theoretical ceiling.

Method

  1. Biogenic CO₂: that of the vats in the 2025/26 harvest (plate 089, 8.88 million t) plus that of upgrading the possible biogas (plate 090, 9.13 million t), summed by IBGE intermediate region: 18.0 million t a year in the state.
  2. Fuel: e-methane and, alternatively, e-methanol, with the ratios in the table; e-methane per day is the annual figure divided by 365.
  3. Comparison: with the natural gas used in São Paulo in 2024, 4.78 billion m³ (13.1 million m³ a day), and with electricity use, 146.9 TWh (SEMIL Energy Yearbook, base year 2024, converted at 0.086 toe per MWh). The possible e-methane would give 25.1 million m³ a day, 1.9 times the state’s gas; that from the vats alone, 12.4 million m³, 95%. The electricity needed, 182 TWh, is 1.2 times the state’s use; for the vats alone, 89.5 TWh, 61%.
  4. Pipelines: distance from each municipality’s interior point to the nearest pipeline (EPE, via MapBiomas, plate 057), in four bands. Of the 8.9 million t of vat CO₂, 1.2 million lies within 10 km of a pipeline, 1.1 at 10 to 25 km, 1.2 at 25 to 50 km and 5.3 million (60%) over 50 km. Guaíra, the largest source, is 150 km away.

Limitations

  • It is a theoretical calculation, an estimate: it does not say such plants are viable, only how much the carbon would yield.
  • Vat CO₂ comes only in the harvest, from April to November; a continuous plant would need to store CO₂ or hydrogen, or stand idle part of the year.
  • Green hydrogen would require new renewable generation; the electricity in the sum exceeds the state’s current use.
  • Biogas CO₂ is a potential (plate 090): it exists only if the biogas is produced and upgraded.
  • The Yearbook measures natural gas in commercial, not normal, cubic metres; the comparison with e-methane is approximate.
  • The other route for this CO₂, geological storage (BECCS), depends on a surveyed reservoir and is not part of the sum.

View this map’s folder on GitHub

Technical record

Technical record · No. 092

What CO₂ could become

At a glance

Possible e-methane by region (thousand m³ a day)
  • Ribeirão Preto 6,485
  • São José do Rio Preto 4,485
  • Bauru 2,593
  • Araçatuba 2,492
  • Campinas 2,065
  • Presidente Prudente 1,921
  • Marília 1,897
  • Araraquara 1,669
  • Sorocaba 1,288
  • São Paulo 182
  • São José dos Campos 26
Vat CO₂ by distance to the gas pipeline (t a harvest)
  • up to 10 km 13.5%
  • 10 to 25 km 12.4%
  • 25 to 50 km 13.9%
  • over 50 km 60.2%

Layers

  • regioes_carbono polygon 11 intermediate regions: biogenic CO₂, H₂, electricity, possible e-methane and e-methanol, and the largest source
  • usinas_etanol point 145 ethanol mills, with estimated CO₂ (plate 089)
  • gasodutos_transporte line Existing transmission pipelines (same database as plate 057)
  • gasodutos_distribuicao line Piped gas distribution networks

Metadata

Extent
São Paulo State (SP)
CRS / Projection
SIRGAS 2000 (EPSG:4674)
EPSG:4674
Software
Node.js · d3-geo · QGIS
Method
Biogenic CO₂ by intermediate region (vats in the 2025/26 harvest, plate 089, plus upgrading of the possible biogas, plate 090), converted into e-methane (CO₂ + 4 H₂ → CH₄ + 2 H₂O) and e-methanol (CO₂ + 3 H₂ → CH₃OH + H₂O) at full conversion, with the hydrogen turned into electricity at 55 kWh per kg (electrolysis); distance from each municipality to the nearest gas pipeline.
Version
v1.0.0
Licence
CC BY 4.0
DOI
being registered on Zenodo

Downloads

Figure to reuse

The map without a frame, with legend, scale, reference system and credit written on it: ready for papers, lectures and slides. In two versions: with the basemap (neighbours and sea) or only the mapped area, on white.

Point a camera at it to open this page.

How to cite

Cerejo, L. N. (2026). O que o CO₂ poderia virar: com hidrogênio verde, a cana renderia quase duas vezes o gás consumido no estado [What CO₂ could become: With green hydrogen, the cane would yield almost twice the gas the state uses] (Version 1.0.0) [Data set]. Essencial. https://aikiesan.github.io/essencial-geo/en/maps/092-o-que-o-co2-pode-virar-sp/

100%