Skip to content
Essencial

No. 089 Energy · biomass Biogenic carbon 1/4

The CO₂ from the vats

Every ethanol mill gives off an almost pure gas that now goes into the air

Record, downloads and citation
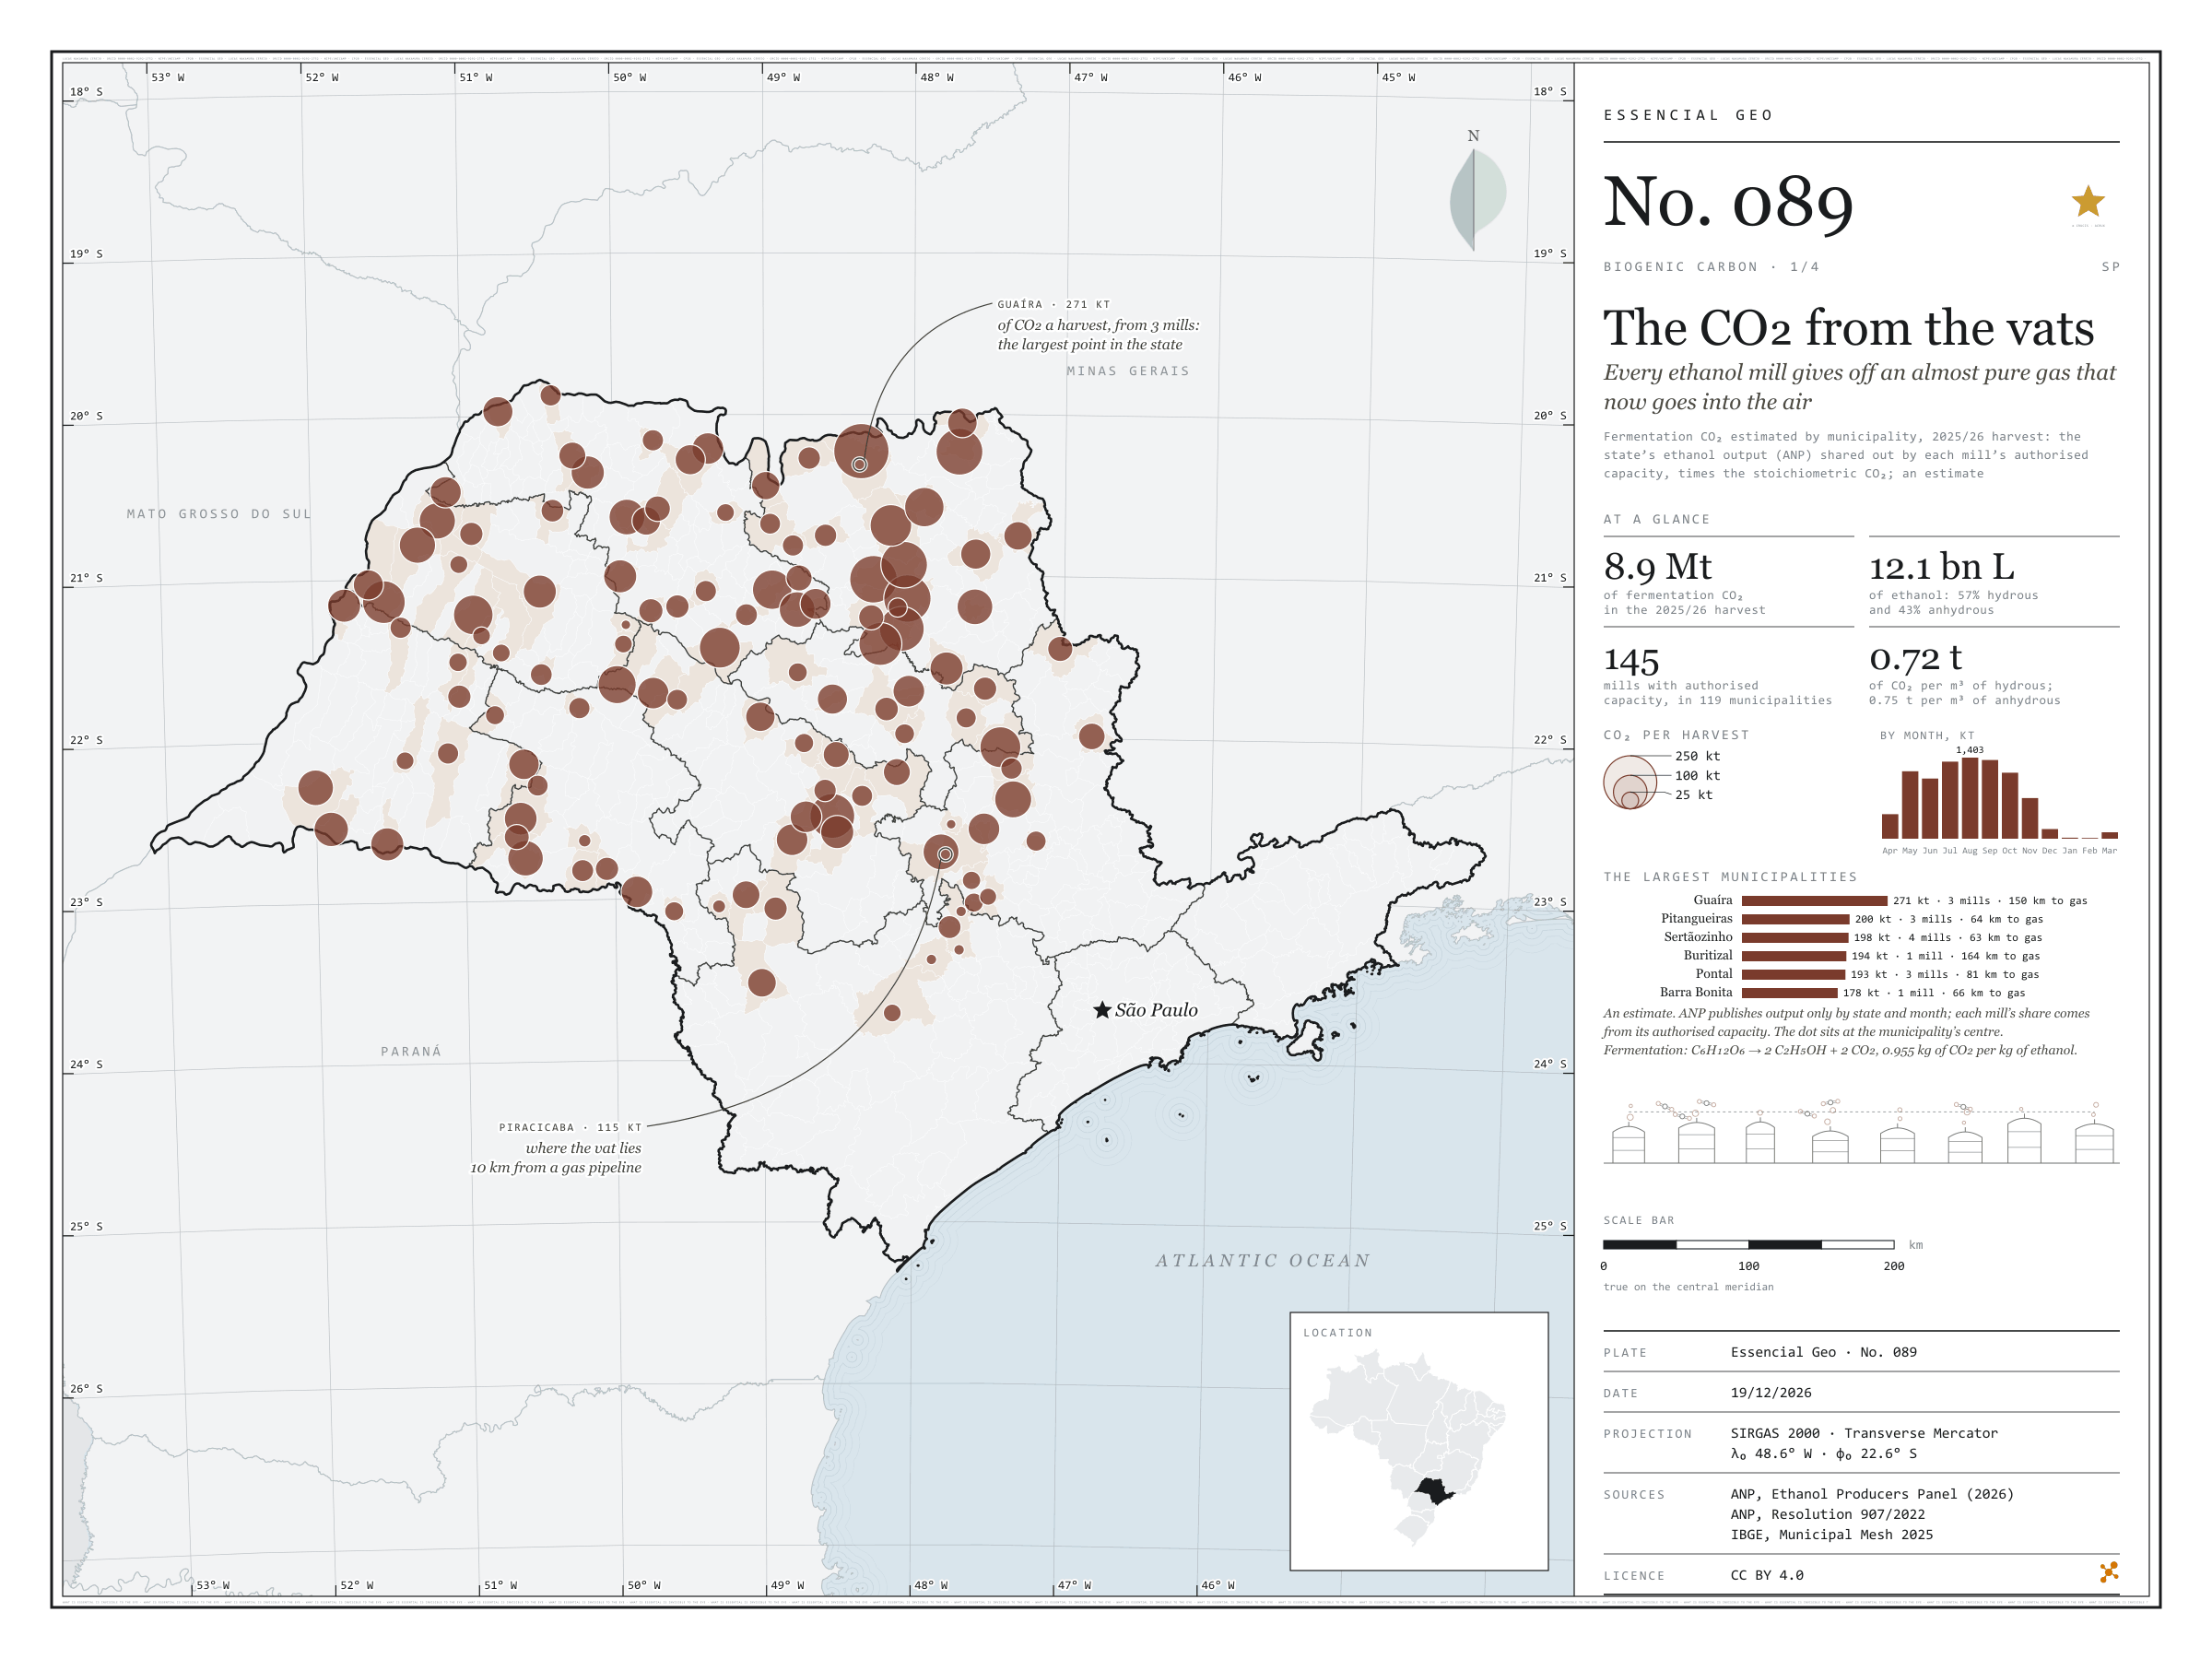
Fig. 089 São Paulo State (SP) EPSG:4674 Source: ANP, Kheshgi, H. S. and Prince, R. C. (2005). Sequestration of fermentation CO₂ from ethanol production. Energy, 30, 1865–1871, EPE, IBGE

In the fermentation vat, yeast turns cane sugar into ethanol and releases CO₂ in step: 0.955 kg of gas per kg of alcohol, about 0.75 t per m³. It is almost pure CO₂, of biological origin, and today it goes into the air. In the 2025/26 harvest, São Paulo’s mills made 12.1 billion litres of ethanol; by stoichiometry, about 8.9 million tonnes of CO₂ left the vats, from 145 mills in 119 municipalities. Guaíra, with three mills, leads with about 271,000 t; Pitangueiras, Sertãozinho and Buritizal each pass 190,000. The gas follows the crushing season: 1.4 million t in August and almost nothing from December to March. As ANP publishes output only by state, each mill’s share is estimated from its authorised capacity; everything here is an estimate. First plate of the collection “Biogenic carbon”.

Technical record · downloads · citation

At a glance

Fermentation CO₂ in the 2025/26 harvest

8.9 million t

Largest municipalities (t of CO₂ a harvest)
  • Guaíra 271,110
  • Pitangueiras 200,298
  • Sertãozinho 198,274
  • Buritizal 194,228
  • Pontal 192,609
  • Barra Bonita 178,042

Layers

  • usinas_etanol point 145 SP mills with authorised capacity in the harvest: estimated ethanol and CO₂, at the municipality’s interior point
  • municipios polygon 645 municipalities: fermentation CO₂ (2025/26 harvest and 2024), biogas, fossil and possible e-methane

Metadata

Sources
ANP — Ethanol Producers Dynamic Panel: authorised capacity by mill and output by state and month (pb-da-etanol.zip) (2026)
ANP — Resolution No. 907/2022, Table 1 (density and alcohol content of anhydrous and hydrous ethanol) (2022)
Kheshgi, H. S. and Prince, R. C. (2005). Sequestration of fermentation CO₂ from ethanol production. Energy, 30, 1865–1871 (2005)
EPE — WebMap: existing gas pipelines, as published in the MapBiomas infrastructure database (distance to pipeline) (2022)
IBGE — Municipal Mesh 2025 (2025)
Extent
São Paulo State (SP)
CRS / Projection
SIRGAS 2000 (EPSG:4674)
EPSG:4674
Software
Node.js · d3-geo · QGIS
Method
São Paulo’s anhydrous and hydrous ethanol output in the 2025/26 harvest (ANP, by month) shared out among mills by their authorised capacity in each month, converted to mass by the density in the ANP specification and to CO₂ by the stoichiometry of alcoholic fermentation (0.955 kg of CO₂ per kg of ethanol); summed by municipality.
Version
v1.0.0
Licence
CC BY 4.0
DOI
being registered on Zenodo

Downloads

Figure to reuse

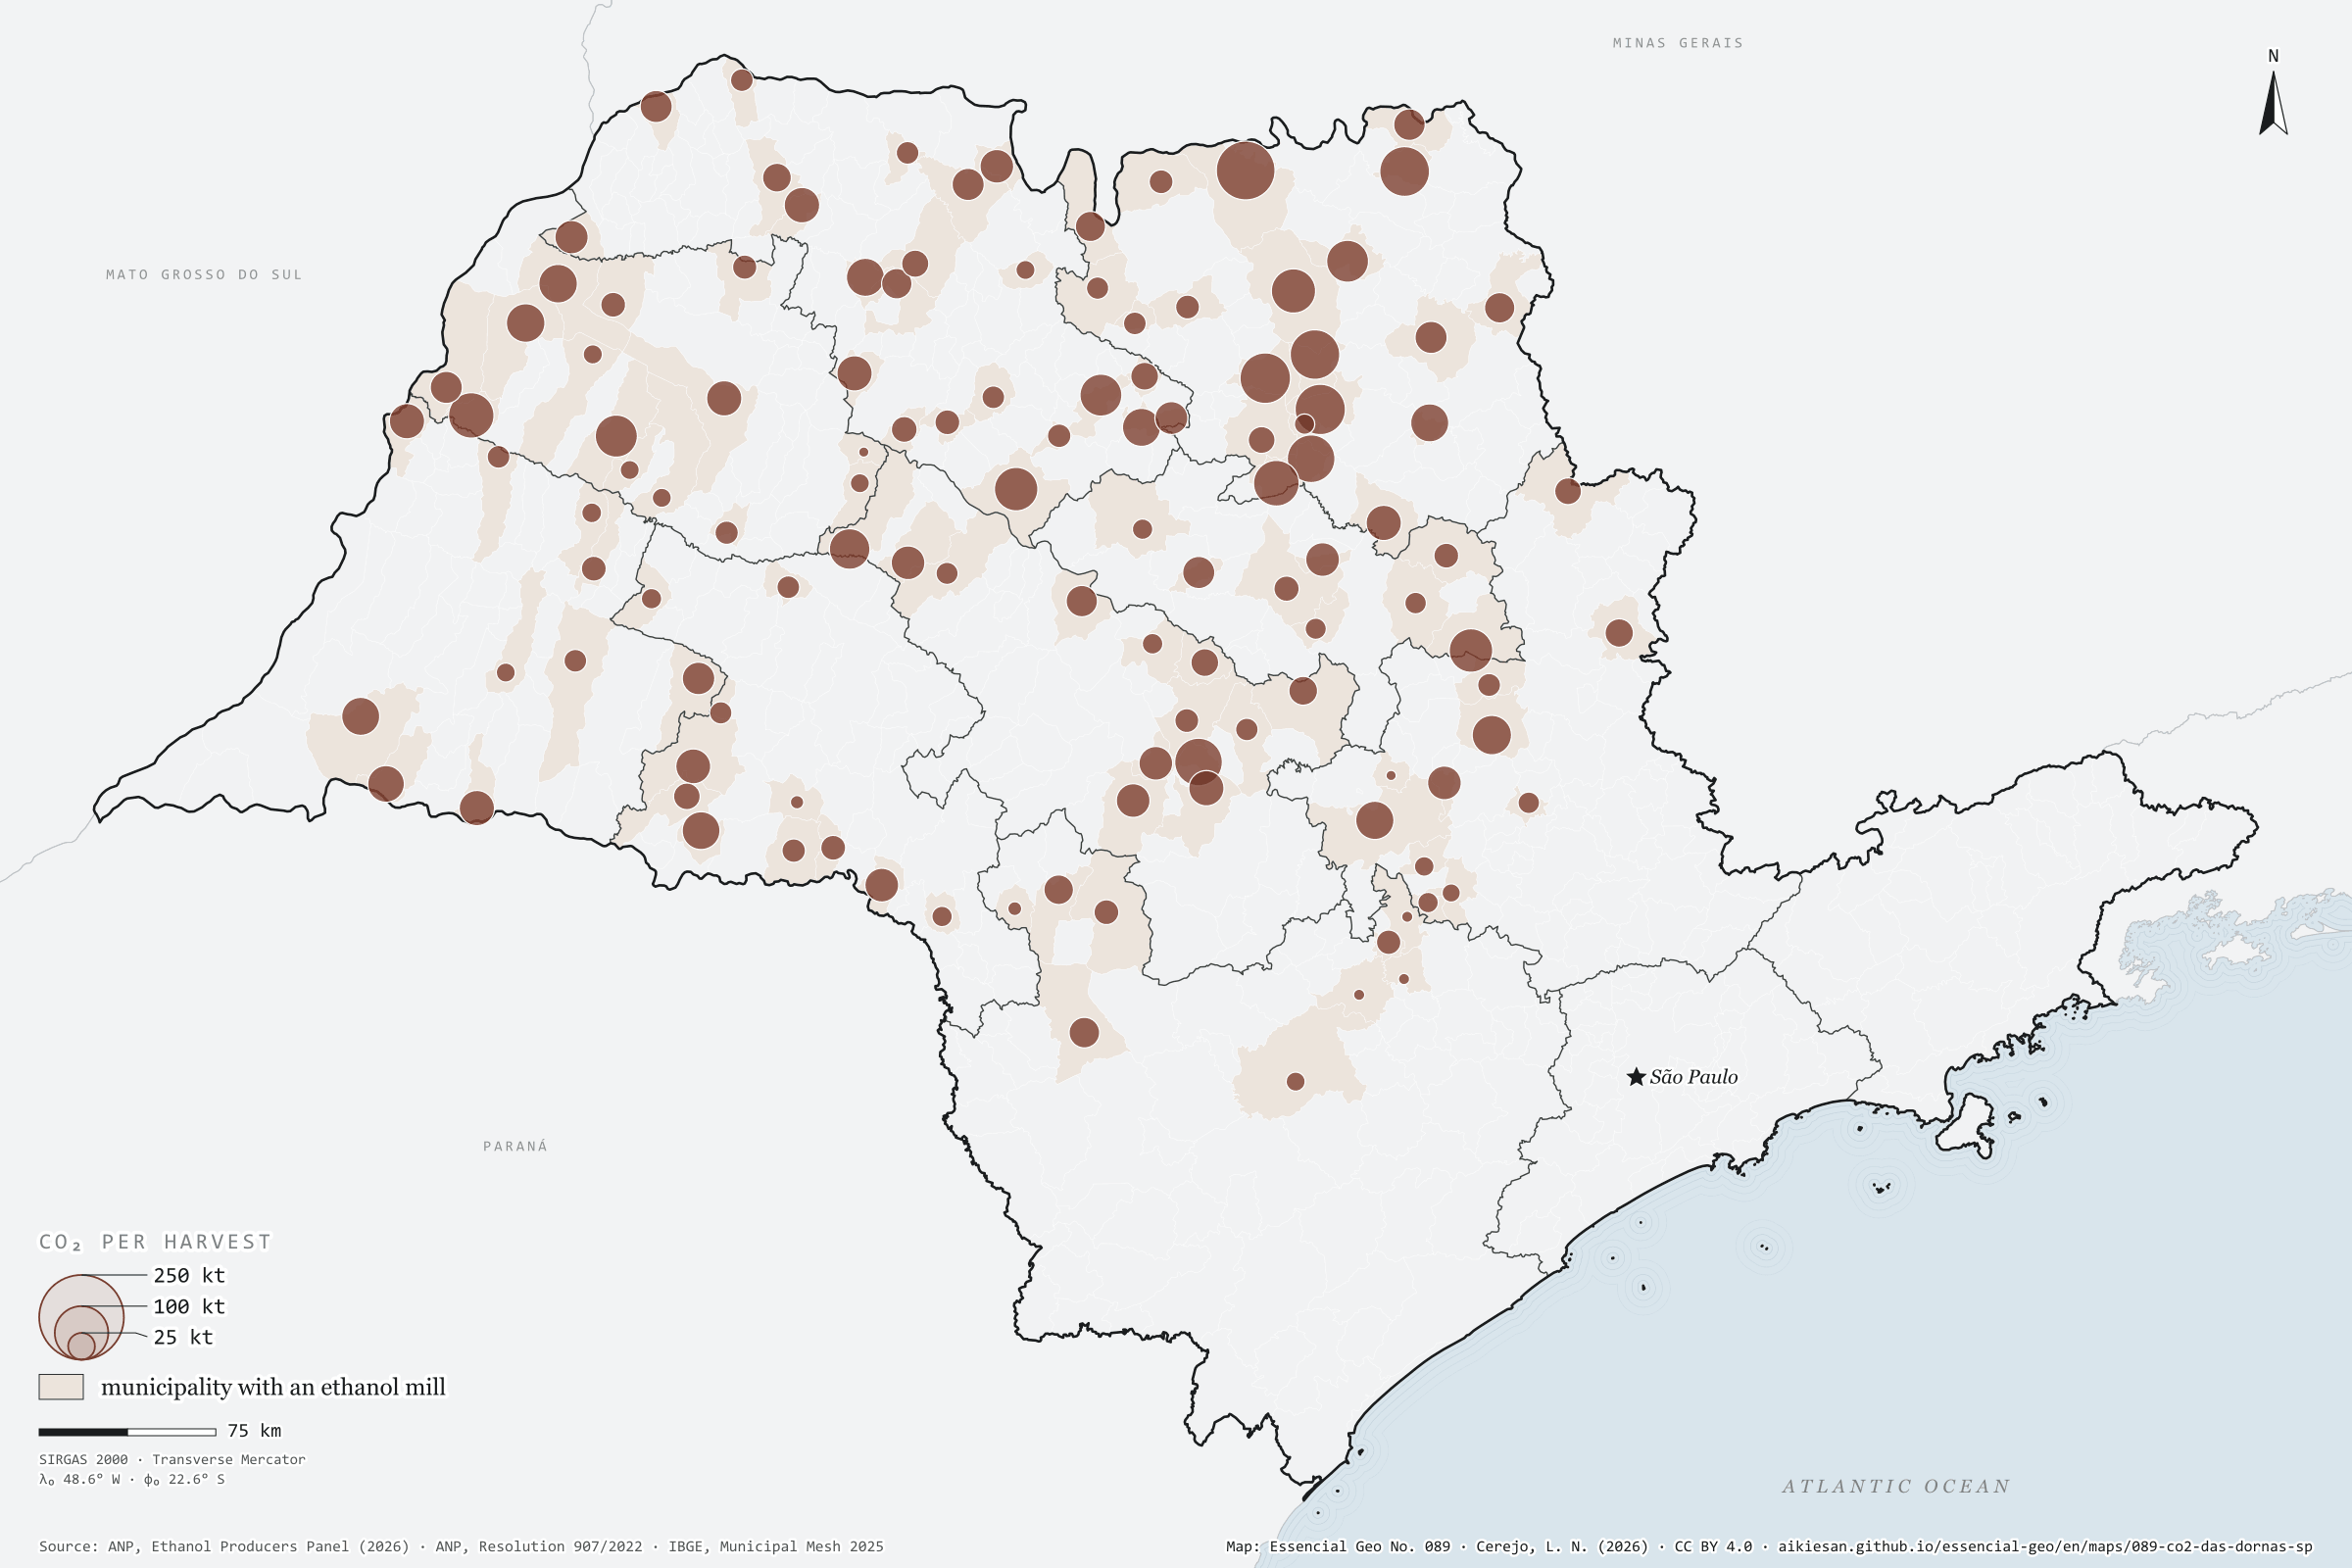
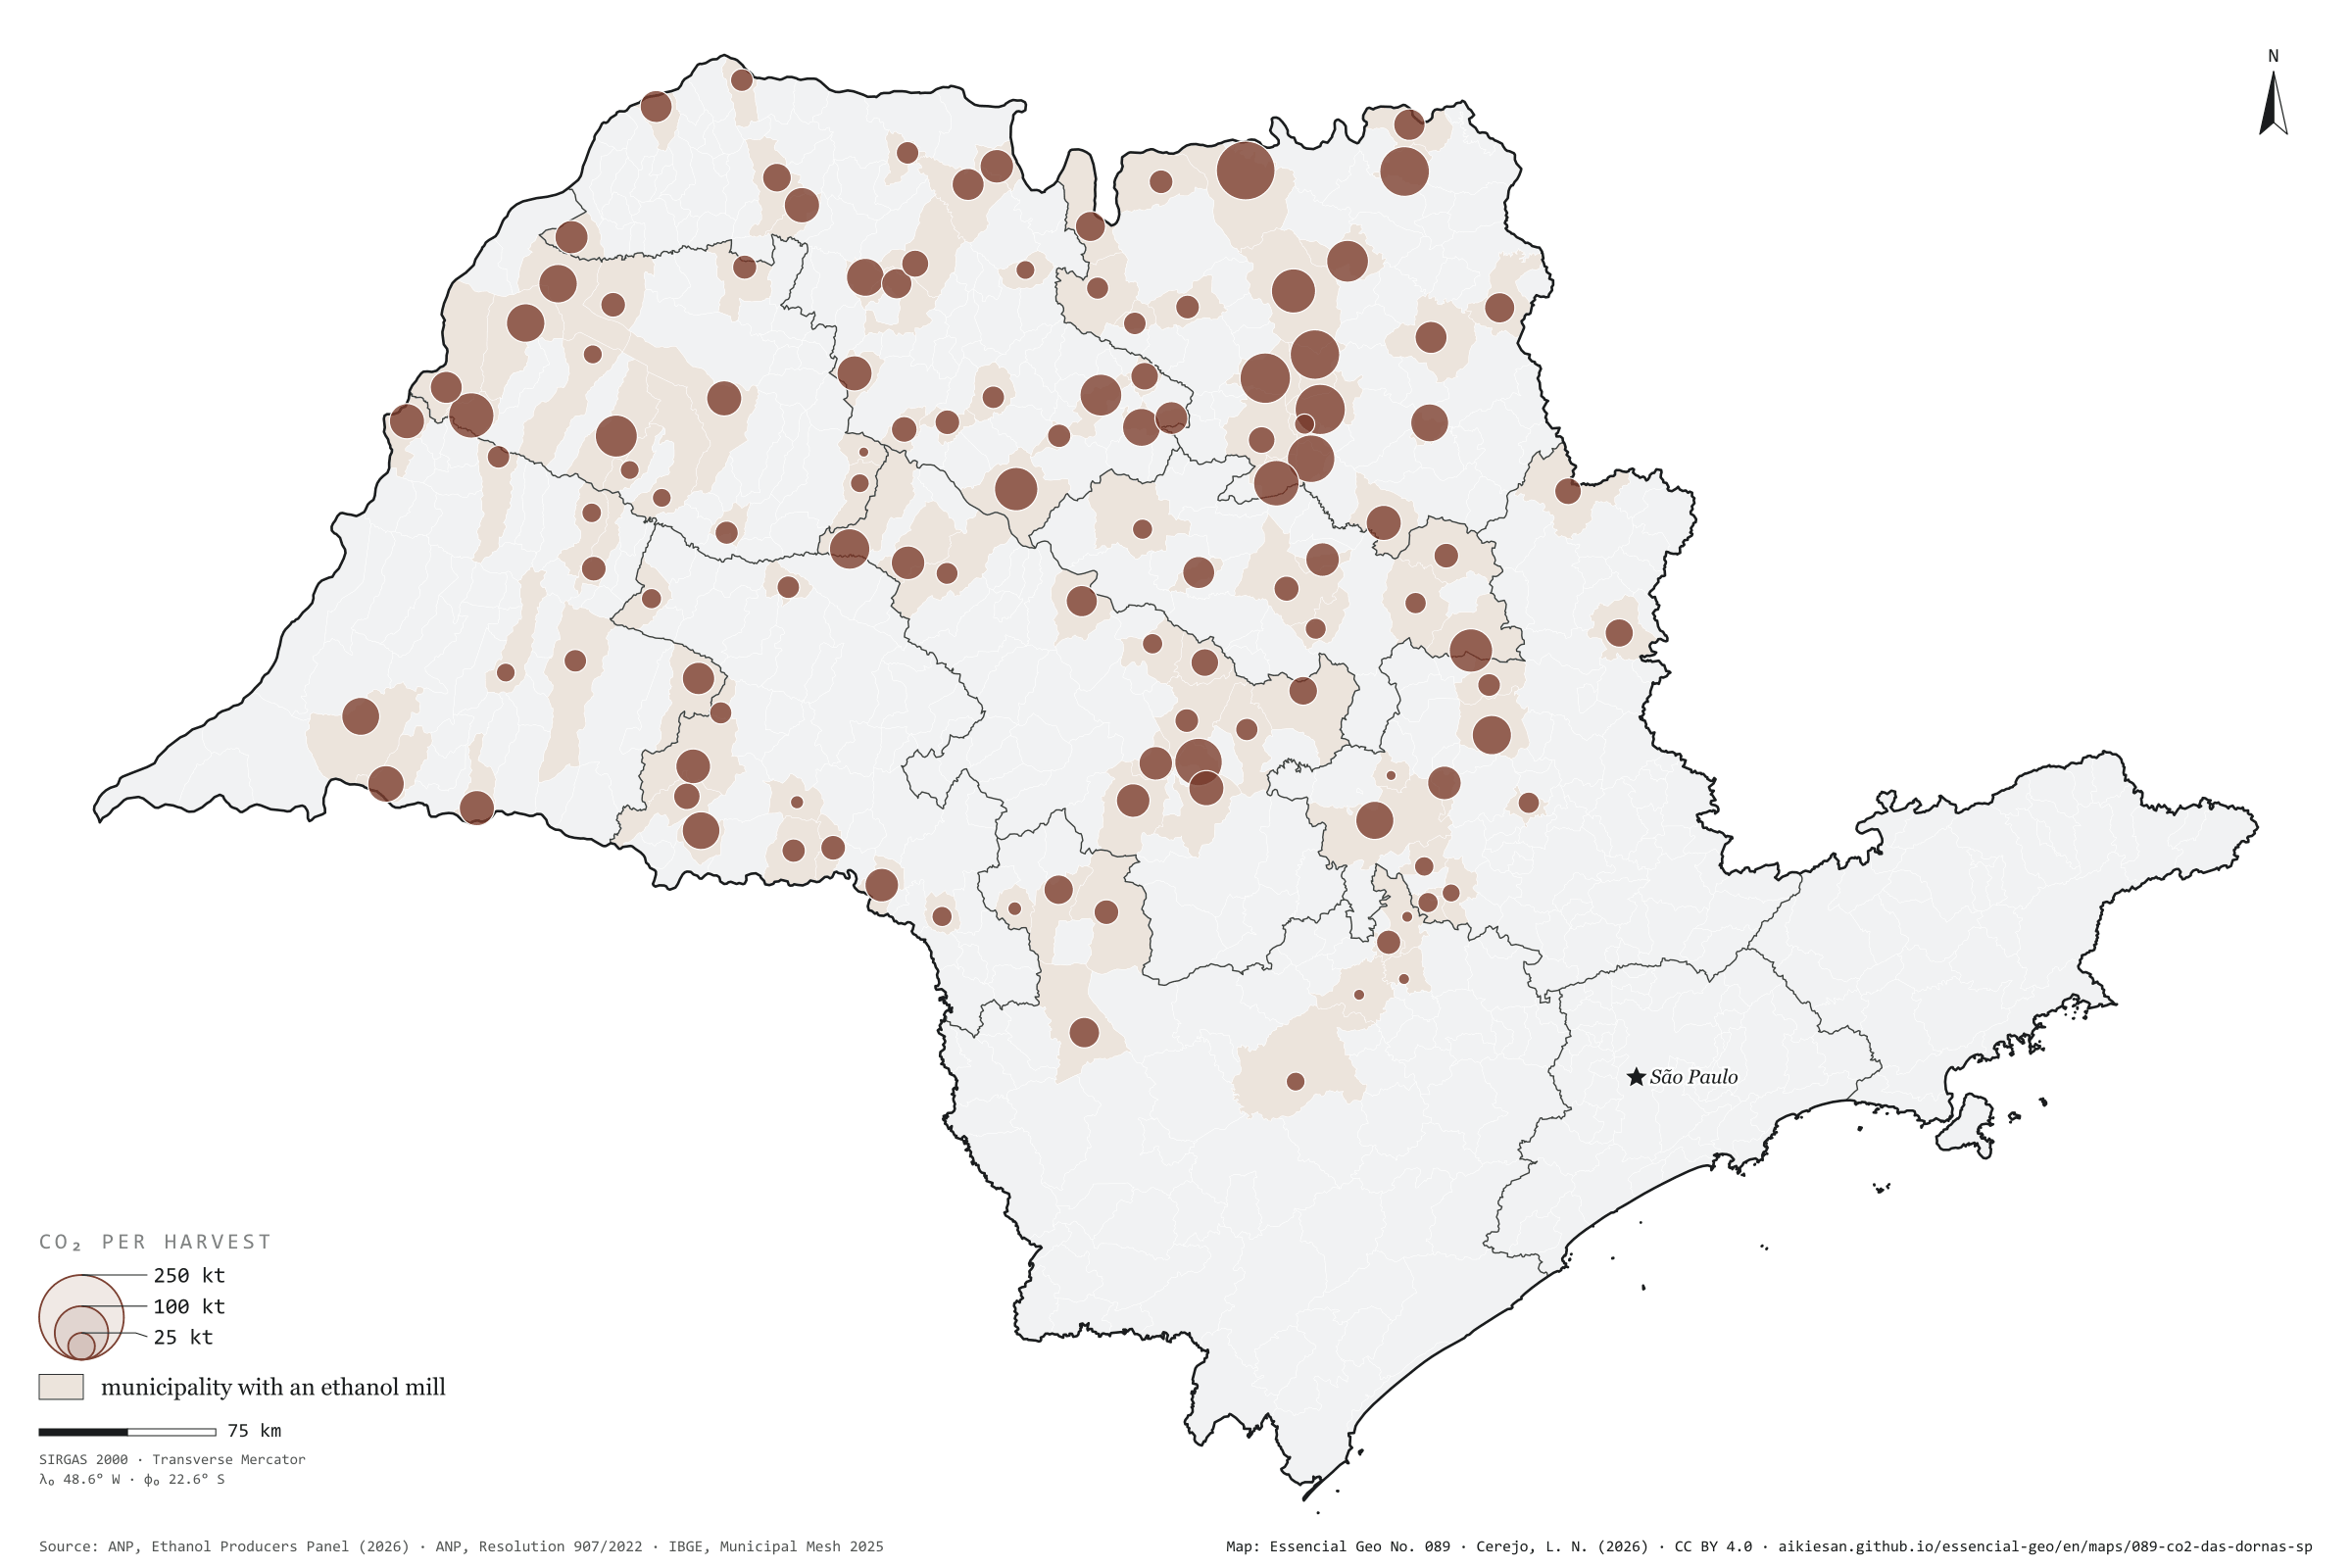
The map without a frame, with legend, scale, reference system and credit written on it: ready for papers, lectures and slides. In two versions: with the basemap (neighbours and sea) or only the mapped area, on white.

Point a camera at it to open this page.

How to cite

Cerejo, L. N. (2026). O CO₂ das dornas: toda usina de etanol solta um gás quase puro, que hoje vai para o ar [The CO₂ from the vats: Every ethanol mill gives off an almost pure gas that now goes into the air] (Version 1.0.0) [Data set]. Essencial. https://aikiesan.github.io/essencial-geo/en/maps/089-co2-das-dornas-sp/

How to read this plate area, projection, scale, legend and source · 3 terms
1 Area
São Paulo State (SP) The area the plate covers. Outside it, neighbours and sea are drawn in grey, just for orientation.
2 Coordinates and projection
SIRGAS 2000 (EPSG:4674) The layers are in SIRGAS 2000; the drawing’s projection is written in the colophon at the foot of the panel.
3 Scale
Graphic scale bar in the panel The scale bar is true on the central meridian; away from it, measured distances vary a little.
4 Legend and layers
2 layers in the GeoPackage · point, polygon Read the legend before the map: it tells you whether a colour is a rate or a class, and whether a circle is a total.
5 Sources
ANP (2026); ANP (2022); Kheshgi, H. S. and Prince, R. C. (2005). Sequestration of fermentation CO₂ from ethanol production. Energy, 30, 1865–1871 (2005); EPE (2022); IBGE (2025) Every figure comes from a public source, with its year. The data sheet gives each one’s address.

Terms on this plate

Harvest year
Cane years are not calendar years: in the Centre-South the harvest runs from April to March; in the Northeast, from September to August. That is why the two regions crush in opposite months.
Biogenic CO₂
CO₂ from recently grown biomass, such as that from ethanol fermentation and biogas upgrading: it returns to the air what the plant took shortly before. It can be captured and used.
ANP
Brazil’s National Agency of Petroleum, Natural Gas and Biofuels: it licenses ethanol and biodiesel plants, tracks filling-station sales and sets the biomethane specification.

Download

Layers, table and figures, under CC BY 4.0. Cite with the DOI.

Full record and citation

Method notes · No. 089

The CO₂ from ethanol vats in São Paulo

Português · English

Plate No. 089, the first of four in the collection Biogenic carbon: how much CO₂ ethanol fermentation releases in each São Paulo municipality in one harvest.

What the files contain

  • dados/sp_co2_fermentacao_usinas.csv: one row per mill, with CNPJ (company tax number), company name, municipality, authorised anhydrous and hydrous capacity (m³/day), months with capacity in the harvest, share of the apportionment (%), estimated ethanol (m³), estimated CO₂ (t) and the municipality’s distance to the nearest gas pipeline (km).
  • sp_carbono_biogenico.gpkg.zip (in the carbono-sp-2026 release): the same GPKG as plates 089 to 092. This plate uses the usinas_etanol layer (style co2) and, in the municipios layer, the fields usinas_etanol, etanol_m3_safra, co2_fermentacao_t and co2_fermentacao_2024_t.

Method

  1. Output: ANP publishes anhydrous and hydrous ethanol output by state and month. We summed São Paulo’s from April 2025 to March 2026 (the 2025/26 harvest): 5,141,755 m³ of anhydrous and 6,952,582 m³ of hydrous. For plate 091 we also used the year 2024: 13,729,549 m³.
  2. Apportionment: the same database gives, month by month, each mill’s authorised capacity. A mill’s weight is the sum, over the harvest months, of the larger of its two capacities (anhydrous or hydrous); the state’s output is divided by that weight.
  3. Mass: anhydrous at 785.96 kg of ethanol per m³ (791.5 kg/m³, the density limit at 20 °C, times 99.3% m/m, the minimum content); hydrous at 756.07 kg of ethanol per m³ (density 805.2 to 811.2 kg/m³ with 92.5 to 94.6% m/m ethanol, at the mid-points). Source: ANP Resolution No. 907/2022, Table 1.
  4. CO₂: in alcoholic fermentation, C₆H₁₂O₆ → 2 C₂H₅OH + 2 CO₂. With IUPAC molar masses (CO₂ 44.009 g/mol, ethanol 46.068 g/mol), this gives 0.9553 kg of CO₂ per kg of ethanol, as in Kheshgi and Prince (2005): 0.751 t of CO₂ per m³ of anhydrous and 0.722 t per m³ of hydrous.
  5. Distance: from the municipality’s interior point to the nearest transmission or distribution pipeline (EPE, via MapBiomas, the same database as plate 057).

A correction on the coefficient: the “about 0.76” figure often quoted is per litre of ethanol, not per kg. By mass, stoichiometry gives 0.955 kg of CO₂ per kg of ethanol; by volume, 0.955 × 0.79 kg/L ≈ 0.75 kg of CO₂ per litre.

Data downloaded

Limitations

  • It is an estimate. Each mill’s actual output is not public; apportioning by authorised capacity assumes all mills use the same share of their capacity over the harvest.
  • Each mill’s point is the municipality’s interior point, not the plant. Municipalities with several mills add them all at the same point.
  • Only fermentation CO₂ is counted; the CO₂ from burning bagasse in the boilers, also biogenic, is left out.
  • The CO₂ is released only during crushing, concentrated from May to October: any use or capture would need storage or seasonal operation.
  • In the 2025/26 harvest the feedstock was almost all cane (131 million t) and molasses (7.4 million t); corn ethanol in São Paulo is marginal (24,000 t of corn).

View this map’s folder on GitHub

Technical record

Technical record · No. 089

The CO₂ from the vats

At a glance

Fermentation CO₂ in the 2025/26 harvest

8.9 million t

Largest municipalities (t of CO₂ a harvest)
  • Guaíra 271,110
  • Pitangueiras 200,298
  • Sertãozinho 198,274
  • Buritizal 194,228
  • Pontal 192,609
  • Barra Bonita 178,042

Layers

  • usinas_etanol point 145 SP mills with authorised capacity in the harvest: estimated ethanol and CO₂, at the municipality’s interior point
  • municipios polygon 645 municipalities: fermentation CO₂ (2025/26 harvest and 2024), biogas, fossil and possible e-methane

Metadata

Sources
ANP — Ethanol Producers Dynamic Panel: authorised capacity by mill and output by state and month (pb-da-etanol.zip) (2026)
ANP — Resolution No. 907/2022, Table 1 (density and alcohol content of anhydrous and hydrous ethanol) (2022)
Kheshgi, H. S. and Prince, R. C. (2005). Sequestration of fermentation CO₂ from ethanol production. Energy, 30, 1865–1871 (2005)
EPE — WebMap: existing gas pipelines, as published in the MapBiomas infrastructure database (distance to pipeline) (2022)
IBGE — Municipal Mesh 2025 (2025)
Extent
São Paulo State (SP)
CRS / Projection
SIRGAS 2000 (EPSG:4674)
EPSG:4674
Software
Node.js · d3-geo · QGIS
Method
São Paulo’s anhydrous and hydrous ethanol output in the 2025/26 harvest (ANP, by month) shared out among mills by their authorised capacity in each month, converted to mass by the density in the ANP specification and to CO₂ by the stoichiometry of alcoholic fermentation (0.955 kg of CO₂ per kg of ethanol); summed by municipality.
Version
v1.0.0
Licence
CC BY 4.0
DOI
being registered on Zenodo

Downloads

Figure to reuse

The map without a frame, with legend, scale, reference system and credit written on it: ready for papers, lectures and slides. In two versions: with the basemap (neighbours and sea) or only the mapped area, on white.

Point a camera at it to open this page.

How to cite

Cerejo, L. N. (2026). O CO₂ das dornas: toda usina de etanol solta um gás quase puro, que hoje vai para o ar [The CO₂ from the vats: Every ethanol mill gives off an almost pure gas that now goes into the air] (Version 1.0.0) [Data set]. Essencial. https://aikiesan.github.io/essencial-geo/en/maps/089-co2-das-dornas-sp/

100%