Skip to content
Essencial

No. 091 Energy · biomass Biogenic carbon 3/4

Biogenic versus fossil

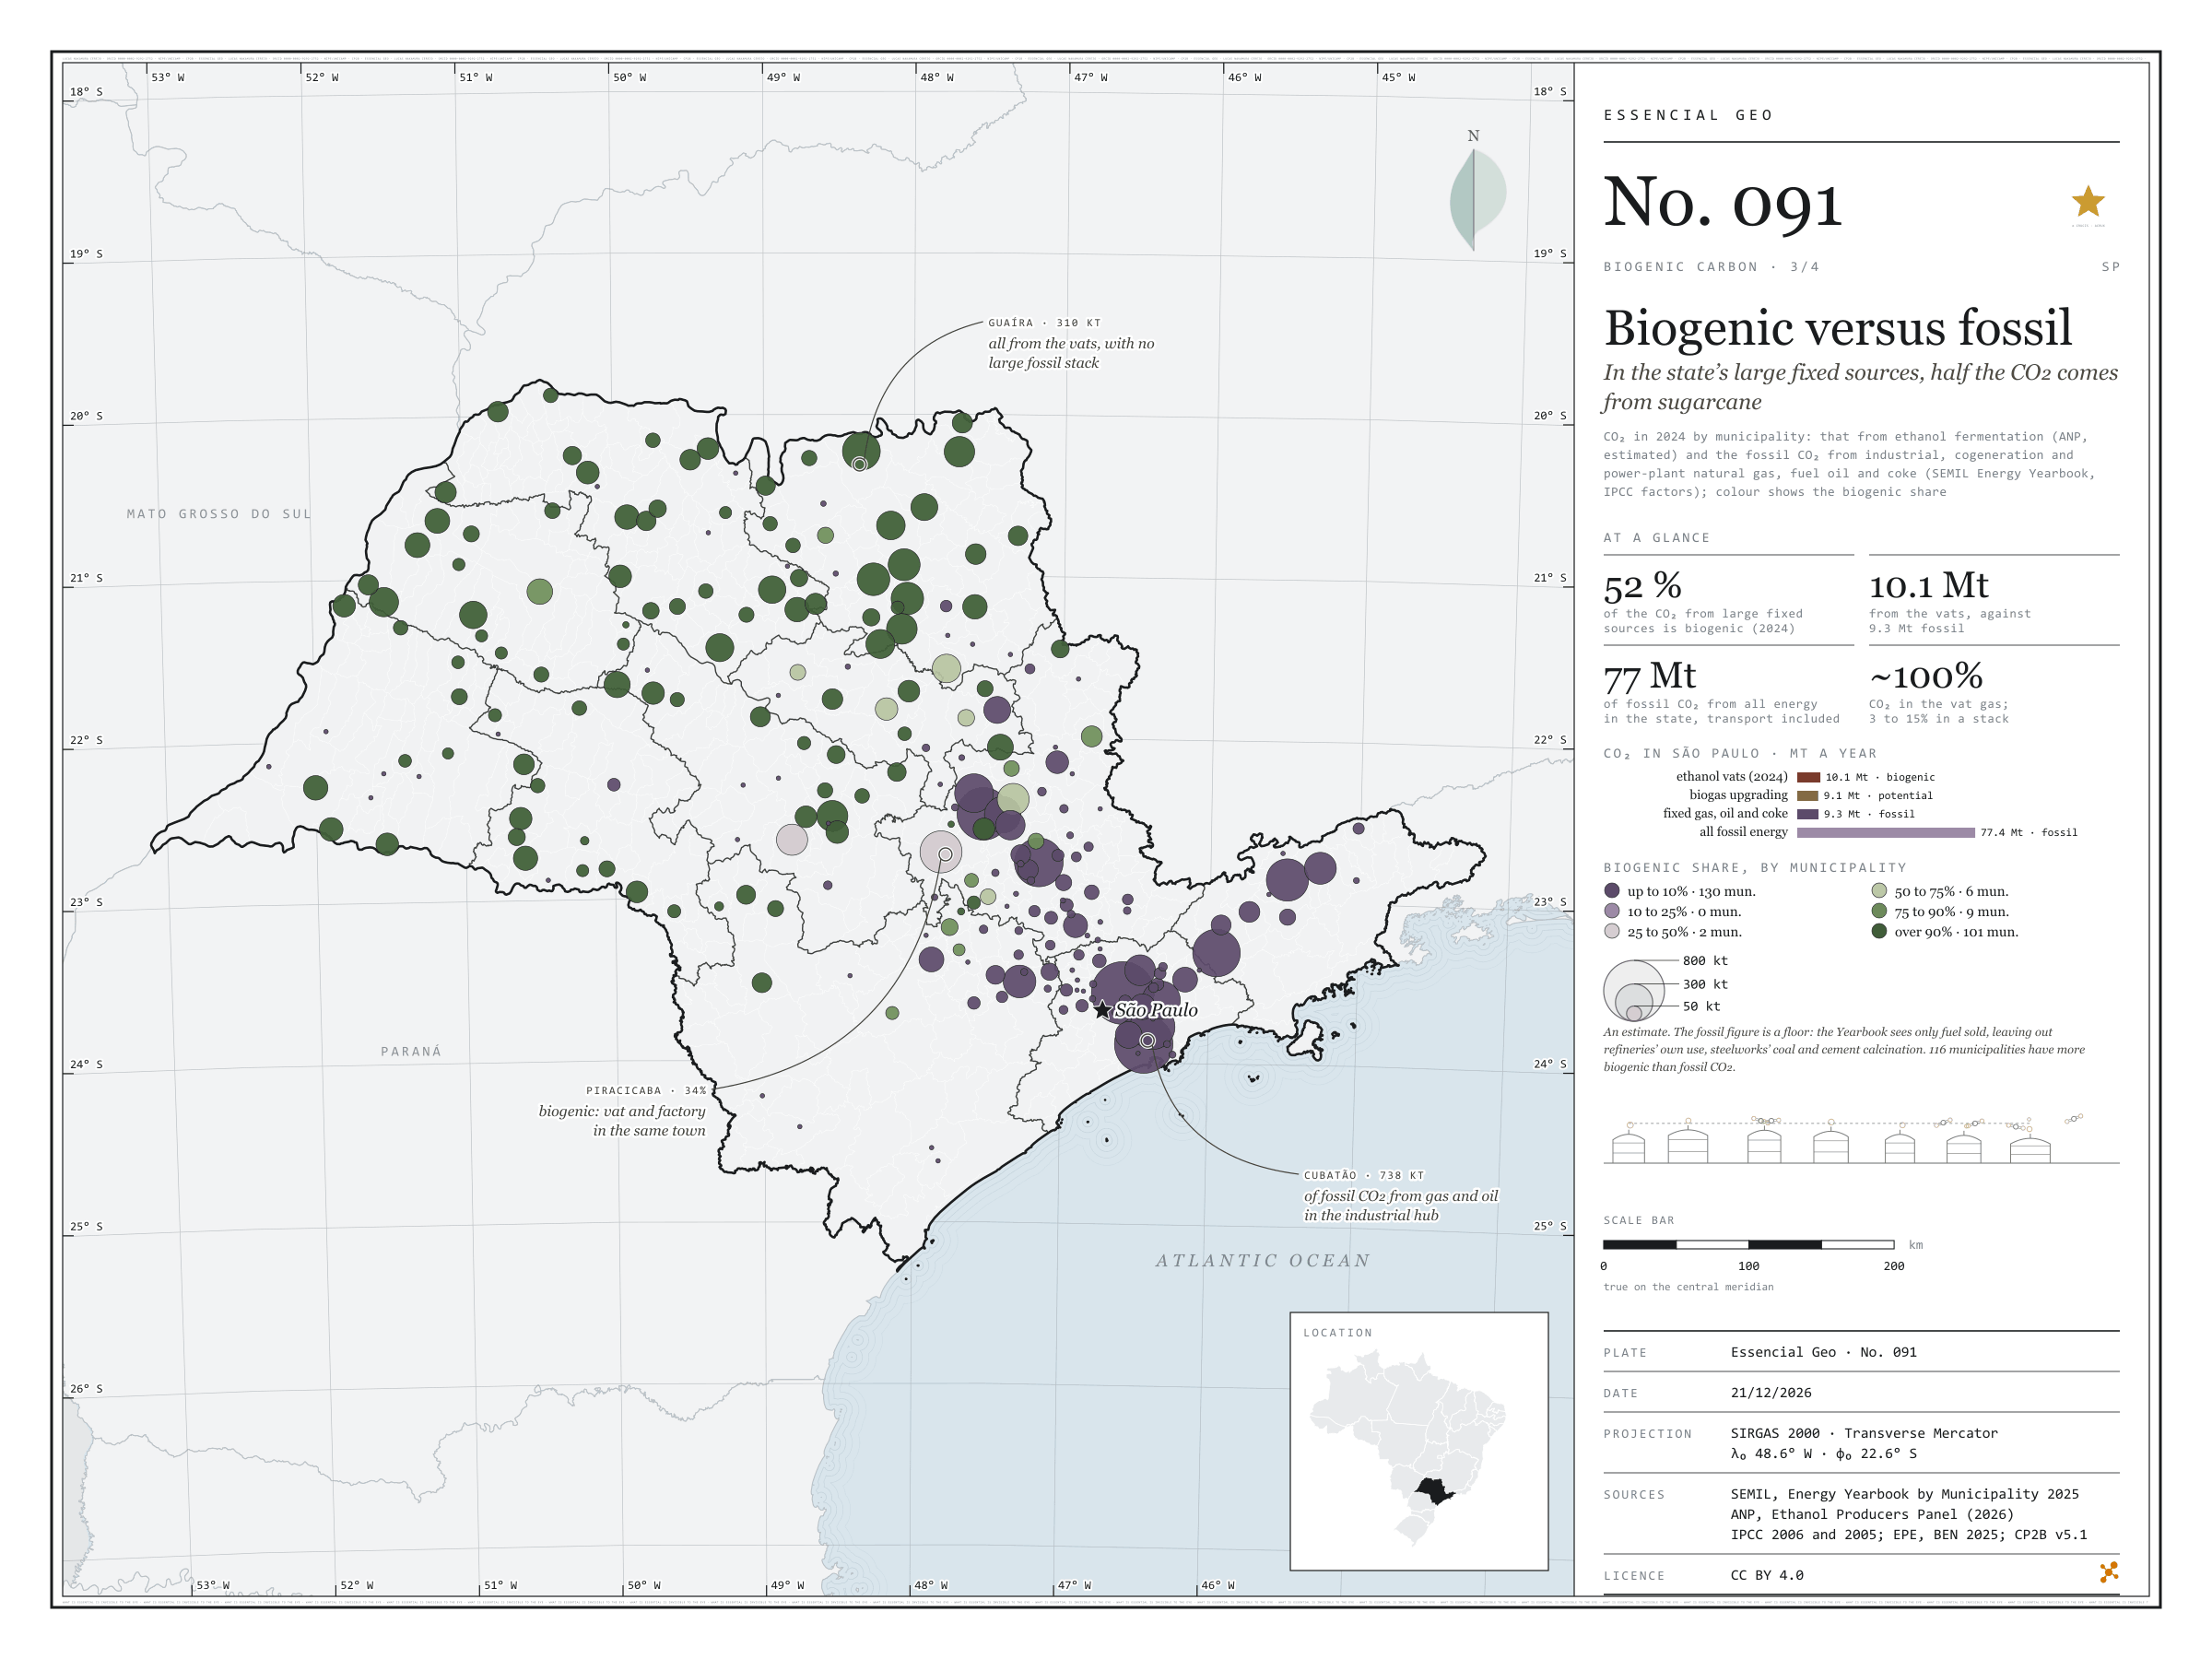
In the state’s large fixed sources, half the CO₂ comes from sugarcane

Record, downloads and citation
Fig. 091 São Paulo State (SP) EPSG:4674 Source: SEMIL (SP), ANP, IPCC (2006), IPCC (2005), EPE, IBGE

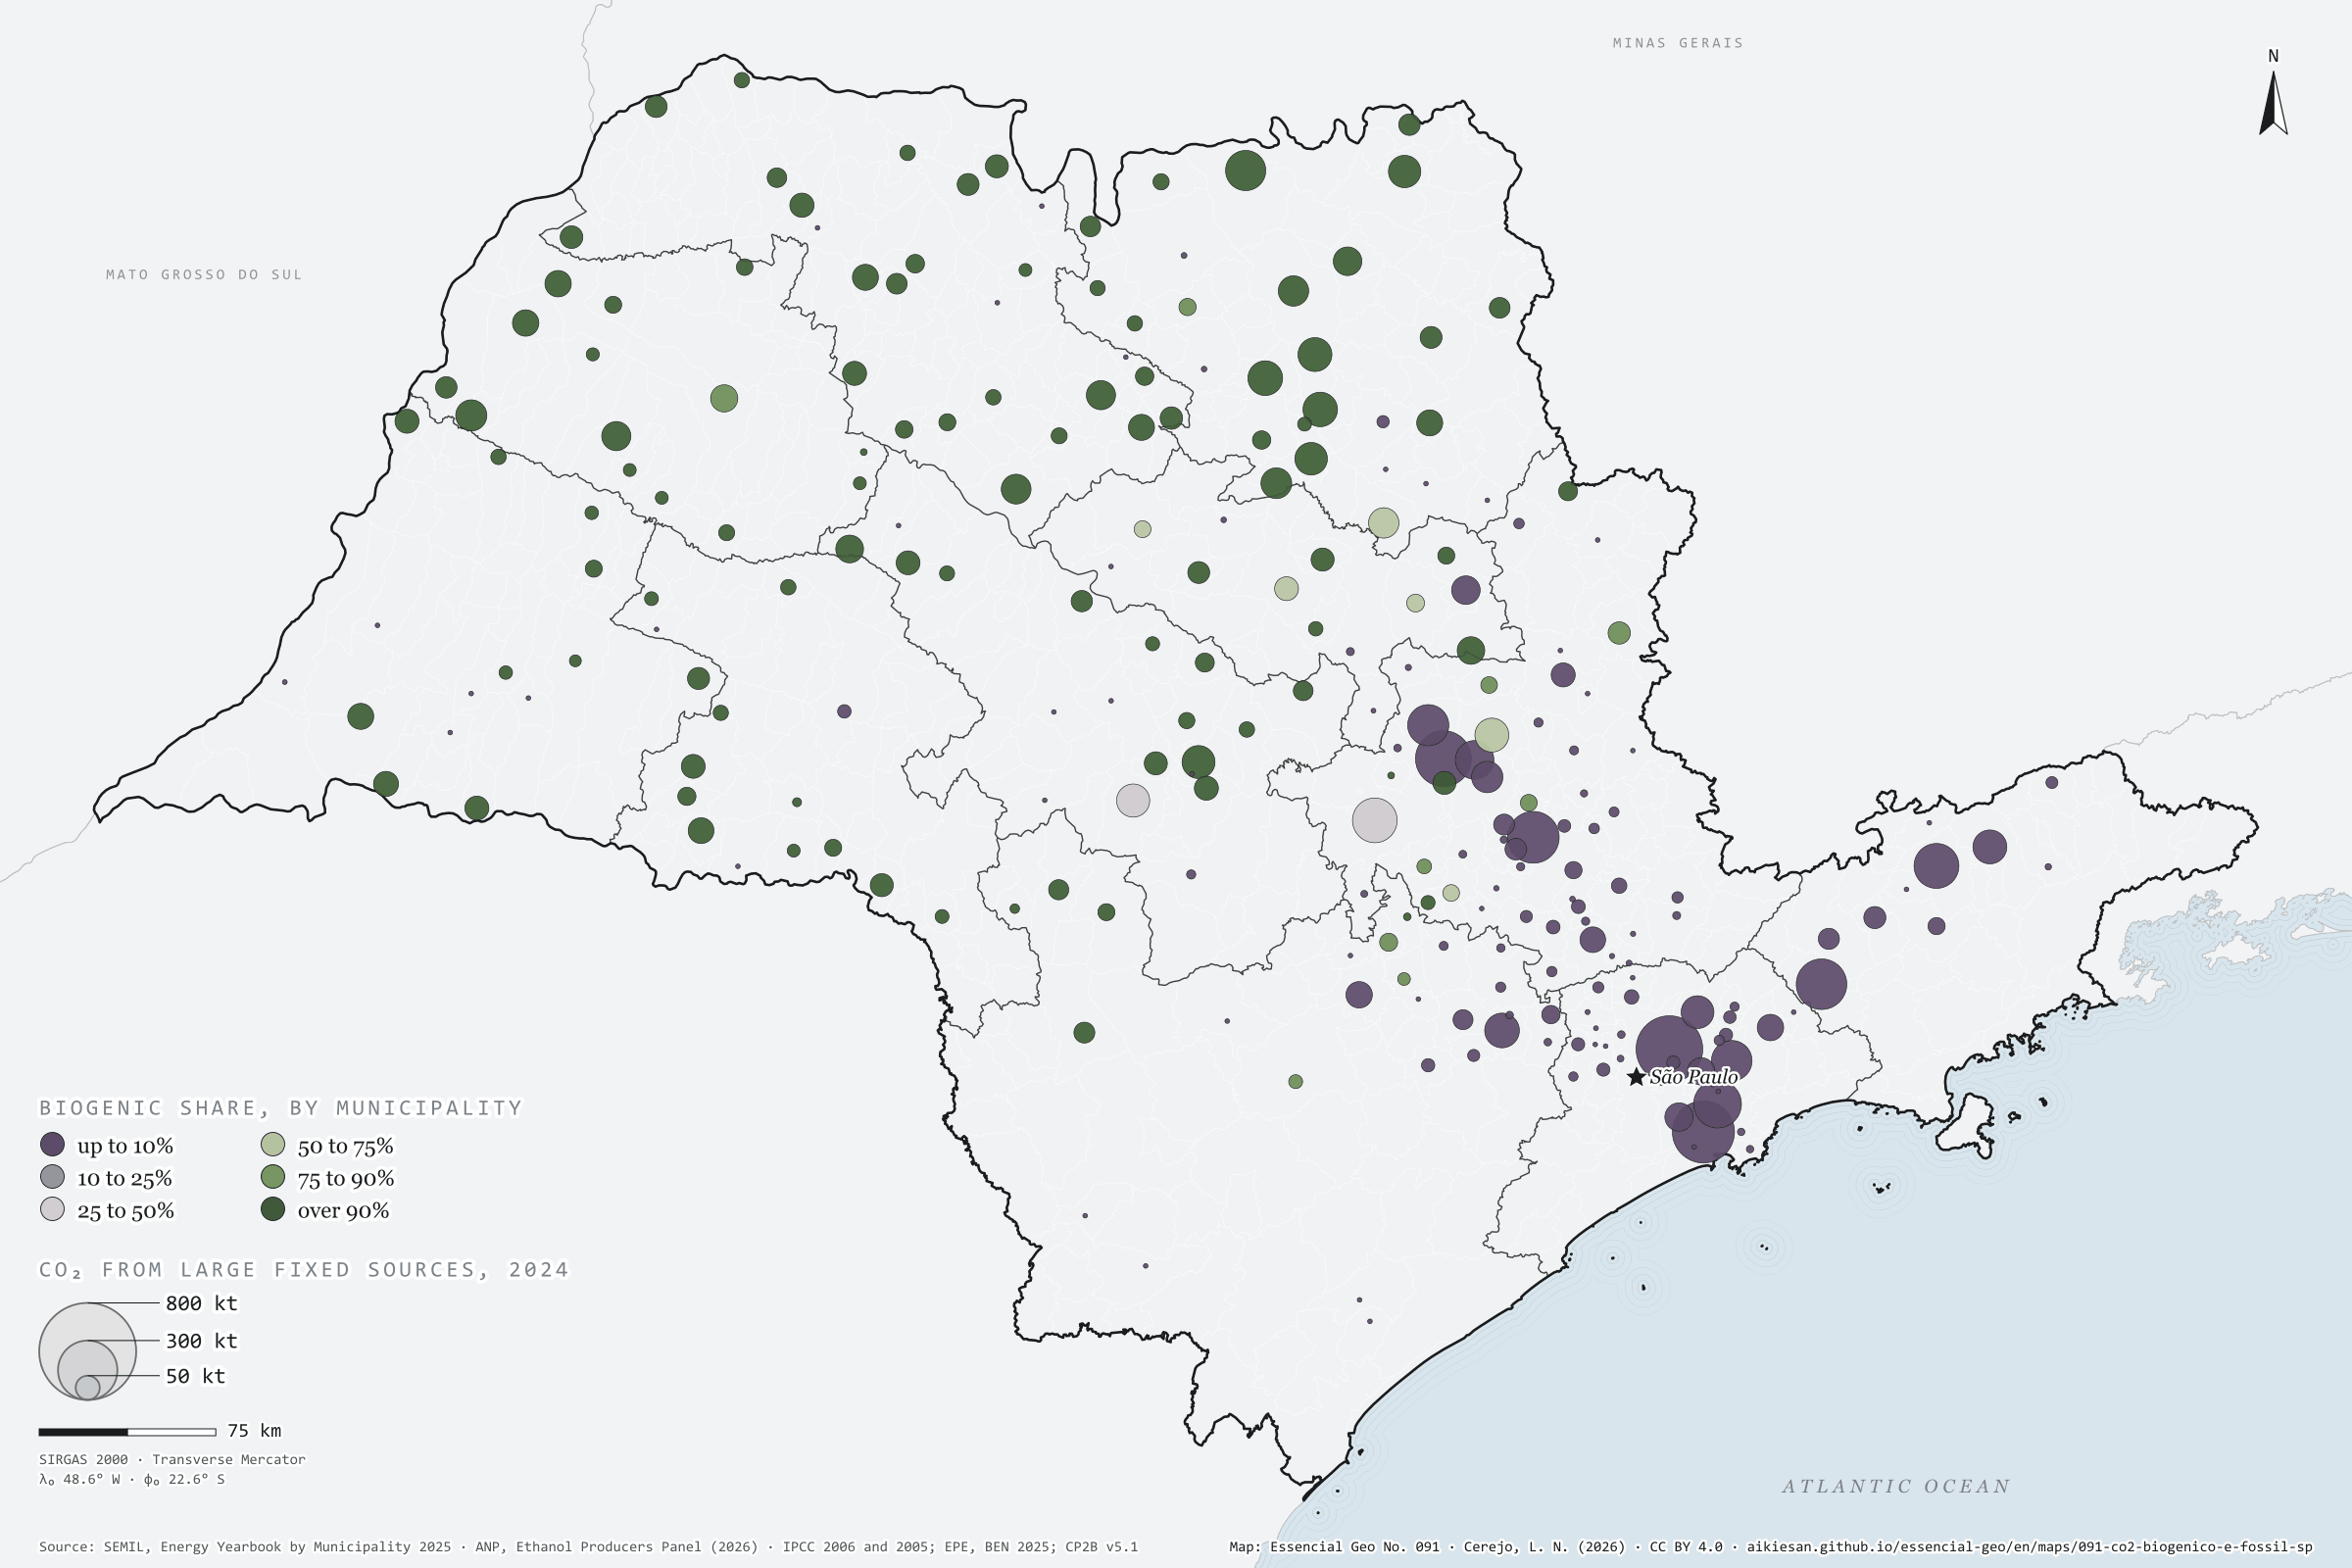
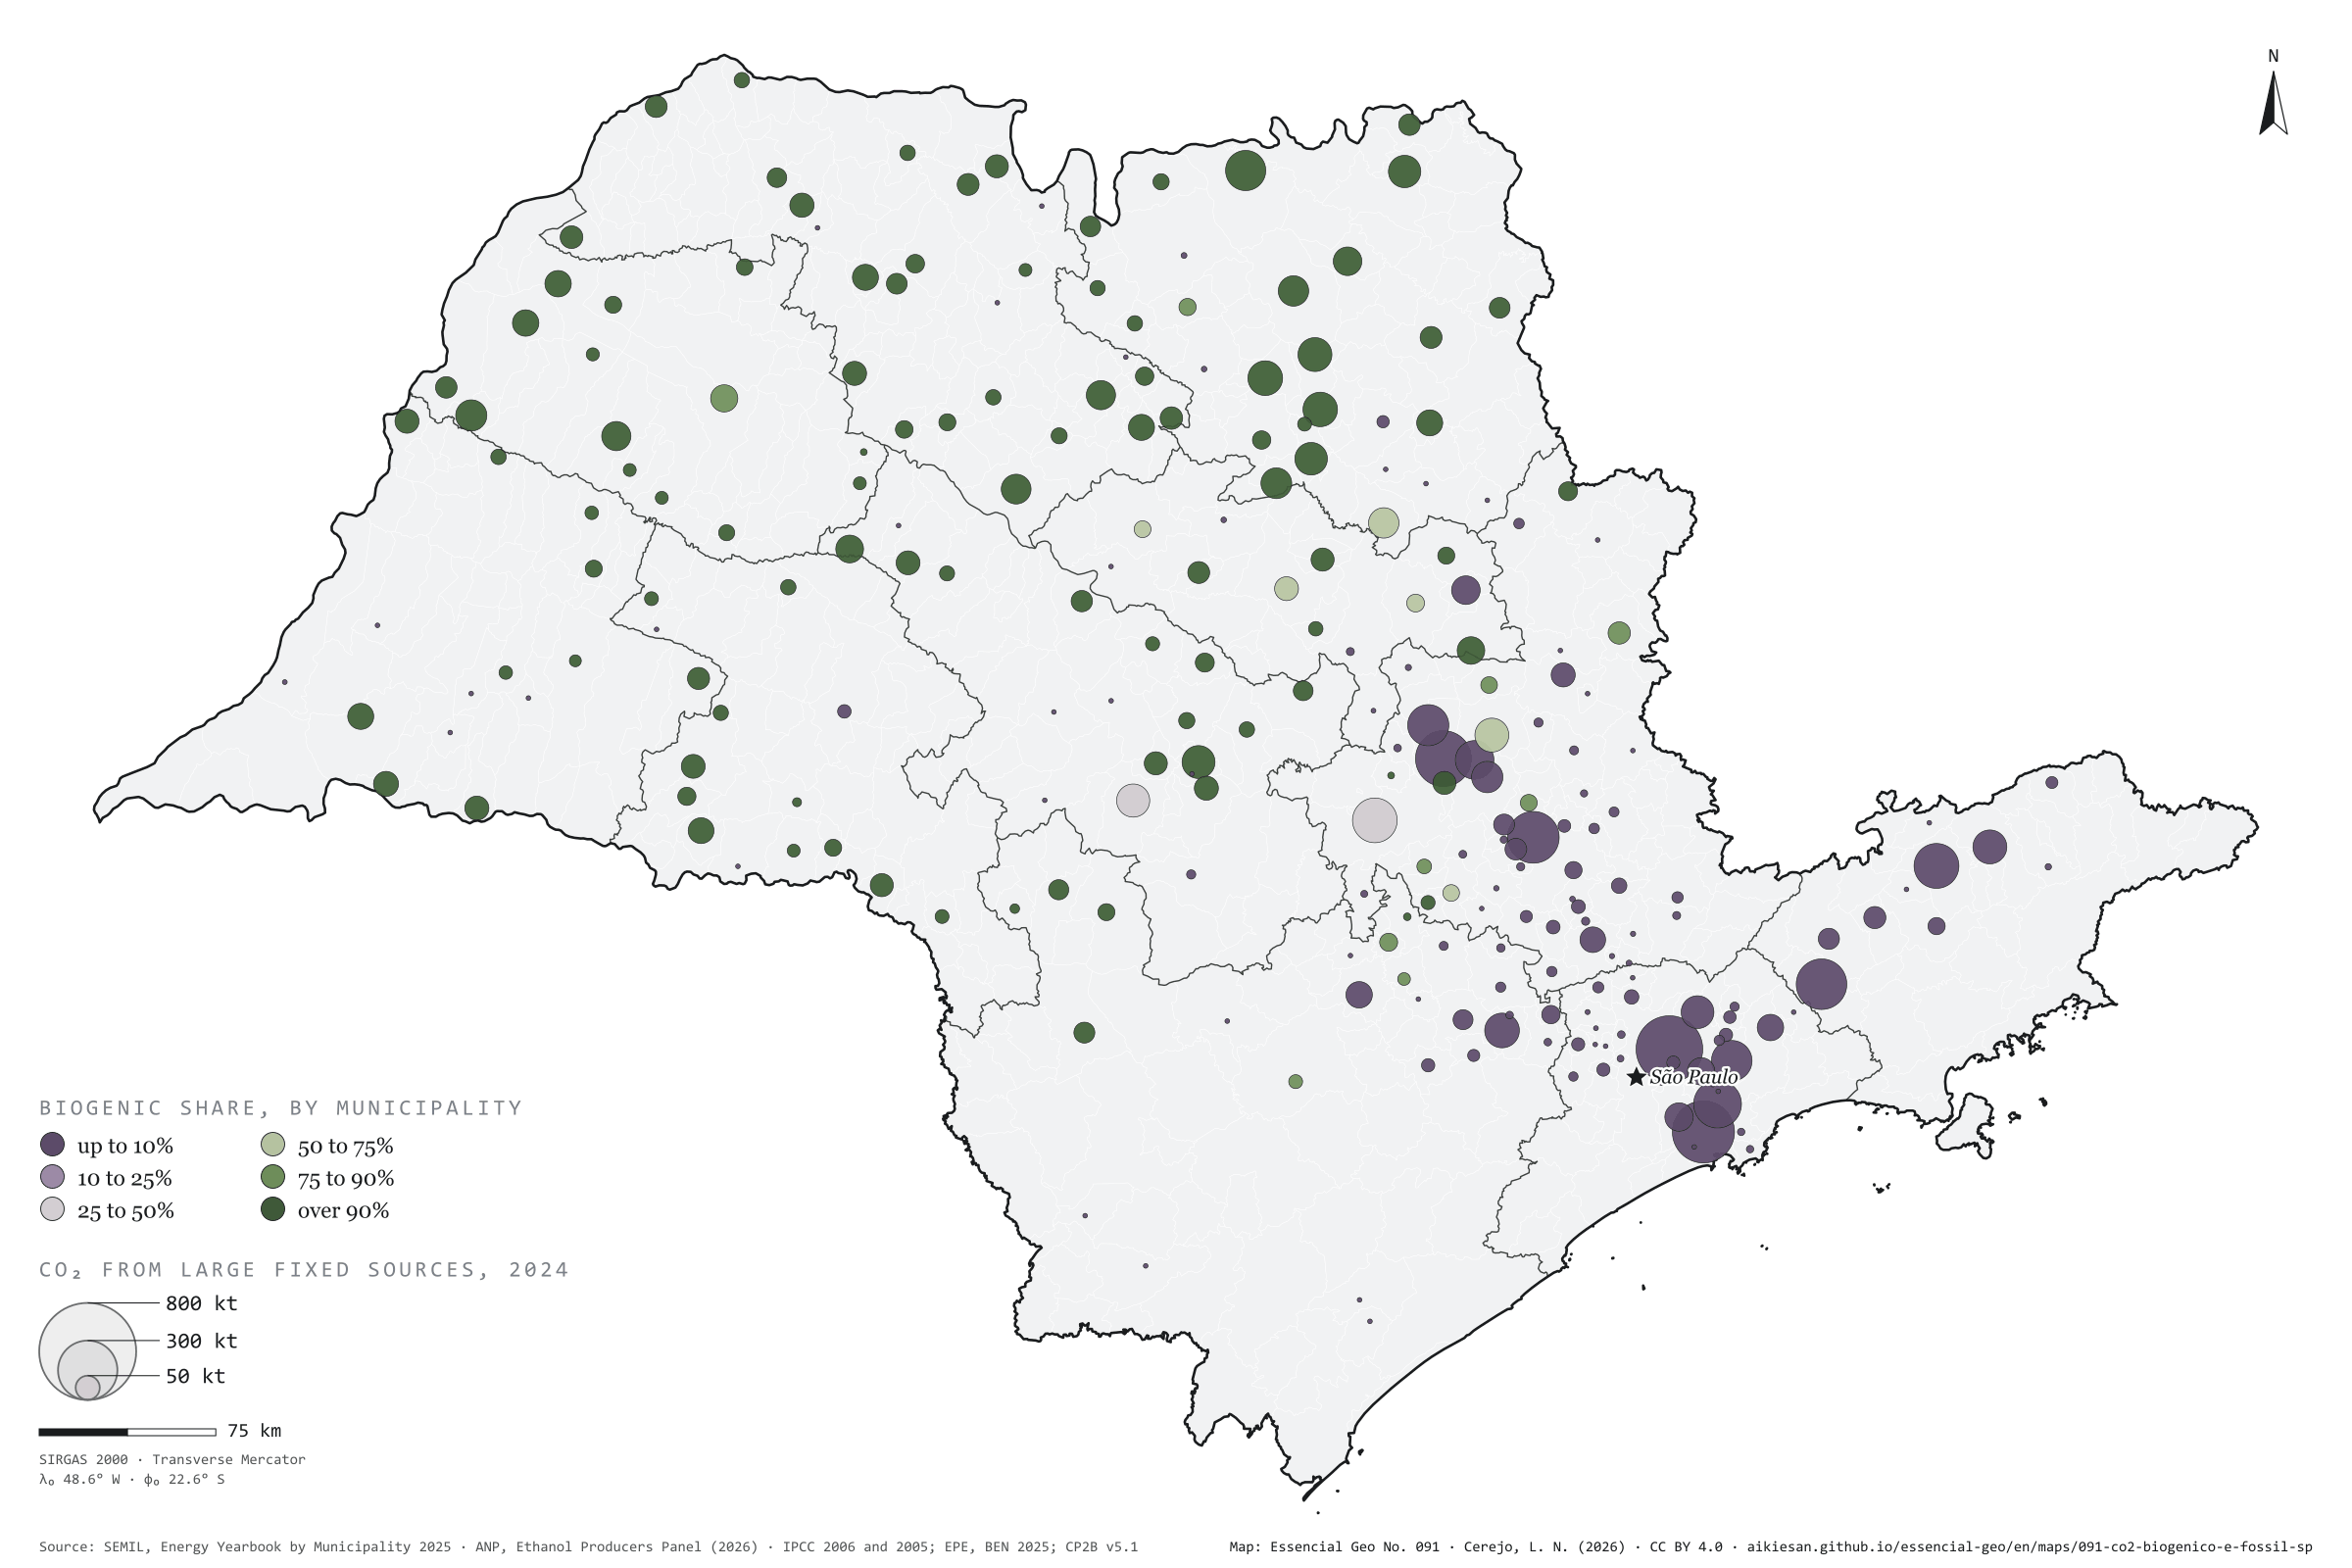
The gas leaving an ethanol vat is almost 100% CO₂; a combustion stack carries 3% to 15%. That is why mills are among the easiest sources to capture. In 2024, São Paulo’s vats released about 10.1 million t of biogenic CO₂. Natural gas burnt by industry, cogeneration and power plants, fuel oil and coke added up to 9.3 million t of fossil CO₂, on the SEMIL Energy Yearbook and IPCC factors. In these large fixed sources, 52% of the CO₂ comes from sugarcane. The map splits: across the cane-growing interior, 116 municipalities have more biogenic than fossil CO₂; fossil CO₂ concentrates in the capital (850,000 t), Cubatão (738,000), Santa Gertrudes, Paulínia and Jacareí. In Piracicaba the two mix: 34% is biogenic. The fossil figure here is a floor. Third plate of the collection “Biogenic carbon”.

Technical record · downloads · citation

At a glance

CO₂ from large fixed sources in 2024 (t)
  • ethanol vats (biogenic) 52.1%
  • gas, oil and coke (fossil) 47.9%
Largest fixed fossil sources (t of CO₂ in 2024)
  • São Paulo 849,580
  • Cubatão 738,384
  • Santa Gertrudes 597,415
  • Paulínia 513,832
  • Jacareí 489,794

Layers

  • municipios polygon 645 municipalities: fossil CO₂ (gas, oil, coke and all energy), vat CO₂ in 2024 and biogenic share (same GPKG as plate 089)

Metadata

Sources
SEMIL (SP) — Energy Yearbook by Municipality of São Paulo State 2025, base year 2024 (natural gas and oil product use by municipality) (2025)
ANP — Ethanol Producers Dynamic Panel (2024 output and capacity by mill) (2026)
IPCC (2006) — Guidelines for National Greenhouse Gas Inventories, vol. 2, ch. 1, Table 1.4 (stationary combustion CO₂ emission factors) (2006)
IPCC (2005) — Special Report on Carbon Dioxide Capture and Storage, Table 2.1 (CO₂ concentration by source type) (2005)
EPE — Brazilian Energy Balance 2025 (net calorific values) (2025)
IBGE — Municipal Mesh 2025 (2025)
Extent
São Paulo State (SP)
CRS / Projection
SIRGAS 2000 (EPSG:4674)
EPSG:4674
Software
Node.js · d3-geo · QGIS
Method
Fossil CO₂ in 2024 by municipality: industrial, cogeneration and power-generation natural gas use and fuel oil and petroleum coke use (SEMIL Energy Yearbook), times the BEN net calorific value and the IPCC 2006 emission factor; biogenic CO₂ in 2024: ethanol fermentation estimated as in plate 089; biogenic share = biogenic ÷ (biogenic + fossil).
Version
v1.0.0
Licence
CC BY 4.0
DOI
being registered on Zenodo

Downloads

Figure to reuse

The map without a frame, with legend, scale, reference system and credit written on it: ready for papers, lectures and slides. In two versions: with the basemap (neighbours and sea) or only the mapped area, on white.

Point a camera at it to open this page.

How to cite

Cerejo, L. N. (2026). Biogênico contra fóssil: nas grandes fontes fixas do estado, metade do CO₂ vem da cana [Biogenic versus fossil: In the state’s large fixed sources, half the CO₂ comes from sugarcane] (Version 1.0.0) [Data set]. Essencial. https://aikiesan.github.io/essencial-geo/en/maps/091-co2-biogenico-e-fossil-sp/

How to read this plate area, projection, scale, legend and source · 2 terms
1 Area
São Paulo State (SP) The area the plate covers. Outside it, neighbours and sea are drawn in grey, just for orientation.
2 Coordinates and projection
SIRGAS 2000 (EPSG:4674) The layers are in SIRGAS 2000; the drawing’s projection is written in the colophon at the foot of the panel.
3 Scale
Graphic scale bar in the panel The scale bar is true on the central meridian; away from it, measured distances vary a little.
4 Legend and layers
1 layer in the GeoPackage · polygon Read the legend before the map: it tells you whether a colour is a rate or a class, and whether a circle is a total.
5 Sources
SEMIL (SP) (2025); ANP (2026); IPCC (2006) (2006); IPCC (2005) (2005); EPE (2025); IBGE (2025) Every figure comes from a public source, with its year. The data sheet gives each one’s address.

Terms on this plate

Biogas
The gas from the airless breakdown (anaerobic digestion) of organic waste: manure, vinasse, sewage sludge, rubbish. It is 50% to 70% methane; the rest is mostly CO₂.
Biogenic CO₂
CO₂ from recently grown biomass, such as that from ethanol fermentation and biogas upgrading: it returns to the air what the plant took shortly before. It can be captured and used.

Download

Layers, table and figures, under CC BY 4.0. Cite with the DOI.

Full record and citation

Method notes · No. 091

Biogenic and fossil CO₂ in São Paulo’s large fixed sources

Português · English

Plate No. 091, the third of four in the collection Biogenic carbon: how much of the state’s concentrated CO₂ comes from sugarcane, and how much from burning fossil fuel in fixed sources.

What the files contain

  • dados/sp_carbono_municipios.csv: this plate’s fields are co2_fermentacao_2024_t, co2_fossil_gas_t, co2_fossil_oleo_t, co2_fossil_coque_t, co2_fossil_estacionario_t (the sum of the three), co2_fossil_energia_t (CO₂ from all energy, from the Yearbook’s Table 9) and pct_biogenico_grandes, empty where there is neither a vat nor a fixed fossil source.
  • sp_carbono_biogenico.gpkg.zip (in the carbono-sp-2026 release): in the municipios layer, the pct_biogenico and co2_fossil_estacionario styles.

Method

  1. Fossil use: from the Energy Yearbook by Municipality 2025 (base year 2024), natural gas for the industrial, cogeneration and power-generation sectors (Table 4, in m³) and fuel oil and petroleum coke (oil products table, in kg). Residential, commercial and vehicle gas is left out: these are small, scattered sources.
  2. Factors: natural gas at 8,800 kcal/m³, fuel oil at 9,590 kcal/kg and coke at 8,390 kcal/kg (net calorific values from BEN 2025), times 56,100, 77,400 and 97,500 kg of CO₂ per TJ (IPCC 2006, vol. 2, Table 1.4): 2.067 kg of CO₂ per m³ of gas, 3.108 kg per kg of oil and 3.425 kg per kg of coke.
  3. Biogenic: fermentation CO₂ in 2024, estimated as in plate 089, with that year’s output (13.7 billion litres).
  4. Biogenic share: biogenic ÷ (biogenic + fixed fossil), in the 248 municipalities with at least one of the two. Statewide, 10.1 ÷ (10.1 + 9.3) = 52.1%.
  5. Purity: the IPCC (2005, Table 2.1) gives about 100% CO₂ in bioethanol fermentation gas, against about 3% to 15% in combustion flue gases.
  6. Check: the municipal natural gas total matches the state row in the Yearbook’s Table 3 (4.78 billion m³), and CO₂ from all energy matches Table 7 (77.4 million t).

Data downloaded

Limitations

  • The fossil figure is a floor, and the biogenic share a ceiling. The Yearbook sees fuel sold in each municipality; refineries’ own use (Paulínia, Cubatão, São José dos Campos, Mauá), mineral coal and coke in steelmaking, and process CO₂ from cement and lime calcination, which does not come from fuel, are all left out.
  • CO₂ from burning bagasse in the mills’ boilers, also biogenic, is not included: only fermentation CO₂, which is the concentrated stream.
  • Fermentation is estimated, not measured (see plate 089), and each municipality’s point is its interior point, not the plant.
  • Municipalities are the Yearbook’s smallest unit; one large factory and many small ones look the same.

View this map’s folder on GitHub

Technical record

Technical record · No. 091

Biogenic versus fossil

At a glance

CO₂ from large fixed sources in 2024 (t)
  • ethanol vats (biogenic) 52.1%
  • gas, oil and coke (fossil) 47.9%
Largest fixed fossil sources (t of CO₂ in 2024)
  • São Paulo 849,580
  • Cubatão 738,384
  • Santa Gertrudes 597,415
  • Paulínia 513,832
  • Jacareí 489,794

Layers

  • municipios polygon 645 municipalities: fossil CO₂ (gas, oil, coke and all energy), vat CO₂ in 2024 and biogenic share (same GPKG as plate 089)

Metadata

Sources
SEMIL (SP) — Energy Yearbook by Municipality of São Paulo State 2025, base year 2024 (natural gas and oil product use by municipality) (2025)
ANP — Ethanol Producers Dynamic Panel (2024 output and capacity by mill) (2026)
IPCC (2006) — Guidelines for National Greenhouse Gas Inventories, vol. 2, ch. 1, Table 1.4 (stationary combustion CO₂ emission factors) (2006)
IPCC (2005) — Special Report on Carbon Dioxide Capture and Storage, Table 2.1 (CO₂ concentration by source type) (2005)
EPE — Brazilian Energy Balance 2025 (net calorific values) (2025)
IBGE — Municipal Mesh 2025 (2025)
Extent
São Paulo State (SP)
CRS / Projection
SIRGAS 2000 (EPSG:4674)
EPSG:4674
Software
Node.js · d3-geo · QGIS
Method
Fossil CO₂ in 2024 by municipality: industrial, cogeneration and power-generation natural gas use and fuel oil and petroleum coke use (SEMIL Energy Yearbook), times the BEN net calorific value and the IPCC 2006 emission factor; biogenic CO₂ in 2024: ethanol fermentation estimated as in plate 089; biogenic share = biogenic ÷ (biogenic + fossil).
Version
v1.0.0
Licence
CC BY 4.0
DOI
being registered on Zenodo

Downloads

Figure to reuse

The map without a frame, with legend, scale, reference system and credit written on it: ready for papers, lectures and slides. In two versions: with the basemap (neighbours and sea) or only the mapped area, on white.

Point a camera at it to open this page.

How to cite

Cerejo, L. N. (2026). Biogênico contra fóssil: nas grandes fontes fixas do estado, metade do CO₂ vem da cana [Biogenic versus fossil: In the state’s large fixed sources, half the CO₂ comes from sugarcane] (Version 1.0.0) [Data set]. Essencial. https://aikiesan.github.io/essencial-geo/en/maps/091-co2-biogenico-e-fossil-sp/

100%