Skip to content
Essencial

No. 090 Energy · biomass Biogenic carbon 2/4

The CO₂ in biogas

To become biomethane, biogas must shed its CO₂, almost half its volume

Record, downloads and citation
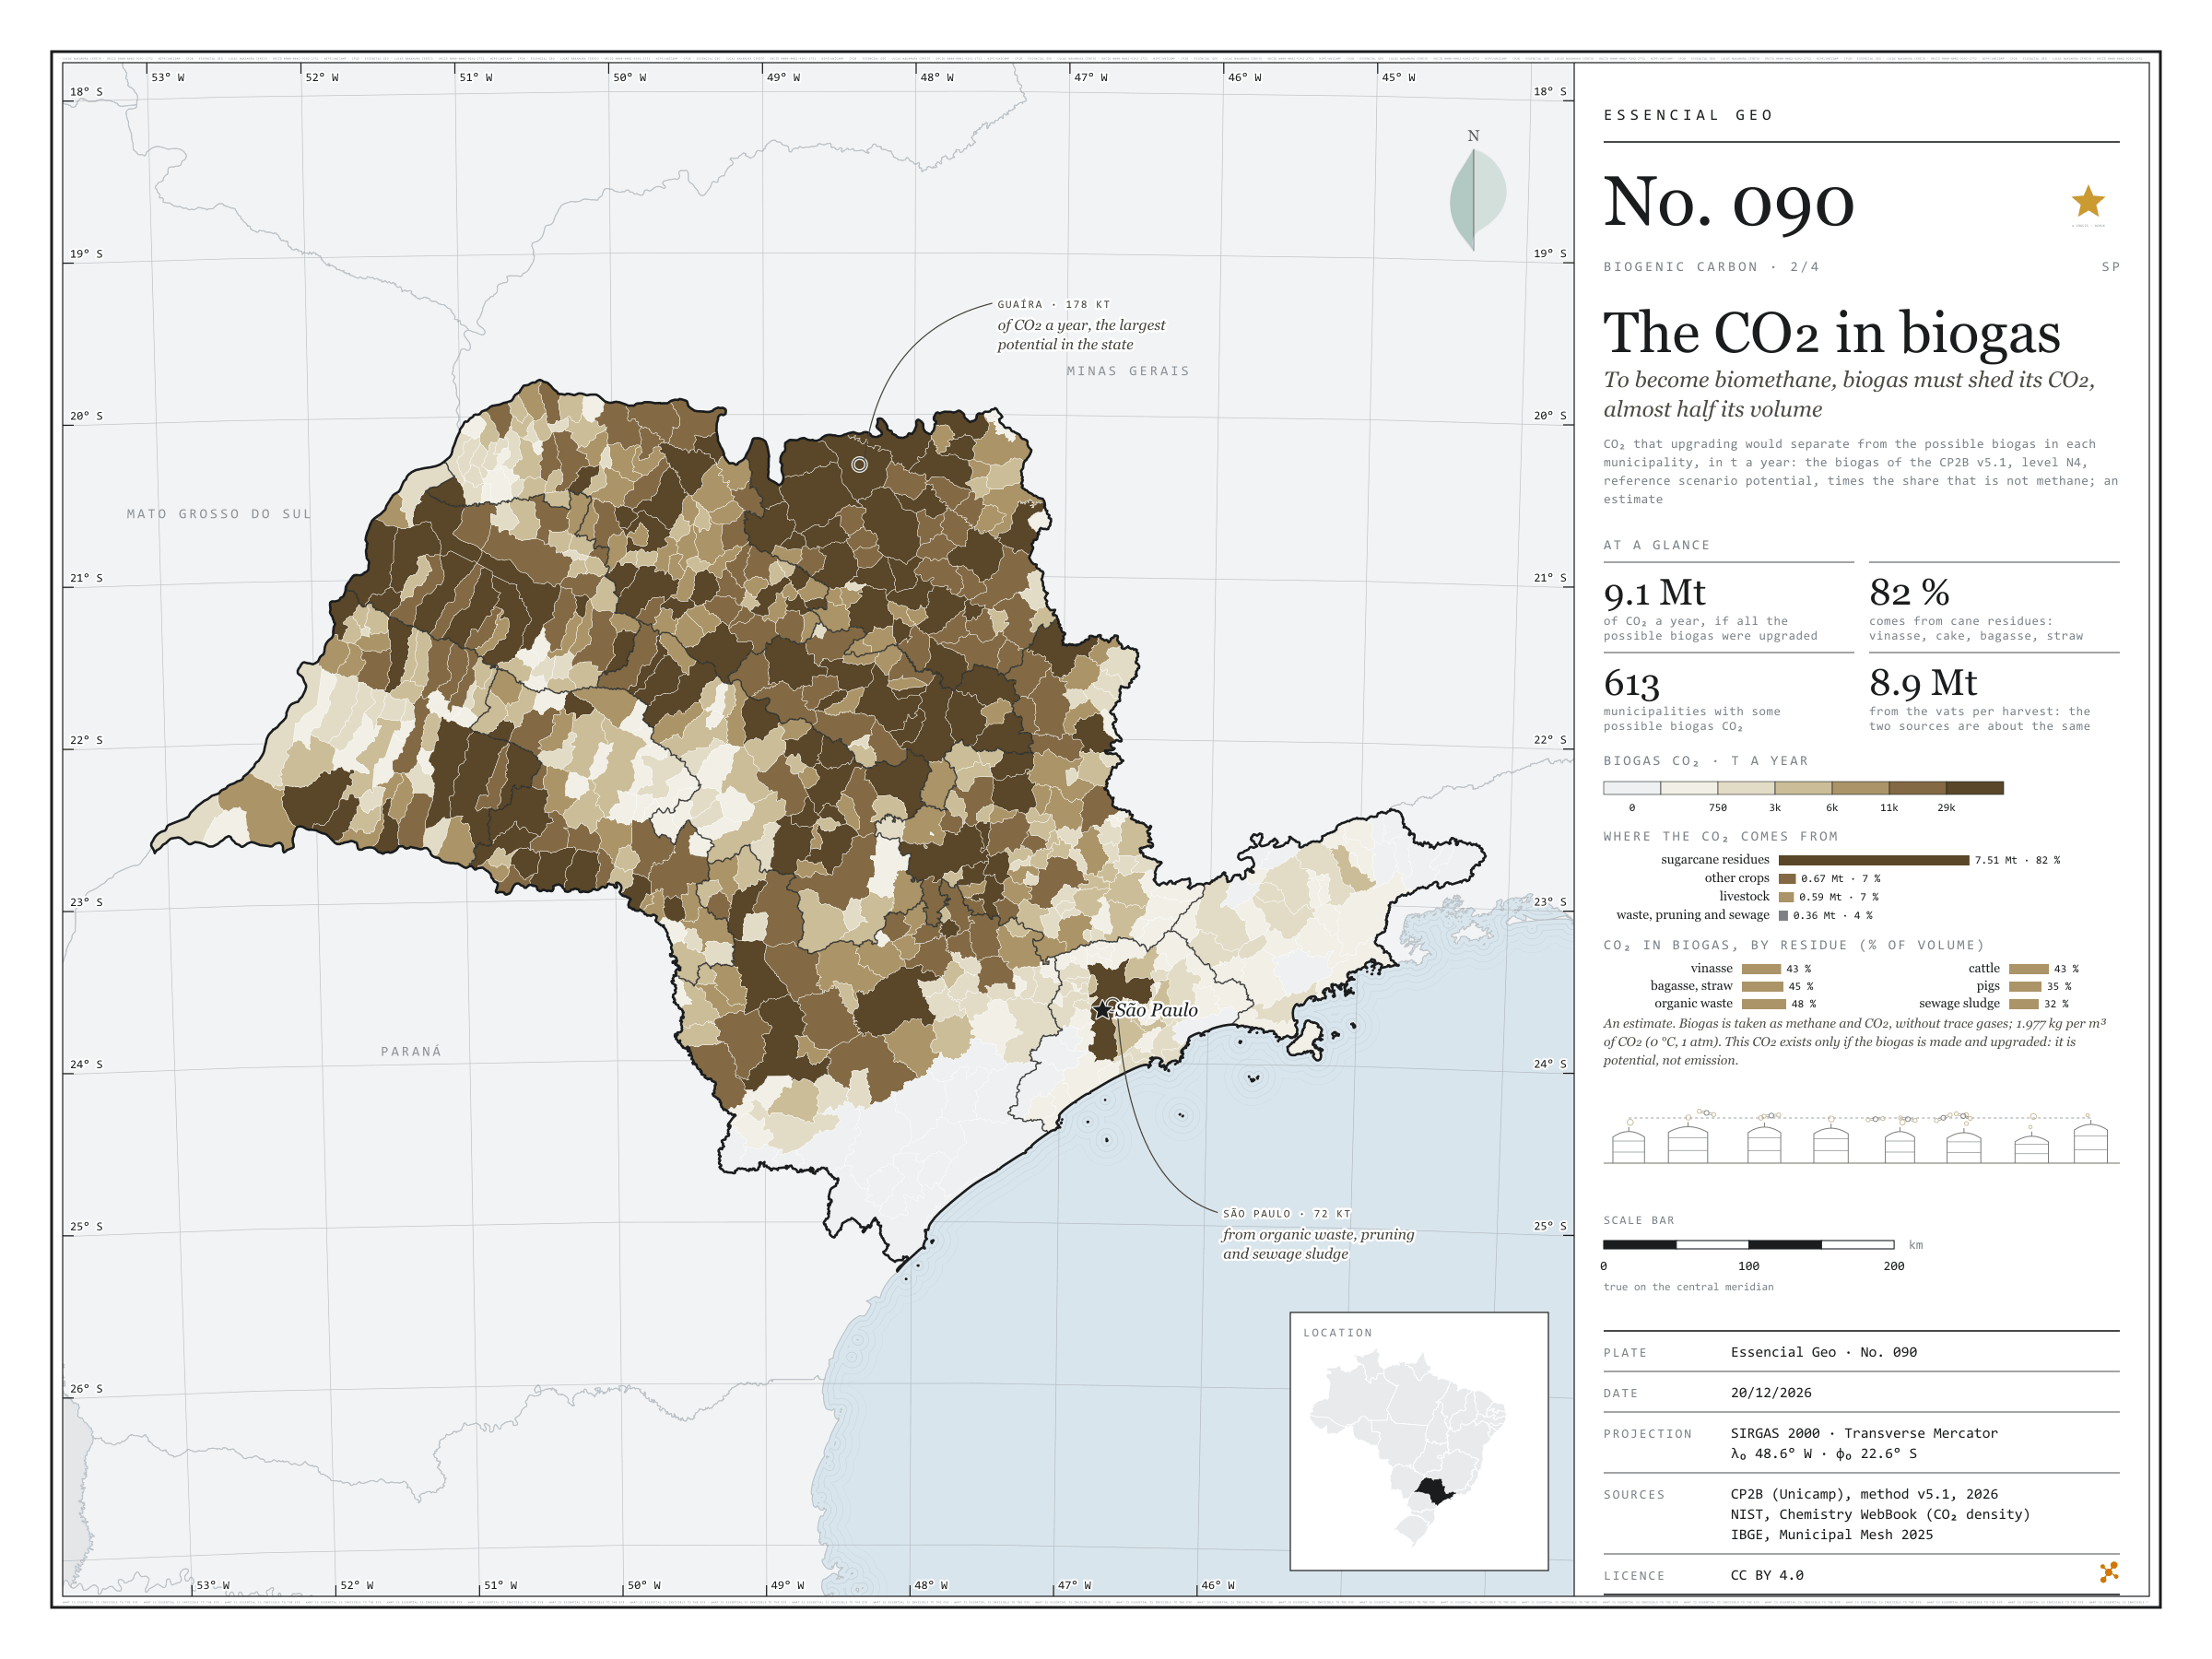
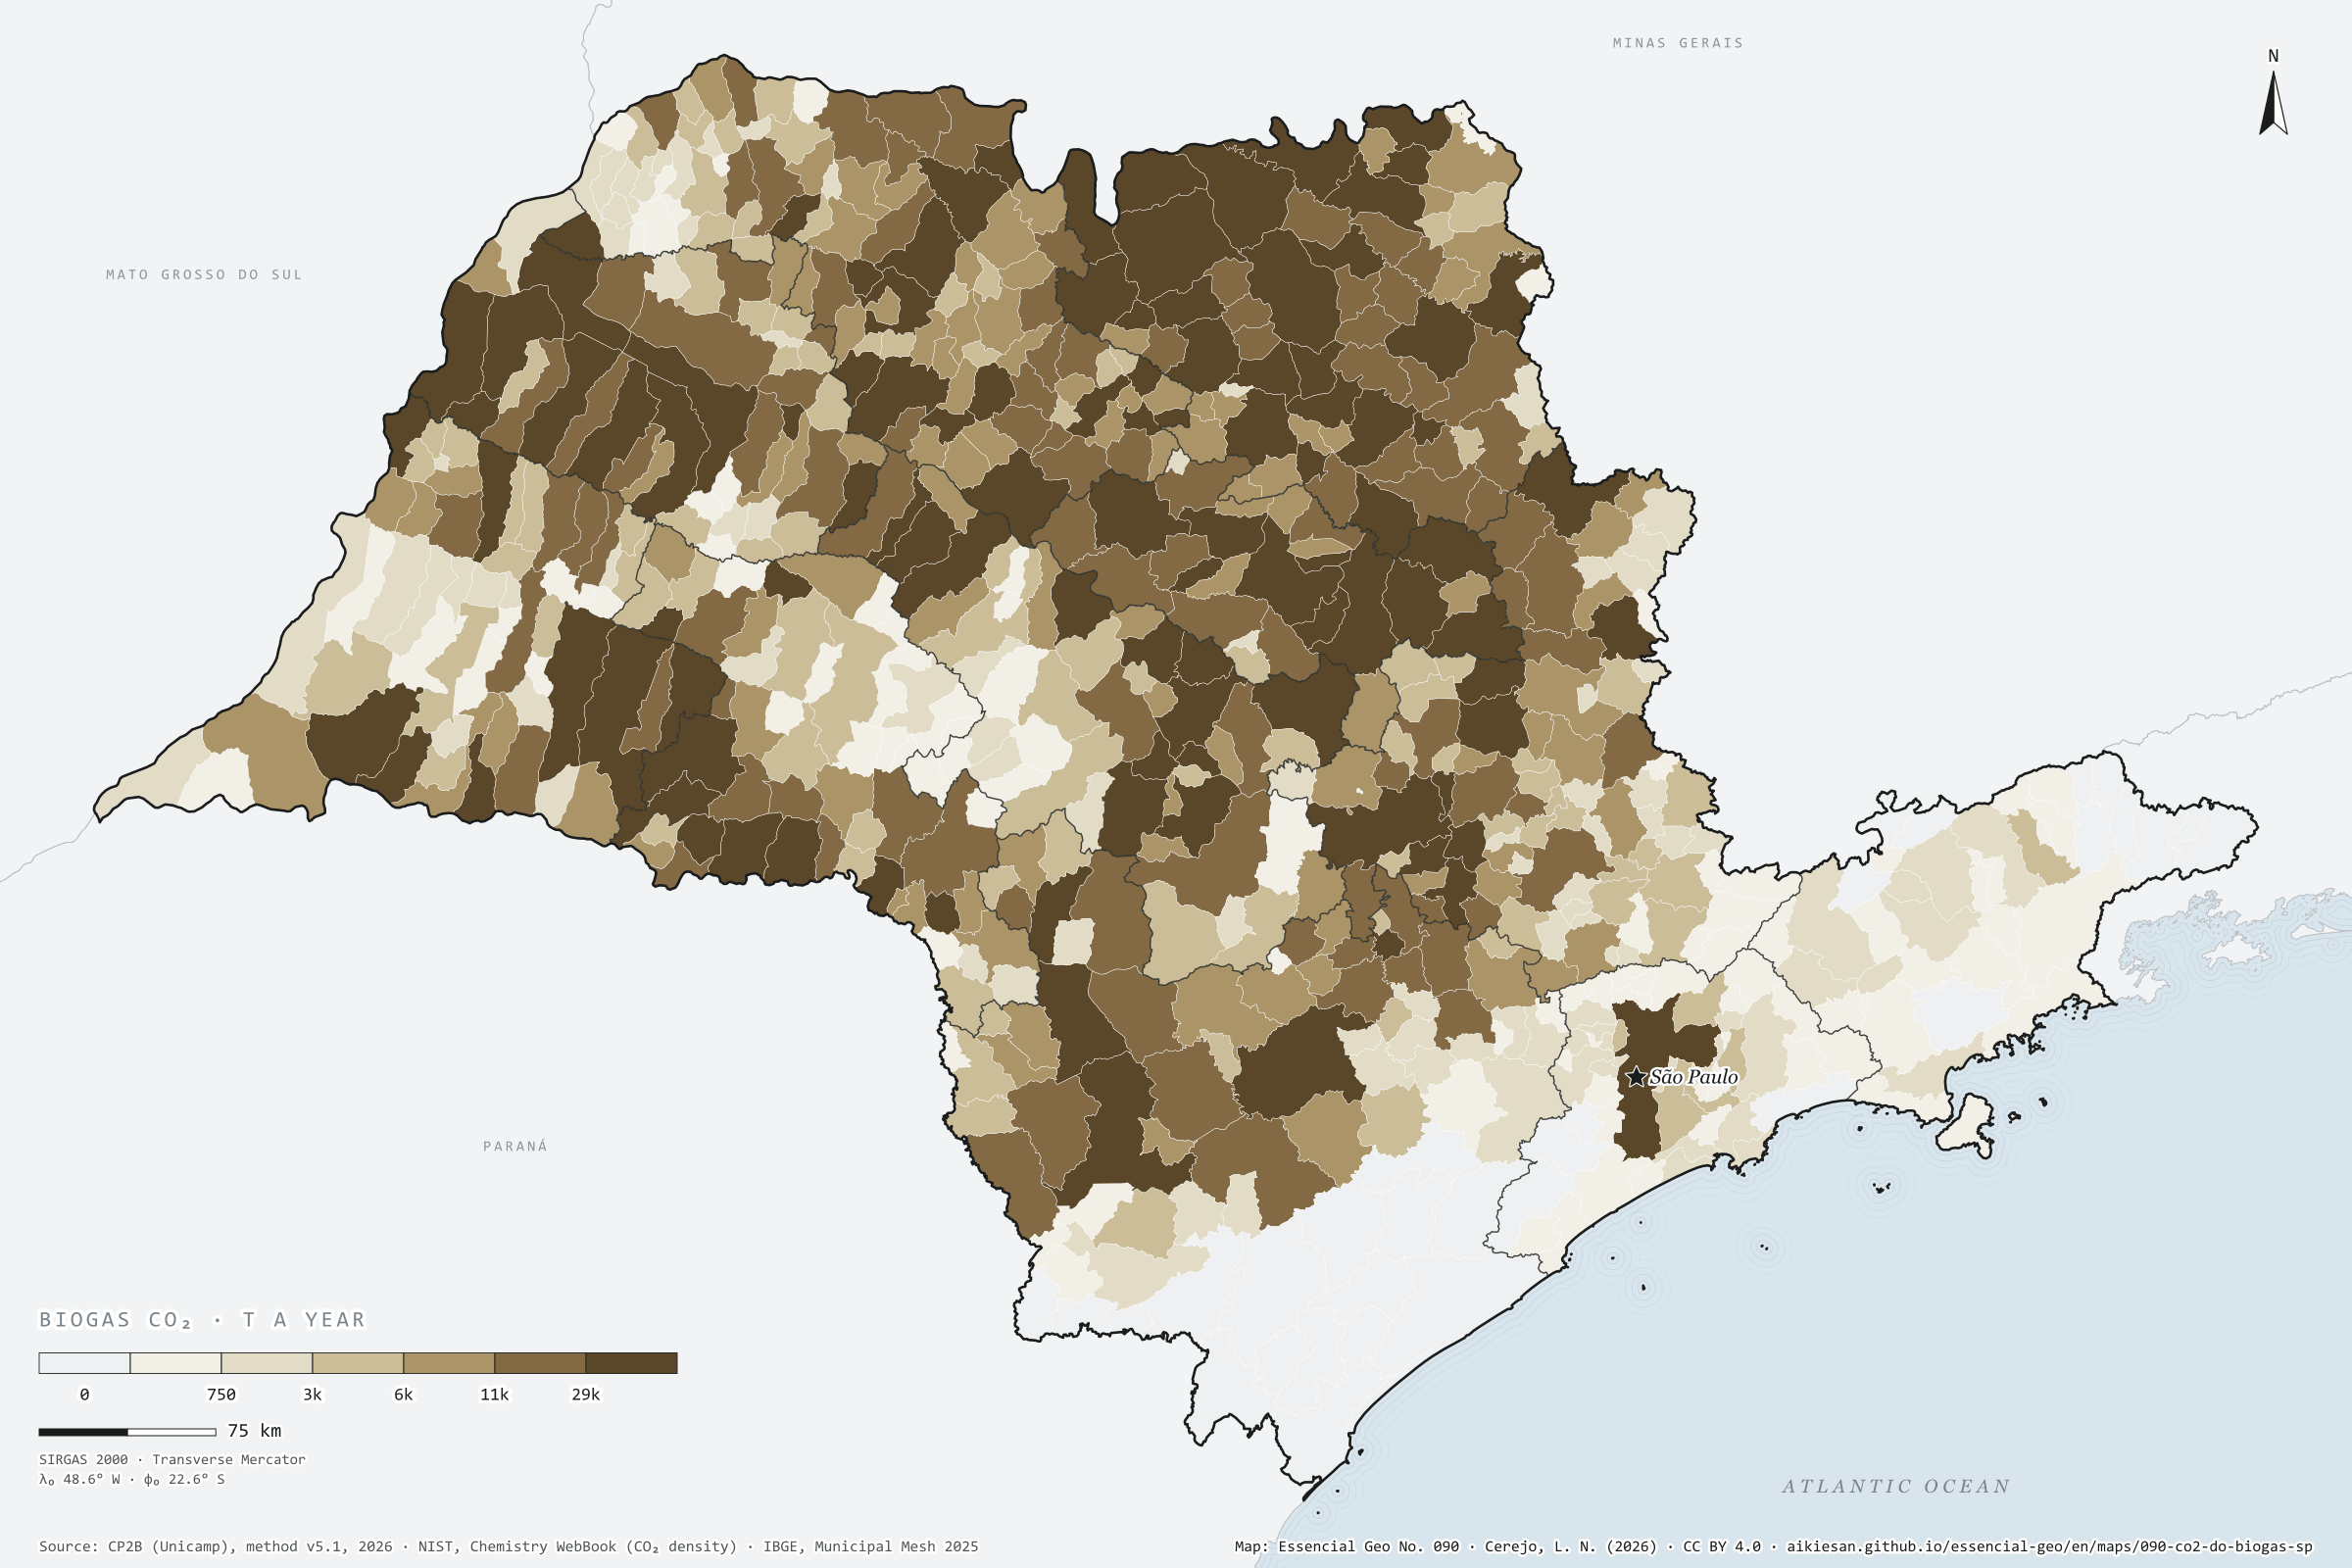
Fig. 090 São Paulo State (SP) EPSG:4674 Source: CP2B (Unicamp), NIST, IBGE

Biogas leaves the digester as methane and CO₂; the CO₂ takes up 32% to 48% of the volume, depending on the residue. To become biomethane, which can enter the gas grid, biogas goes through upgrading, which separates out this CO₂, a concentrated, biogenic gas. If all the possible biogas in São Paulo were made and upgraded, on the CP2B potential (level N4, reference scenario), about 9.1 million t of CO₂ a year would come out, almost as much as the ethanol vats release in a harvest. 82% would come from cane residues: vinasse, filter cake, bagasse and straw. Guaíra leads with 178,000 t, followed by Morro Agudo with 154,000 and Sertãozinho with 136,000; the capital reaches 72,000 t from organic waste, pruning and sewage sludge. It is a potential, not a current emission, and an estimate. Second plate of the collection “Biogenic carbon”.

Technical record · downloads · citation

At a glance

Where the biogas CO₂ would come from (t a year)
  • sugarcane residues 82.2%
  • other crops 7.4%
  • livestock 6.5%
  • waste, pruning and sewage 3.9%
Largest municipalities (t of CO₂ a year)
  • Guaíra 177,918
  • Morro Agudo 154,321
  • Sertãozinho 136,382
  • Pontal 119,943
  • Pitangueiras 112,591

Layers

  • municipios polygon 645 municipalities: biogas upgrading CO₂, total and by group (cane, crops, livestock, urban), and N4 biogas (same GPKG as plate 089)

Metadata

Sources
CP2B (Unicamp) — biogas and biomethane potential by municipality, method v5.1 (level N4, reference scenario) (2026)
NIST — Chemistry WebBook (CO₂ density at 0 °C and 1 atm) (2023)
IBGE — Municipal Mesh 2025 (2025)
Extent
São Paulo State (SP)
CRS / Projection
SIRGAS 2000 (EPSG:4674)
EPSG:4674
Software
Node.js · d3-geo · QGIS
Method
For each municipality and residue, the biogas of the CP2B v5.1 potential (level N4, reference scenario) times the share of the volume that is not methane (1 − the residue’s CH₄ fraction), converted to mass at 1.977 kg of CO₂ per normal m³; summed by municipality and by residue group.
Version
v1.0.0
Licence
CC BY 4.0
DOI
being registered on Zenodo

Downloads

Figure to reuse

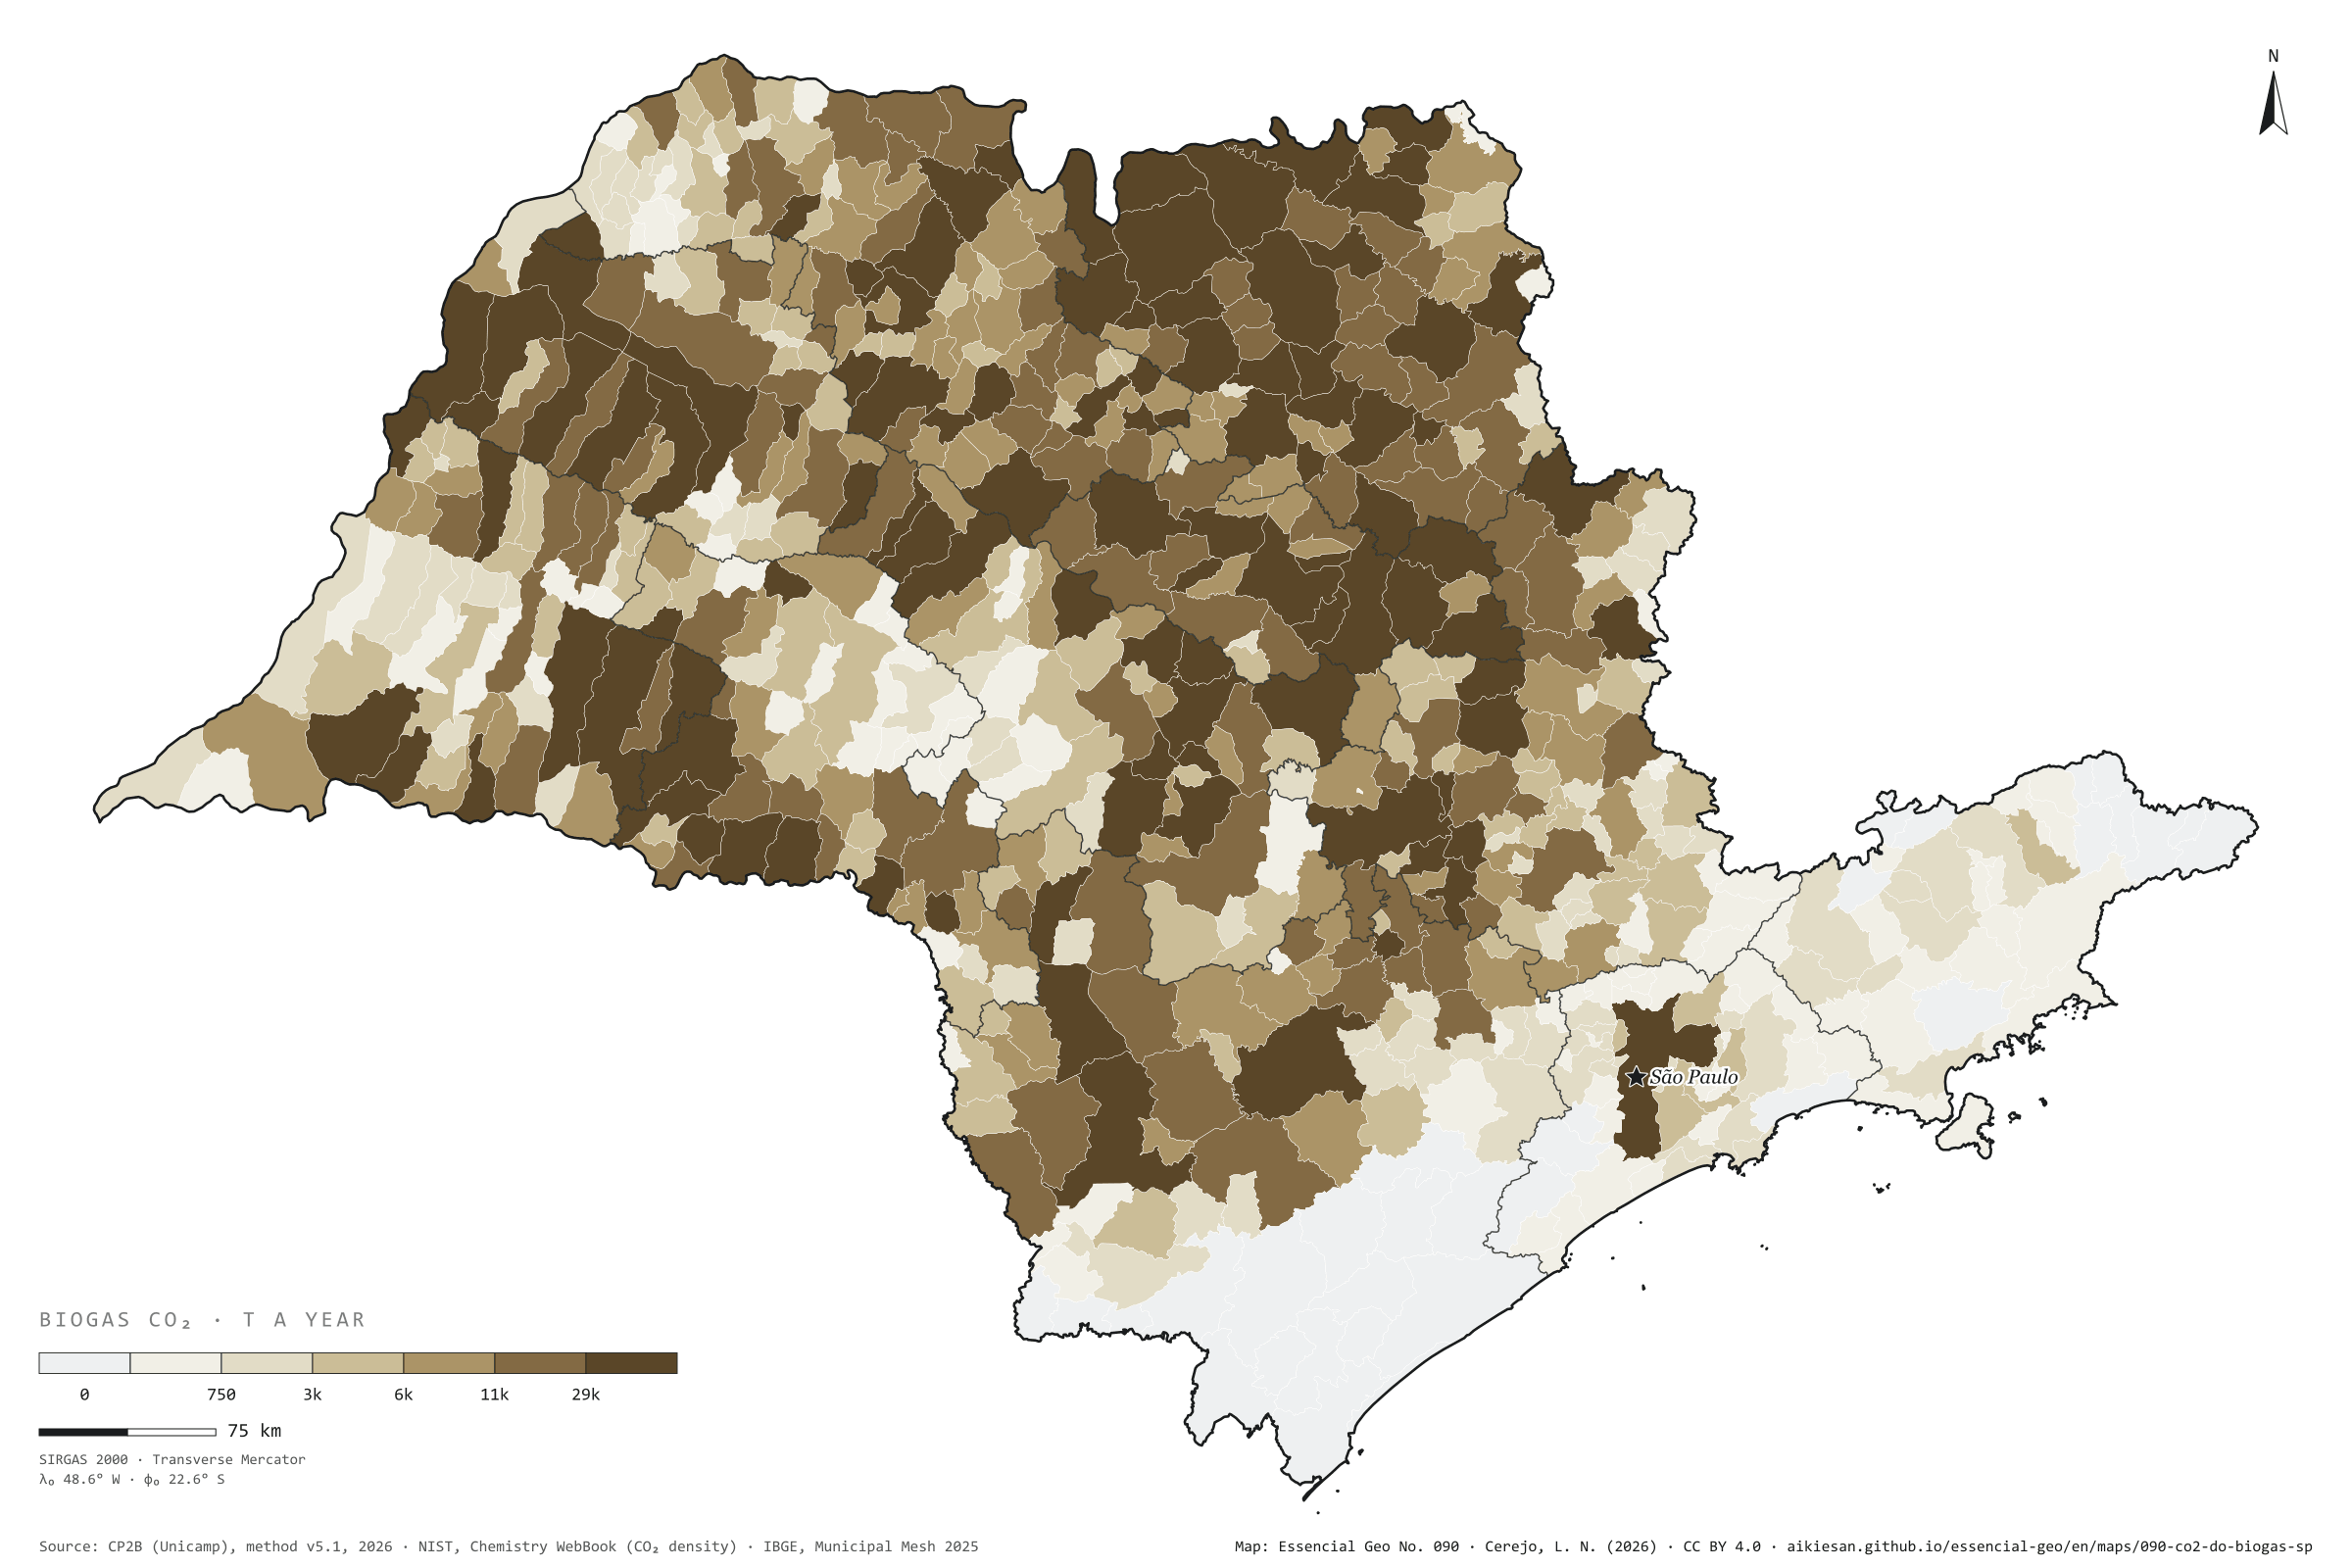
The map without a frame, with legend, scale, reference system and credit written on it: ready for papers, lectures and slides. In two versions: with the basemap (neighbours and sea) or only the mapped area, on white.

Point a camera at it to open this page.

How to cite

Cerejo, L. N. (2026). O CO₂ do biogás: para virar biometano, o biogás solta o CO₂, quase metade do volume [The CO₂ in biogas: To become biomethane, biogas must shed its CO₂, almost half its volume] (Version 1.0.0) [Data set]. Essencial. https://aikiesan.github.io/essencial-geo/en/maps/090-co2-do-biogas-sp/

How to read this plate area, projection, scale, legend and source · 10 terms
1 Area
São Paulo State (SP) The area the plate covers. Outside it, neighbours and sea are drawn in grey, just for orientation.
2 Coordinates and projection
SIRGAS 2000 (EPSG:4674) The layers are in SIRGAS 2000; the drawing’s projection is written in the colophon at the foot of the panel.
3 Scale
Graphic scale bar in the panel The scale bar is true on the central meridian; away from it, measured distances vary a little.
4 Legend and layers
1 layer in the GeoPackage · polygon Read the legend before the map: it tells you whether a colour is a rate or a class, and whether a circle is a total.
5 Sources
CP2B (Unicamp) (2026); NIST (2023); IBGE (2025) Every figure comes from a public source, with its year. The data sheet gives each one’s address.

Terms on this plate

Choropleth map
Each area (municipality, census tract) takes the colour of its value’s class. The colour gives the band, not the total, which is why the plates use rates such as per km², per person or per household.
Harvest year
Cane years are not calendar years: in the Centre-South the harvest runs from April to March; in the Northeast, from September to August. That is why the two regions crush in opposite months.
Bagasse
The fibre left after crushing. Burnt in the boilers, it makes the mill’s own steam and electricity; the surplus goes to the grid.
Cane straw
Tops and leaves left in the field by mechanised harvesting since cane burning ended. Some can be collected for energy; some must stay to protect the soil.
Vinasse
The liquid left by distillation, around ten litres per litre of ethanol, rich in potassium. It goes back to the cane fields as fertiliser and can pass through a digester first.
Filter cake
The residue from clarifying cane juice, rich in phosphorus and organic matter: a fertiliser and a biogas feedstock.
Biogas
The gas from the airless breakdown (anaerobic digestion) of organic waste: manure, vinasse, sewage sludge, rubbish. It is 50% to 70% methane; the rest is mostly CO₂.
Biomethane
Biogas upgraded, with most of the CO₂ removed, to ANP’s specification, at which point it replaces natural gas in the pipeline, in industry and in the lorry’s tank.
N1 to N4 (potential levels)
CP2B’s four levels: N1 theoretical (all residue generated), N2 technical (after collection), N3 mobilisable (after competing uses and what already becomes biogas) and N4 accessible (after storage and the logistic factor).
Biogenic CO₂
CO₂ from recently grown biomass, such as that from ethanol fermentation and biogas upgrading: it returns to the air what the plant took shortly before. It can be captured and used.

Download

Layers, table and figures, under CC BY 4.0. Cite with the DOI.

Full record and citation

Method notes · No. 090

The CO₂ from biogas upgrading in São Paulo

Português · English

Plate No. 090, the second of four in the collection Biogenic carbon: how much CO₂ would come out of upgrading the possible biogas in each municipality, if it were made and turned into biomethane.

What the files contain

  • dados/sp_carbono_municipios.csv: one row per municipality, with all the collection’s fields. This plate uses co2_biogas_t (total), co2_biogas_cana_t, co2_biogas_lavouras_t, co2_biogas_pecuaria_t, co2_biogas_urbano_t and biogas_n4_nm3_ano (biogas of the potential, in normal m³ a year).
  • sp_carbono_biogenico.gpkg.zip (in the carbono-sp-2026 release): in the municipios layer, the co2_biogas style reproduces the map’s classes.

Method

  1. Biogas: the CP2B potential, method v5.1, level N4 (accessible: the theoretical potential less what is unavailable, what cannot be mobilised and the distance to where the gas would be made), in the reference scenario, by municipality and residue.
  2. CO₂: biogas is taken as methane plus CO₂. The CO₂ volume is the biogas times (1 − the residue’s methane fraction), with CP2B’s fractions: from 0.52 methane in organic waste (48% CO₂) to 0.68 in sewage sludge (32% CO₂); 0.575 in vinasse and 0.55 in bagasse and straw.
  3. Mass: 1.977 kg of CO₂ per normal m³ (0 °C and 1 atm), from the NIST density.
  4. Groups: cane (vinasse, filter cake, bagasse and straw), other crops, livestock and urban (organic waste, pruning and sewage sludge).

Limitations

  • It is a potential, not an emission. The CO₂ exists only if the biogas is produced and upgraded; today most of these residues never reach a digester.
  • Real biogas also carries water vapour, H₂S, nitrogen and other traces; treating it as methane and CO₂ only slightly overstates the CO₂.
  • Not every upgrading route delivers usable CO₂: with membranes or water scrubbing, the CO₂ stream carries some methane and needs treatment before any use.
  • The CO₂ from cane biogas and that from the vats (plate 089) come from the same mill but from different processes; adding them, as plate 092 does, assumes both are put to use.

View this map’s folder on GitHub

Technical record

Technical record · No. 090

The CO₂ in biogas

At a glance

Where the biogas CO₂ would come from (t a year)
  • sugarcane residues 82.2%
  • other crops 7.4%
  • livestock 6.5%
  • waste, pruning and sewage 3.9%
Largest municipalities (t of CO₂ a year)
  • Guaíra 177,918
  • Morro Agudo 154,321
  • Sertãozinho 136,382
  • Pontal 119,943
  • Pitangueiras 112,591

Layers

  • municipios polygon 645 municipalities: biogas upgrading CO₂, total and by group (cane, crops, livestock, urban), and N4 biogas (same GPKG as plate 089)

Metadata

Sources
CP2B (Unicamp) — biogas and biomethane potential by municipality, method v5.1 (level N4, reference scenario) (2026)
NIST — Chemistry WebBook (CO₂ density at 0 °C and 1 atm) (2023)
IBGE — Municipal Mesh 2025 (2025)
Extent
São Paulo State (SP)
CRS / Projection
SIRGAS 2000 (EPSG:4674)
EPSG:4674
Software
Node.js · d3-geo · QGIS
Method
For each municipality and residue, the biogas of the CP2B v5.1 potential (level N4, reference scenario) times the share of the volume that is not methane (1 − the residue’s CH₄ fraction), converted to mass at 1.977 kg of CO₂ per normal m³; summed by municipality and by residue group.
Version
v1.0.0
Licence
CC BY 4.0
DOI
being registered on Zenodo

Downloads

Figure to reuse

The map without a frame, with legend, scale, reference system and credit written on it: ready for papers, lectures and slides. In two versions: with the basemap (neighbours and sea) or only the mapped area, on white.

Point a camera at it to open this page.

How to cite

Cerejo, L. N. (2026). O CO₂ do biogás: para virar biometano, o biogás solta o CO₂, quase metade do volume [The CO₂ in biogas: To become biomethane, biogas must shed its CO₂, almost half its volume] (Version 1.0.0) [Data set]. Essencial. https://aikiesan.github.io/essencial-geo/en/maps/090-co2-do-biogas-sp/

100%