Skip to content
Essencial

No. 089 Energy · biomass Biogenic carbon 1/4

The CO₂ from the vats

Every ethanol mill gives off an almost pure gas that now goes into the air

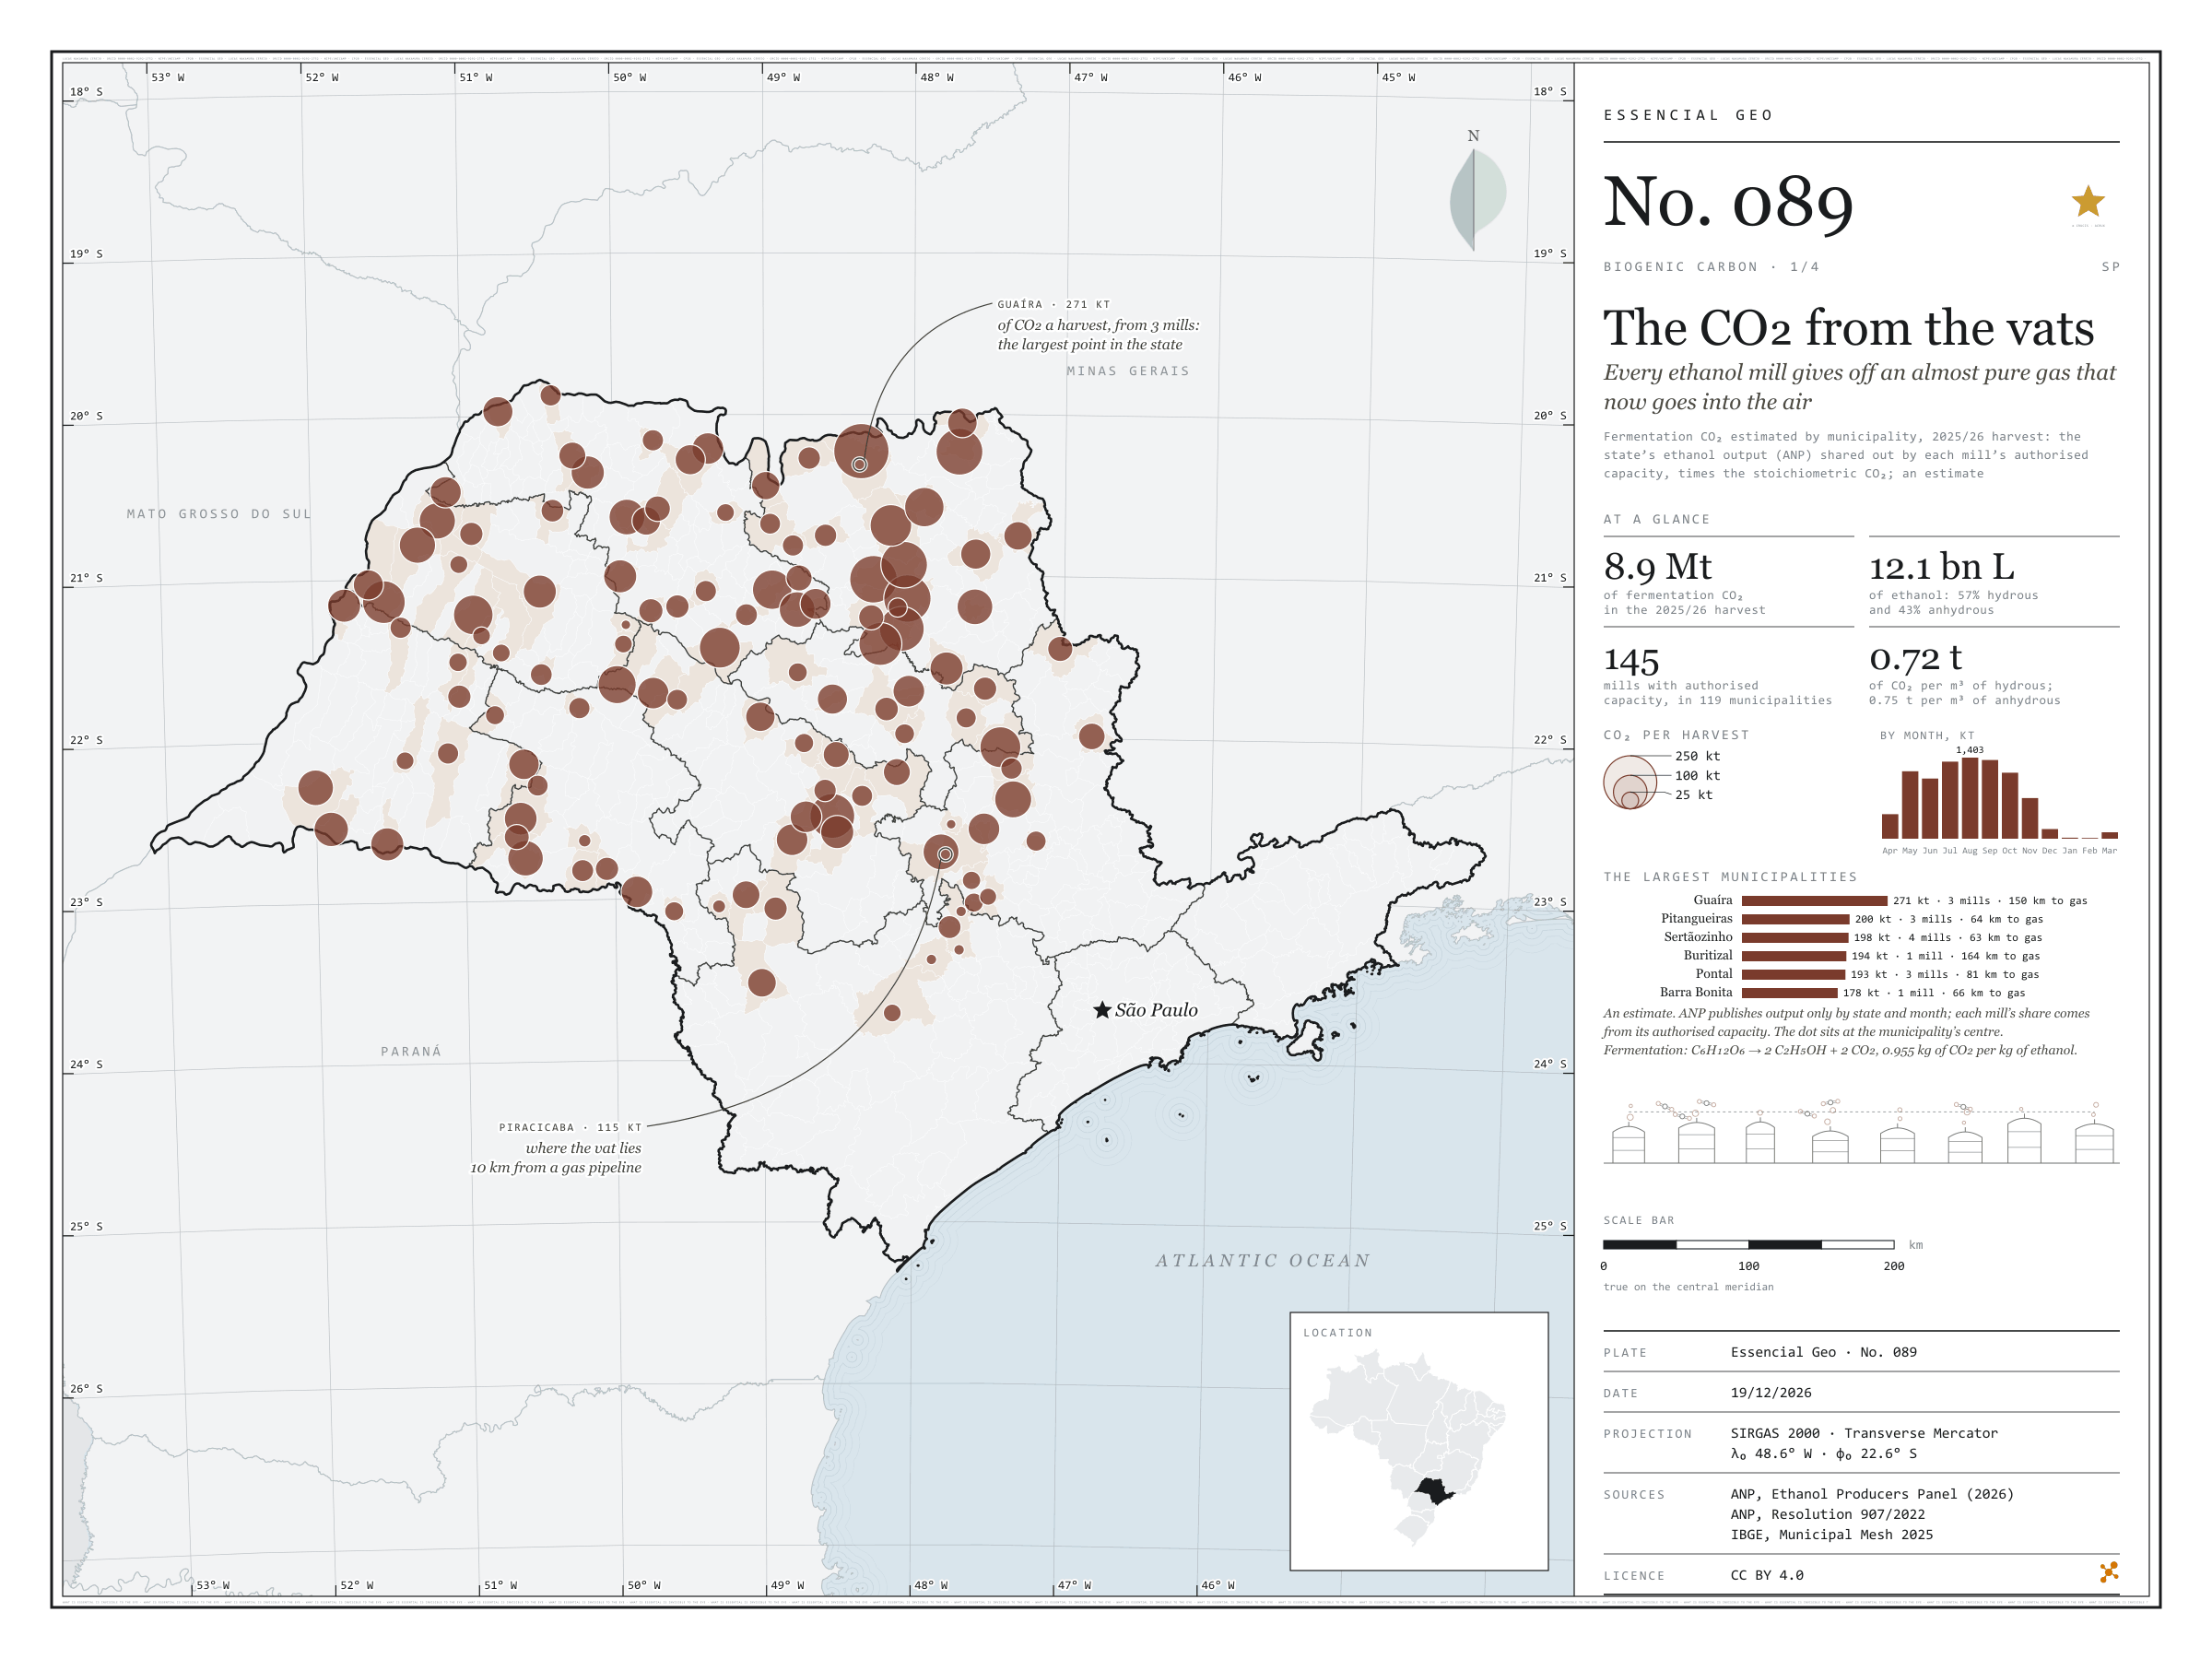
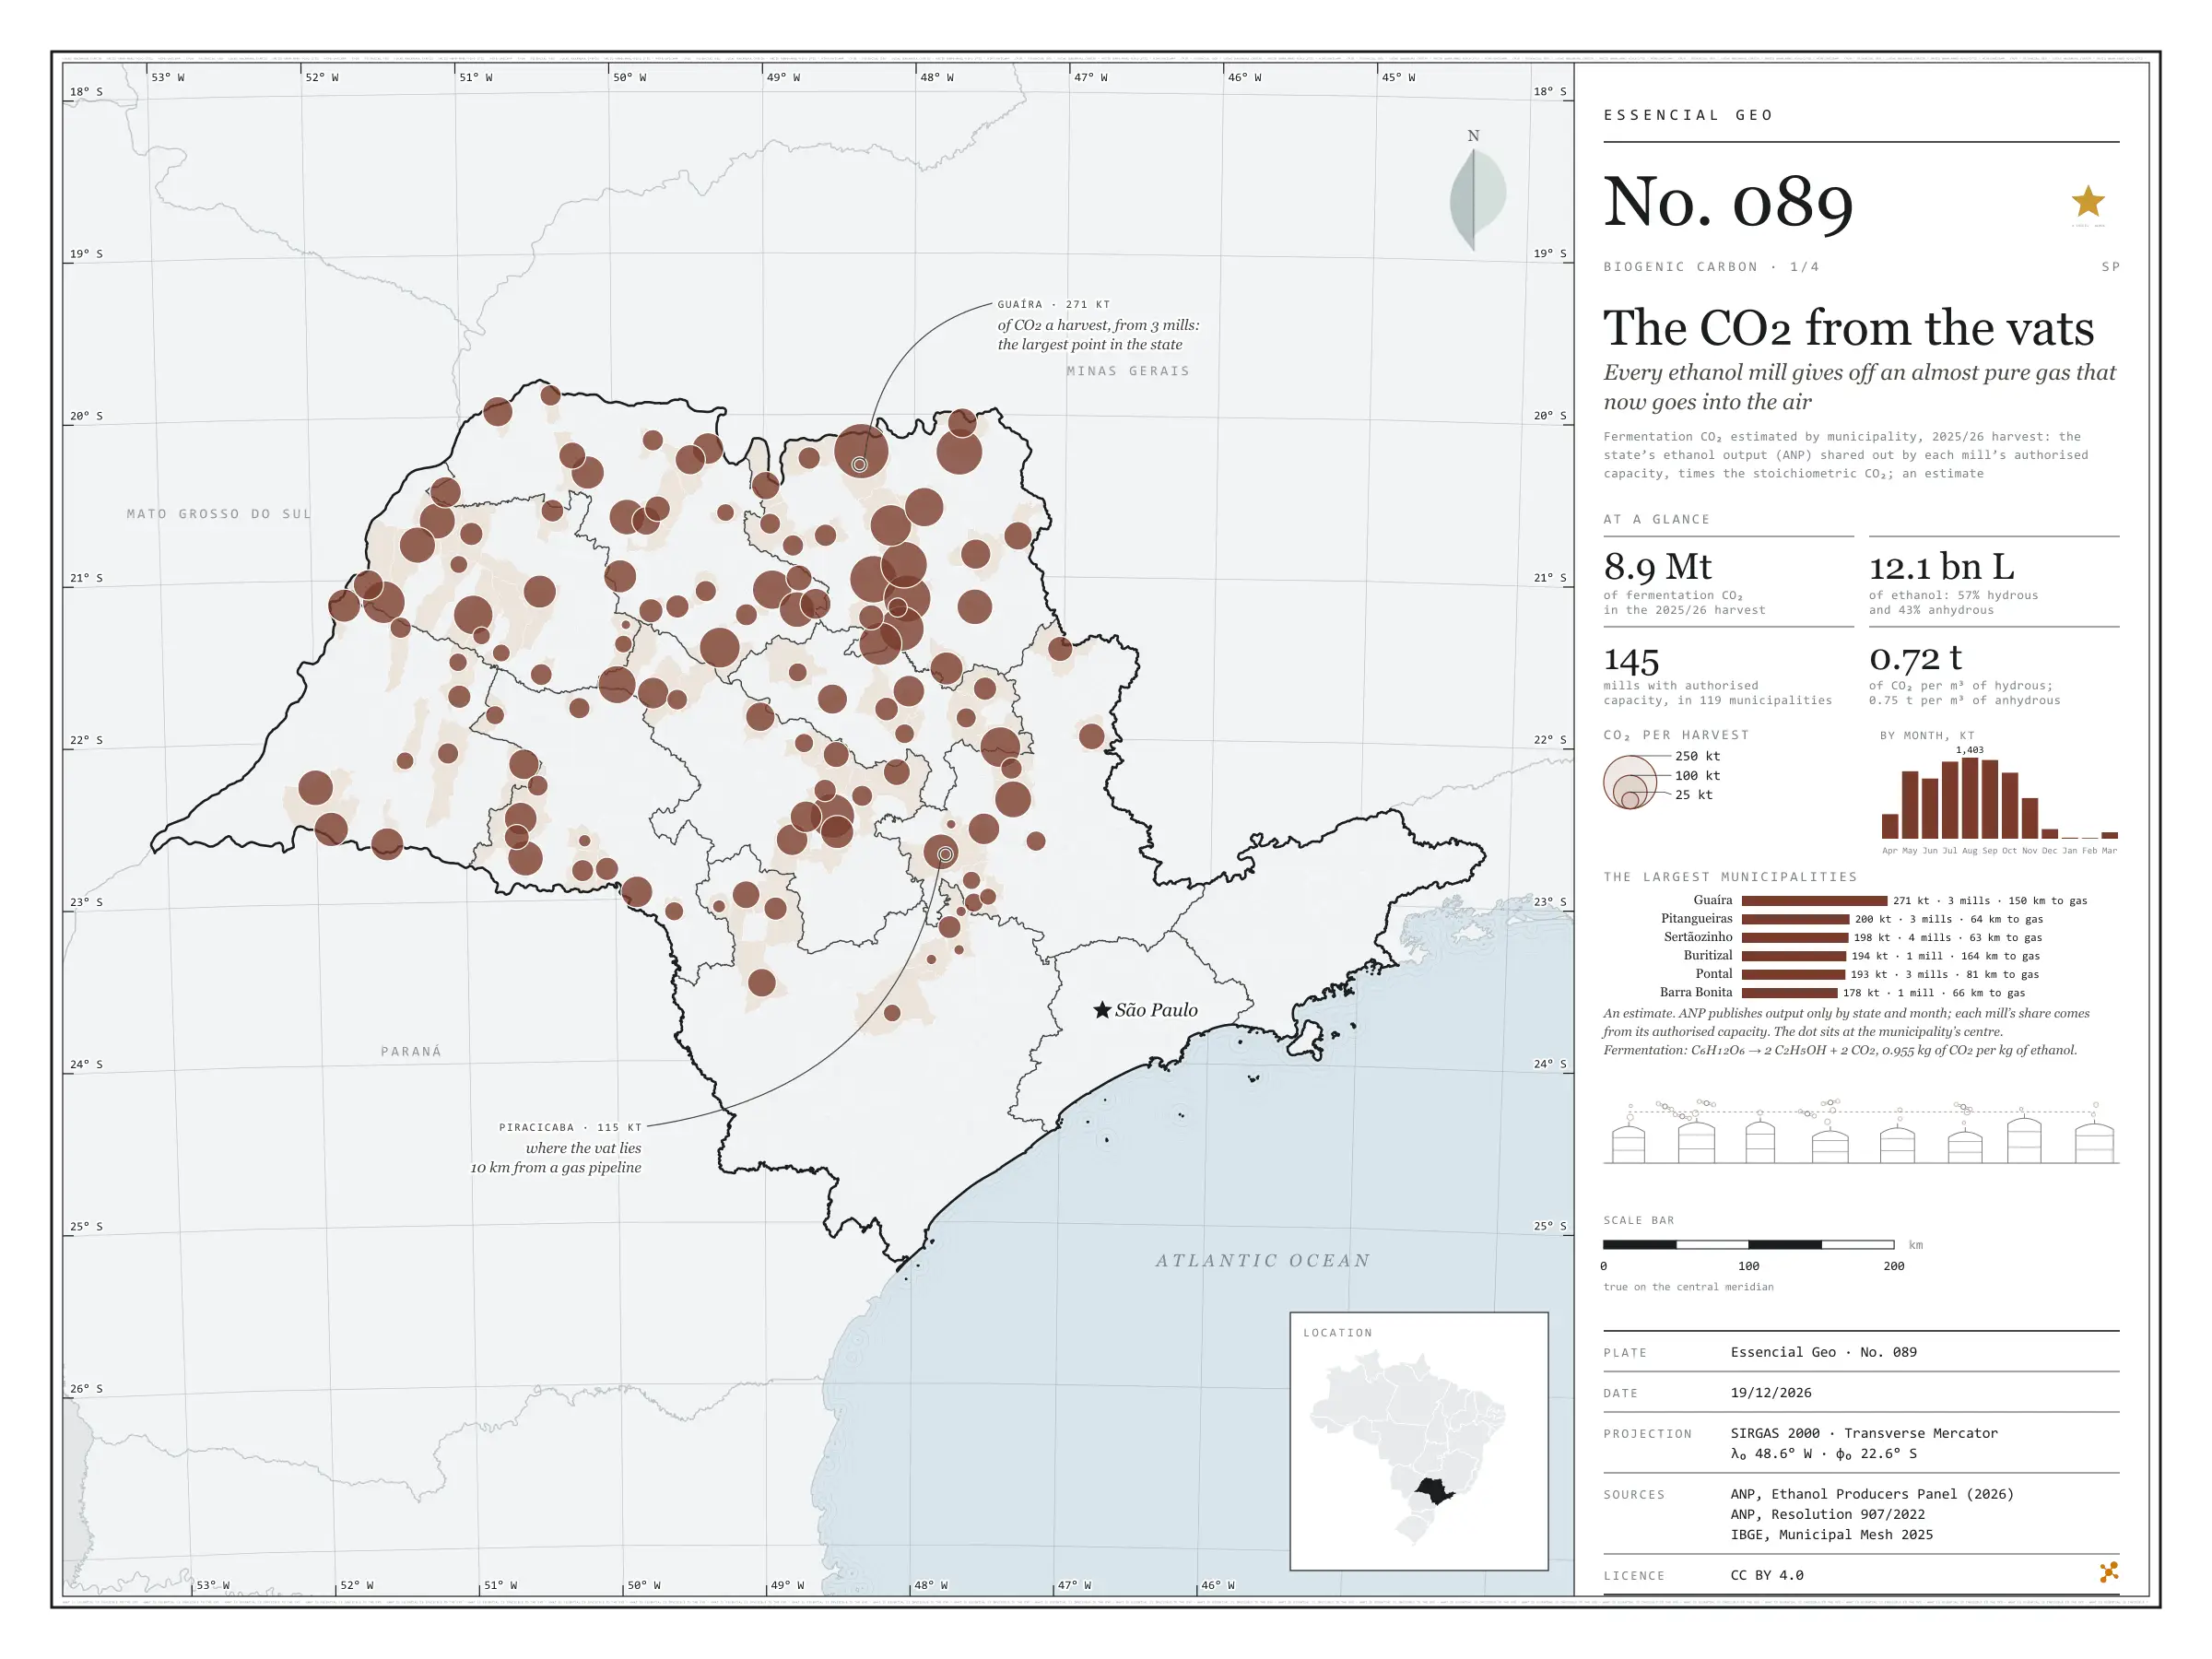
Fig. 089 São Paulo State (SP) EPSG:4674 Source: ANP, Kheshgi, H. S. and Prince, R. C. (2005). Sequestration of fermentation CO₂ from ethanol production. Energy, 30, 1865–1871, EPE, IBGE

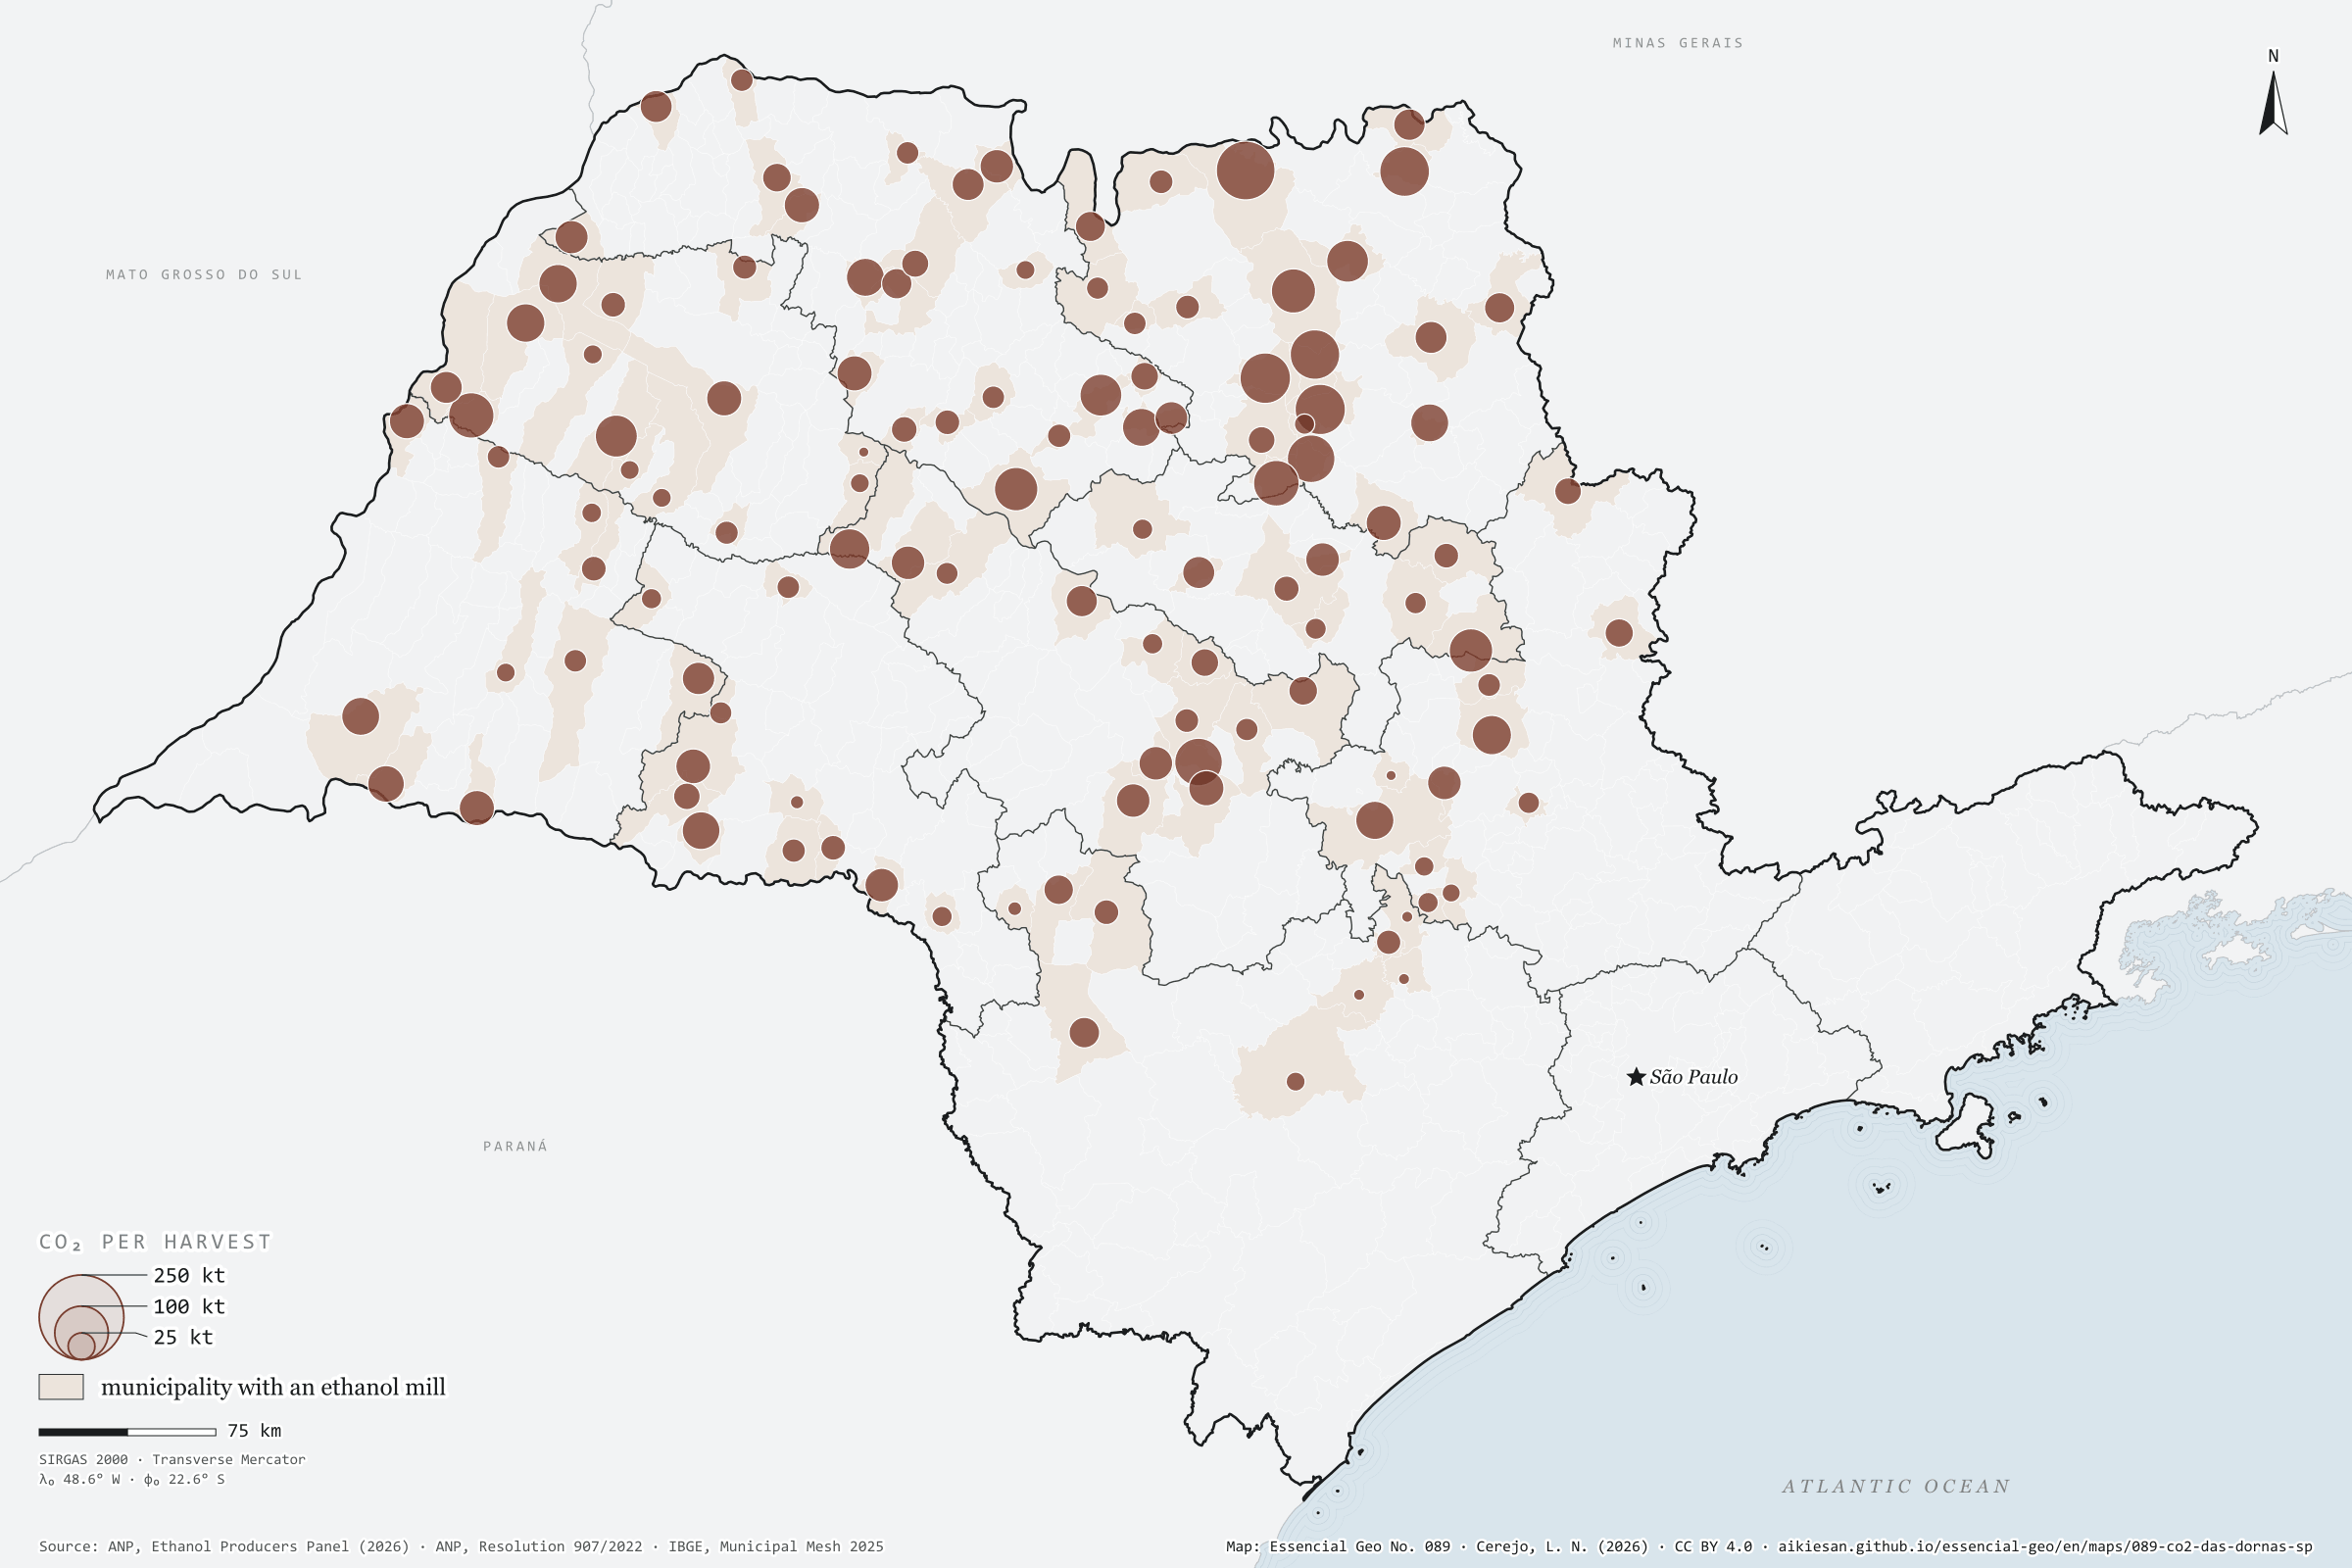
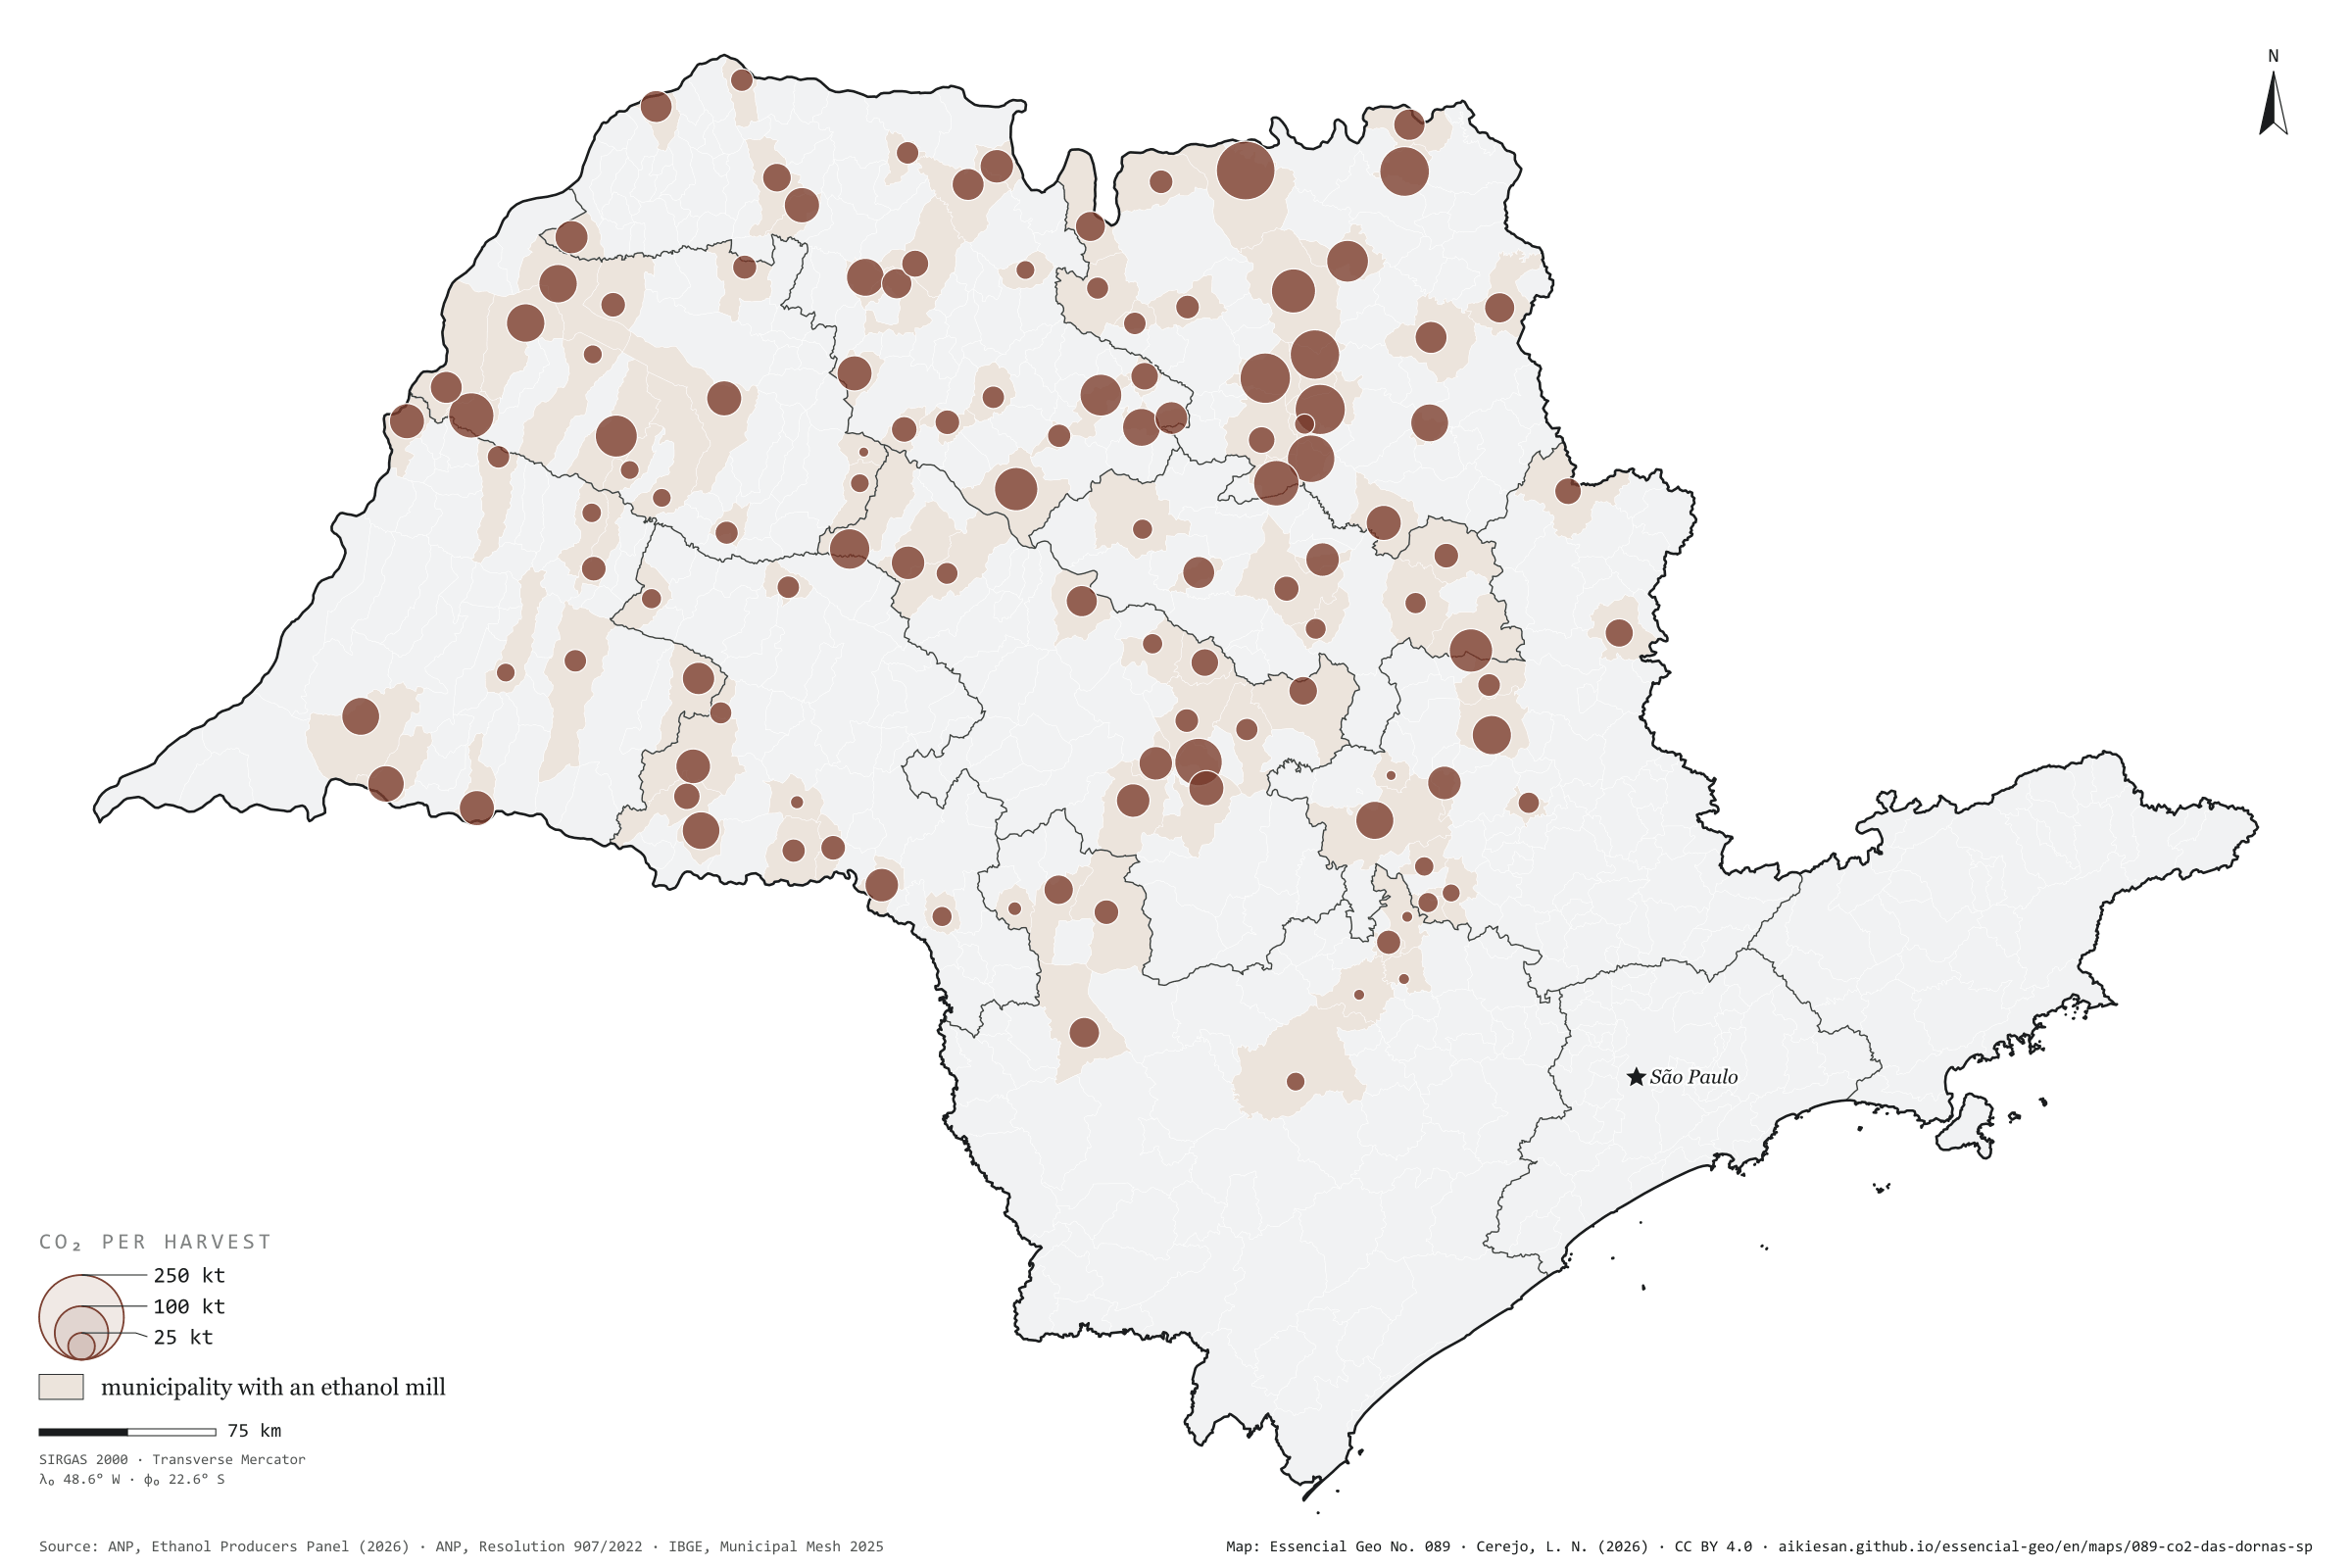
In the fermentation vat, yeast turns cane sugar into ethanol and releases CO₂ in step: 0.955 kg of gas per kg of alcohol, about 0.75 t per m³. It is almost pure CO₂, of biological origin, and today it goes into the air. In the 2025/26 harvest, São Paulo’s mills made 12.1 billion litres of ethanol; by stoichiometry, about 8.9 million tonnes of CO₂ left the vats, from 145 mills in 119 municipalities. Guaíra, with three mills, leads with about 271,000 t; Pitangueiras, Sertãozinho and Buritizal each pass 190,000. The gas follows the crushing season: 1.4 million t in August and almost nothing from December to March. As ANP publishes output only by state, each mill’s share is estimated from its authorised capacity; everything here is an estimate. First plate of the collection “Biogenic carbon”.

Technical record · downloads · citation

At a glance

Fermentation CO₂ in the 2025/26 harvest

8.9 million t

Largest municipalities (t of CO₂ a harvest)
  • Guaíra 271,110
  • Pitangueiras 200,298
  • Sertãozinho 198,274
  • Buritizal 194,228
  • Pontal 192,609
  • Barra Bonita 178,042

Layers

  • usinas_etanol point 145 SP mills with authorised capacity in the harvest: estimated ethanol and CO₂, at the municipality’s interior point
  • municipios polygon 645 municipalities: fermentation CO₂ (2025/26 harvest and 2024), biogas, fossil and possible e-methane

Metadata

Sources
ANP — Ethanol Producers Dynamic Panel: authorised capacity by mill and output by state and month (pb-da-etanol.zip) (2026)
ANP — Resolution No. 907/2022, Table 1 (density and alcohol content of anhydrous and hydrous ethanol) (2022)
Kheshgi, H. S. and Prince, R. C. (2005). Sequestration of fermentation CO₂ from ethanol production. Energy, 30, 1865–1871 (2005)
EPE — WebMap: existing gas pipelines, as published in the MapBiomas infrastructure database (distance to pipeline) (2022)
IBGE — Municipal Mesh 2025 (2025)
Extent
São Paulo State (SP)
CRS / Projection
SIRGAS 2000 (EPSG:4674)
EPSG:4674
Software
Node.js · d3-geo · QGIS
Method
São Paulo’s anhydrous and hydrous ethanol output in the 2025/26 harvest (ANP, by month) shared out among mills by their authorised capacity in each month, converted to mass by the density in the ANP specification and to CO₂ by the stoichiometry of alcoholic fermentation (0.955 kg of CO₂ per kg of ethanol); summed by municipality.
Version
v1.0.0
Licence
CC BY 4.0
DOI
being registered on Zenodo

Downloads

Figure to reuse

The map without a frame, with legend, scale, reference system and credit written on it: ready for papers, lectures and slides. In two versions: with the basemap (neighbours and sea) or only the mapped area, on white.

Point a camera at it to open this page.

How to cite

Cerejo, L. N. (2026). O CO₂ das dornas: toda usina de etanol solta um gás quase puro, que hoje vai para o ar [The CO₂ from the vats: Every ethanol mill gives off an almost pure gas that now goes into the air] (Version 1.0.0) [Data set]. Essencial. https://aikiesan.github.io/essencial-geo/en/maps/089-co2-das-dornas-sp/

No. 090 Energy · biomass Biogenic carbon 2/4

The CO₂ in biogas

To become biomethane, biogas must shed its CO₂, almost half its volume

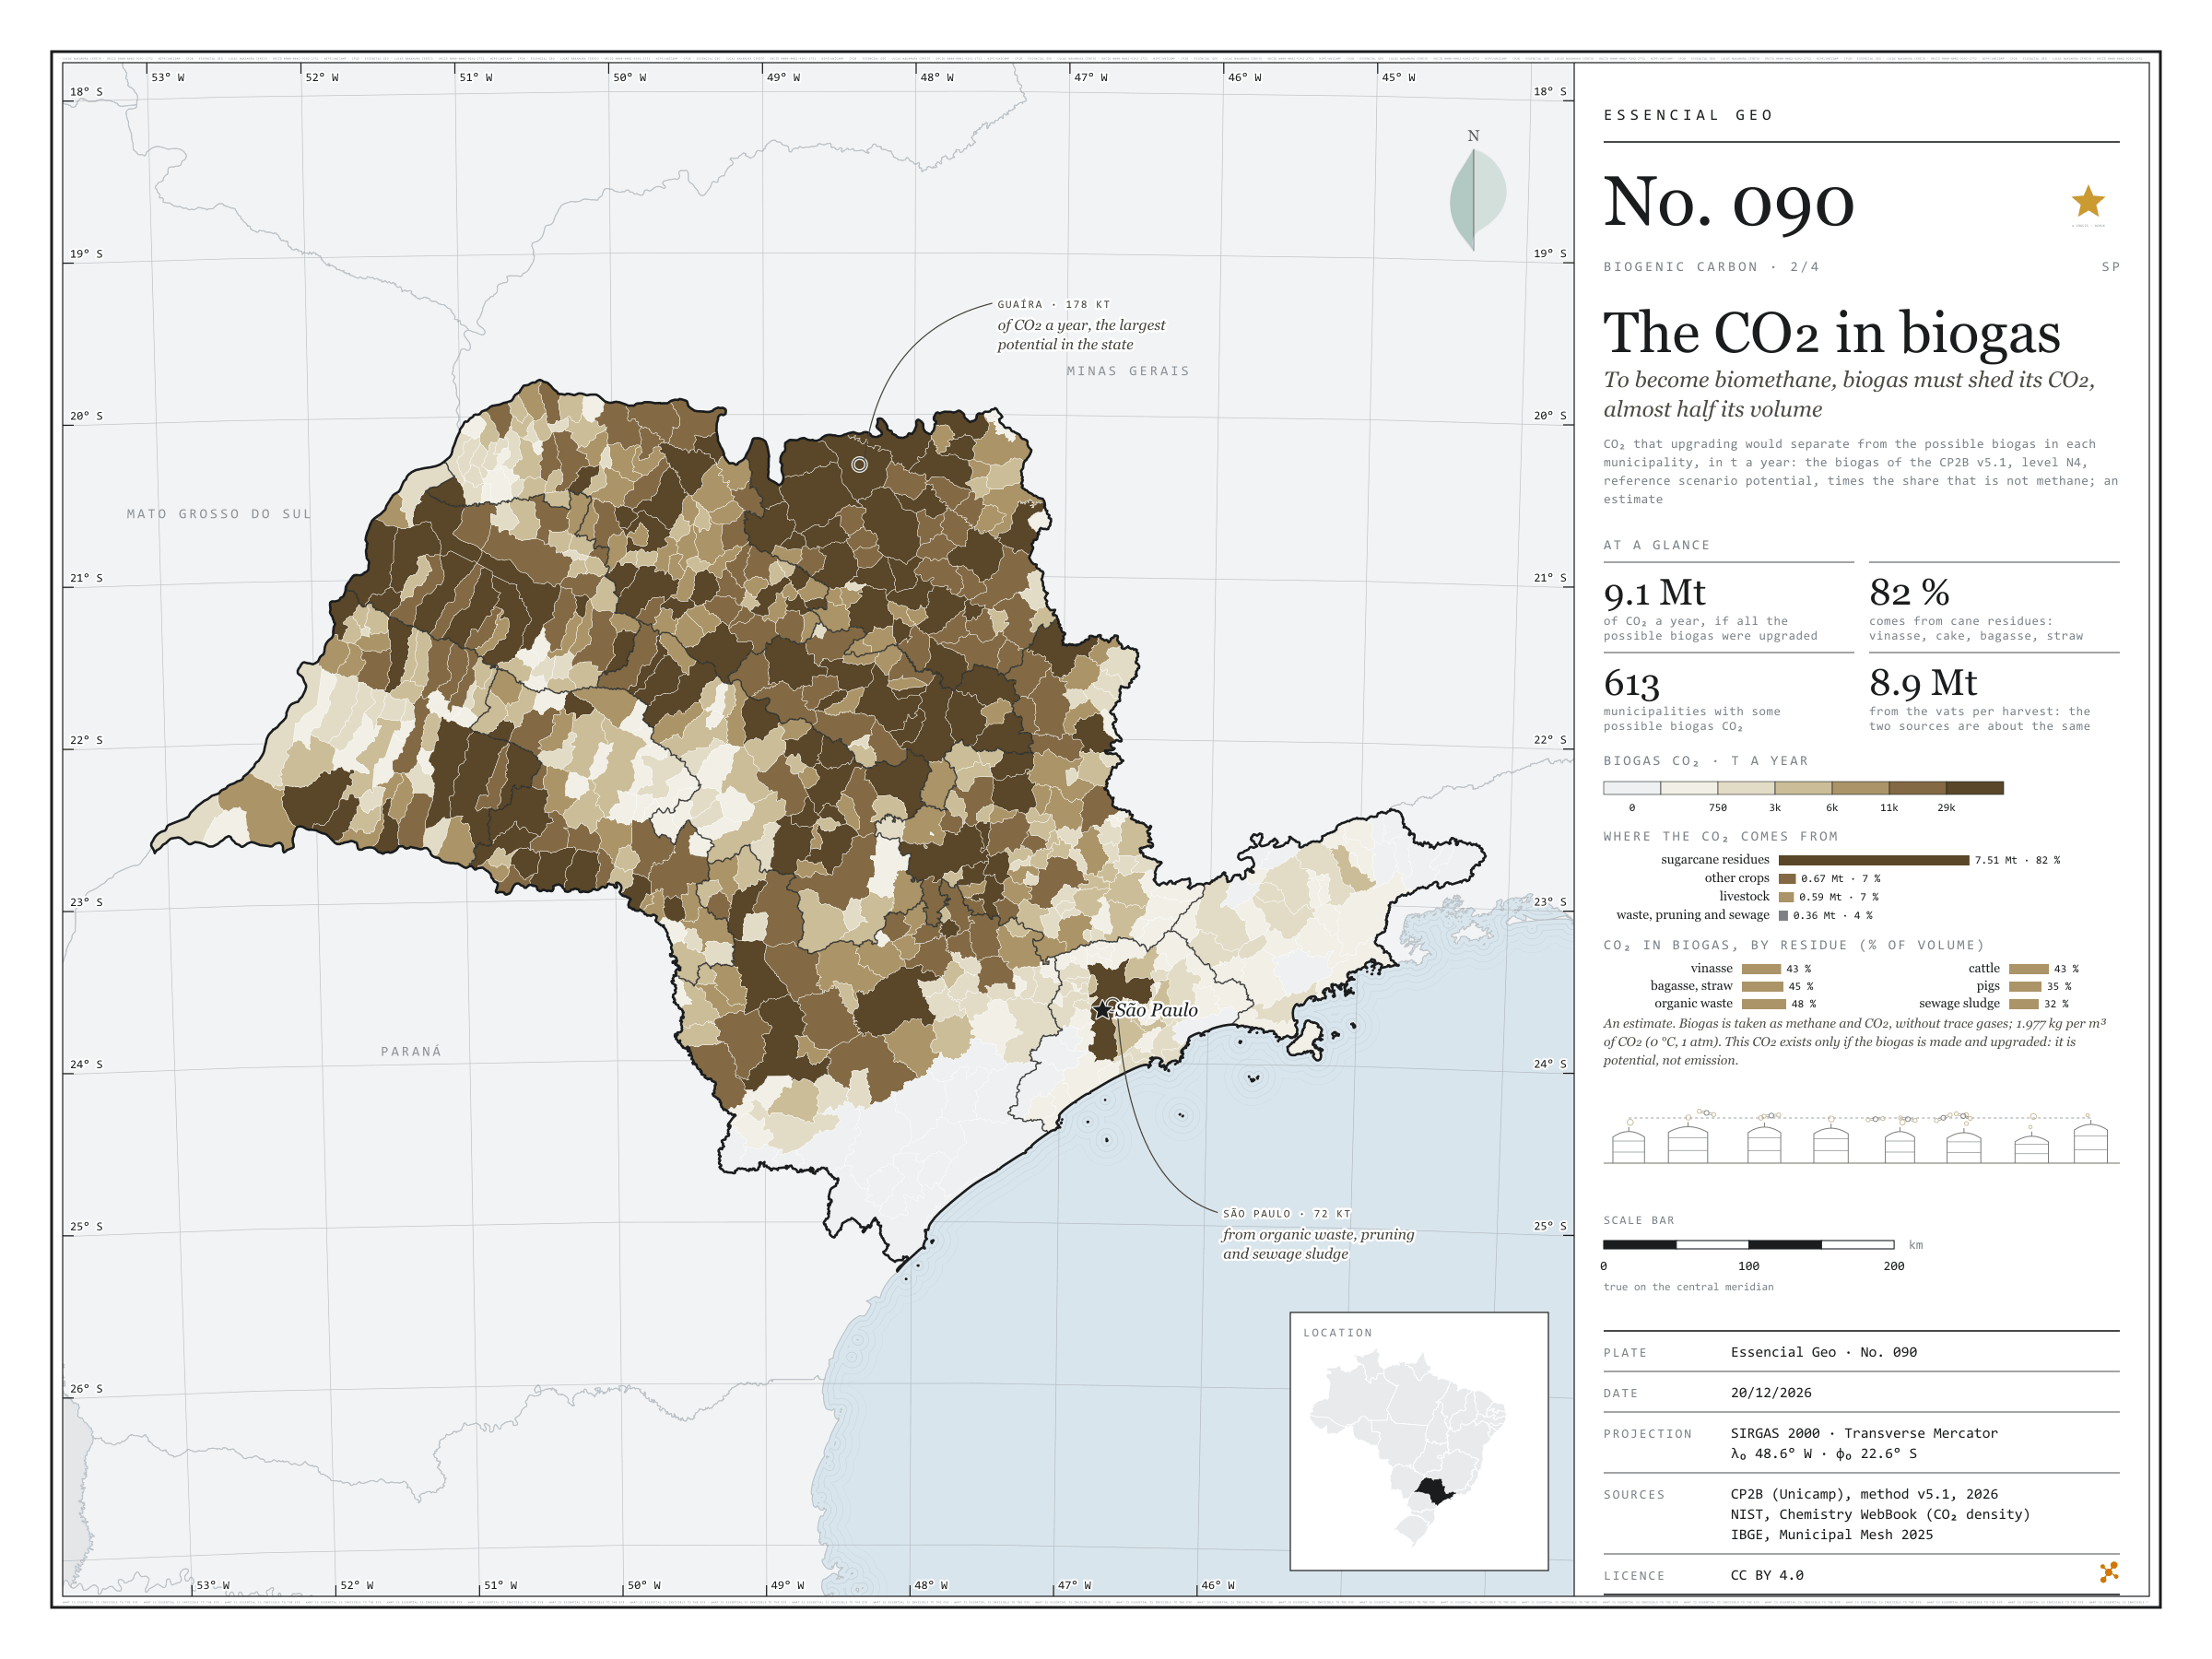
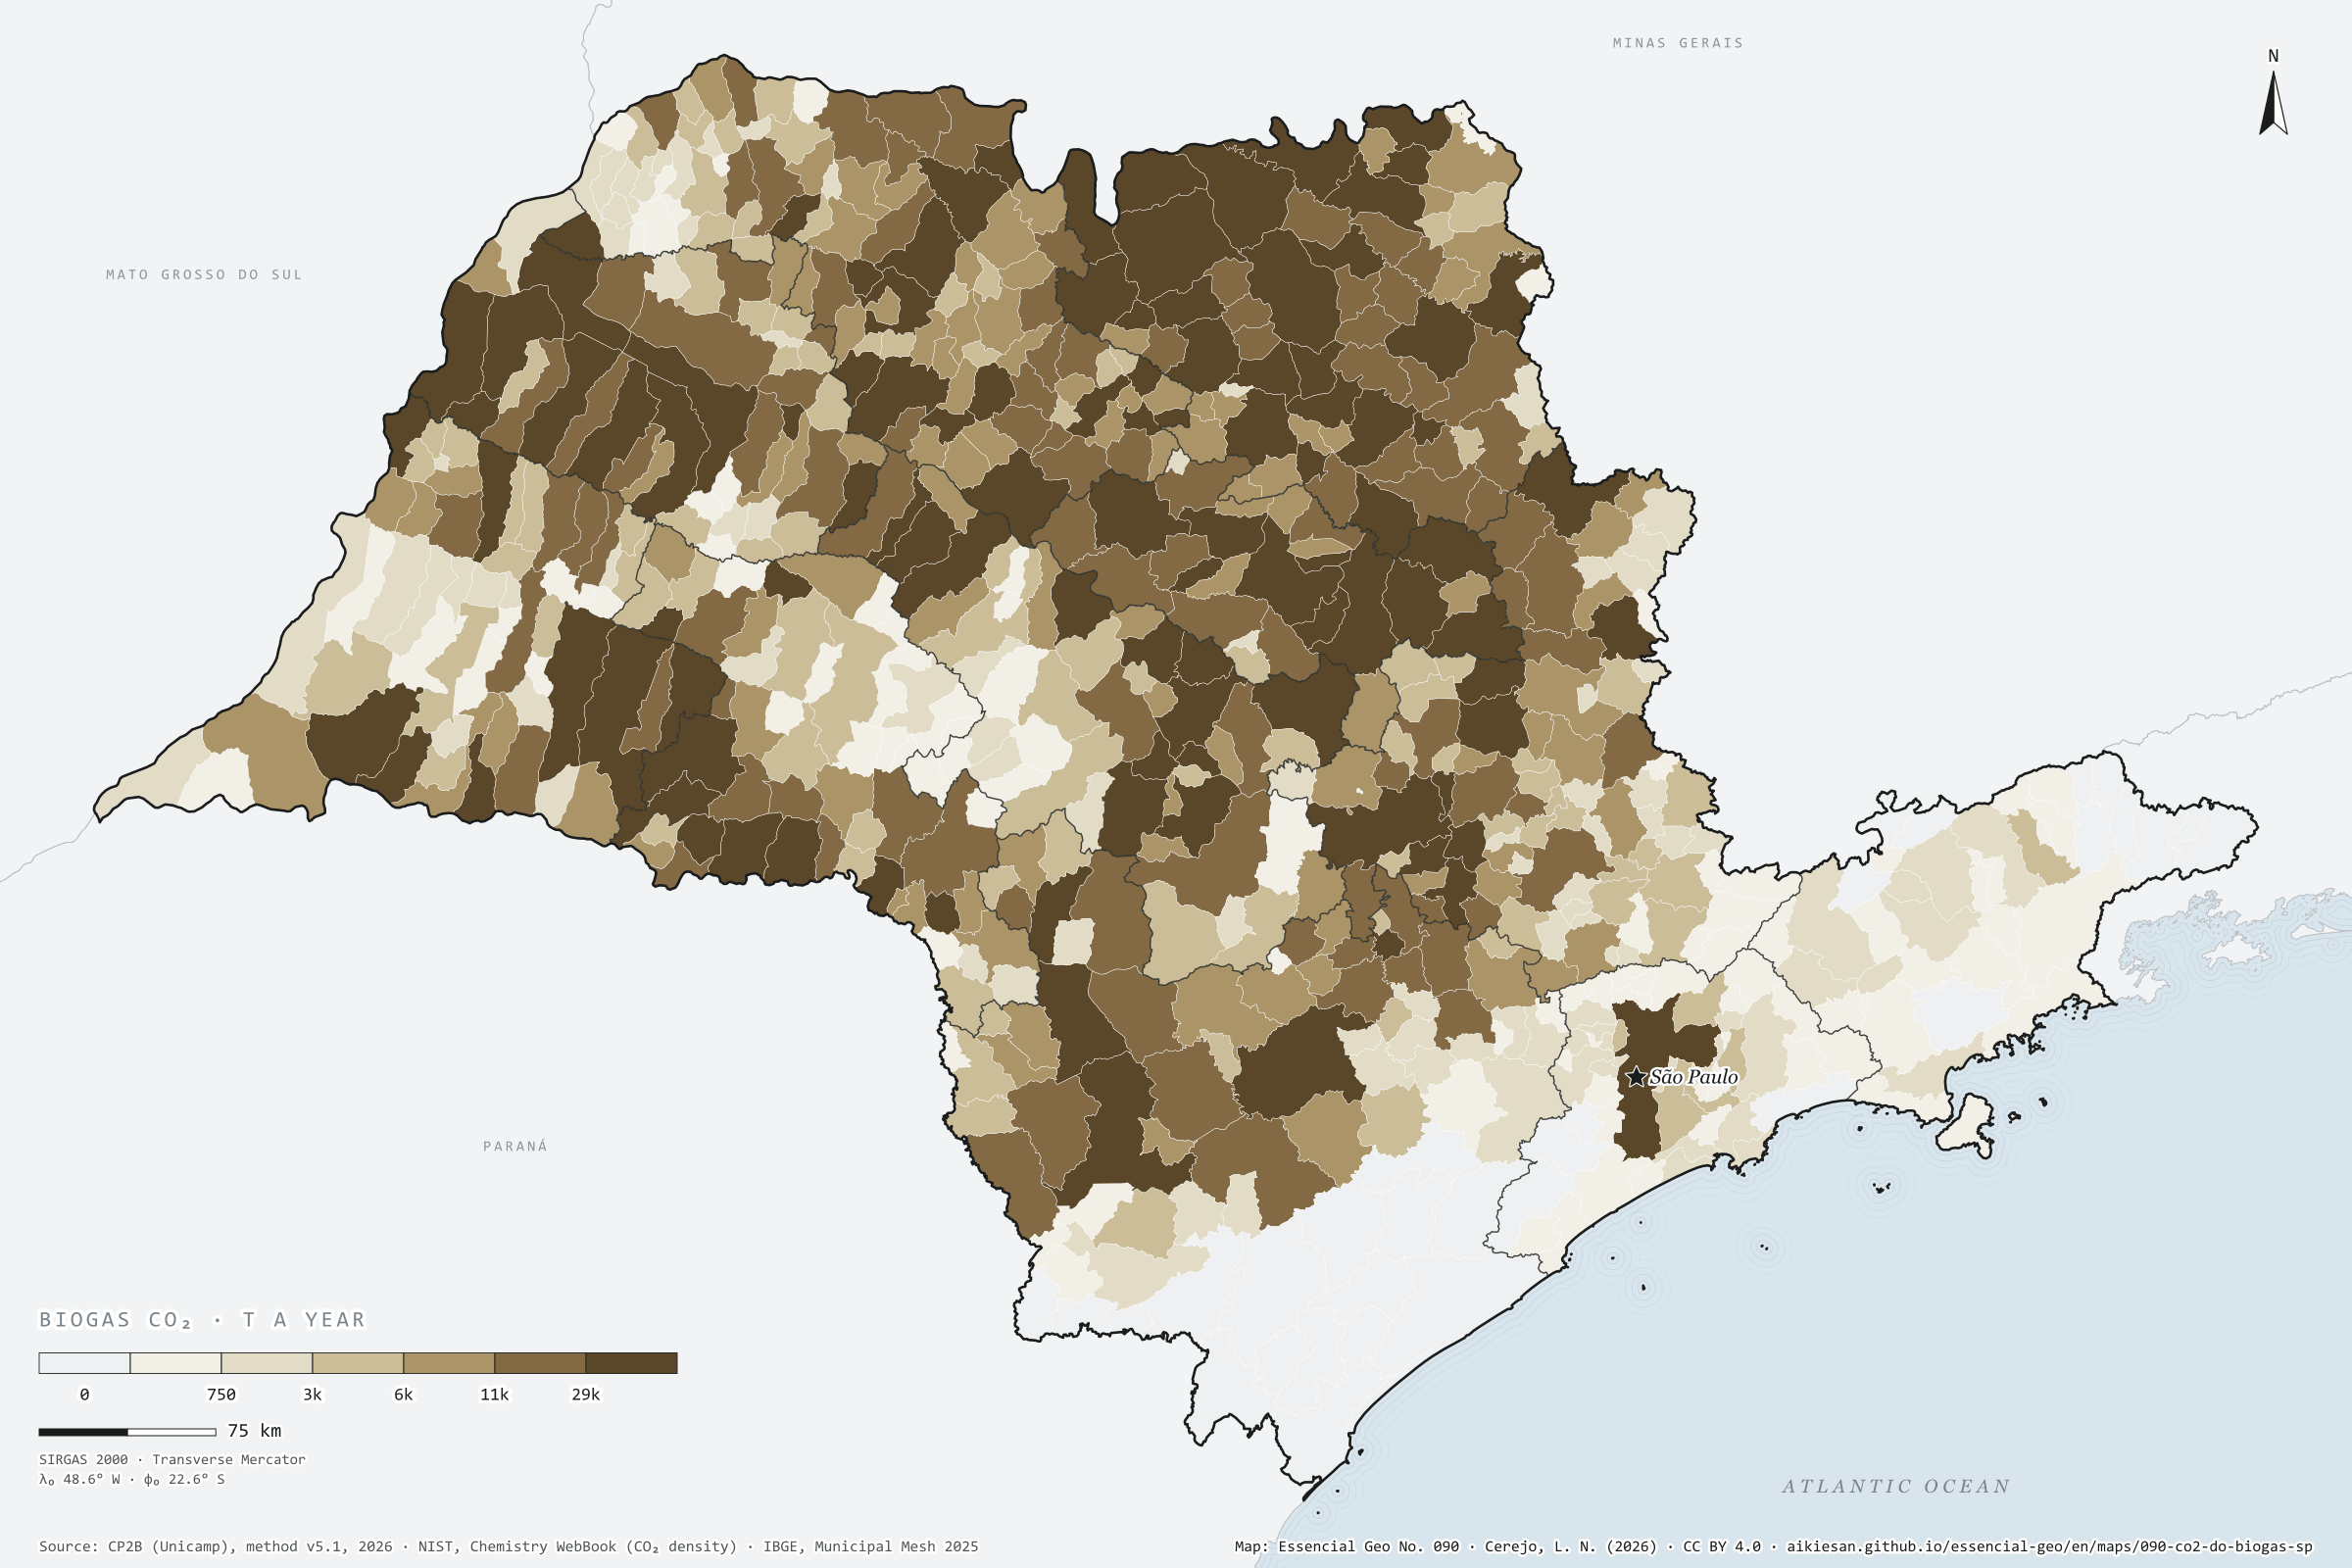
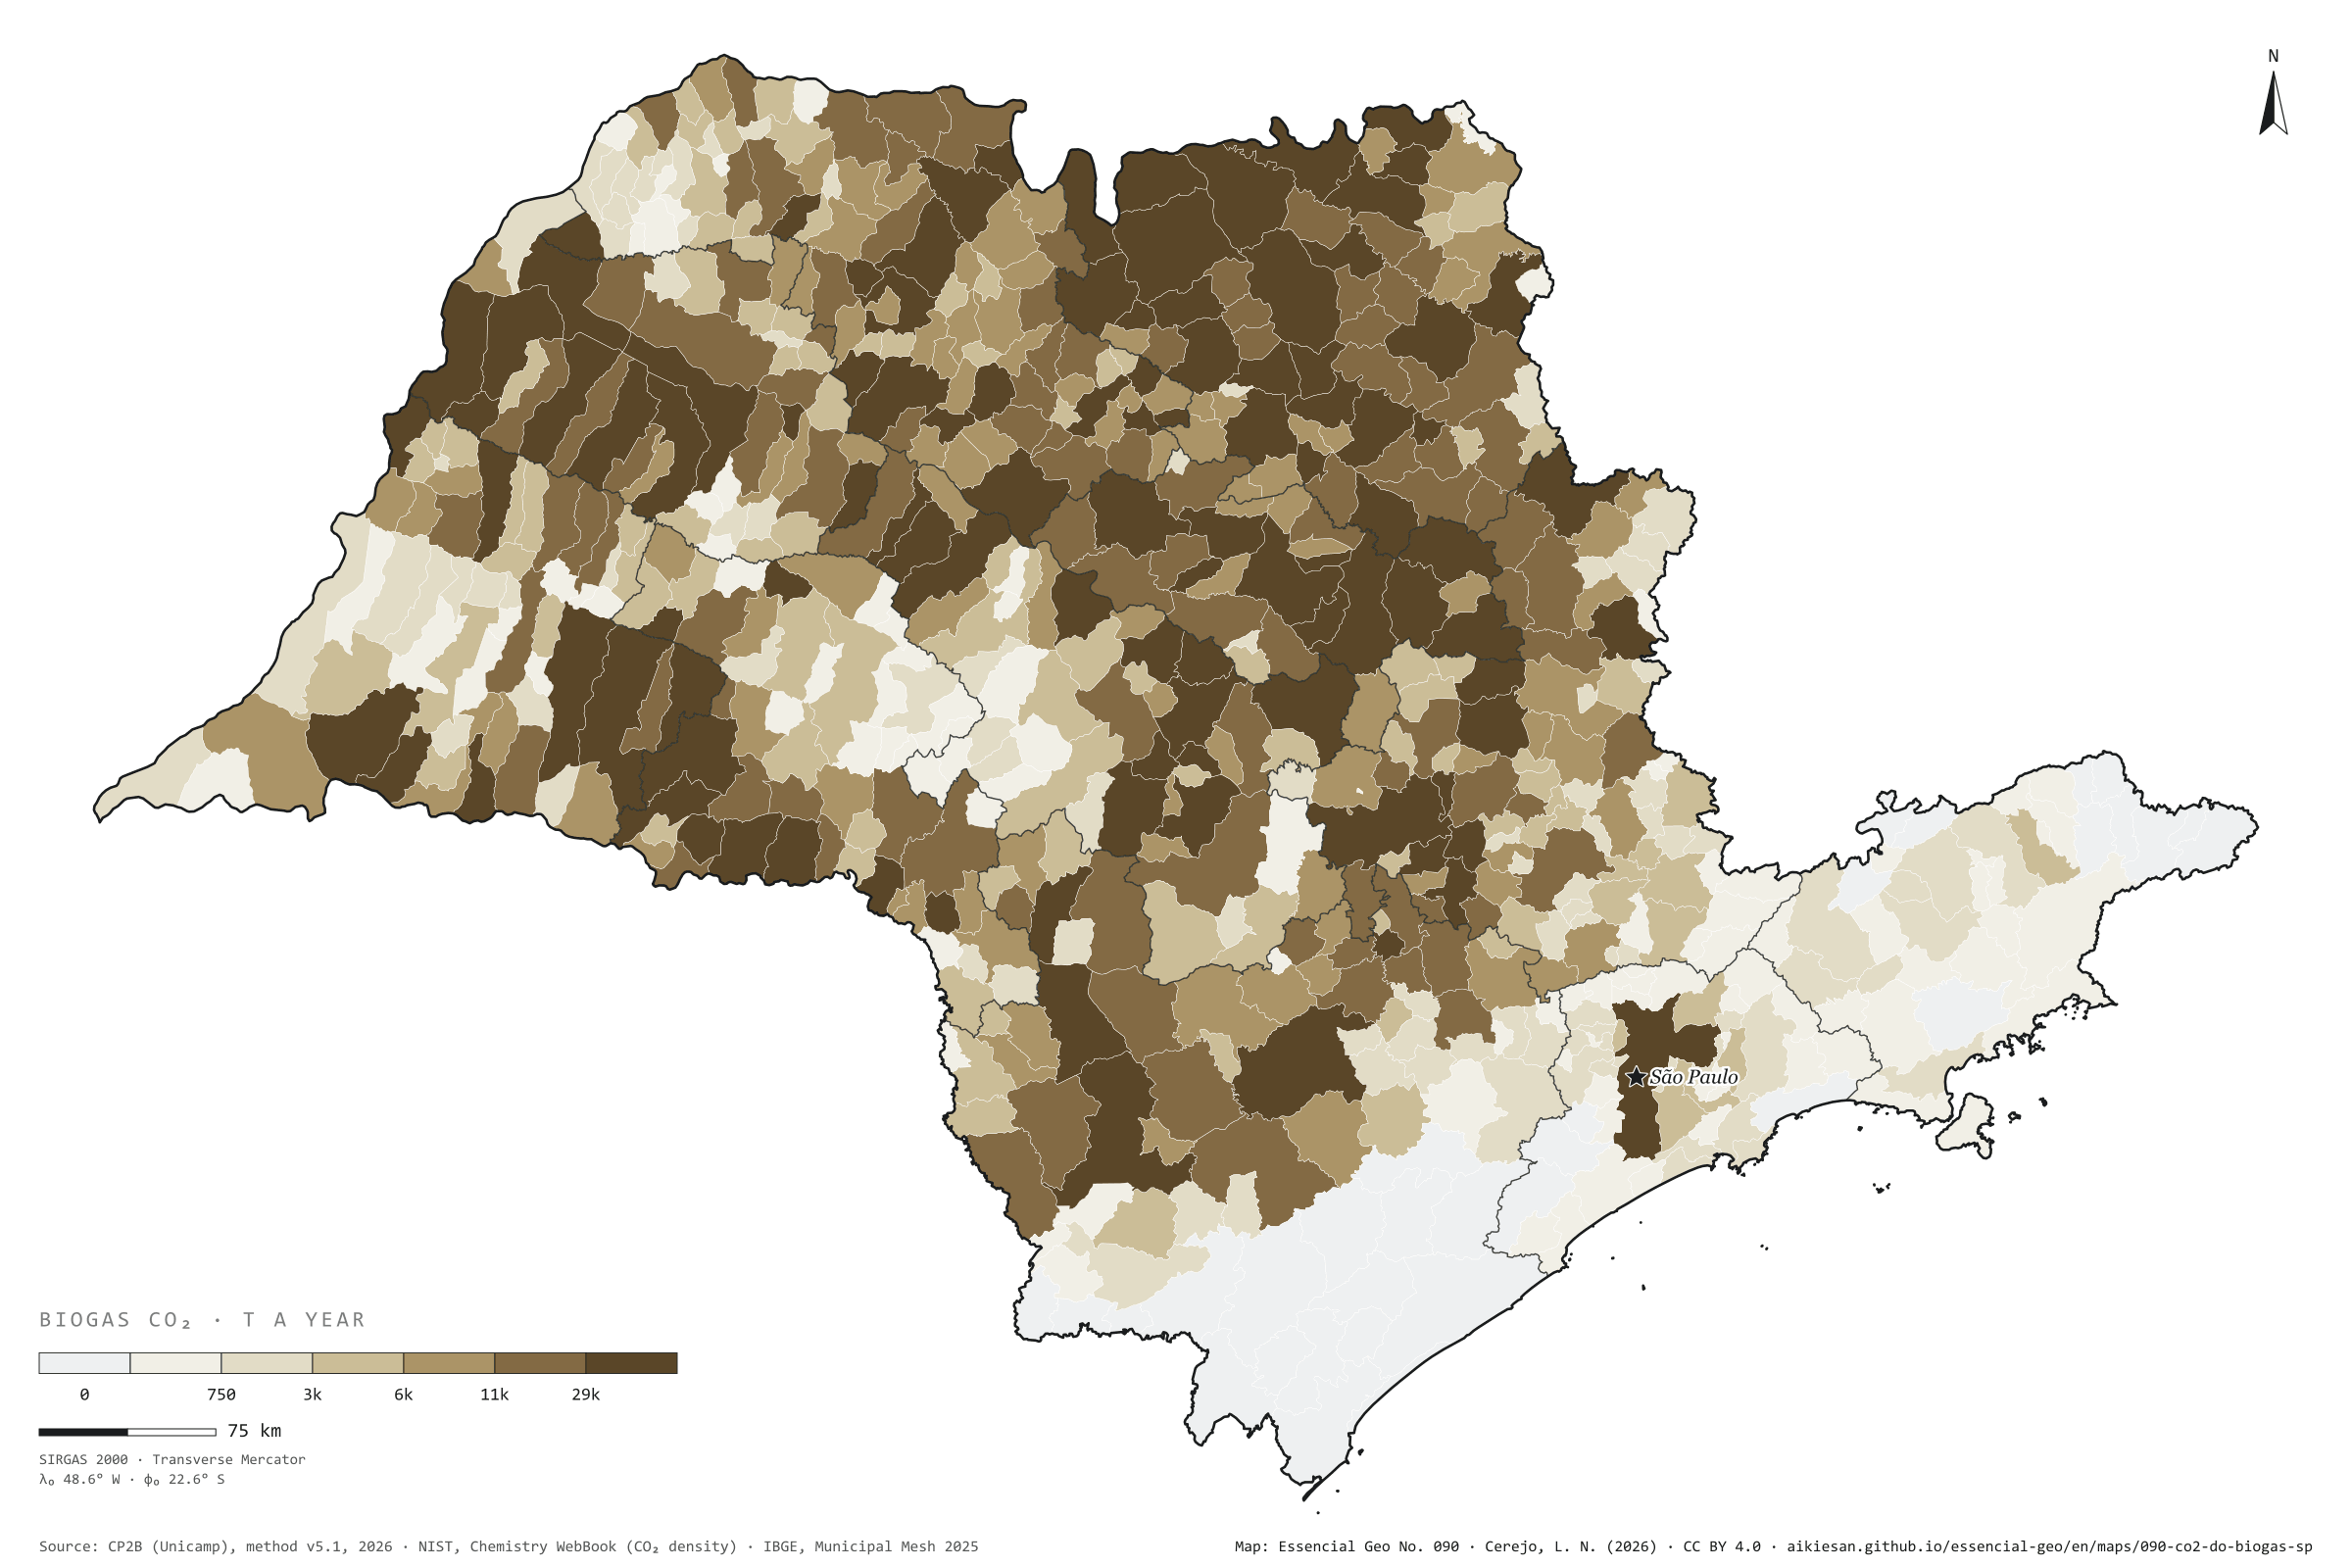
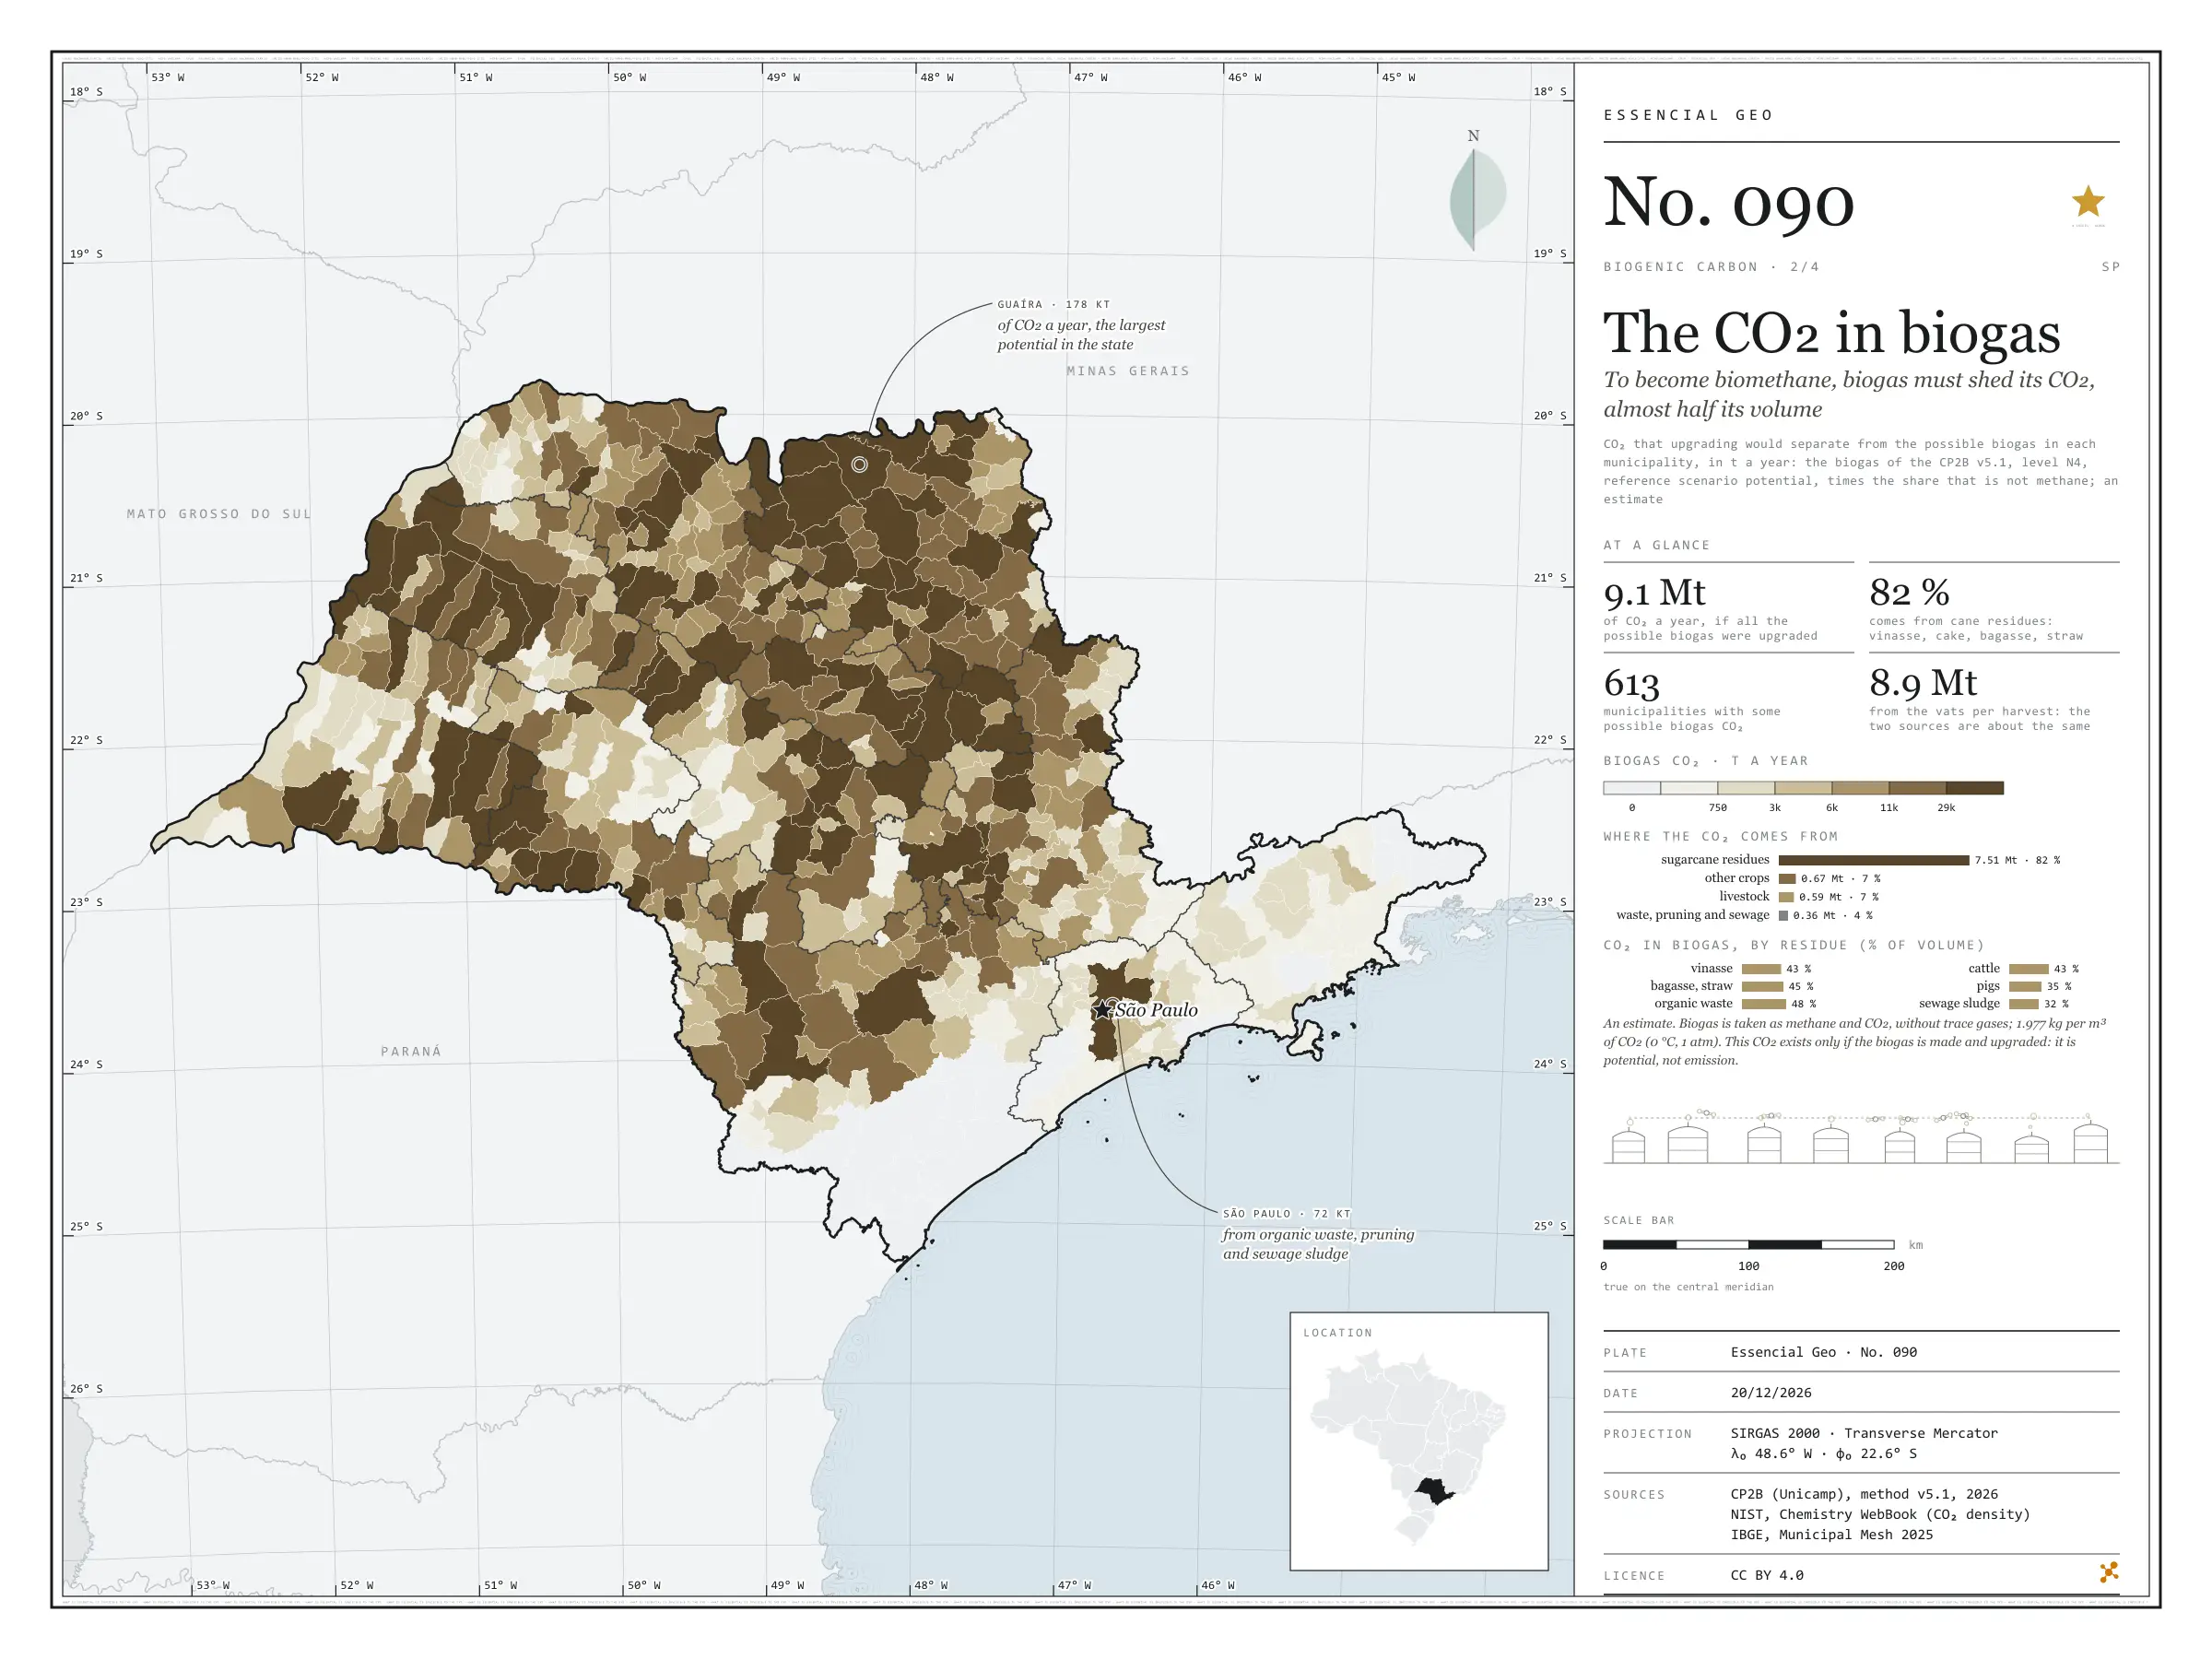
Fig. 090 São Paulo State (SP) EPSG:4674 Source: CP2B (Unicamp), NIST, IBGE

Biogas leaves the digester as methane and CO₂; the CO₂ takes up 32% to 48% of the volume, depending on the residue. To become biomethane, which can enter the gas grid, biogas goes through upgrading, which separates out this CO₂, a concentrated, biogenic gas. If all the possible biogas in São Paulo were made and upgraded, on the CP2B potential (level N4, reference scenario), about 9.1 million t of CO₂ a year would come out, almost as much as the ethanol vats release in a harvest. 82% would come from cane residues: vinasse, filter cake, bagasse and straw. Guaíra leads with 178,000 t, followed by Morro Agudo with 154,000 and Sertãozinho with 136,000; the capital reaches 72,000 t from organic waste, pruning and sewage sludge. It is a potential, not a current emission, and an estimate. Second plate of the collection “Biogenic carbon”.

Technical record · downloads · citation

At a glance

Where the biogas CO₂ would come from (t a year)
  • sugarcane residues 82.2%
  • other crops 7.4%
  • livestock 6.5%
  • waste, pruning and sewage 3.9%
Largest municipalities (t of CO₂ a year)
  • Guaíra 177,918
  • Morro Agudo 154,321
  • Sertãozinho 136,382
  • Pontal 119,943
  • Pitangueiras 112,591

Layers

  • municipios polygon 645 municipalities: biogas upgrading CO₂, total and by group (cane, crops, livestock, urban), and N4 biogas (same GPKG as plate 089)

Metadata

Sources
CP2B (Unicamp) — biogas and biomethane potential by municipality, method v5.1 (level N4, reference scenario) (2026)
NIST — Chemistry WebBook (CO₂ density at 0 °C and 1 atm) (2023)
IBGE — Municipal Mesh 2025 (2025)
Extent
São Paulo State (SP)
CRS / Projection
SIRGAS 2000 (EPSG:4674)
EPSG:4674
Software
Node.js · d3-geo · QGIS
Method
For each municipality and residue, the biogas of the CP2B v5.1 potential (level N4, reference scenario) times the share of the volume that is not methane (1 − the residue’s CH₄ fraction), converted to mass at 1.977 kg of CO₂ per normal m³; summed by municipality and by residue group.
Version
v1.0.0
Licence
CC BY 4.0
DOI
being registered on Zenodo

Downloads

Figure to reuse

The map without a frame, with legend, scale, reference system and credit written on it: ready for papers, lectures and slides. In two versions: with the basemap (neighbours and sea) or only the mapped area, on white.

Point a camera at it to open this page.

How to cite

Cerejo, L. N. (2026). O CO₂ do biogás: para virar biometano, o biogás solta o CO₂, quase metade do volume [The CO₂ in biogas: To become biomethane, biogas must shed its CO₂, almost half its volume] (Version 1.0.0) [Data set]. Essencial. https://aikiesan.github.io/essencial-geo/en/maps/090-co2-do-biogas-sp/

No. 091 Energy · biomass Biogenic carbon 3/4

Biogenic versus fossil

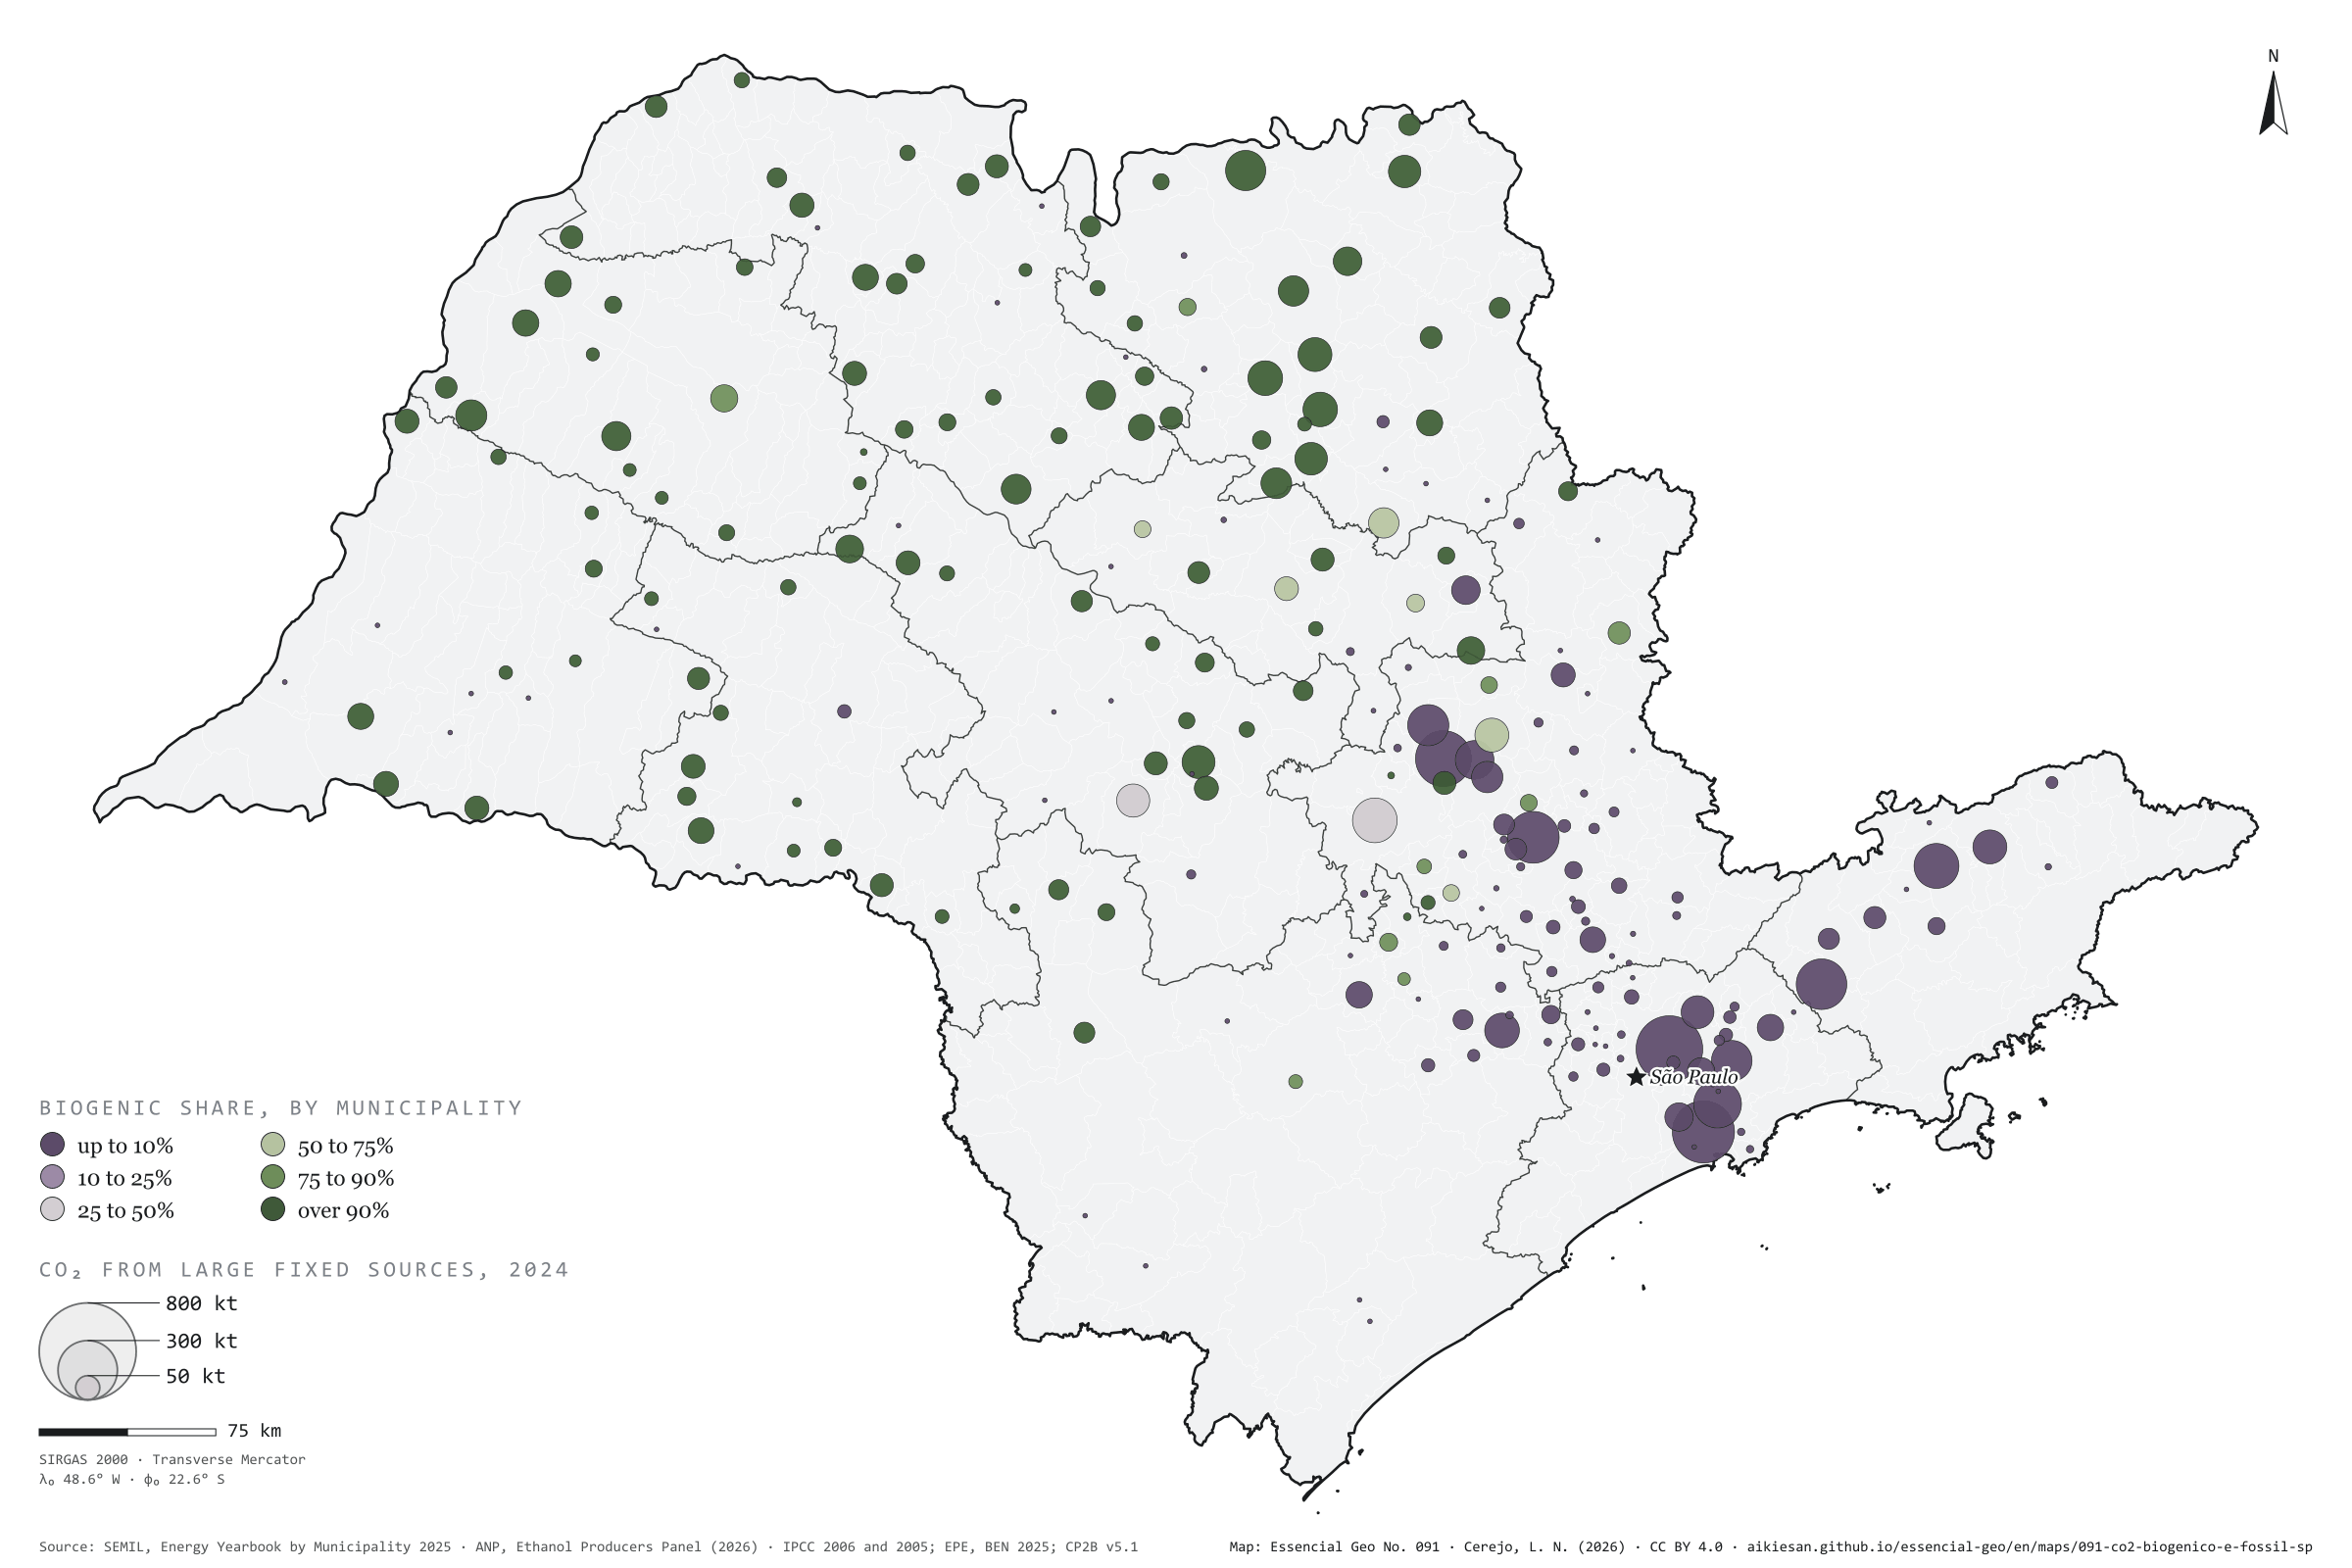
In the state’s large fixed sources, half the CO₂ comes from sugarcane

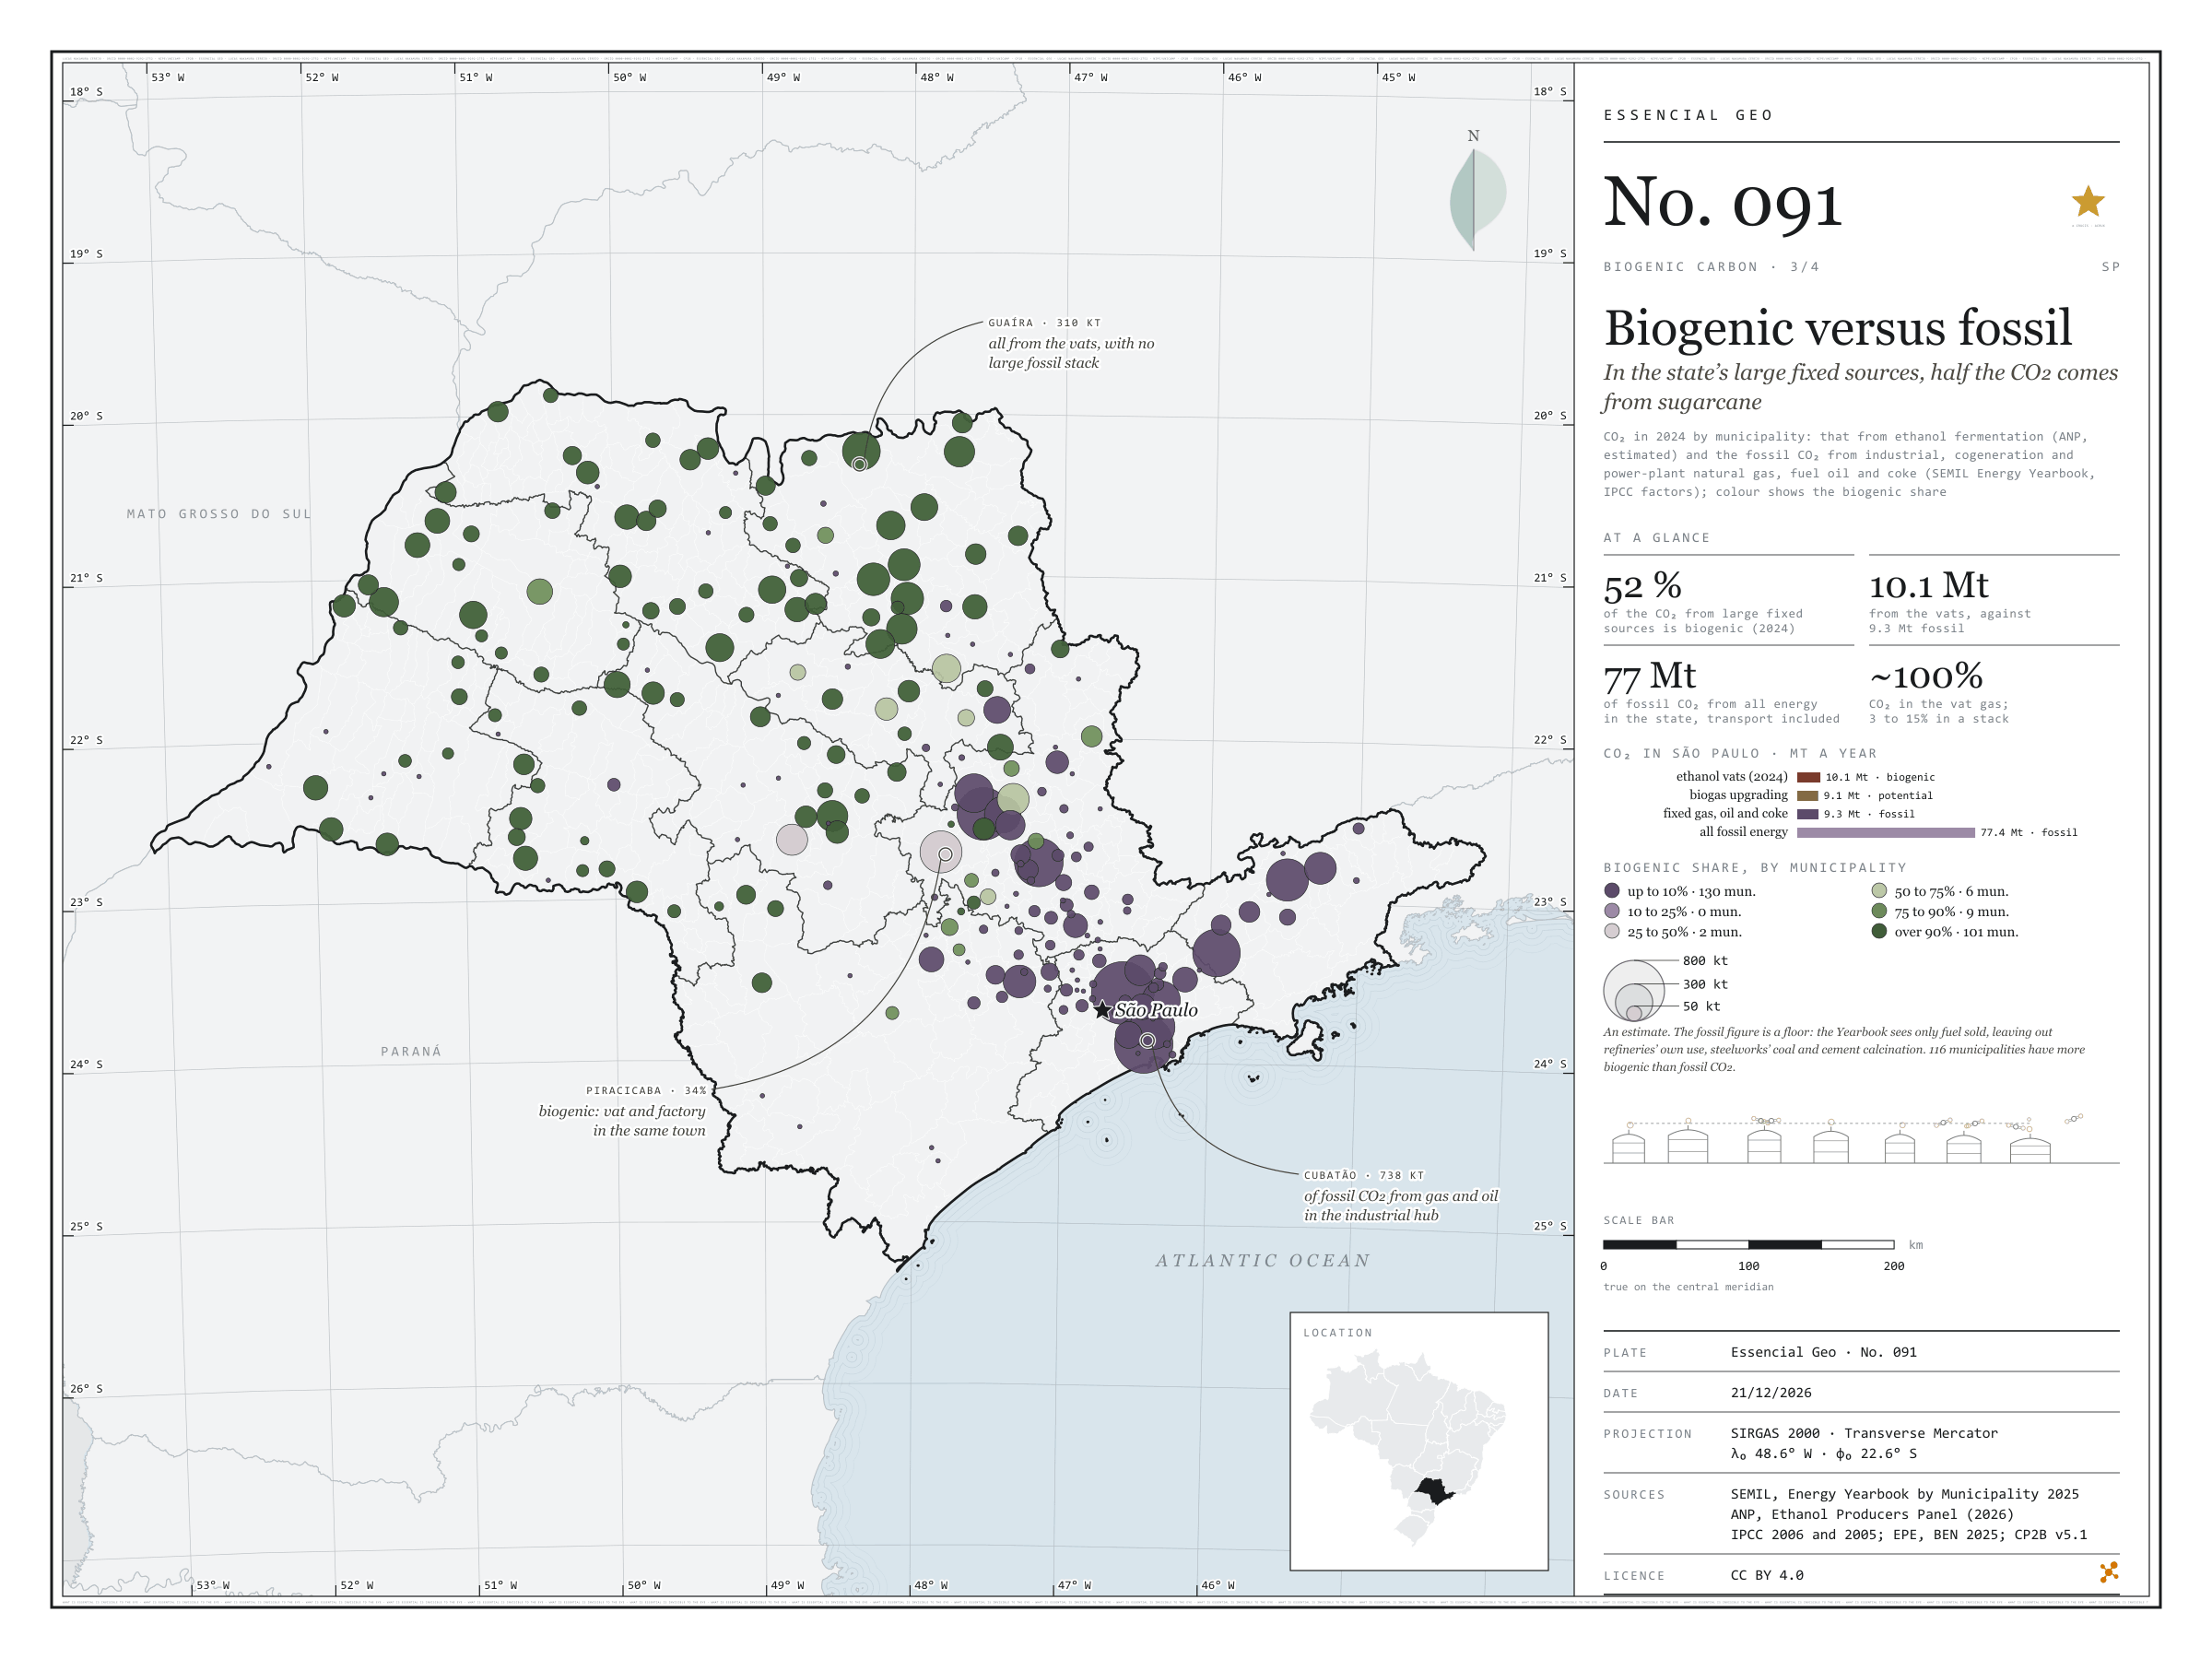
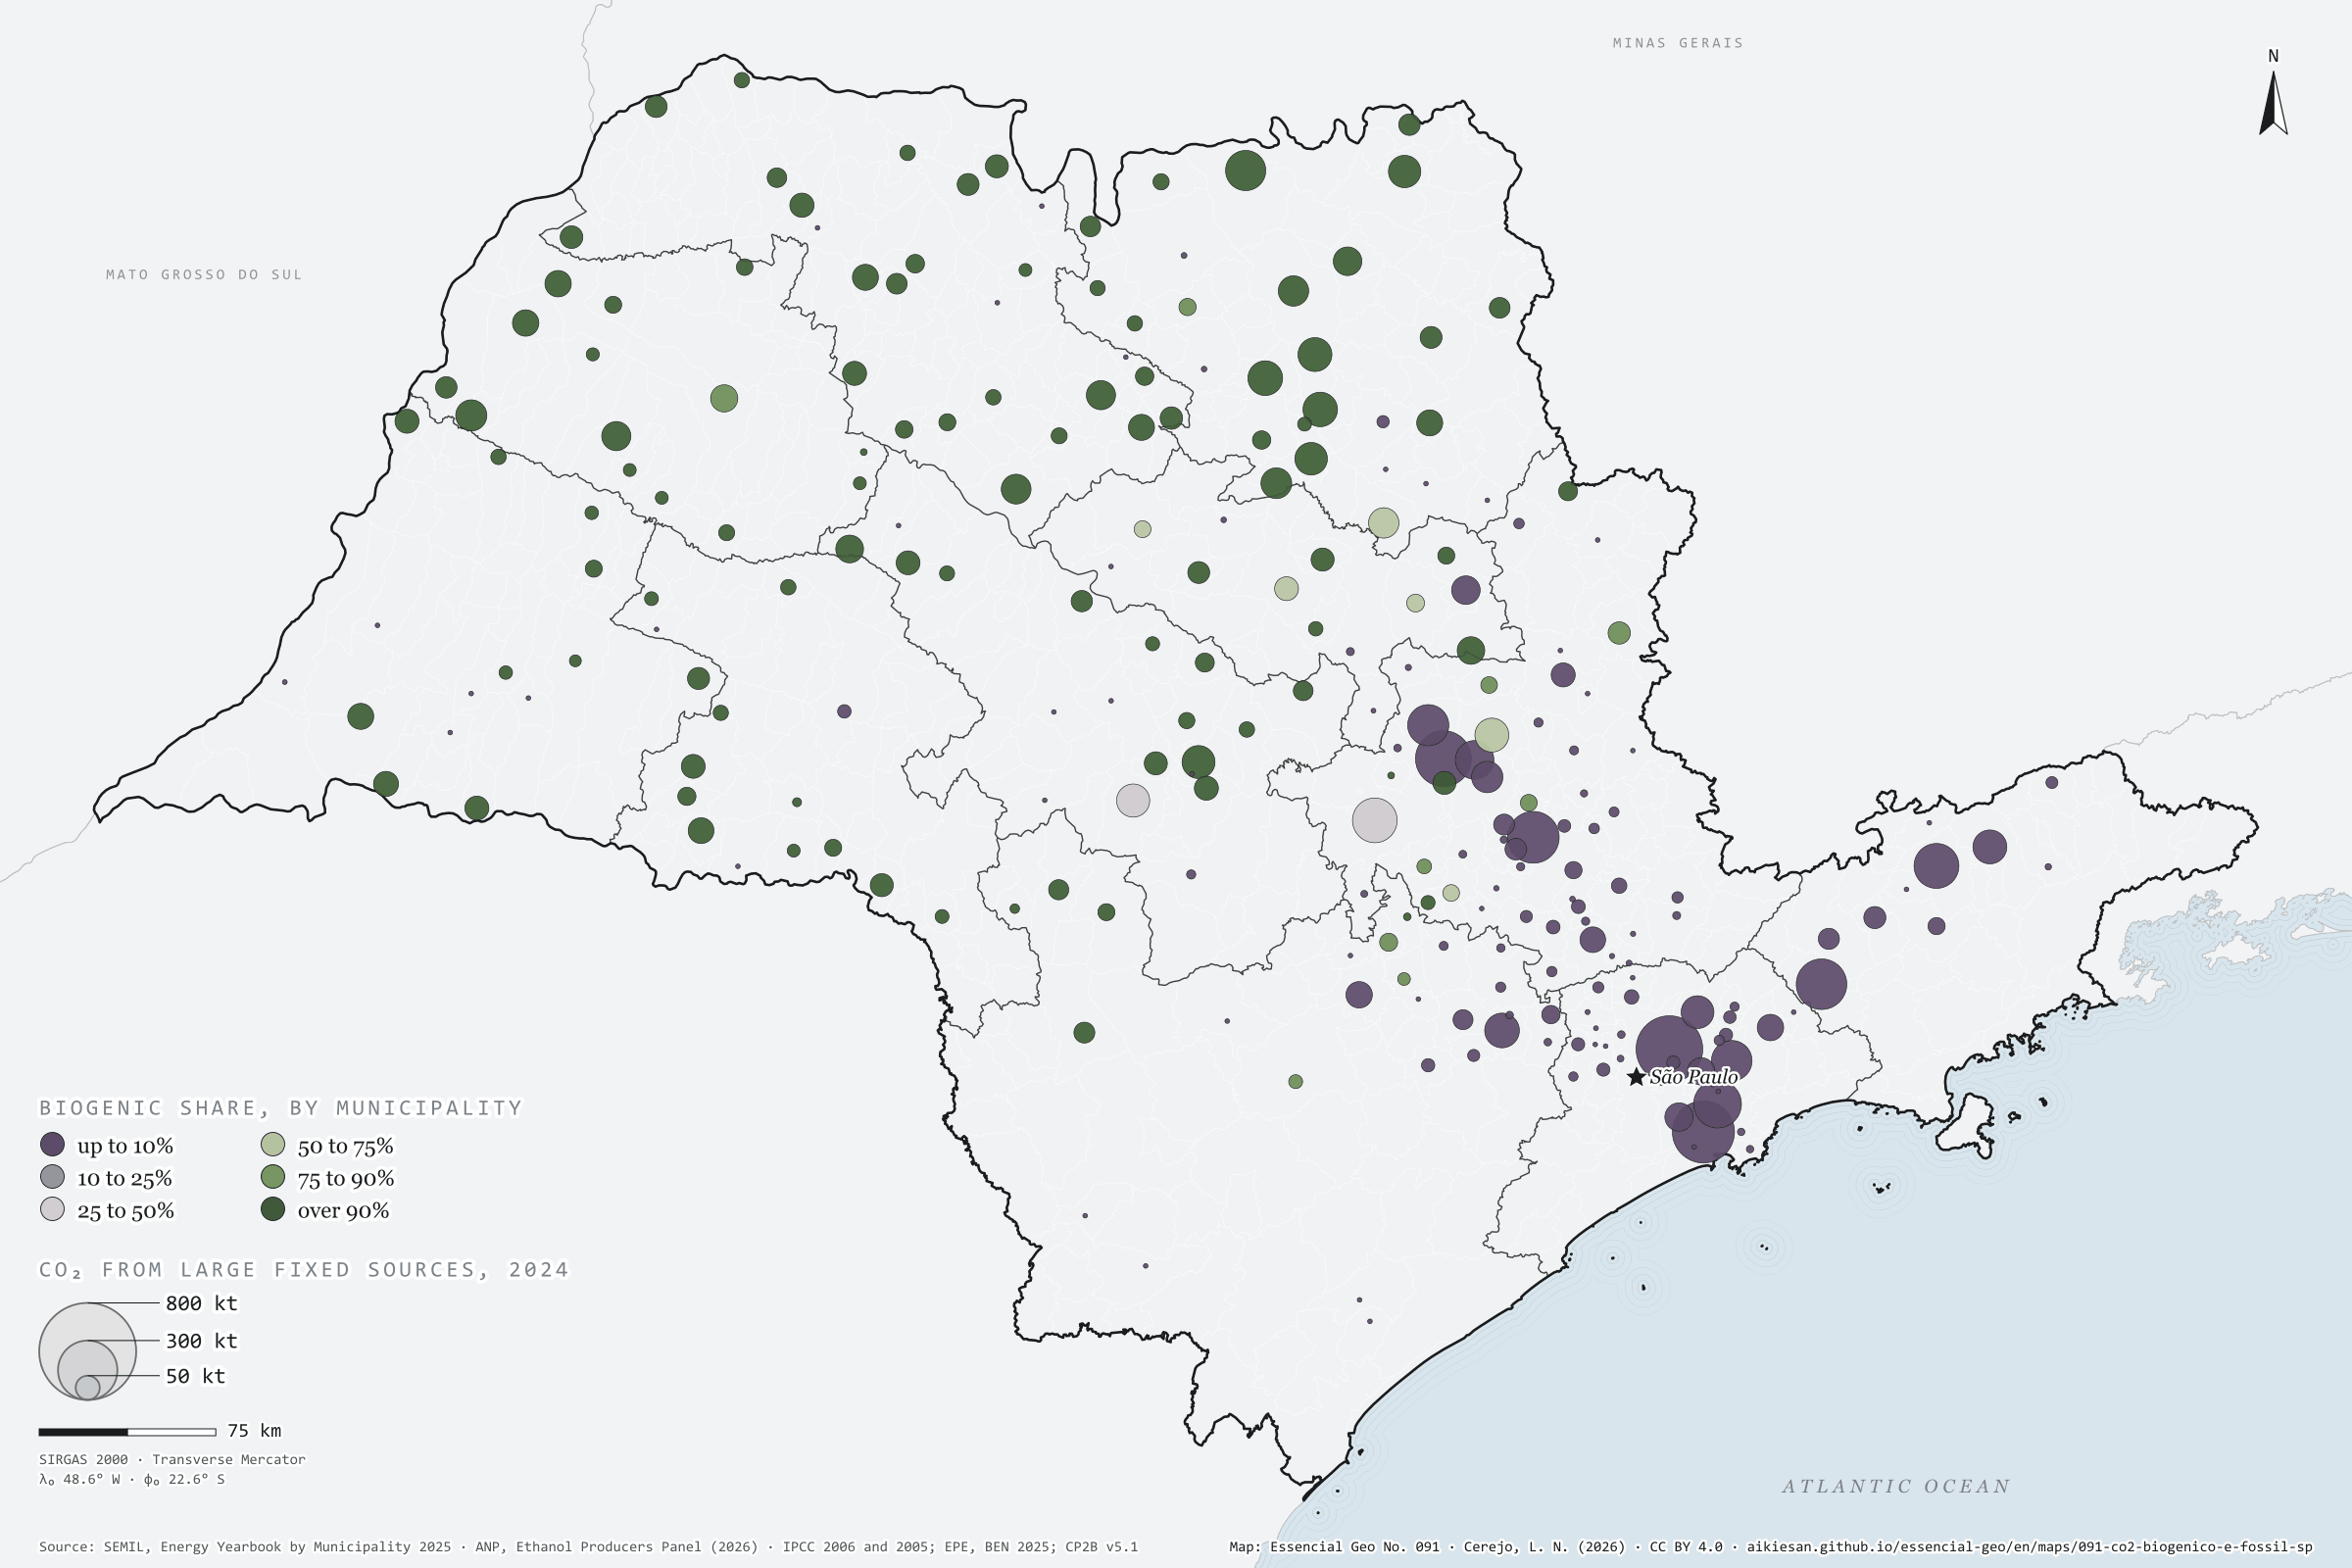
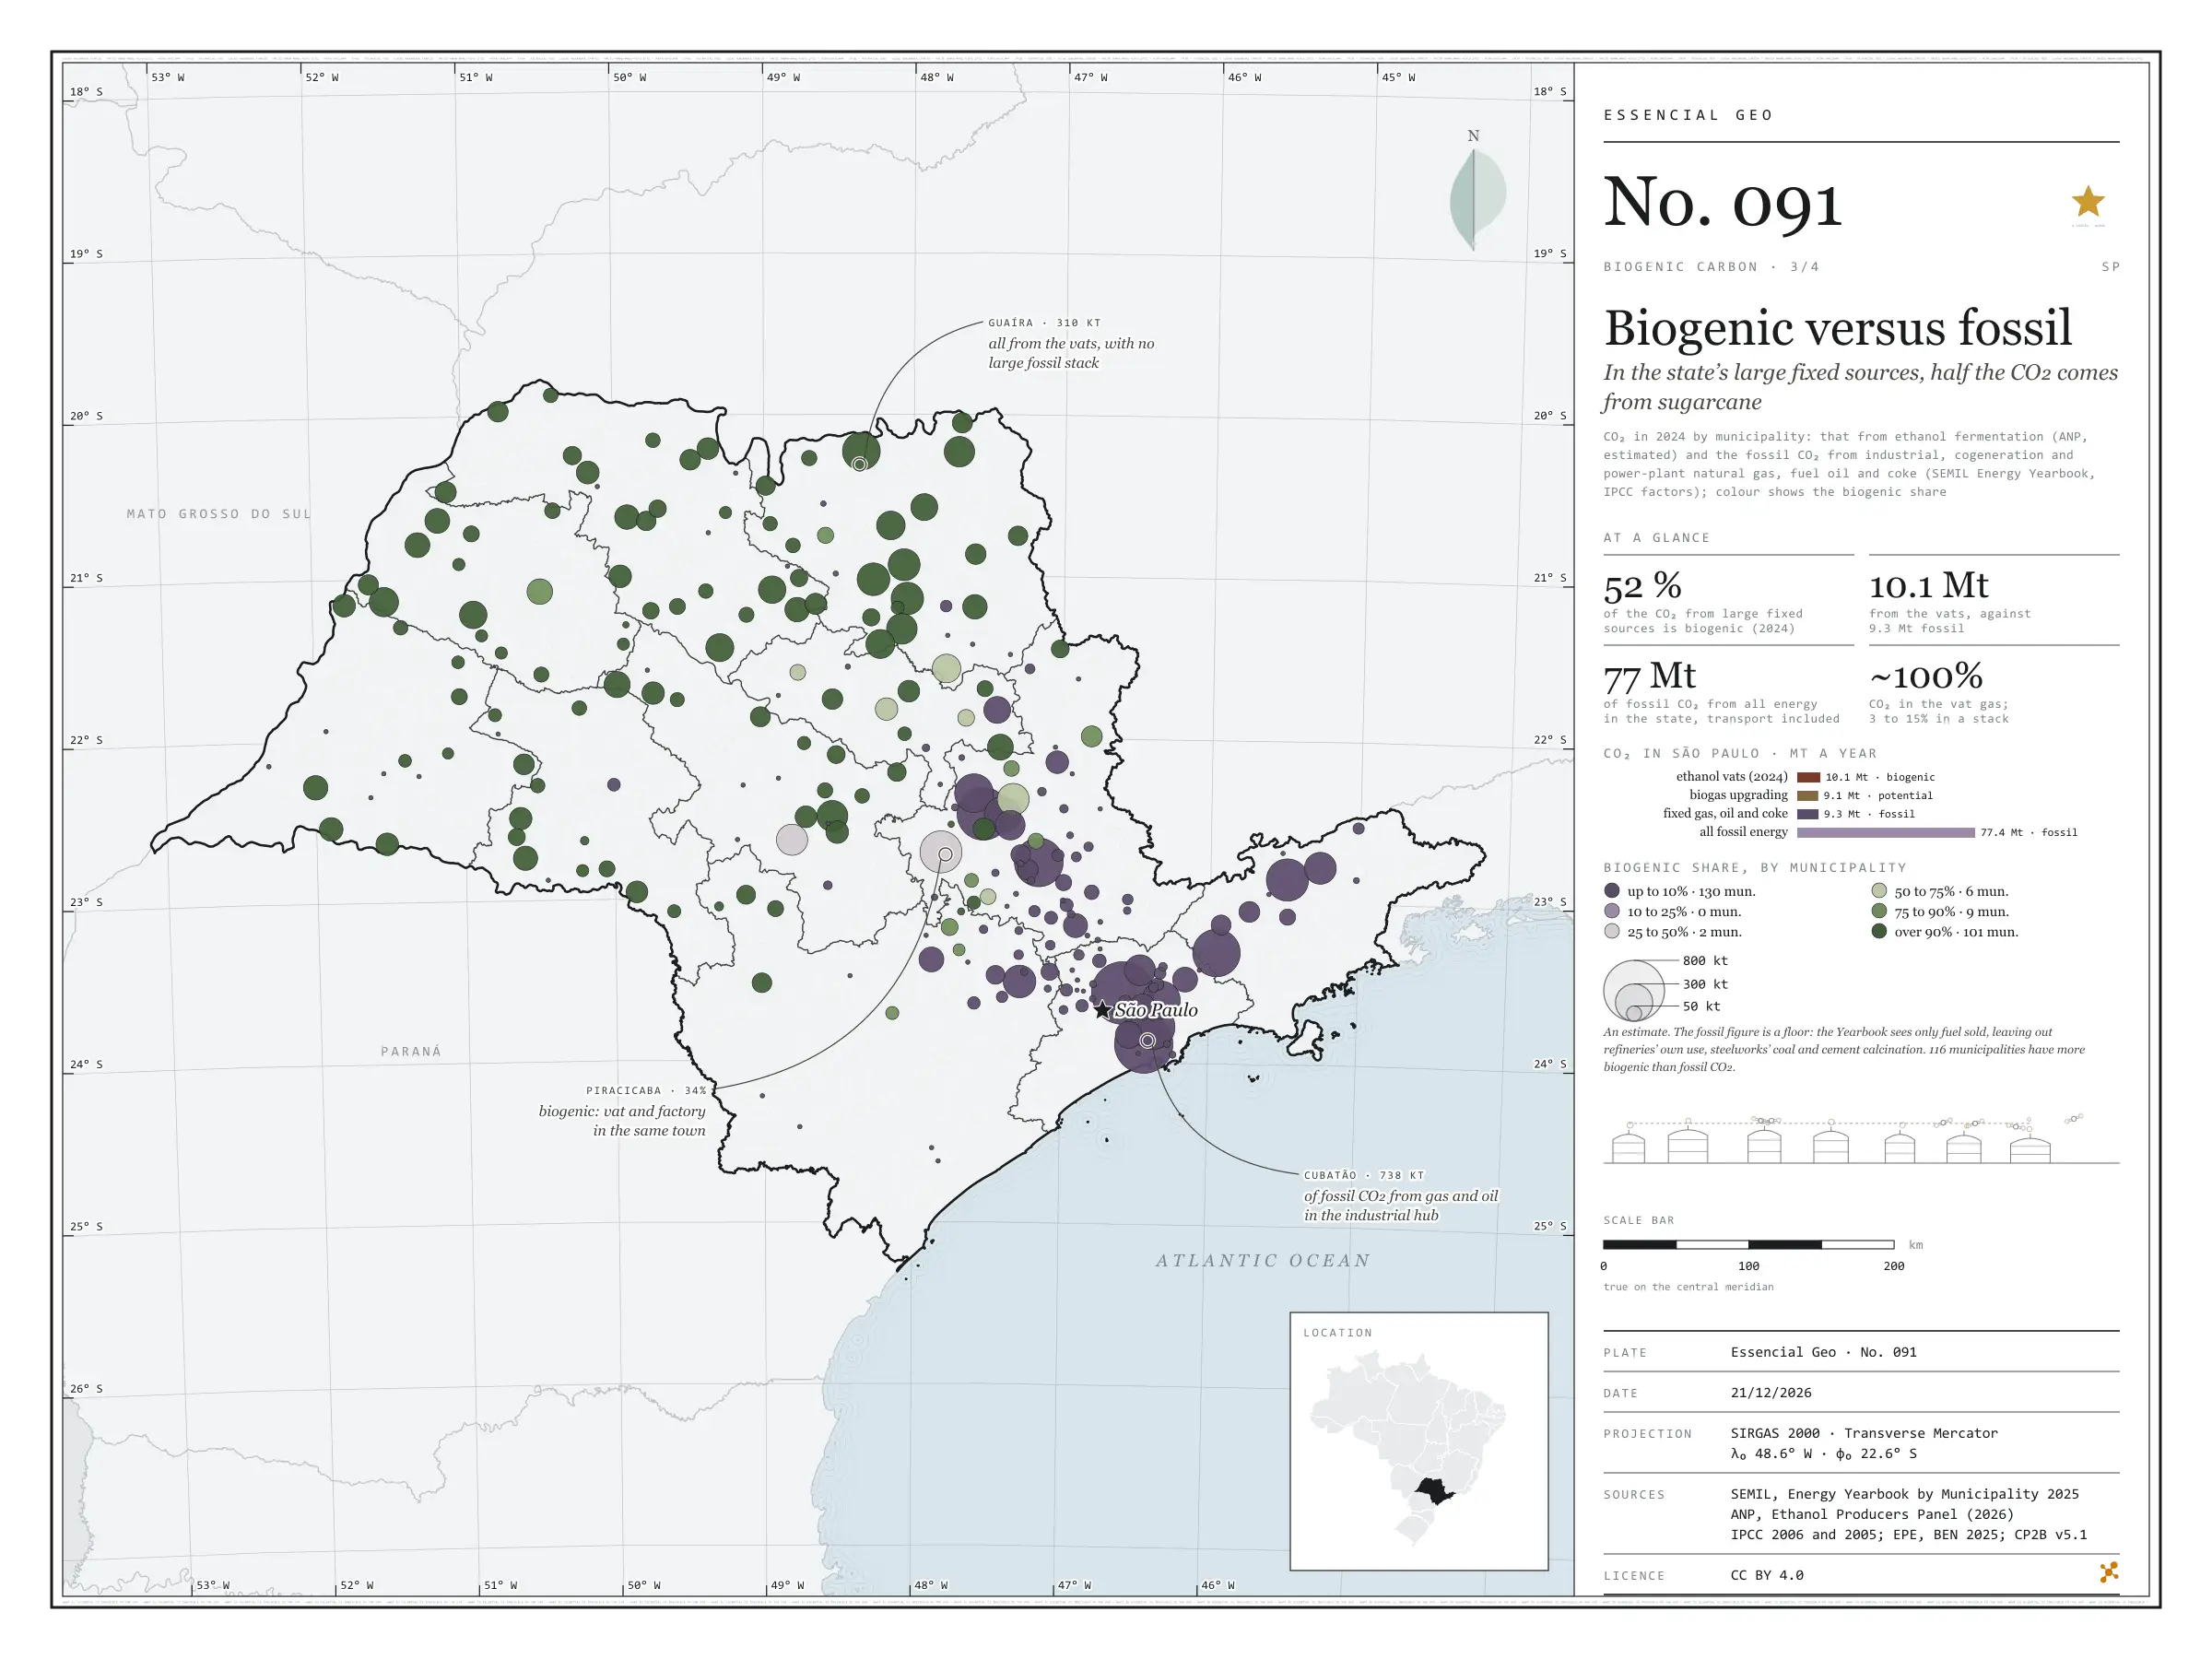
Fig. 091 São Paulo State (SP) EPSG:4674 Source: SEMIL (SP), ANP, IPCC (2006), IPCC (2005), EPE, IBGE

The gas leaving an ethanol vat is almost 100% CO₂; a combustion stack carries 3% to 15%. That is why mills are among the easiest sources to capture. In 2024, São Paulo’s vats released about 10.1 million t of biogenic CO₂. Natural gas burnt by industry, cogeneration and power plants, fuel oil and coke added up to 9.3 million t of fossil CO₂, on the SEMIL Energy Yearbook and IPCC factors. In these large fixed sources, 52% of the CO₂ comes from sugarcane. The map splits: across the cane-growing interior, 116 municipalities have more biogenic than fossil CO₂; fossil CO₂ concentrates in the capital (850,000 t), Cubatão (738,000), Santa Gertrudes, Paulínia and Jacareí. In Piracicaba the two mix: 34% is biogenic. The fossil figure here is a floor. Third plate of the collection “Biogenic carbon”.

Technical record · downloads · citation

At a glance

CO₂ from large fixed sources in 2024 (t)
  • ethanol vats (biogenic) 52.1%
  • gas, oil and coke (fossil) 47.9%
Largest fixed fossil sources (t of CO₂ in 2024)
  • São Paulo 849,580
  • Cubatão 738,384
  • Santa Gertrudes 597,415
  • Paulínia 513,832
  • Jacareí 489,794

Layers

  • municipios polygon 645 municipalities: fossil CO₂ (gas, oil, coke and all energy), vat CO₂ in 2024 and biogenic share (same GPKG as plate 089)

Metadata

Sources
SEMIL (SP) — Energy Yearbook by Municipality of São Paulo State 2025, base year 2024 (natural gas and oil product use by municipality) (2025)
ANP — Ethanol Producers Dynamic Panel (2024 output and capacity by mill) (2026)
IPCC (2006) — Guidelines for National Greenhouse Gas Inventories, vol. 2, ch. 1, Table 1.4 (stationary combustion CO₂ emission factors) (2006)
IPCC (2005) — Special Report on Carbon Dioxide Capture and Storage, Table 2.1 (CO₂ concentration by source type) (2005)
EPE — Brazilian Energy Balance 2025 (net calorific values) (2025)
IBGE — Municipal Mesh 2025 (2025)
Extent
São Paulo State (SP)
CRS / Projection
SIRGAS 2000 (EPSG:4674)
EPSG:4674
Software
Node.js · d3-geo · QGIS
Method
Fossil CO₂ in 2024 by municipality: industrial, cogeneration and power-generation natural gas use and fuel oil and petroleum coke use (SEMIL Energy Yearbook), times the BEN net calorific value and the IPCC 2006 emission factor; biogenic CO₂ in 2024: ethanol fermentation estimated as in plate 089; biogenic share = biogenic ÷ (biogenic + fossil).
Version
v1.0.0
Licence
CC BY 4.0
DOI
being registered on Zenodo

Downloads

Figure to reuse

The map without a frame, with legend, scale, reference system and credit written on it: ready for papers, lectures and slides. In two versions: with the basemap (neighbours and sea) or only the mapped area, on white.

Point a camera at it to open this page.

How to cite

Cerejo, L. N. (2026). Biogênico contra fóssil: nas grandes fontes fixas do estado, metade do CO₂ vem da cana [Biogenic versus fossil: In the state’s large fixed sources, half the CO₂ comes from sugarcane] (Version 1.0.0) [Data set]. Essencial. https://aikiesan.github.io/essencial-geo/en/maps/091-co2-biogenico-e-fossil-sp/

No. 092 Energy · biomass Biogenic carbon 4/4

What CO₂ could become

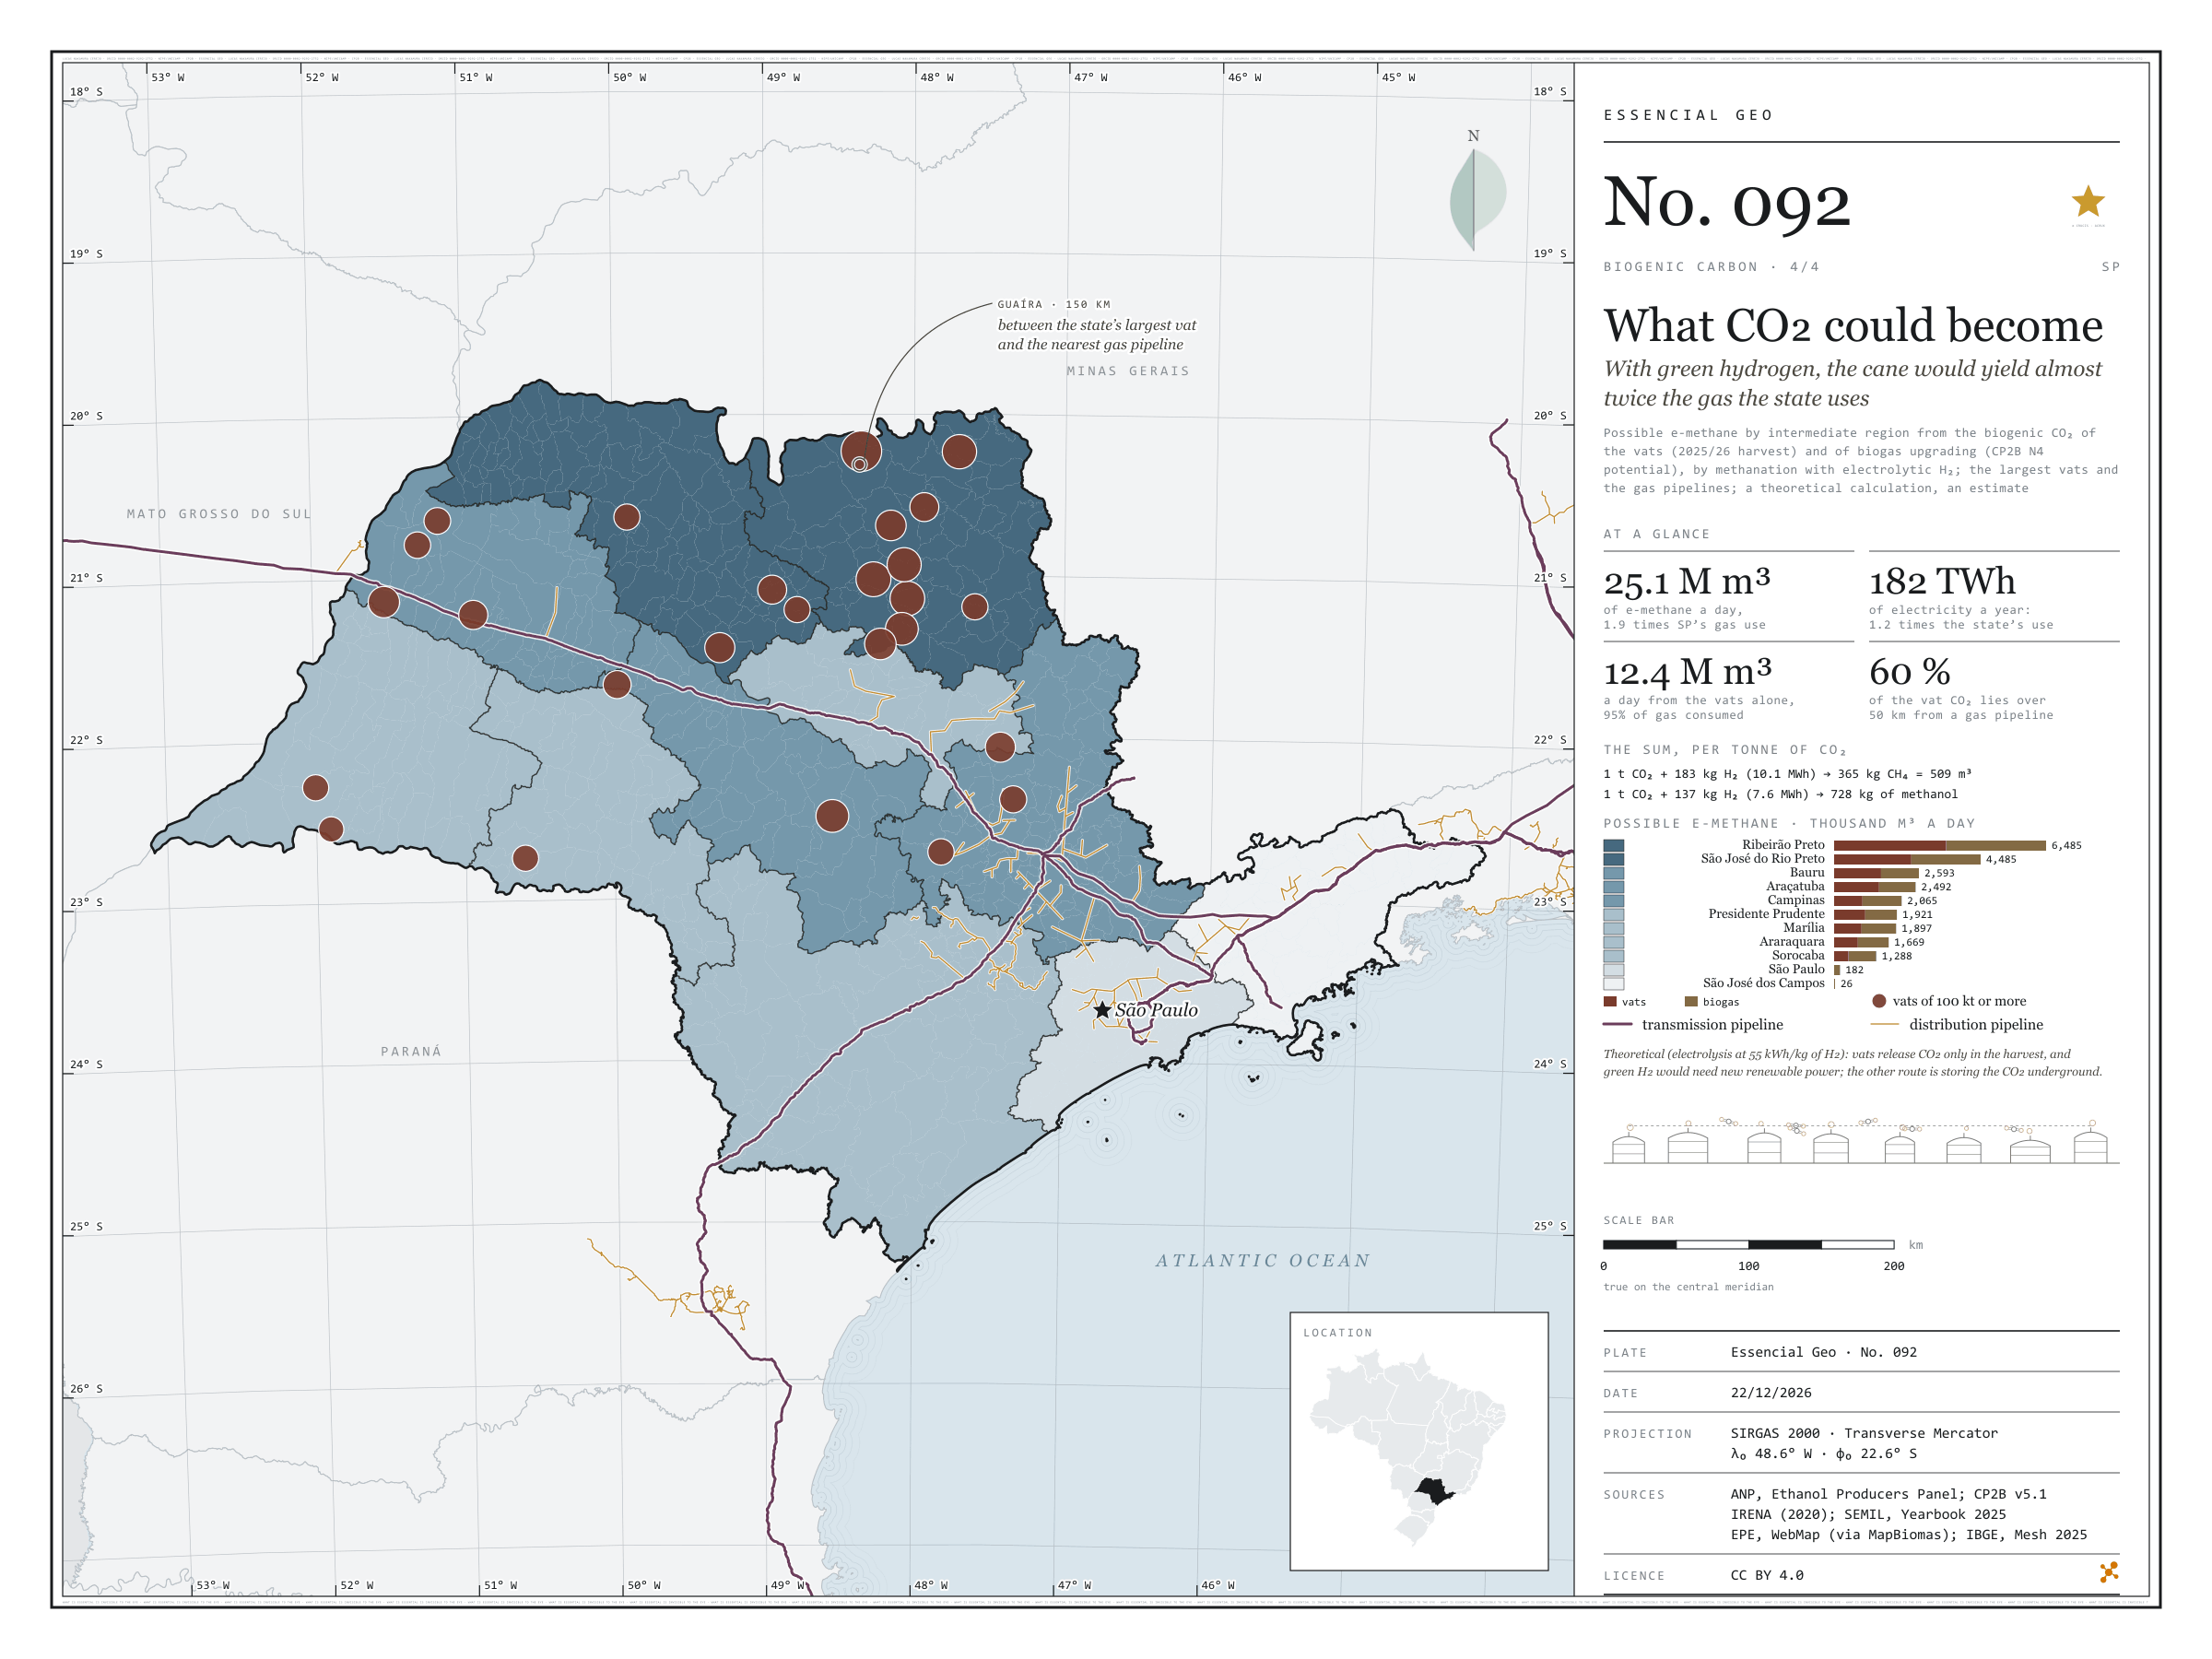
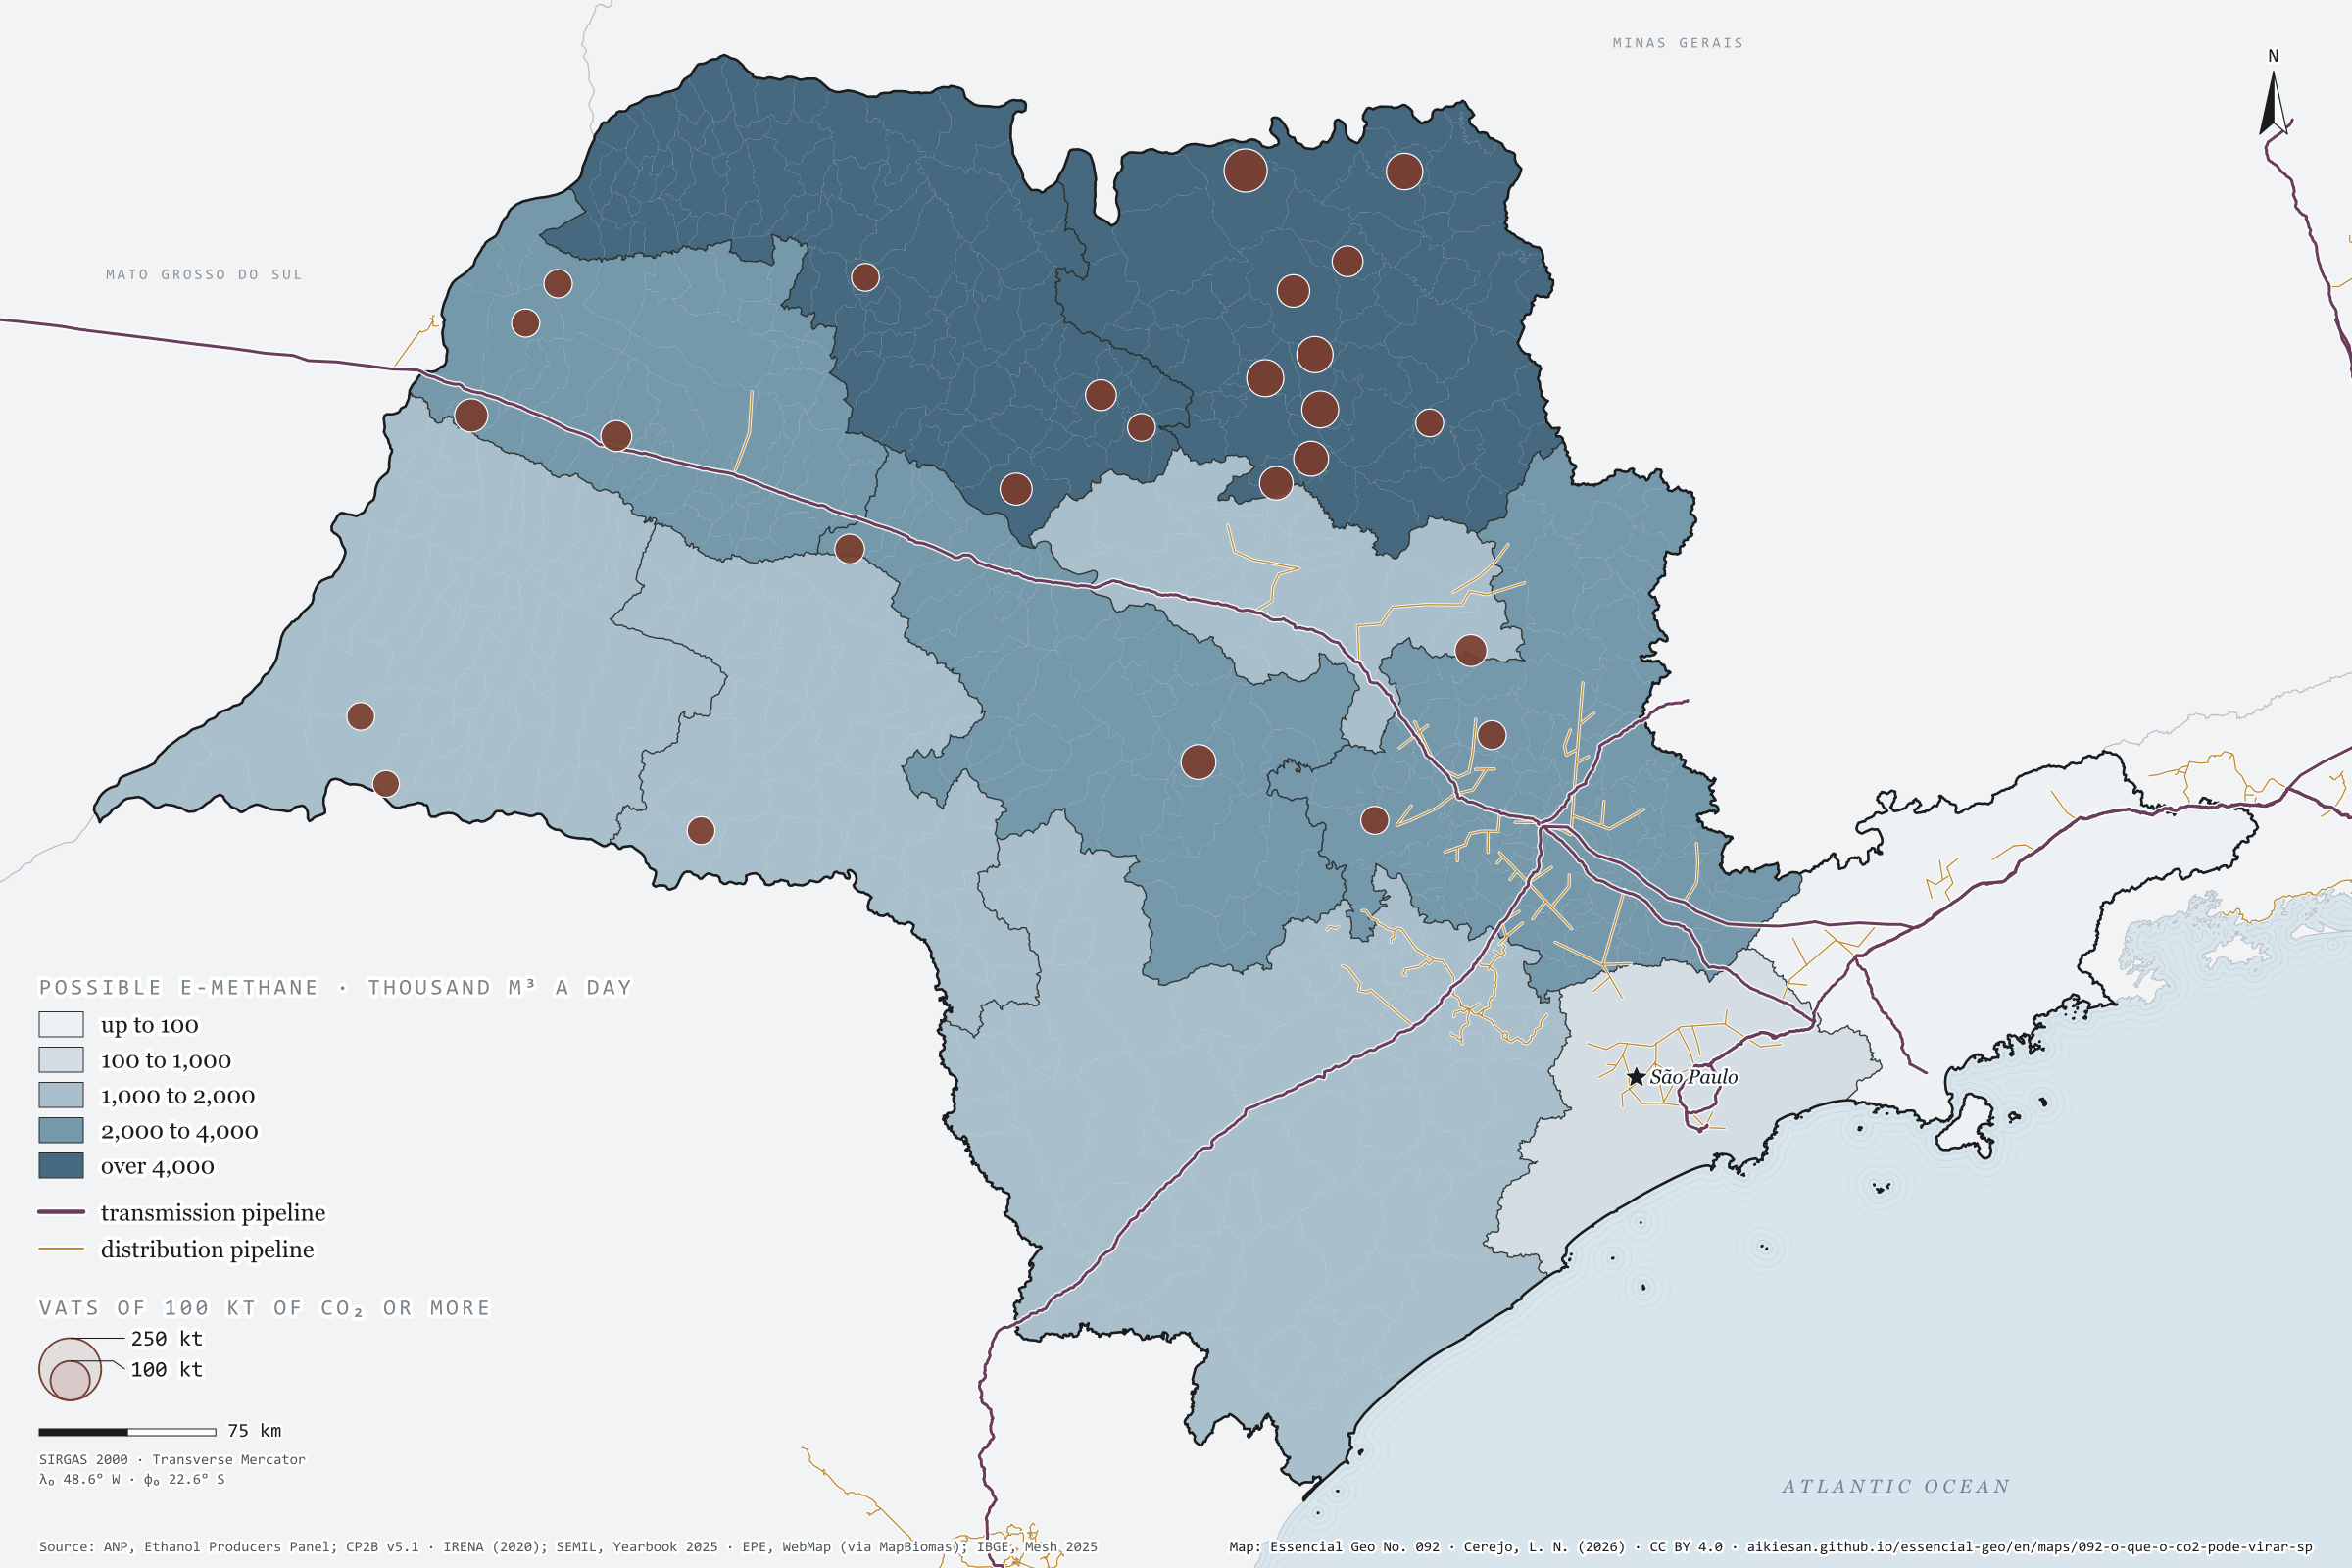
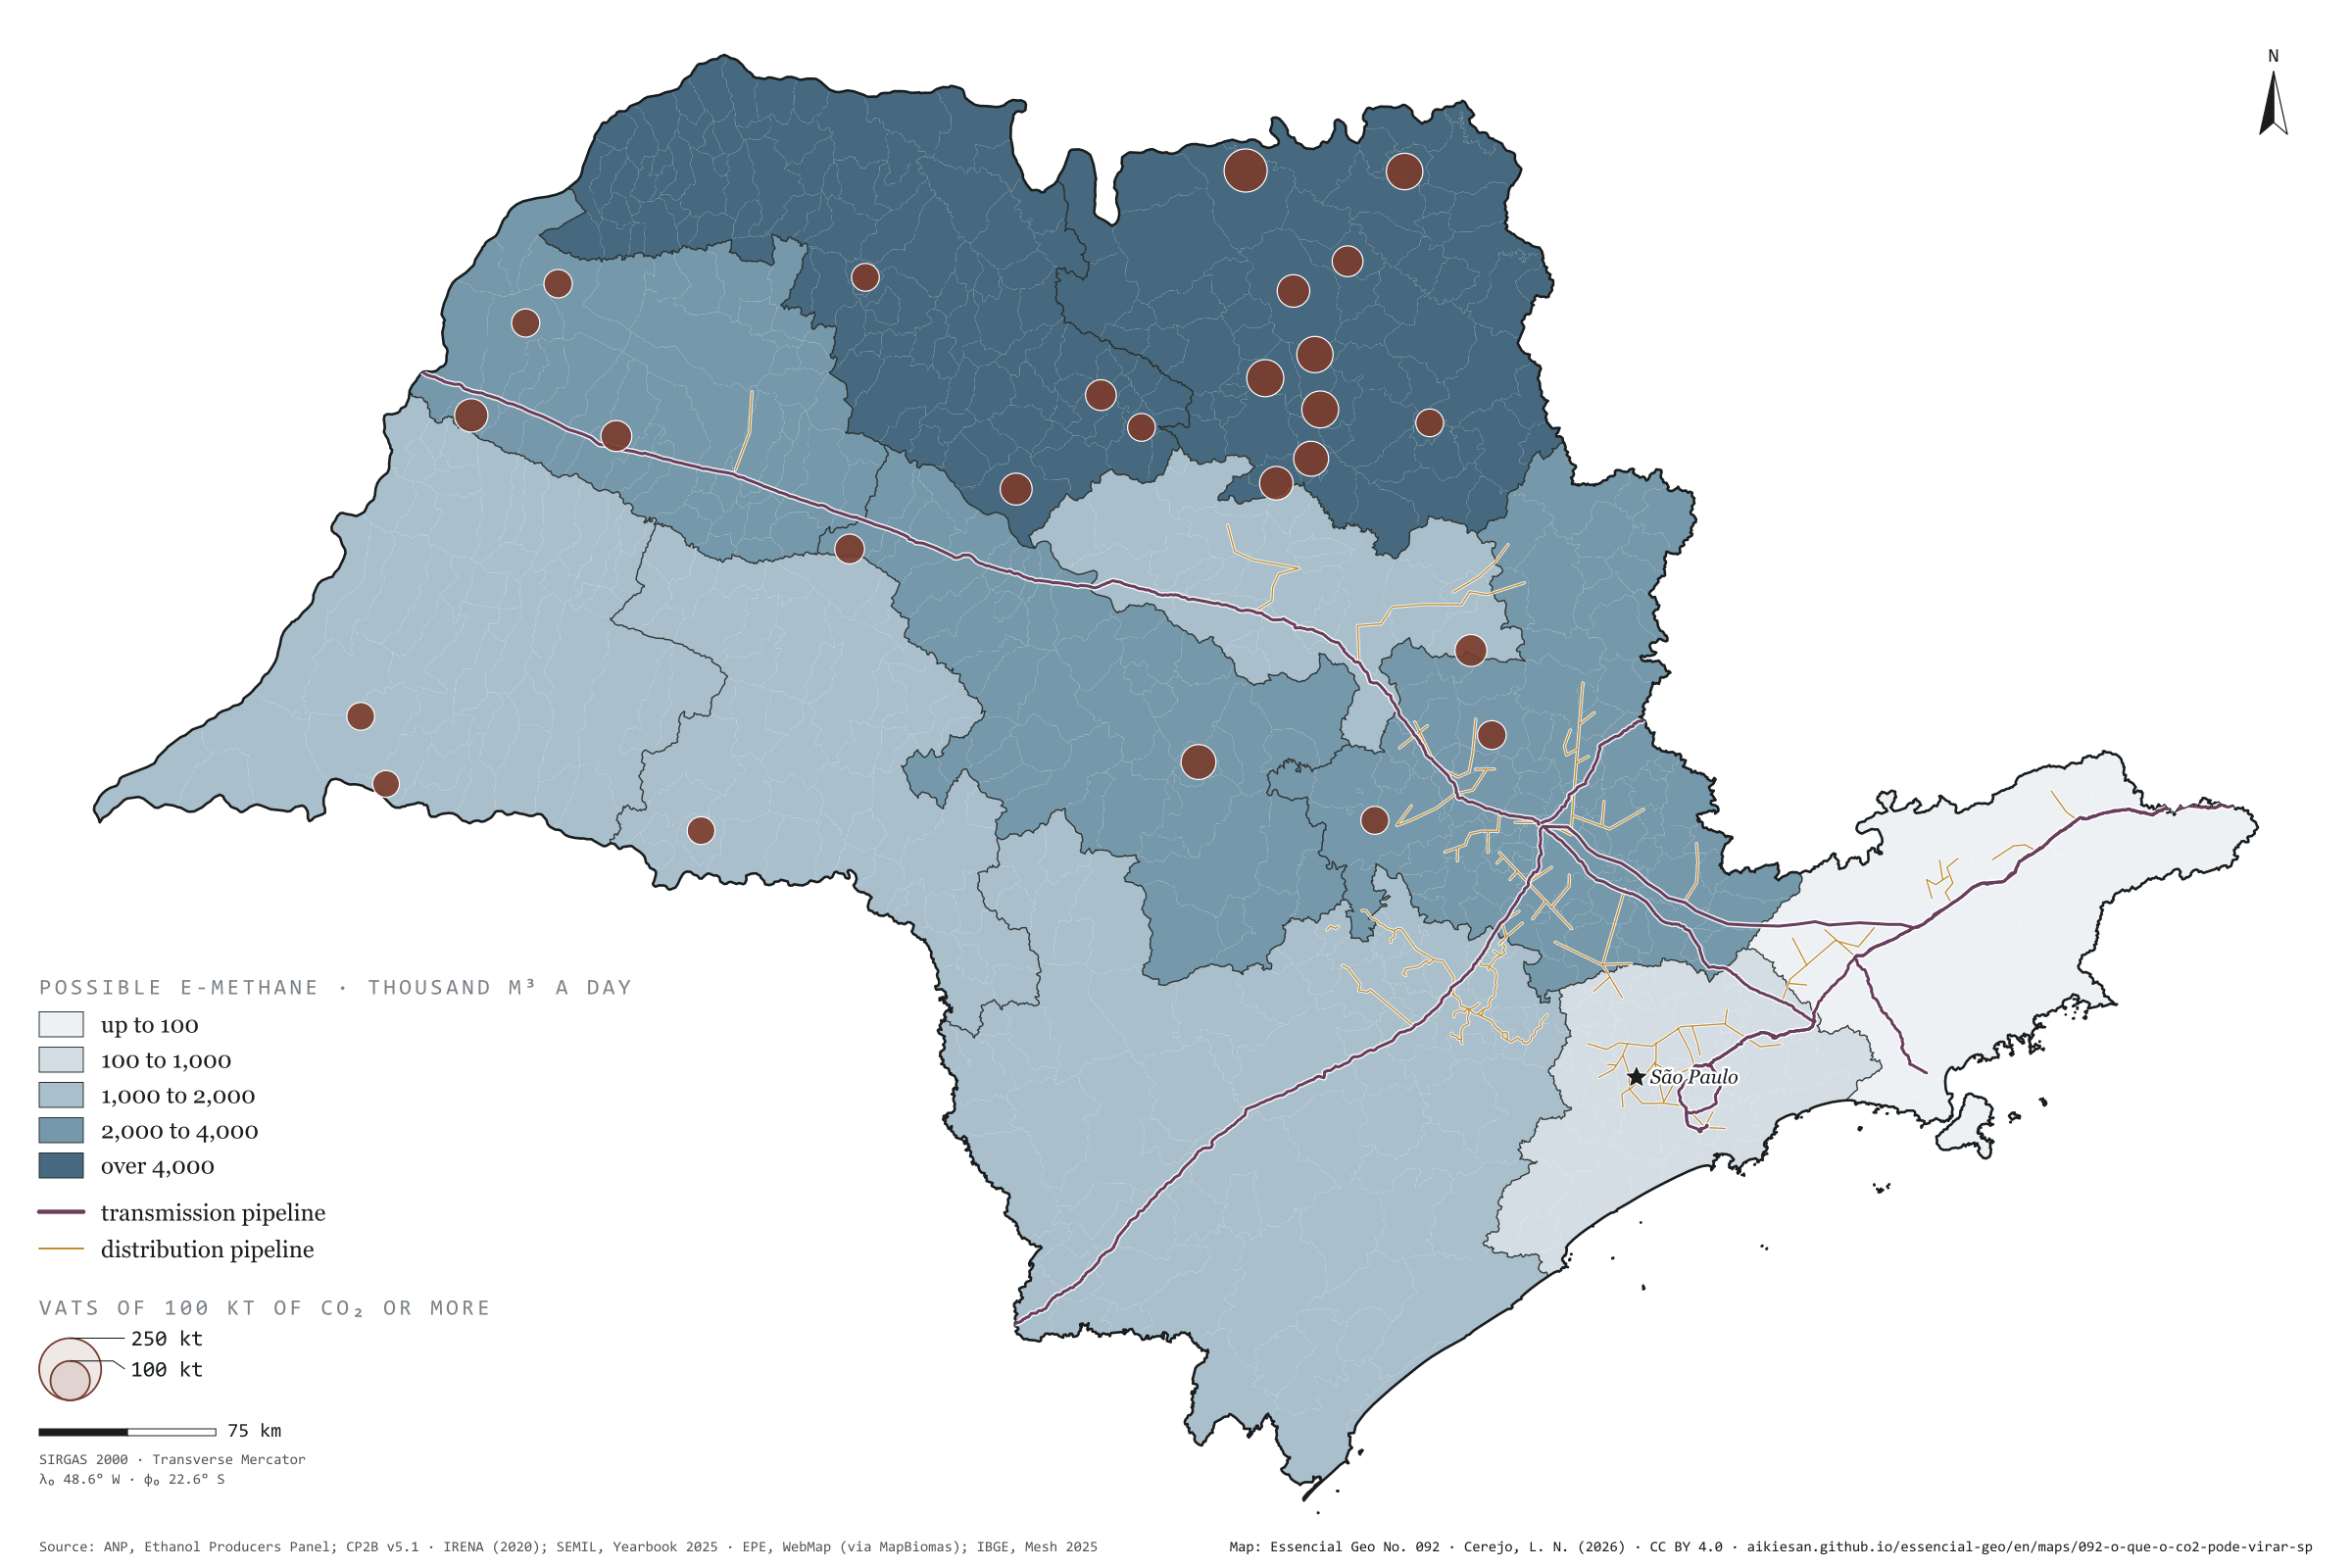
With green hydrogen, the cane would yield almost twice the gas the state uses

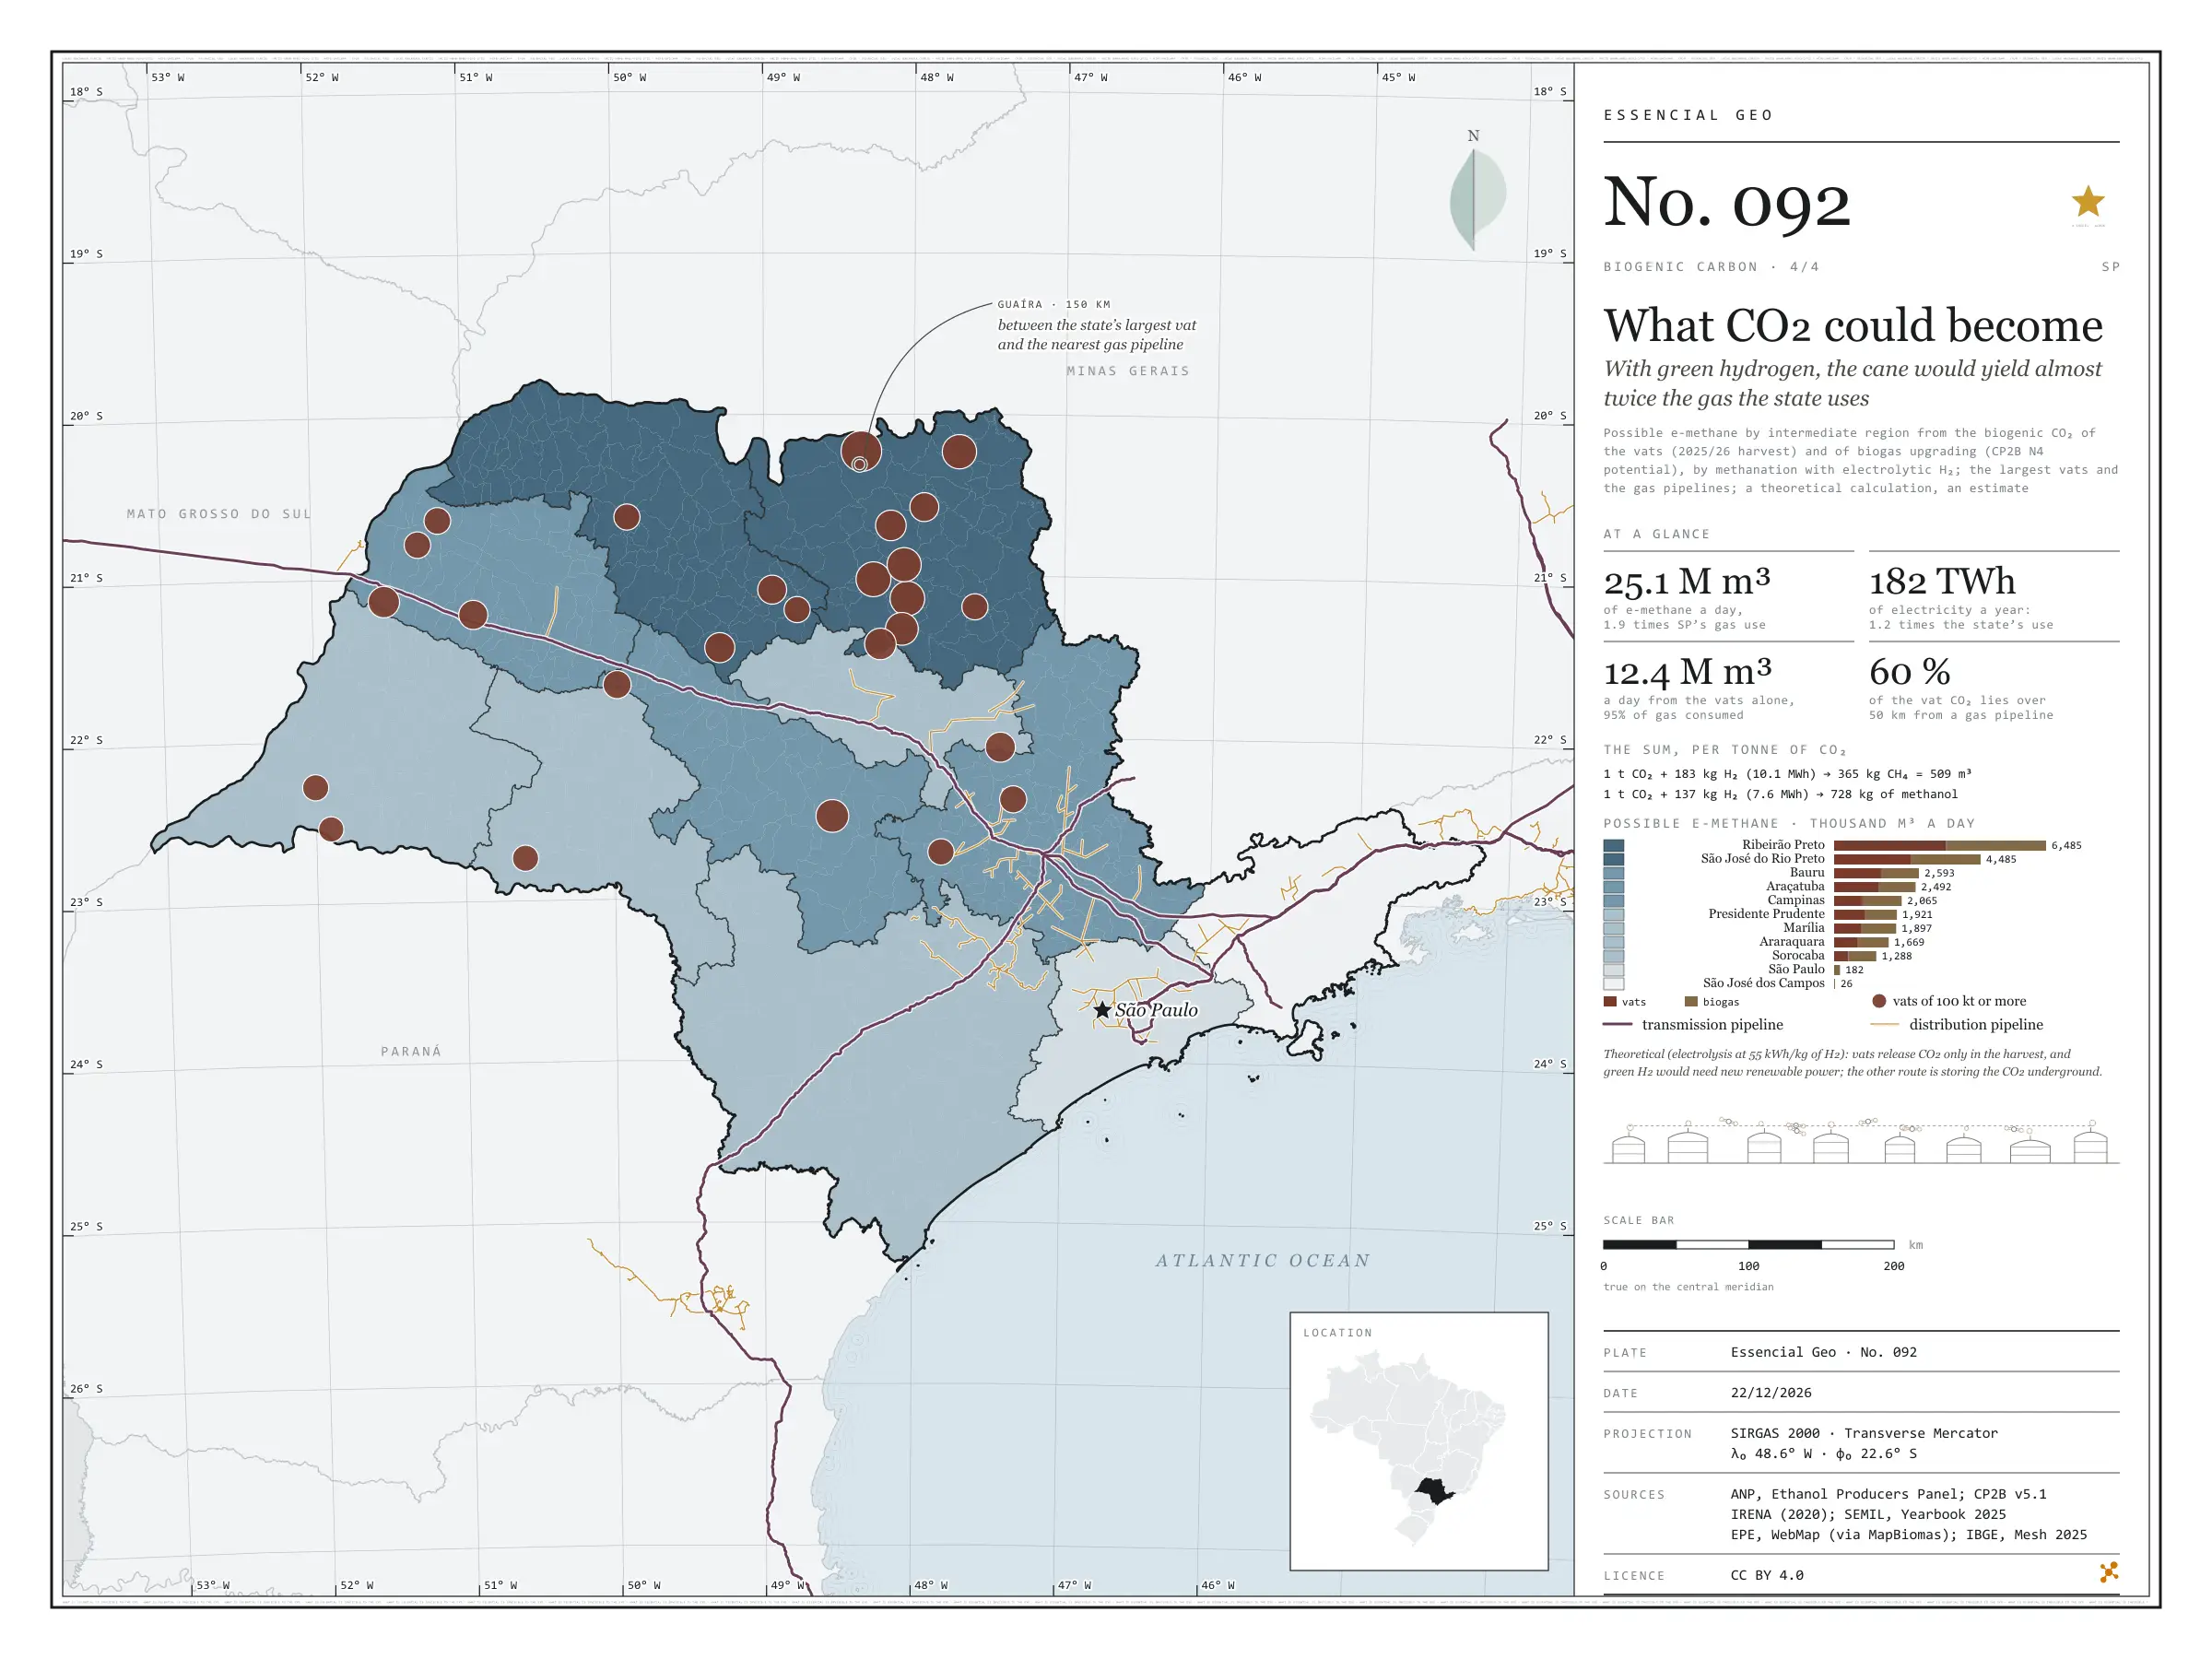
Fig. 092 São Paulo State (SP) EPSG:4674 Source: ANP, CP2B (Unicamp), IRENA (2020), SEMIL (SP), EPE, IBGE

With hydrogen, biogenic CO₂ can become fuel. One tonne of CO₂ plus 183 kg of H₂ gives 365 kg of methane, about 509 m³; with 137 kg of H₂, it gives 728 kg of methanol. Adding the vat CO₂ of the 2025/26 harvest (8.9 million t) to what upgrading the possible biogas would separate (9.1 million), São Paulo would have 18 million t a year: enough for 25 million m³ of e-methane a day, almost twice the natural gas the state used in 2024, or for 13 million t of methanol. But the sum calls for 3.3 million t of green hydrogen and 182 TWh of electricity, 1.2 times the state’s use. The Ribeirão Preto region holds 26% of the total, and 60% of the vat CO₂ lies over 50 km from a gas pipeline. It is a theoretical calculation and an estimate. Last plate of the collection “Biogenic carbon”.

Technical record · downloads · citation

At a glance

Possible e-methane by region (thousand m³ a day)
  • Ribeirão Preto 6,485
  • São José do Rio Preto 4,485
  • Bauru 2,593
  • Araçatuba 2,492
  • Campinas 2,065
  • Presidente Prudente 1,921
  • Marília 1,897
  • Araraquara 1,669
  • Sorocaba 1,288
  • São Paulo 182
  • São José dos Campos 26
Vat CO₂ by distance to the gas pipeline (t a harvest)
  • up to 10 km 13.5%
  • 10 to 25 km 12.4%
  • 25 to 50 km 13.9%
  • over 50 km 60.2%

Layers

  • regioes_carbono polygon 11 intermediate regions: biogenic CO₂, H₂, electricity, possible e-methane and e-methanol, and the largest source
  • usinas_etanol point 145 ethanol mills, with estimated CO₂ (plate 089)
  • gasodutos_transporte line Existing transmission pipelines (same database as plate 057)
  • gasodutos_distribuicao line Piped gas distribution networks

Metadata

Extent
São Paulo State (SP)
CRS / Projection
SIRGAS 2000 (EPSG:4674)
EPSG:4674
Software
Node.js · d3-geo · QGIS
Method
Biogenic CO₂ by intermediate region (vats in the 2025/26 harvest, plate 089, plus upgrading of the possible biogas, plate 090), converted into e-methane (CO₂ + 4 H₂ → CH₄ + 2 H₂O) and e-methanol (CO₂ + 3 H₂ → CH₃OH + H₂O) at full conversion, with the hydrogen turned into electricity at 55 kWh per kg (electrolysis); distance from each municipality to the nearest gas pipeline.
Version
v1.0.0
Licence
CC BY 4.0
DOI
being registered on Zenodo

Downloads

Figure to reuse

The map without a frame, with legend, scale, reference system and credit written on it: ready for papers, lectures and slides. In two versions: with the basemap (neighbours and sea) or only the mapped area, on white.

Point a camera at it to open this page.

How to cite

Cerejo, L. N. (2026). O que o CO₂ poderia virar: com hidrogênio verde, a cana renderia quase duas vezes o gás consumido no estado [What CO₂ could become: With green hydrogen, the cane would yield almost twice the gas the state uses] (Version 1.0.0) [Data set]. Essencial. https://aikiesan.github.io/essencial-geo/en/maps/092-o-que-o-co2-pode-virar-sp/

Technical record

Technical record · No. 089

The CO₂ from the vats

At a glance

Fermentation CO₂ in the 2025/26 harvest

8.9 million t

Largest municipalities (t of CO₂ a harvest)
  • Guaíra 271,110
  • Pitangueiras 200,298
  • Sertãozinho 198,274
  • Buritizal 194,228
  • Pontal 192,609
  • Barra Bonita 178,042

Layers

  • usinas_etanol point 145 SP mills with authorised capacity in the harvest: estimated ethanol and CO₂, at the municipality’s interior point
  • municipios polygon 645 municipalities: fermentation CO₂ (2025/26 harvest and 2024), biogas, fossil and possible e-methane

Metadata

Sources
ANP — Ethanol Producers Dynamic Panel: authorised capacity by mill and output by state and month (pb-da-etanol.zip) (2026)
ANP — Resolution No. 907/2022, Table 1 (density and alcohol content of anhydrous and hydrous ethanol) (2022)
Kheshgi, H. S. and Prince, R. C. (2005). Sequestration of fermentation CO₂ from ethanol production. Energy, 30, 1865–1871 (2005)
EPE — WebMap: existing gas pipelines, as published in the MapBiomas infrastructure database (distance to pipeline) (2022)
IBGE — Municipal Mesh 2025 (2025)
Extent
São Paulo State (SP)
CRS / Projection
SIRGAS 2000 (EPSG:4674)
EPSG:4674
Software
Node.js · d3-geo · QGIS
Method
São Paulo’s anhydrous and hydrous ethanol output in the 2025/26 harvest (ANP, by month) shared out among mills by their authorised capacity in each month, converted to mass by the density in the ANP specification and to CO₂ by the stoichiometry of alcoholic fermentation (0.955 kg of CO₂ per kg of ethanol); summed by municipality.
Version
v1.0.0
Licence
CC BY 4.0
DOI
being registered on Zenodo

Downloads

Figure to reuse

The map without a frame, with legend, scale, reference system and credit written on it: ready for papers, lectures and slides. In two versions: with the basemap (neighbours and sea) or only the mapped area, on white.

Point a camera at it to open this page.

How to cite

Cerejo, L. N. (2026). O CO₂ das dornas: toda usina de etanol solta um gás quase puro, que hoje vai para o ar [The CO₂ from the vats: Every ethanol mill gives off an almost pure gas that now goes into the air] (Version 1.0.0) [Data set]. Essencial. https://aikiesan.github.io/essencial-geo/en/maps/089-co2-das-dornas-sp/

Data and plates under CC BY 4.0: use them in commercial drawings and papers, citing the source.

100%