One in twelve people in São Paulo lives in a favela: where they are, the largest in the metropolis, streets without light or pavements and the income gap with the rest of the same town.
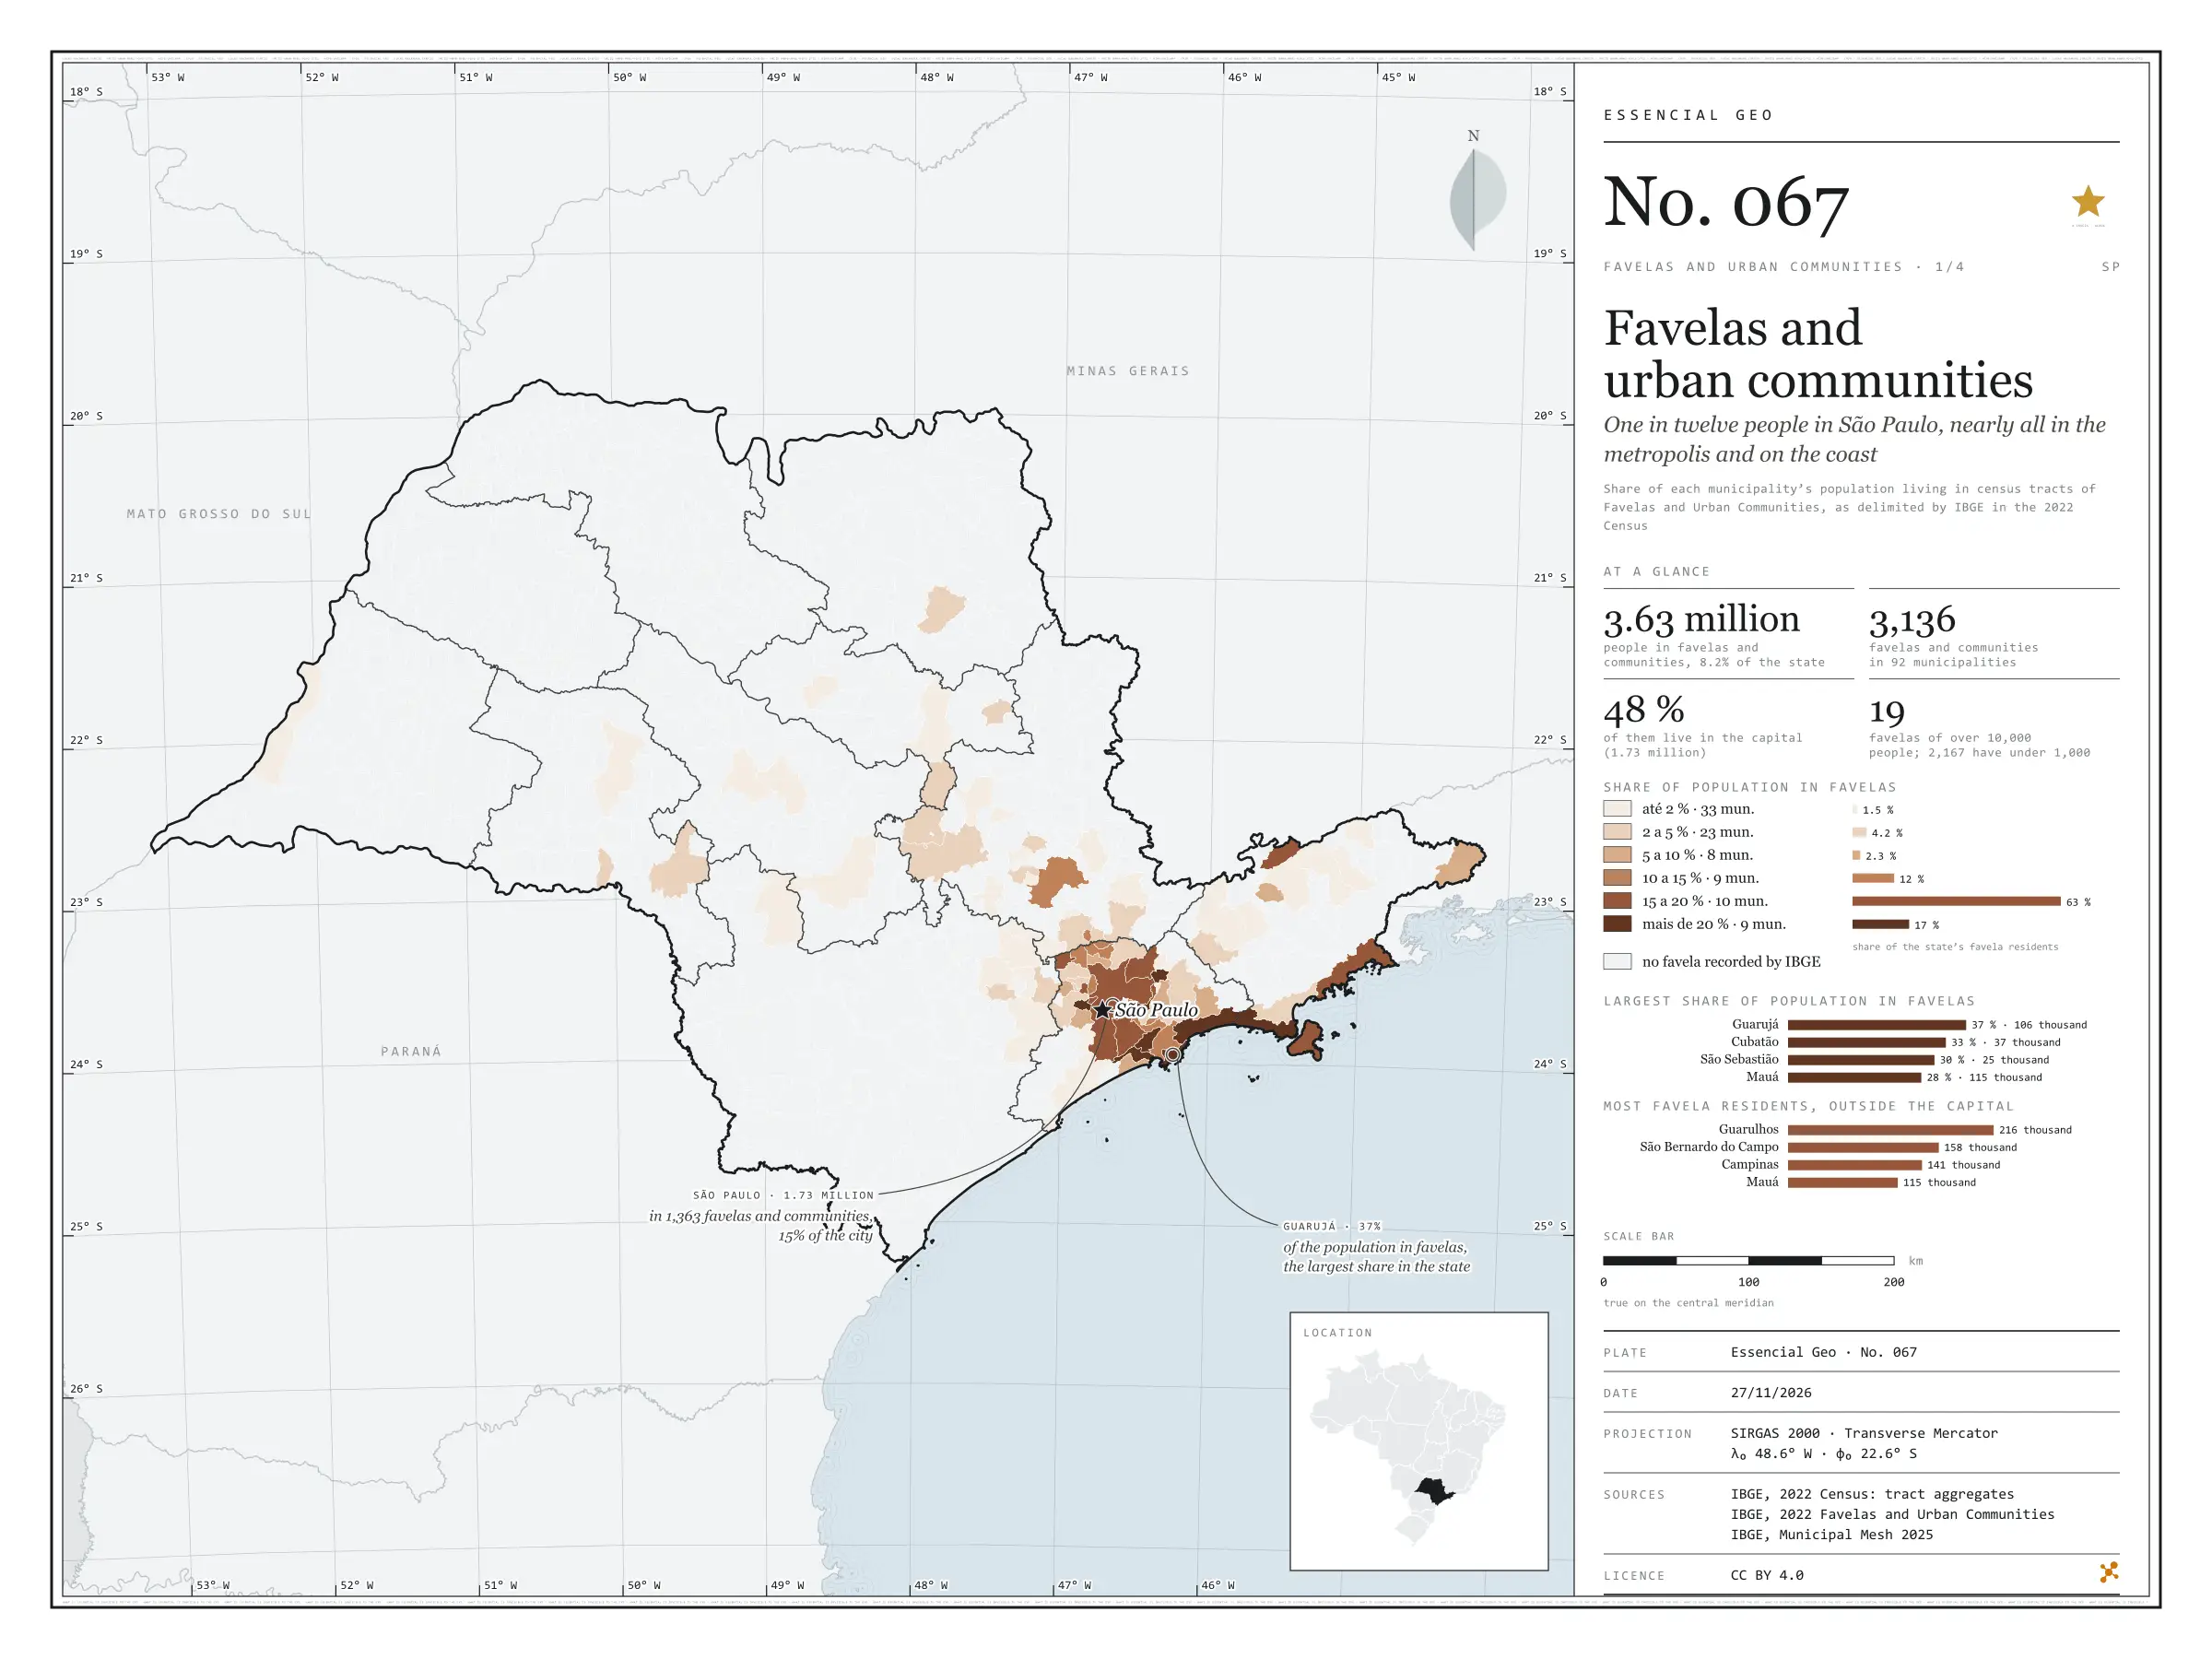
One in twelve people in São Paulo, nearly all in the metropolis and on the coast
Fig. 067São Paulo State (SP)EPSG:4674Source: IBGE
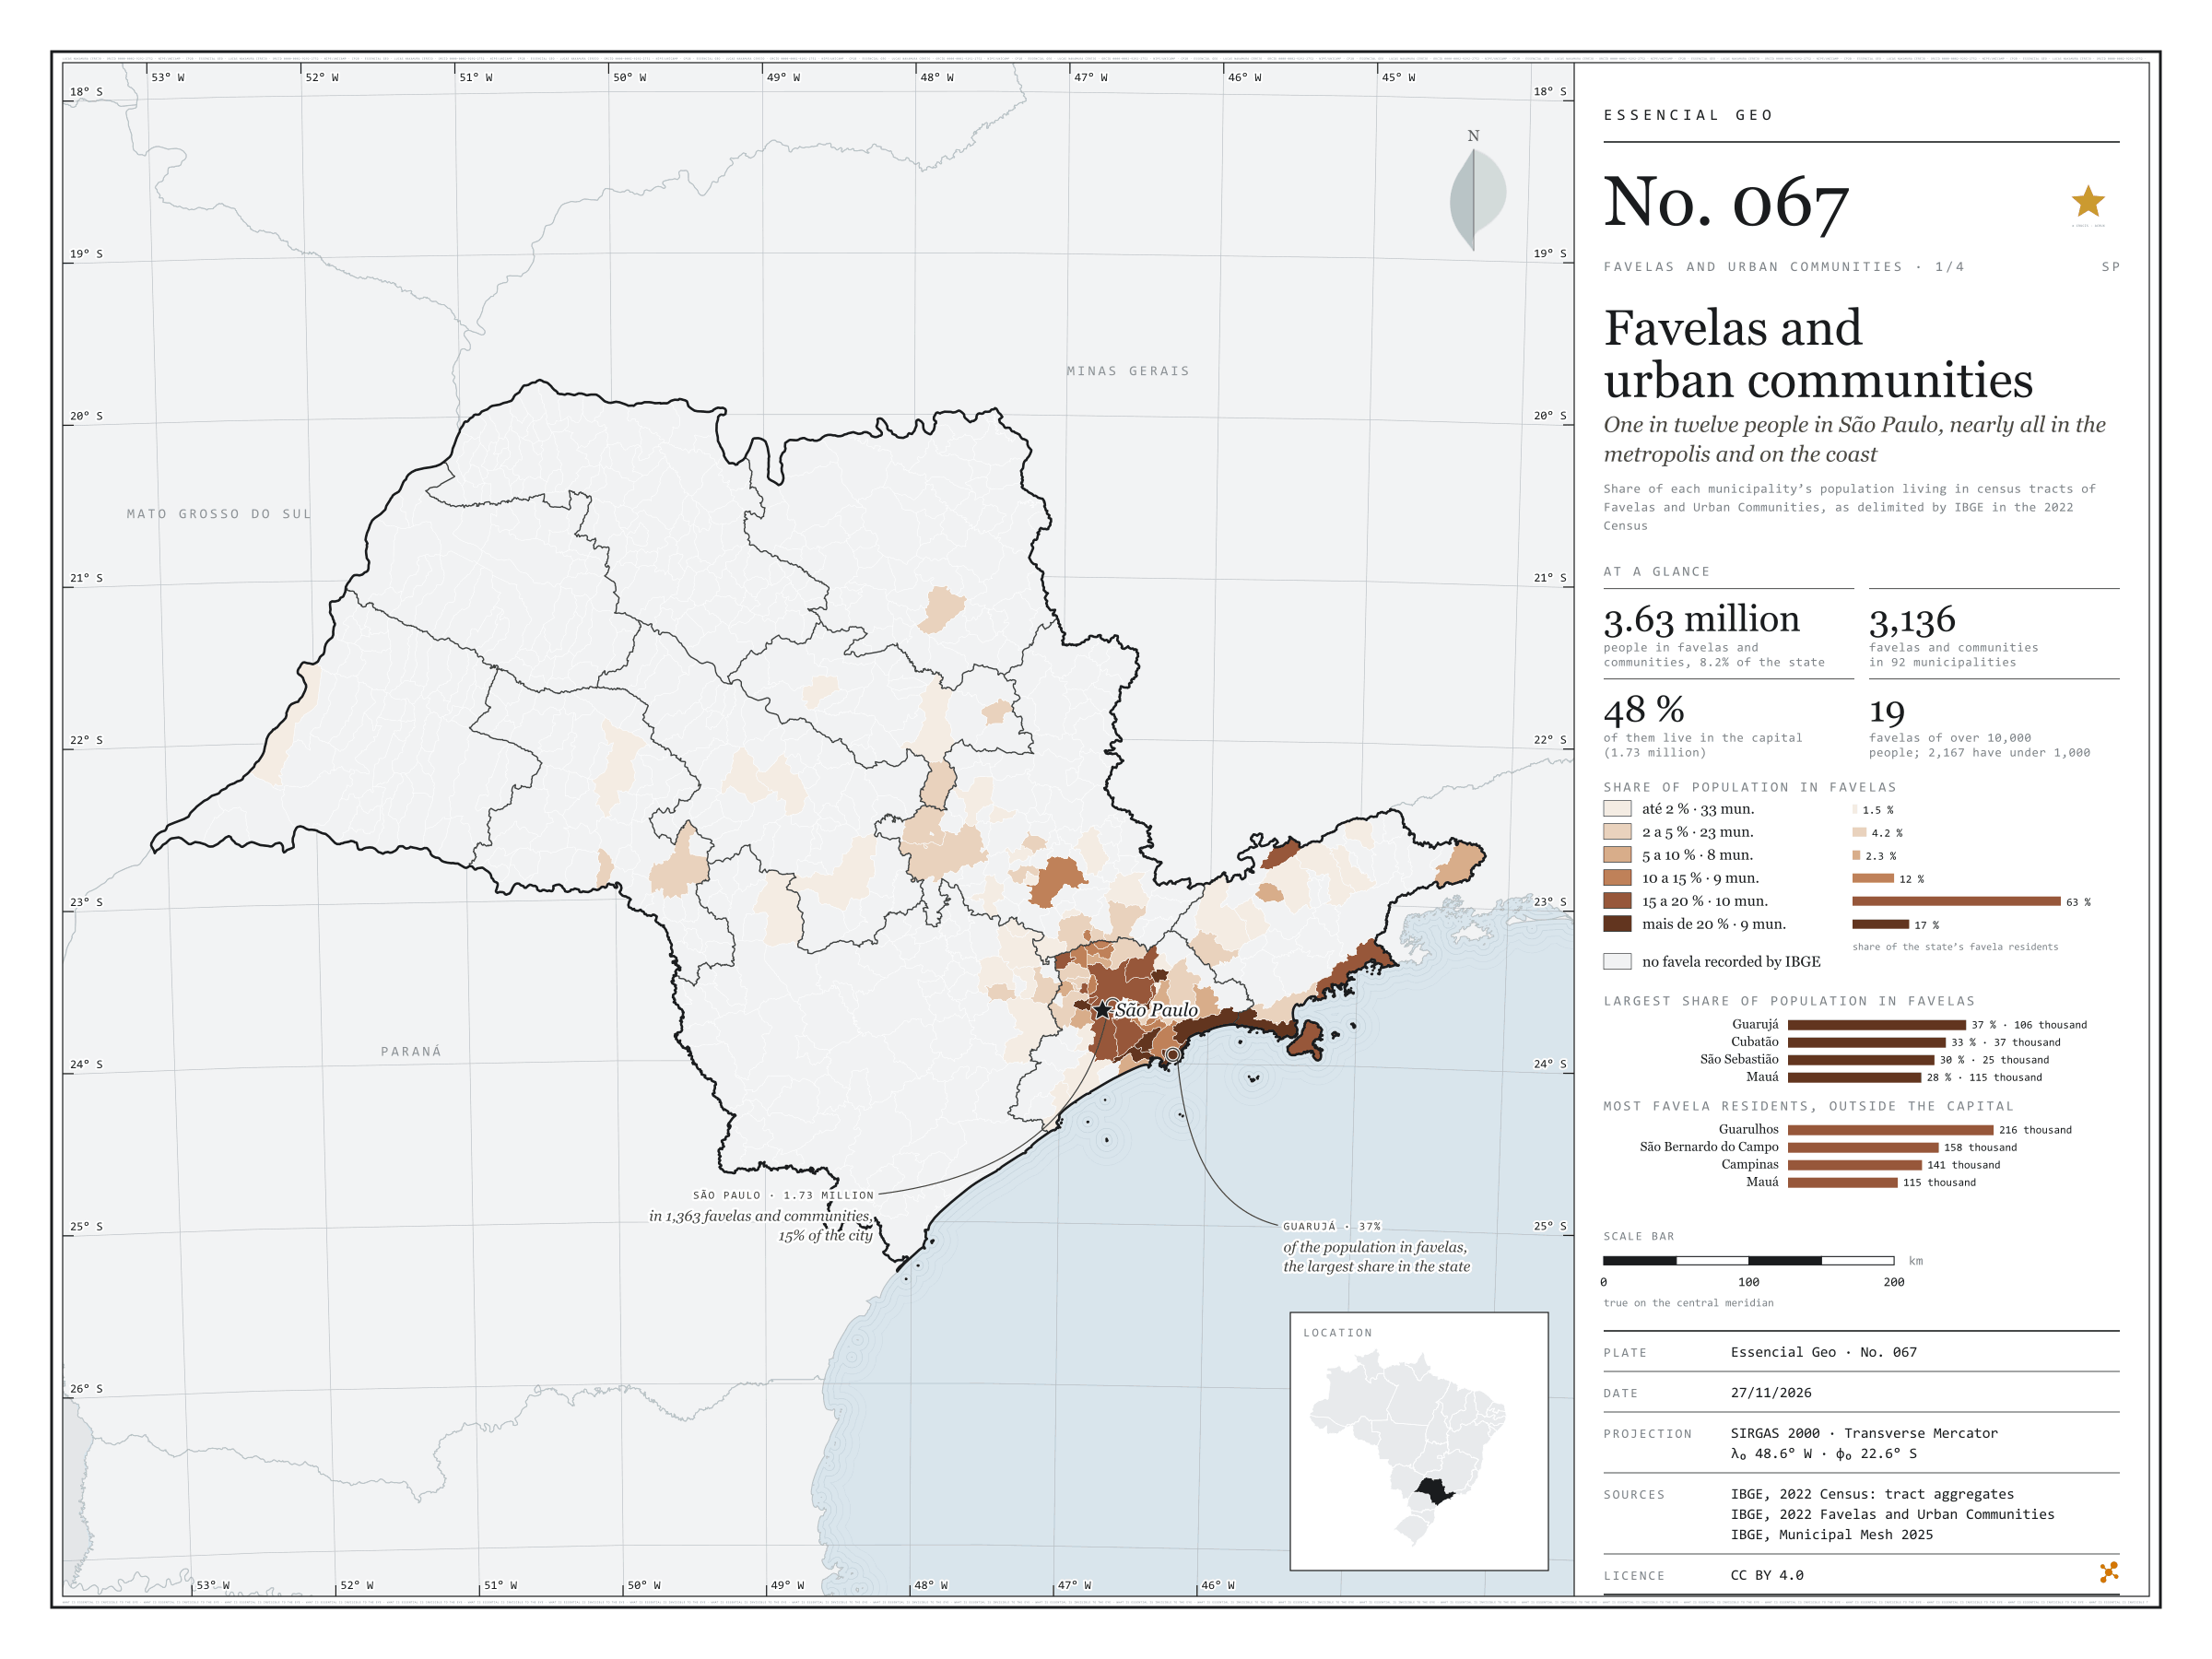
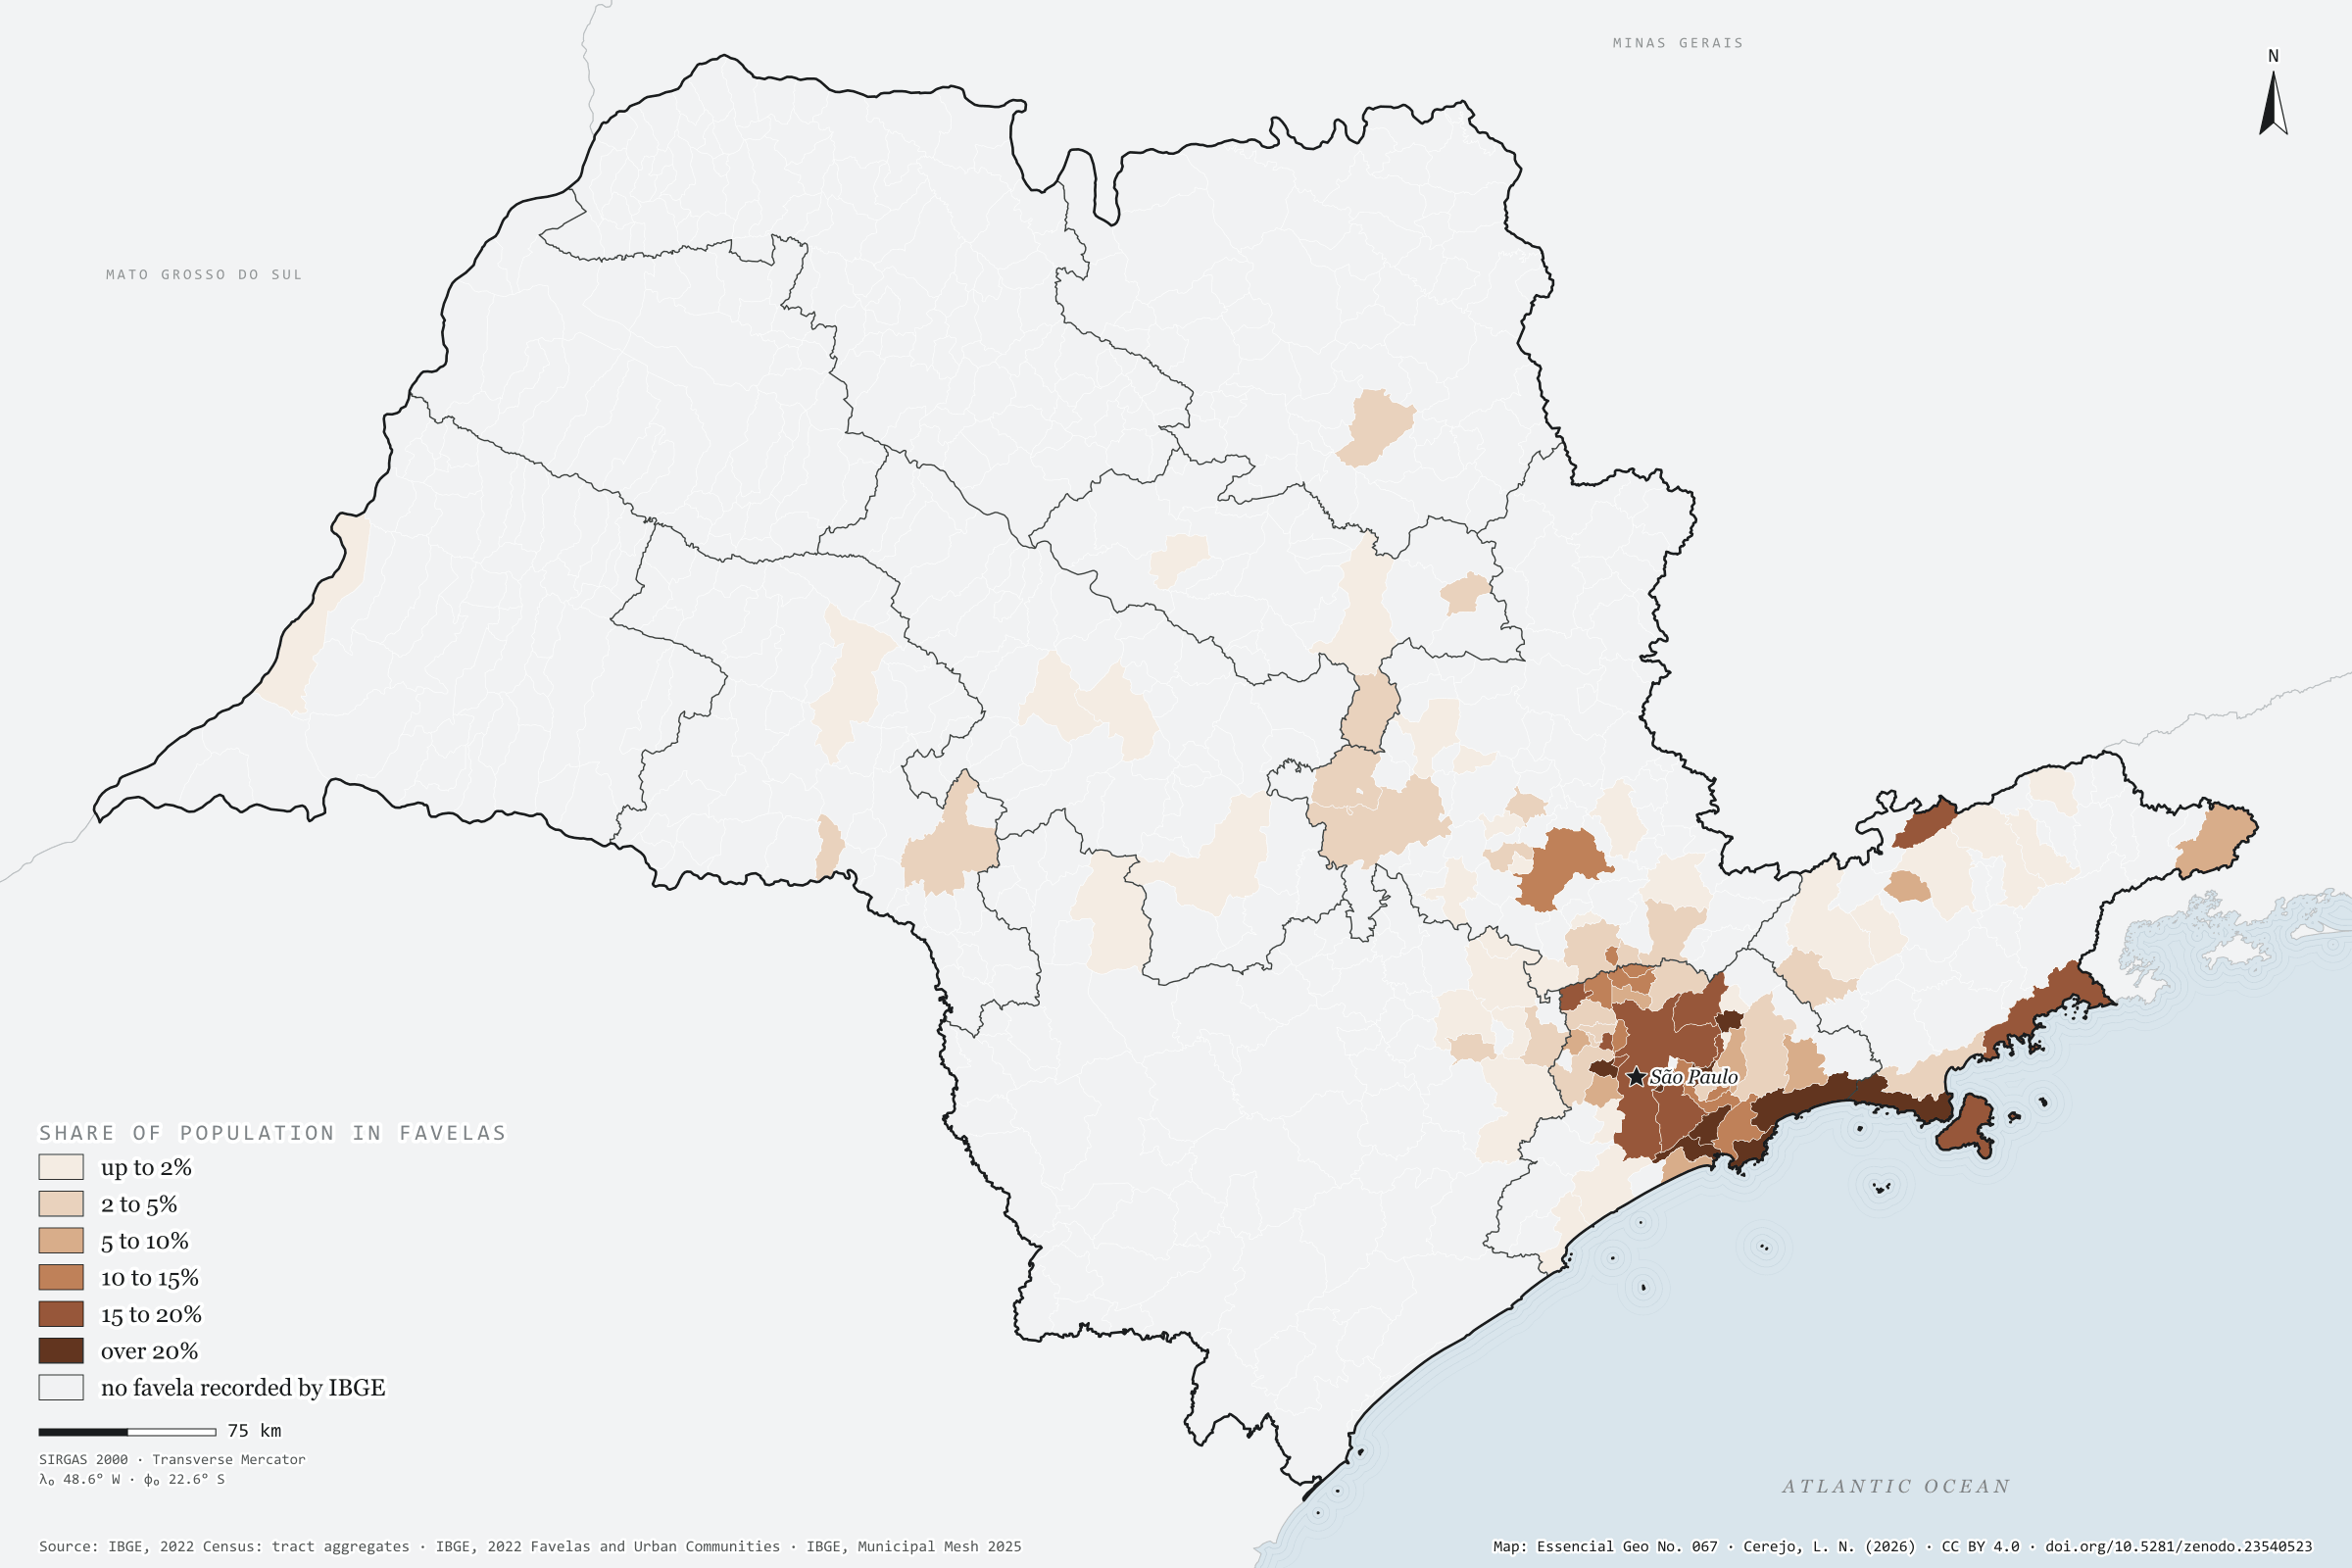
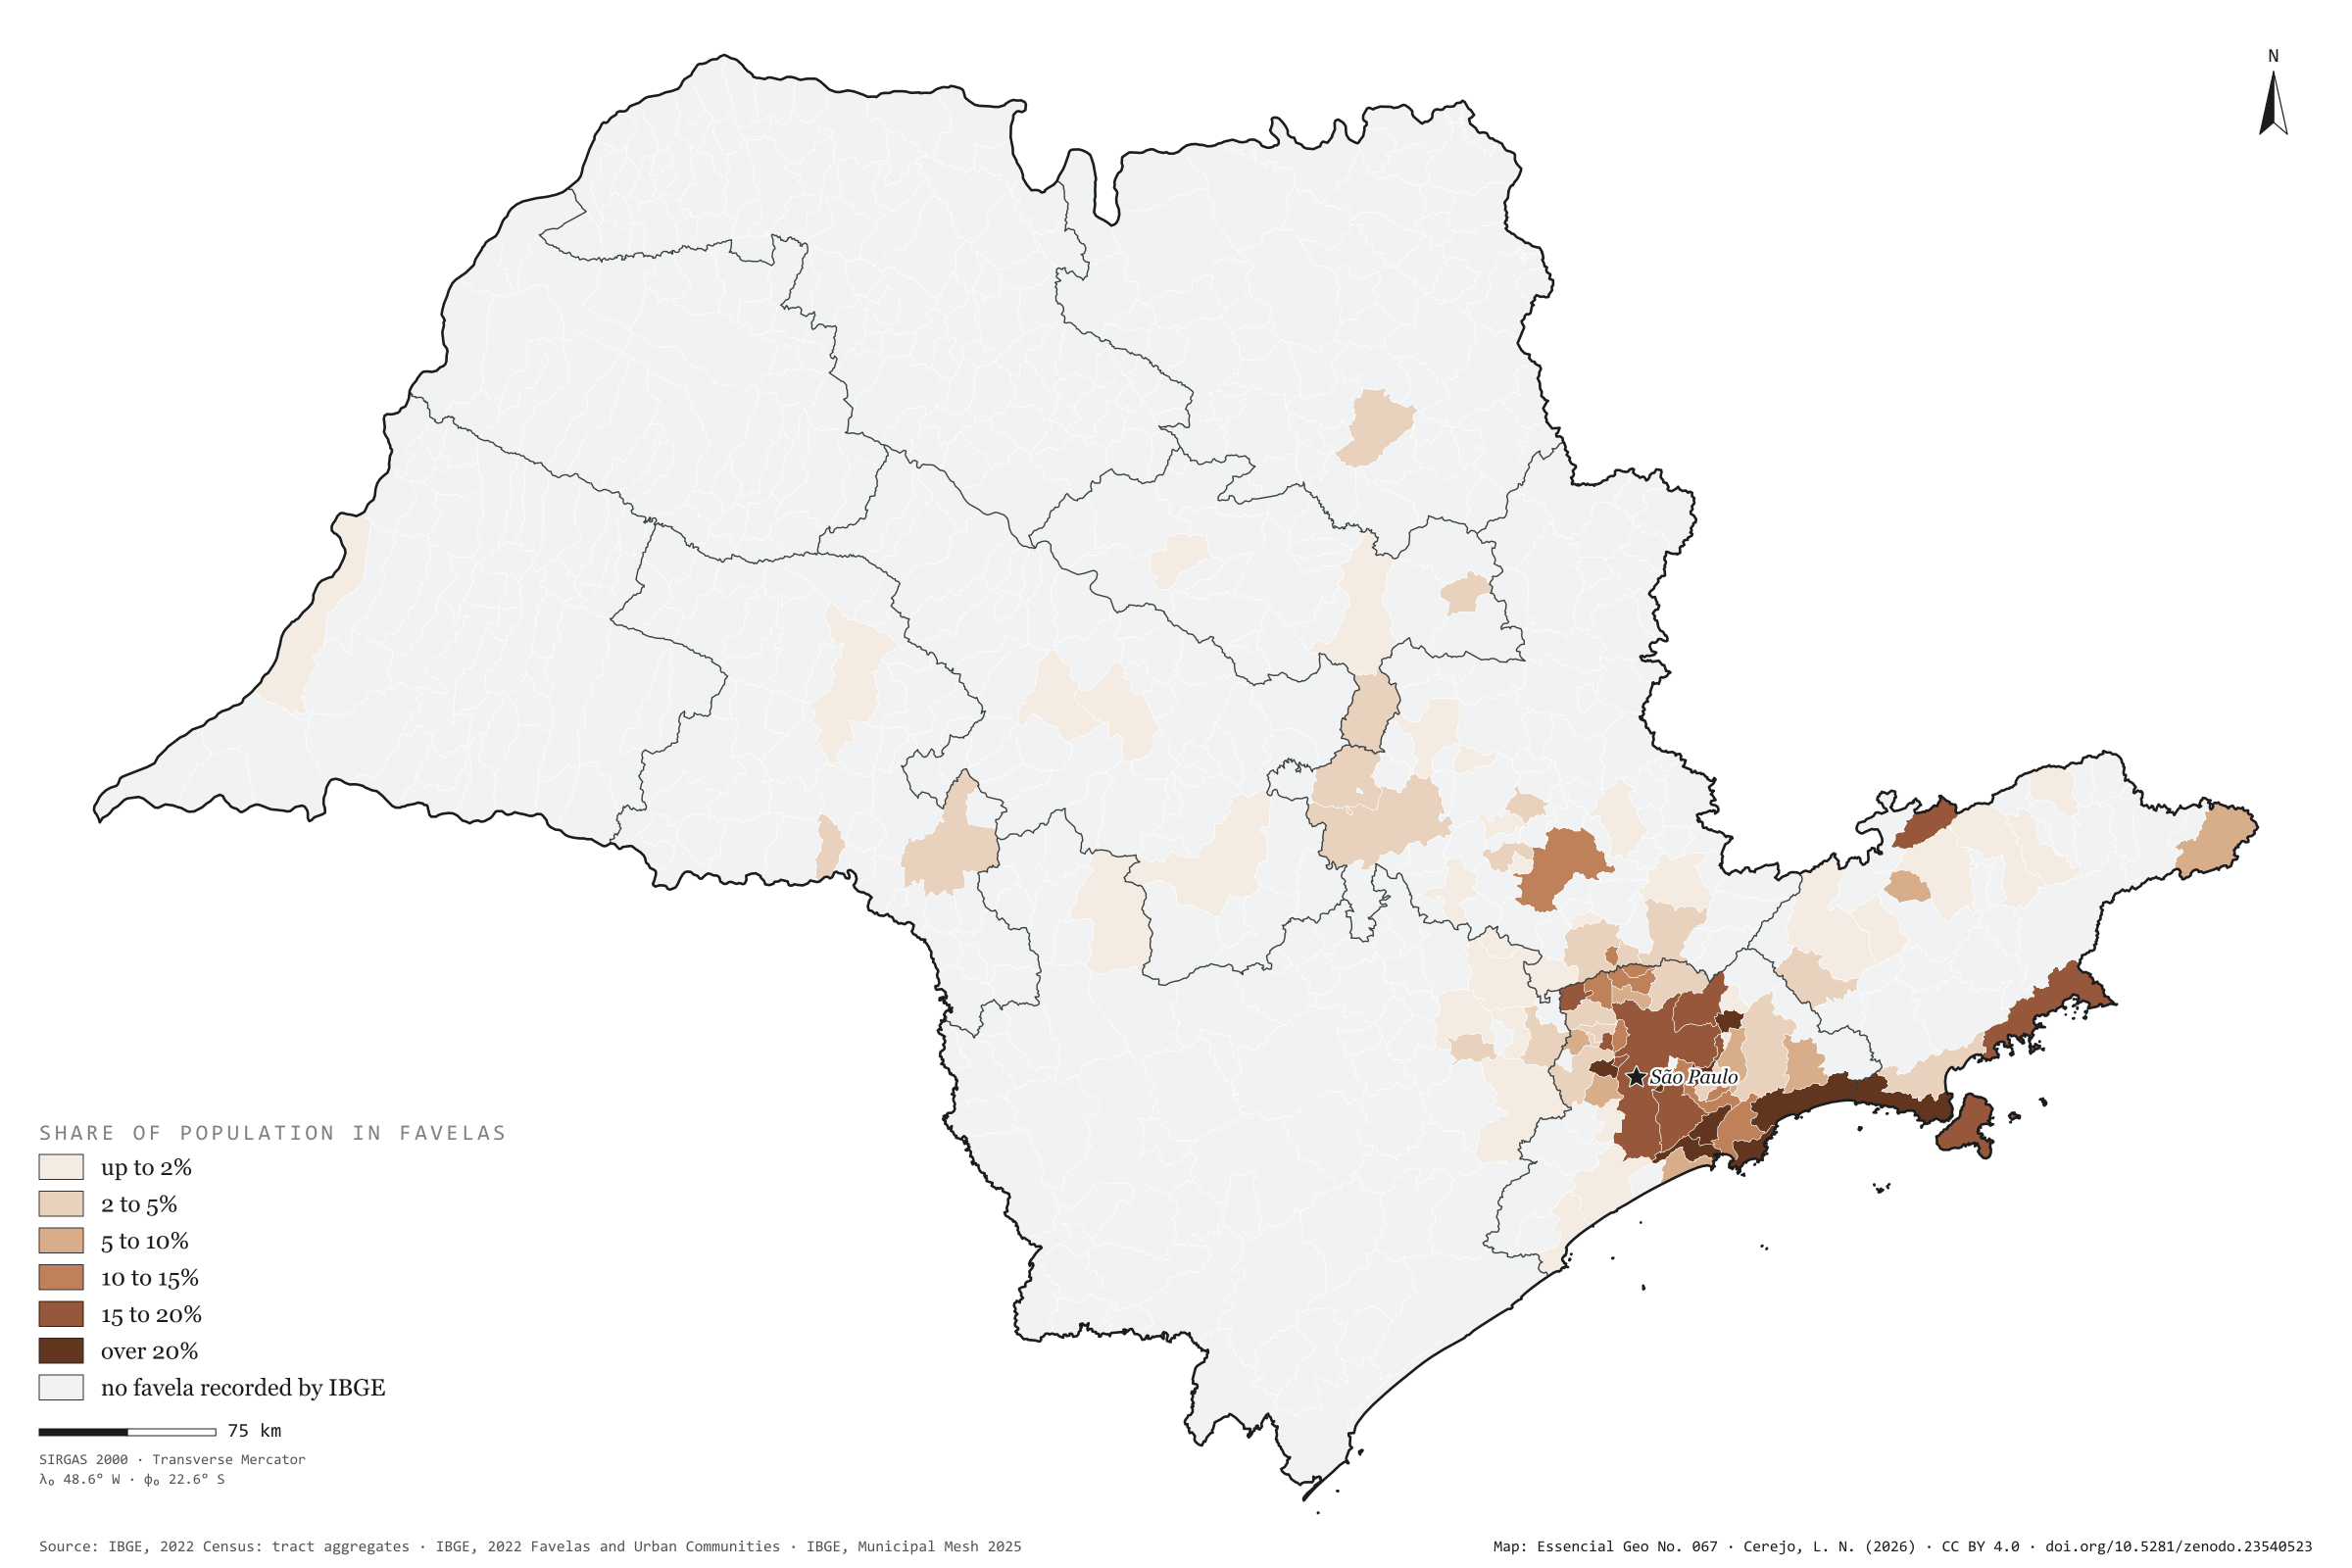
In 2022, 3.63 million people in São Paulo lived in tracts that IBGE classed as Favelas and Urban Communities: 8.2% of the population, one in twelve. There are 3,136 favelas and communities in 92 of the 645 municipalities. The capital has 1.73 million residents in them, nearly half the state’s total, in 1,363 communities: 15% of the city. By share of population, the coast leads: in Guarujá, 37% of residents live in favelas; in Cubatão, 33%; in São Sebastião, 30%. Outside the capital, the town with most people in favelas is Guarulhos, with 216,000, ahead of São Bernardo do Campo and Campinas. Inland, the exception is Campinas, with 12% of its population in favelas; in Ribeirão Preto it is 3%, in Sorocaba 2%. First plate of the collection “Favelas and urban communities”.
Technical record · downloads · citation
At a glance
Favela residents by the municipality’s share of population in favelas (people)
up to 2%1.5%
2 to 5%4.2%
5 to 10%2.3%
10 to 15%12.5%
15 to 20%62.5%
over 20%17%
People in favelas and urban communities
8.2%
3.63 million people
Favelas and urban communities
3,136communities
in 92 municipalities
Layers
setores_fcupolygon8,008 tracts in Favelas and Urban Communities: community code and name, municipality, people and occupied households
municipiospolygon645 municipalities: people, people in favelas, number of communities, population share, surroundings and income inside and outside
regioes_intermediariaspolygon11 intermediate geographic regions
People in census tracts coded as a Favela or Urban Community over all people in each municipality, from the 2022 Census tract aggregates, in six classes; municipalities with no recorded favela shown apart.
The map without a frame, with legend, scale, reference system and credit written on it: ready for papers, lectures and slides. In two versions: with the basemap (neighbours and sea) or only the mapped area, on white.
CEREJO, Lucas Nakamura. Favelas e comunidades urbanas: um em cada doze paulistas, quase todos na metrópole e no litoral. Versão 1.0.0. [S. l.]: Zenodo, 2026. Conjunto de dados. DOI: 10.5281/zenodo.23540523. Disponível em: https://doi.org/10.5281/zenodo.23540523. Acesso em: 10 nov. 2026.
Cerejo, L. N. (2026). Favelas e comunidades urbanas: um em cada doze paulistas, quase todos na metrópole e no litoral [Favelas and urban communities: One in twelve people in São Paulo, nearly all in the metropolis and on the coast] (Version 1.0.0) [Data set]. Zenodo. https://doi.org/10.5281/zenodo.23540523
@dataset{cerejo2026_favelas_sp,
  author    = {Cerejo, Lucas Nakamura},
  title     = {Favelas e comunidades urbanas: Um em cada doze paulistas, quase todos na metrópole e no litoral},
  year      = {2026},
  publisher = {Zenodo},
  version   = {1.0.0},
  doi       = {10.5281/zenodo.23540523},
  url       = {https://doi.org/10.5281/zenodo.23540523},
  language  = {portuguese},
  note      = {English title: Favelas and urban communities: One in twelve people in São Paulo, nearly all in the metropolis and on the coast. Licence CC BY 4.0}
}
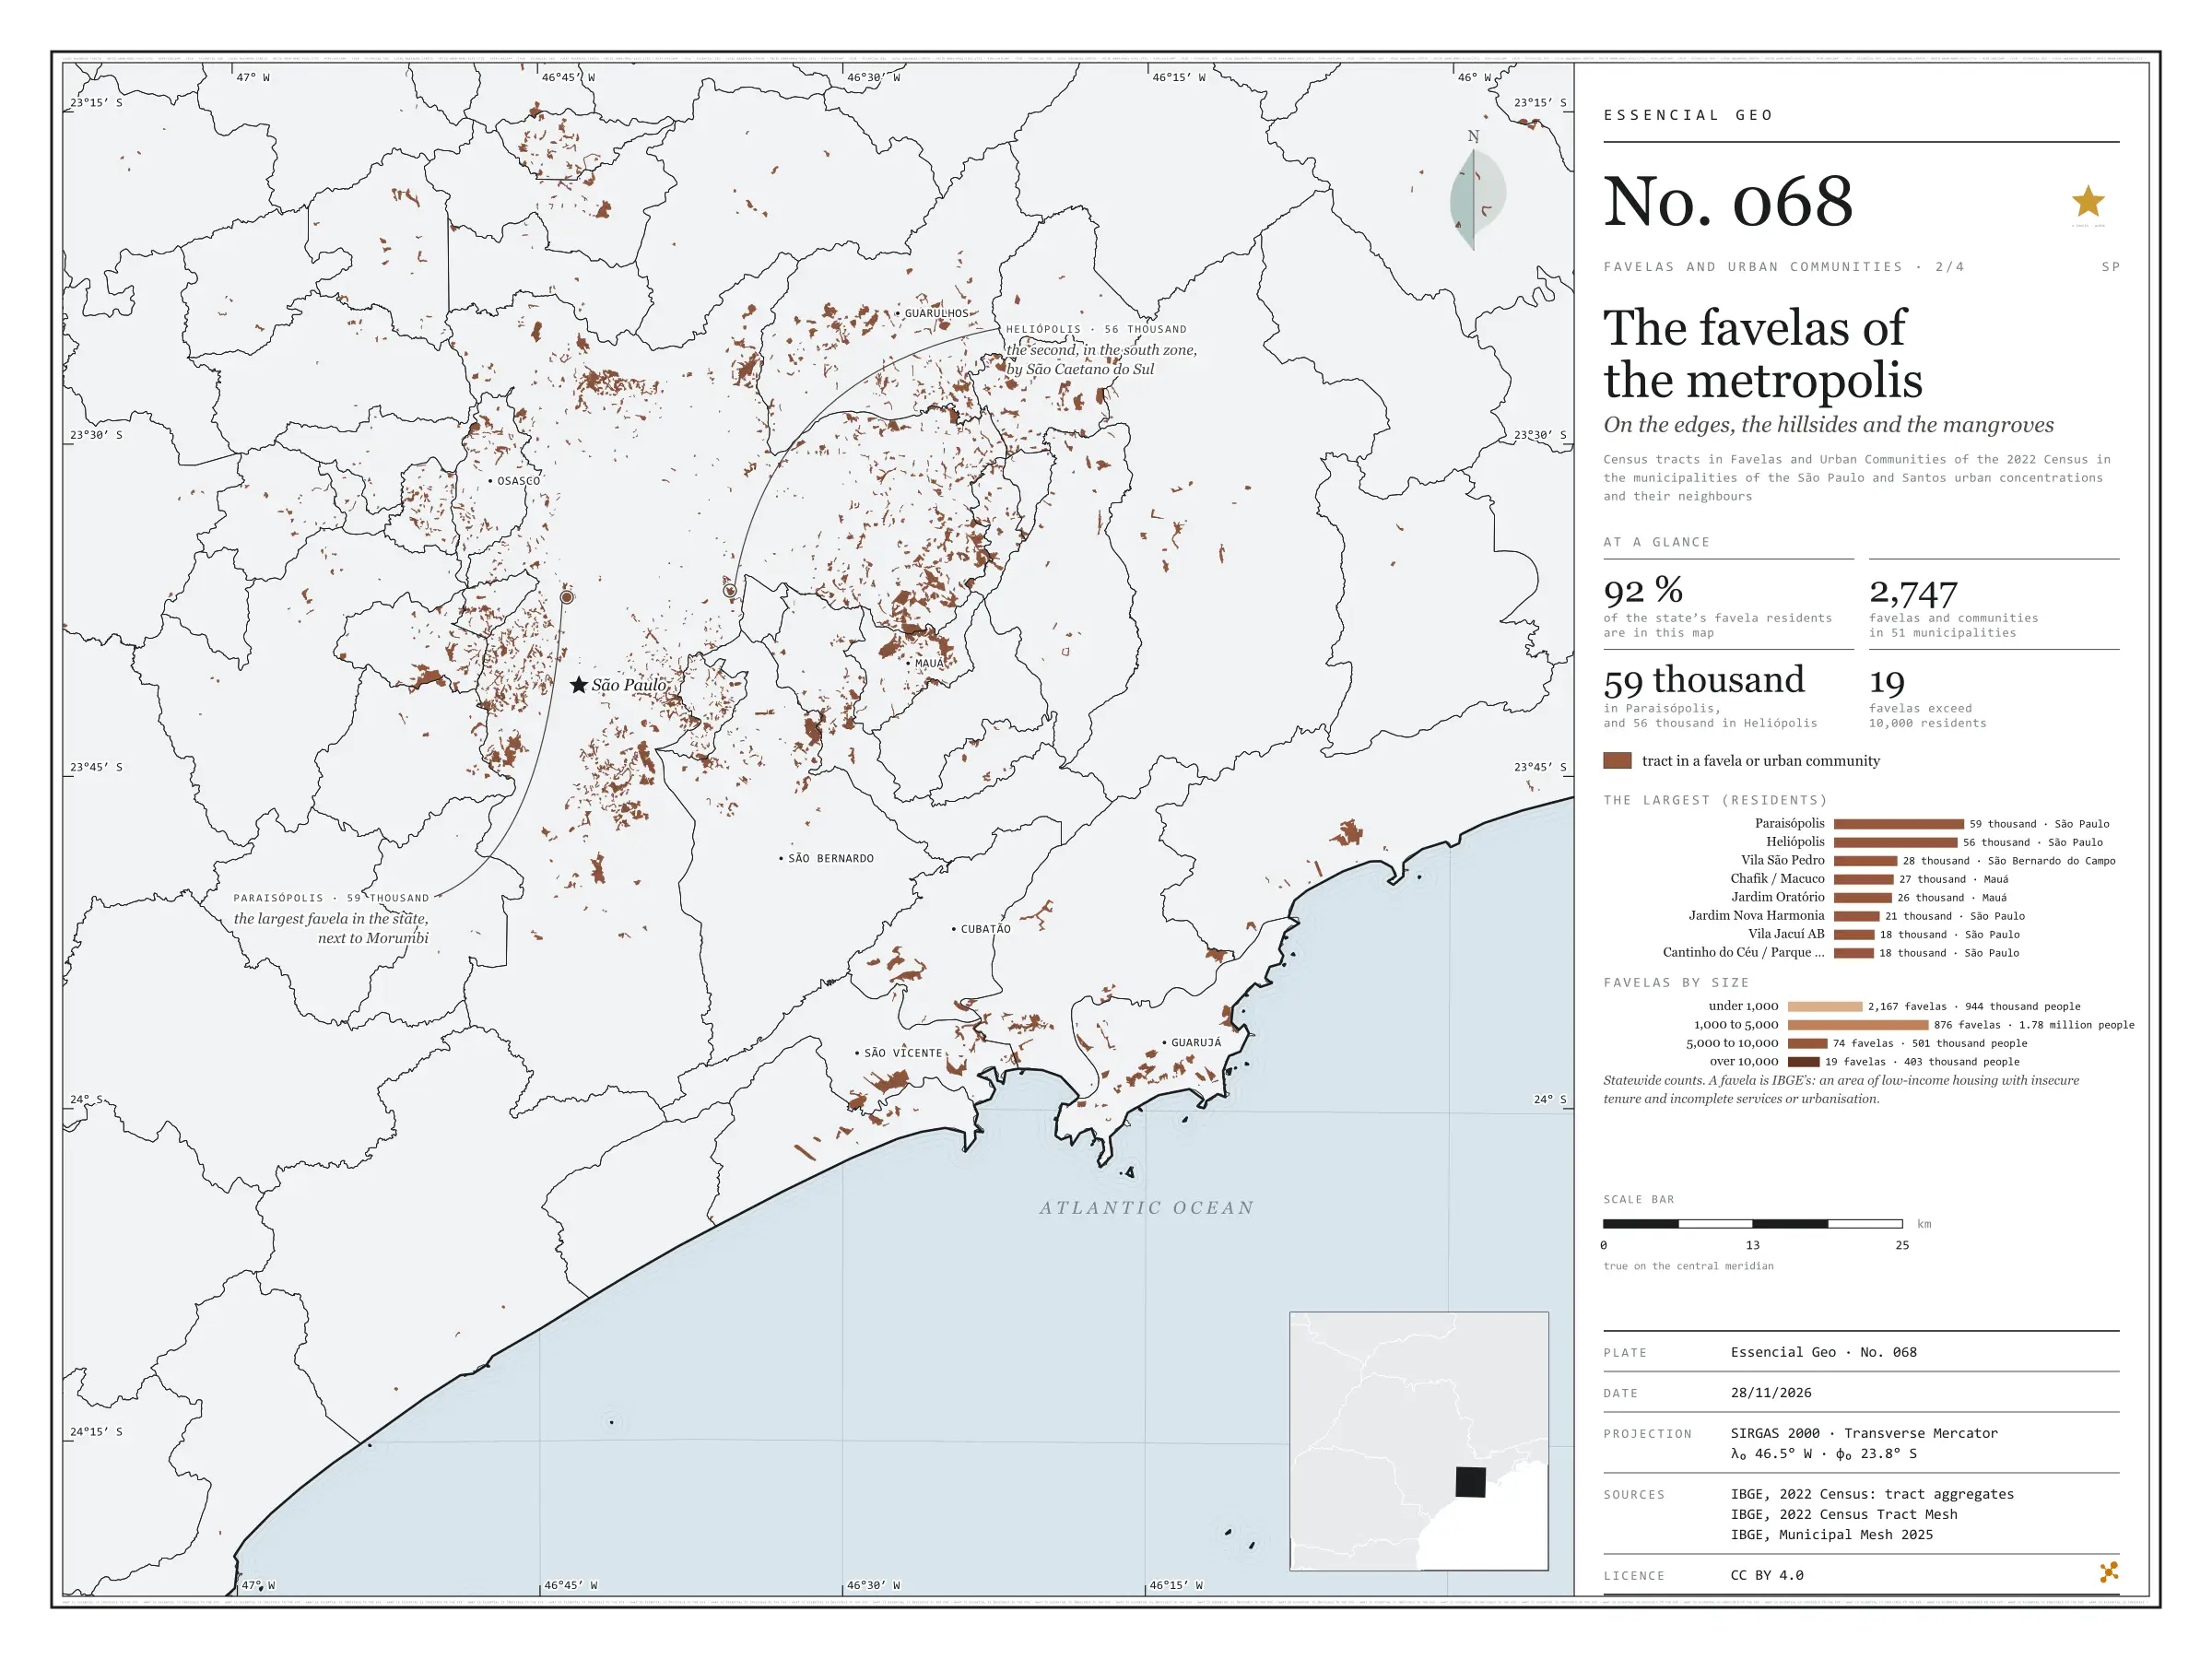
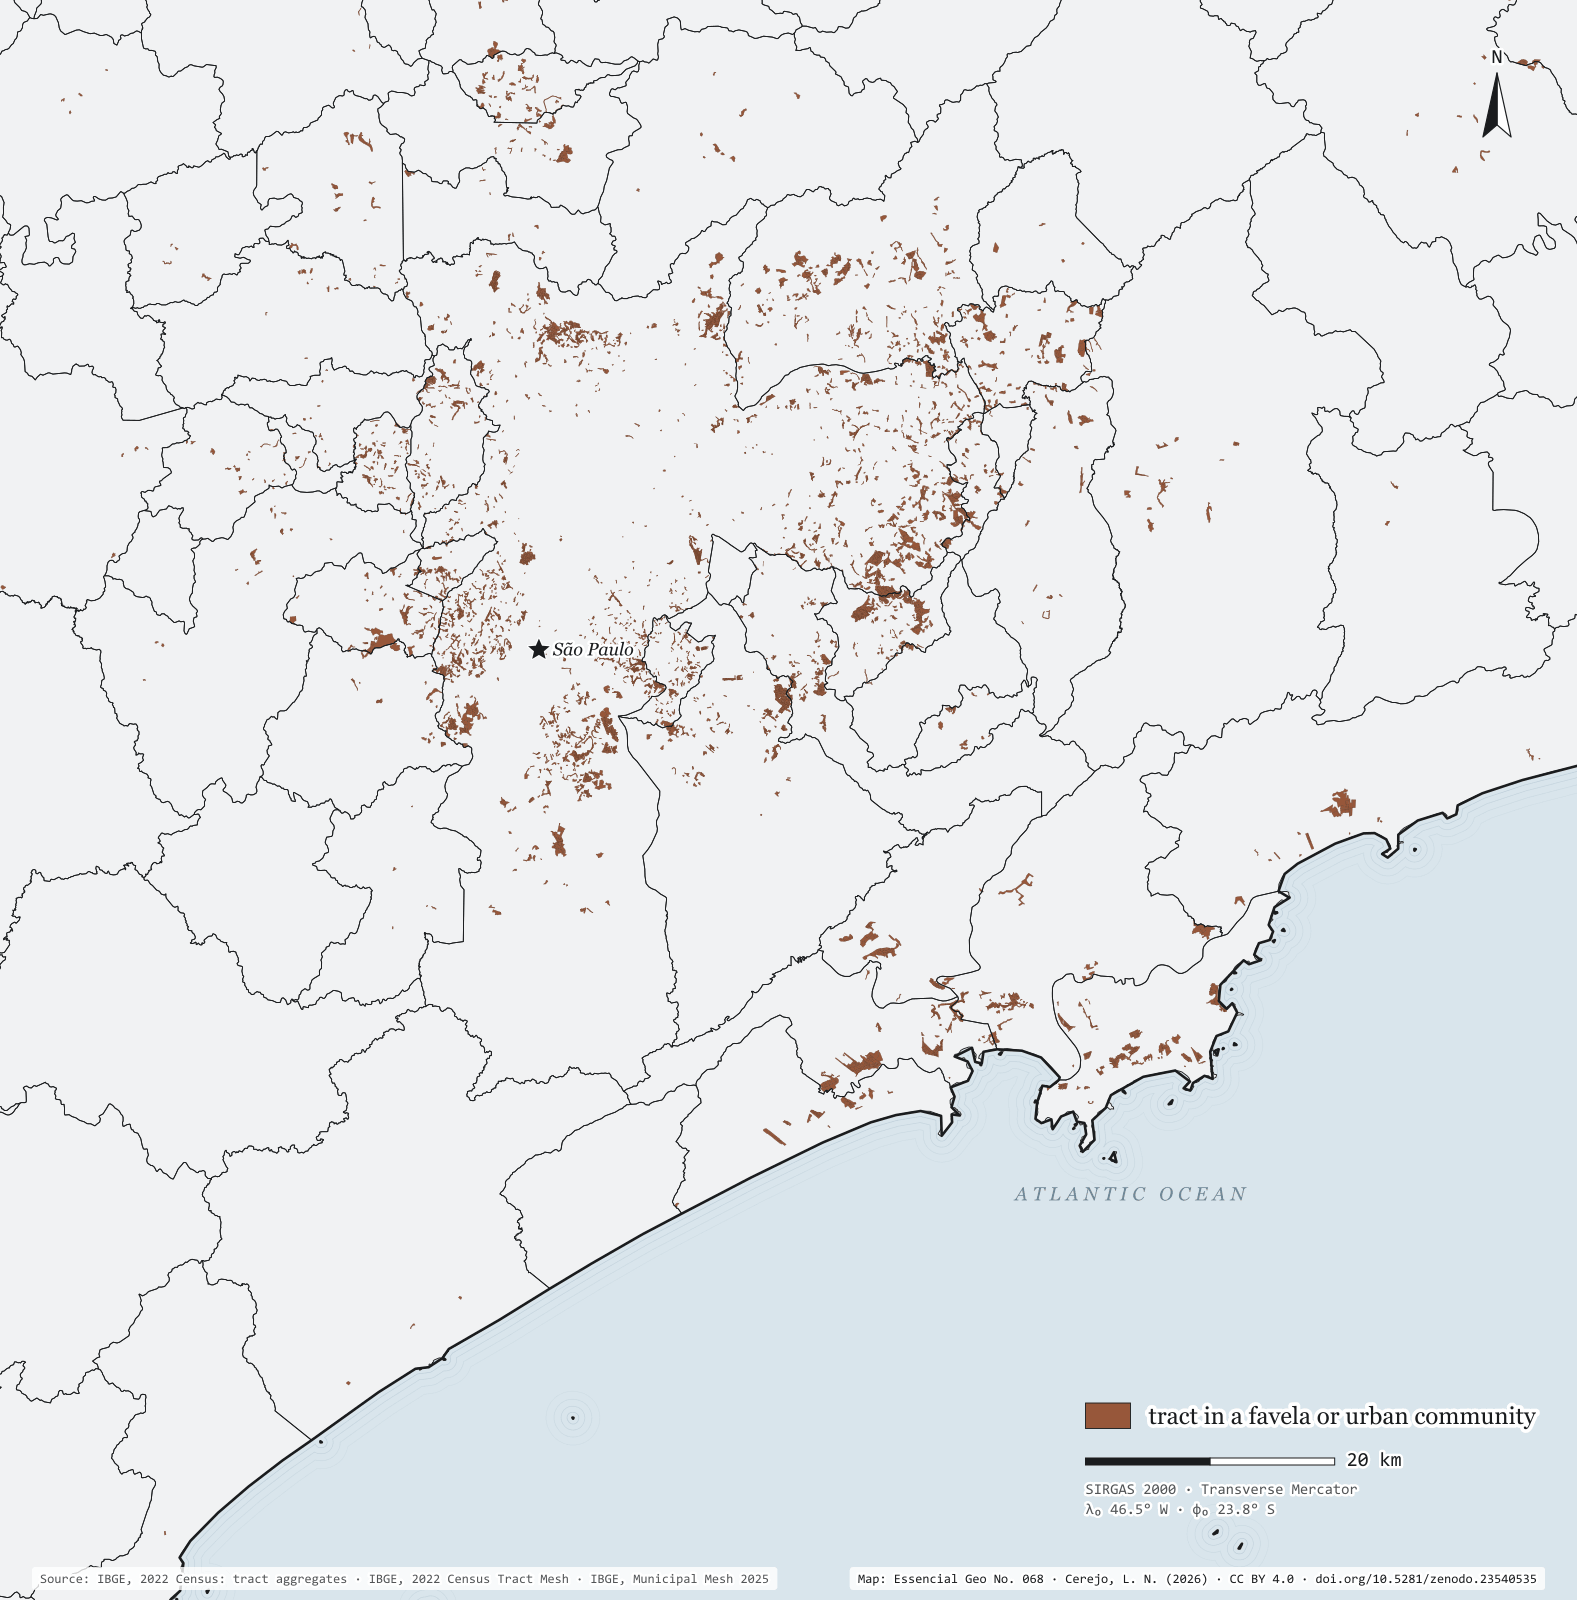
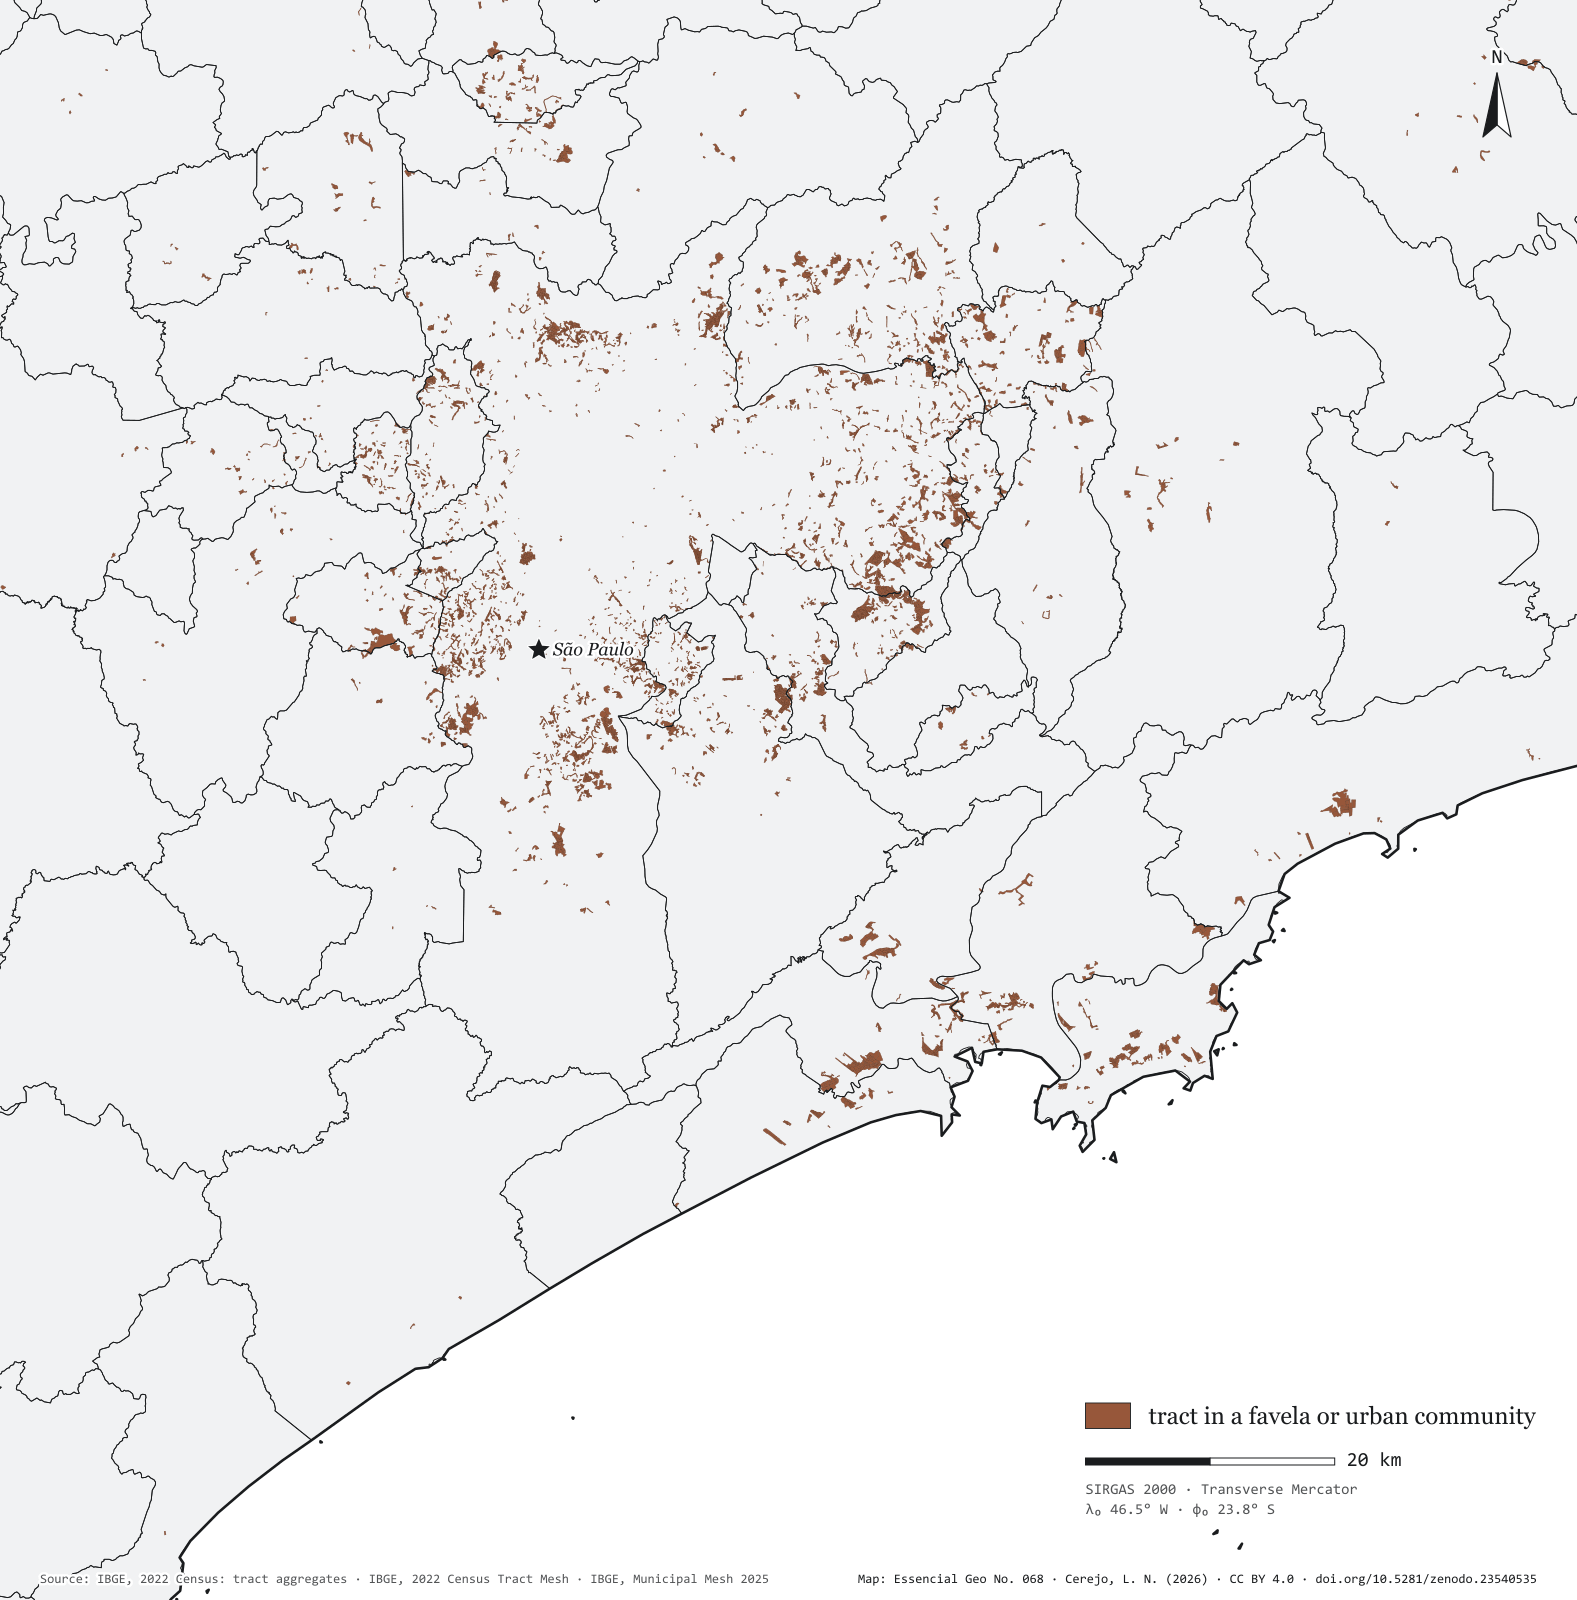
Fig. 068Greater São Paulo and the Santos coast (SP)EPSG:4674Source: IBGE
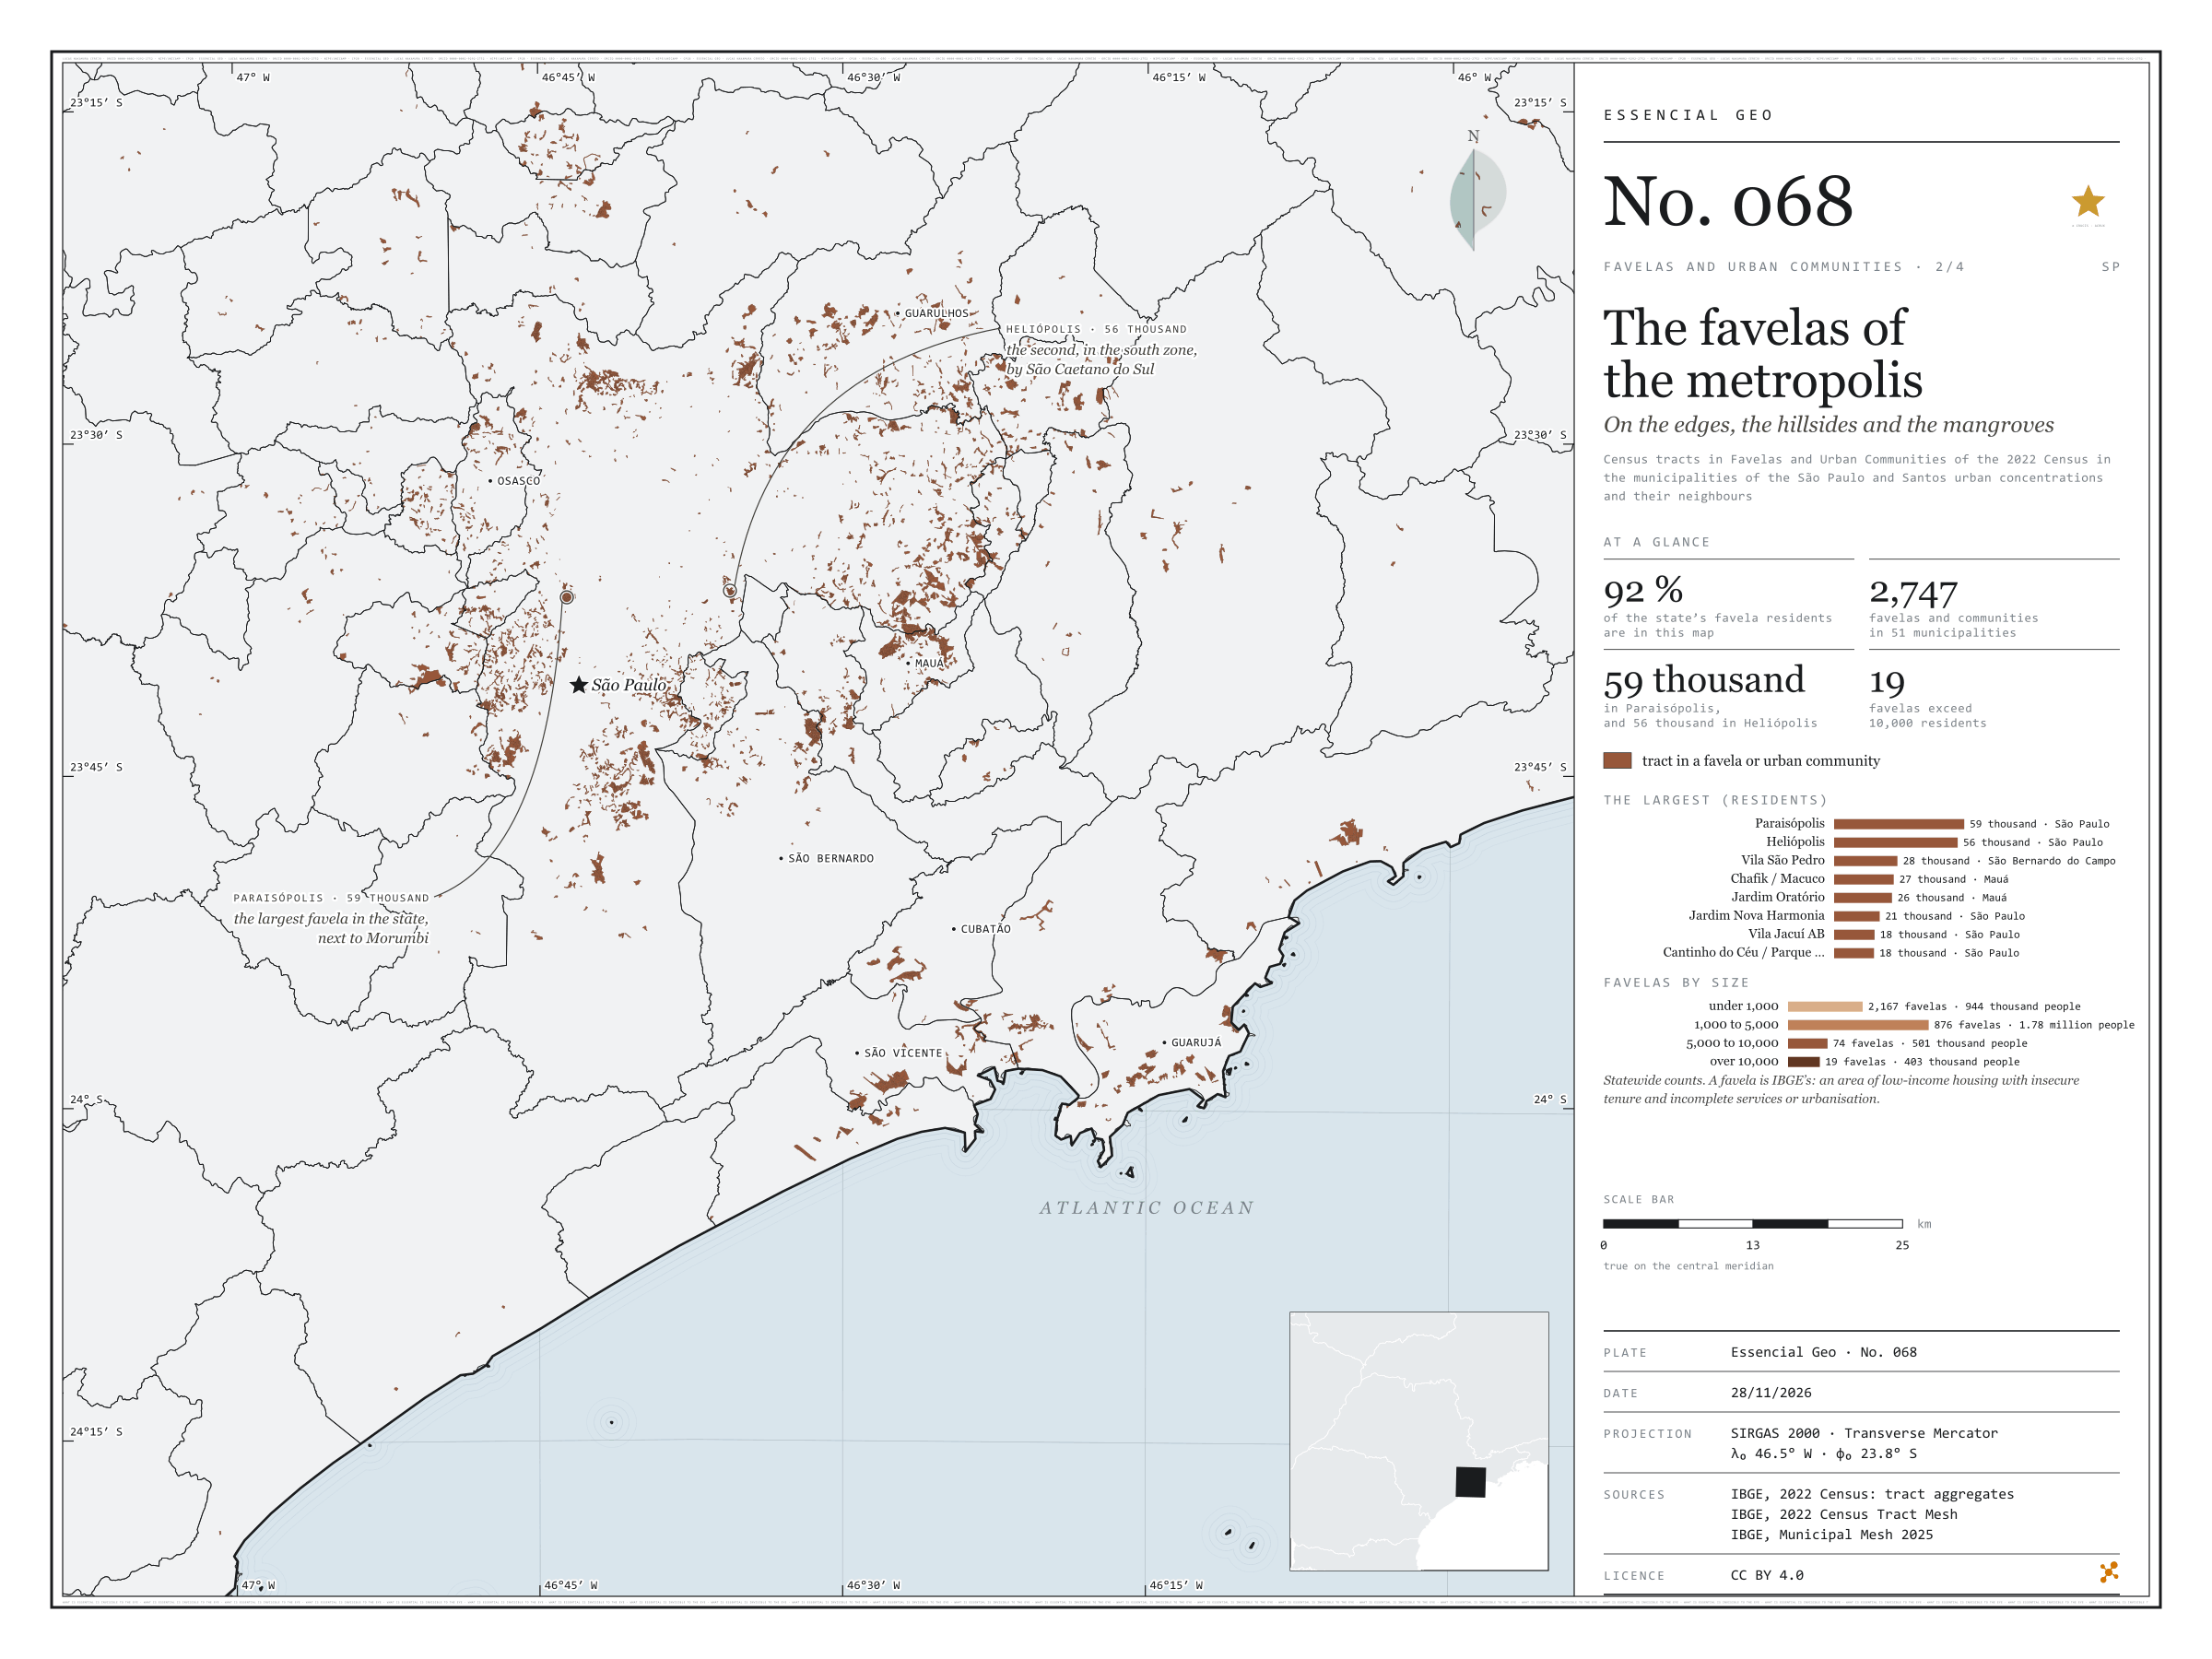
Seen tract by tract, the favelas of Greater São Paulo and the Santos coast are not one patch but hundreds of fragments on valley floors, hillsides and the edges of reservoirs, streams and mangroves. The map window, from Francisco Morato to Guarujá, holds 92% of the state’s favela residents, in 2,747 communities across 51 municipalities. The two largest are in the capital: Paraisópolis, with 59,000 residents, beside Morumbi, and Heliópolis, with 56,000, in the south, next to São Caetano do Sul. Then come Vila São Pedro, in São Bernardo do Campo, with 28,000, and Chafik/Macuco and Jardim Oratório, in Mauá. In the state, only 19 favelas exceed 10,000 residents, with 403,000 people between them; most are small: 2,167 have fewer than 1,000 residents, and the bulk of the population, 1.78 million, lives in the 876 with 1,000 to 5,000.
Technical record · downloads · citation
At a glance
Favela residents by favela size, statewide (people)
under 1,00026%
1,000 to 5,00049.1%
5,000 to 10,00013.8%
over 10,00011.1%
The state’s favela residents in this window
92%
2,747 favelas and communities in 51 municipalities
Residents of Paraisópolis
58,527people
Layers
setores_fcupolygon8,008 tracts in Favelas and Urban Communities: community code and name, municipality, people and occupied households
municipiospolygon645 municipalities: people, people in favelas, number of communities and population share
regioes_intermediariaspolygon11 intermediate geographic regions
Census tracts coded as a Favela or Urban Community in the 2022 Census aggregates, drawn over the municipal mesh; residents of each community = sum of people in its tracts.
The map without a frame, with legend, scale, reference system and credit written on it: ready for papers, lectures and slides. In two versions: with the basemap (neighbours and sea) or only the mapped area, on white.
CEREJO, Lucas Nakamura. As favelas da metrópole: nas margens, nas encostas e nos mangues. Versão 1.0.0. [S. l.]: Zenodo, 2026. Conjunto de dados. DOI: 10.5281/zenodo.23540535. Disponível em: https://doi.org/10.5281/zenodo.23540535. Acesso em: 10 nov. 2026.
Cerejo, L. N. (2026). As favelas da metrópole: nas margens, nas encostas e nos mangues [The favelas of the metropolis: On the banks, the slopes and the mangroves] (Version 1.0.0) [Data set]. Zenodo. https://doi.org/10.5281/zenodo.23540535
@dataset{cerejo2026_favelas_na_metropole_sp,
  author    = {Cerejo, Lucas Nakamura},
  title     = {As favelas da metrópole: Nas margens, nas encostas e nos mangues},
  year      = {2026},
  publisher = {Zenodo},
  version   = {1.0.0},
  doi       = {10.5281/zenodo.23540535},
  url       = {https://doi.org/10.5281/zenodo.23540535},
  language  = {portuguese},
  note      = {English title: The favelas of the metropolis: On the banks, the slopes and the mangroves. Licence CC BY 4.0}
}
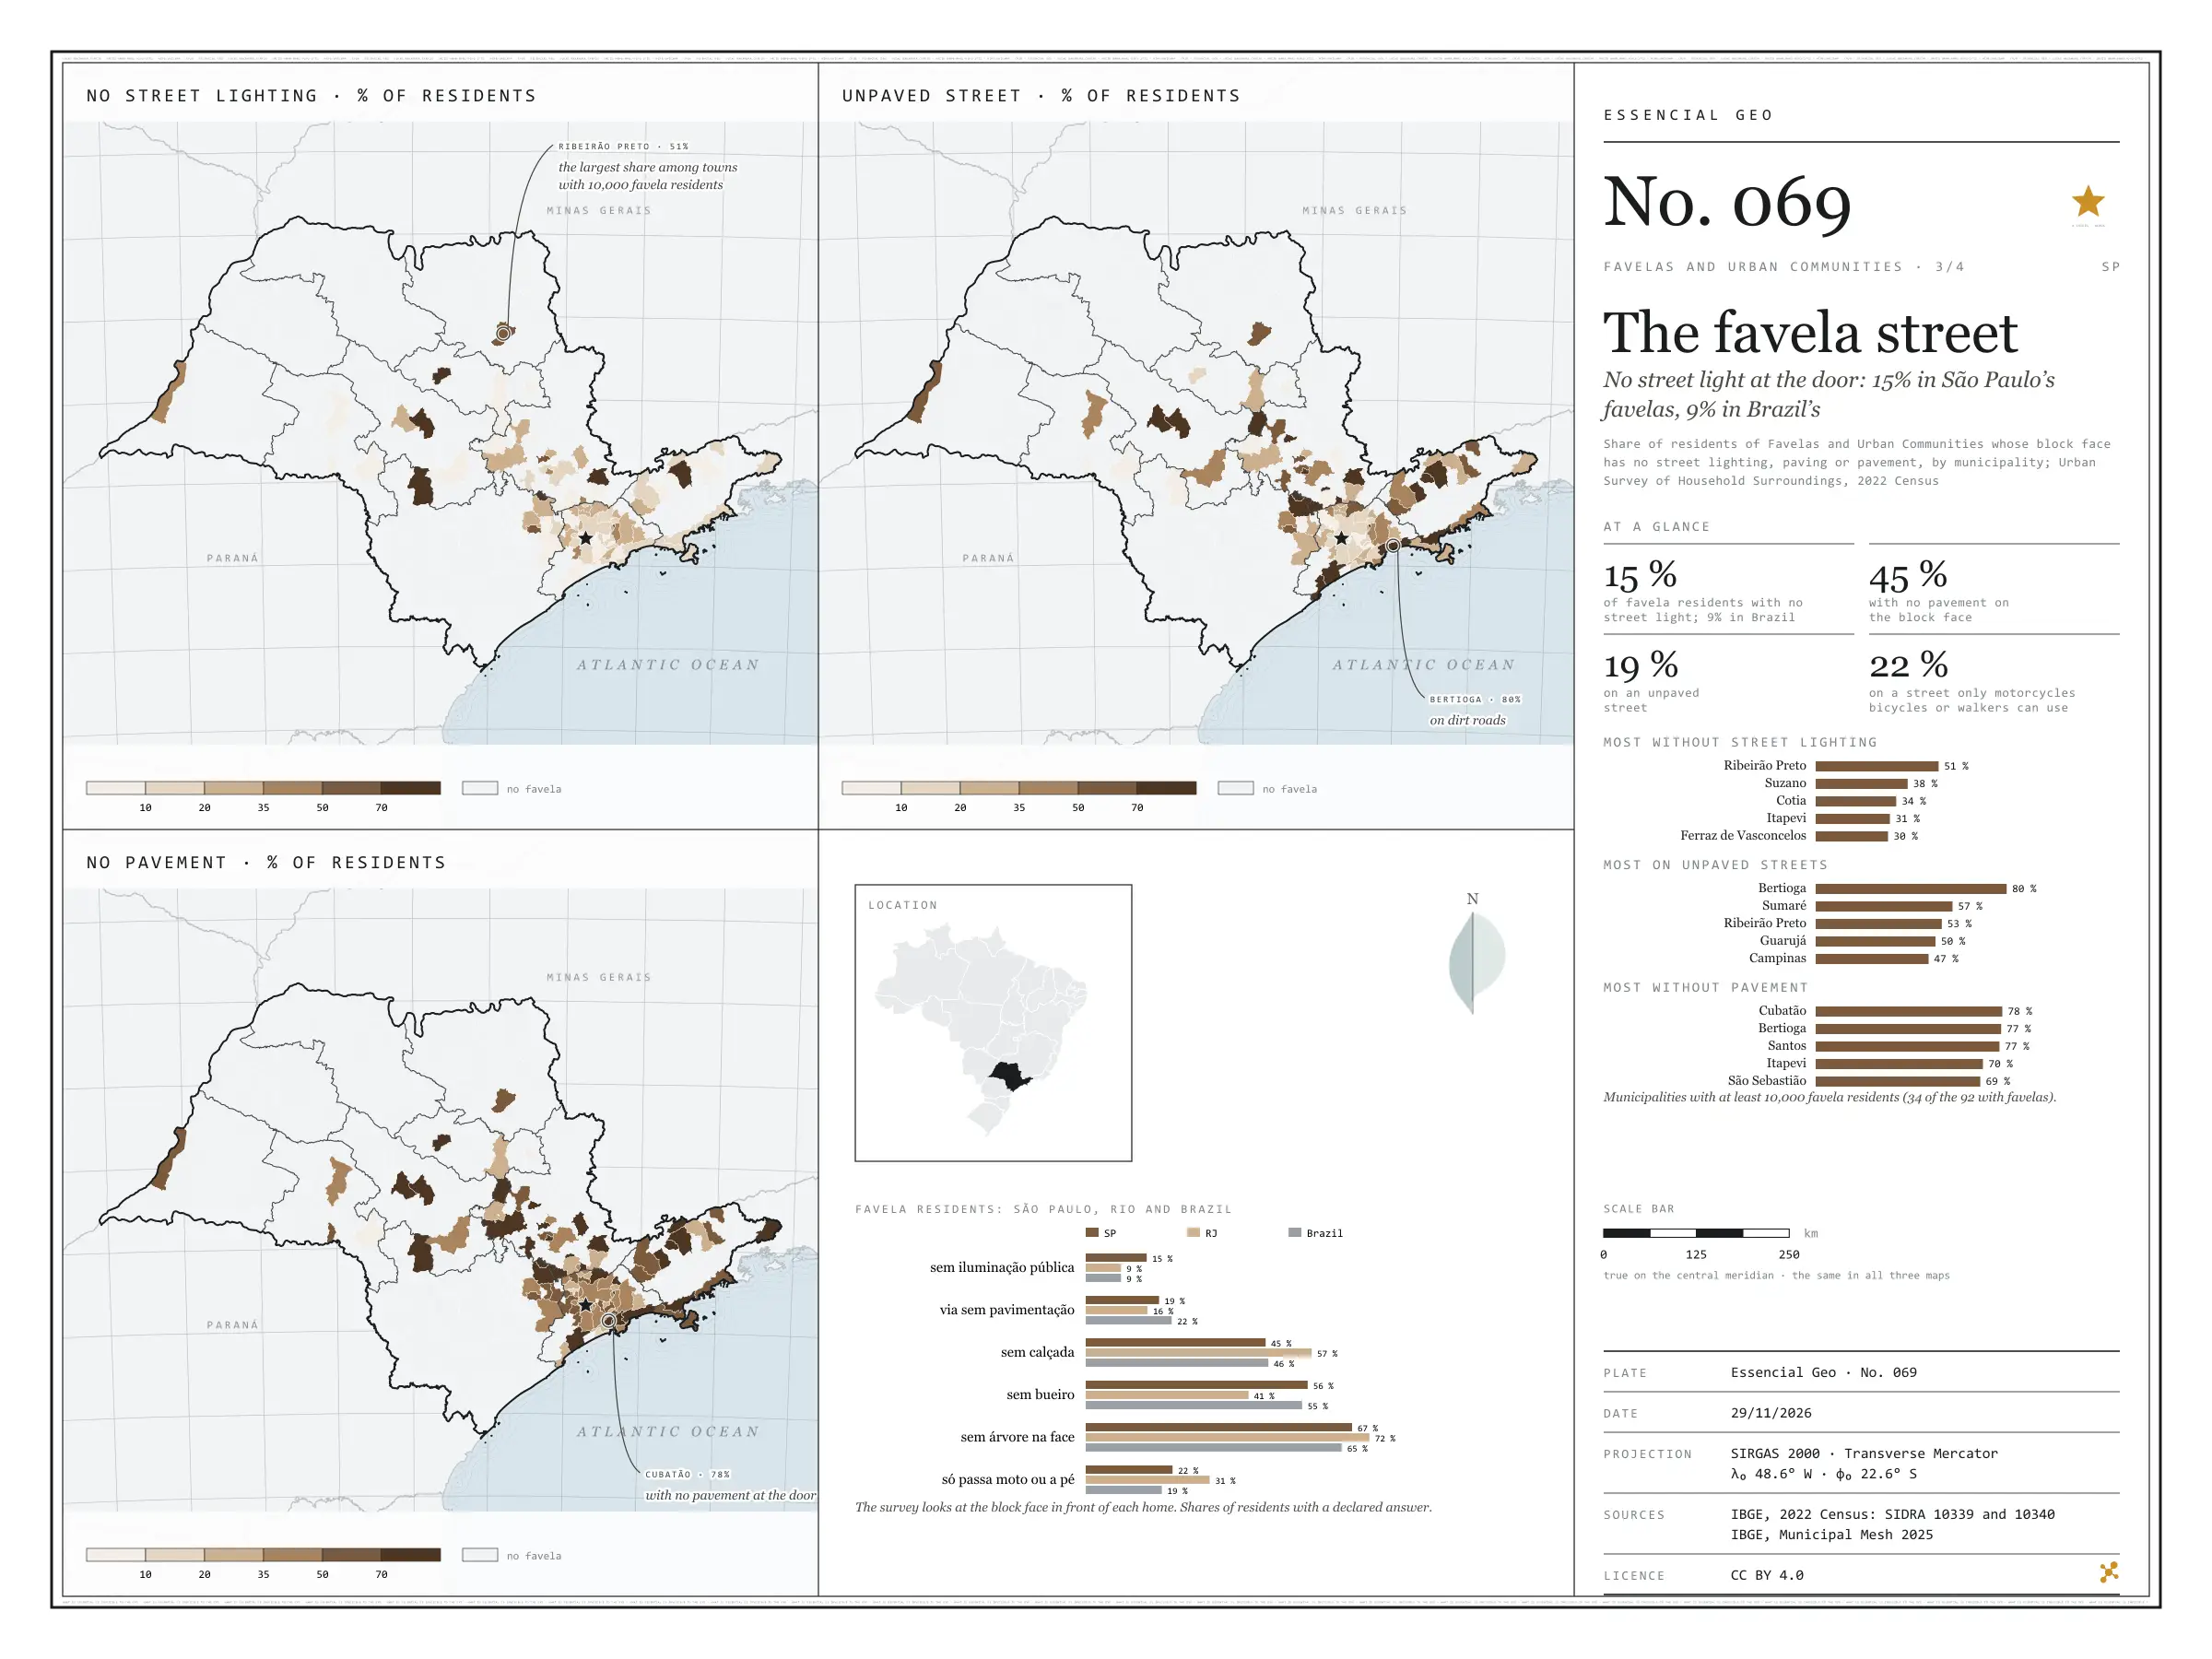
No street light at the door: 15% in São Paulo’s favelas, 9% in Brazil’s
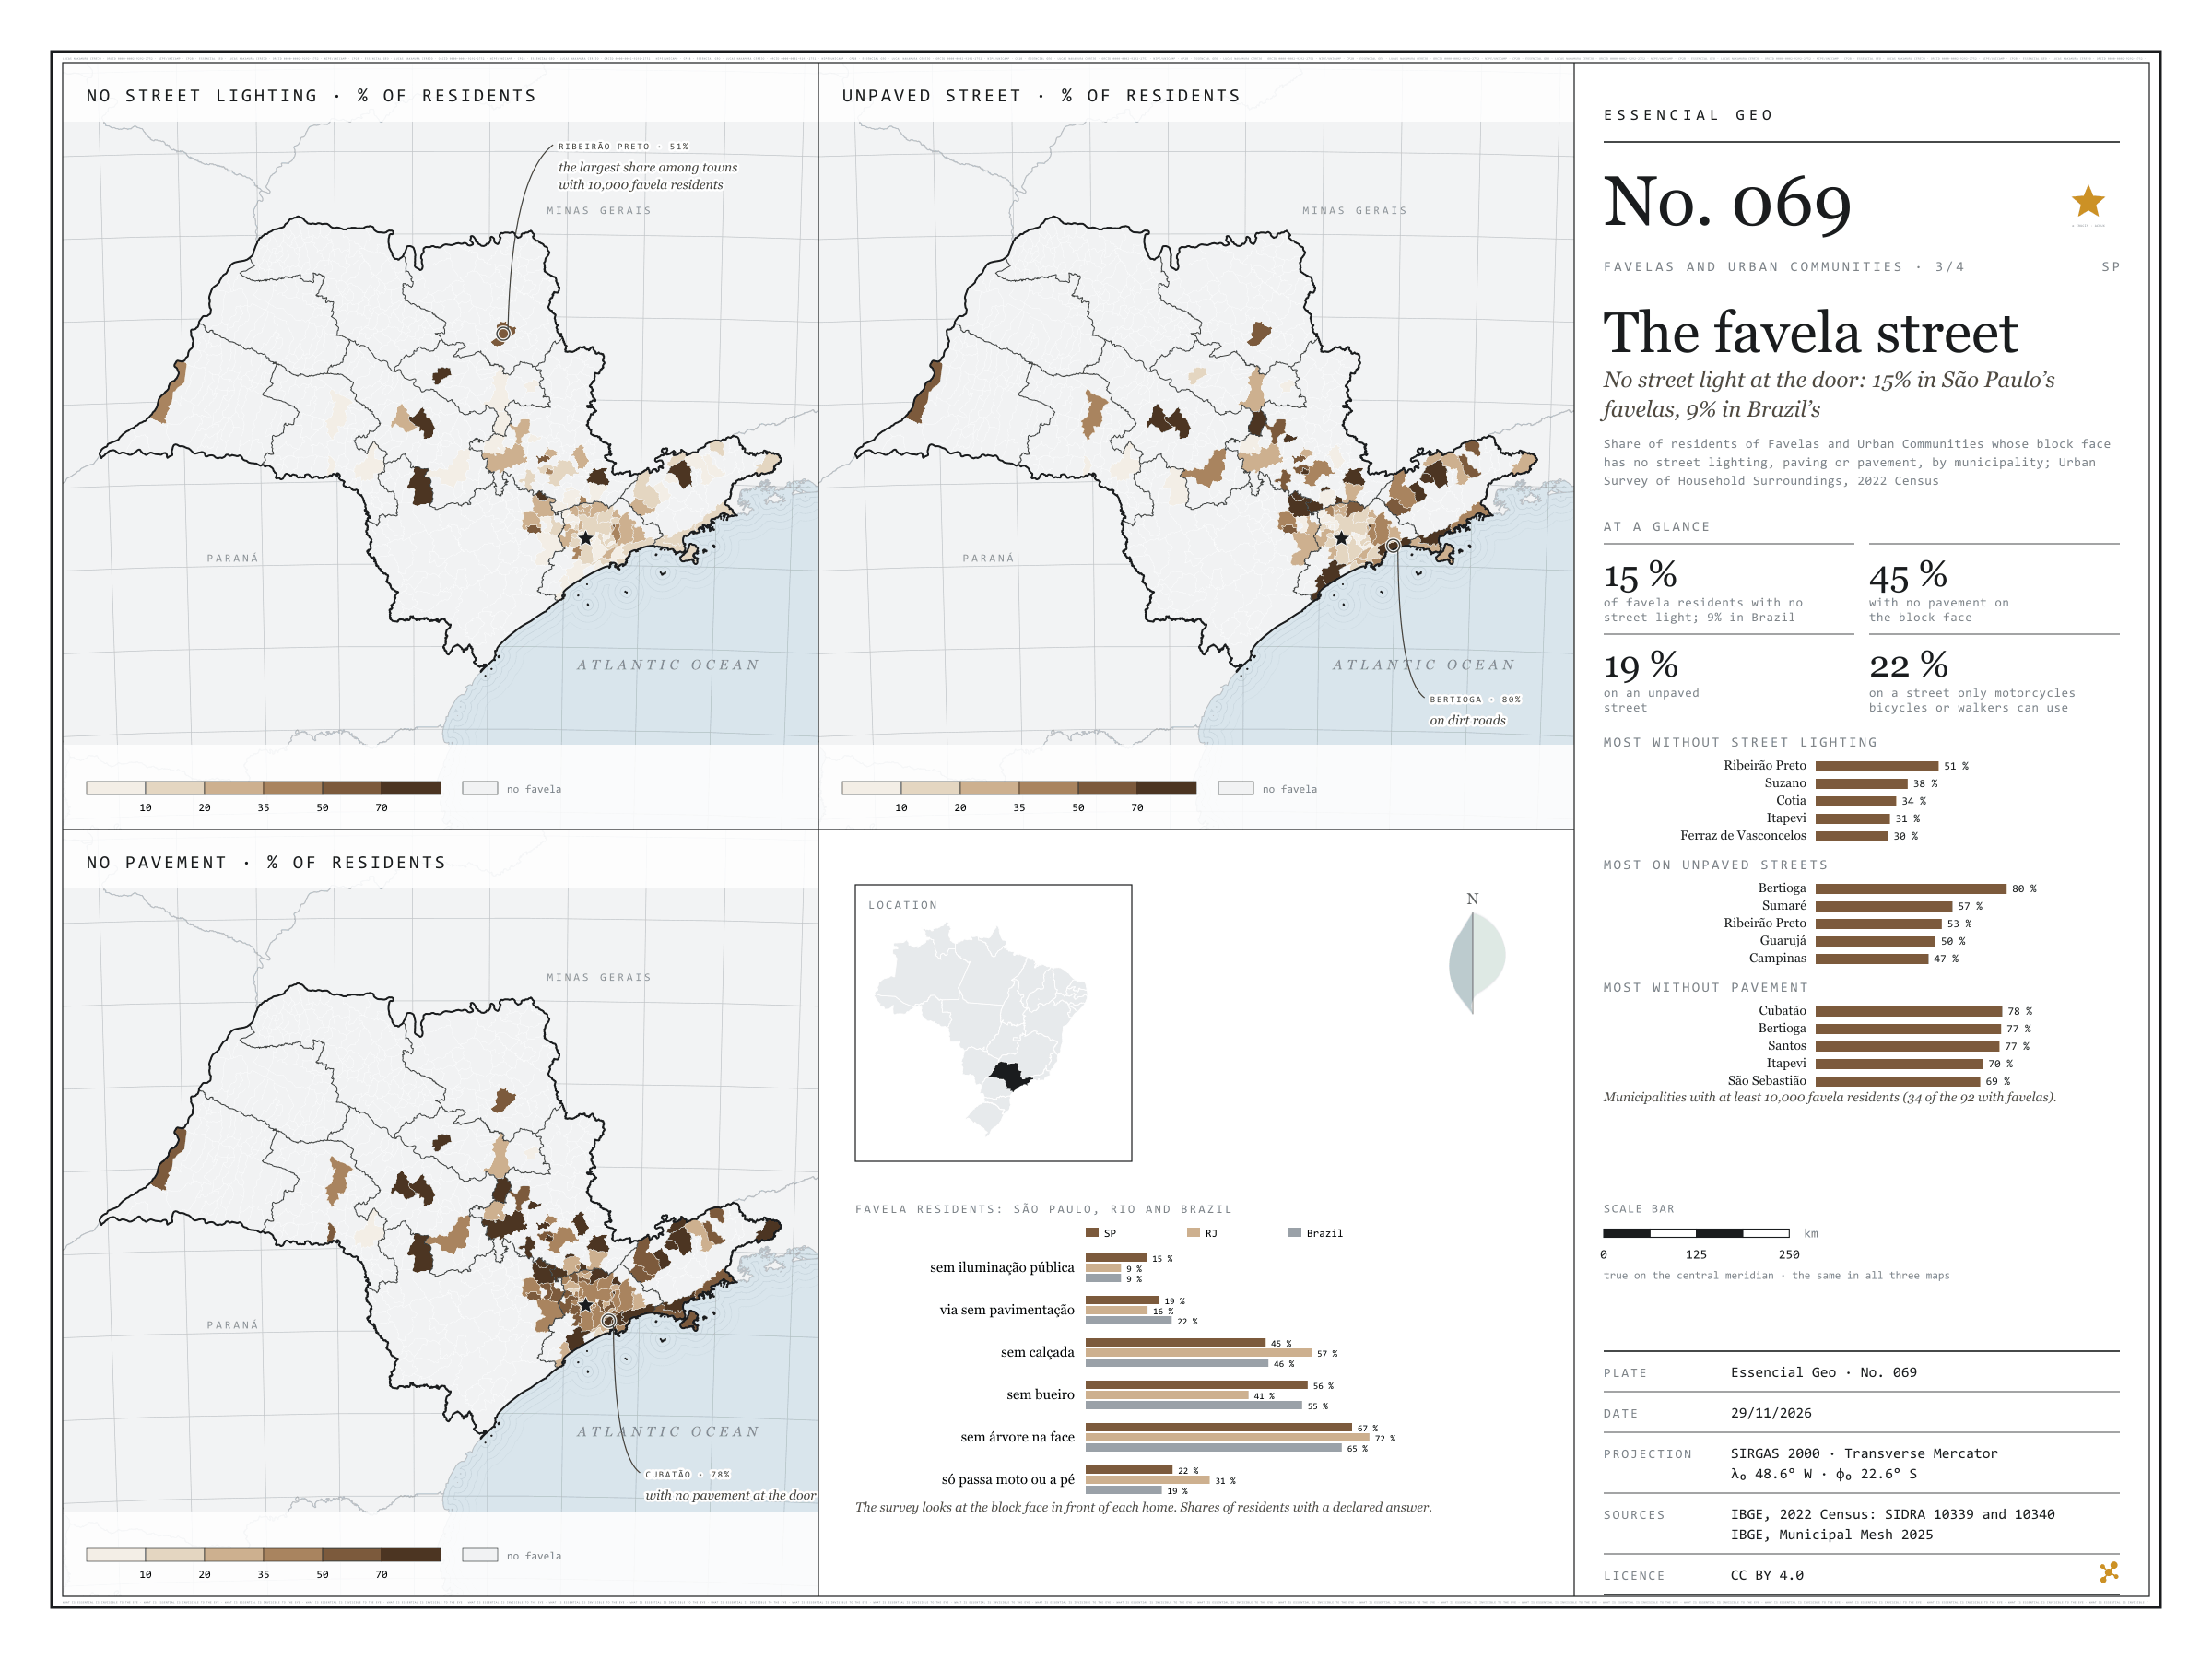
Fig. 069São Paulo State (SP)EPSG:4674Source: IBGE
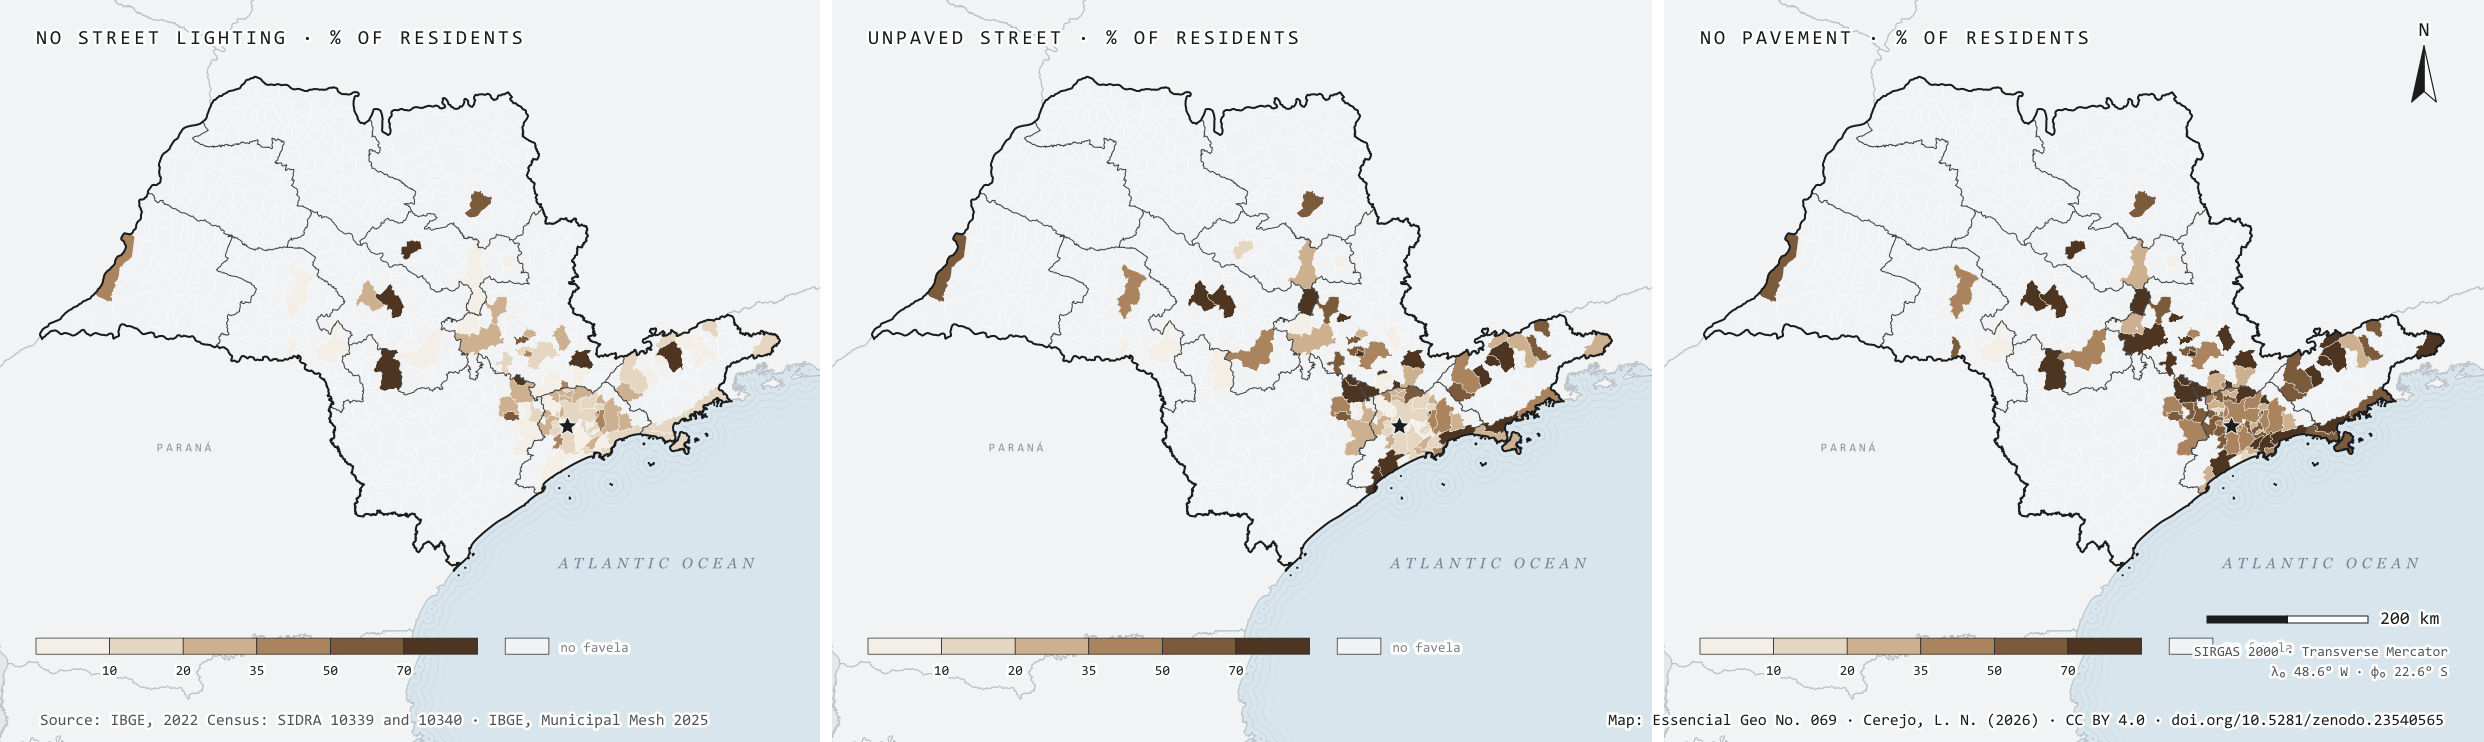
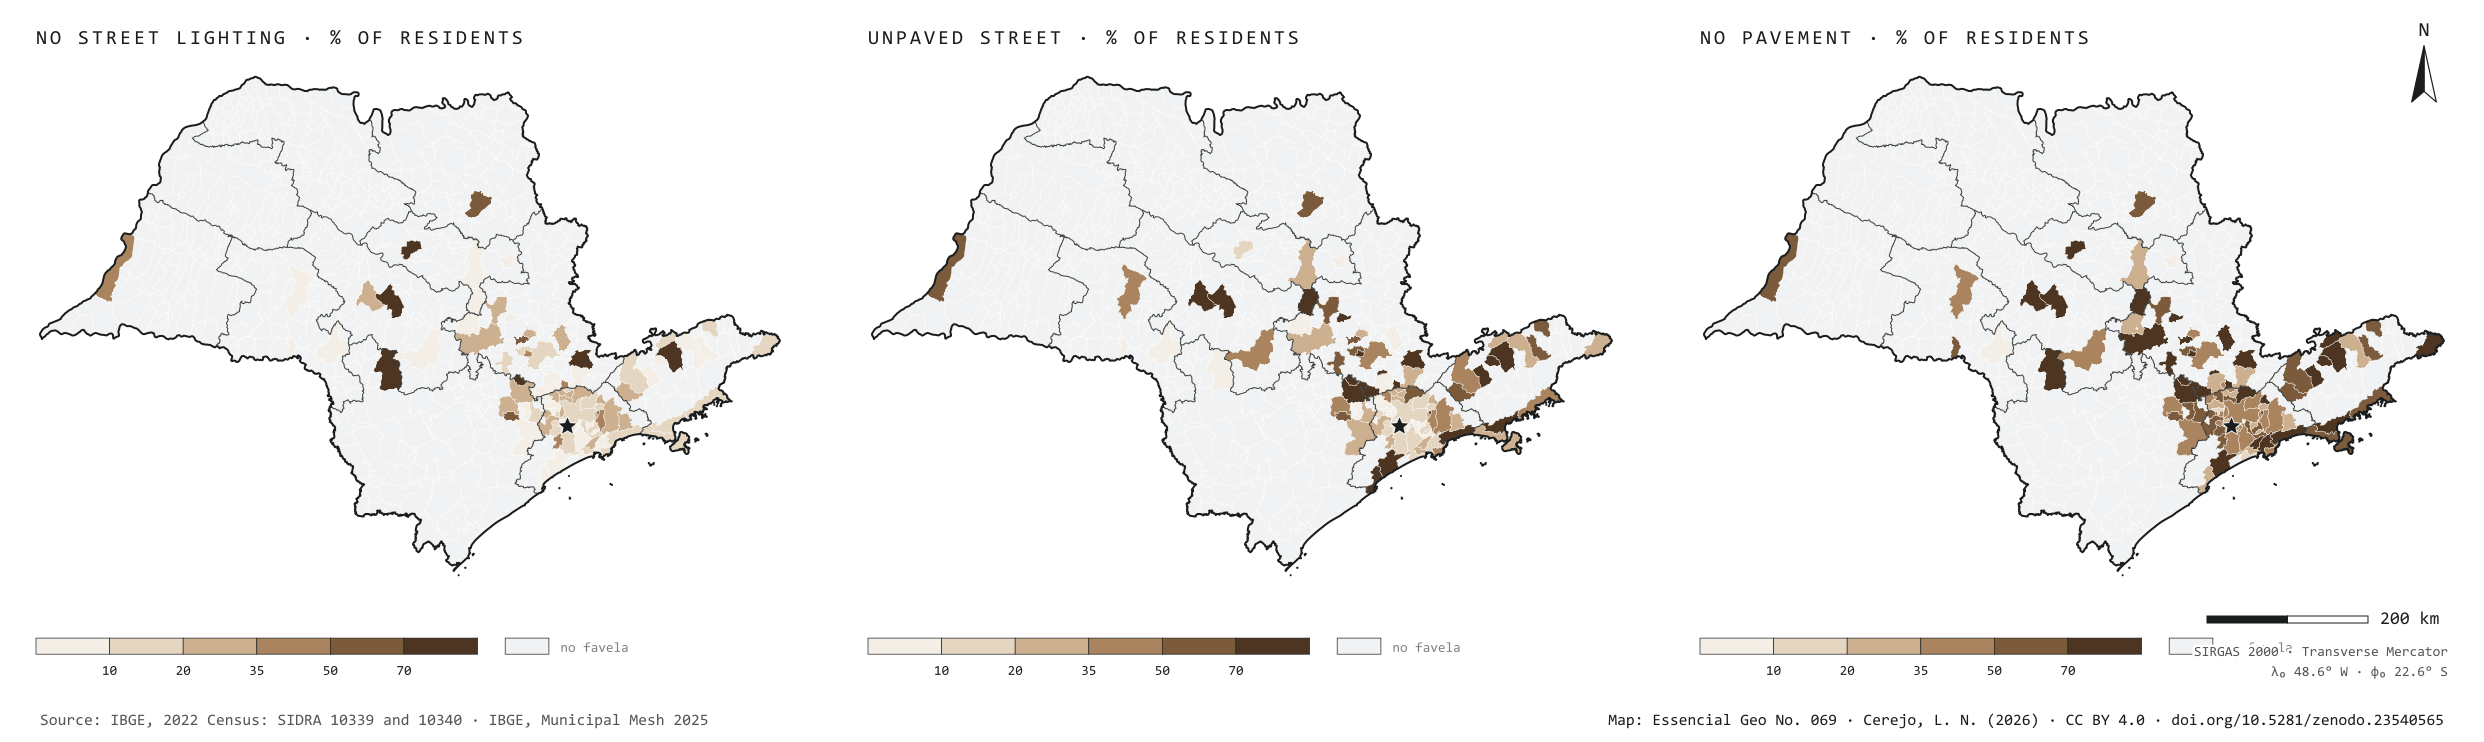
In the 2022 Census, the Urban Survey of Household Surroundings looked at the block face in front of each home. In São Paulo’s favelas, 15% of residents have no street lighting at the door, against 9% in the favelas of Rio and of Brazil as a whole. Paving is better than average: 19% live on an unpaved street, against 22% in Brazil. But 45% have no pavement to walk on, 56% no storm drain and 67% not a single tree on the block face, and for 22% the street only lets through motorbikes, bicycles or people on foot. Among the 34 municipalities with at least 10,000 favela residents, Ribeirão Preto leads on missing light, with 51% of residents in the dark; Bertioga on dirt roads, with 80%; and Cubatão on missing pavements, with 78%, ahead of Bertioga and Santos. The three maps share one frame: only the 92 municipalities with favelas.
Technical record · downloads · citation
At a glance
Favela residents with no street lighting on their block face
15%
8.9% in Brazil and in Rio de Janeiro
Favela residents with no pavement
45%
46.1% in Brazil
Favela residents on unpaved streets
19%
21.7% in Brazil
Layers
municipiospolygon645 municipalities: favela residents with surveyed surroundings and the shares without street lighting, paving, storm drains, pavement and trees, and on streets for motorbikes or pedestrians only
setores_fcupolygon8,008 tracts in Favelas and Urban Communities
regioes_intermediariaspolygon11 intermediate geographic regions
Residents of Favelas and Urban Communities whose block face has no street lighting, paving or pavement over residents with the feature declared, by municipality, from SIDRA 10340, in six classes; municipalities without favelas shown apart.
The map without a frame, with legend, scale, reference system and credit written on it: ready for papers, lectures and slides. In two versions: with the basemap (neighbours and sea) or only the mapped area, on white.
CEREJO, Lucas Nakamura. A rua da favela: sem luz pública na porta: 15 % nas favelas paulistas, 9 % nas do país. Versão 1.0.0. [S. l.]: Zenodo, 2026. Conjunto de dados. DOI: 10.5281/zenodo.23540565. Disponível em: https://doi.org/10.5281/zenodo.23540565. Acesso em: 10 nov. 2026.
Cerejo, L. N. (2026). A rua da favela: sem luz pública na porta: 15 % nas favelas paulistas, 9 % nas do país [The favela street: No street light at the door: 15% in São Paulo’s favelas, 9% in Brazil’s] (Version 1.0.0) [Data set]. Zenodo. https://doi.org/10.5281/zenodo.23540565
@dataset{cerejo2026_entorno_das_favelas_sp,
  author    = {Cerejo, Lucas Nakamura},
  title     = {A rua da favela: Sem luz pública na porta: 15 % nas favelas paulistas, 9 % nas do país},
  year      = {2026},
  publisher = {Zenodo},
  version   = {1.0.0},
  doi       = {10.5281/zenodo.23540565},
  url       = {https://doi.org/10.5281/zenodo.23540565},
  language  = {portuguese},
  note      = {English title: The favela street: No street light at the door: 15% in São Paulo’s favelas, 9% in Brazil’s. Licence CC BY 4.0}
}
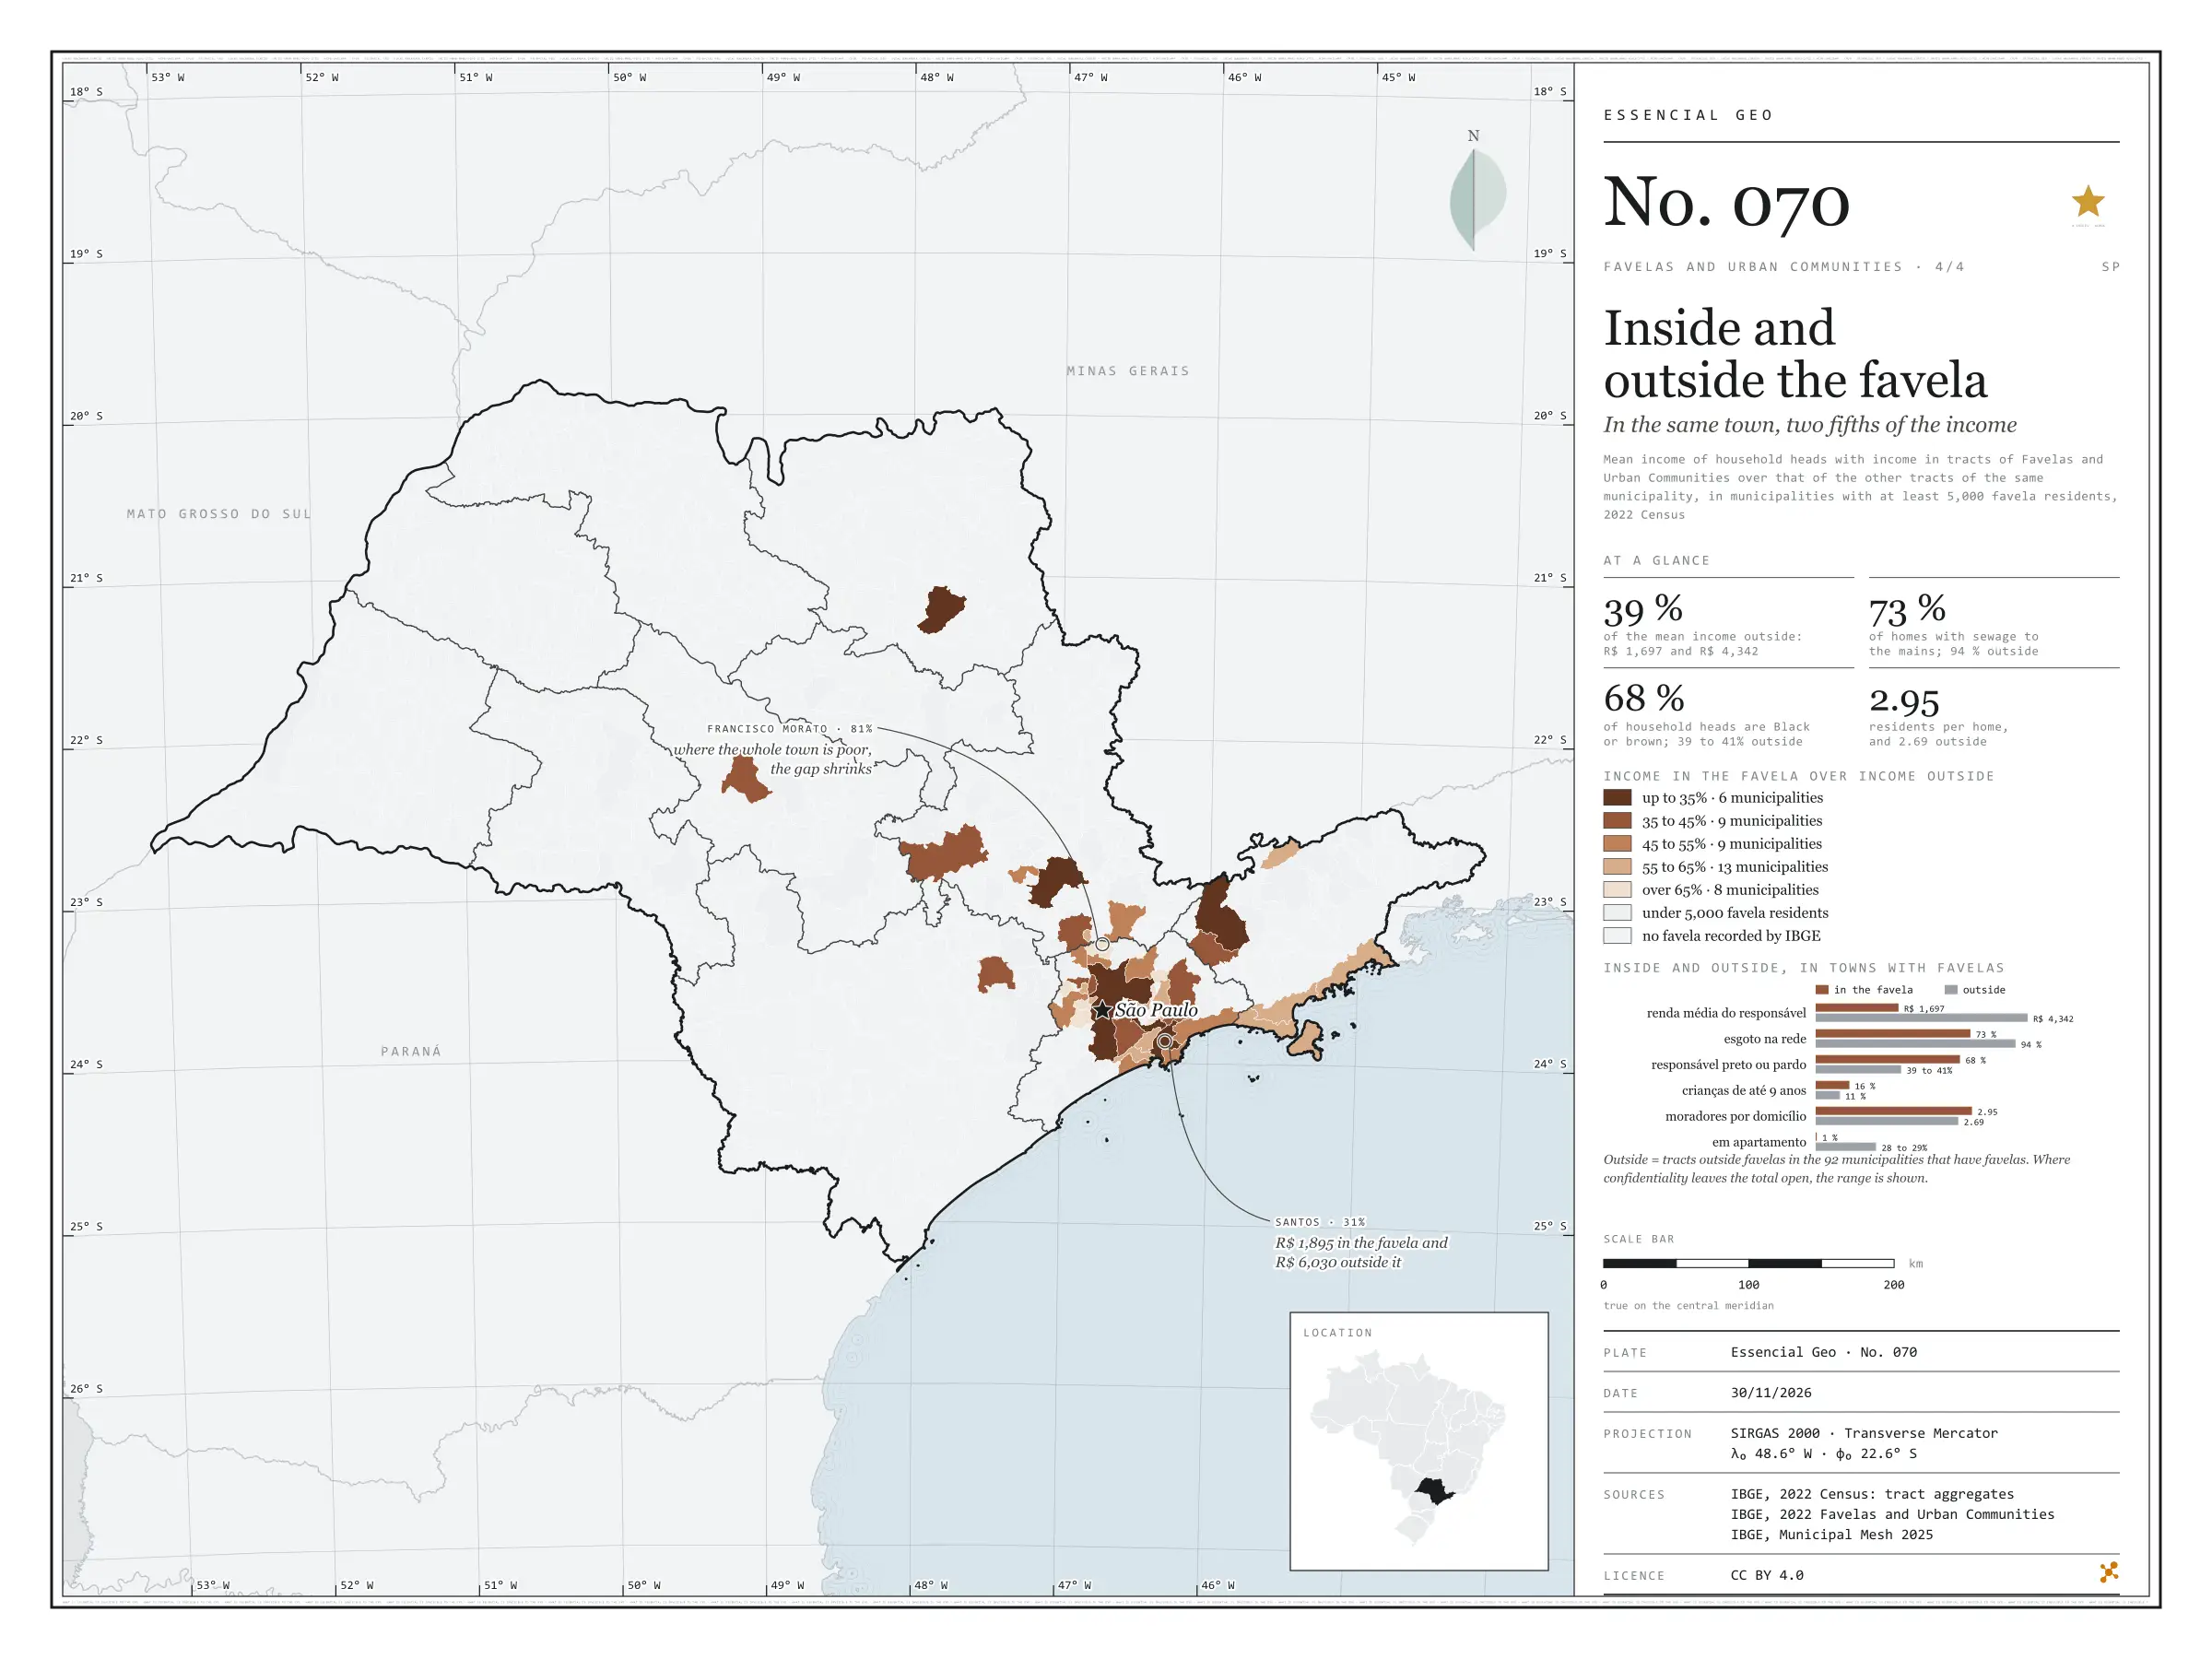
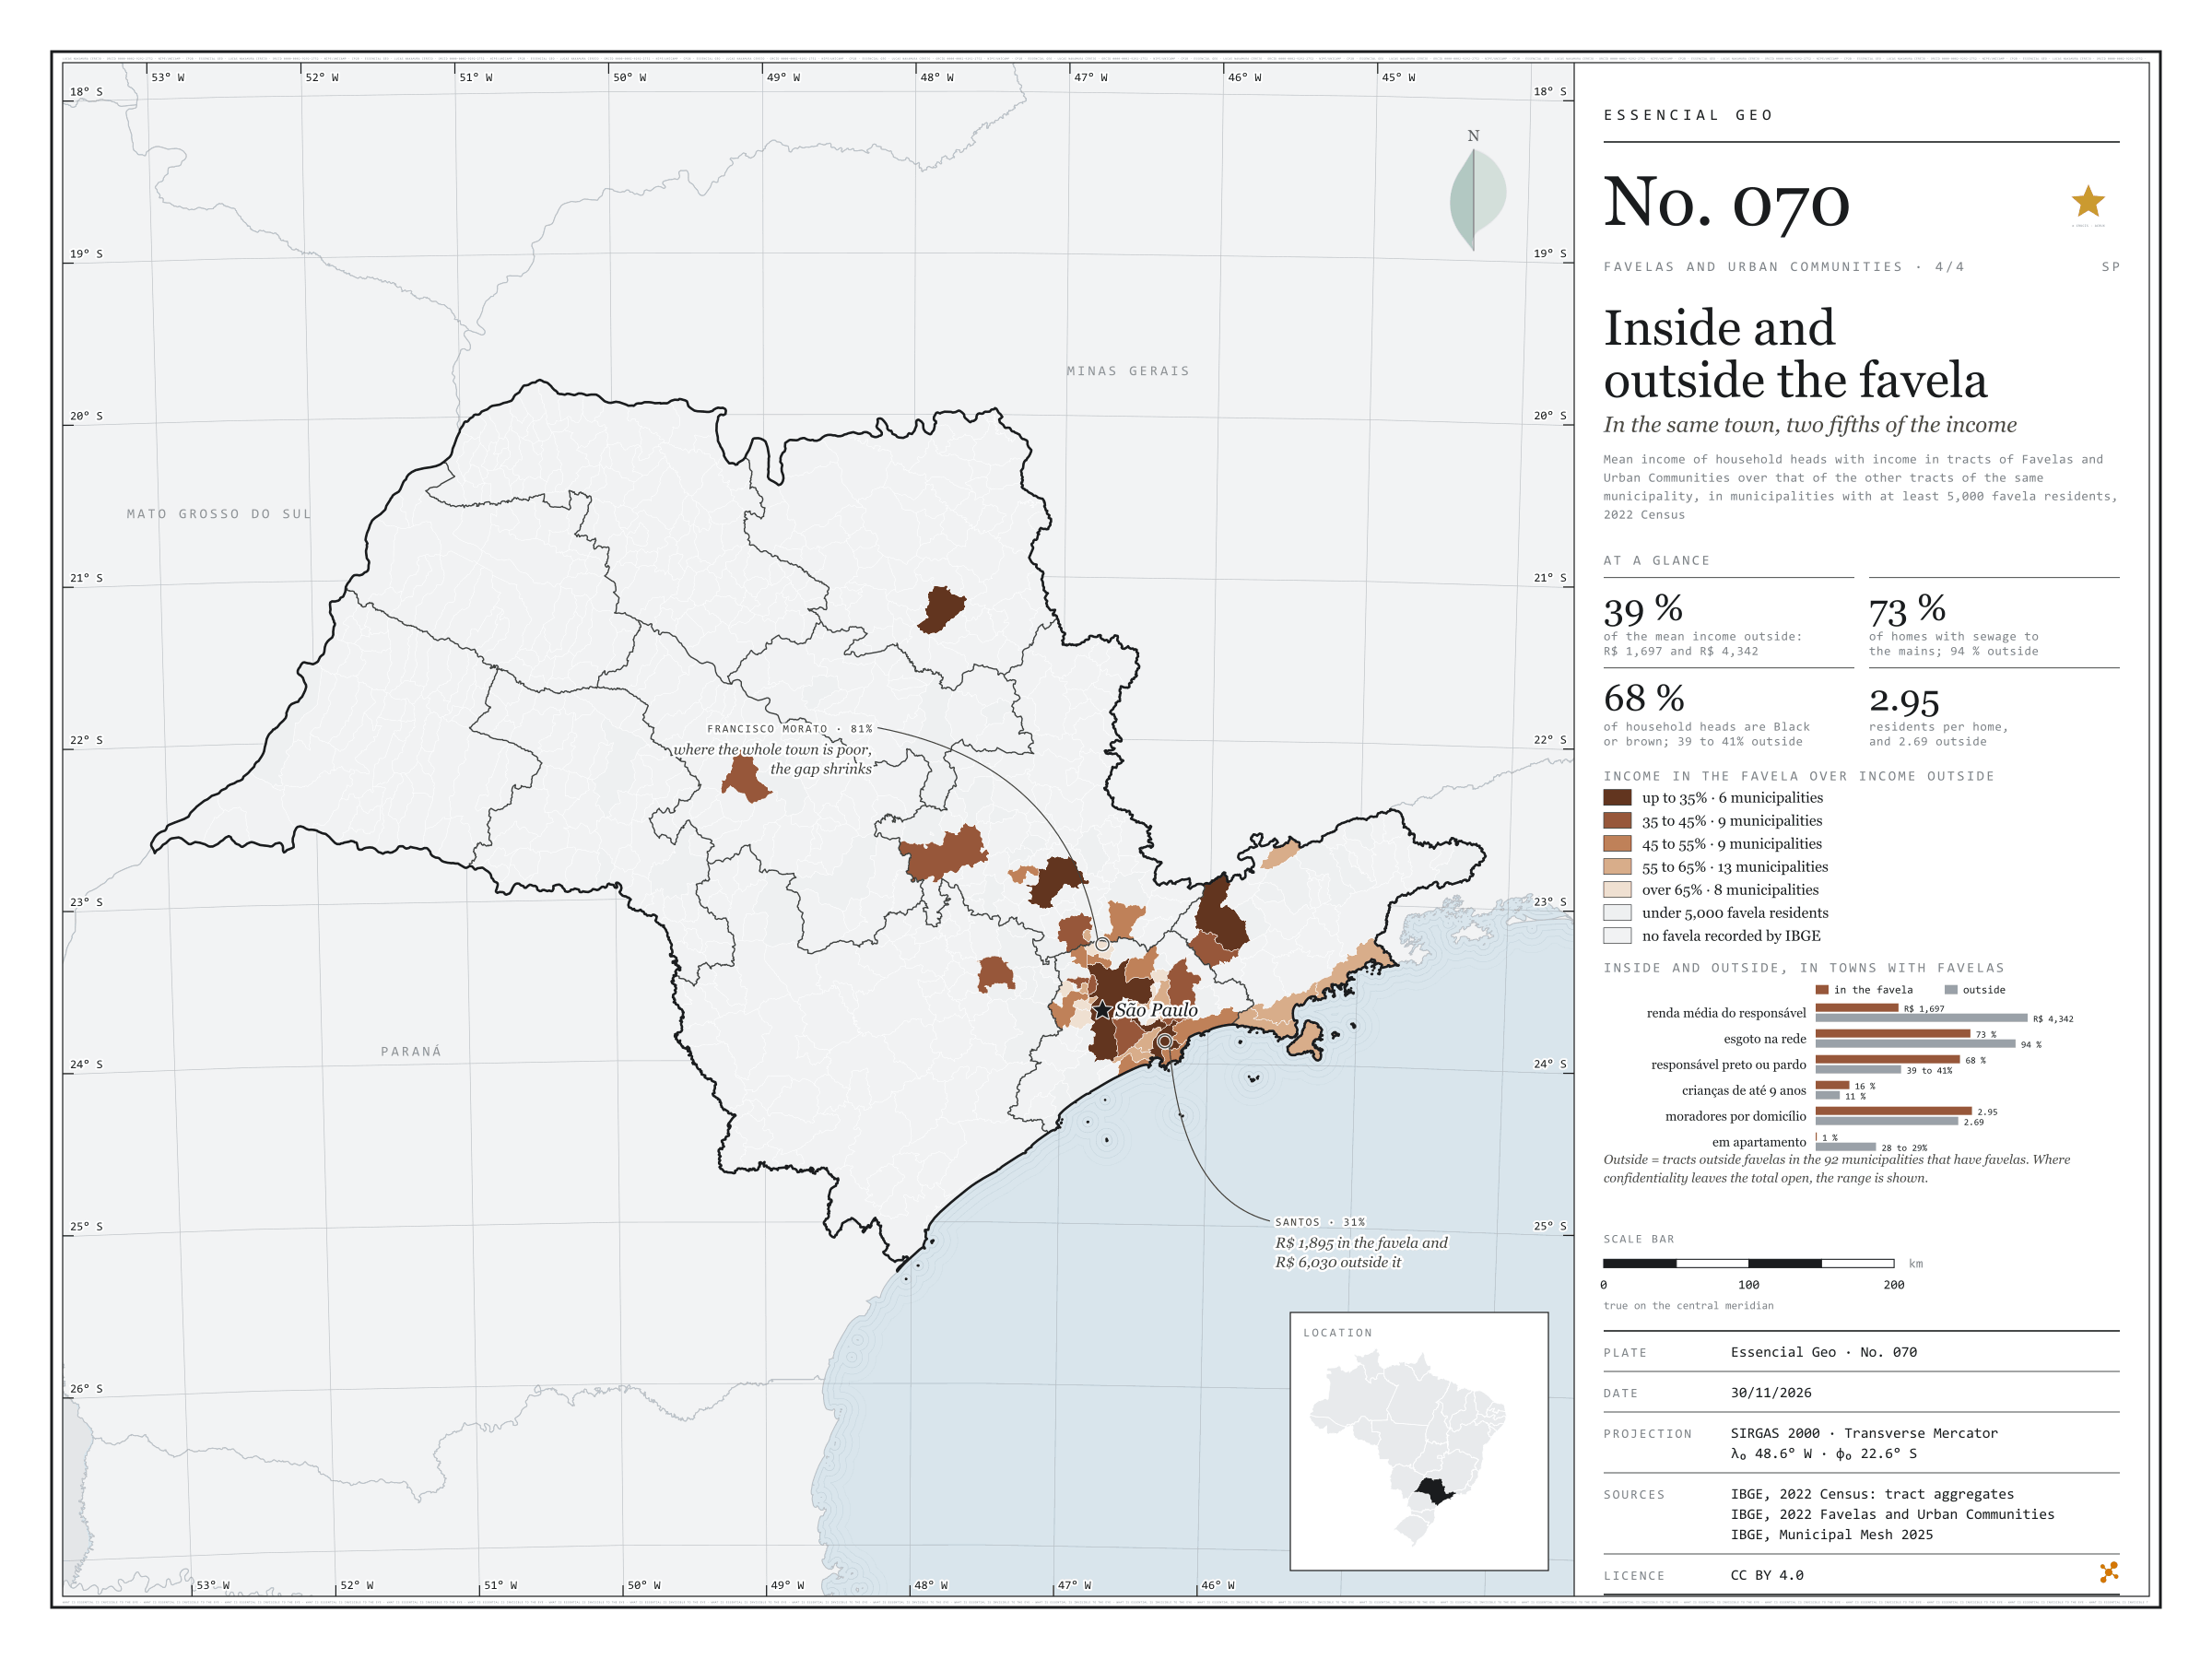
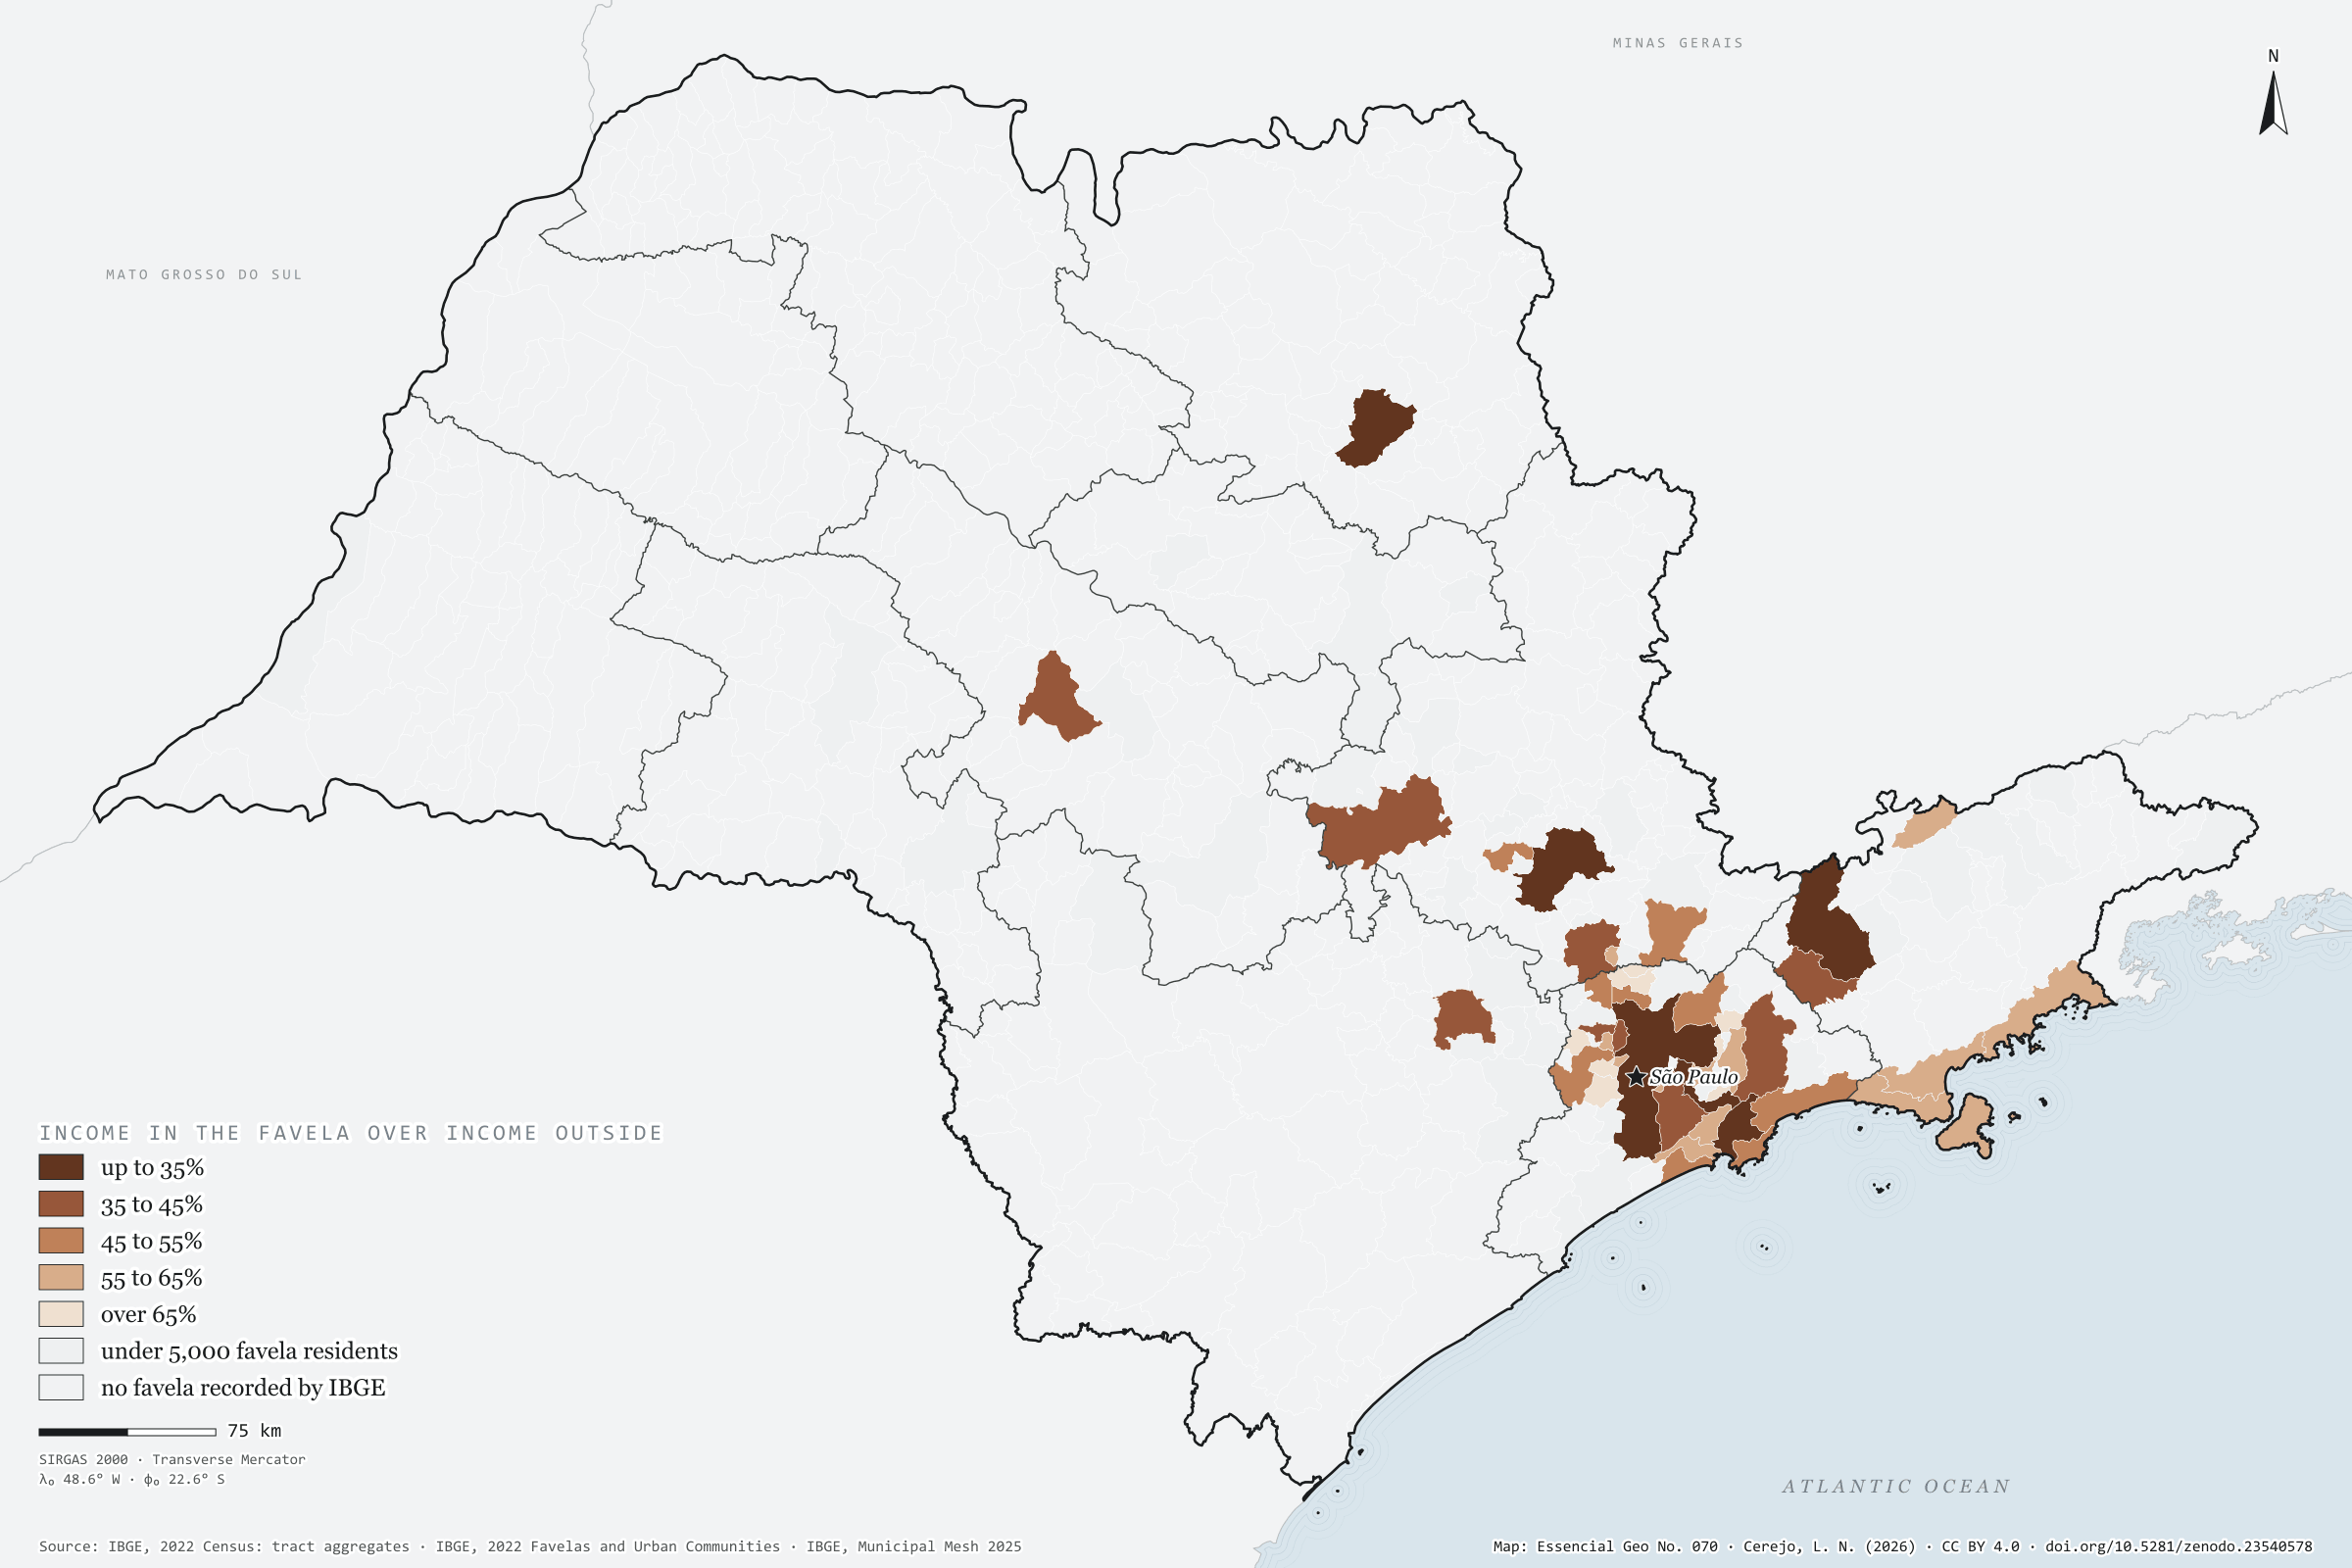
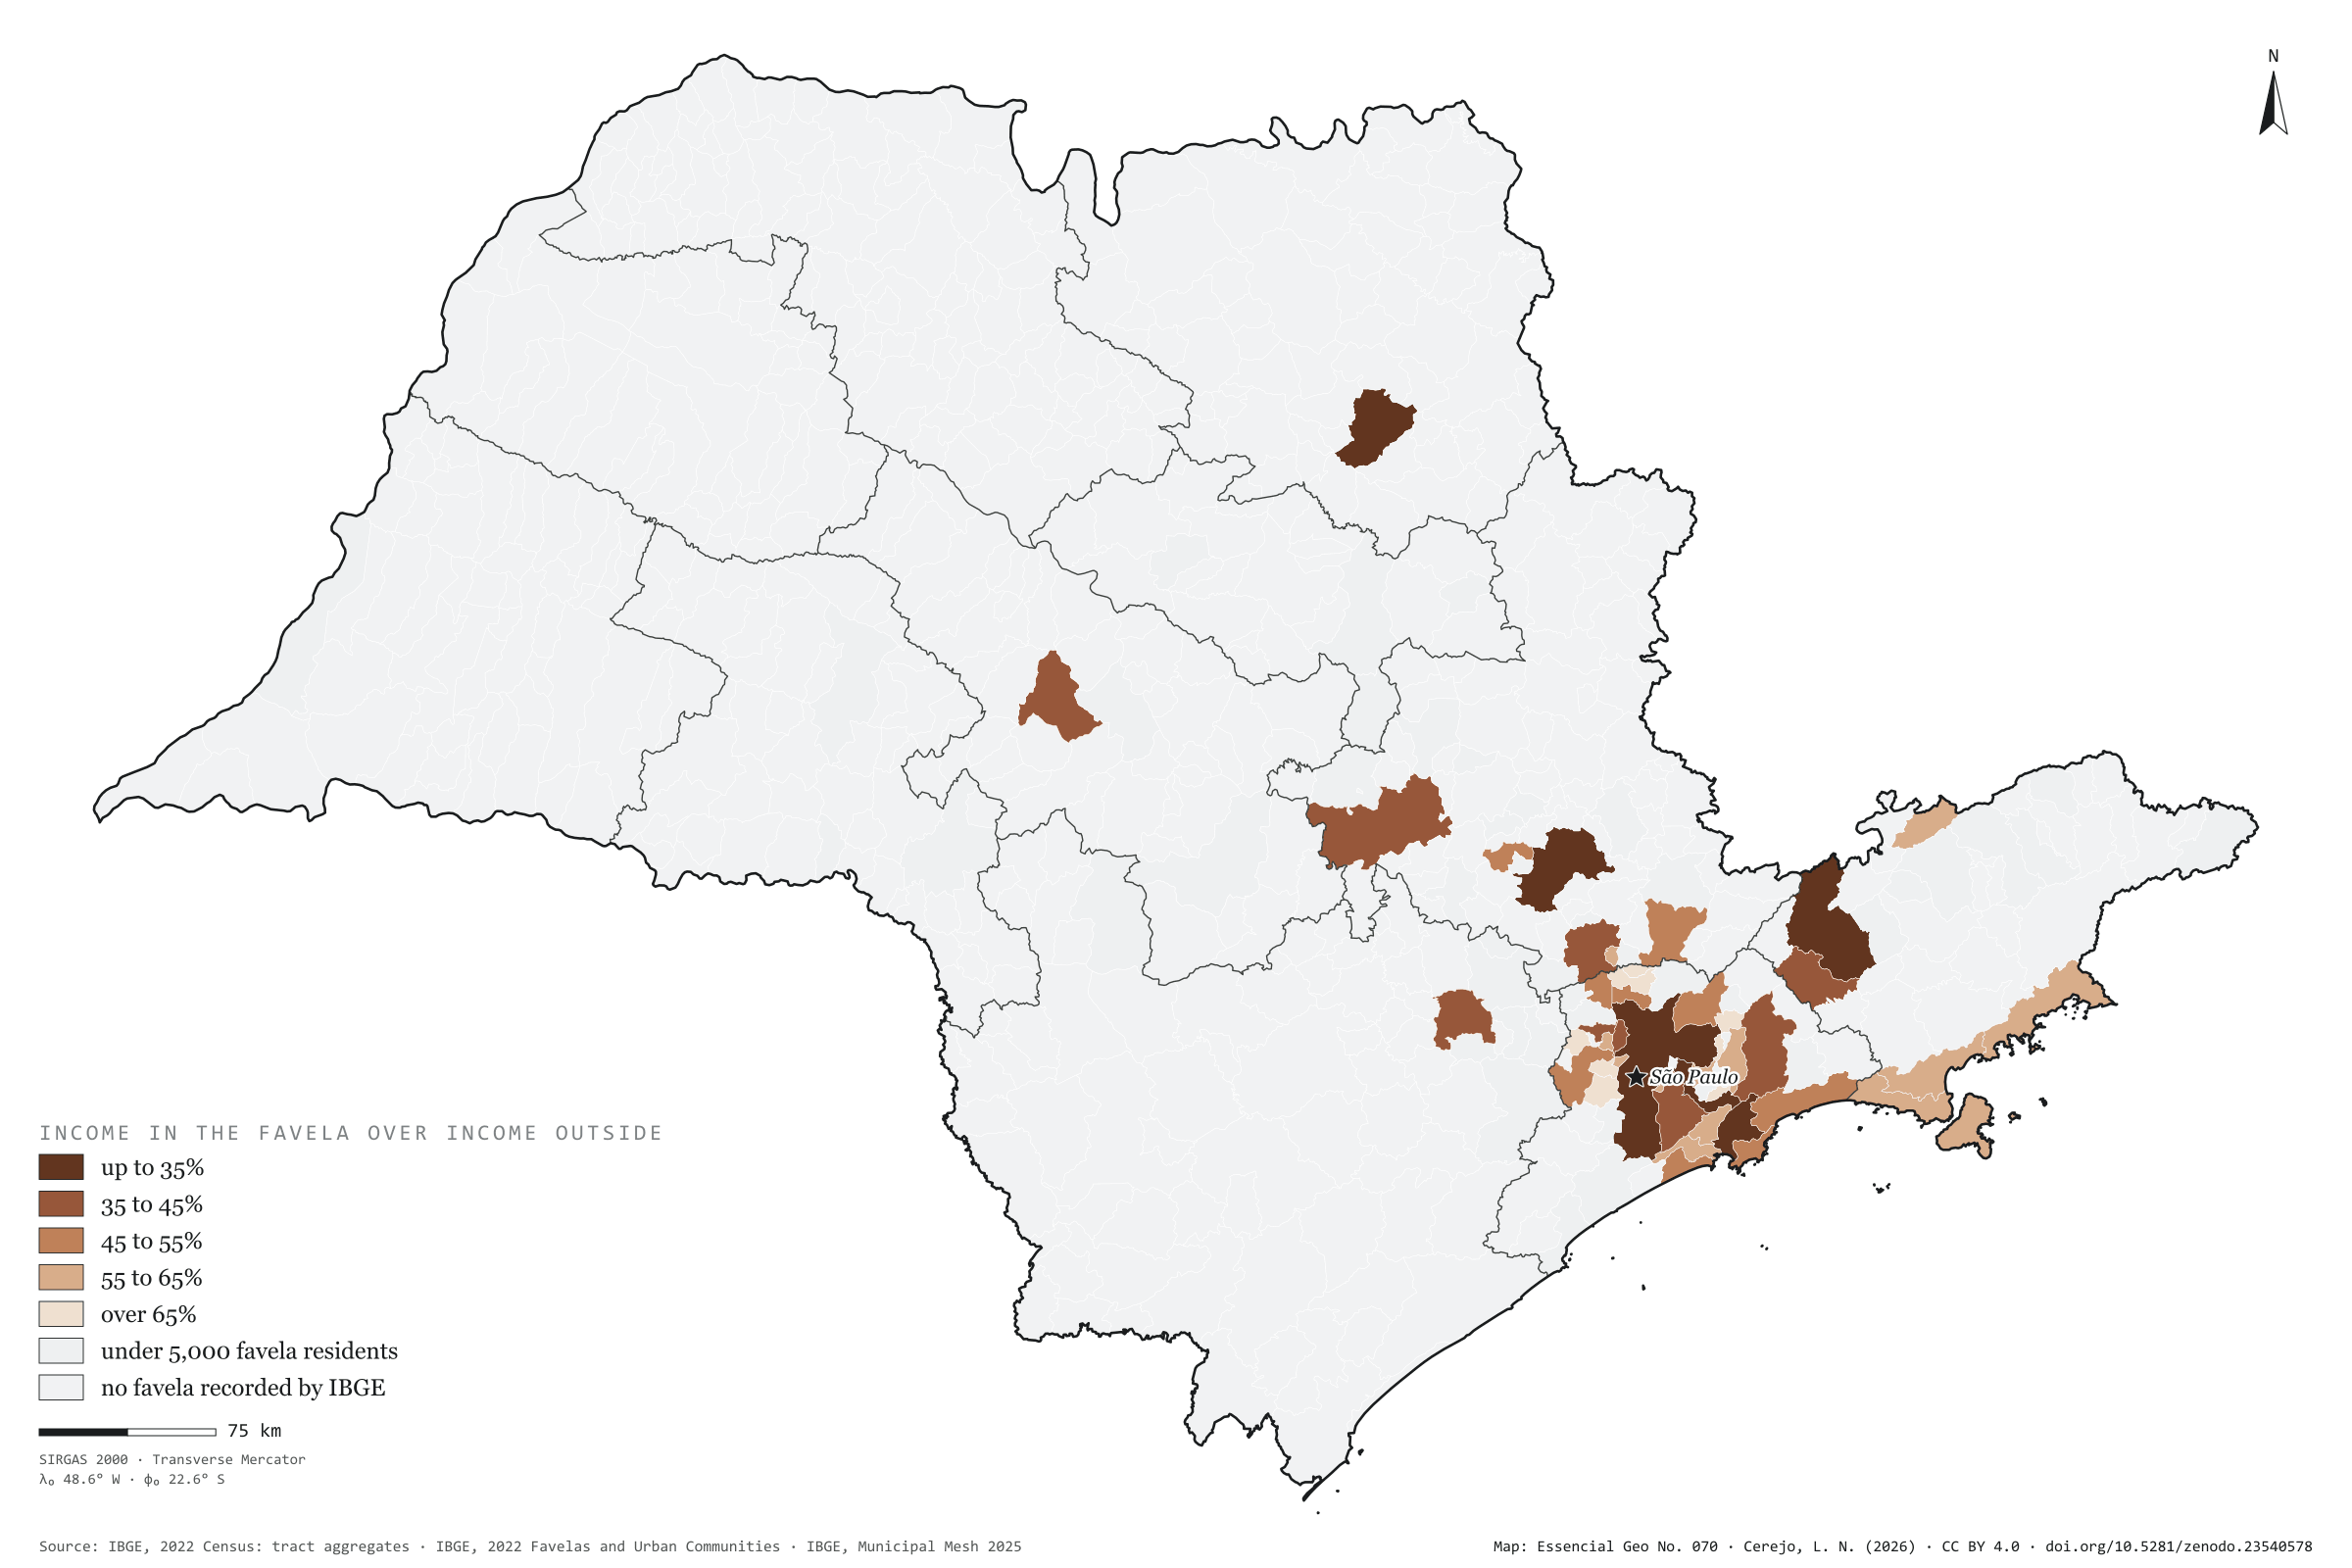
In the 92 São Paulo municipalities that have favelas, the mean income of the household head is R$ 1,697 in the favelas and R$ 4,342 in the rest of the same town: 2.6 times as much. Inside, 73% of homes have sewage to the mains, against 94% outside; 68% of household heads are Black or brown, against about 40%; 16% of residents are aged 9 or under, against 11%; and almost no one lives in a flat (0.5%, against 28%). The map compares income inside and outside in each of the 45 municipalities with at least 5,000 favela residents. The gap is widest in rich towns: in Santos and São Paulo, income in the favela is 31% of that outside; in Ribeirão Preto and São José dos Campos, 33%. It narrows where the whole town is poor, as in Francisco Morato, Itaquaquecetuba and Rio Grande da Serra, at 81%. Last plate of the collection “Favelas and urban communities”.
Technical record · downloads · citation
At a glance
Municipalities by income in the favela over income outside (municipalities)
up to 35%13.3%
35 to 45%20%
45 to 55%20%
55 to 65%28.9%
over 65%17.8%
Mean household-head income in the favela
1,697R$
R$ 4,342 outside, in the same municipalities
Favela homes with sewage to the mains
73%
94% outside
Layers
municipiospolygon645 municipalities: mean income inside and outside favelas and the ratio between them, plus people in favelas and surroundings
setores_fcupolygon8,008 tracts in Favelas and Urban Communities
regioes_intermediariaspolygon11 intermediate geographic regions
Mean income of household heads with income in tracts of Favelas and Urban Communities over that of the other tracts of the same municipality, from the 2022 Census tract aggregates, in municipalities with at least 5,000 favela residents, in five classes.
The map without a frame, with legend, scale, reference system and credit written on it: ready for papers, lectures and slides. In two versions: with the basemap (neighbours and sea) or only the mapped area, on white.
CEREJO, Lucas Nakamura. Dentro e fora da favela: na mesma cidade, dois quintos da renda. Versão 1.0.0. [S. l.]: Zenodo, 2026. Conjunto de dados. DOI: 10.5281/zenodo.23540578. Disponível em: https://doi.org/10.5281/zenodo.23540578. Acesso em: 10 nov. 2026.
Cerejo, L. N. (2026). Dentro e fora da favela: na mesma cidade, dois quintos da renda [Inside and outside the favela: In the same town, two fifths of the income] (Version 1.0.0) [Data set]. Zenodo. https://doi.org/10.5281/zenodo.23540578
@dataset{cerejo2026_dentro_e_fora_das_favelas_sp,
  author    = {Cerejo, Lucas Nakamura},
  title     = {Dentro e fora da favela: Na mesma cidade, dois quintos da renda},
  year      = {2026},
  publisher = {Zenodo},
  version   = {1.0.0},
  doi       = {10.5281/zenodo.23540578},
  url       = {https://doi.org/10.5281/zenodo.23540578},
  language  = {portuguese},
  note      = {English title: Inside and outside the favela: In the same town, two fifths of the income. Licence CC BY 4.0}
}