Skip to content
Essencial

No. 070 Census · income Favelas and urban communities 4/4

Inside and outside the favela

In the same town, two fifths of the income

Record, downloads and citation
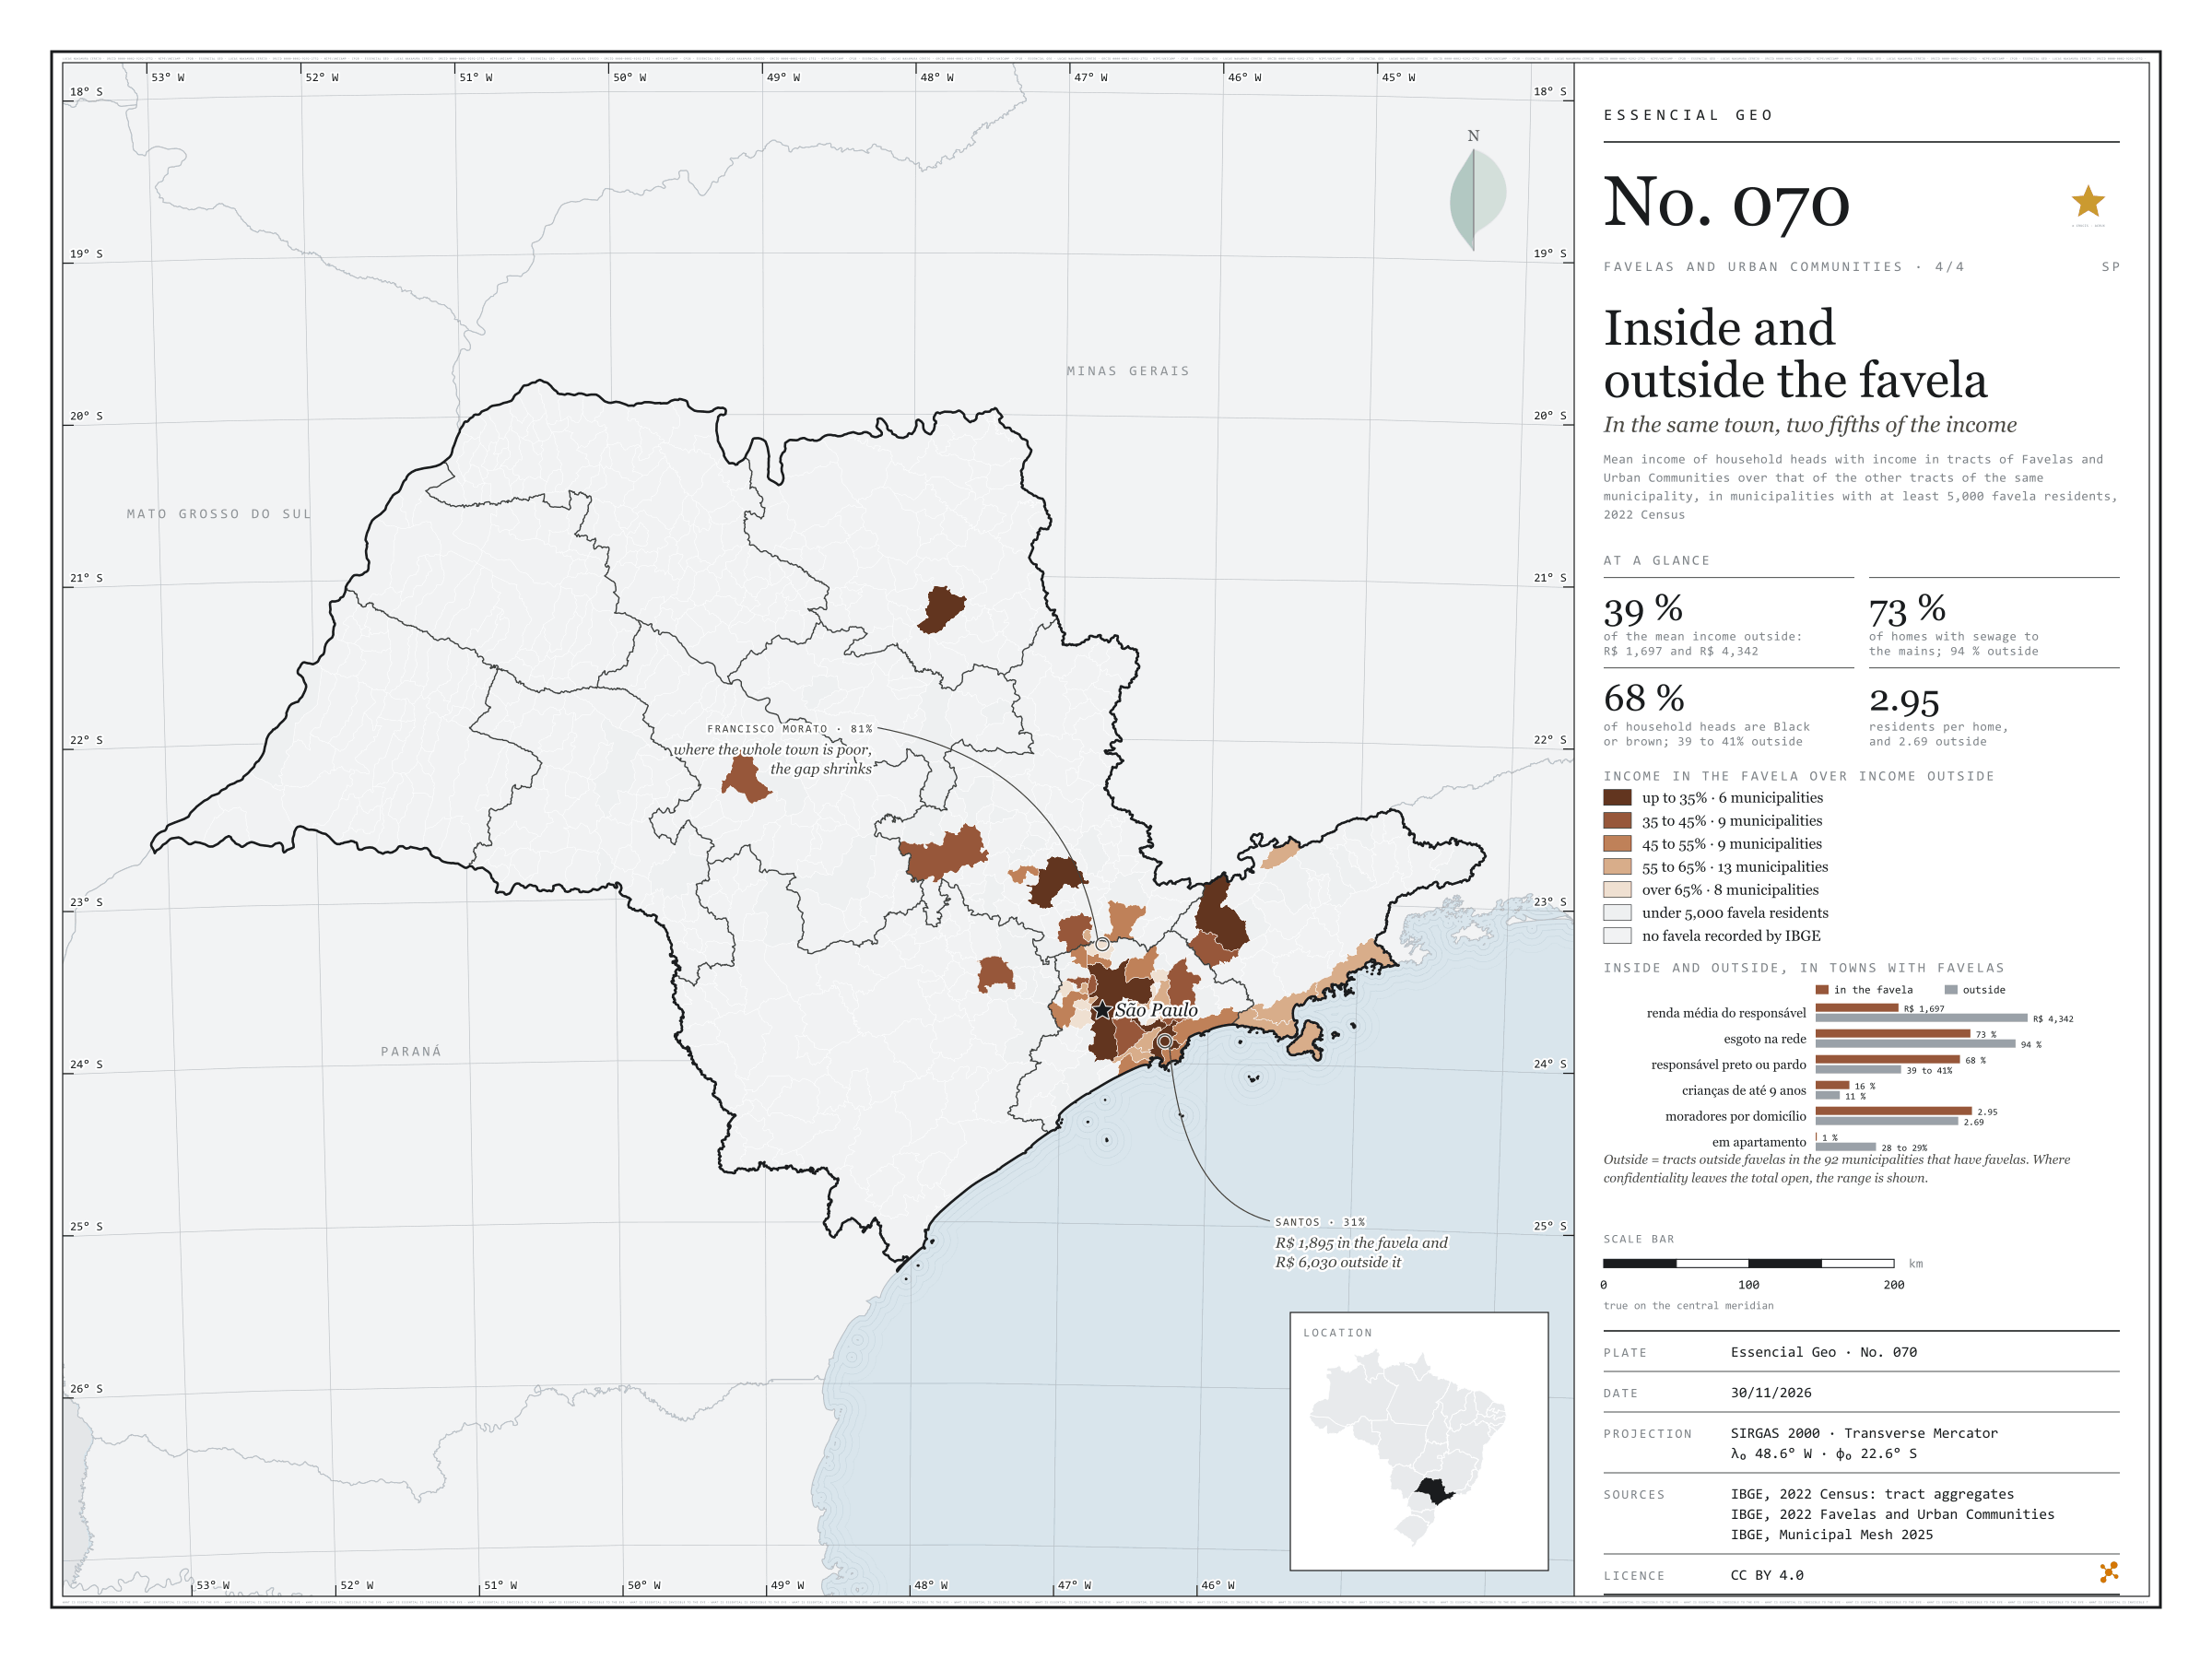
Fig. 070 São Paulo State (SP) EPSG:4674 Source: IBGE

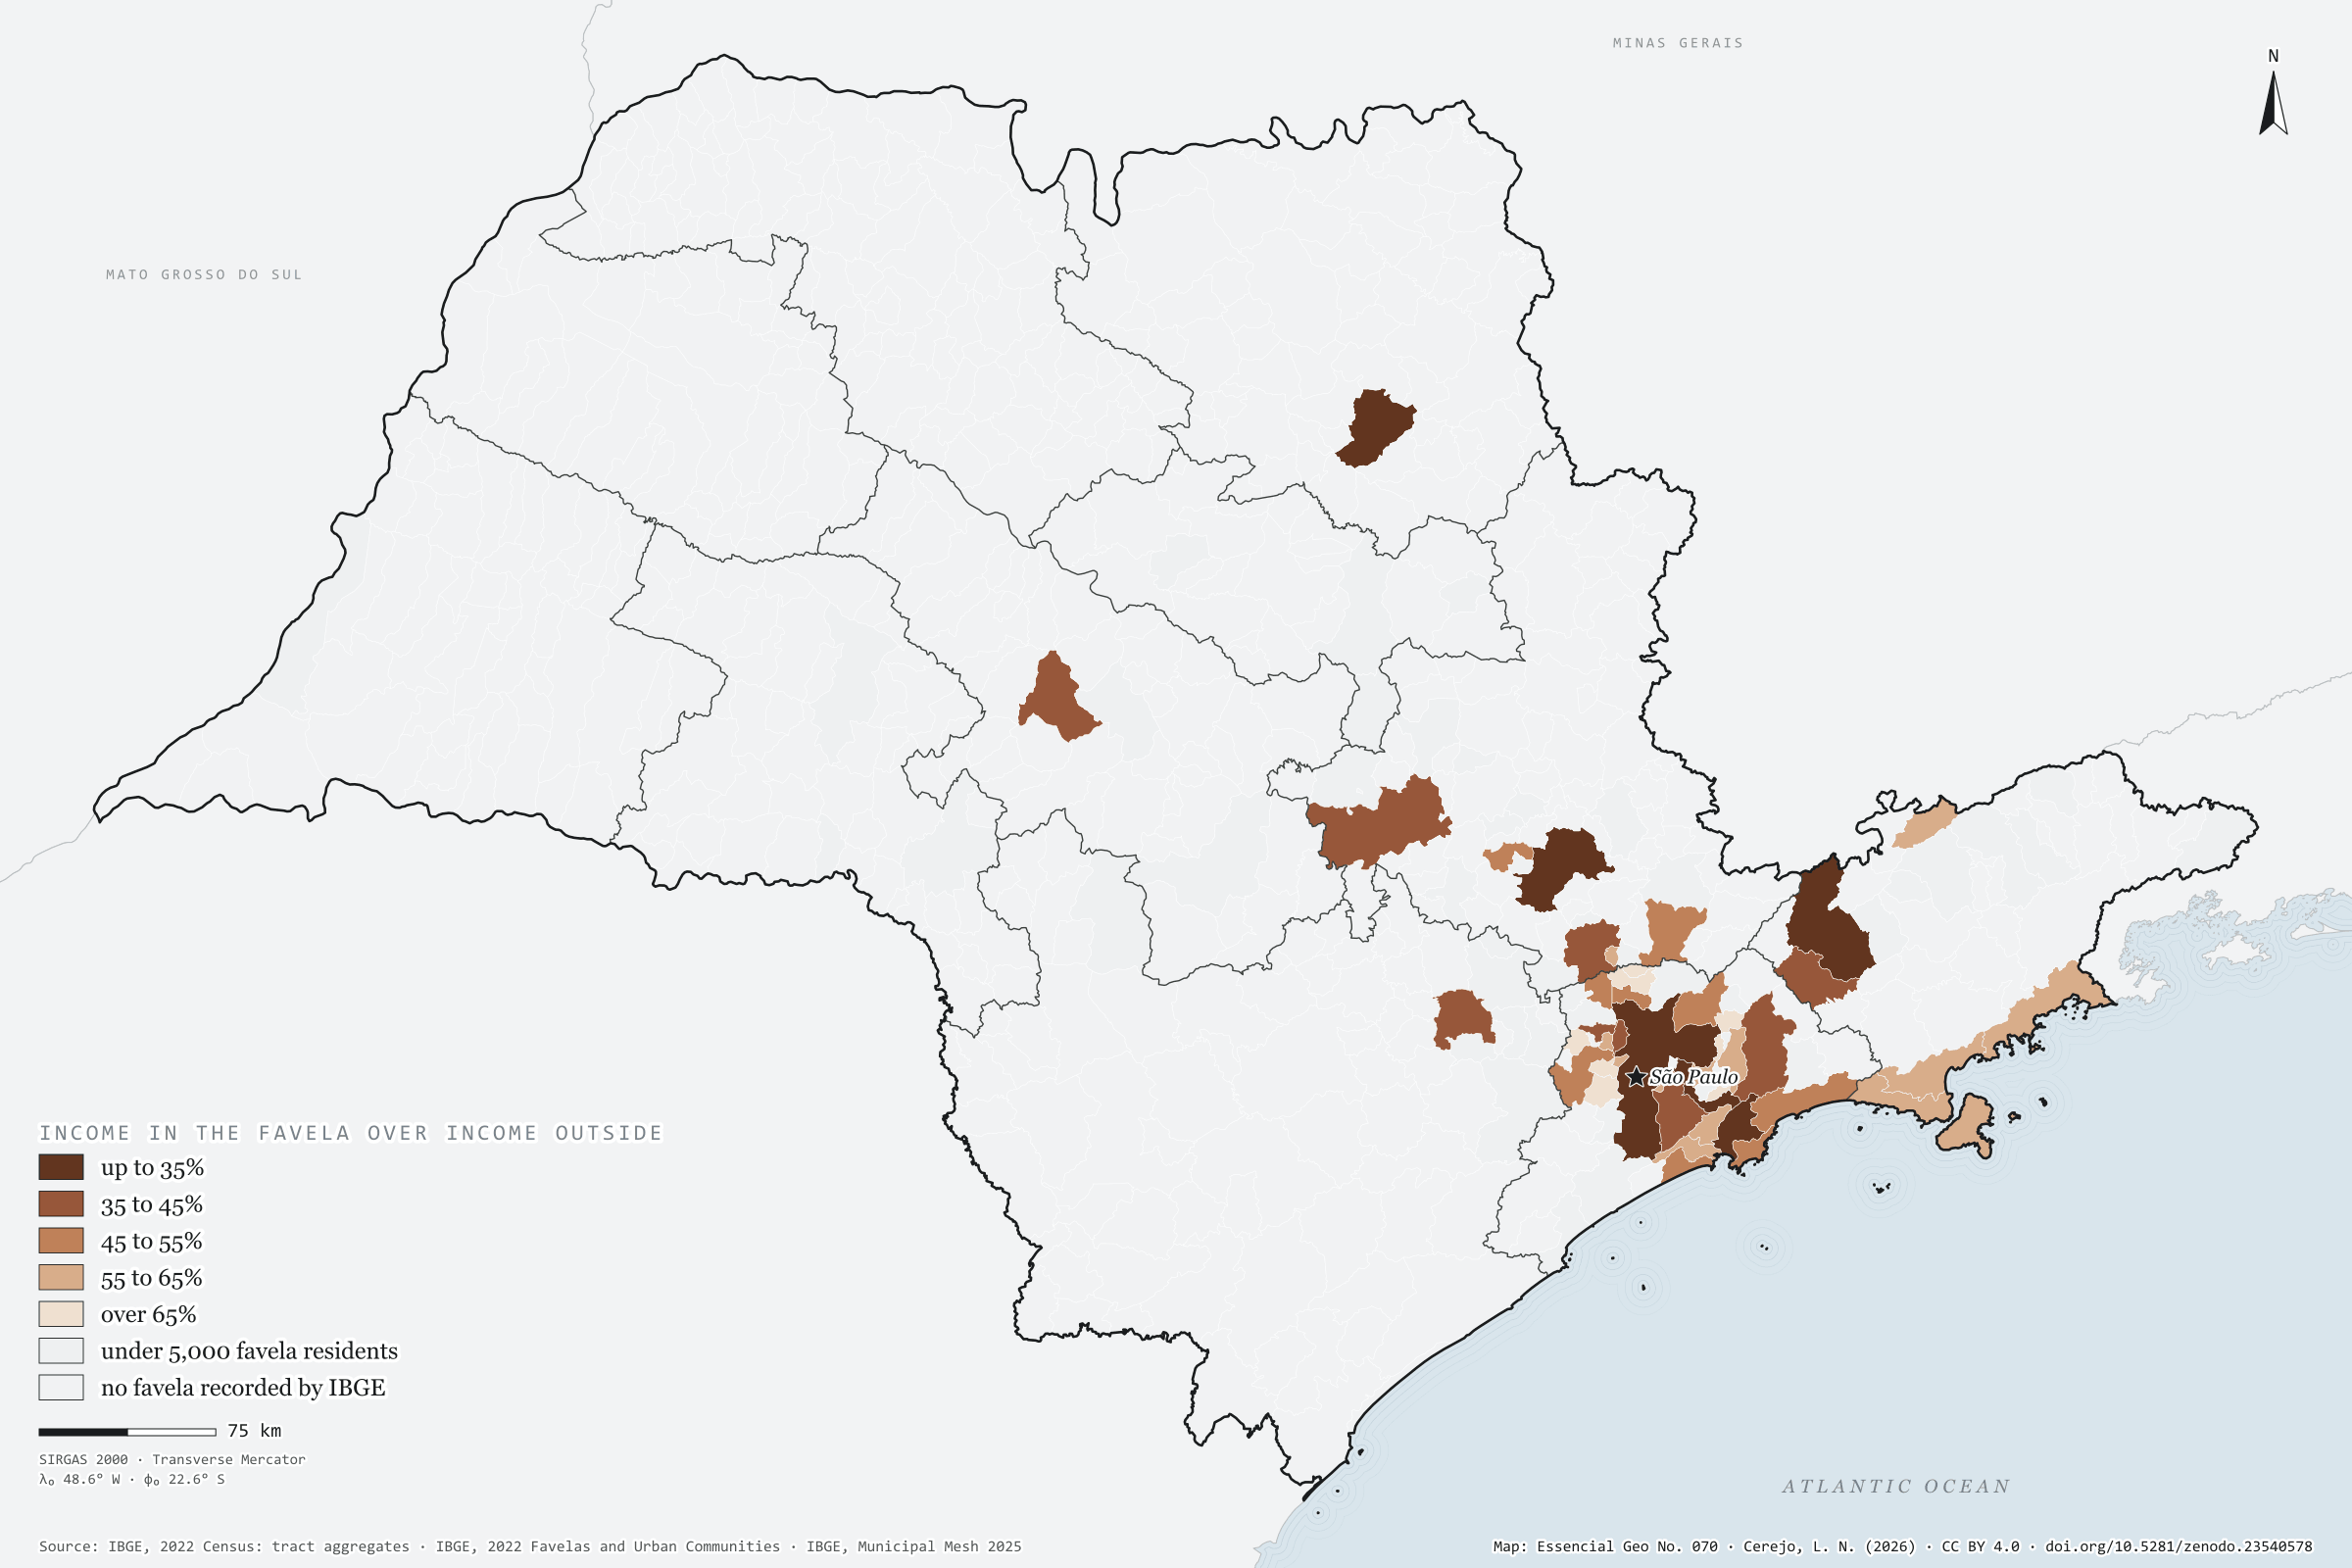
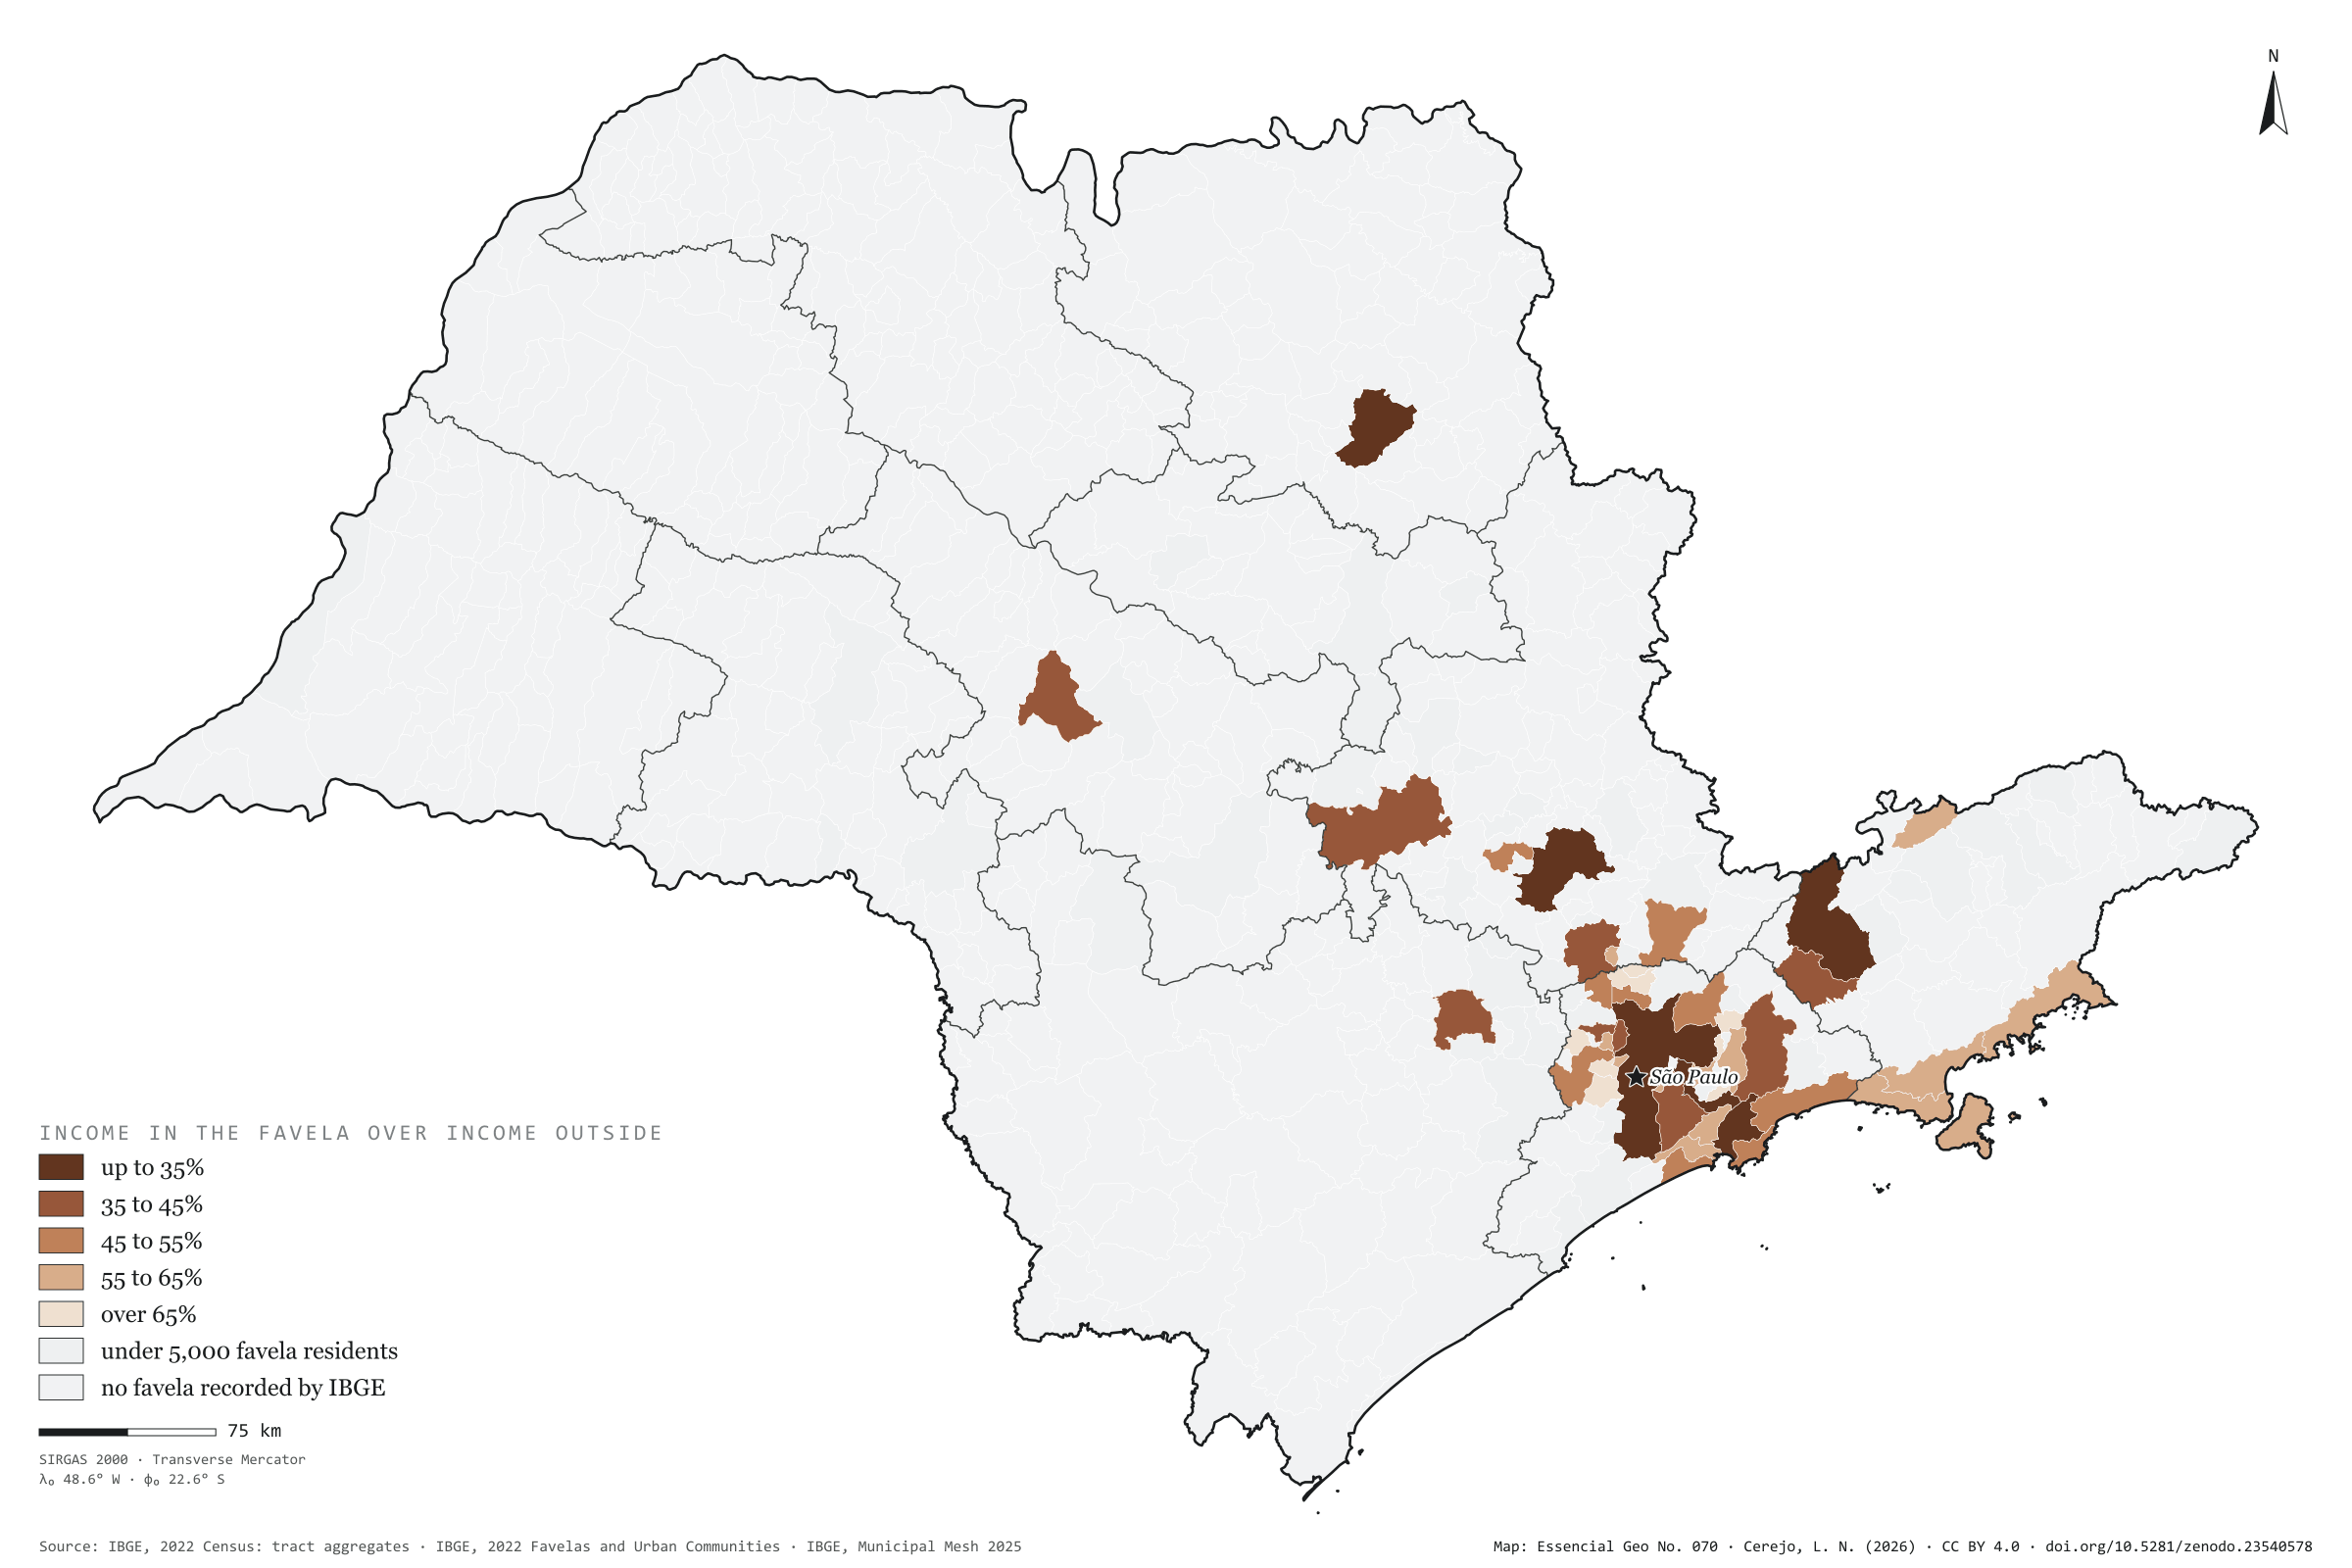
In the 92 São Paulo municipalities that have favelas, the mean income of the household head is R$ 1,697 in the favelas and R$ 4,342 in the rest of the same town: 2.6 times as much. Inside, 73% of homes have sewage to the mains, against 94% outside; 68% of household heads are Black or brown, against about 40%; 16% of residents are aged 9 or under, against 11%; and almost no one lives in a flat (0.5%, against 28%). The map compares income inside and outside in each of the 45 municipalities with at least 5,000 favela residents. The gap is widest in rich towns: in Santos and São Paulo, income in the favela is 31% of that outside; in Ribeirão Preto and São José dos Campos, 33%. It narrows where the whole town is poor, as in Francisco Morato, Itaquaquecetuba and Rio Grande da Serra, at 81%. Last plate of the collection “Favelas and urban communities”.

Technical record · downloads · citation

At a glance

Municipalities by income in the favela over income outside (municipalities)
  • up to 35% 13.3%
  • 35 to 45% 20%
  • 45 to 55% 20%
  • 55 to 65% 28.9%
  • over 65% 17.8%
Mean household-head income in the favela

1,697 R$

R$ 4,342 outside, in the same municipalities

Favela homes with sewage to the mains

73 %

94% outside

Layers

  • municipios polygon 645 municipalities: mean income inside and outside favelas and the ratio between them, plus people in favelas and surroundings
  • setores_fcu polygon 8,008 tracts in Favelas and Urban Communities
  • regioes_intermediarias polygon 11 intermediate geographic regions
  • limite_estadual polygon State boundary

Metadata

Extent
São Paulo State (SP)
CRS / Projection
SIRGAS 2000 (EPSG:4674)
EPSG:4674
Software
Node.js · d3-geo · QGIS
Method
Mean income of household heads with income in tracts of Favelas and Urban Communities over that of the other tracts of the same municipality, from the 2022 Census tract aggregates, in municipalities with at least 5,000 favela residents, in five classes.
Version
v1.0.0
Licence
CC BY 4.0

Downloads

Figure to reuse

The map without a frame, with legend, scale, reference system and credit written on it: ready for papers, lectures and slides. In two versions: with the basemap (neighbours and sea) or only the mapped area, on white.

Point a camera at it to open this page.

How to cite

Cerejo, L. N. (2026). Dentro e fora da favela: na mesma cidade, dois quintos da renda [Inside and outside the favela: In the same town, two fifths of the income] (Version 1.0.0) [Data set]. Zenodo. https://doi.org/10.5281/zenodo.23540578

How to read this plate area, projection, scale, legend and source · 3 terms
1 Area
São Paulo State (SP) The area the plate covers. Outside it, neighbours and sea are drawn in grey, just for orientation.
2 Coordinates and projection
SIRGAS 2000 (EPSG:4674) The layers are in SIRGAS 2000; the drawing’s projection is written in the colophon at the foot of the panel.
3 Scale
Graphic scale bar in the panel The scale bar is true on the central meridian; away from it, measured distances vary a little.
4 Legend and layers
4 layers in the GeoPackage · polygon Read the legend before the map: it tells you whether a colour is a rate or a class, and whether a circle is a total.
5 Sources
IBGE (2022); IBGE (2025) Every figure comes from a public source, with its year. The data sheet gives each one’s address.

Terms on this plate

Census tract
The smallest collection area of the IBGE Census, a few hundred households each. It is the finest grain at which income, sanitation and housing can be seen without identifying anyone.
Favelas and urban communities
The name IBGE adopted in 2024 in place of “subnormal agglomerations”: low-income housing areas with insecure tenure and incomplete public services.
2022 Census
IBGE’s door-to-door count. Results by census tract give residents, age, household-head income, water, sewerage and rubbish.

Download

Layers, table and figures, under CC BY 4.0. Cite with the DOI.

Full record and citation

Method notes · No. 070

Income, sanitation and housing inside and outside São Paulo’s favelas

Português · English

Plate No. 070, the last of four in the collection Favelas and urban communities. The favela street is on plate 069.

What the files contain

Layer (GPKG)GeometryContent
municipiospolygon645 municipalities: renda_media_dentro, renda_media_fora (R$ per month), razao_renda, plus pessoas_fcu, pct_fcu and the surroundings
setores_fcupolygon8,008 tracts in favelas
regioes_intermediarias, limite_estadualpolygonreference

It is the GPKG of plate 067. The CSV has the municipal table, without geometry.

Method

  1. 2022 Census tract aggregates, split by the Favela or Urban Community code: inside = tracts in favelas; outside = the other tracts of the 92 municipalities that have favelas.
  2. Mean income = sum, over tracts, of the mean monthly nominal income of household heads with income times their number, over all household heads with income. Tracts without the figure are left out (19 inside and 792 outside).
  3. Sewage to the mains = public or storm sewer, or a septic tank connected to it; water = mains as the main source; colour or race = the household head’s; children = residents aged 9 or under; flat = type of dwelling.
  4. Where statistical confidentiality hides a cell (X), it is worth 1 or 2; the sum becomes a range, and the panel shows the range when both ends give different percentages.
  5. Map: ratio of income inside to income outside in the 45 municipalities with at least 5,000 favela residents, in five classes: up to 35%, 35 to 45%, 45 to 55%, 55 to 65% and over 65%.

Limitations

  • It is the household head’s income, not income per head; and outside includes other poor neighbourhoods that IBGE did not class as favelas.
  • The comparison is between sets of tracts, not people: it does not say what a favela family earns, only the mean of the tracts.
  • The outside of each municipality varies greatly in size: in Guarujá the favela is over a third of the town; in Campinas, an eighth.

View this map’s folder on GitHub

Technical record

Technical record · No. 070

Inside and outside the favela

At a glance

Municipalities by income in the favela over income outside (municipalities)
  • up to 35% 13.3%
  • 35 to 45% 20%
  • 45 to 55% 20%
  • 55 to 65% 28.9%
  • over 65% 17.8%
Mean household-head income in the favela

1,697 R$

R$ 4,342 outside, in the same municipalities

Favela homes with sewage to the mains

73 %

94% outside

Layers

  • municipios polygon 645 municipalities: mean income inside and outside favelas and the ratio between them, plus people in favelas and surroundings
  • setores_fcu polygon 8,008 tracts in Favelas and Urban Communities
  • regioes_intermediarias polygon 11 intermediate geographic regions
  • limite_estadual polygon State boundary

Metadata

Extent
São Paulo State (SP)
CRS / Projection
SIRGAS 2000 (EPSG:4674)
EPSG:4674
Software
Node.js · d3-geo · QGIS
Method
Mean income of household heads with income in tracts of Favelas and Urban Communities over that of the other tracts of the same municipality, from the 2022 Census tract aggregates, in municipalities with at least 5,000 favela residents, in five classes.
Version
v1.0.0
Licence
CC BY 4.0

Downloads

Figure to reuse

The map without a frame, with legend, scale, reference system and credit written on it: ready for papers, lectures and slides. In two versions: with the basemap (neighbours and sea) or only the mapped area, on white.

Point a camera at it to open this page.

How to cite

Cerejo, L. N. (2026). Dentro e fora da favela: na mesma cidade, dois quintos da renda [Inside and outside the favela: In the same town, two fifths of the income] (Version 1.0.0) [Data set]. Zenodo. https://doi.org/10.5281/zenodo.23540578

100%