Fig. 045São Paulo state (SP)EPSG:4674Source: MapBiomas, IBGE
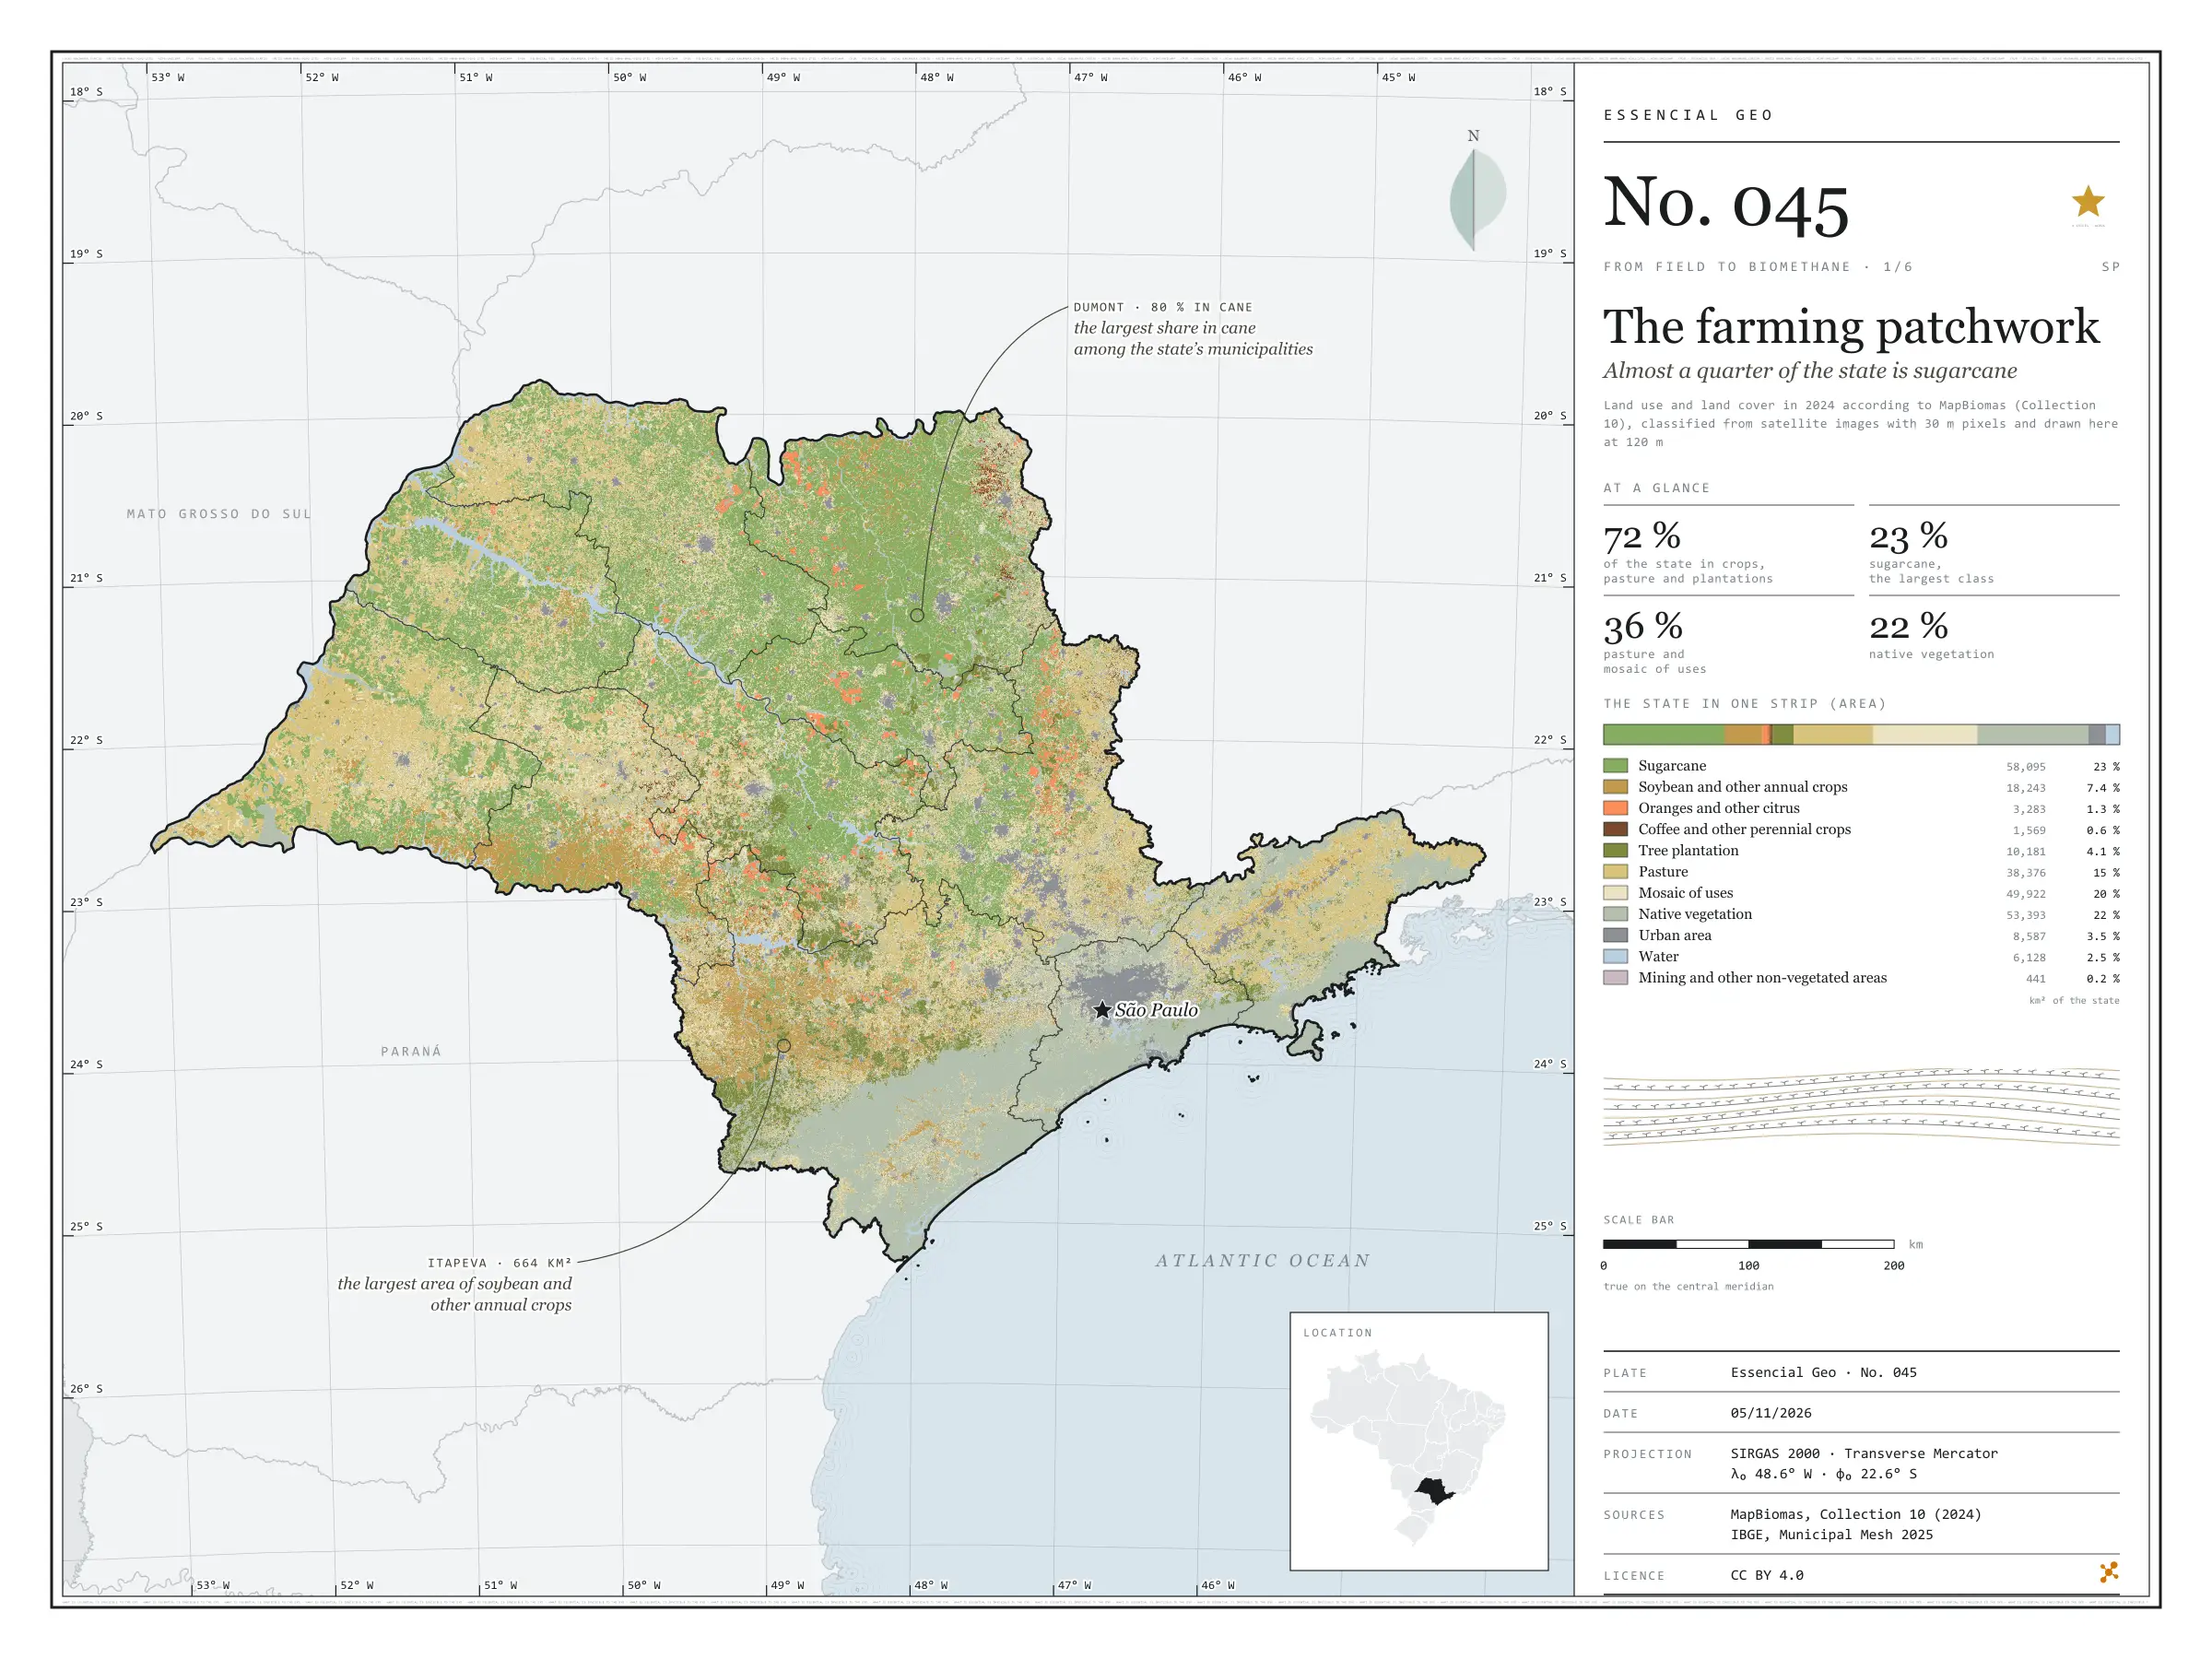
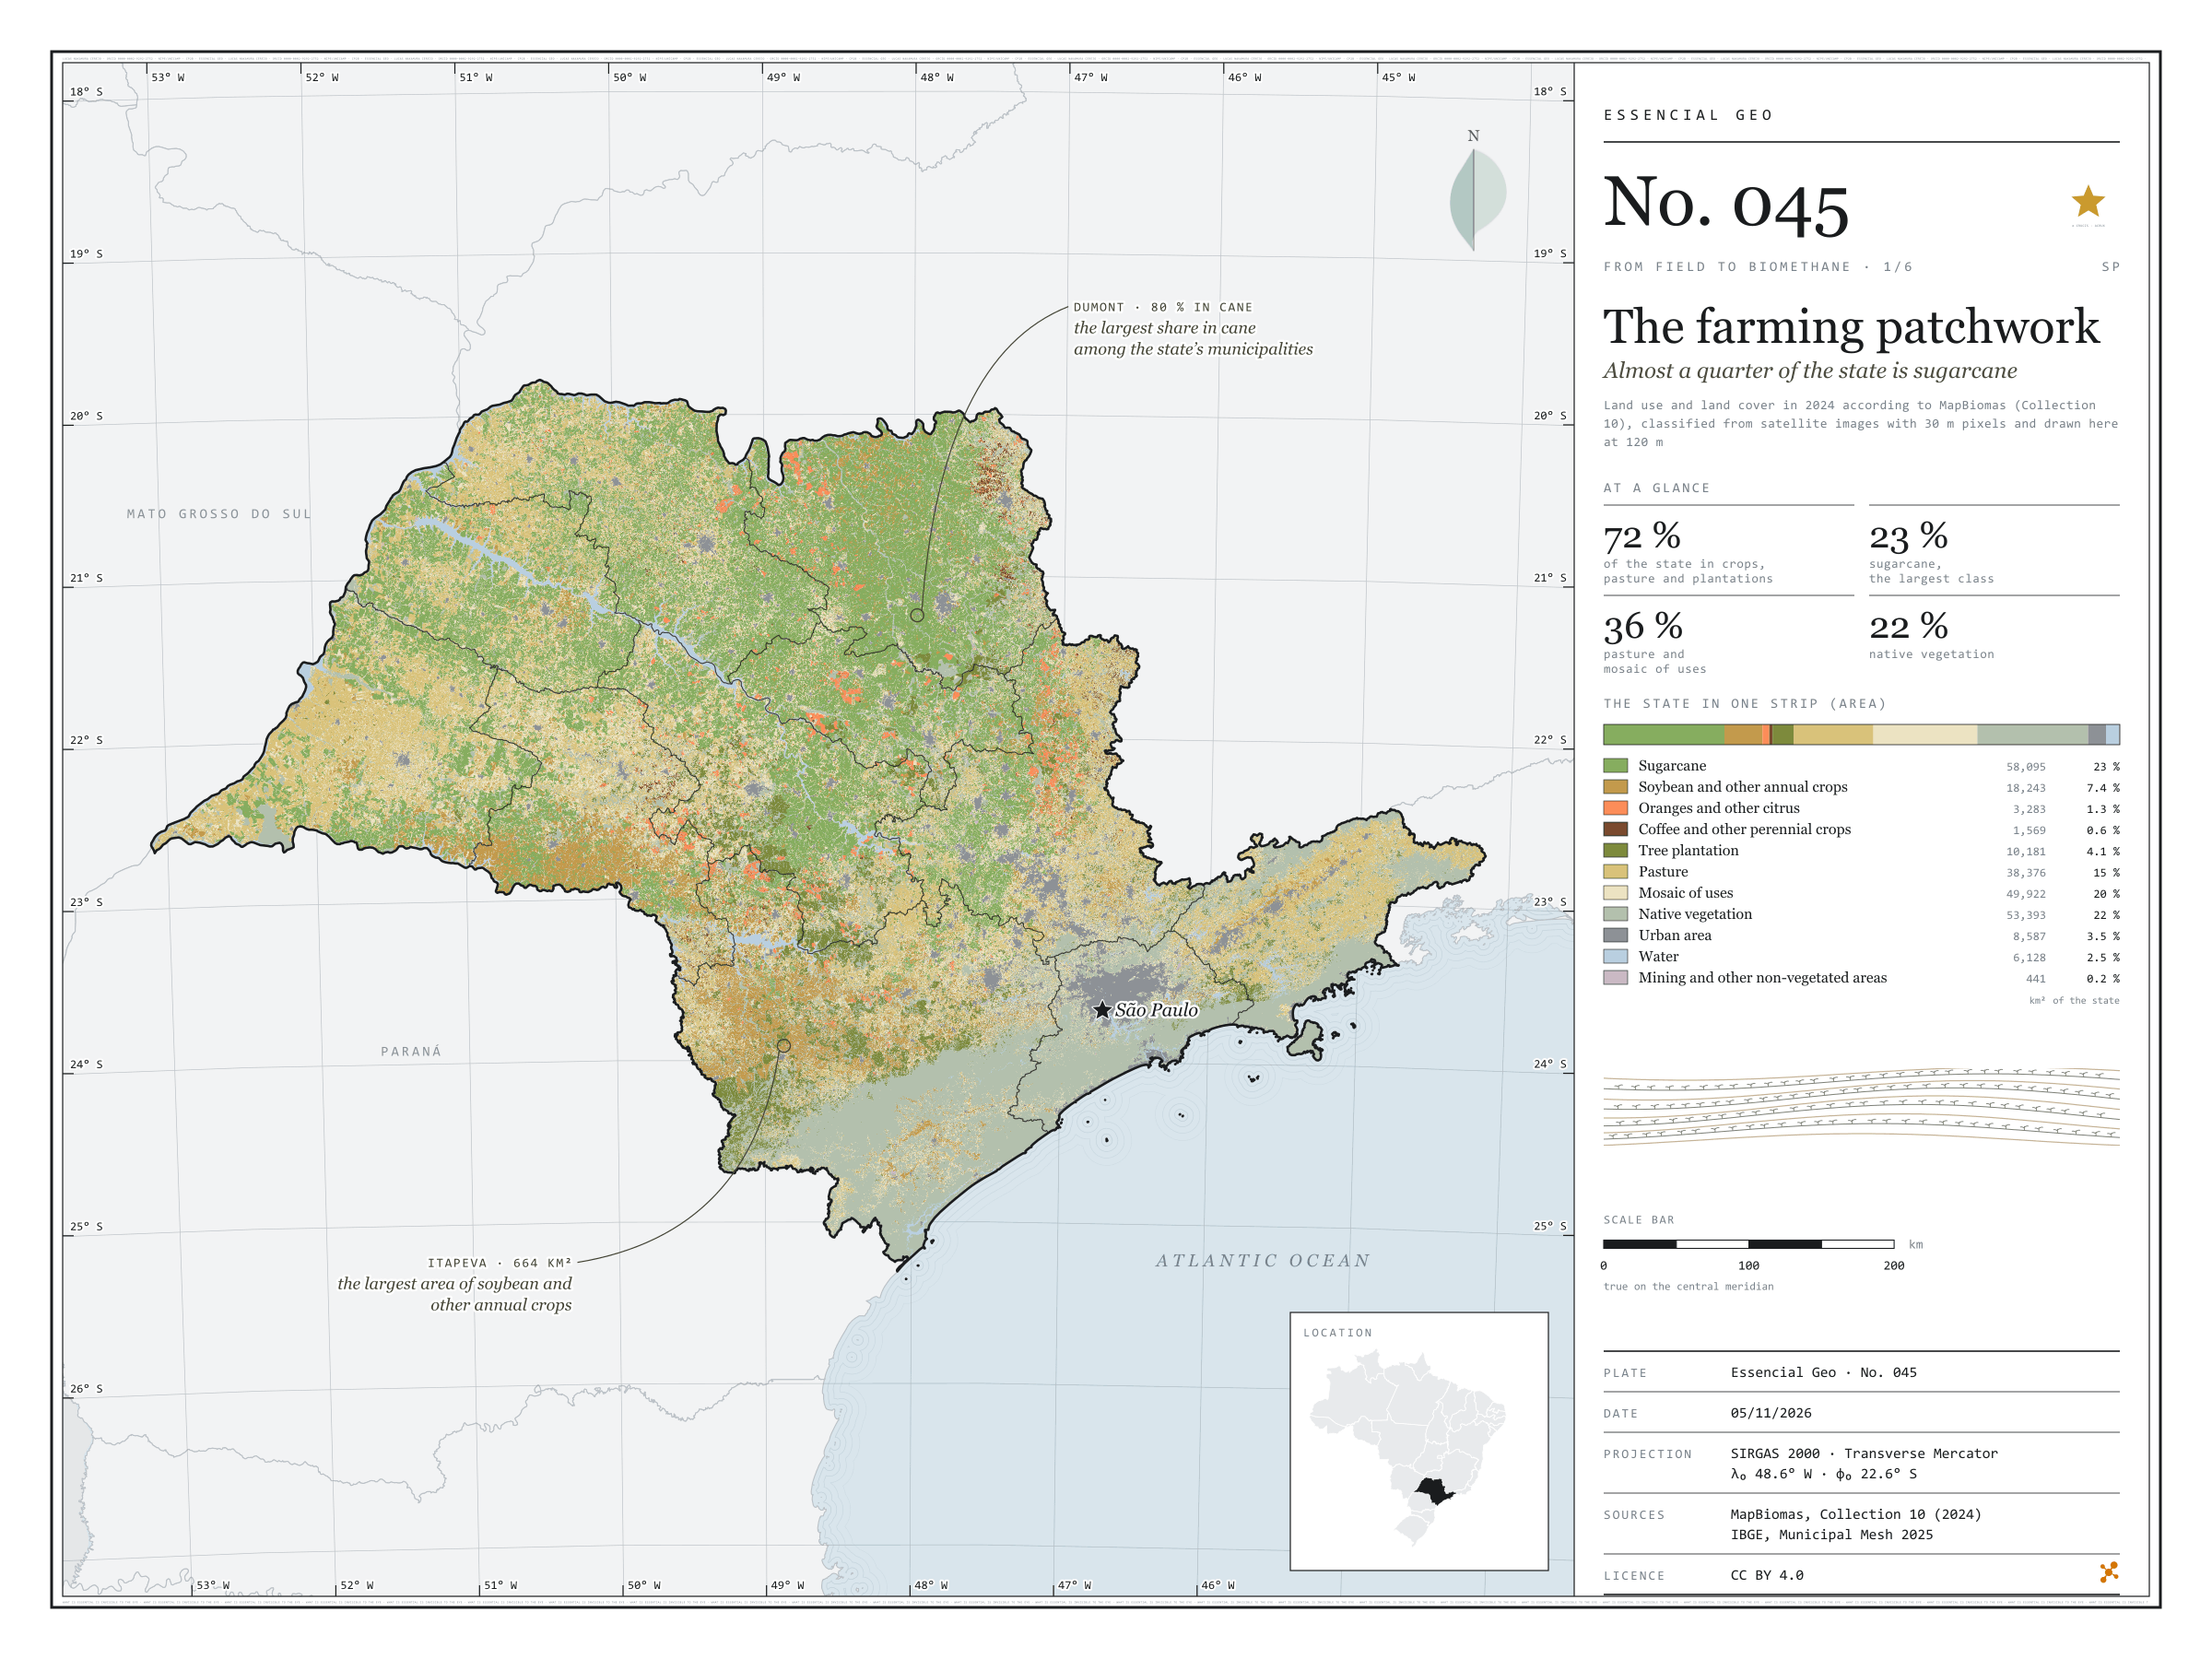
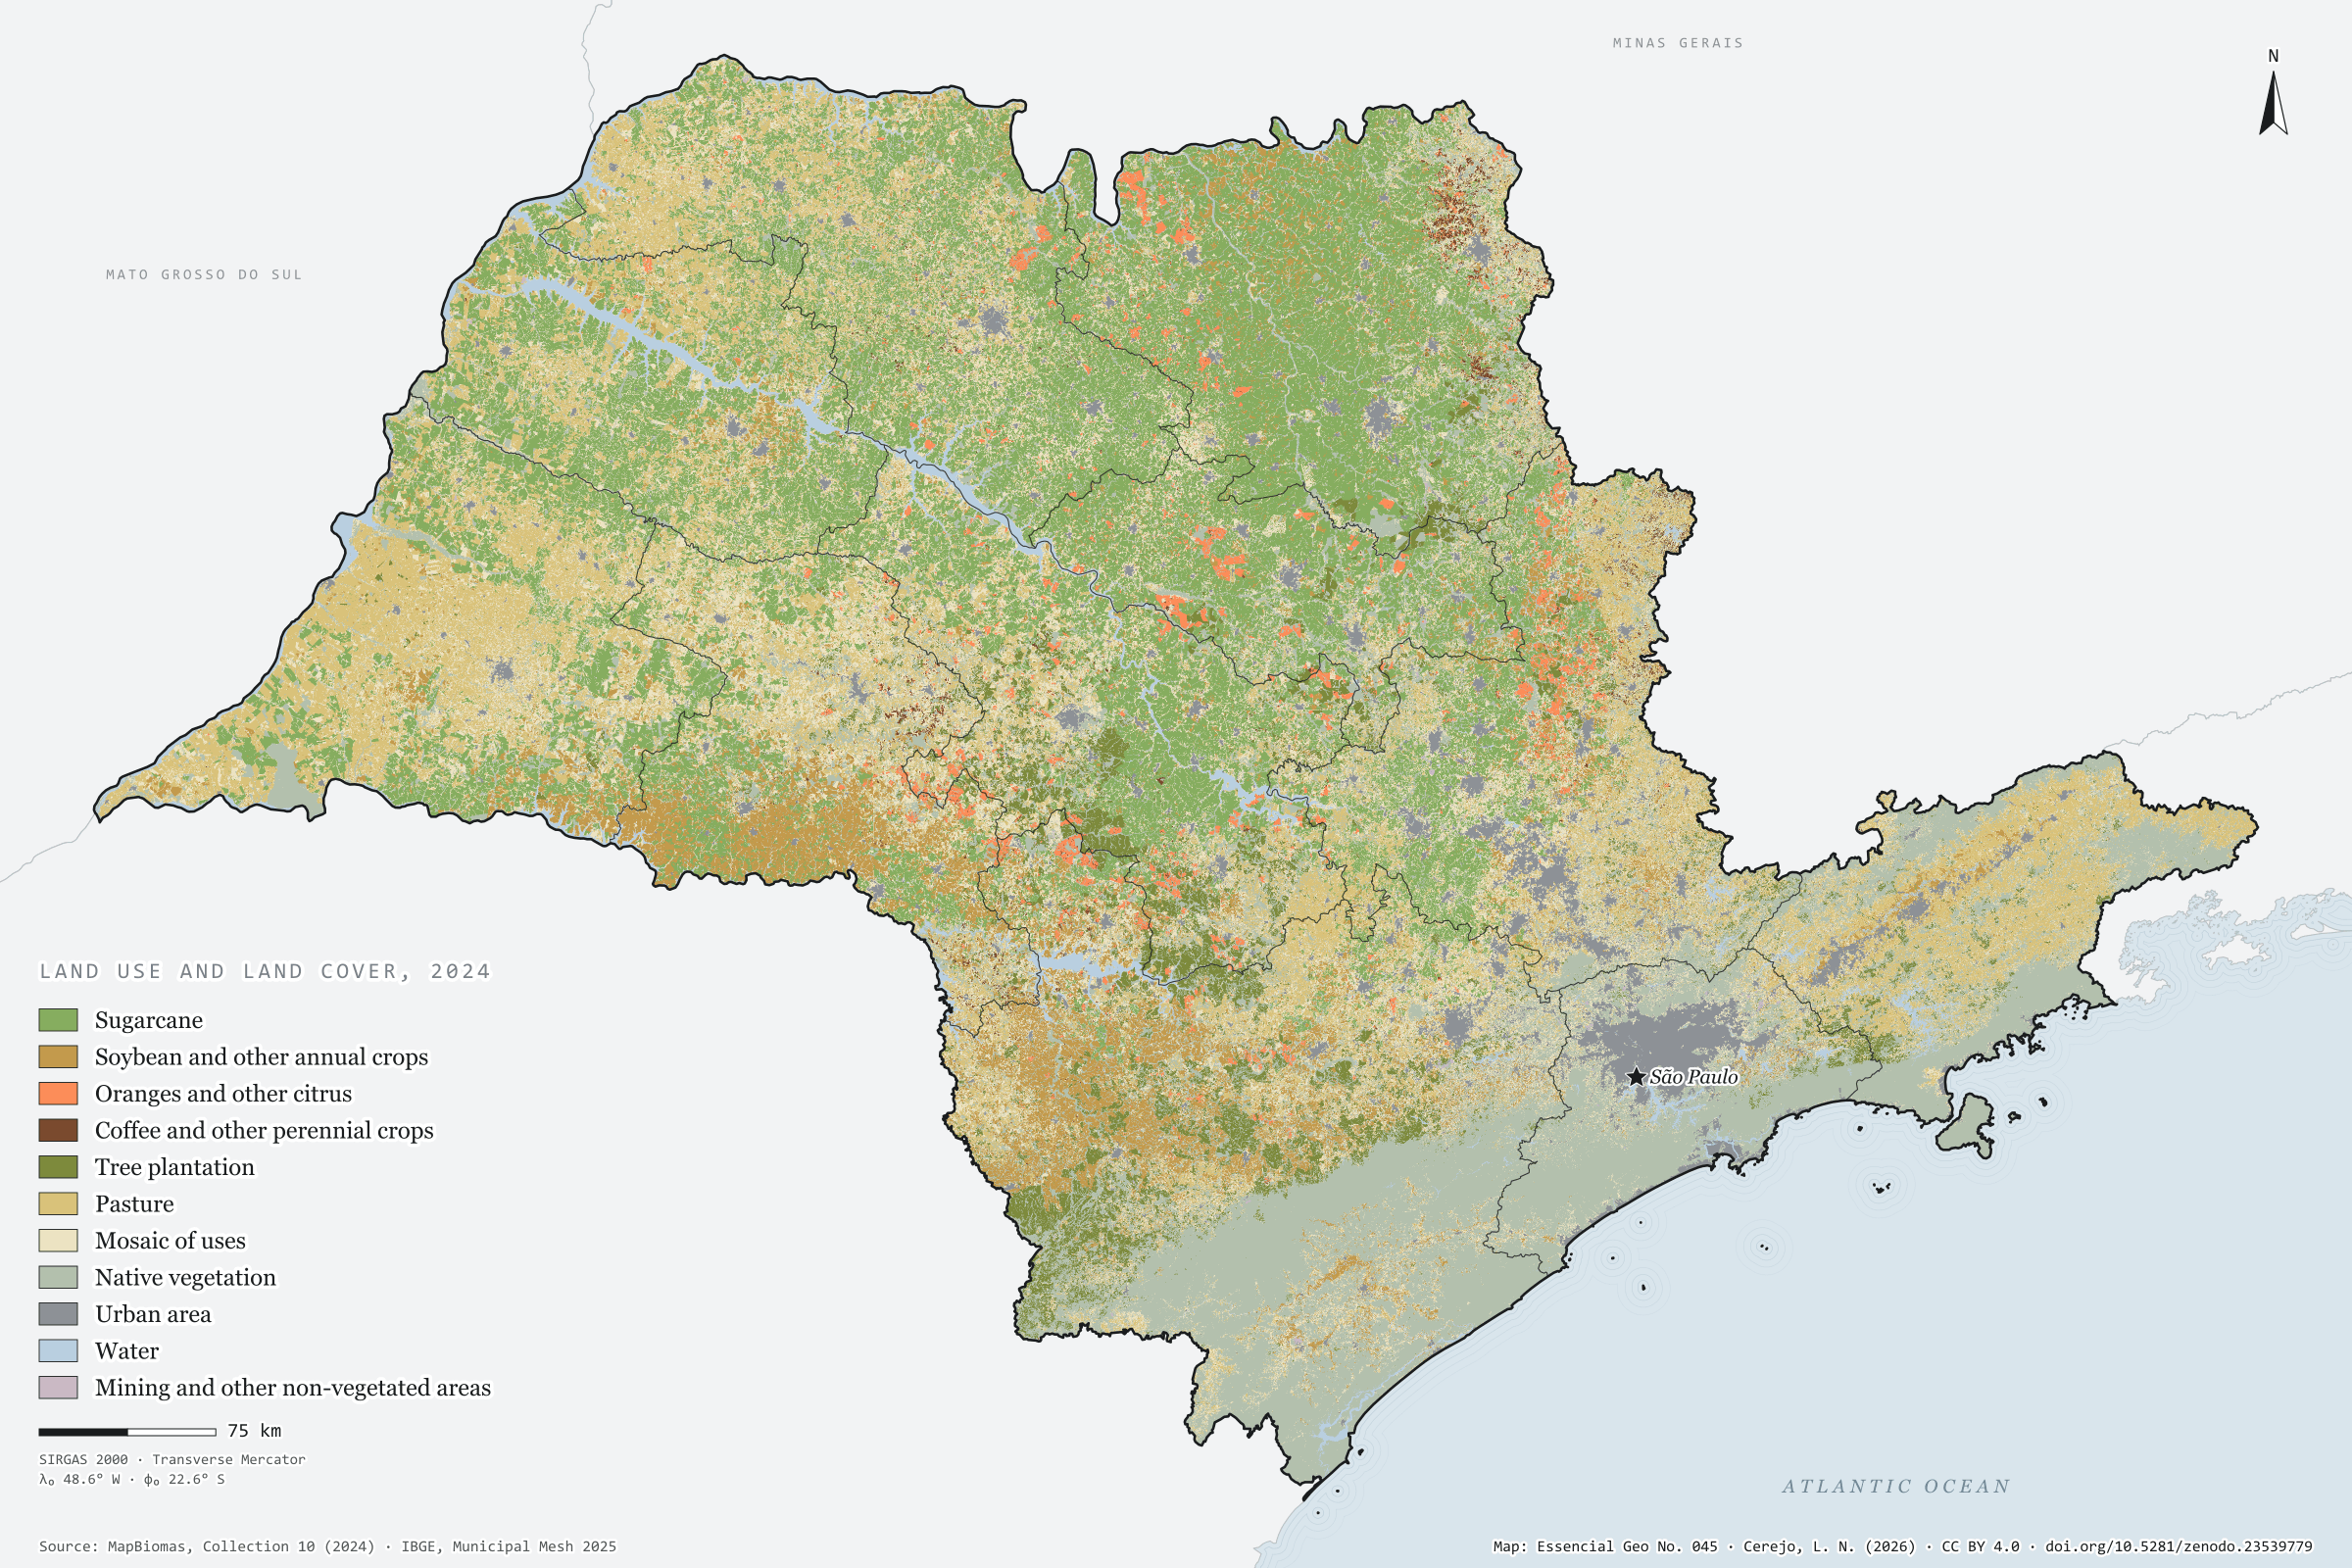
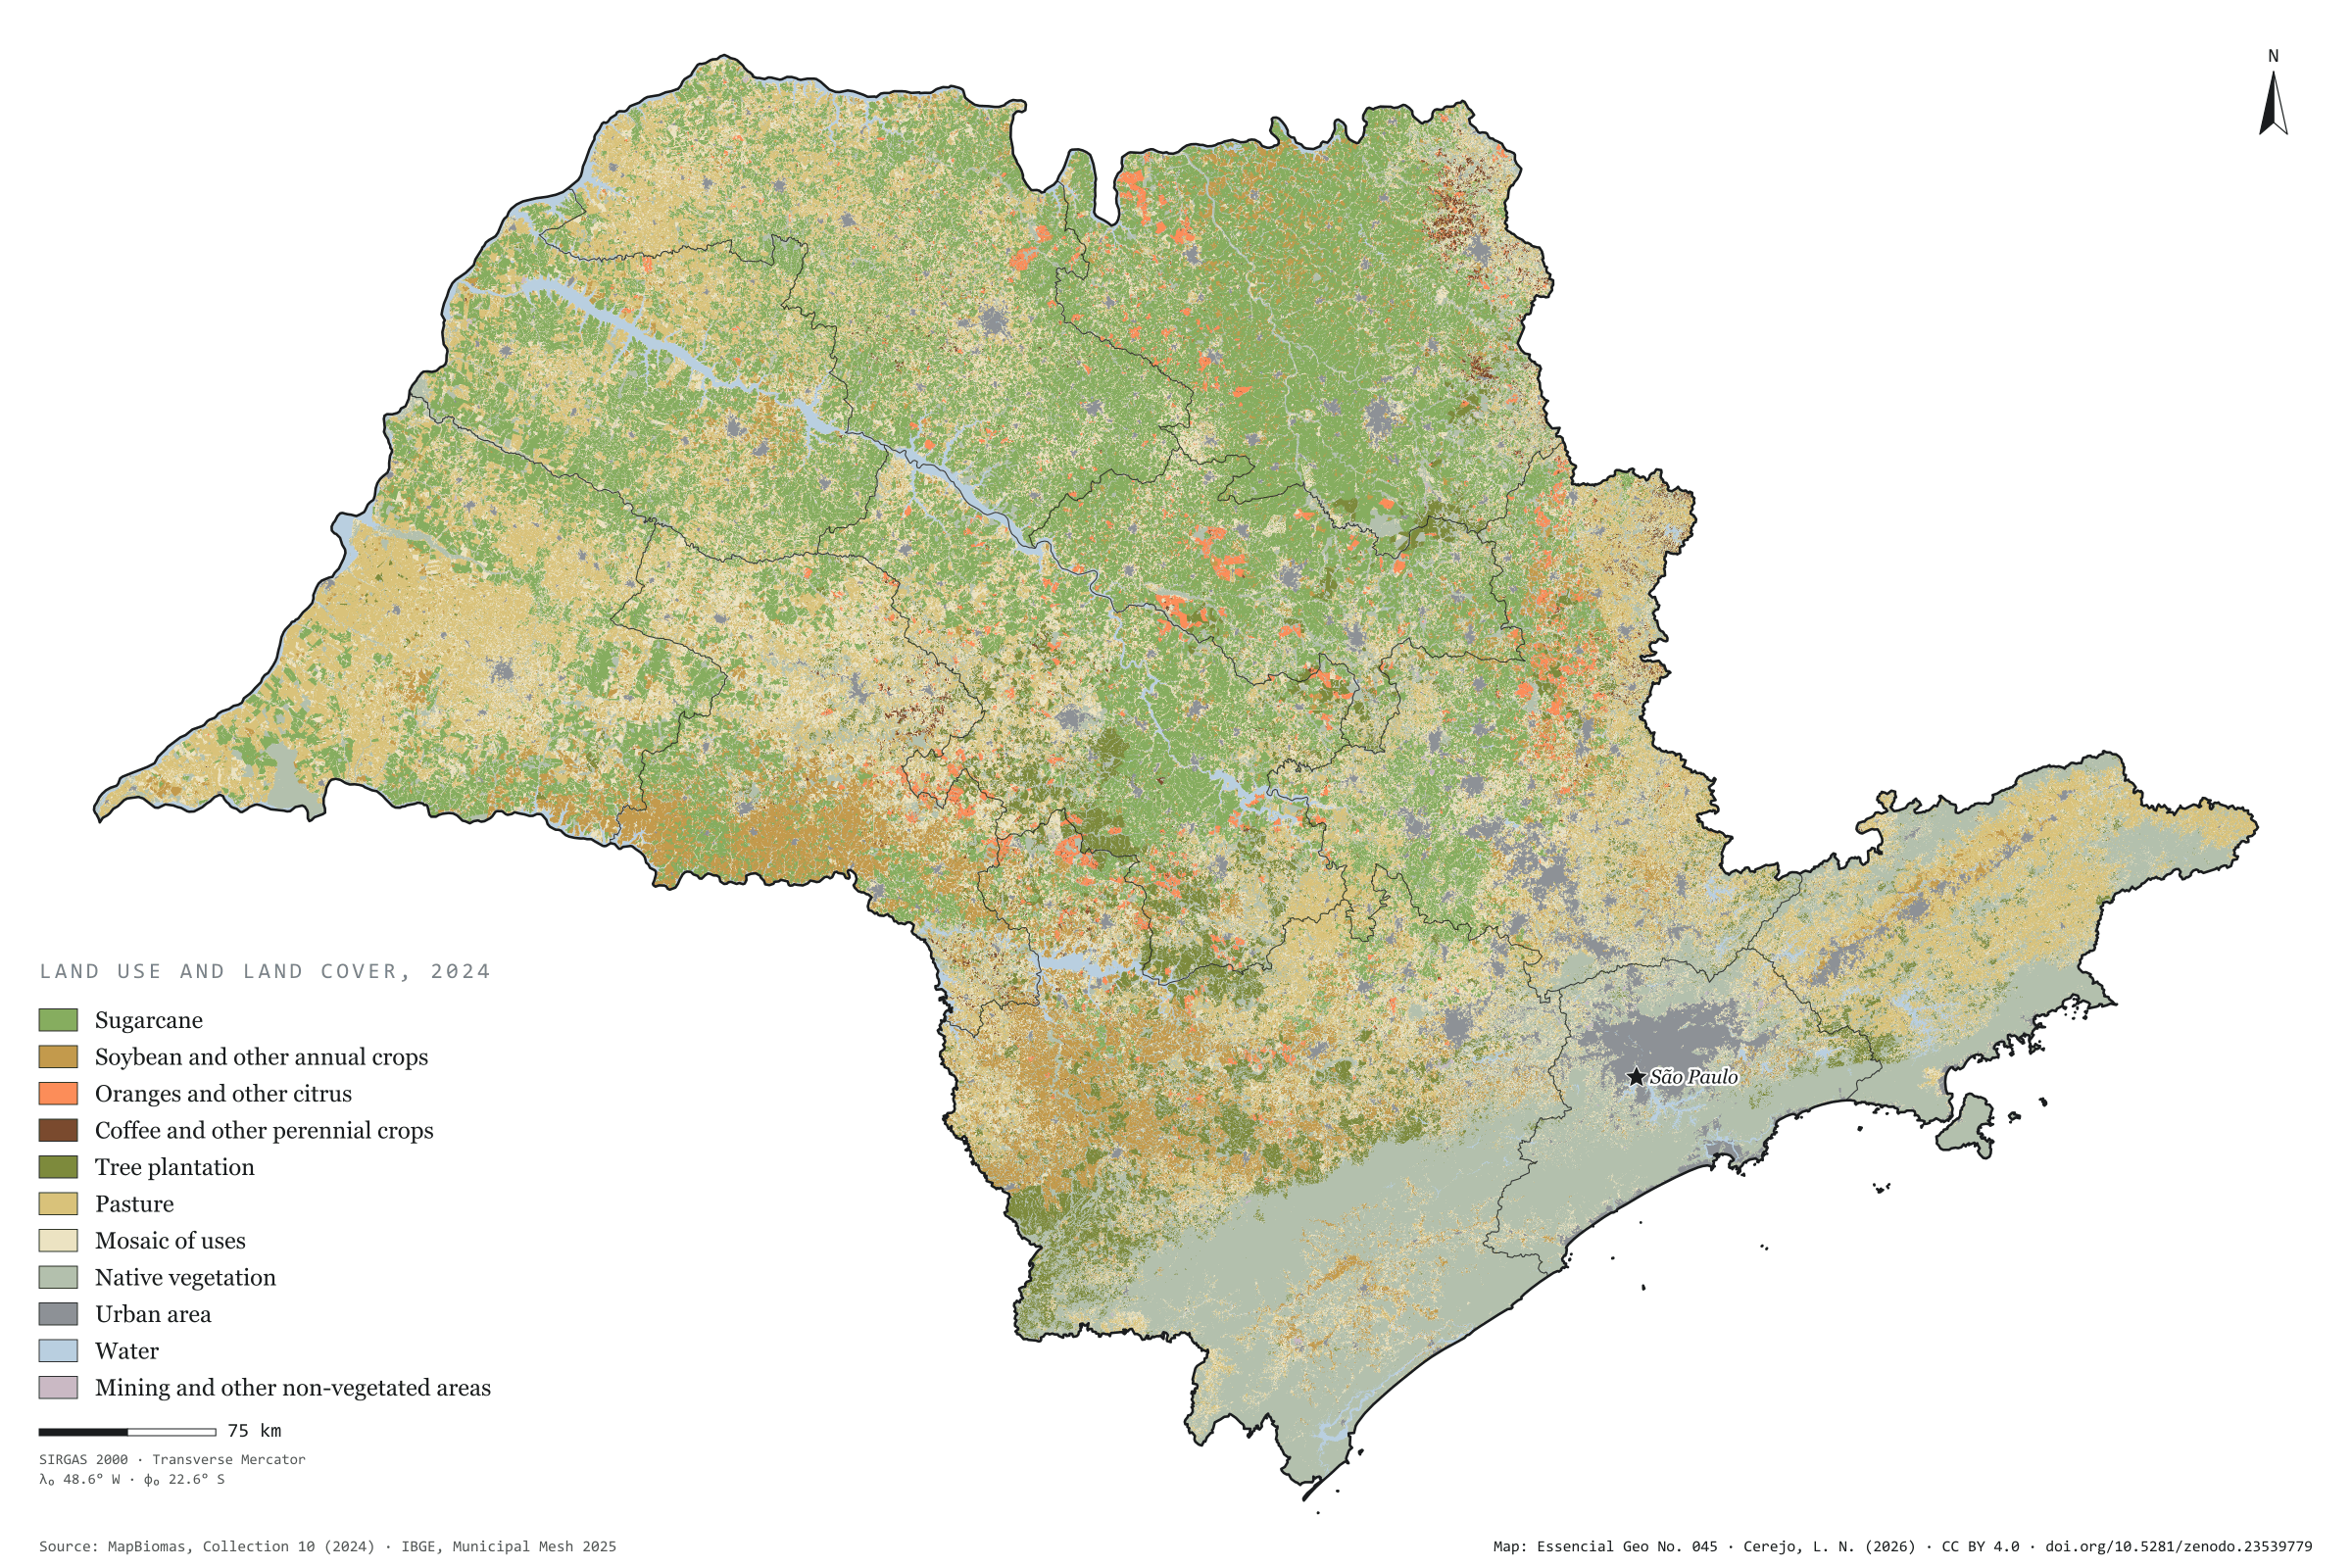
In 2024, 72% of São Paulo’s territory was cropland, pasture, tree plantation or a mosaic of these uses, according to MapBiomas. Sugarcane is the largest class: 58,000 km², almost a quarter of the state, and the leading use in 255 of the 645 municipalities. In the Ribeirão Preto region it covers half the land, and in Dumont, 80%. Soybean and other annual crops add up to 7%, mostly in the south, in the Marília region and around Itapeva. Pasture, at 15%, dominates the west: it covers 36% of the Presidente Prudente region. Oranges, coffee and other perennial crops take up less than 2%. Native vegetation, 22% of the state, lies mostly in the Serra do Mar and the Ribeira valley. First plate of the collection “From field to biomethane”, which follows the crops to the gas their residues could give.
Technical record · downloads · citation
At a glance
The state by land use (km²)
Sugarcane23.4%
Native vegetation21.5%
Mosaic of uses20.1%
Pasture15.5%
Soybean and other annual crops7.3%
Tree plantation4.1%
Urban area3.5%
Water2.5%
Citrus, coffee and other perennials2%
Other non-vegetated areas0.2%
Largest share of the municipality in sugarcane (%)
Dumont80
Guariba78
Pontal77
Dobrada76
Ariranha75
Layers
municipiospolygon645 municipalities: area (km²) and share of the municipality (%) of each of the eleven classes, total of farming uses and class with the largest area
regioes_intermediariaspolygon11 intermediate geographic regions
MapBiomas 2024 classification (Collection 10), 30 m pixels, grouped into eleven classes; areas by municipality counted on the 30 m pixels, on the GRS80 ellipsoid; map drawn with the most frequent class in blocks of 4 × 4 pixels (120 m).
The map without a frame, with legend, scale, reference system and credit written on it: ready for papers, lectures and slides. In two versions: with the basemap (neighbours and sea) or only the mapped area, on white.
CEREJO, Lucas Nakamura. O tabuleiro agrícola: quase um quarto do estado é cana. Versão 1.0.0. [S. l.]: Zenodo, 2026. Conjunto de dados. DOI: 10.5281/zenodo.23539779. Disponível em: https://doi.org/10.5281/zenodo.23539779. Acesso em: 10 nov. 2026.
Cerejo, L. N. (2026). O tabuleiro agrícola: quase um quarto do estado é cana [The farming patchwork: Almost a quarter of the state is sugarcane] (Version 1.0.0) [Data set]. Zenodo. https://doi.org/10.5281/zenodo.23539779
@dataset{cerejo2026_tabuleiro_agricola_sp,
  author    = {Cerejo, Lucas Nakamura},
  title     = {O tabuleiro agrícola: Quase um quarto do estado é cana},
  year      = {2026},
  publisher = {Zenodo},
  version   = {1.0.0},
  doi       = {10.5281/zenodo.23539779},
  url       = {https://doi.org/10.5281/zenodo.23539779},
  language  = {portuguese},
  note      = {English title: The farming patchwork: Almost a quarter of the state is sugarcane. Licence CC BY 4.0}
}
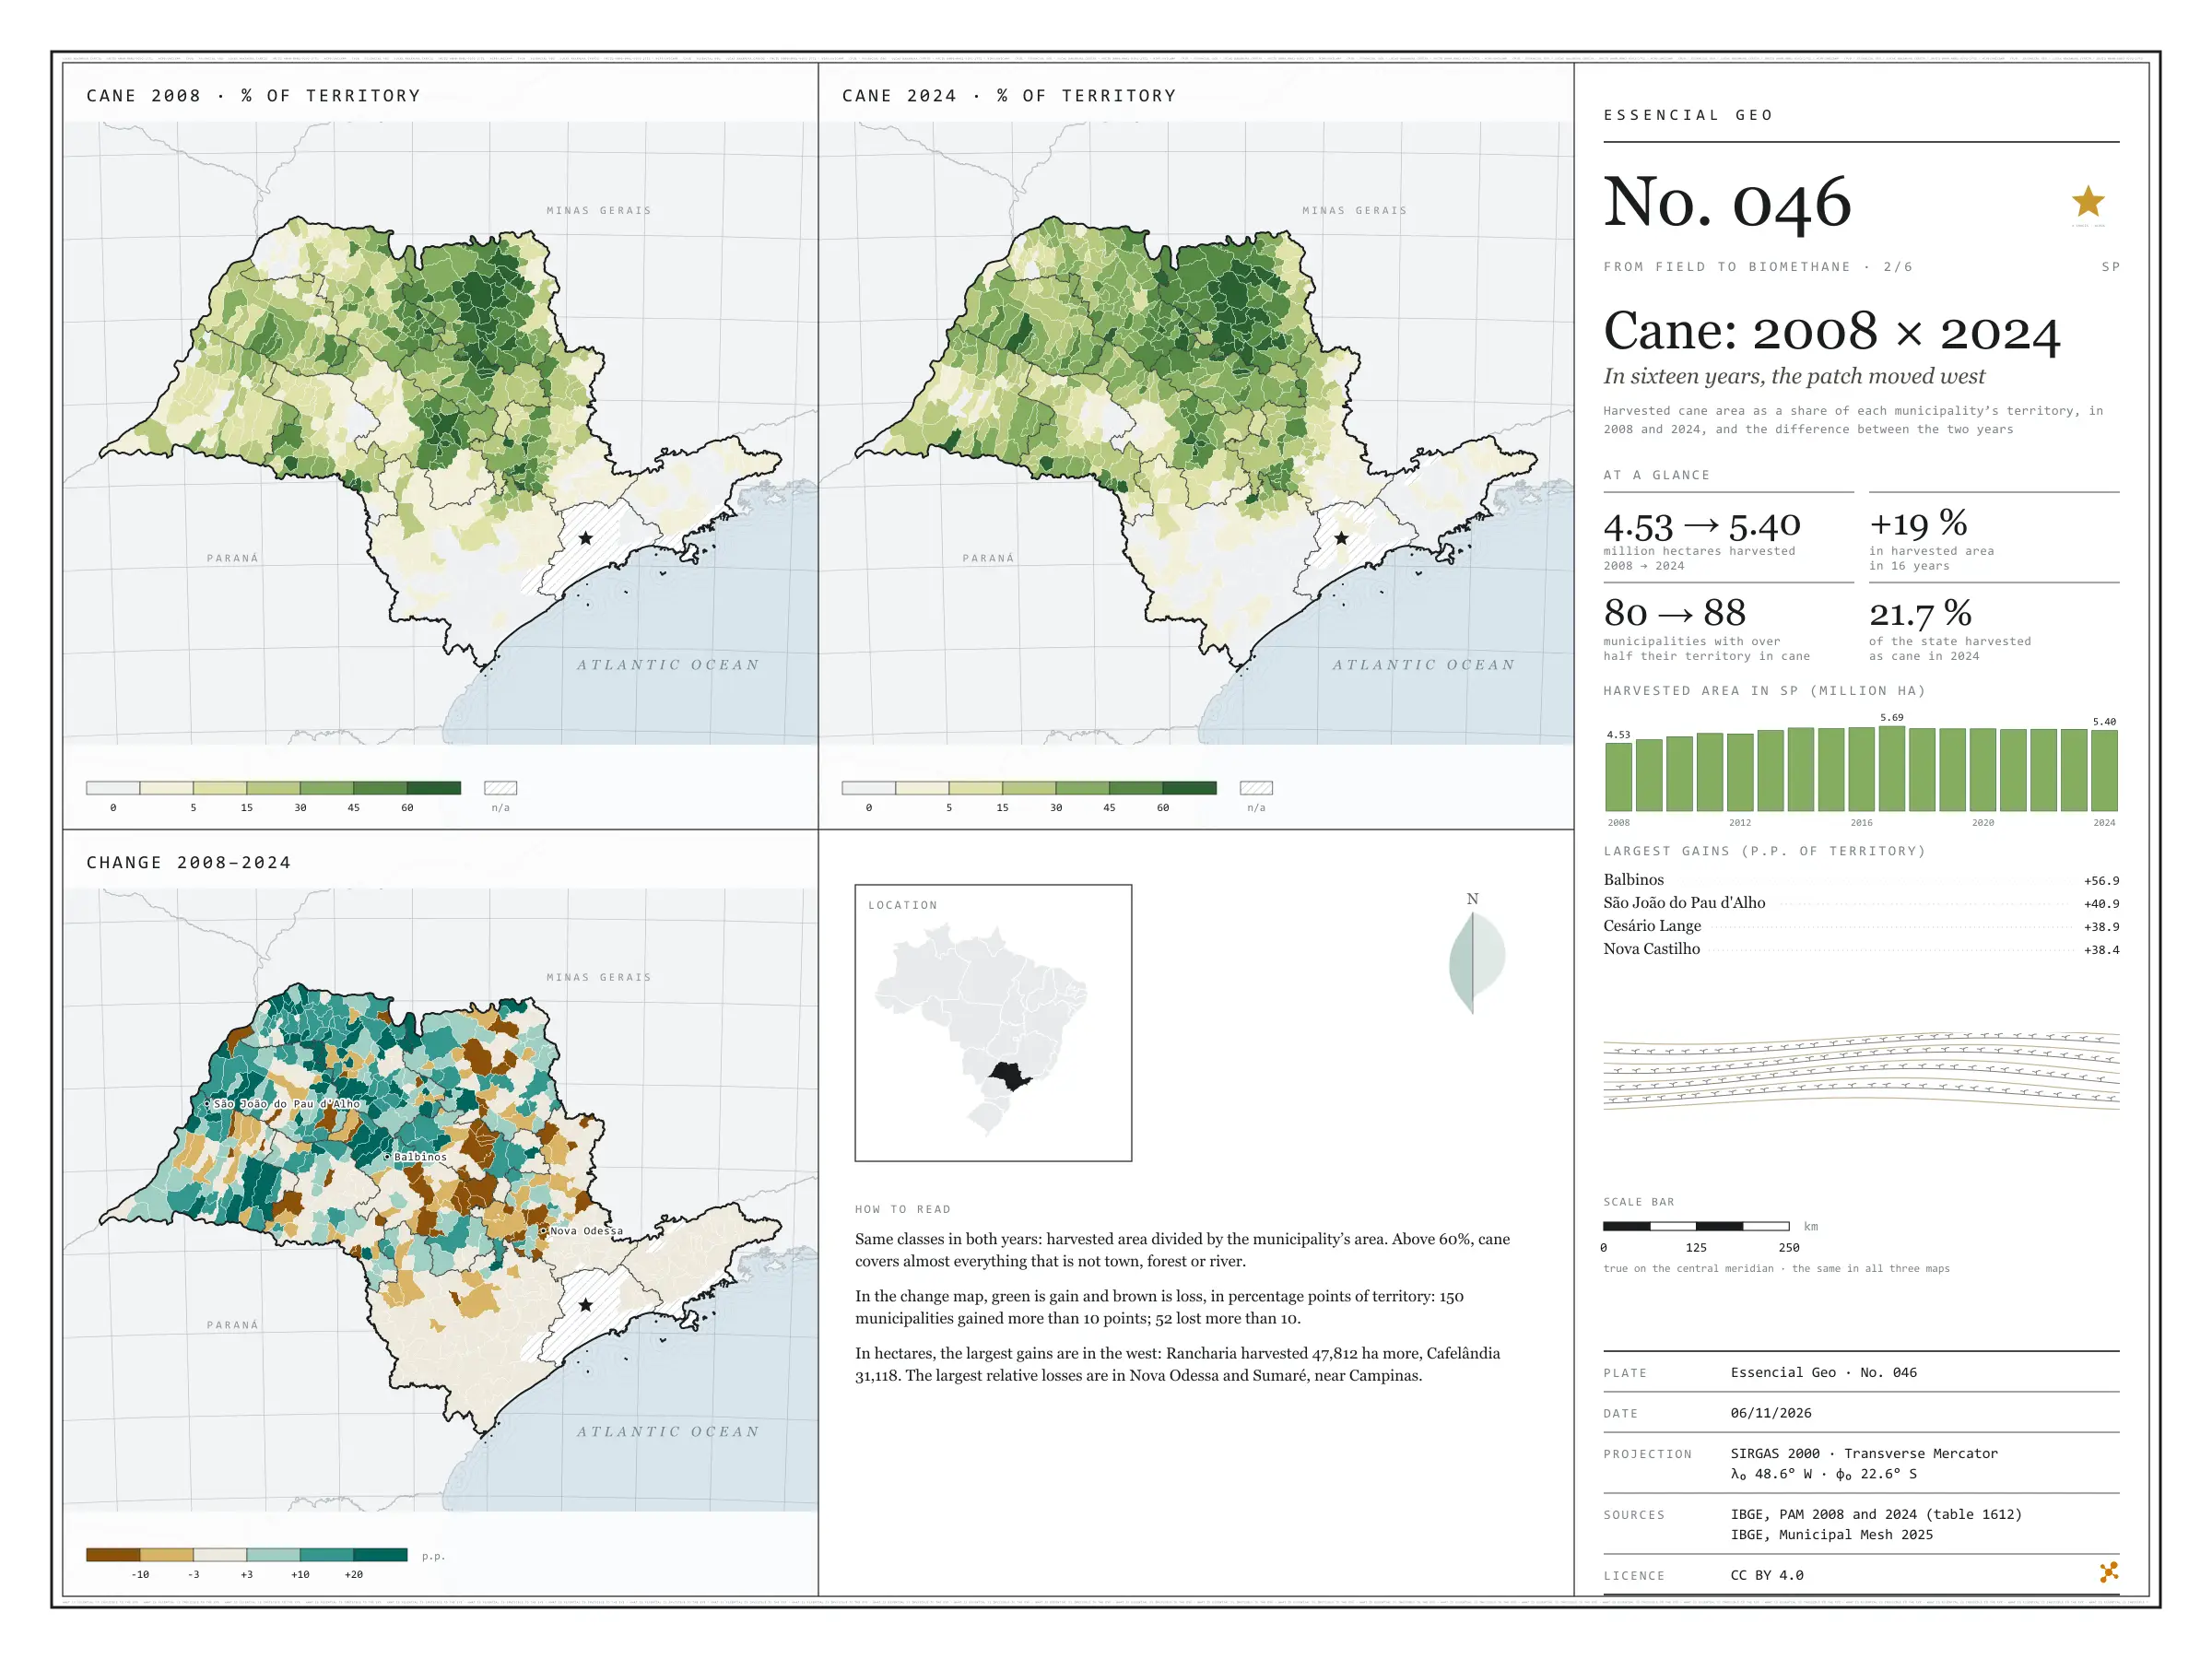
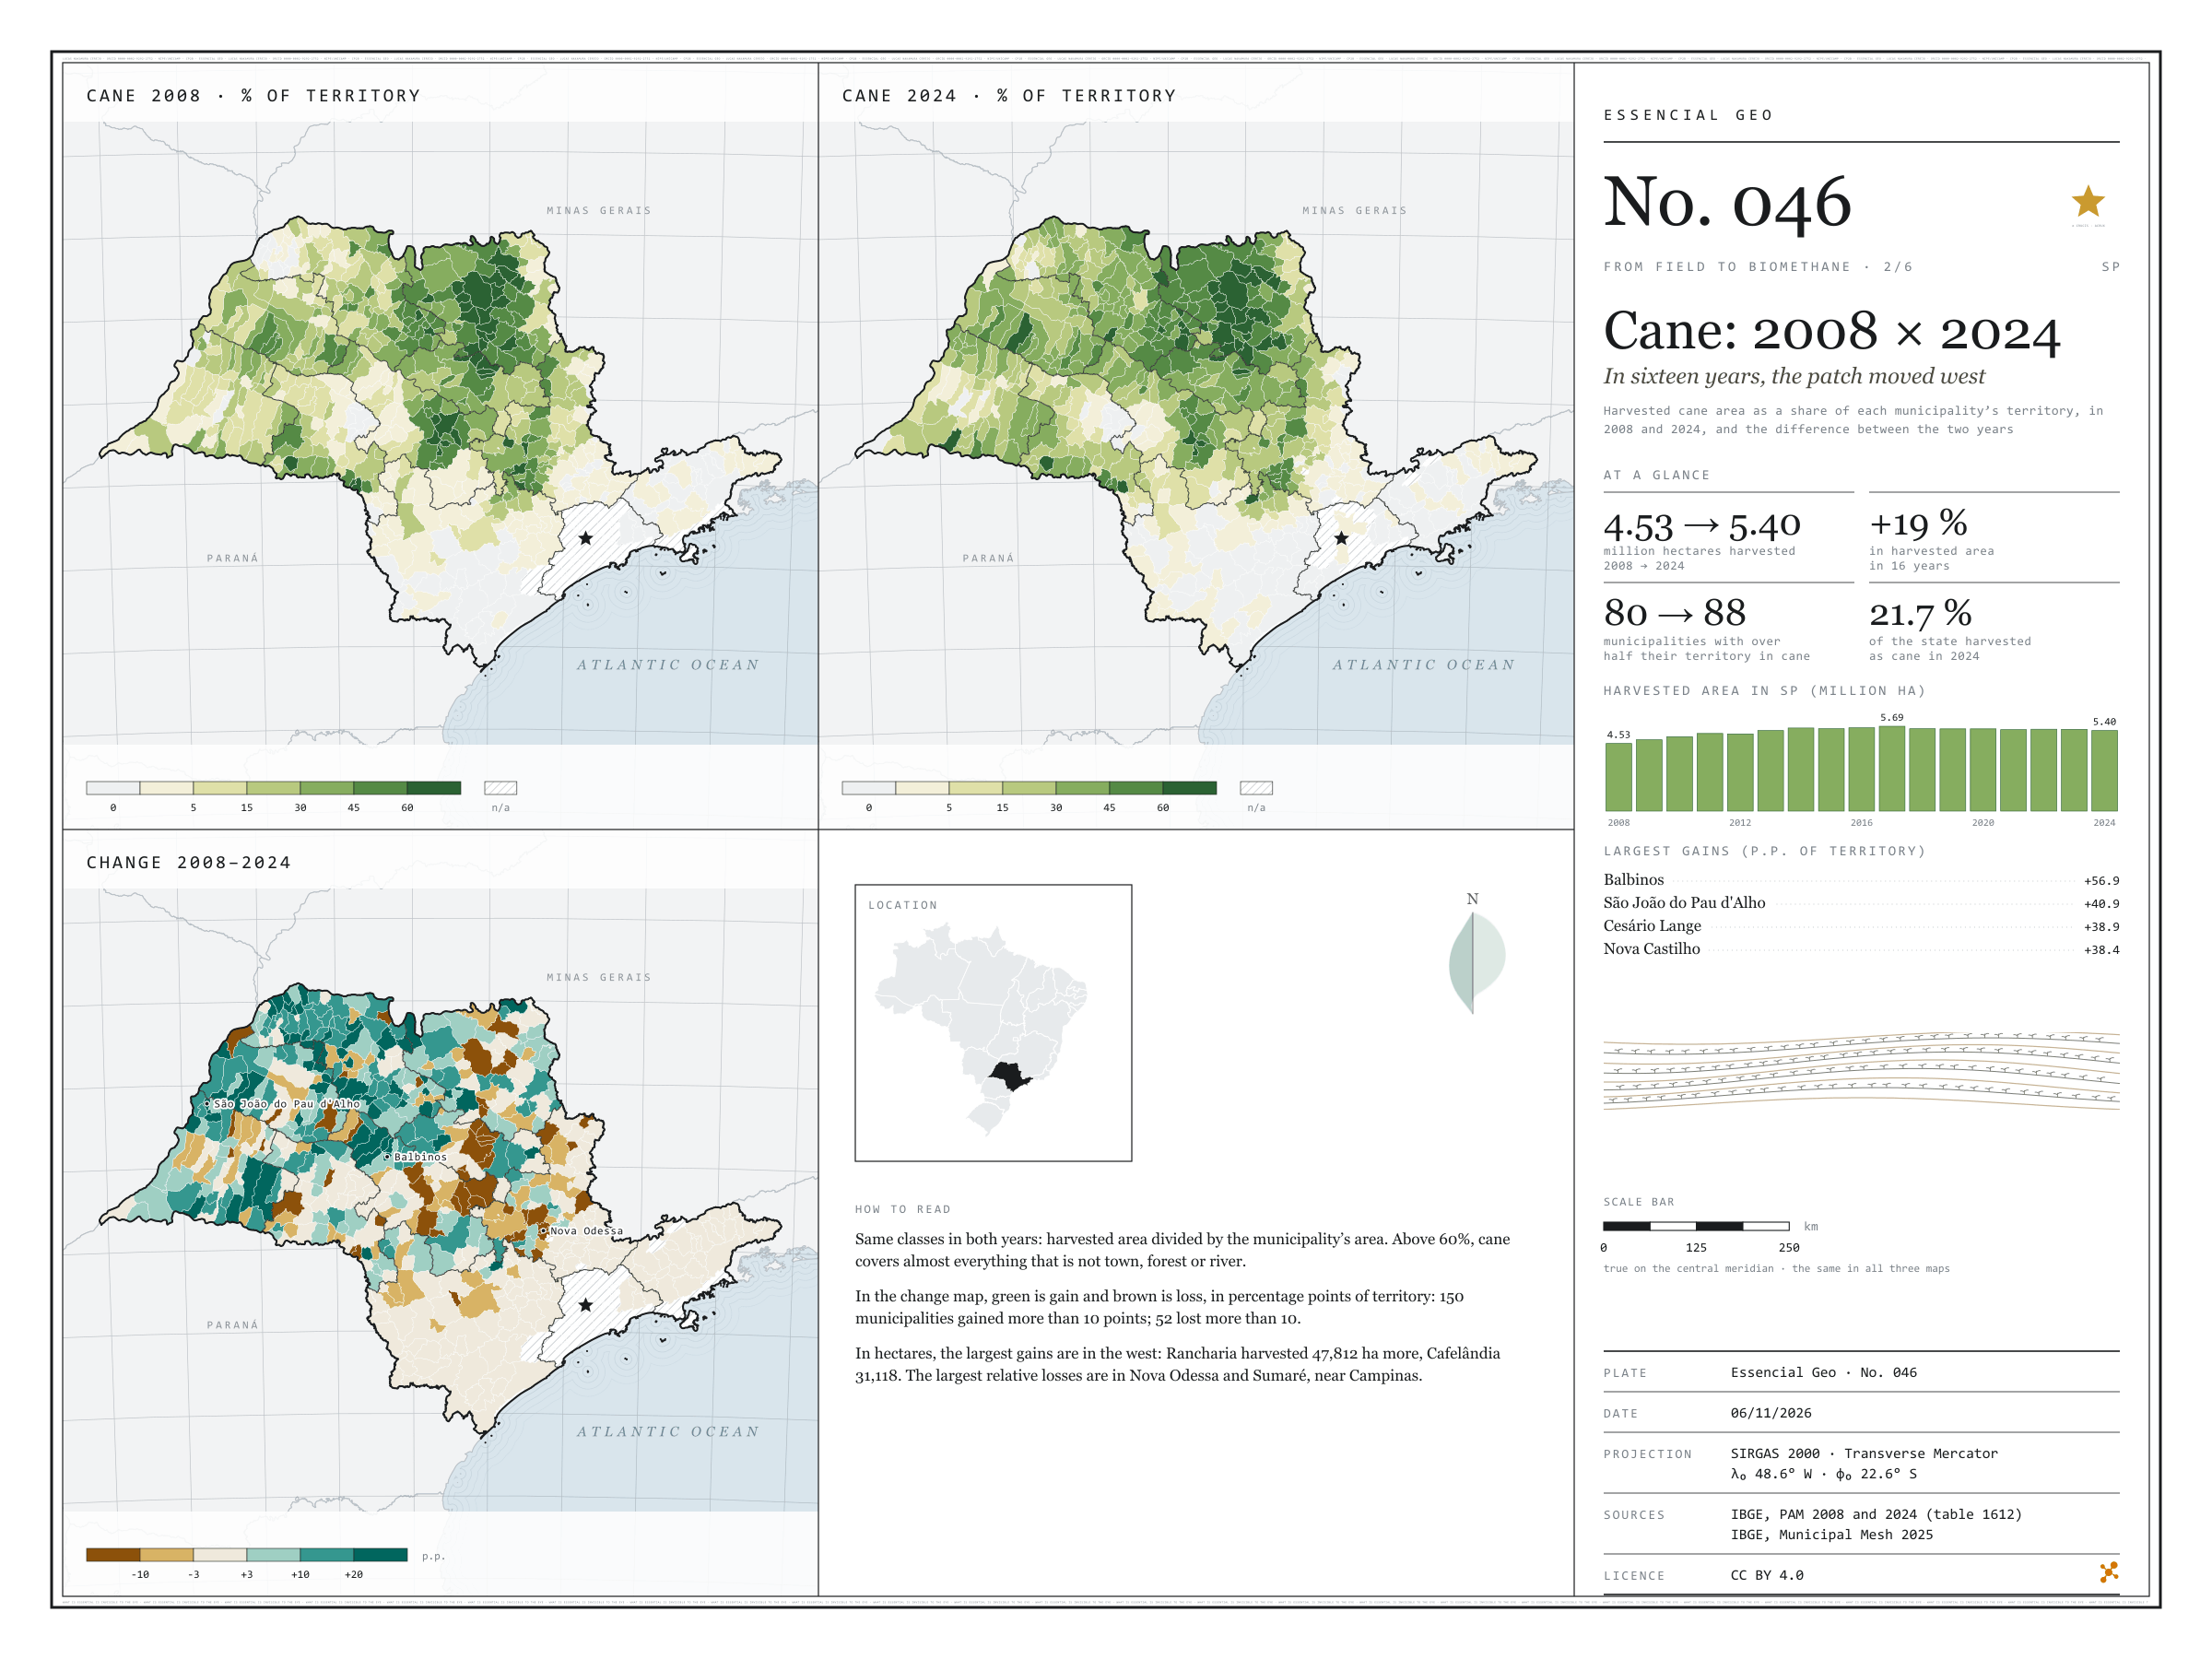
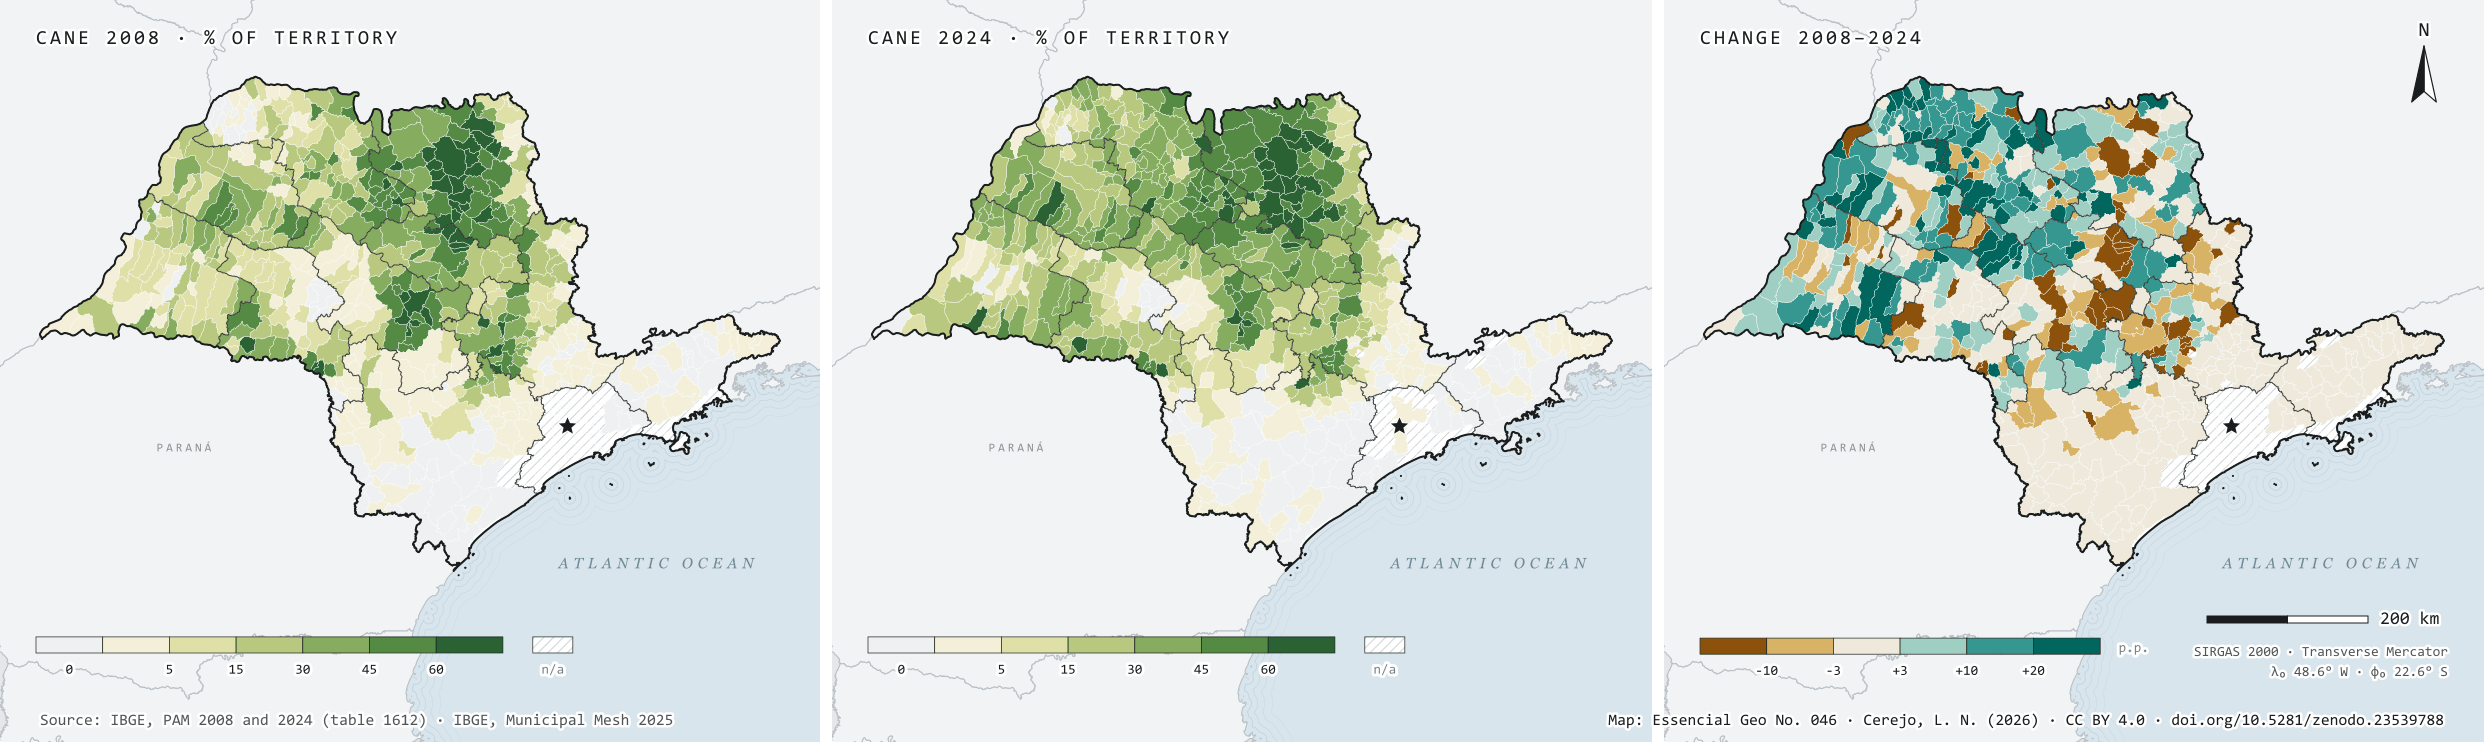
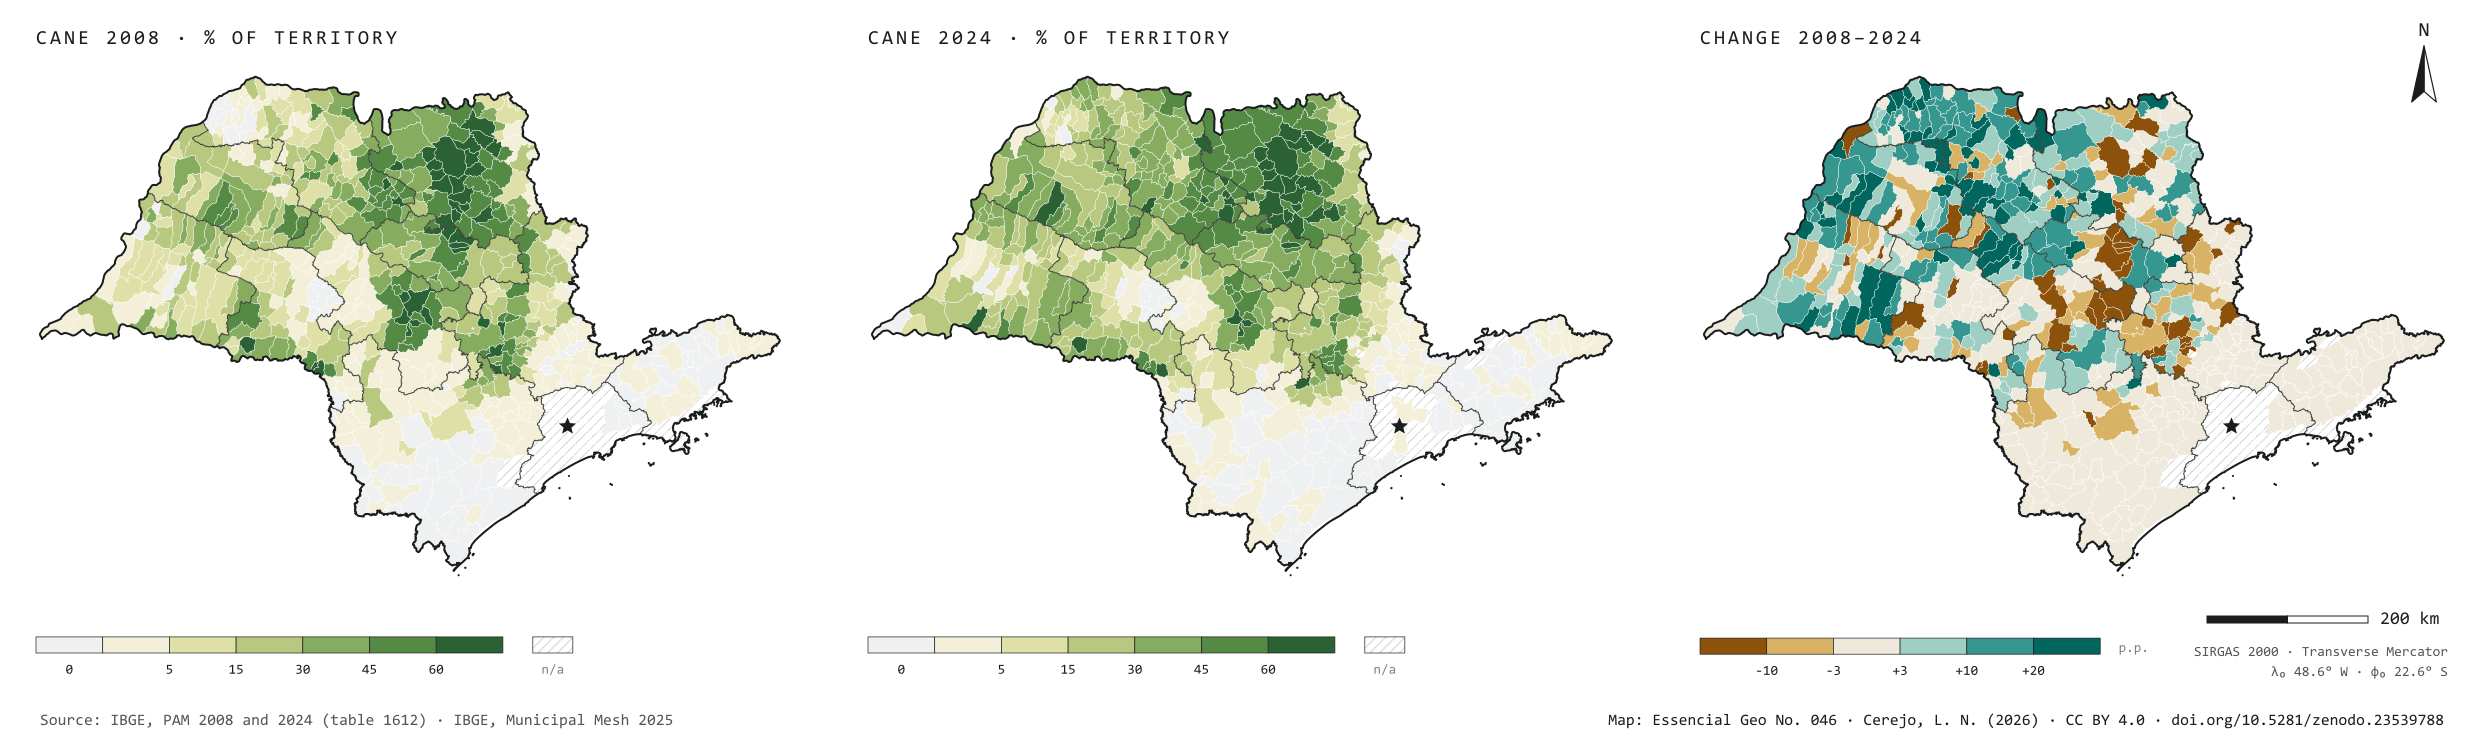
In 2008, São Paulo’s cane fields were harvested over 4.53 million hectares; in 2024, over 5.40 million, 19% more, and cane went from 18.3% to 21.7% of the state’s territory. Harvested area peaked in 2017, at 5.69 million hectares, and has been slowly receding since. The plate sets the two years side by side, with the same classes, and maps the difference: 150 municipalities gained more than 10 percentage points of territory under cane, 104 of them in the São José do Rio Preto, Araçatuba and Presidente Prudente regions, in the west; Rancharia harvested 47,812 hectares more. The Campinas region was the only one to lose much: 63,632 hectares fewer, with the steepest falls in Nova Odessa and Sumaré. Second plate of the collection “From field to biomethane”.
Technical record · downloads · citation
At a glance
Harvested area in 2024
5,398,676ha
It was 4,530,784 ha in 2008: 19% more in sixteen years
Municipalities that gained over 10 p.p.
150
Another 52 lost more than 10 percentage points of territory under cane
Largest gains in harvested area, 2008–2024 (ha)
Rancharia47,812
Cafelândia31,118
José Bonifácio28,000
Martinópolis25,500
Mirandópolis23,000
Layers
municipiospolygon645 municipalities: harvested area and production of cane in 2008 and 2024, share of territory in each year (%) and change (p.p.)
regioes_intermediariaspolygon11 intermediate geographic regions
Harvested cane area from PAM in 2008 and 2024 divided by municipal area, in the same six classes for both years; the change is given in percentage points of territory.
The map without a frame, with legend, scale, reference system and credit written on it: ready for papers, lectures and slides. In two versions: with the basemap (neighbours and sea) or only the mapped area, on white.
CEREJO, Lucas Nakamura. Cana: 2008 × 2024: em dezesseis anos, a mancha andou para o oeste. Versão 1.0.0. [S. l.]: Zenodo, 2026. Conjunto de dados. DOI: 10.5281/zenodo.23539788. Disponível em: https://doi.org/10.5281/zenodo.23539788. Acesso em: 10 nov. 2026.
Cerejo, L. N. (2026). Cana: 2008 × 2024: em dezesseis anos, a mancha andou para o oeste [Cane: 2008 × 2024: In sixteen years, the patch moved west] (Version 1.0.0) [Data set]. Zenodo. https://doi.org/10.5281/zenodo.23539788
@dataset{cerejo2026_cana_2008_2024_sp,
  author    = {Cerejo, Lucas Nakamura},
  title     = {Cana: 2008 × 2024: Em dezesseis anos, a mancha andou para o oeste},
  year      = {2026},
  publisher = {Zenodo},
  version   = {1.0.0},
  doi       = {10.5281/zenodo.23539788},
  url       = {https://doi.org/10.5281/zenodo.23539788},
  language  = {portuguese},
  note      = {English title: Cane: 2008 × 2024: In sixteen years, the patch moved west. Licence CC BY 4.0}
}
Fig. 047São Paulo state (SP)EPSG:4674Source: IBGE, CP2B (Unicamp)
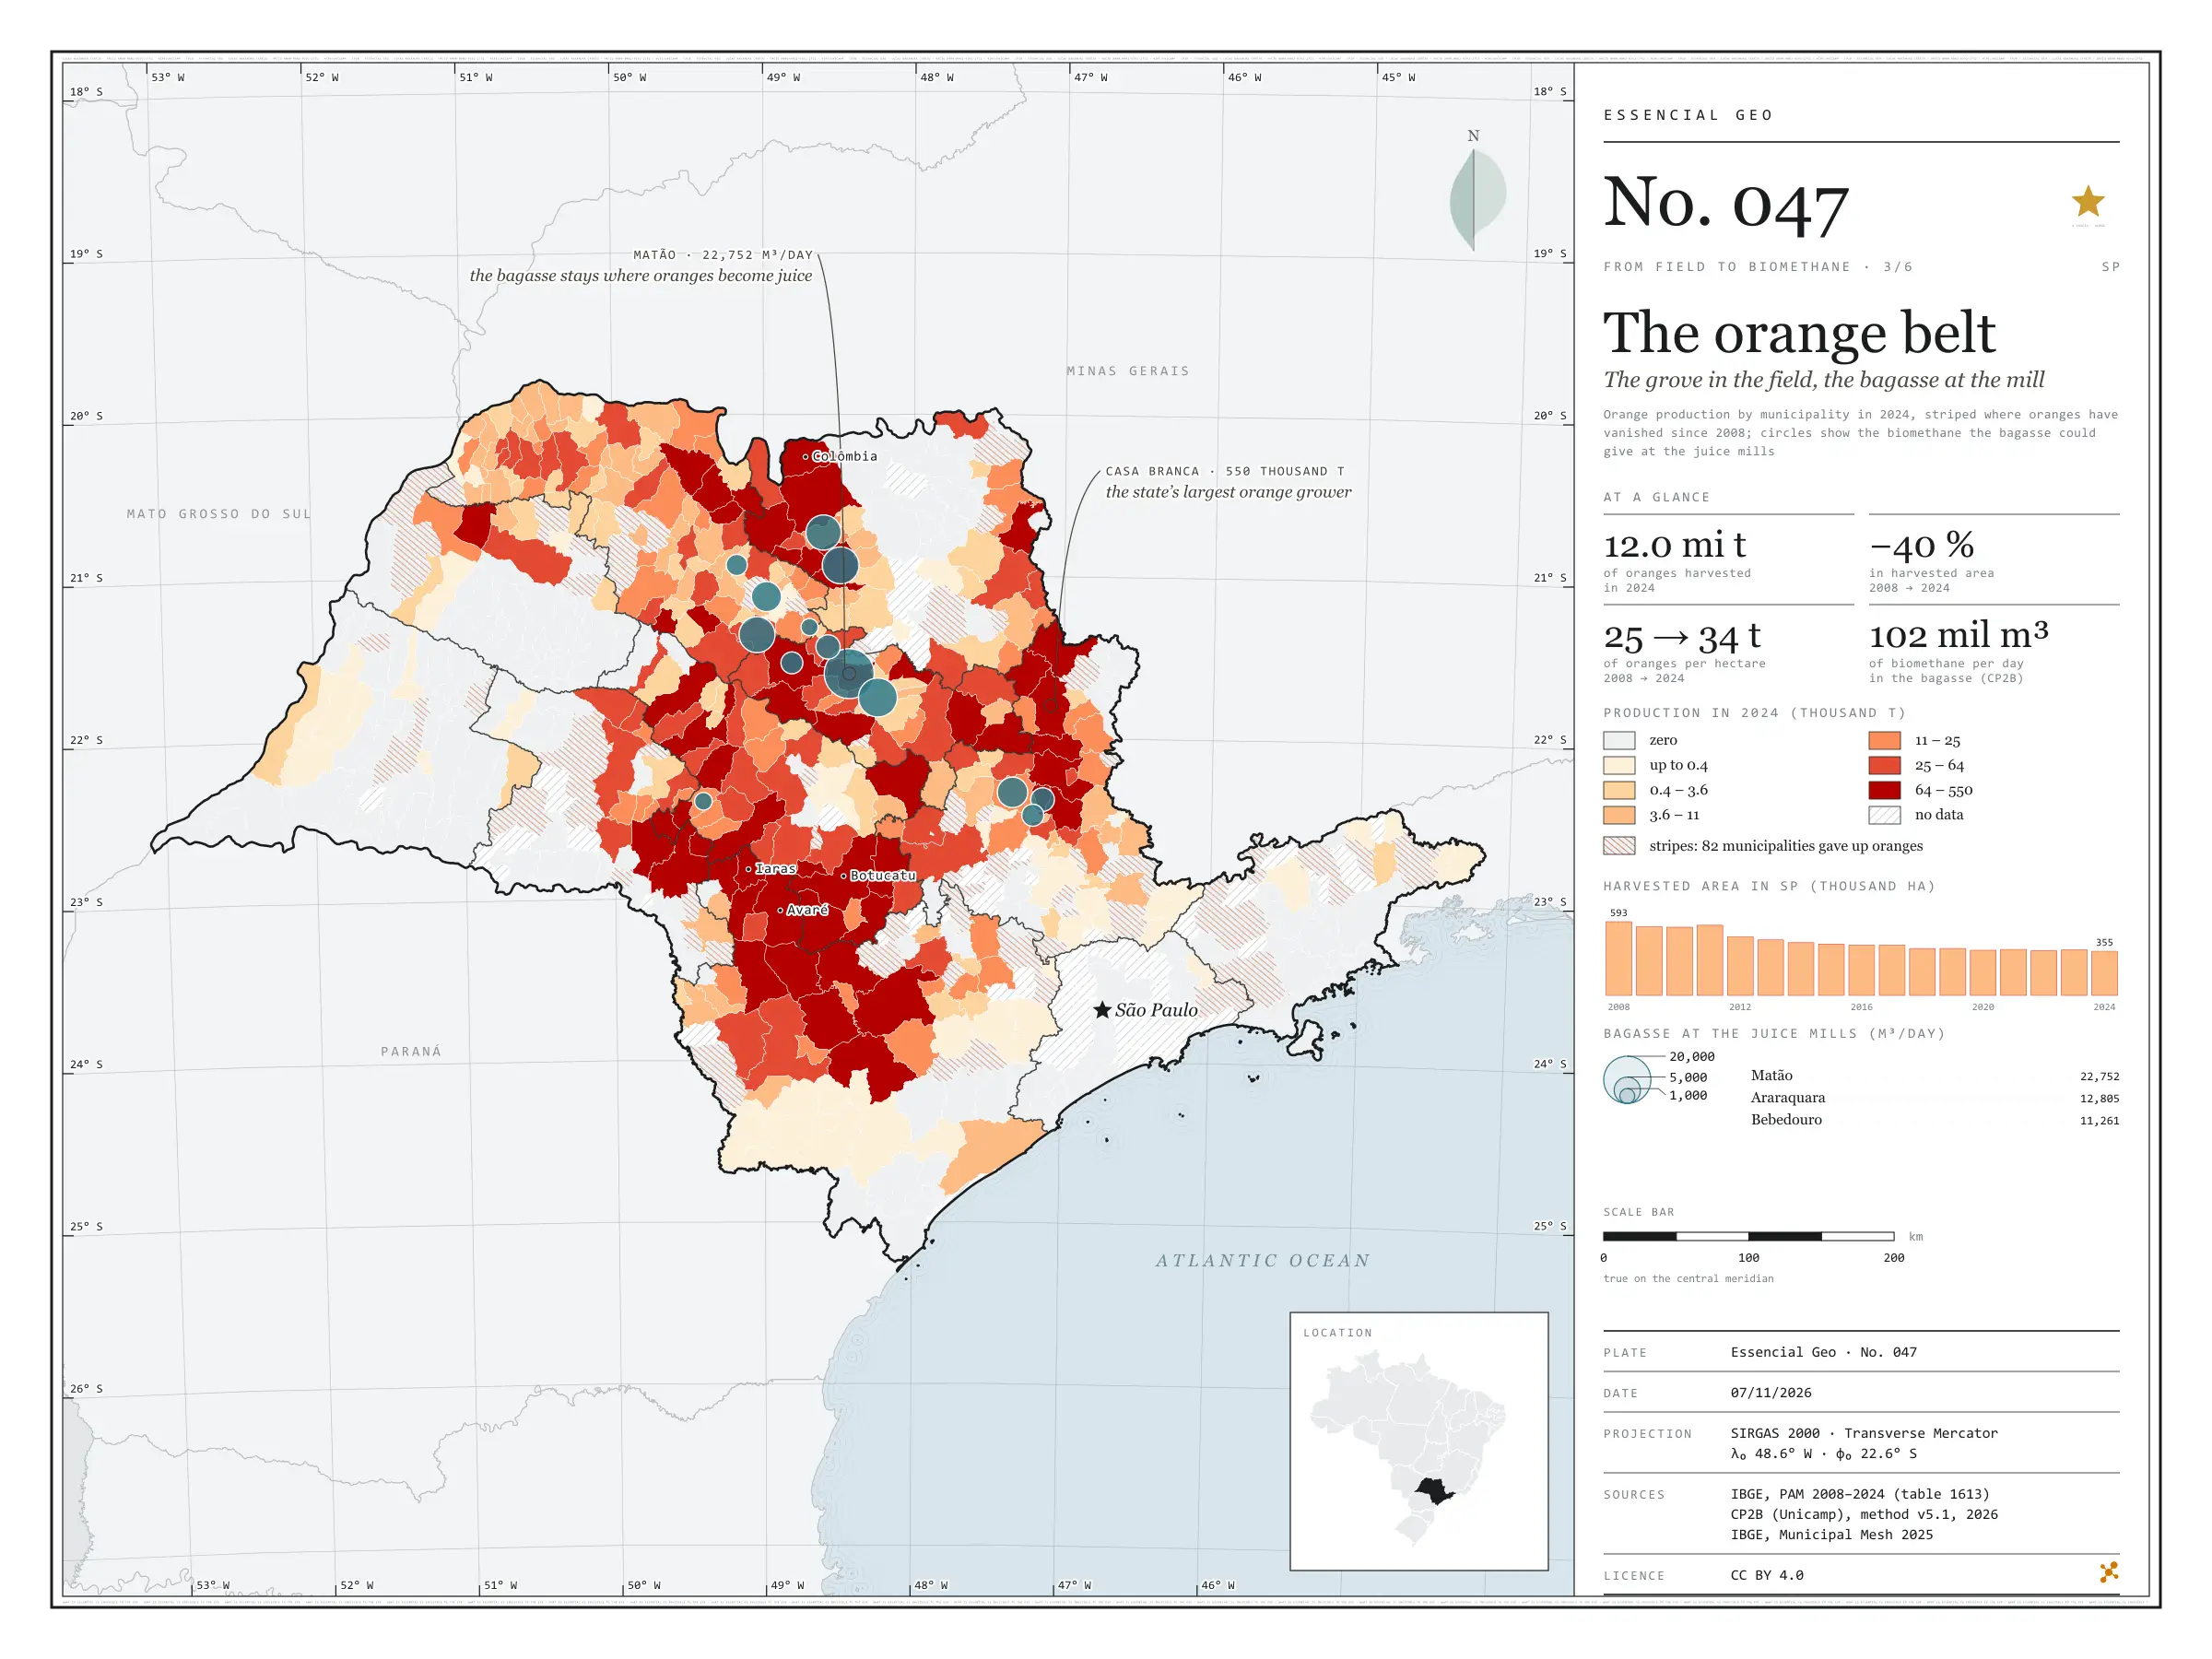
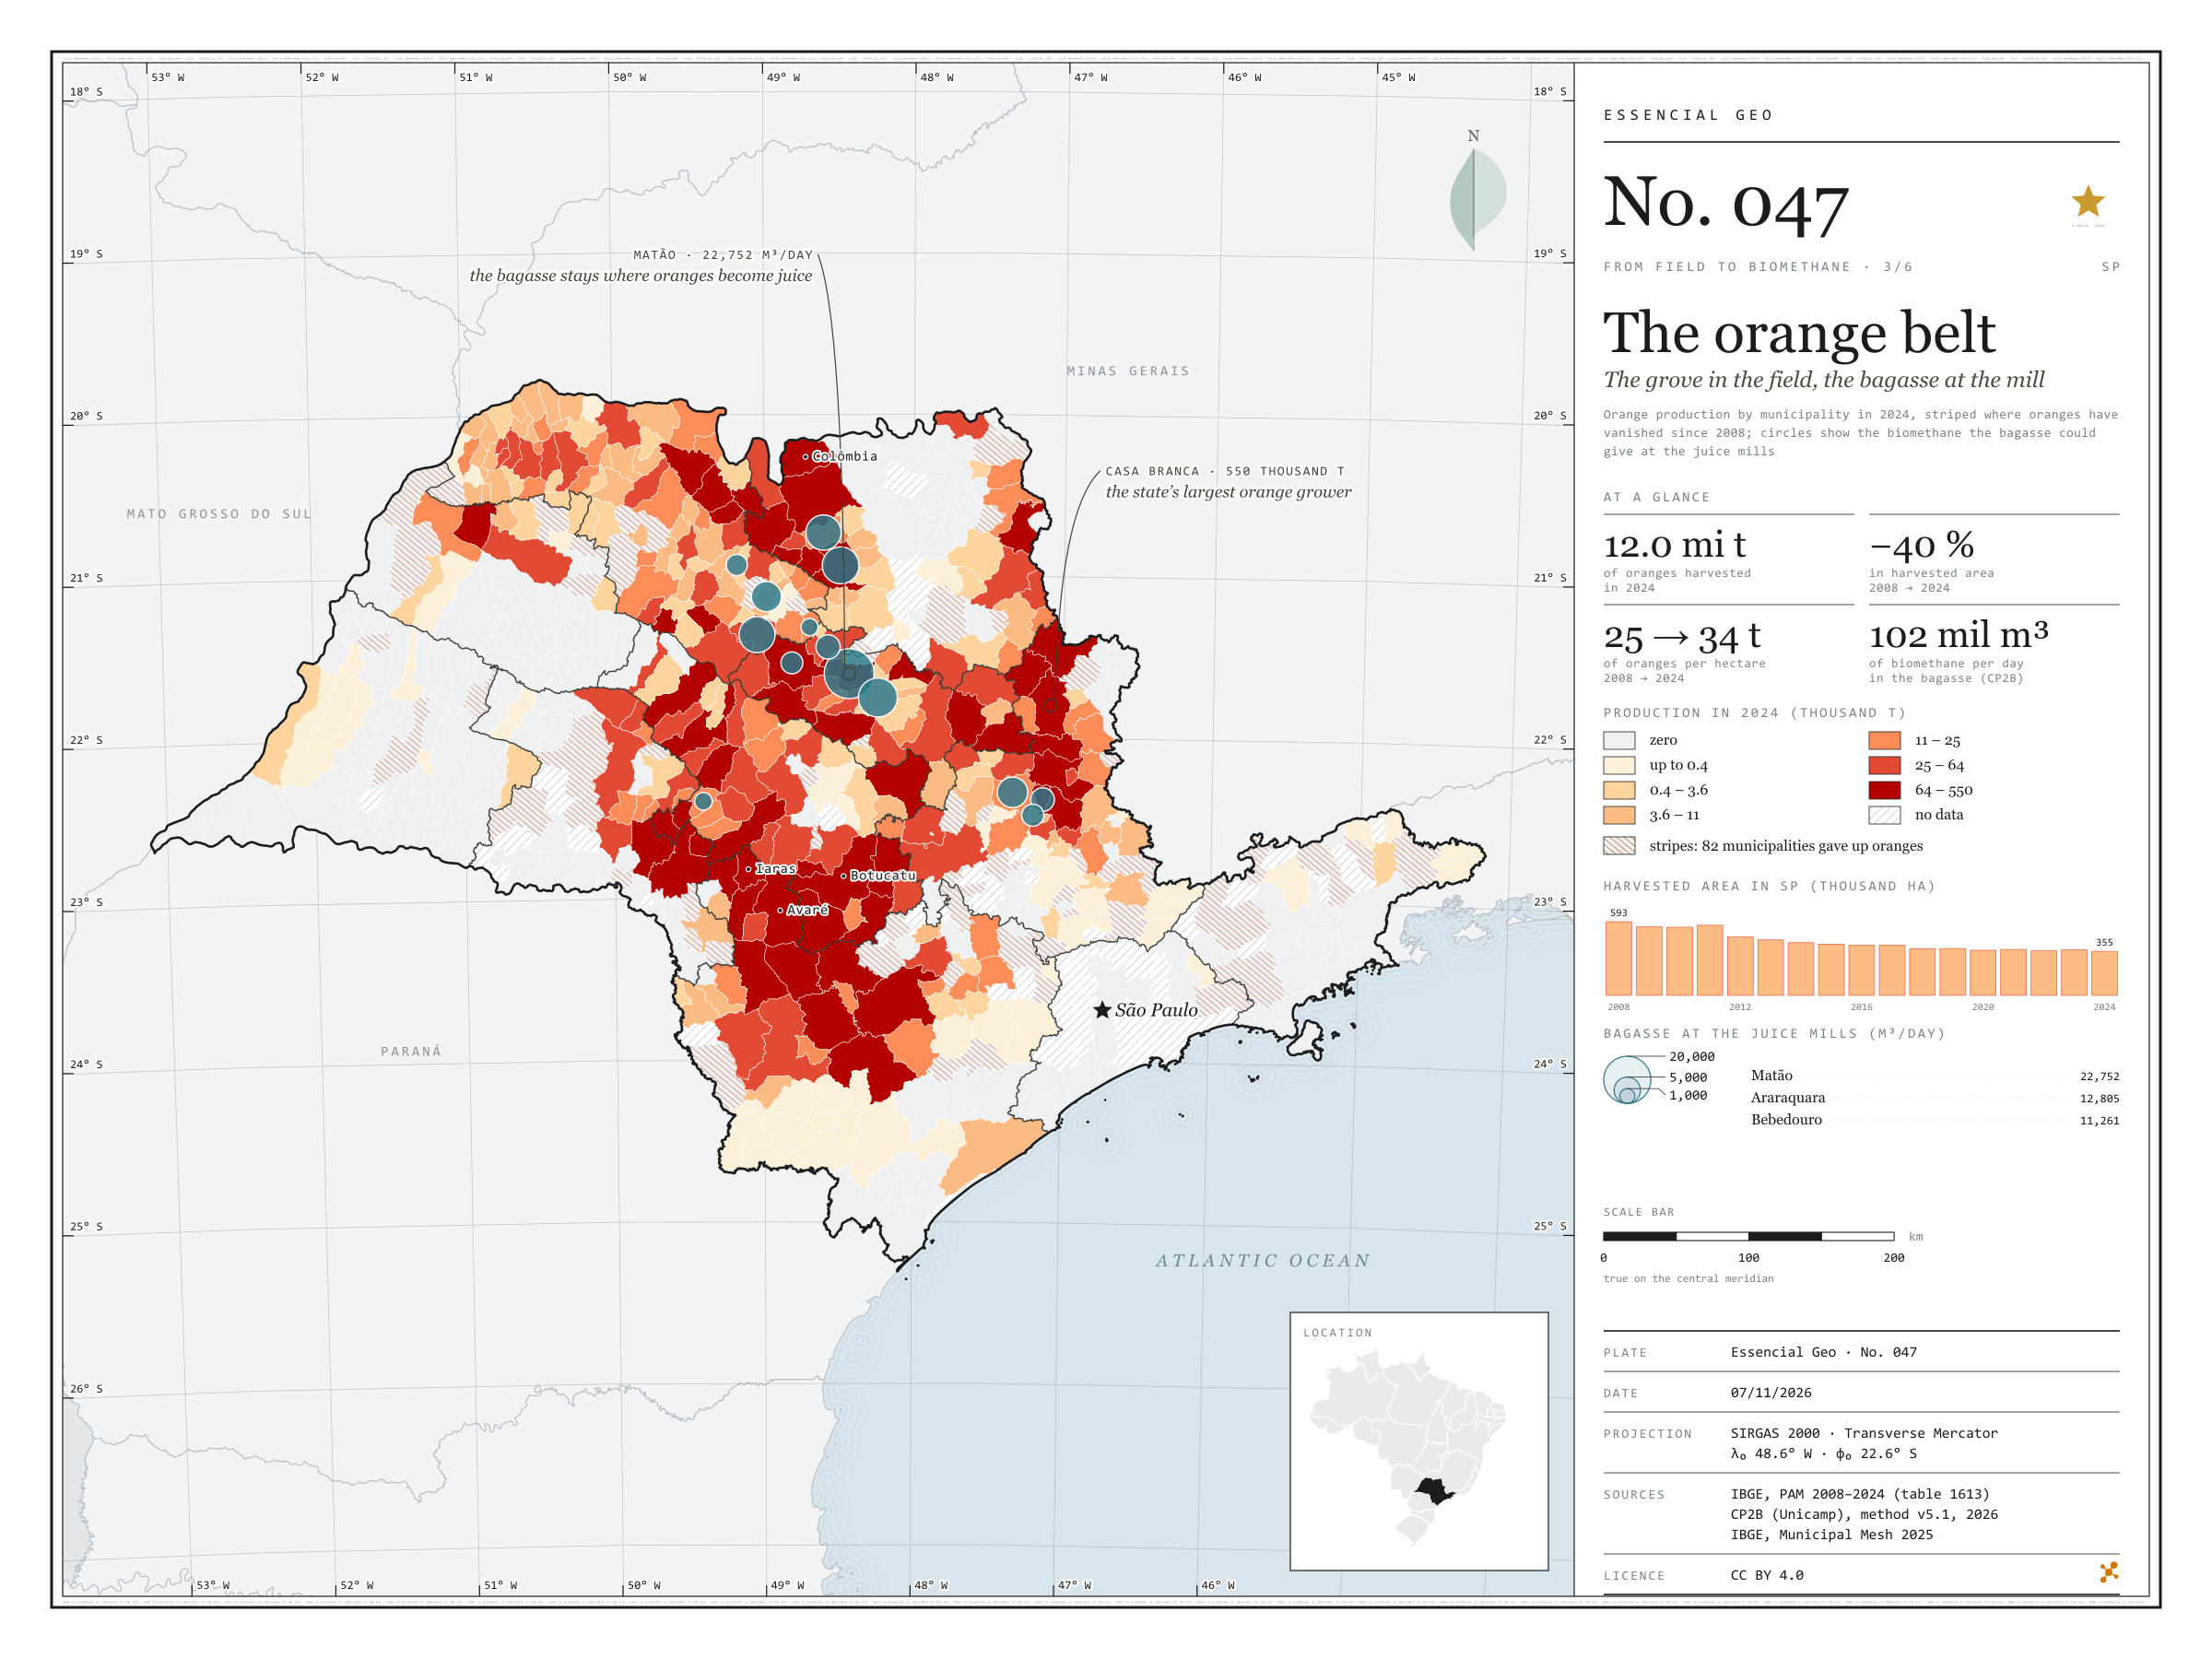
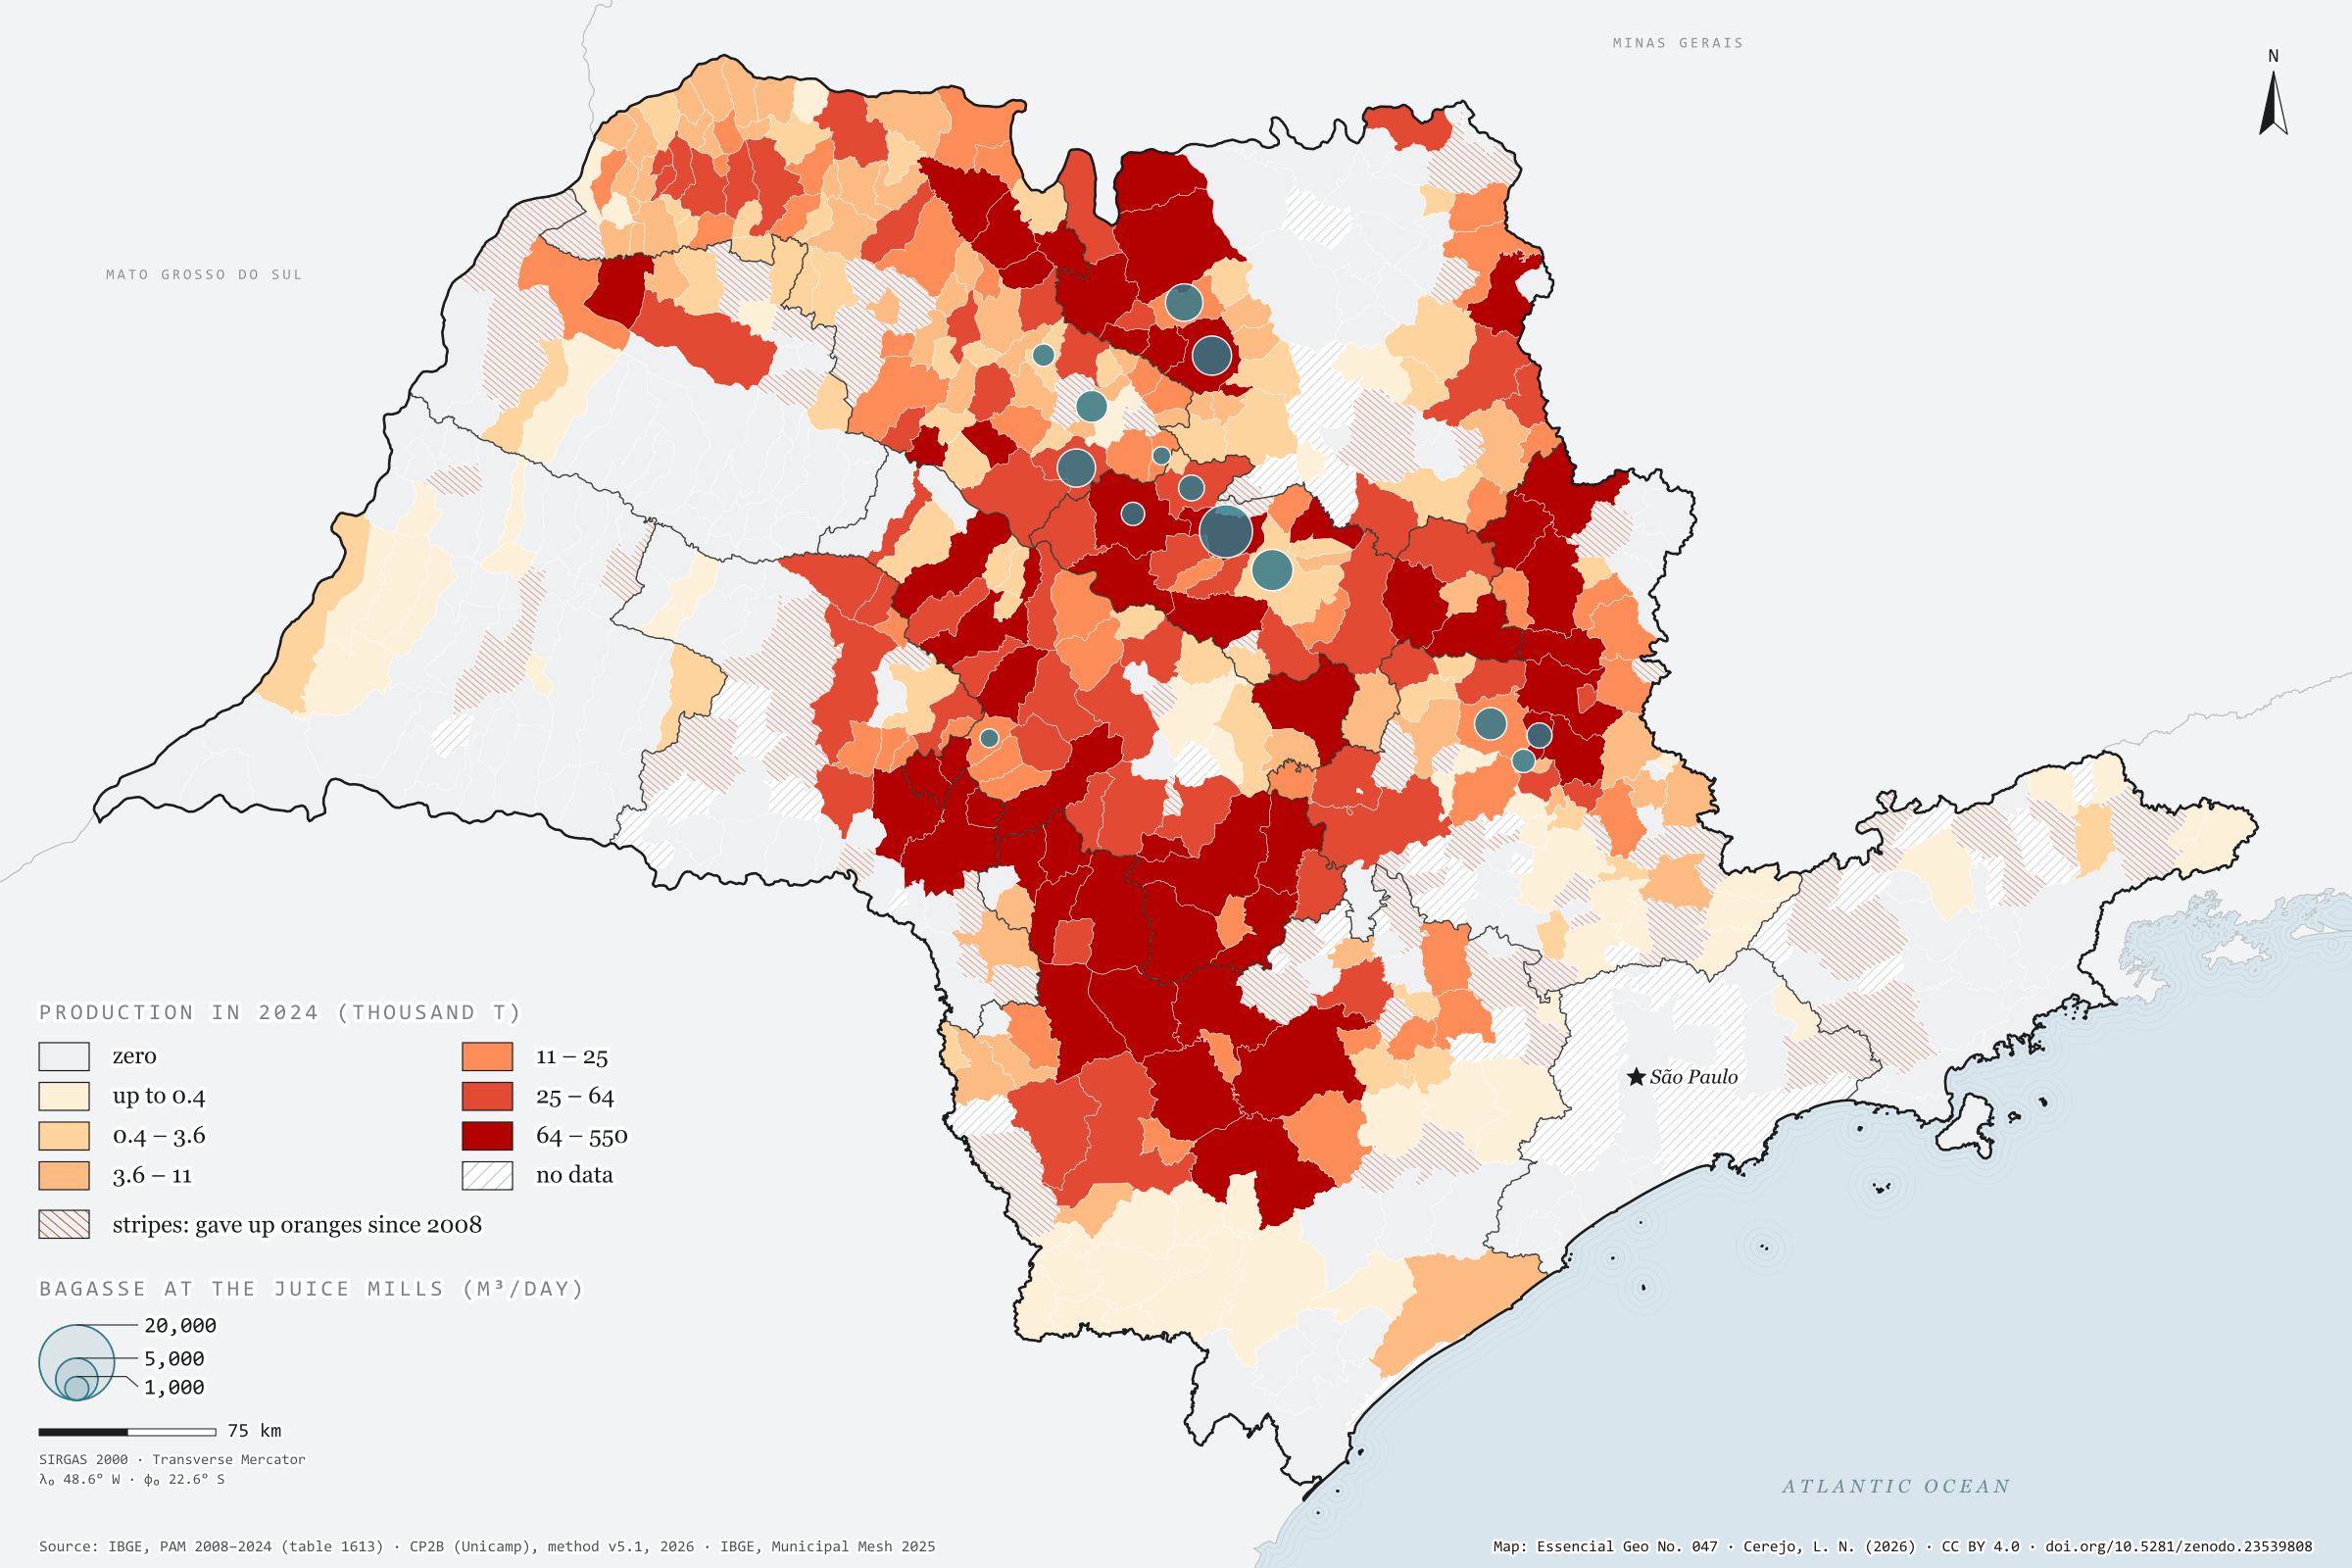
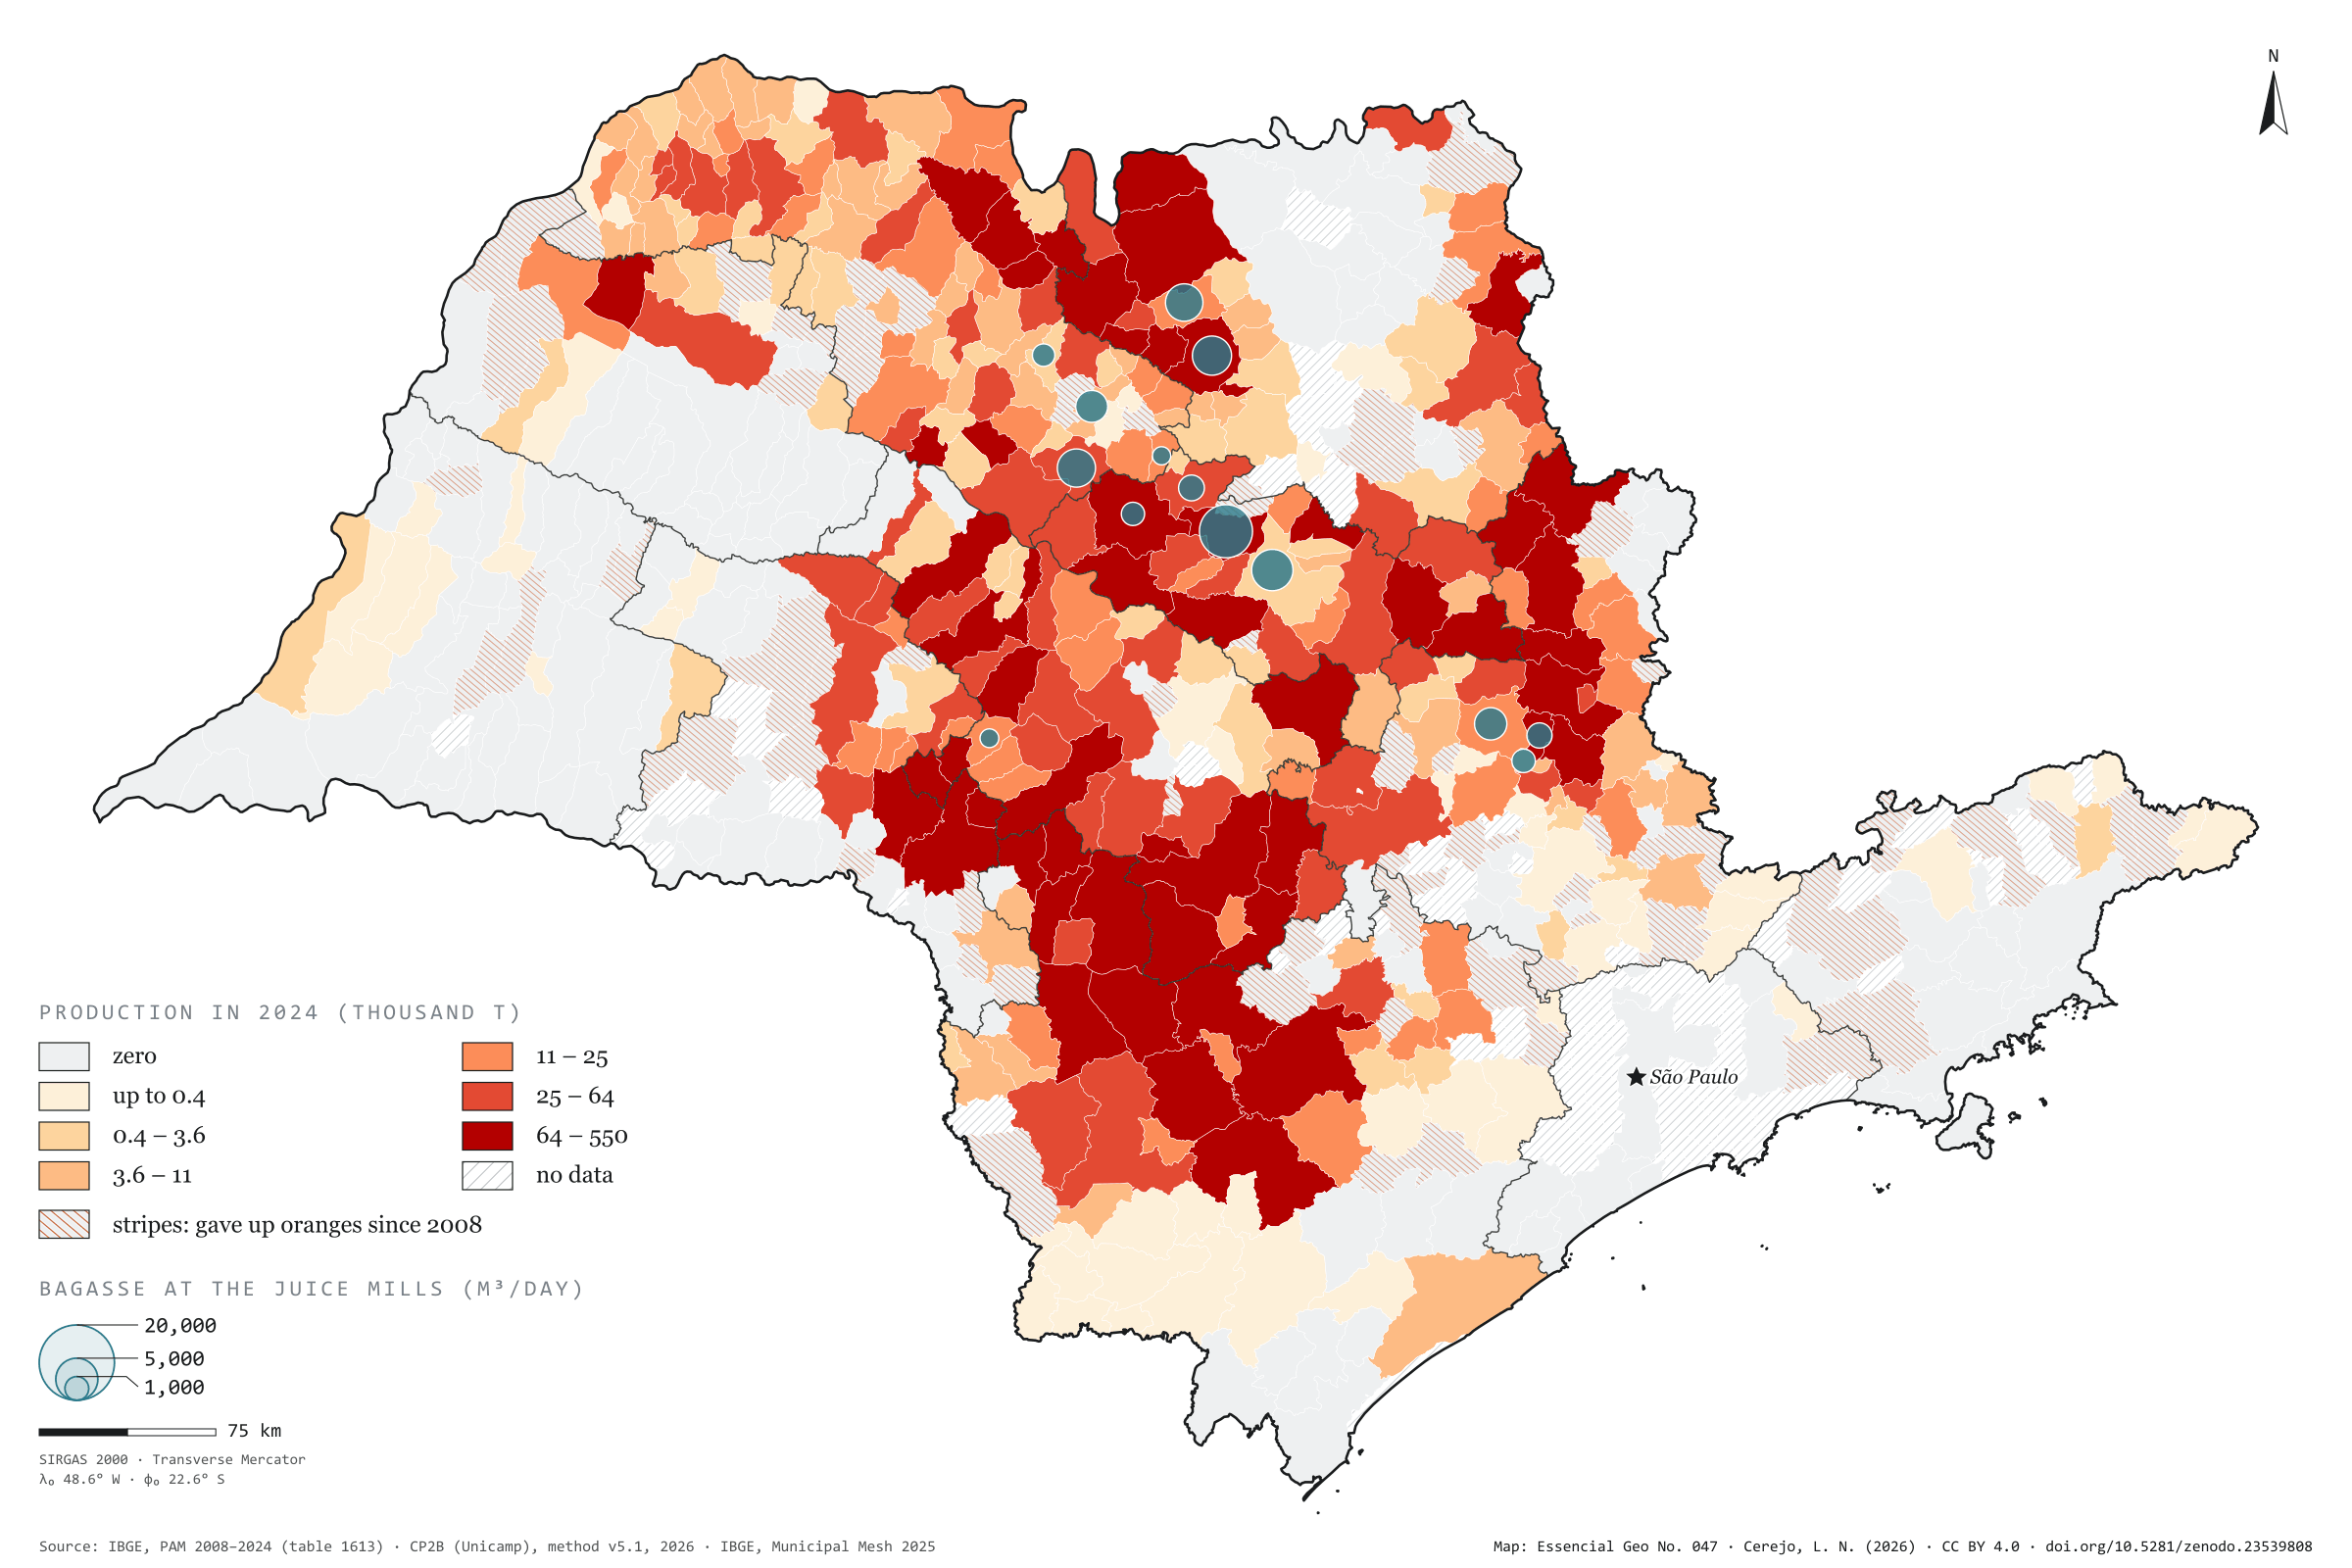
São Paulo harvested 12.0 million tonnes of oranges in 2024, from 354,562 hectares. In 2008 it was 14.5 million tonnes from 592,566 hectares: the area fell by 40%, and each hectare now gives 34 tonnes instead of 25. The belt has also moved south-west. The Araraquara region harvested 3.4 million tonnes and now harvests 1.2; the Sorocaba region rose from 1.0 to 2.4 million and is the state’s largest. Casa Branca leads, with 550,000 tonnes, followed by Botucatu and Avaré, and 82 municipalities have given up oranges. The bagasse, however, stays where the fruit becomes juice. The CP2B method places it in 14 municipalities with mills, and Matão, which harvests 108,000 tonnes, receives the largest potential: 22,752 m³ of biomethane a day, out of 101,834. Third plate of the collection “From field to biomethane”.
Technical record · downloads · citation
At a glance
Orange production in 2024
12,002,362t
In 2008 it was 14,537,610 t, harvested from 592,566 ha; in 2024, from 354,562 ha
Biomethane from orange bagasse
101,834m³/day
Accessible level of the CP2B method, reference scenario, in 14 municipalities with juice mills
Largest growers in 2024 (t)
Casa Branca550,000
Botucatu436,780
Avaré414,710
Iaras346,800
Colômbia337,621
Layers
bagaco_nas_fabricaspoint14 municipalities that receive the bagasse in the CP2B method, with the biomethane (m³/day)
municipiospolygon645 municipalities: harvested area and orange production in 2008 and 2024, share of territory, whether oranges were given up, and bagasse biomethane
regioes_intermediariaspolygon11 intermediate geographic regions
Orange production from PAM 2024 by municipality in six quantile classes; stripes where there was harvested area in 2008 and none in 2024; circles with the bagasse biomethane potential at the accessible level of the CP2B method, allocated to the juice mills.
The map without a frame, with legend, scale, reference system and credit written on it: ready for papers, lectures and slides. In two versions: with the basemap (neighbours and sea) or only the mapped area, on white.
CEREJO, Lucas Nakamura. O cinturão da laranja: o pomar no campo, o bagaço na fábrica. Versão 1.0.0. [S. l.]: Zenodo, 2026. Conjunto de dados. DOI: 10.5281/zenodo.23539808. Disponível em: https://doi.org/10.5281/zenodo.23539808. Acesso em: 10 nov. 2026.
Cerejo, L. N. (2026). O cinturão da laranja: o pomar no campo, o bagaço na fábrica [The orange belt: The grove in the field, the bagasse at the mill] (Version 1.0.0) [Data set]. Zenodo. https://doi.org/10.5281/zenodo.23539808
@dataset{cerejo2026_laranja_sp,
  author    = {Cerejo, Lucas Nakamura},
  title     = {O cinturão da laranja: O pomar no campo, o bagaço na fábrica},
  year      = {2026},
  publisher = {Zenodo},
  version   = {1.0.0},
  doi       = {10.5281/zenodo.23539808},
  url       = {https://doi.org/10.5281/zenodo.23539808},
  language  = {portuguese},
  note      = {English title: The orange belt: The grove in the field, the bagasse at the mill. Licence CC BY 4.0}
}
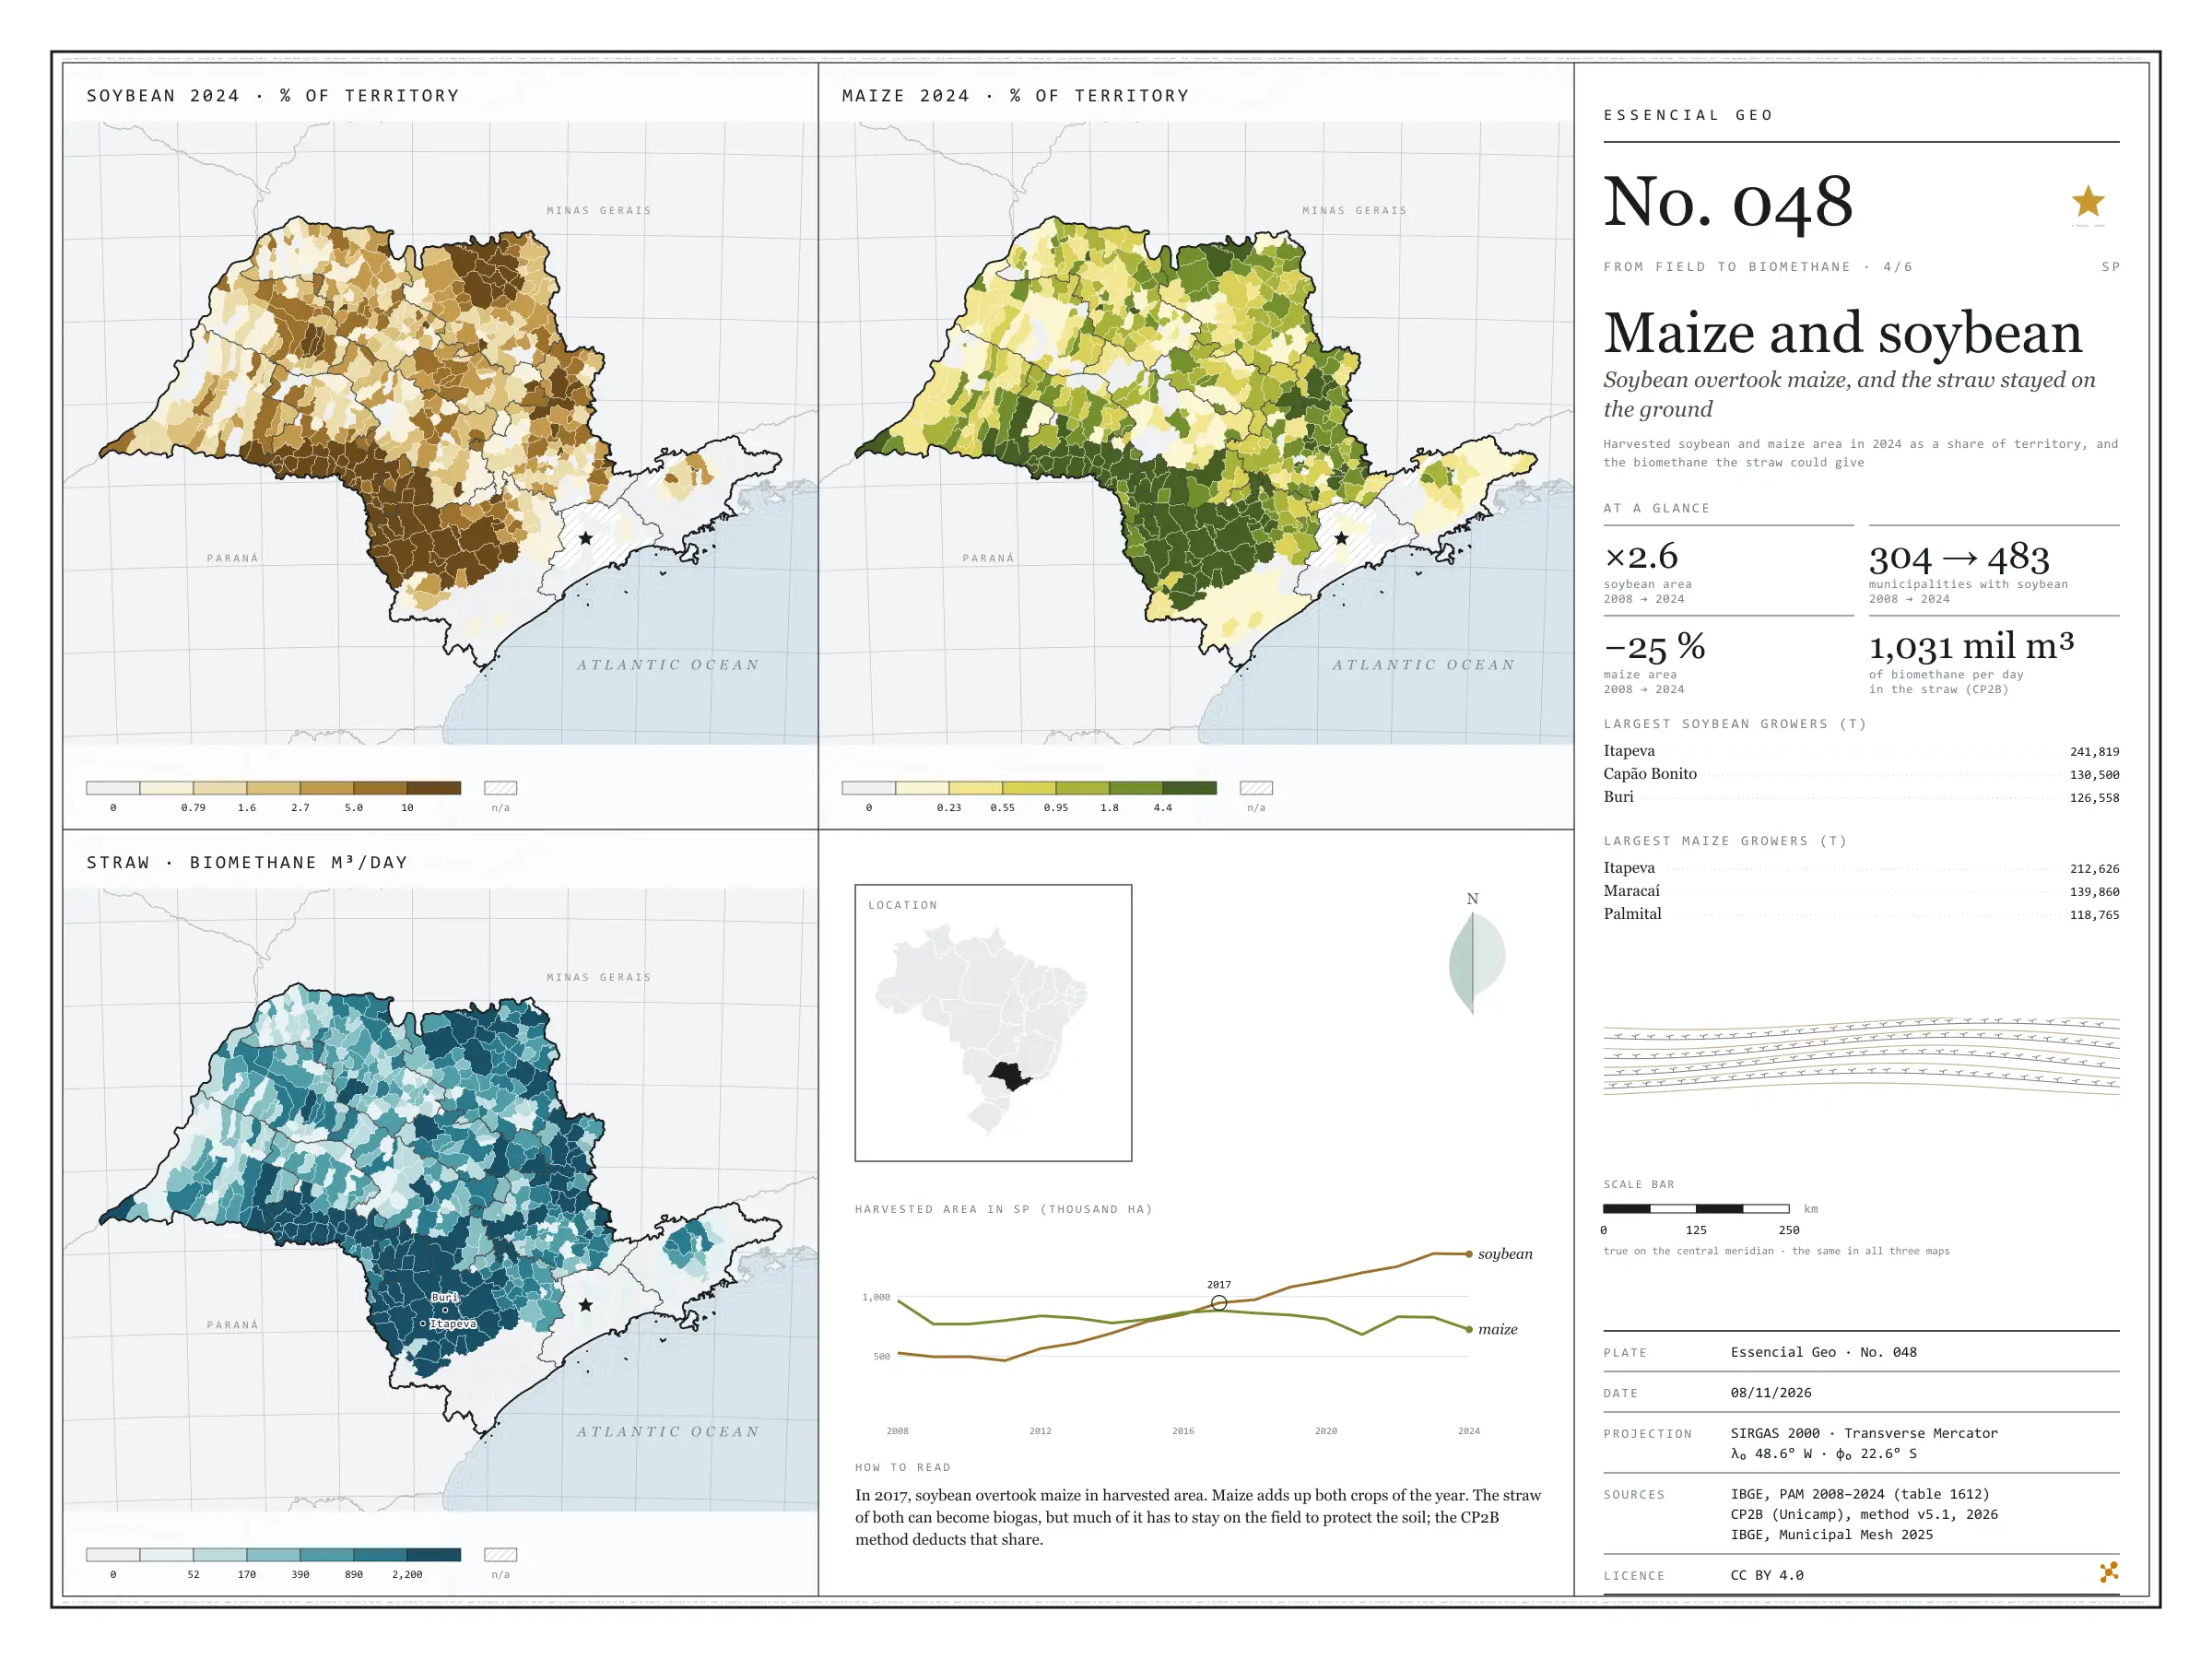
Soybean overtook maize, and the straw stayed on the ground
Fig. 048São Paulo state (SP)EPSG:4674Source: IBGE, CP2B (Unicamp)
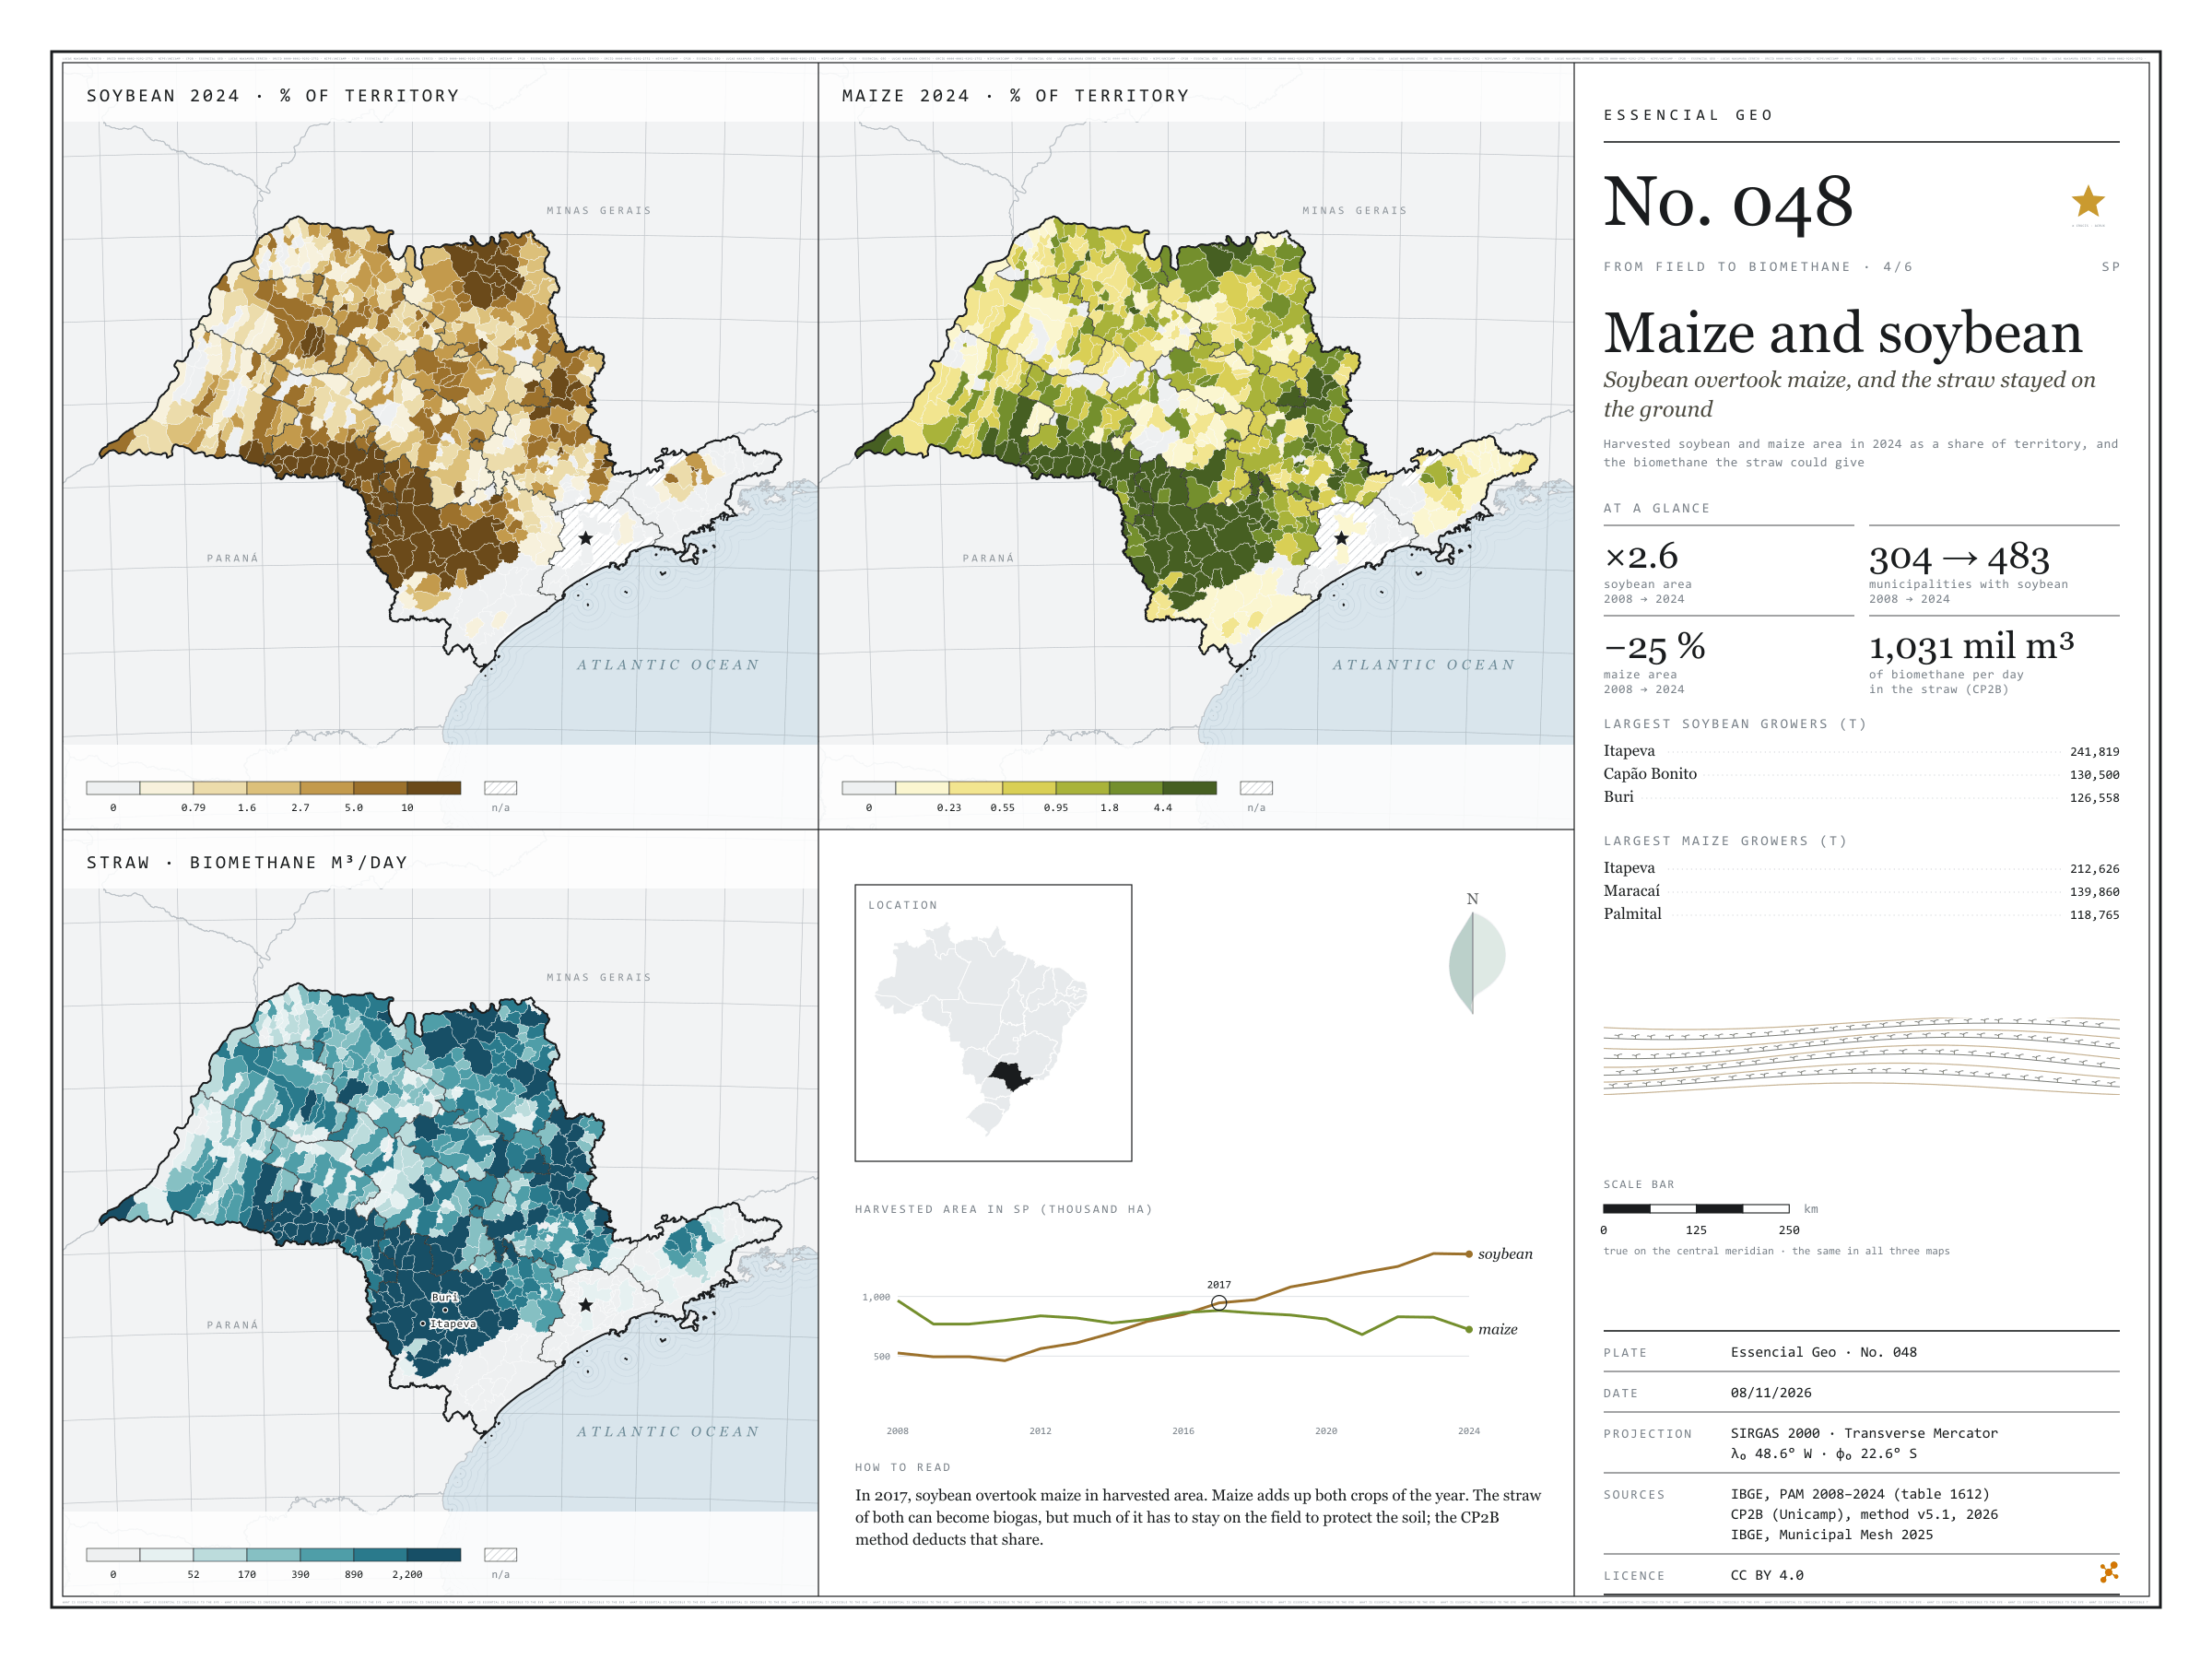
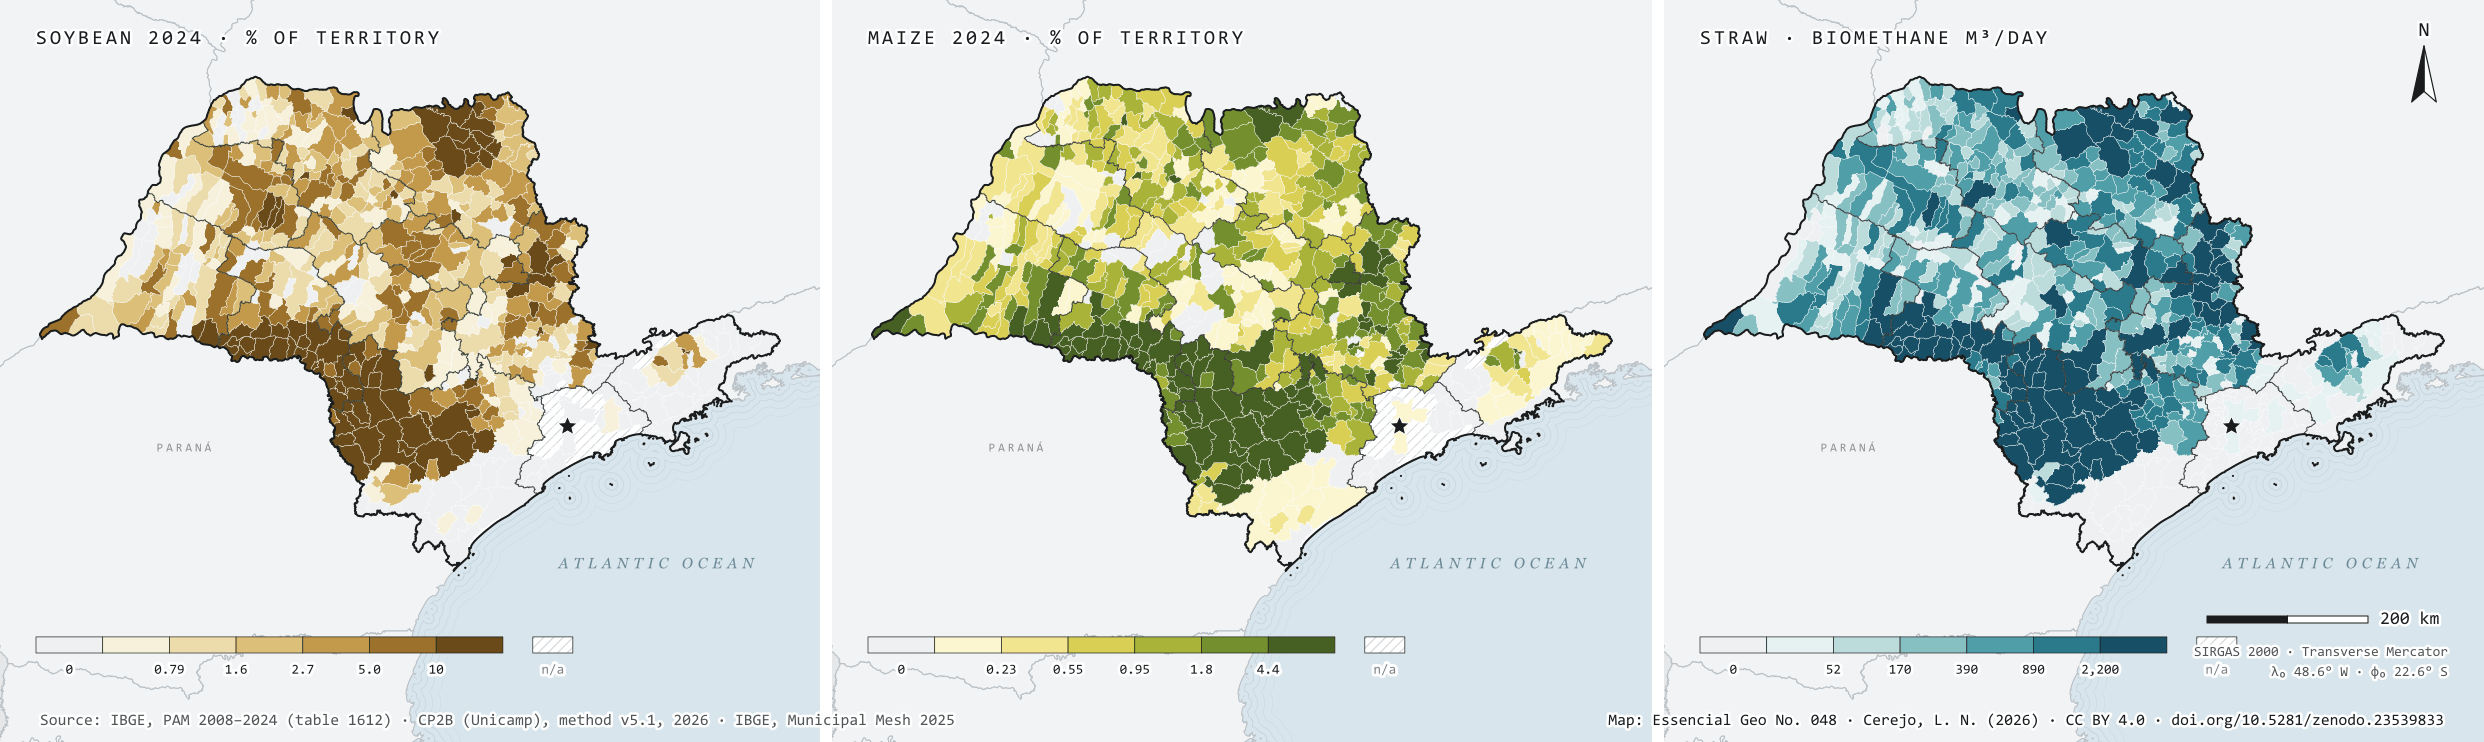
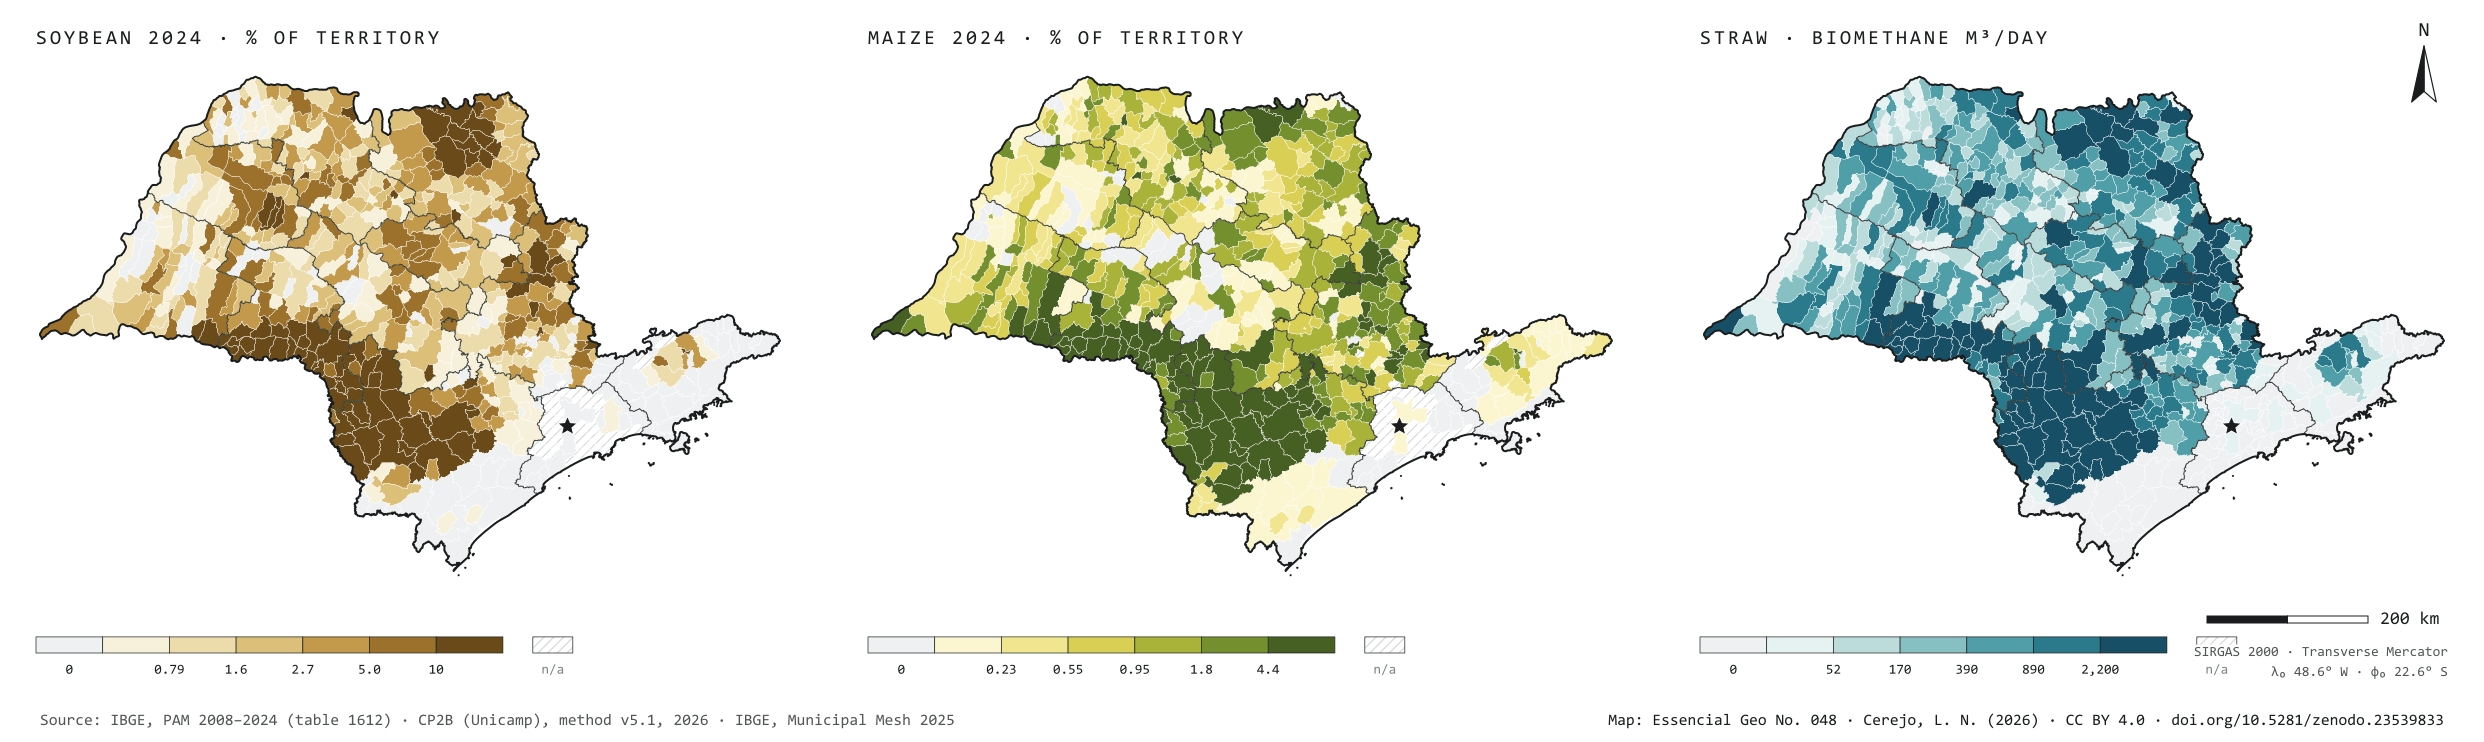
In 2008, São Paulo harvested 525,940 hectares of soybean and 965,907 of maize. In 2024, 1.36 million hectares of soybean, 2.6 times more, and 723,128 of maize, 25% less; soybean overtook maize in 2017. It spread from 304 to 483 municipalities and grew above all in the south of the state. In the Sorocaba region the area went from 82,000 to 468,000 hectares, and Itapeva is the largest grower of both grains. In Ibirarema and Salto Grande, harvested soybean covers almost two thirds of the municipality. The straw of both grains could give 1.03 million m³ of biomethane a day under the CP2B method, 41% of it in the Sorocaba region. That is what remains after leaving on the field the share that protects the soil. Fourth plate of the collection “From field to biomethane”.
Technical record · downloads · citation
At a glance
Harvested soybean area in 2024
1,355,595ha
It was 525,940 ha in 2008; maize fell from 965,907 to 723,128 ha
Biomethane from maize and soybean straw
1,031,325m³/day
Accessible level of the CP2B method, reference scenario: 528,467 from maize and 502,858 from soybean
Largest soybean growers in 2024 (t)
Itapeva241,819
Capão Bonito130,500
Buri126,558
Itaberá103,650
Itapetininga99,000
Layers
municipiospolygon645 municipalities: harvested area and production of soybean and maize in 2008 and 2024, share of territory in 2024 (%) and straw biomethane (m³/day)
regioes_intermediariaspolygon11 intermediate geographic regions
Harvested soybean and maize area from PAM 2024 divided by municipal area, in six quantile classes; straw biomethane potential at the accessible level of the CP2B method, in six quantile classes.
The map without a frame, with legend, scale, reference system and credit written on it: ready for papers, lectures and slides. In two versions: with the basemap (neighbours and sea) or only the mapped area, on white.
CEREJO, Lucas Nakamura. Milho e soja: a soja passou o milho, e a palha ficou no chão. Versão 1.0.0. [S. l.]: Zenodo, 2026. Conjunto de dados. DOI: 10.5281/zenodo.23539833. Disponível em: https://doi.org/10.5281/zenodo.23539833. Acesso em: 10 nov. 2026.
Cerejo, L. N. (2026). Milho e soja: a soja passou o milho, e a palha ficou no chão [Maize and soybean: Soybean overtook maize, and the straw stayed on the ground] (Version 1.0.0) [Data set]. Zenodo. https://doi.org/10.5281/zenodo.23539833
@dataset{cerejo2026_milho_e_soja_sp,
  author    = {Cerejo, Lucas Nakamura},
  title     = {Milho e soja: A soja passou o milho, e a palha ficou no chão},
  year      = {2026},
  publisher = {Zenodo},
  version   = {1.0.0},
  doi       = {10.5281/zenodo.23539833},
  url       = {https://doi.org/10.5281/zenodo.23539833},
  language  = {portuguese},
  note      = {English title: Maize and soybean: Soybean overtook maize, and the straw stayed on the ground. Licence CC BY 4.0}
}
Fig. 049São Paulo state (SP)EPSG:4674Source: CP2B (Unicamp), ANA, IBGE
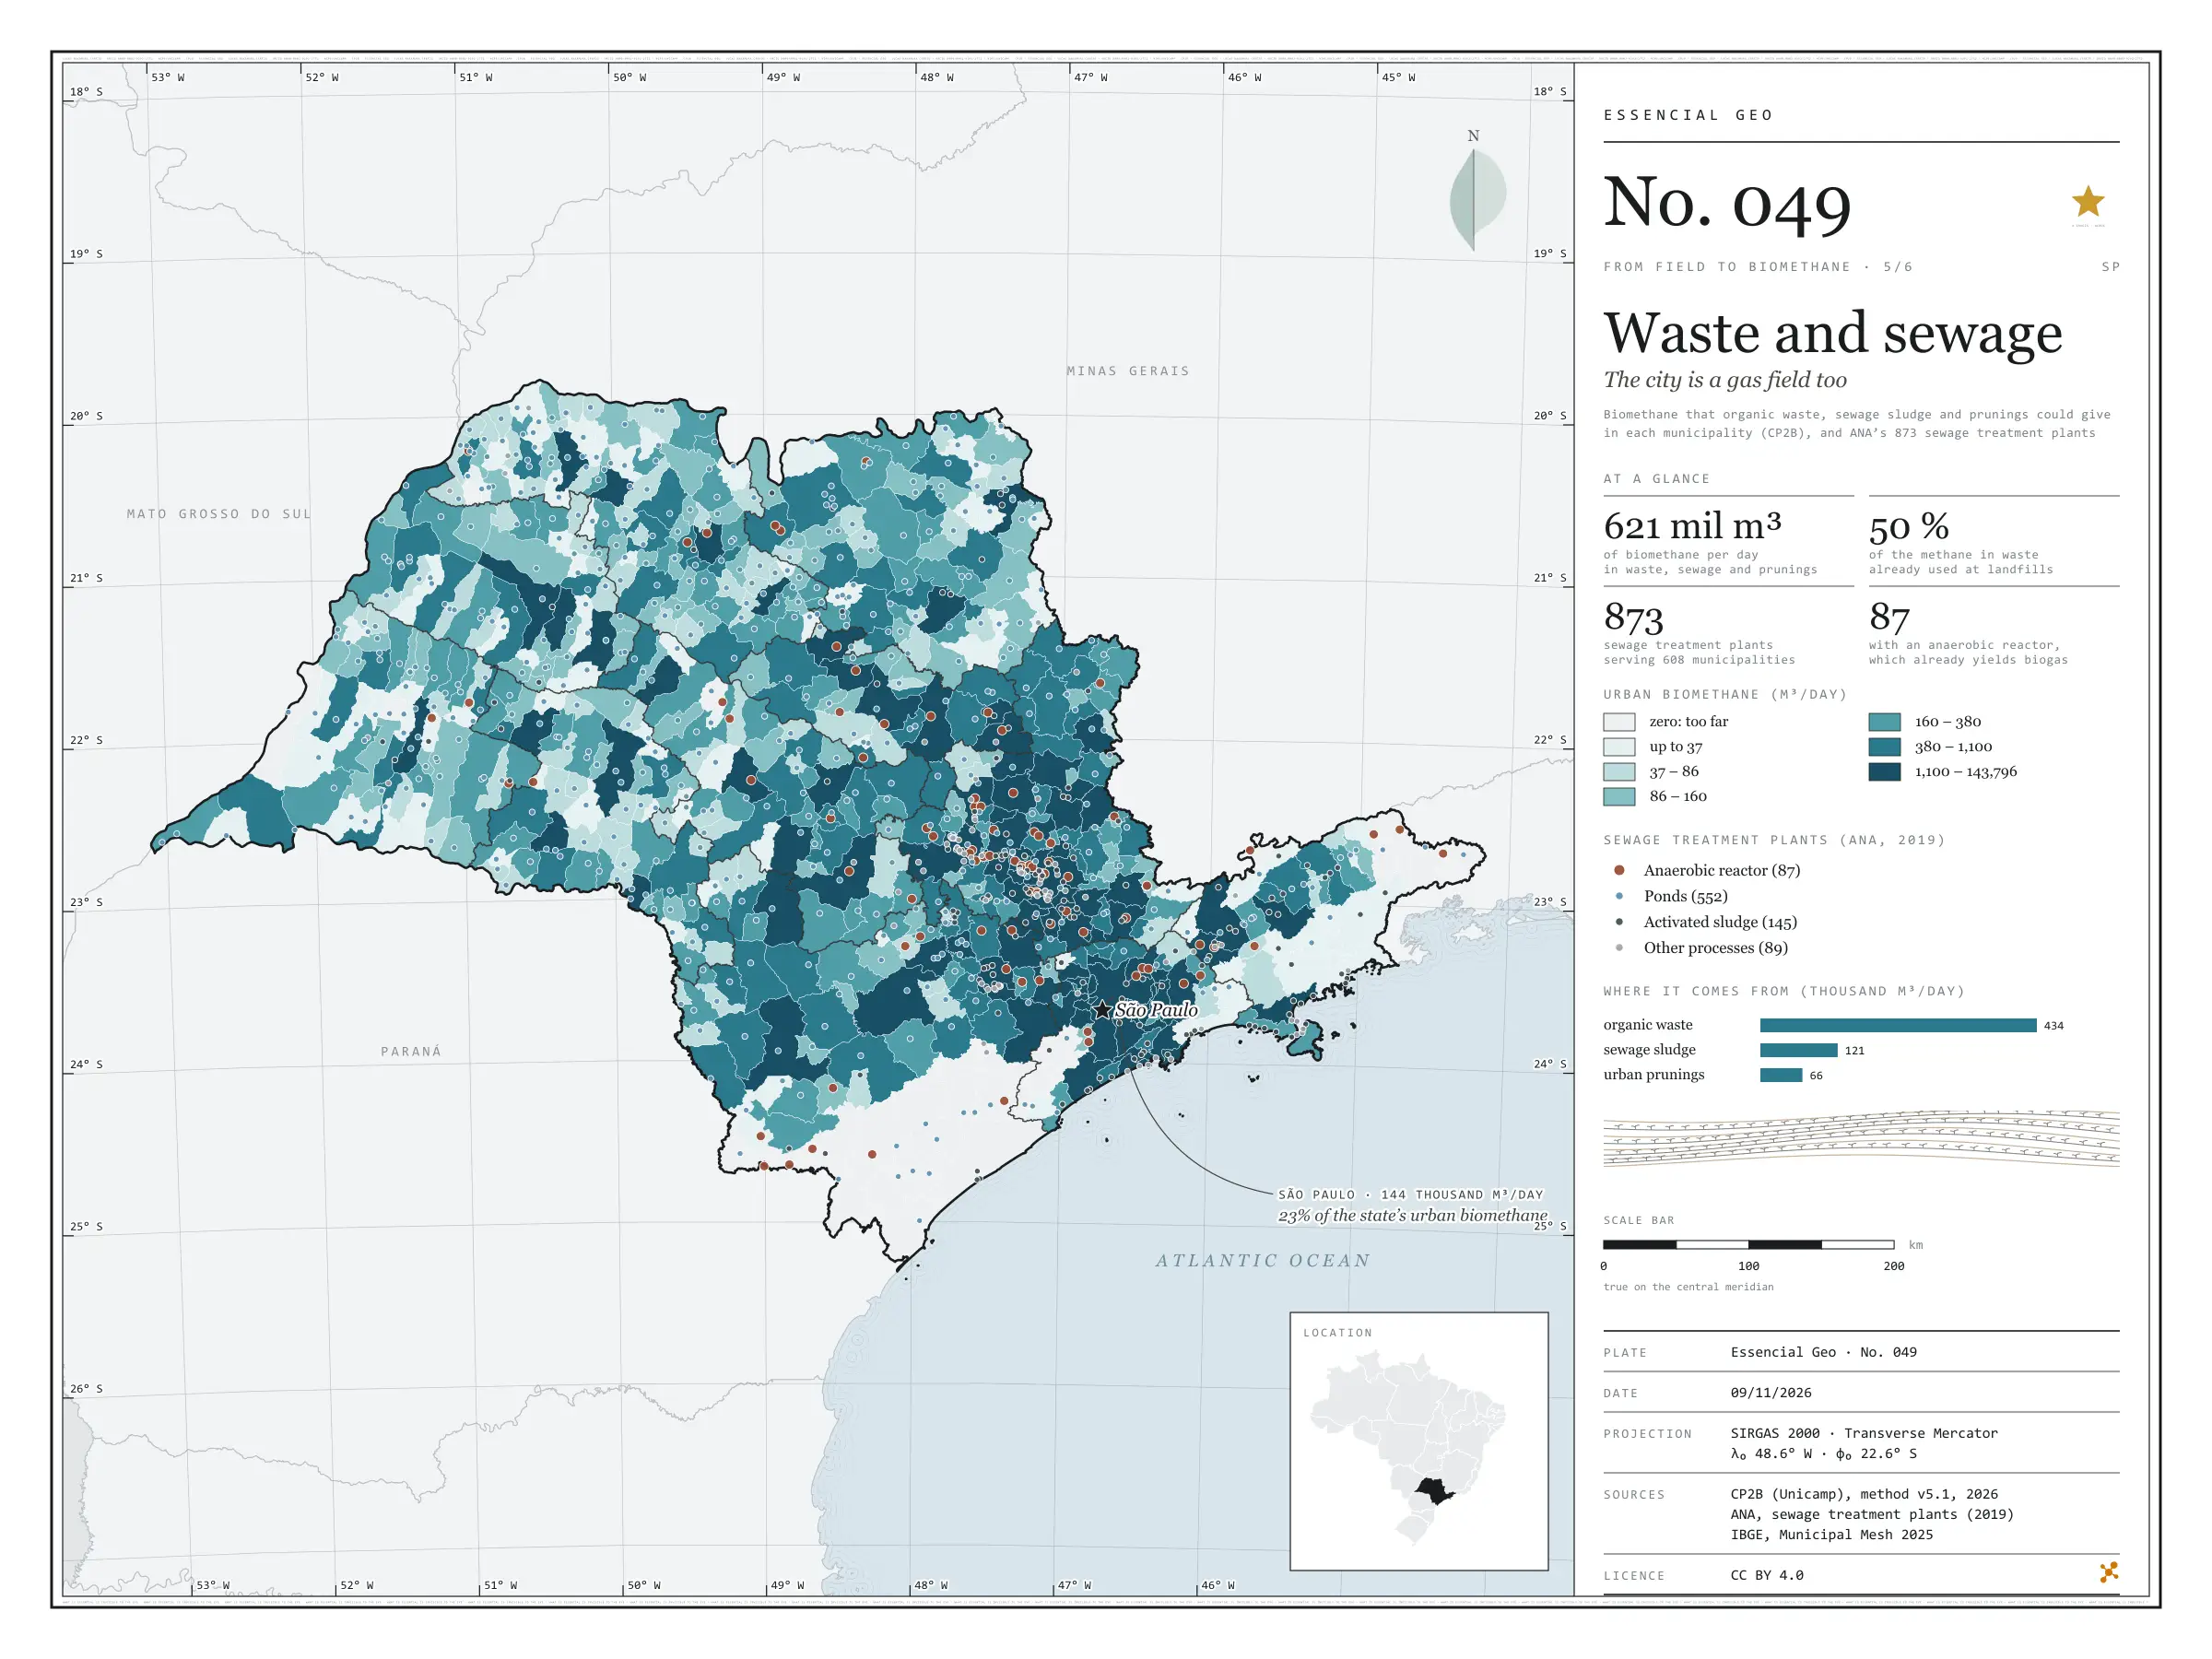
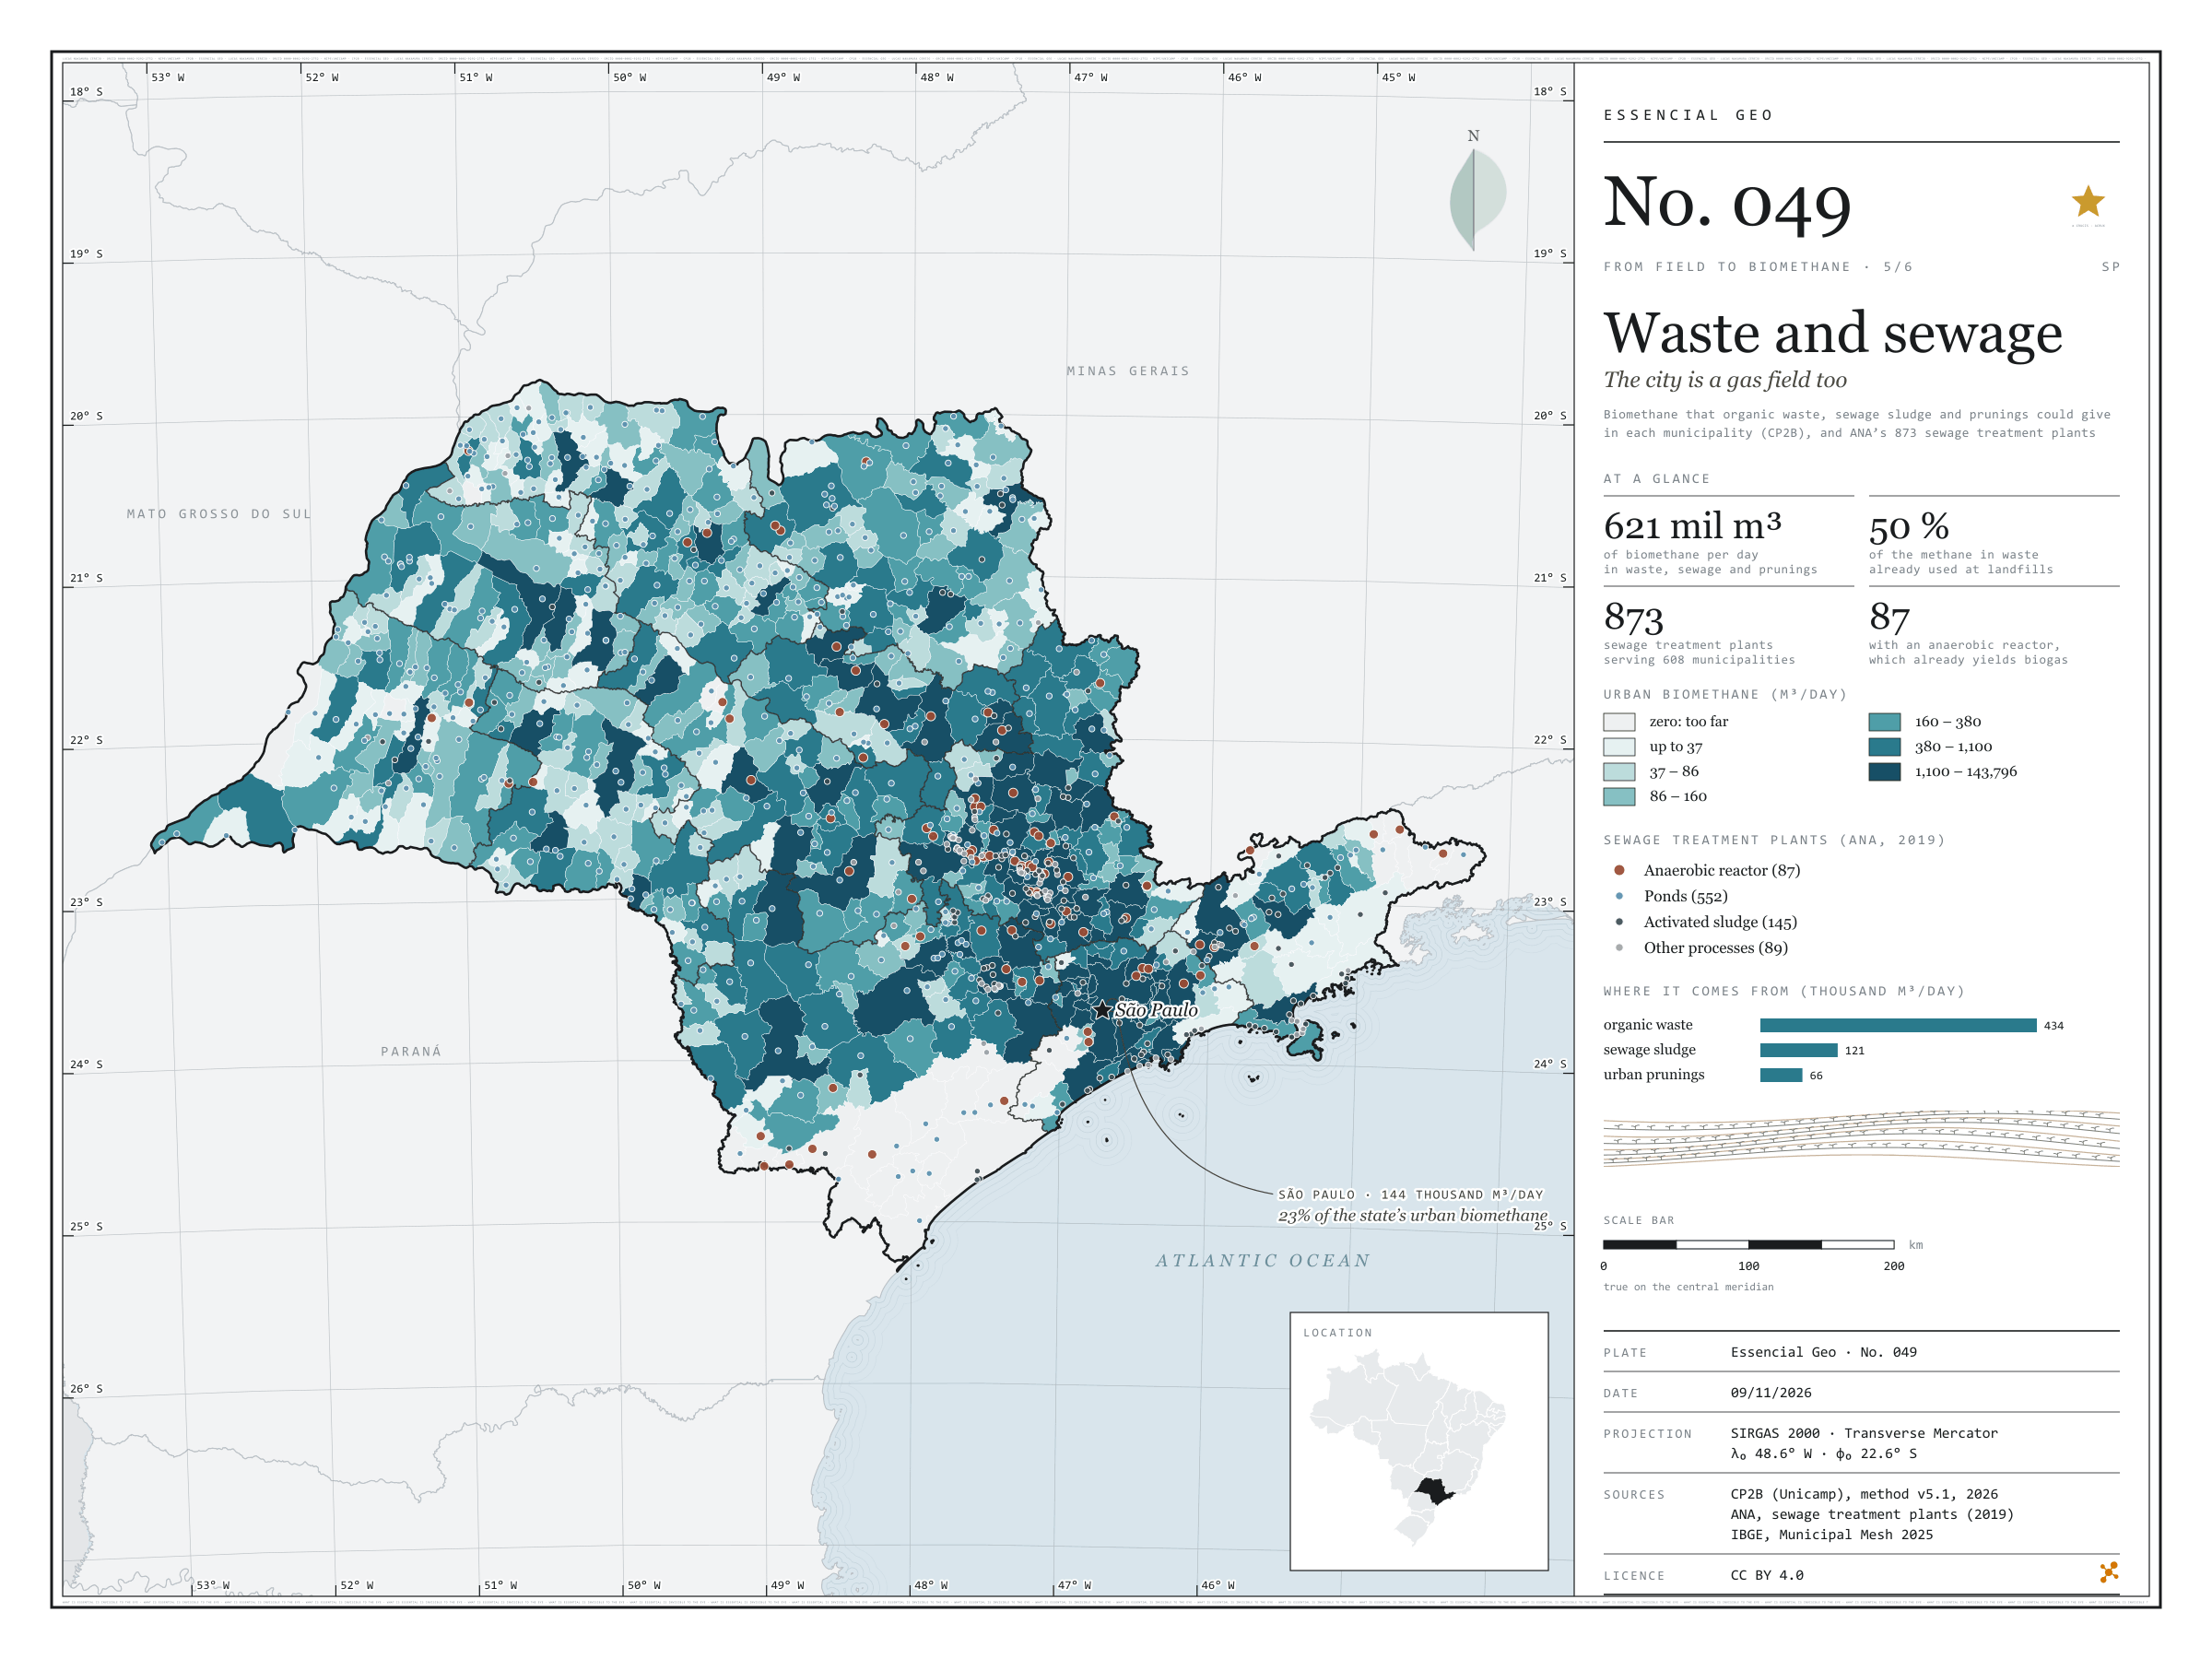
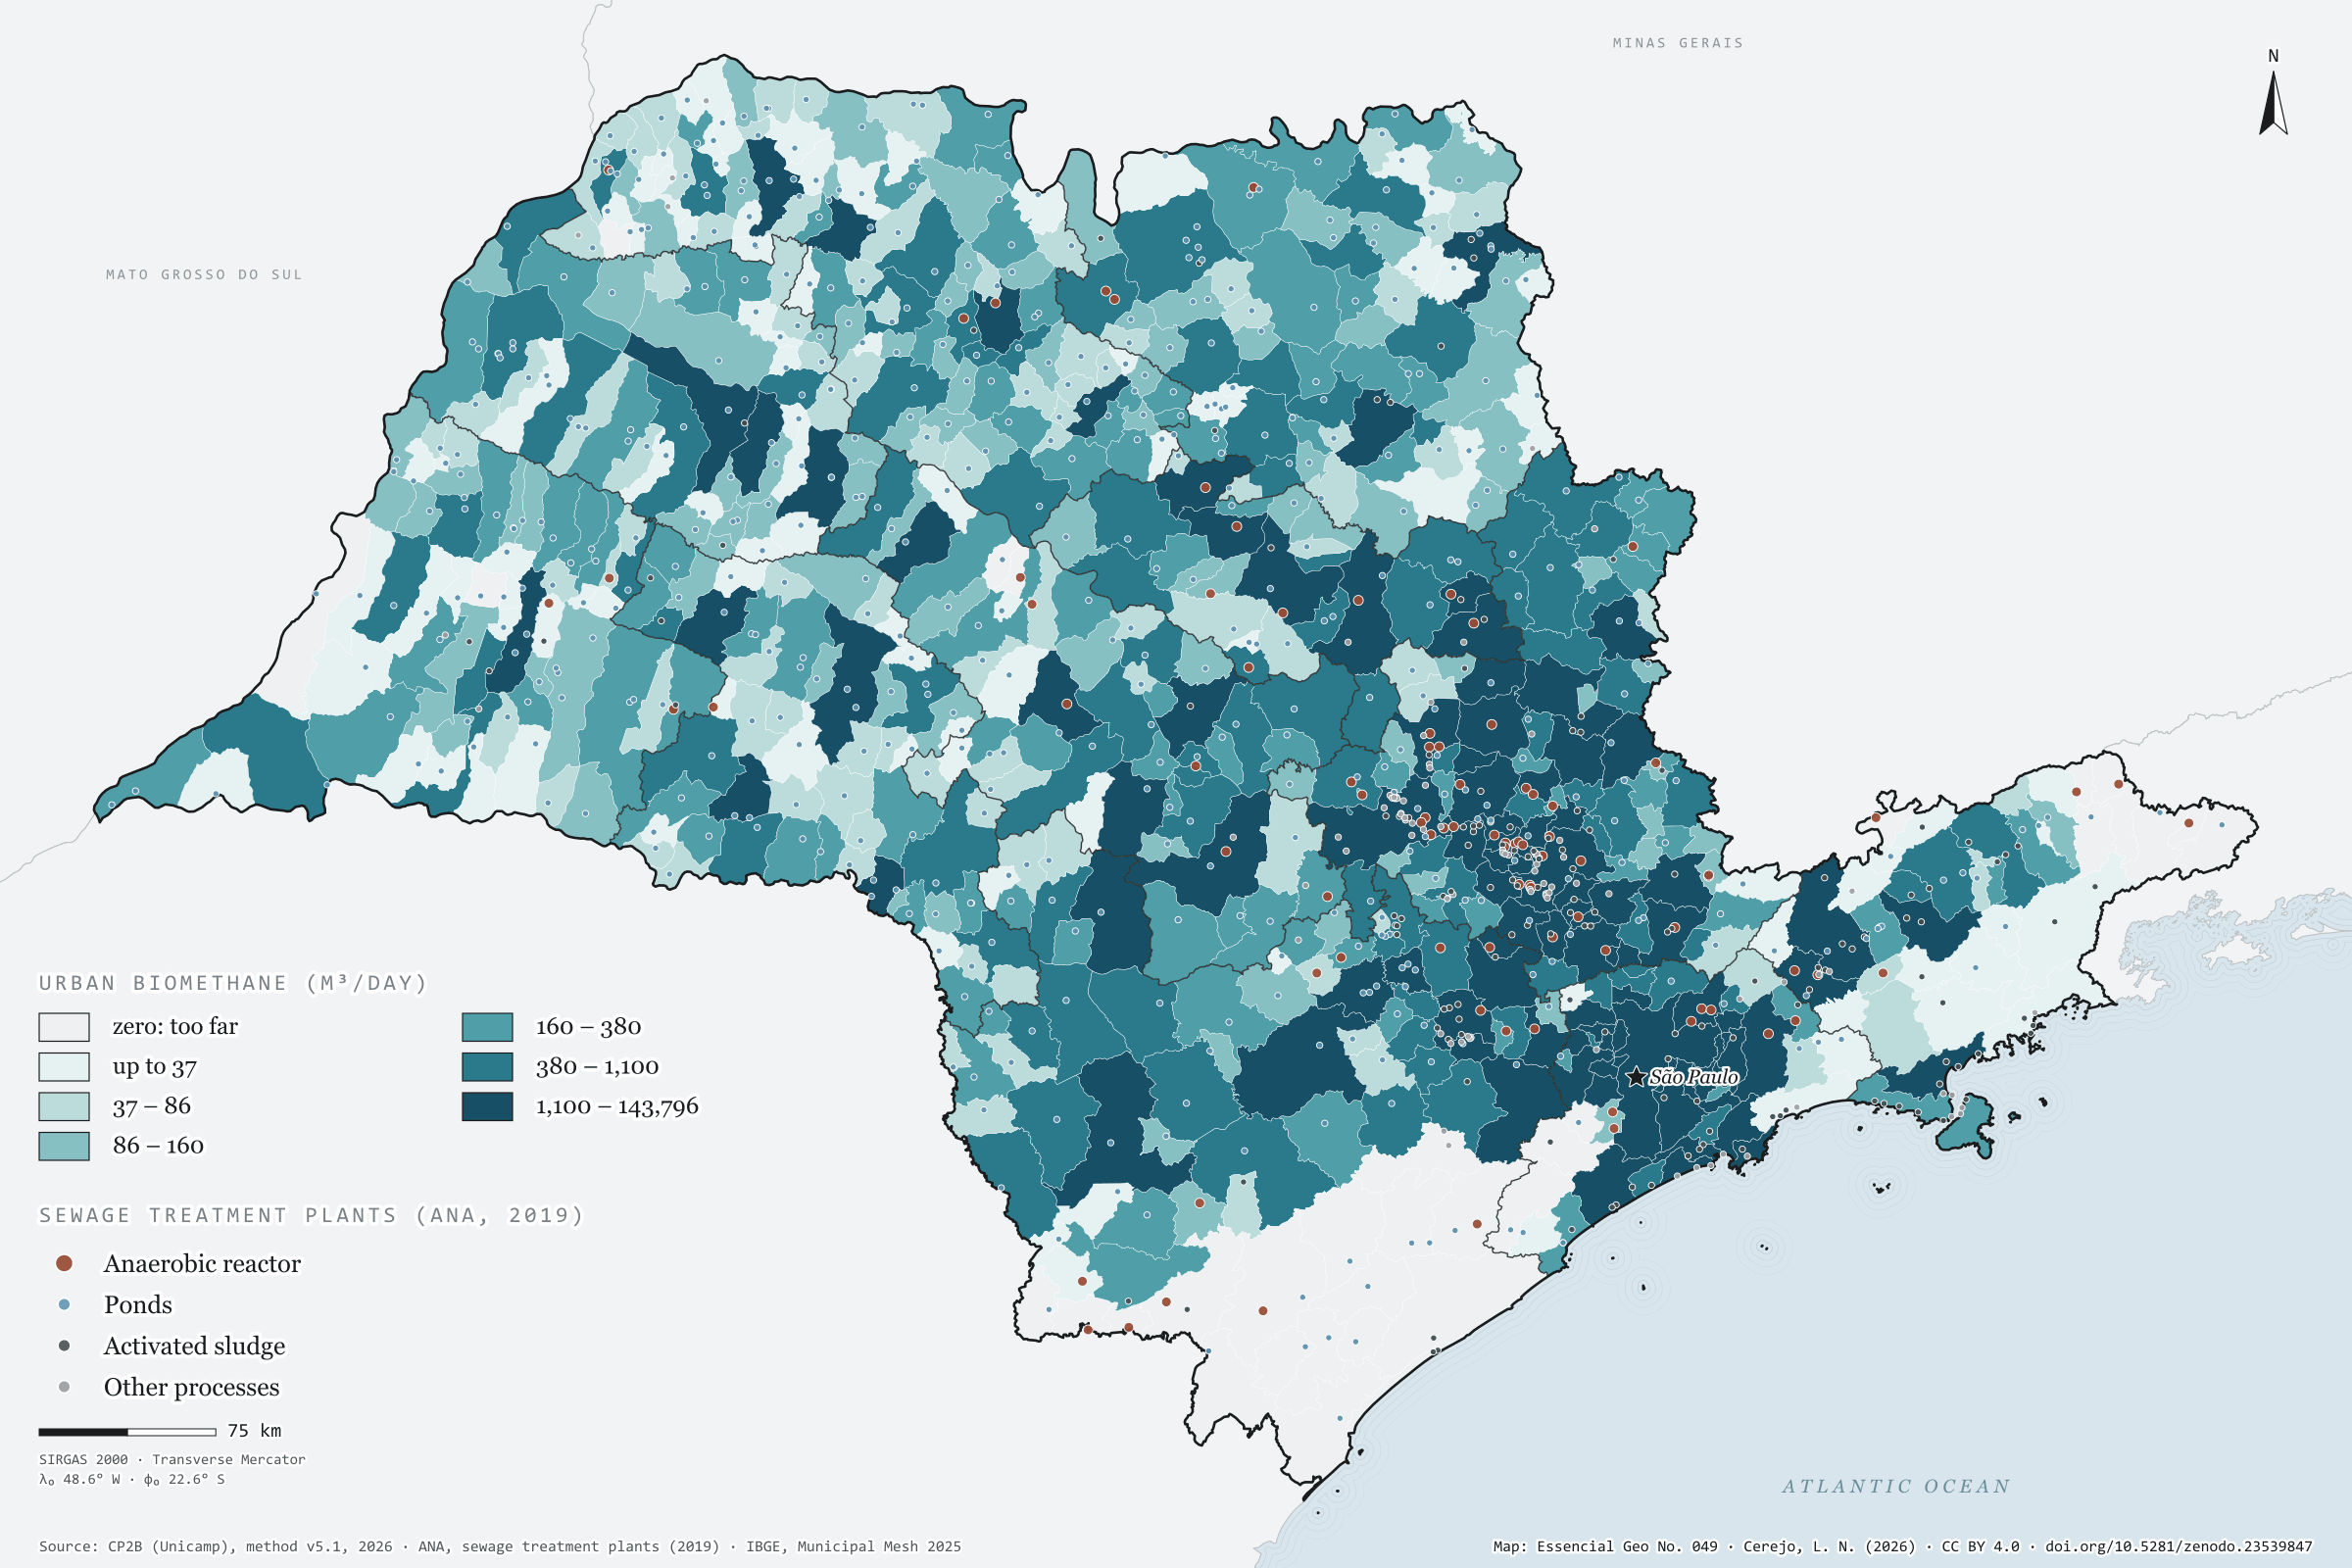
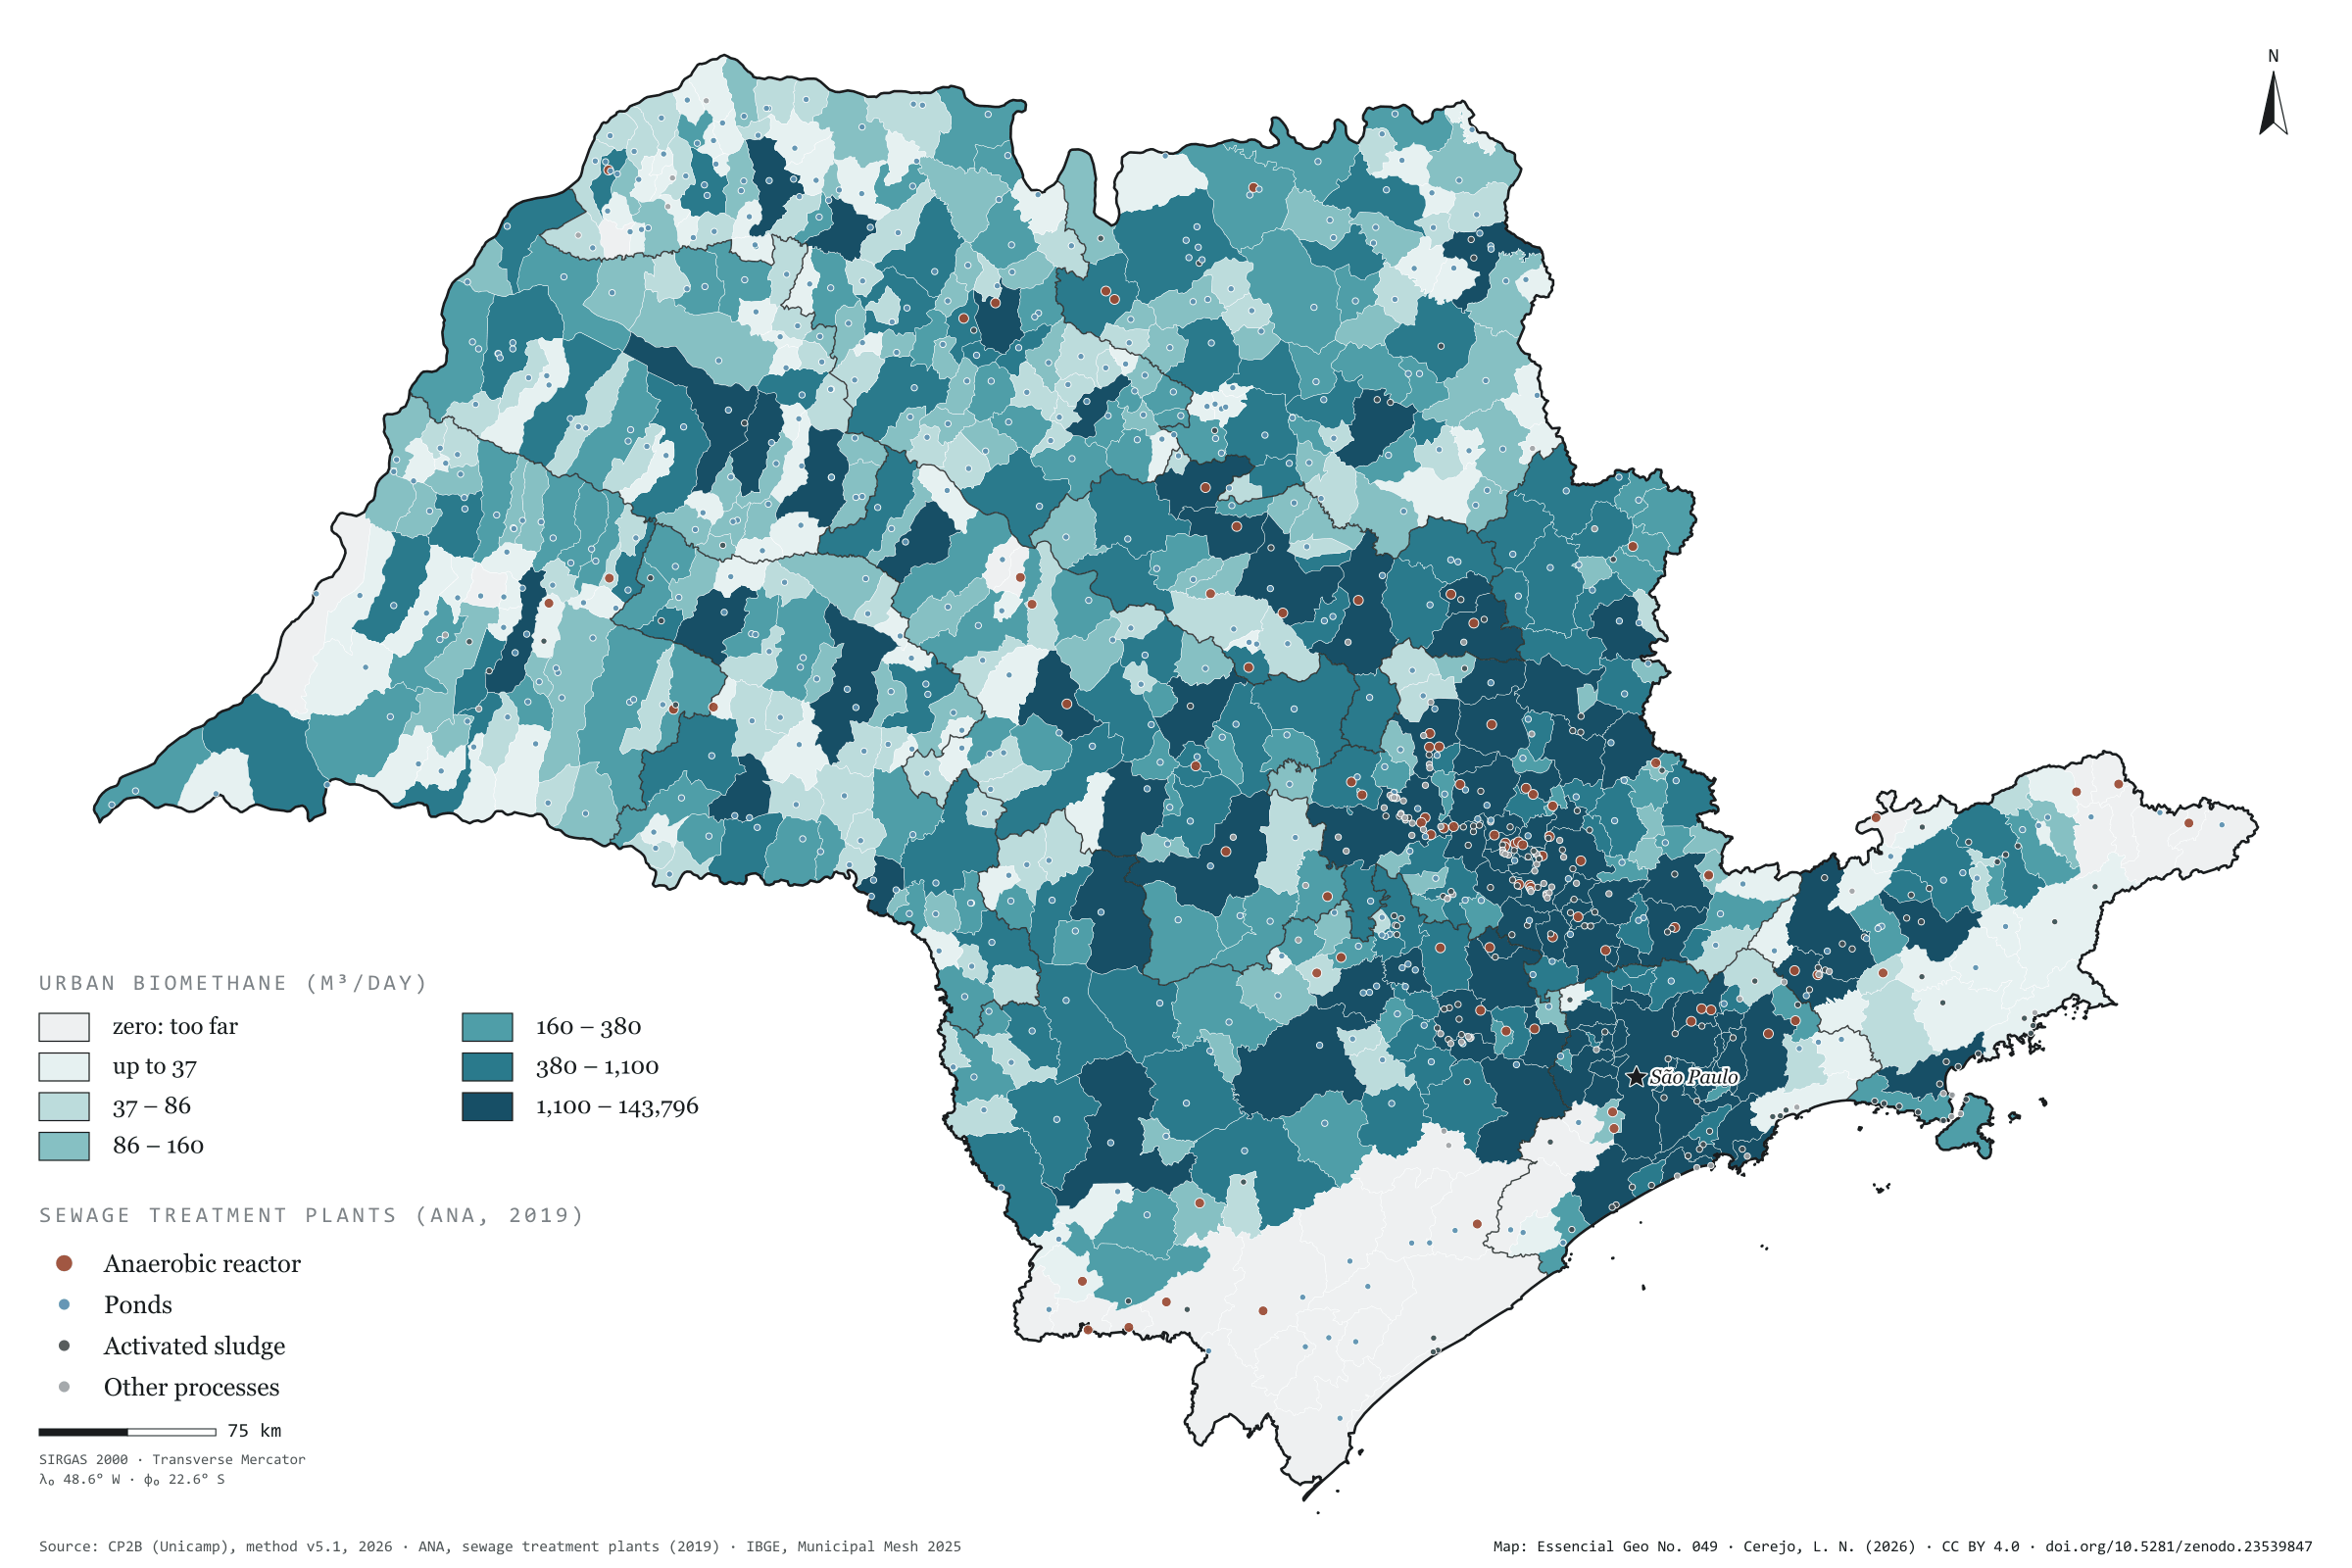
The organic waste, sewage sludge and prunings of São Paulo’s towns and cities could give 621,000 m³ of biomethane a day under the CP2B method: 434,000 from waste, 121,000 from sludge and 66,000 from prunings. That is little next to the countryside, under 4% of the state total, but it lies where almost everyone lives. The city of São Paulo accounts for 23% and its region for 39%. Half the methane the waste could generate is already captured at landfills, and the method deducts that share. The map also shows the 873 sewage treatment plants registered by ANA, serving 608 municipalities. Most treat sewage in ponds (552); 87 use anaerobic reactors, which produce biogas during treatment. Fifth plate of the collection “From field to biomethane”.
Technical record · downloads · citation
At a glance
Where urban biomethane comes from (m³/day)
Organic waste69.8%
Sewage sludge19.5%
Urban prunings10.6%
Waste methane already used
446,934m³ CH₄/day
50% of the 889,450 m³ of methane a day that organic waste could generate, deducted by the method
Largest urban potentials (m³/day)
São Paulo143,796
Campinas28,064
Sorocaba18,094
Piracicaba12,561
São José do Rio Preto12,338
Layers
etespoint873 sewage treatment plants: name, status, process, family, BOD removal and municipalities served
municipiospolygon645 municipalities: biomethane from waste, sludge and prunings (m³/day) and waste methane already used at landfills
regioes_intermediariaspolygon11 intermediate geographic regions
limite_estadualpolygonState boundary
Metadata
Sources
CP2B (Unicamp) — biogas and biomethane potential by municipality, method v5.1 (2026) ANA — Sewage treatment plants (2019 database) (2019) IBGE — Municipal Mesh 2025 (2025)
Biomethane potential of organic waste, sewage sludge and urban prunings at the accessible level of the CP2B method, by municipality, in six quantile classes; ANA sewage treatment plants, one per code, coloured by process family.
The map without a frame, with legend, scale, reference system and credit written on it: ready for papers, lectures and slides. In two versions: with the basemap (neighbours and sea) or only the mapped area, on white.
CEREJO, Lucas Nakamura. Lixo e esgoto: a cidade também é lavoura de gás. Versão 1.0.0. [S. l.]: Zenodo, 2026. Conjunto de dados. DOI: 10.5281/zenodo.23539847. Disponível em: https://doi.org/10.5281/zenodo.23539847. Acesso em: 10 nov. 2026.
Cerejo, L. N. (2026). Lixo e esgoto: a cidade também é lavoura de gás [Waste and sewage: The city is a gas crop too] (Version 1.0.0) [Data set]. Zenodo. https://doi.org/10.5281/zenodo.23539847
@dataset{cerejo2026_lixo_e_esgoto_sp,
  author    = {Cerejo, Lucas Nakamura},
  title     = {Lixo e esgoto: A cidade também é lavoura de gás},
  year      = {2026},
  publisher = {Zenodo},
  version   = {1.0.0},
  doi       = {10.5281/zenodo.23539847},
  url       = {https://doi.org/10.5281/zenodo.23539847},
  language  = {portuguese},
  note      = {English title: Waste and sewage: The city is a gas crop too. Licence CC BY 4.0}
}