Skip to content
Essencial

No. 046 Land use From field to biomethane 2/5

Cane: 2008 × 2024

In sixteen years, the patch moved west

Record, downloads and citation
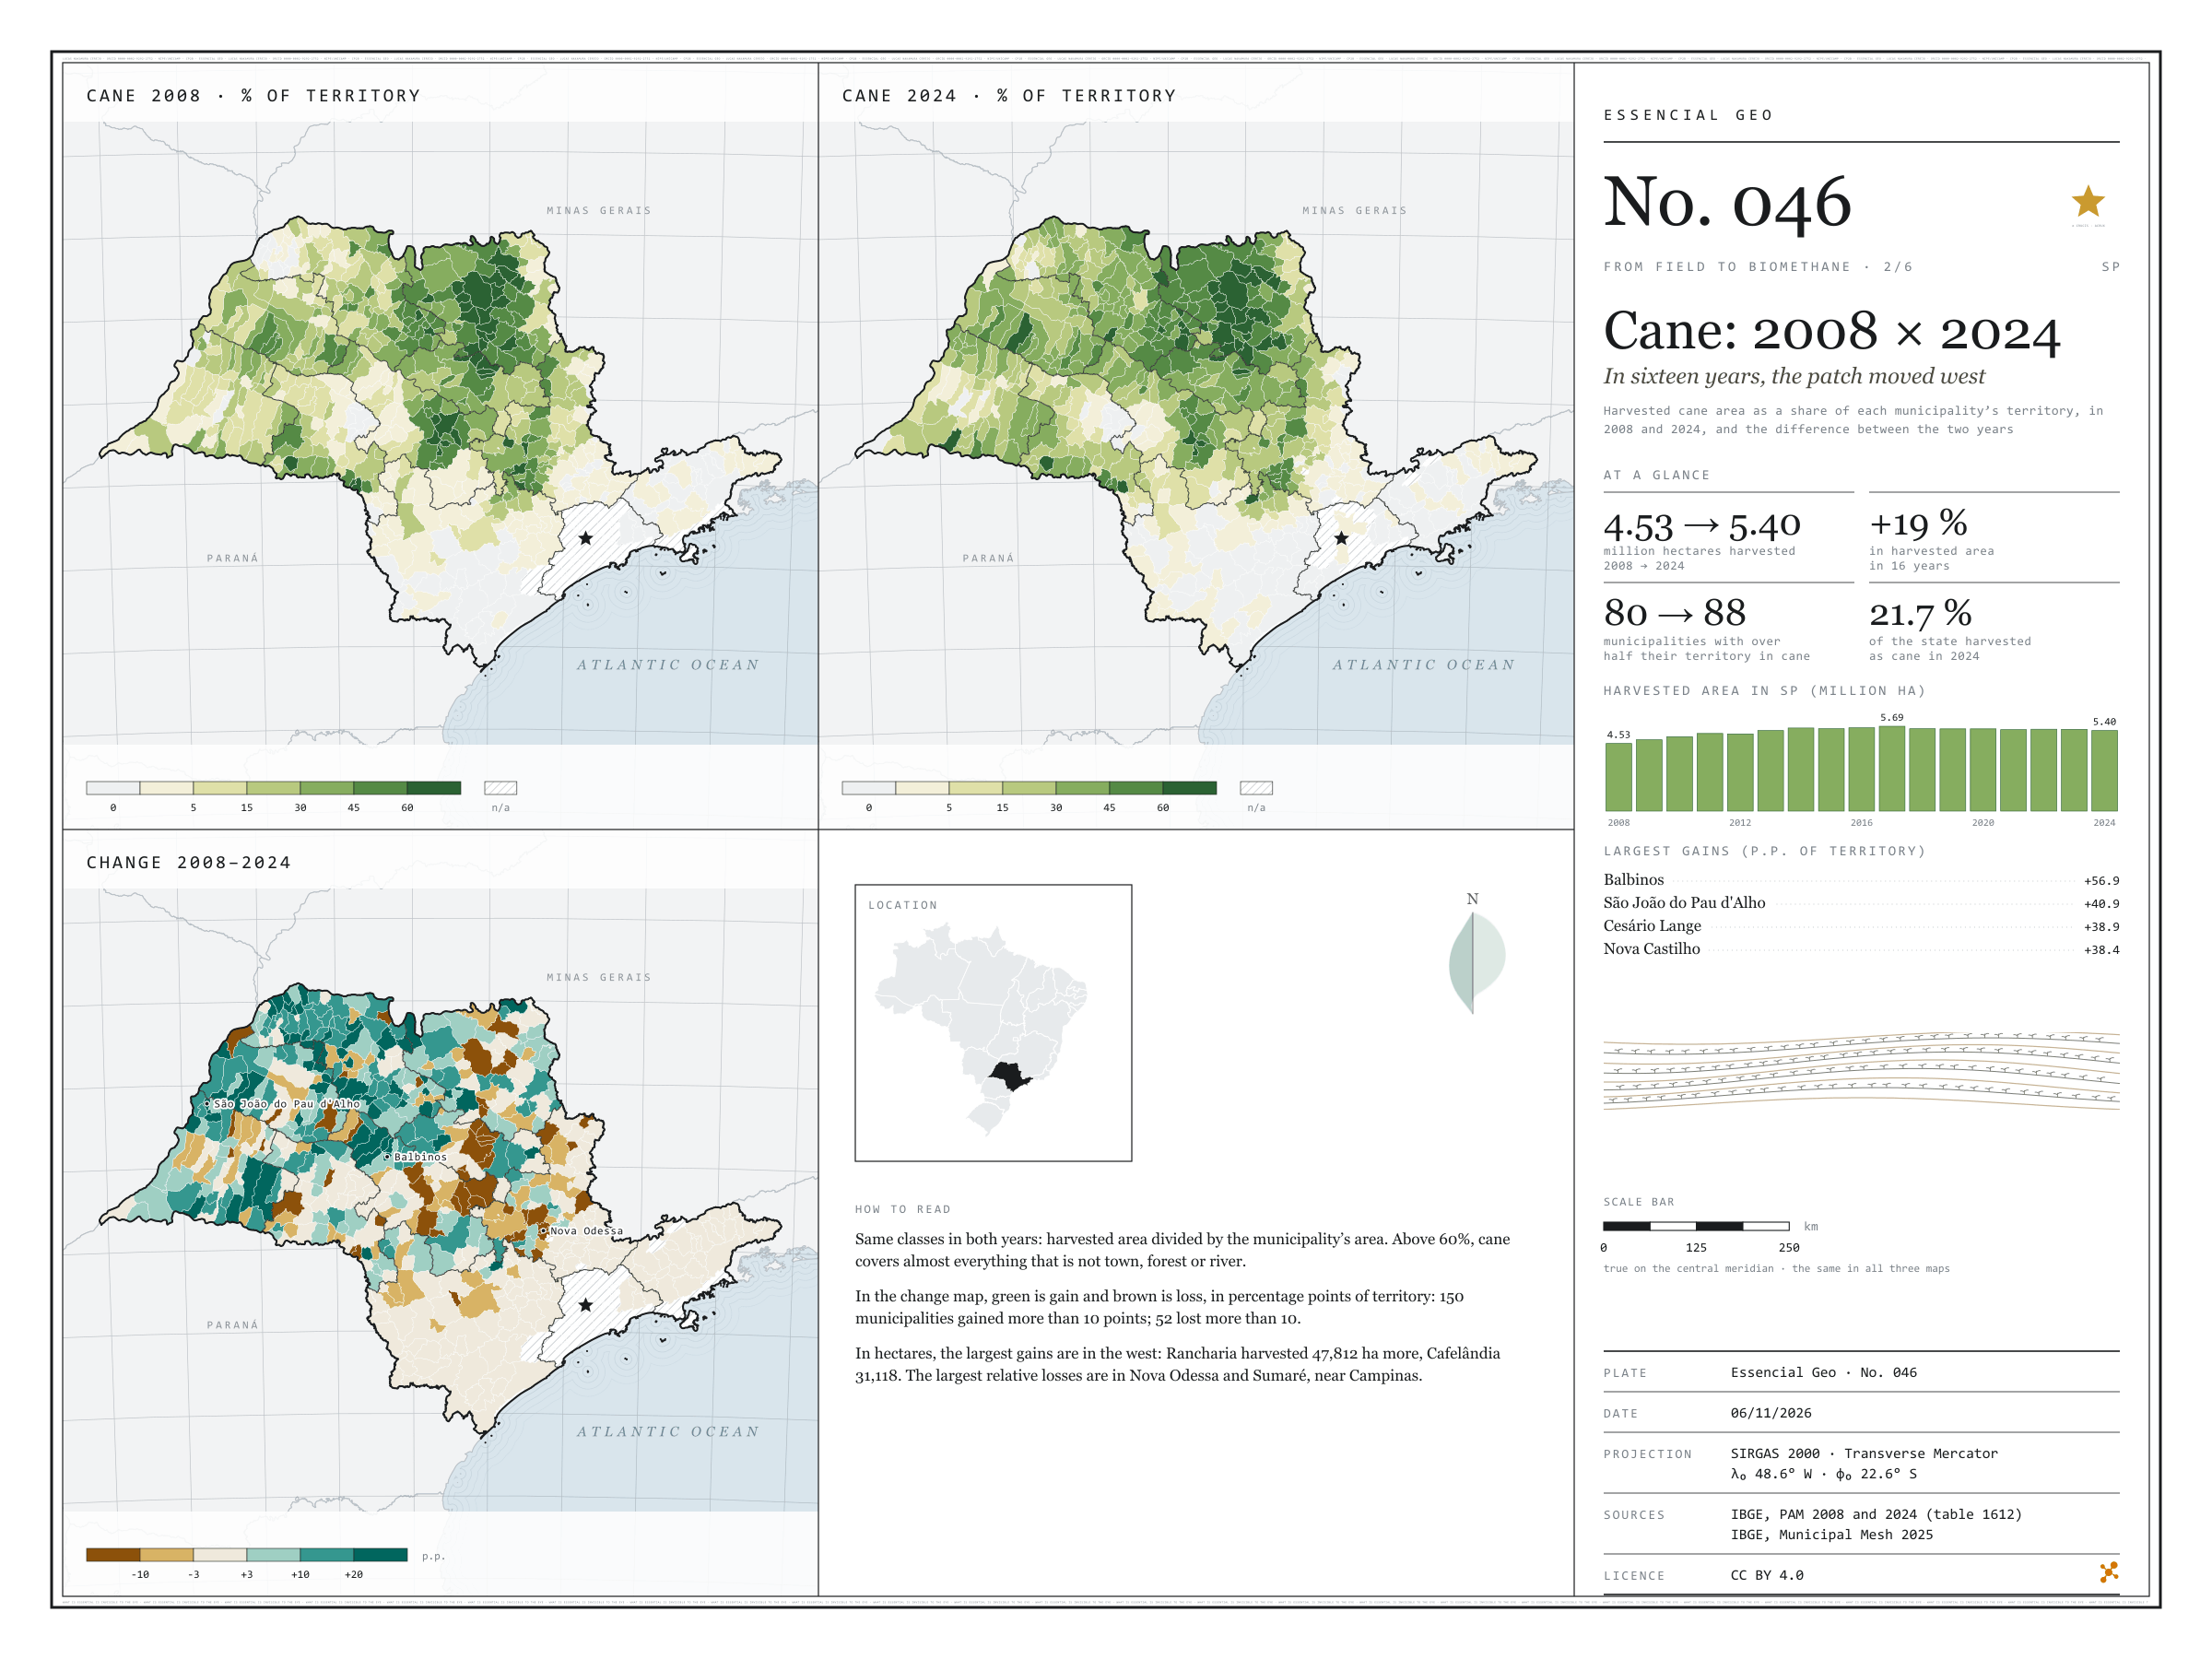
Fig. 046 São Paulo state (SP) EPSG:4674 Source: IBGE

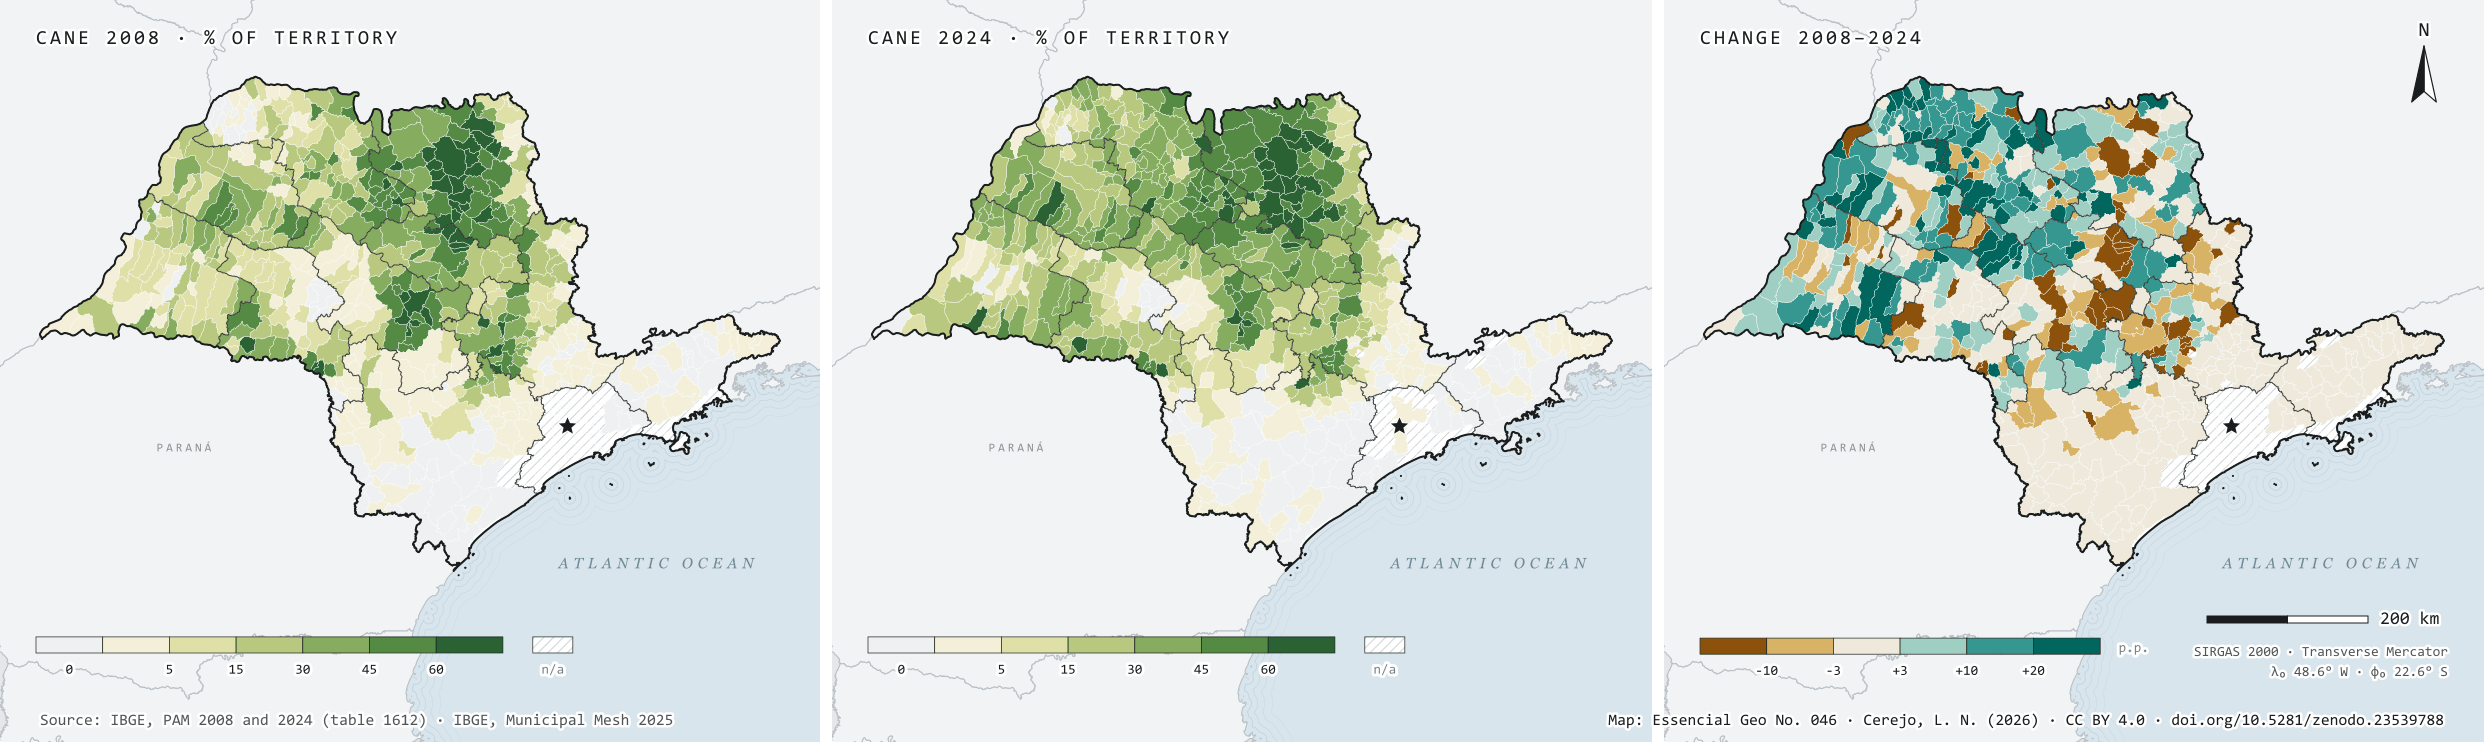
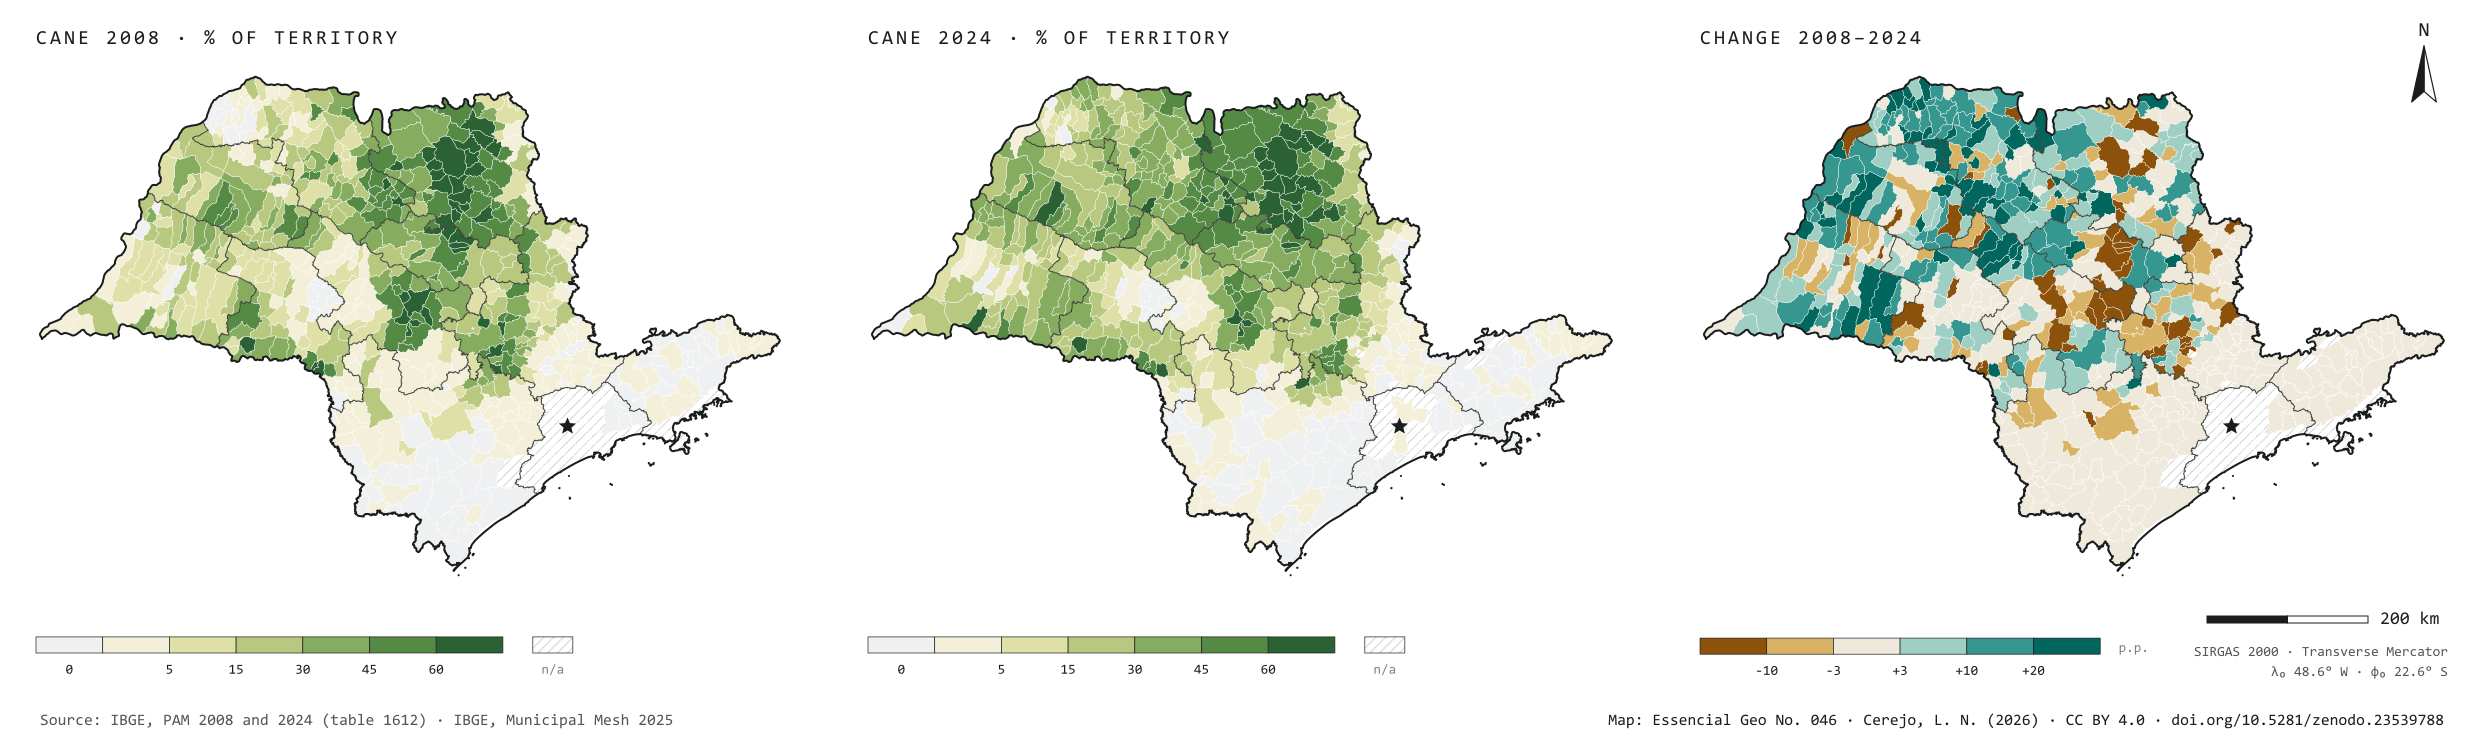
In 2008, São Paulo’s cane fields were harvested over 4.53 million hectares; in 2024, over 5.40 million, 19% more, and cane went from 18.3% to 21.7% of the state’s territory. Harvested area peaked in 2017, at 5.69 million hectares, and has been slowly receding since. The plate sets the two years side by side, with the same classes, and maps the difference: 150 municipalities gained more than 10 percentage points of territory under cane, 104 of them in the São José do Rio Preto, Araçatuba and Presidente Prudente regions, in the west; Rancharia harvested 47,812 hectares more. The Campinas region was the only one to lose much: 63,632 hectares fewer, with the steepest falls in Nova Odessa and Sumaré. Second plate of the collection “From field to biomethane”.

Technical record · downloads · citation

At a glance

Harvested area in 2024

5,398,676 ha

It was 4,530,784 ha in 2008: 19% more in sixteen years

Municipalities that gained over 10 p.p.

150

Another 52 lost more than 10 percentage points of territory under cane

Largest gains in harvested area, 2008–2024 (ha)
  • Rancharia 47,812
  • Cafelândia 31,118
  • José Bonifácio 28,000
  • Martinópolis 25,500
  • Mirandópolis 23,000

Layers

  • municipios polygon 645 municipalities: harvested area and production of cane in 2008 and 2024, share of territory in each year (%) and change (p.p.)
  • regioes_intermediarias polygon 11 intermediate geographic regions
  • limite_estadual polygon State boundary

Metadata

Extent
São Paulo state (SP)
CRS / Projection
SIRGAS 2000 (EPSG:4674)
EPSG:4674
Software
Python · GeoPandas · GDAL · QGIS · Node.js · d3-geo
Method
Harvested cane area from PAM in 2008 and 2024 divided by municipal area, in the same six classes for both years; the change is given in percentage points of territory.
Version
v1.0.0
Licence
CC BY 4.0

Downloads

Figure to reuse

The map without a frame, with legend, scale, reference system and credit written on it: ready for papers, lectures and slides. In two versions: with the basemap (neighbours and sea) or only the mapped area, on white.

Point a camera at it to open this page.

How to cite

Cerejo, L. N. (2026). Cana: 2008 × 2024: em dezesseis anos, a mancha andou para o oeste [Cane: 2008 × 2024: In sixteen years, the patch moved west] (Version 1.0.0) [Data set]. Zenodo. https://doi.org/10.5281/zenodo.23539788

How to read this plate area, projection, scale, legend and source · 2 terms
1 Area
São Paulo state (SP) The area the plate covers. Outside it, neighbours and sea are drawn in grey, just for orientation.
2 Coordinates and projection
SIRGAS 2000 (EPSG:4674) The layers are in SIRGAS 2000; the drawing’s projection is written in the colophon at the foot of the panel.
3 Scale
Graphic scale bar in the panel The scale bar is true on the central meridian; away from it, measured distances vary a little.
4 Legend and layers
3 layers in the GeoPackage · polygon Read the legend before the map: it tells you whether a colour is a rate or a class, and whether a circle is a total.
5 Sources
IBGE (2008 a 2024); IBGE (2025) Every figure comes from a public source, with its year. The data sheet gives each one’s address.

Terms on this plate

Harvest year
Cane years are not calendar years: in the Centre-South the harvest runs from April to March; in the Northeast, from September to August. That is why the two regions crush in opposite months.
Biomethane
Biogas upgraded, with most of the CO₂ removed, to ANP’s specification, at which point it replaces natural gas in the pipeline, in industry and in the lorry’s tank.

Download

Layers, table and figures, under CC BY 4.0. Cite with the DOI.

Full record and citation

Method notes · No. 046

Sugarcane in São Paulo, 2008 and 2024

Português · English

Plate No. 046, the second of six in the collection From field to biomethane: before measuring the gas the residues could give, a look at how the crop that leaves the most residue has moved across the state.

What the files contain

Layer (GPKG)GeometryContents
municipiospolygon645 municipalities: CD_MUN, NM_MUN, intermediate region, area_km2, area_2008_ha, area_2024_ha, producao_2008_t, producao_2024_t, pct_2008 and pct_2024 (harvested area ÷ municipal area, in %) and var_pp (change, in percentage points)
regioes_intermediariaspolygon11 intermediate geographic regions
limite_estadualpolygonoutline of the state

The GPKG is zipped and attached to the agro-sp-2026 release, together with those of the other plates in the collection.

The municipios layer carries three QGIS styles: parte_2024 (the default), parte_2008 and variacao. To switch, open the layer properties and pick the style under Style › Styles.

The CSV holds the same table, in UTF-8, without geometry. An empty cell means no data; 0 means zero as declared by IBGE.

Method

  1. Table 1612 of the Municipal Agricultural Production survey on SIDRA: Harvested area (hectares) and Quantity produced (tonnes), product Sugarcane, years 2008 to 2024, municipal level, São Paulo state.
  2. Joined to IBGE’s 2025 Municipal Mesh by the seven-digit code. The state has the same 645 municipalities in both years.
  3. Share of territory = harvested area ÷ (official municipal area × 100), in %. Fixed classes, the same on both maps: up to 5%, 5 to 15%, 15 to 30%, 30 to 45%, 45 to 60% and above 60%.
  4. Change = share in 2024 − share in 2008, in percentage points, in six classes: loss of more than 10, loss of 3 to 10, stable (±3), gain of 3 to 10, of 10 to 20 and of more than 20.
  5. The panel’s columns add up the state’s harvested area year by year, from 2008 to 2024.

Limitations

  • Harvested area is not planted area: fields being replanted or not cut in the year are left out.
  • The 2025 municipal area is used for both years; boundary changes between municipalities since 2008 are not corrected.
  • 53 municipalities have no data in 2008 and 45 in 2024, most of them in Greater São Paulo and on the Santos coast; the change is computed only where both years exist.
  • In small municipalities, a few thousand hectares shift many percentage points. That is why the panel lists the largest gains in points, and the factsheet the largest in hectares.
  • The plate does not say what was there before the cane or what replaced it; that takes a land use and land cover map.

Data licence

Open data from IBGE, free to use with attribution.

View this map’s folder on GitHub

Technical record

Technical record · No. 046

Cane: 2008 × 2024

At a glance

Harvested area in 2024

5,398,676 ha

It was 4,530,784 ha in 2008: 19% more in sixteen years

Municipalities that gained over 10 p.p.

150

Another 52 lost more than 10 percentage points of territory under cane

Largest gains in harvested area, 2008–2024 (ha)
  • Rancharia 47,812
  • Cafelândia 31,118
  • José Bonifácio 28,000
  • Martinópolis 25,500
  • Mirandópolis 23,000

Layers

  • municipios polygon 645 municipalities: harvested area and production of cane in 2008 and 2024, share of territory in each year (%) and change (p.p.)
  • regioes_intermediarias polygon 11 intermediate geographic regions
  • limite_estadual polygon State boundary

Metadata

Extent
São Paulo state (SP)
CRS / Projection
SIRGAS 2000 (EPSG:4674)
EPSG:4674
Software
Python · GeoPandas · GDAL · QGIS · Node.js · d3-geo
Method
Harvested cane area from PAM in 2008 and 2024 divided by municipal area, in the same six classes for both years; the change is given in percentage points of territory.
Version
v1.0.0
Licence
CC BY 4.0

Downloads

Figure to reuse

The map without a frame, with legend, scale, reference system and credit written on it: ready for papers, lectures and slides. In two versions: with the basemap (neighbours and sea) or only the mapped area, on white.

Point a camera at it to open this page.

How to cite

Cerejo, L. N. (2026). Cana: 2008 × 2024: em dezesseis anos, a mancha andou para o oeste [Cane: 2008 × 2024: In sixteen years, the patch moved west] (Version 1.0.0) [Data set]. Zenodo. https://doi.org/10.5281/zenodo.23539788

100%