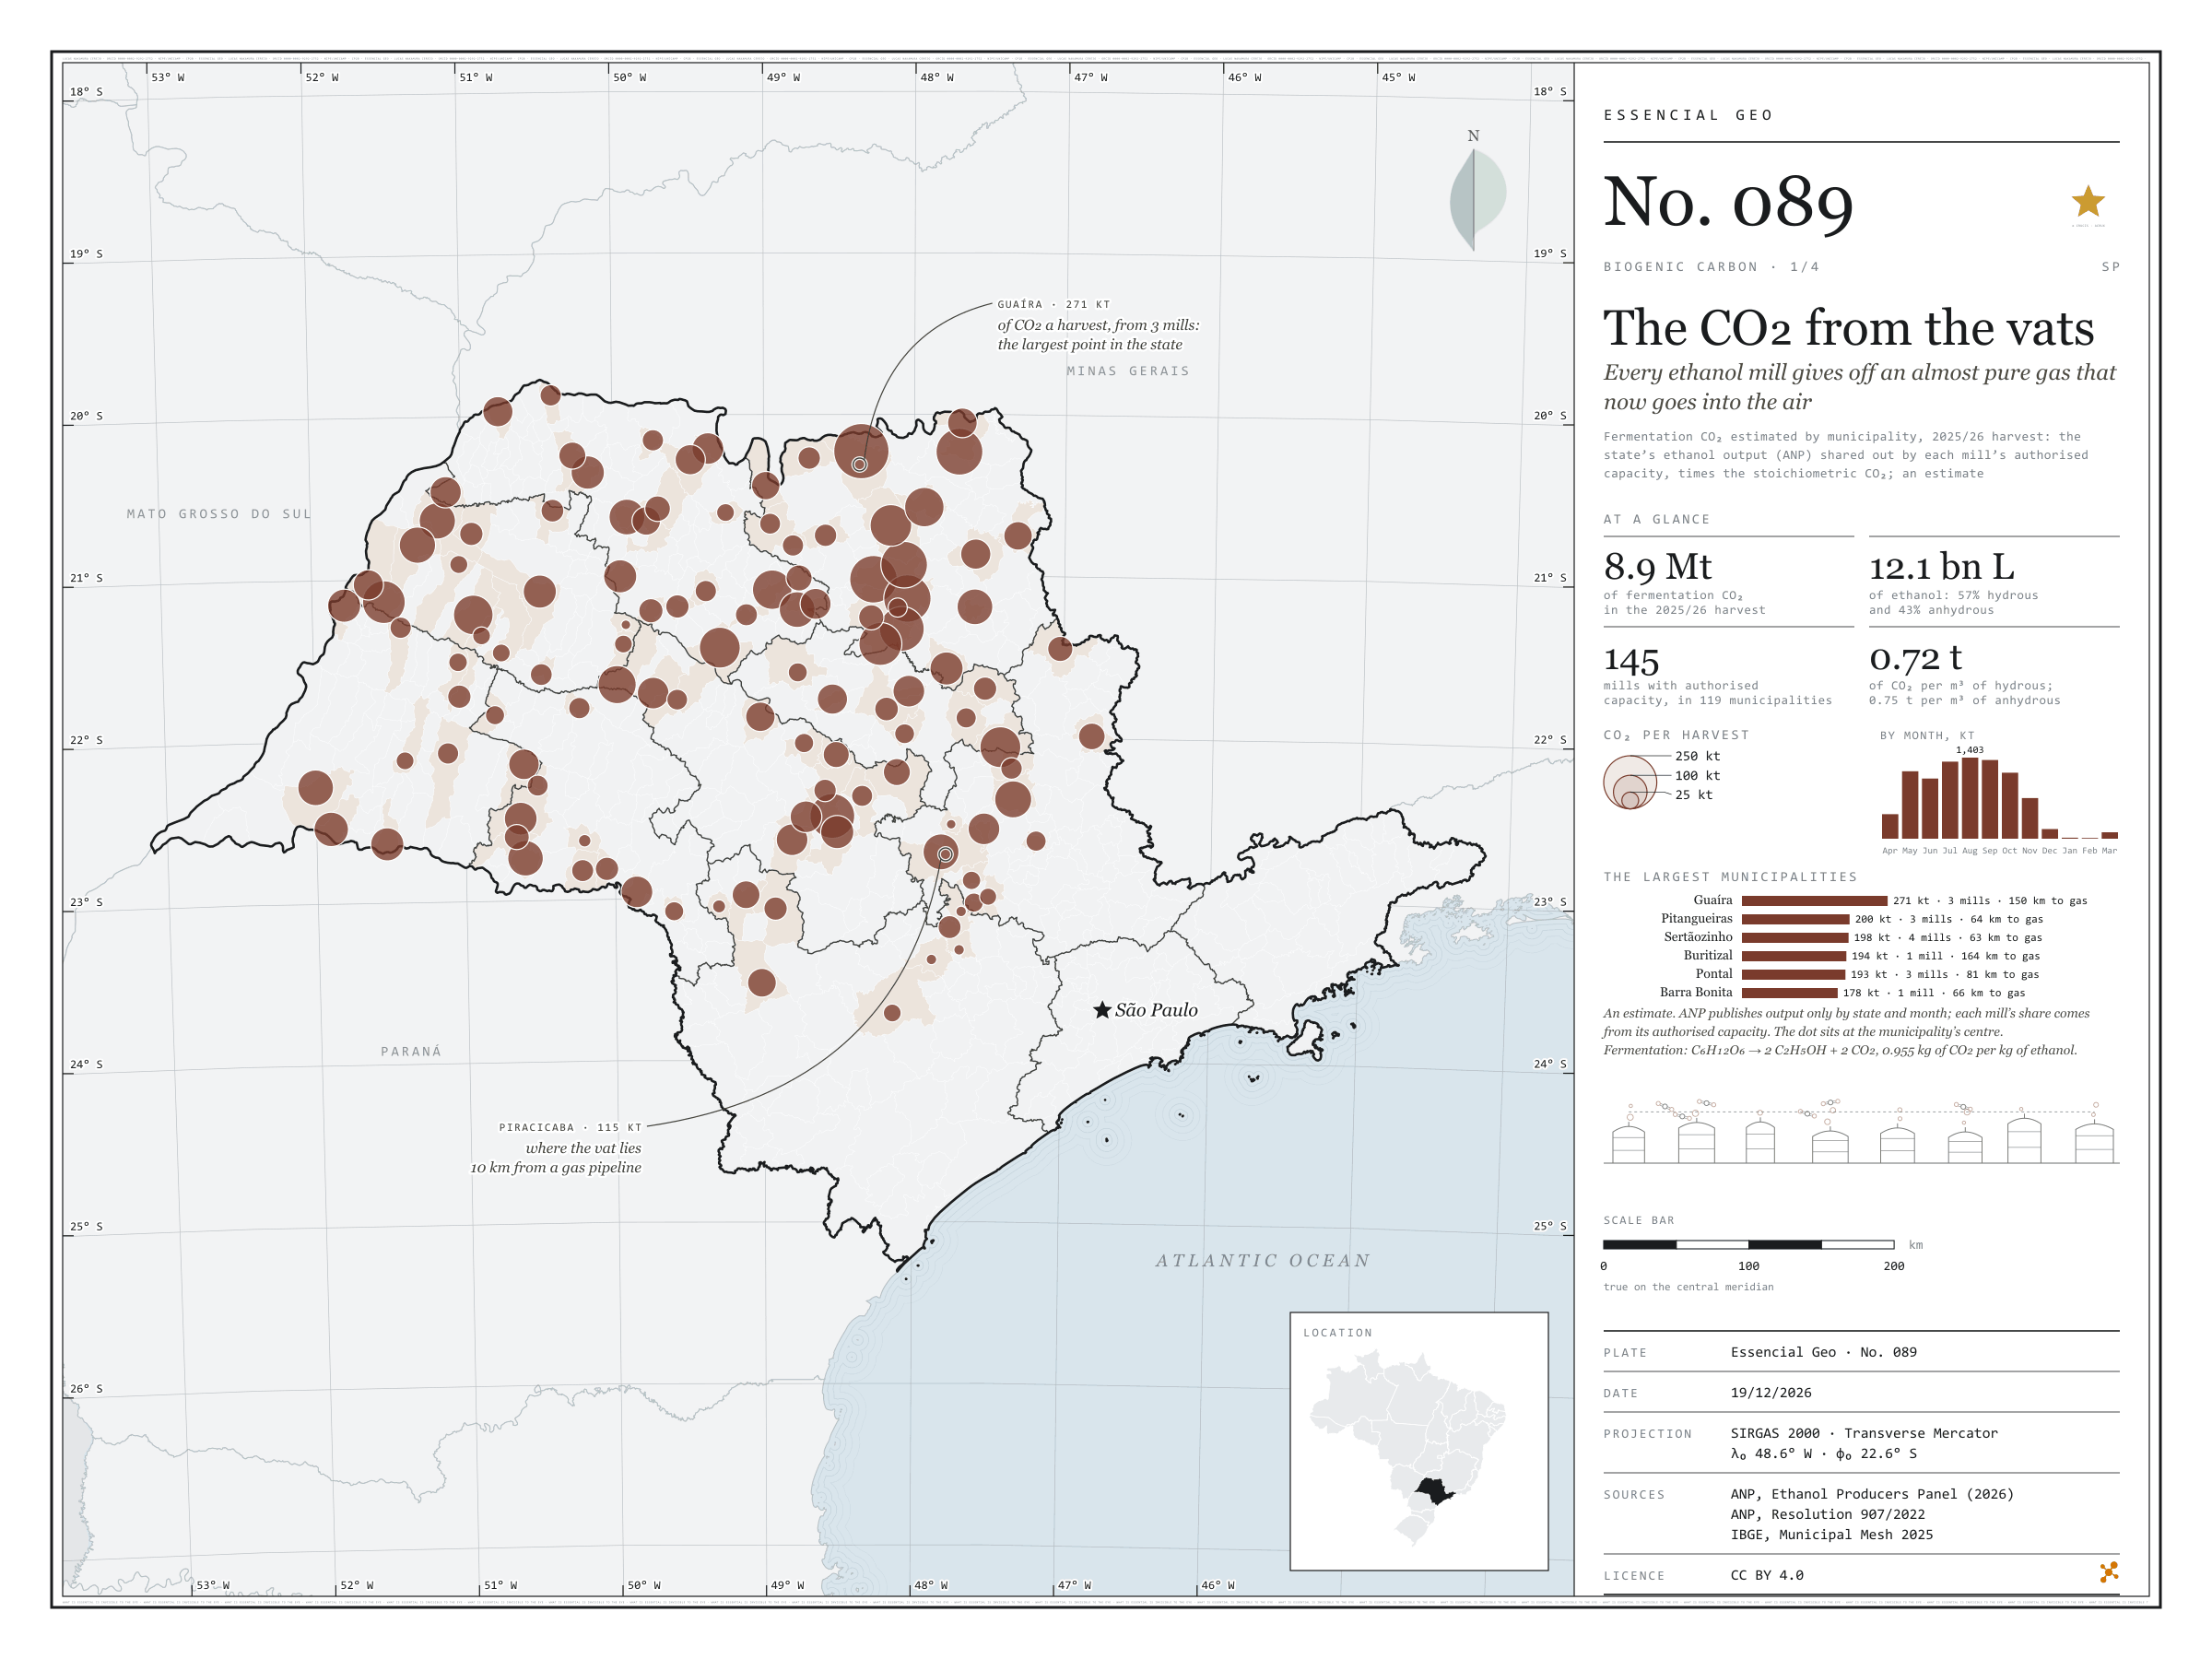
Every ethanol mill gives off an almost pure gas that now goes into the air
Fig. 089São Paulo State (SP)EPSG:4674Source: ANP, Kheshgi, H. S. and Prince, R. C. (2005). Sequestration of fermentation CO₂ from ethanol production. Energy, 30, 1865–1871, EPE, IBGE
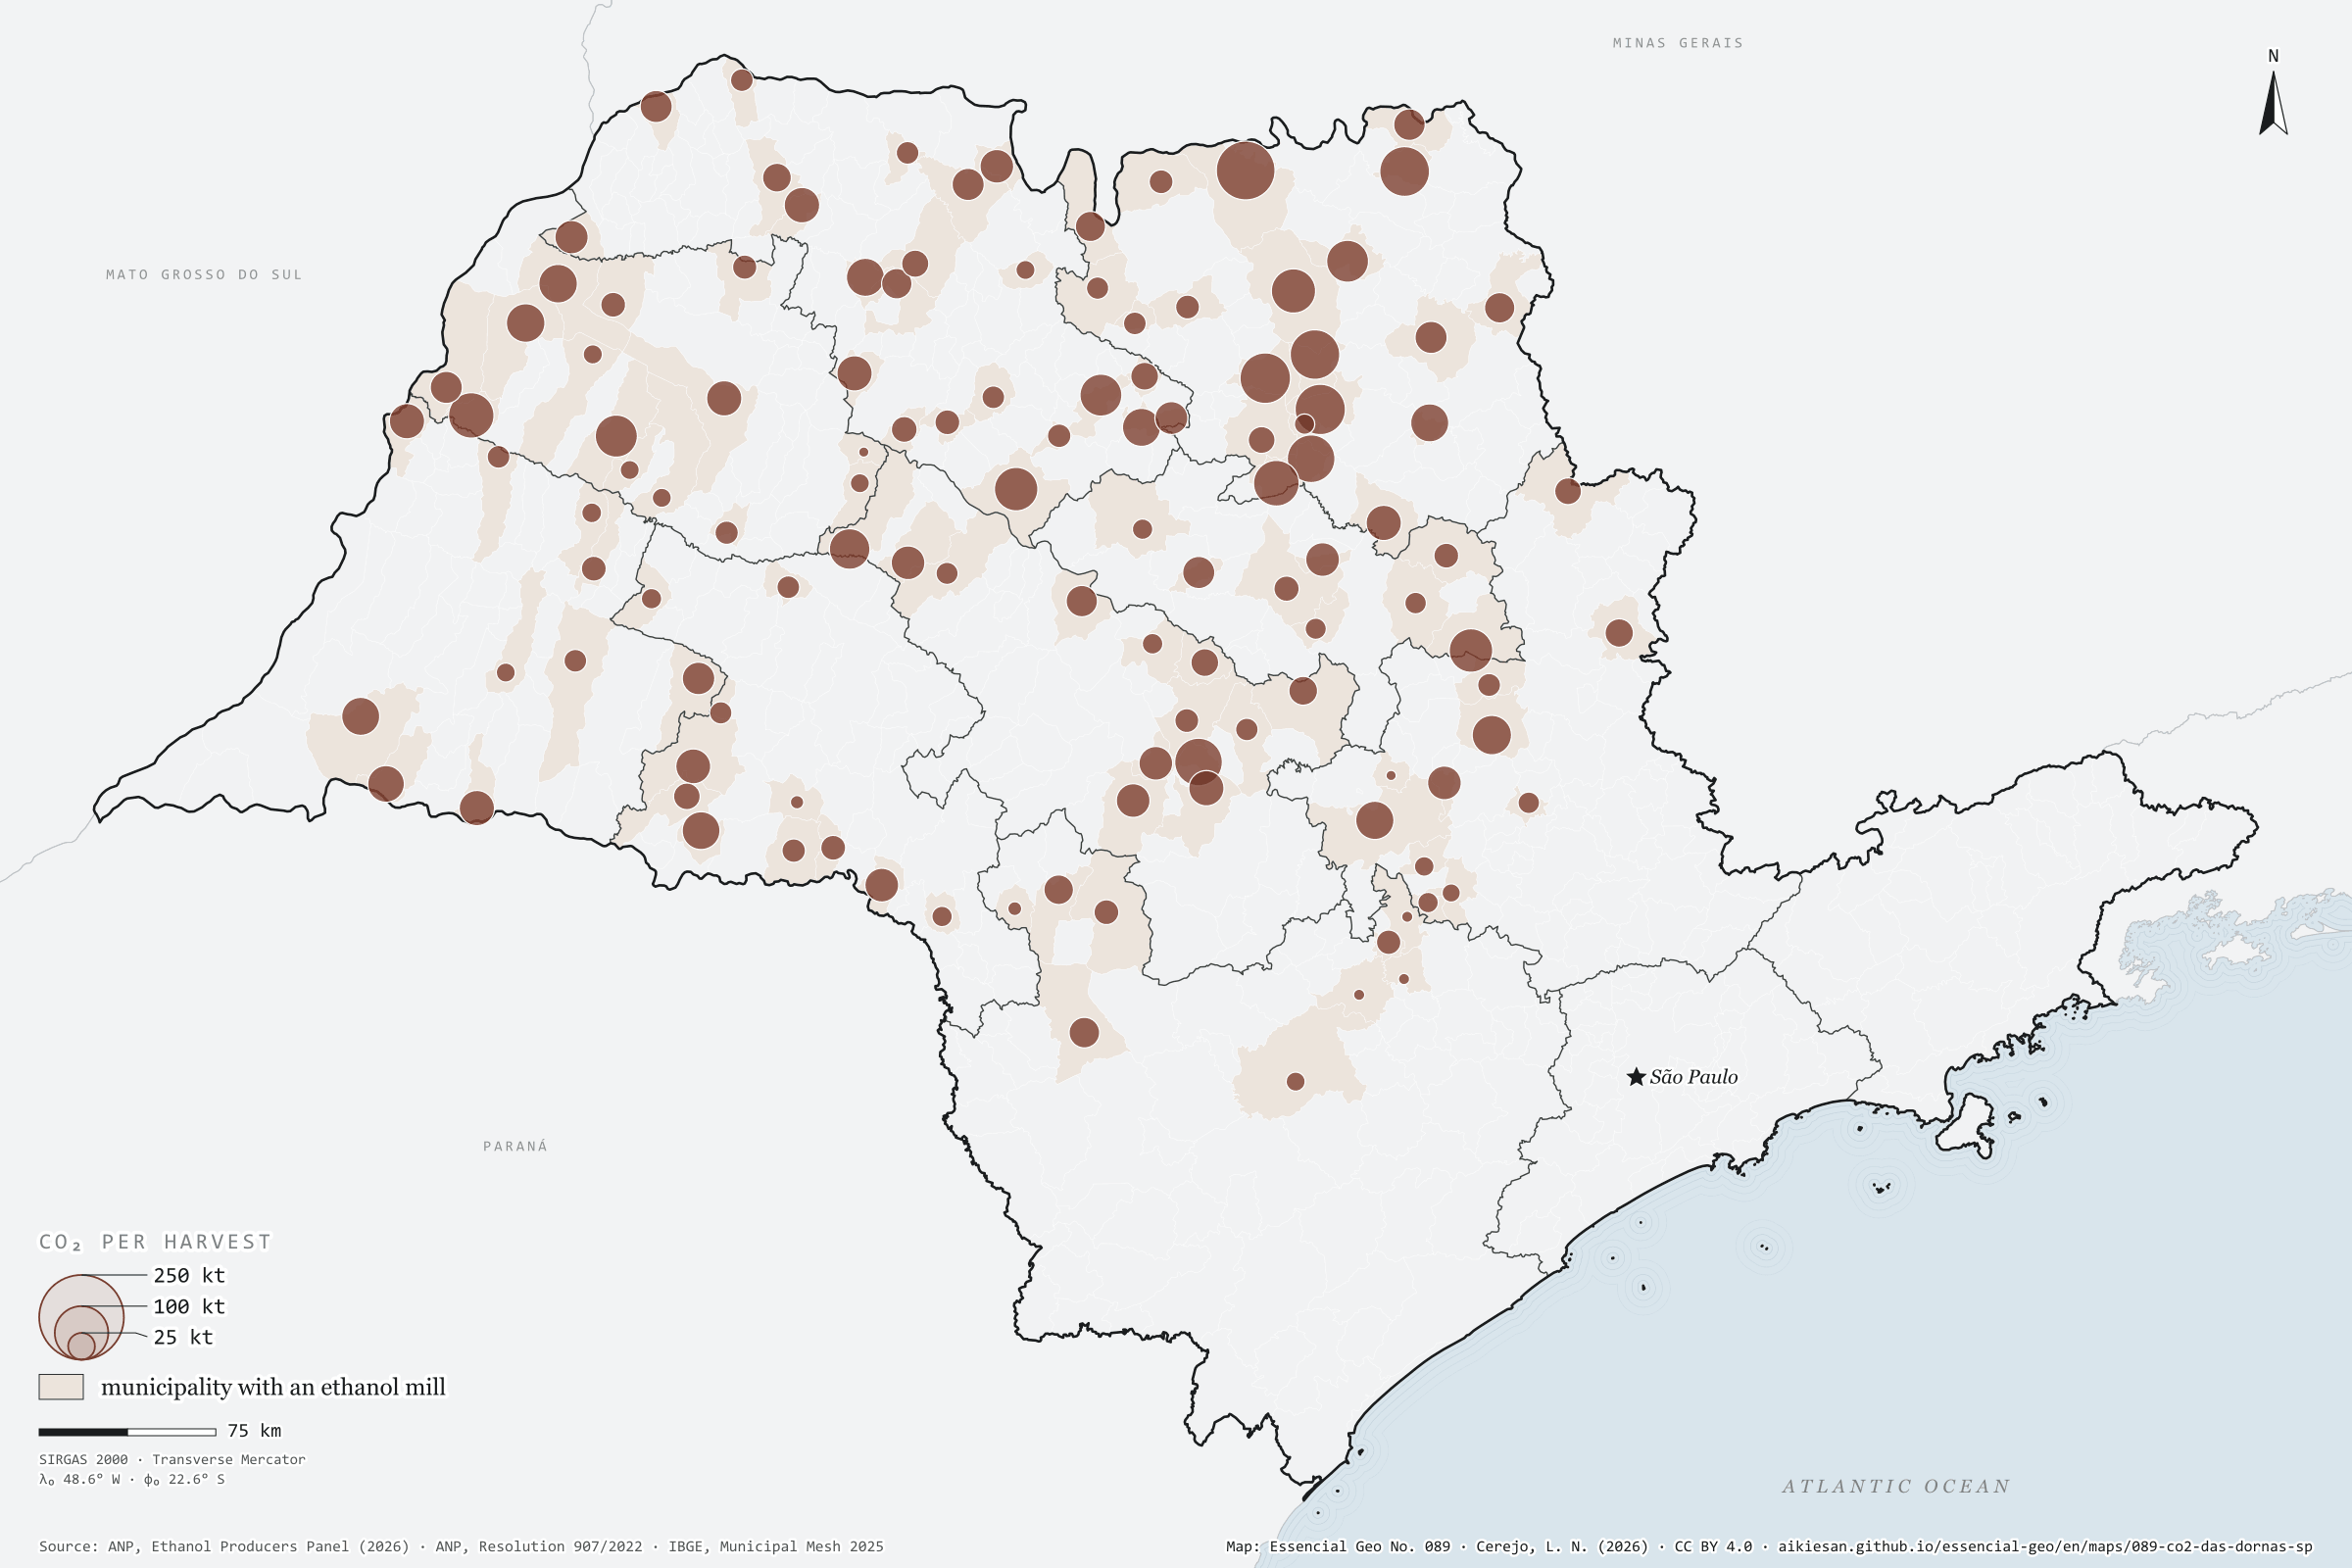
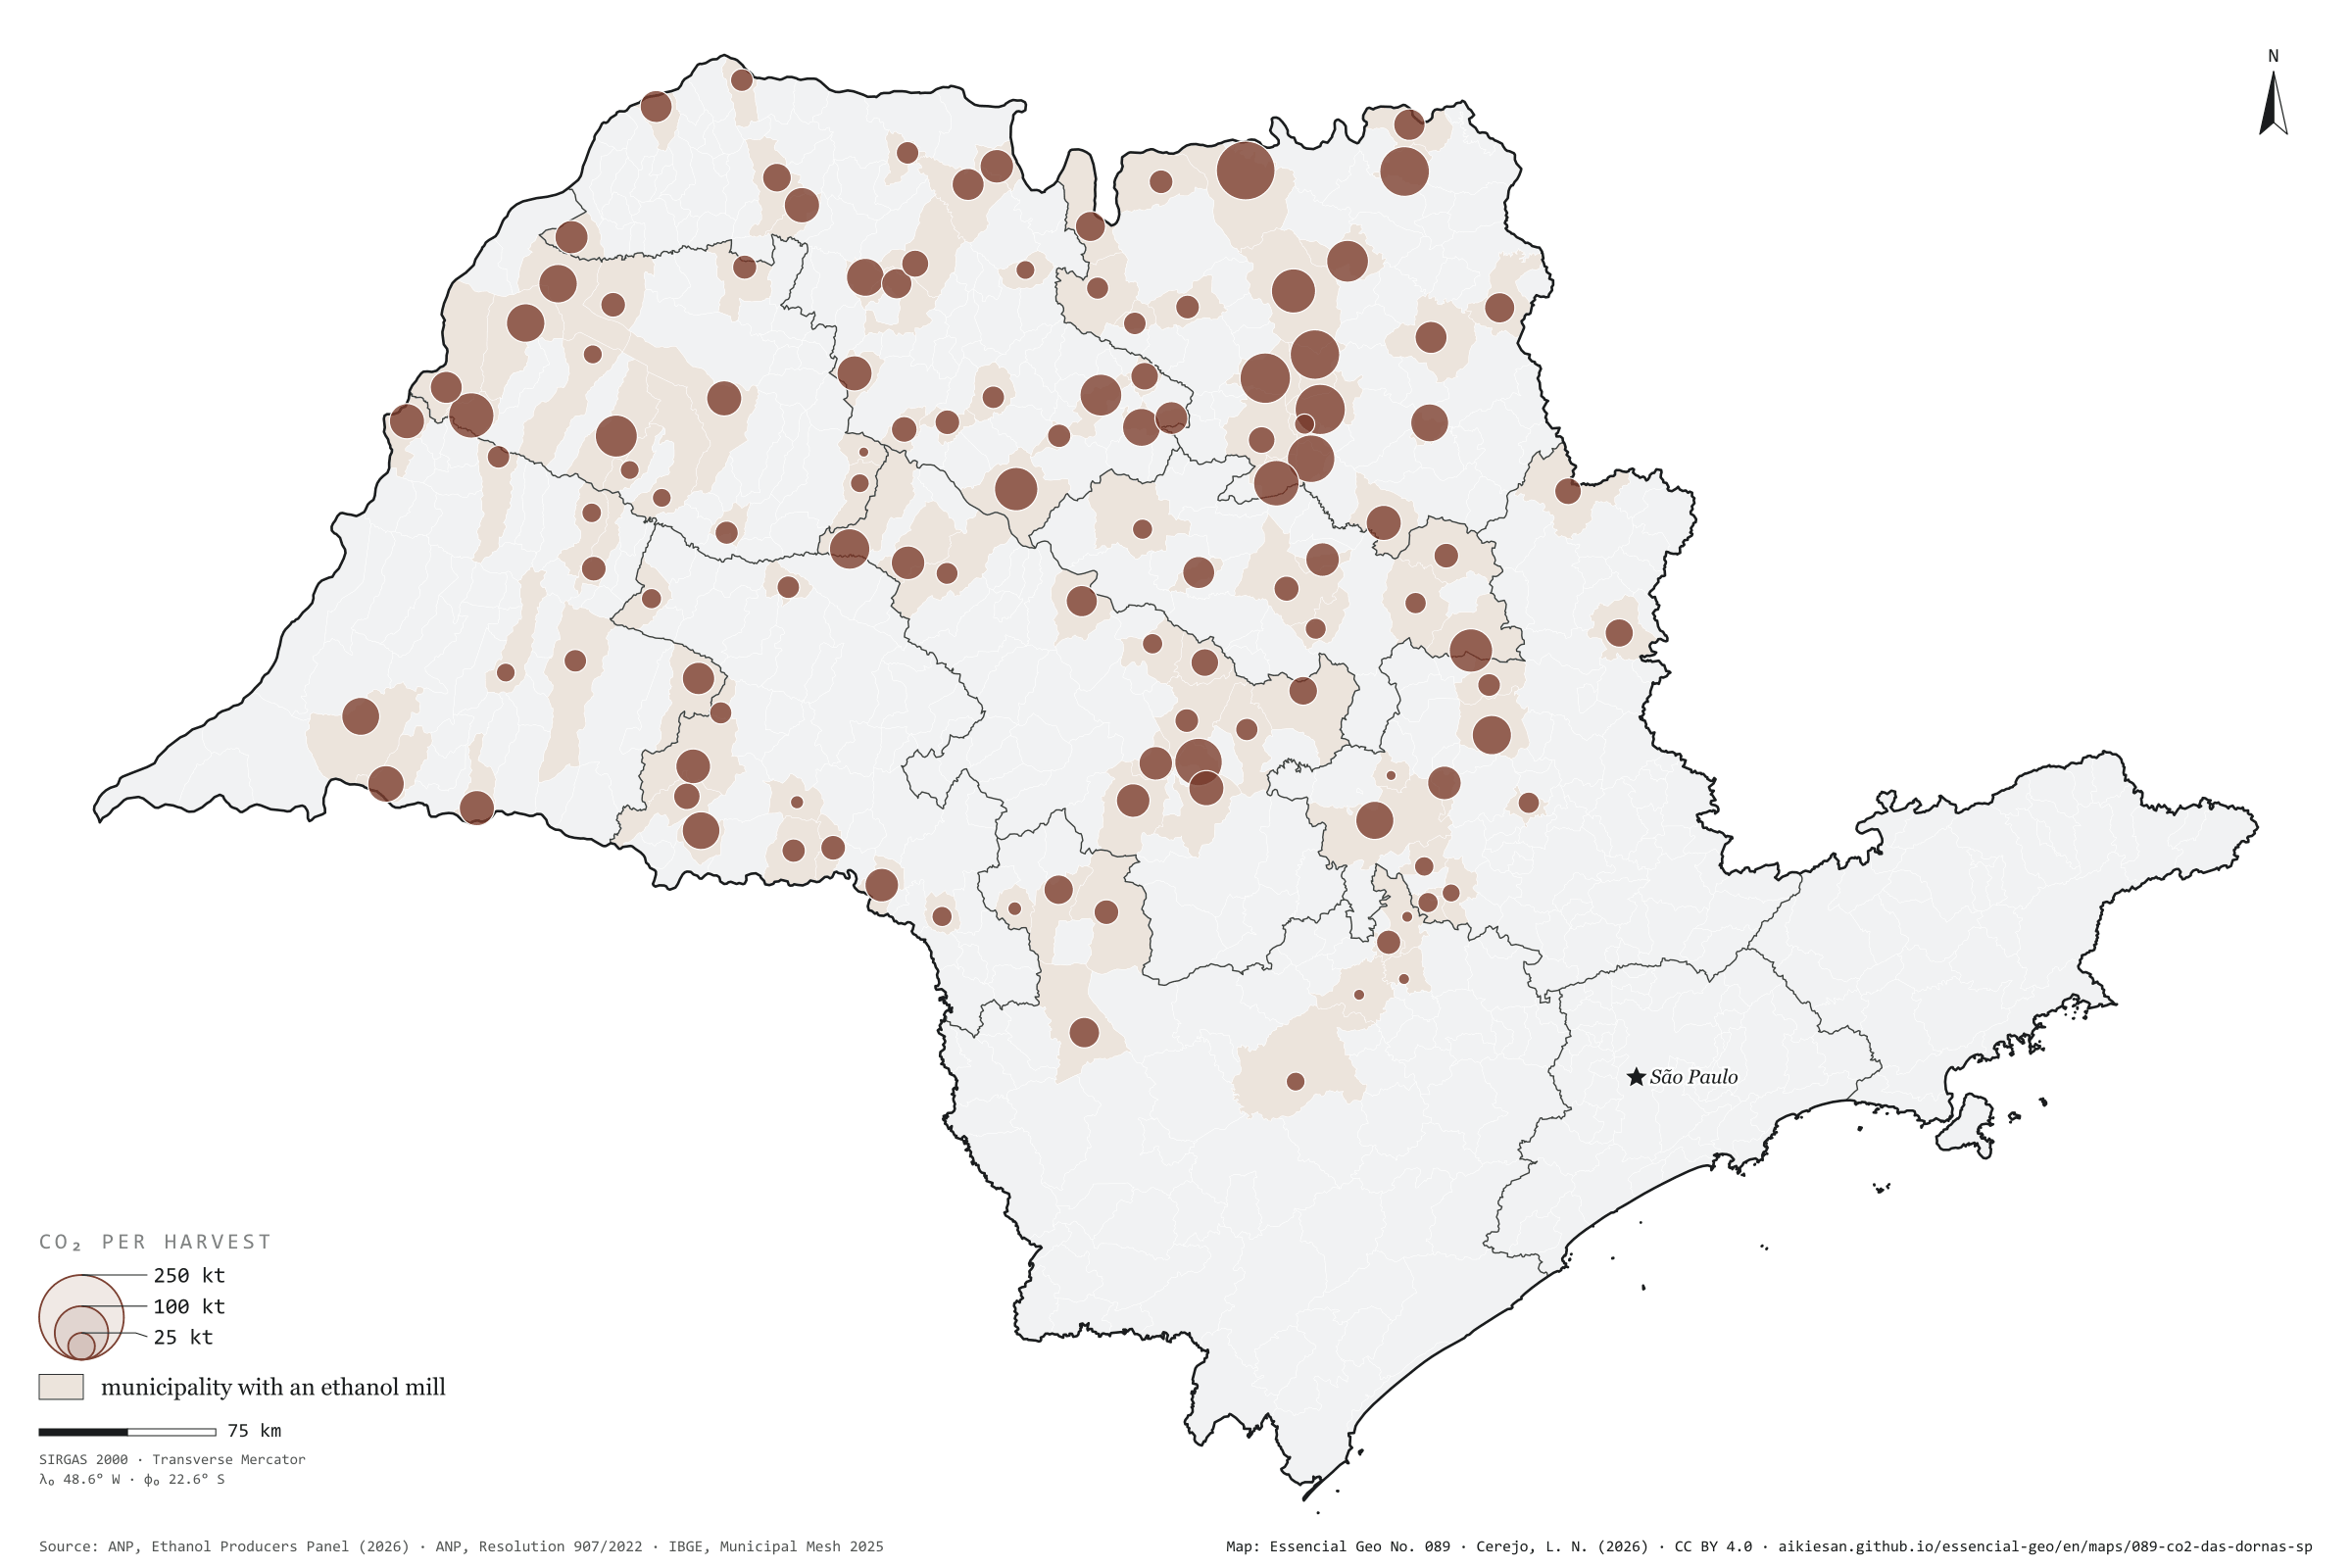
In the fermentation vat, yeast turns cane sugar into ethanol and releases CO₂ in step: 0.955 kg of gas per kg of alcohol, about 0.75 t per m³. It is almost pure CO₂, of biological origin, and today it goes into the air. In the 2025/26 harvest, São Paulo’s mills made 12.1 billion litres of ethanol; by stoichiometry, about 8.9 million tonnes of CO₂ left the vats, from 145 mills in 119 municipalities. Guaíra, with three mills, leads with about 271,000 t; Pitangueiras, Sertãozinho and Buritizal each pass 190,000. The gas follows the crushing season: 1.4 million t in August and almost nothing from December to March. As ANP publishes output only by state, each mill’s share is estimated from its authorised capacity; everything here is an estimate. First plate of the collection “Biogenic carbon”.
Technical record · downloads · citation
At a glance
Fermentation CO₂ in the 2025/26 harvest
8.9million t
Largest municipalities (t of CO₂ a harvest)
Guaíra271,110
Pitangueiras200,298
Sertãozinho198,274
Buritizal194,228
Pontal192,609
Barra Bonita178,042
Layers
usinas_etanolpoint145 SP mills with authorised capacity in the harvest: estimated ethanol and CO₂, at the municipality’s interior point
municipiospolygon645 municipalities: fermentation CO₂ (2025/26 harvest and 2024), biogas, fossil and possible e-methane
São Paulo’s anhydrous and hydrous ethanol output in the 2025/26 harvest (ANP, by month) shared out among mills by their authorised capacity in each month, converted to mass by the density in the ANP specification and to CO₂ by the stoichiometry of alcoholic fermentation (0.955 kg of CO₂ per kg of ethanol); summed by municipality.
The map without a frame, with legend, scale, reference system and credit written on it: ready for papers, lectures and slides. In two versions: with the basemap (neighbours and sea) or only the mapped area, on white.
CEREJO, Lucas Nakamura. O CO₂ das dornas: toda usina de etanol solta um gás quase puro, que hoje vai para o ar. Versão 1.0.0. [S. l.]: Essencial, 2026. Conjunto de dados. Disponível em: https://aikiesan.github.io/essencial-geo/en/maps/089-co2-das-dornas-sp/. Acesso em: 10 nov. 2026.
Cerejo, L. N. (2026). O CO₂ das dornas: toda usina de etanol solta um gás quase puro, que hoje vai para o ar [The CO₂ from the vats: Every ethanol mill gives off an almost pure gas that now goes into the air] (Version 1.0.0) [Data set]. Essencial. https://aikiesan.github.io/essencial-geo/en/maps/089-co2-das-dornas-sp/
@dataset{cerejo2026_co2_das_dornas_sp,
  author    = {Cerejo, Lucas Nakamura},
  title     = {O CO₂ das dornas: Toda usina de etanol solta um gás quase puro, que hoje vai para o ar},
  year      = {2026},
  publisher = {Essencial},
  version   = {1.0.0},
  url       = {https://aikiesan.github.io/essencial-geo/en/maps/089-co2-das-dornas-sp/},
  language  = {portuguese},
  note      = {English title: The CO₂ from the vats: Every ethanol mill gives off an almost pure gas that now goes into the air. Licence CC BY 4.0}
}
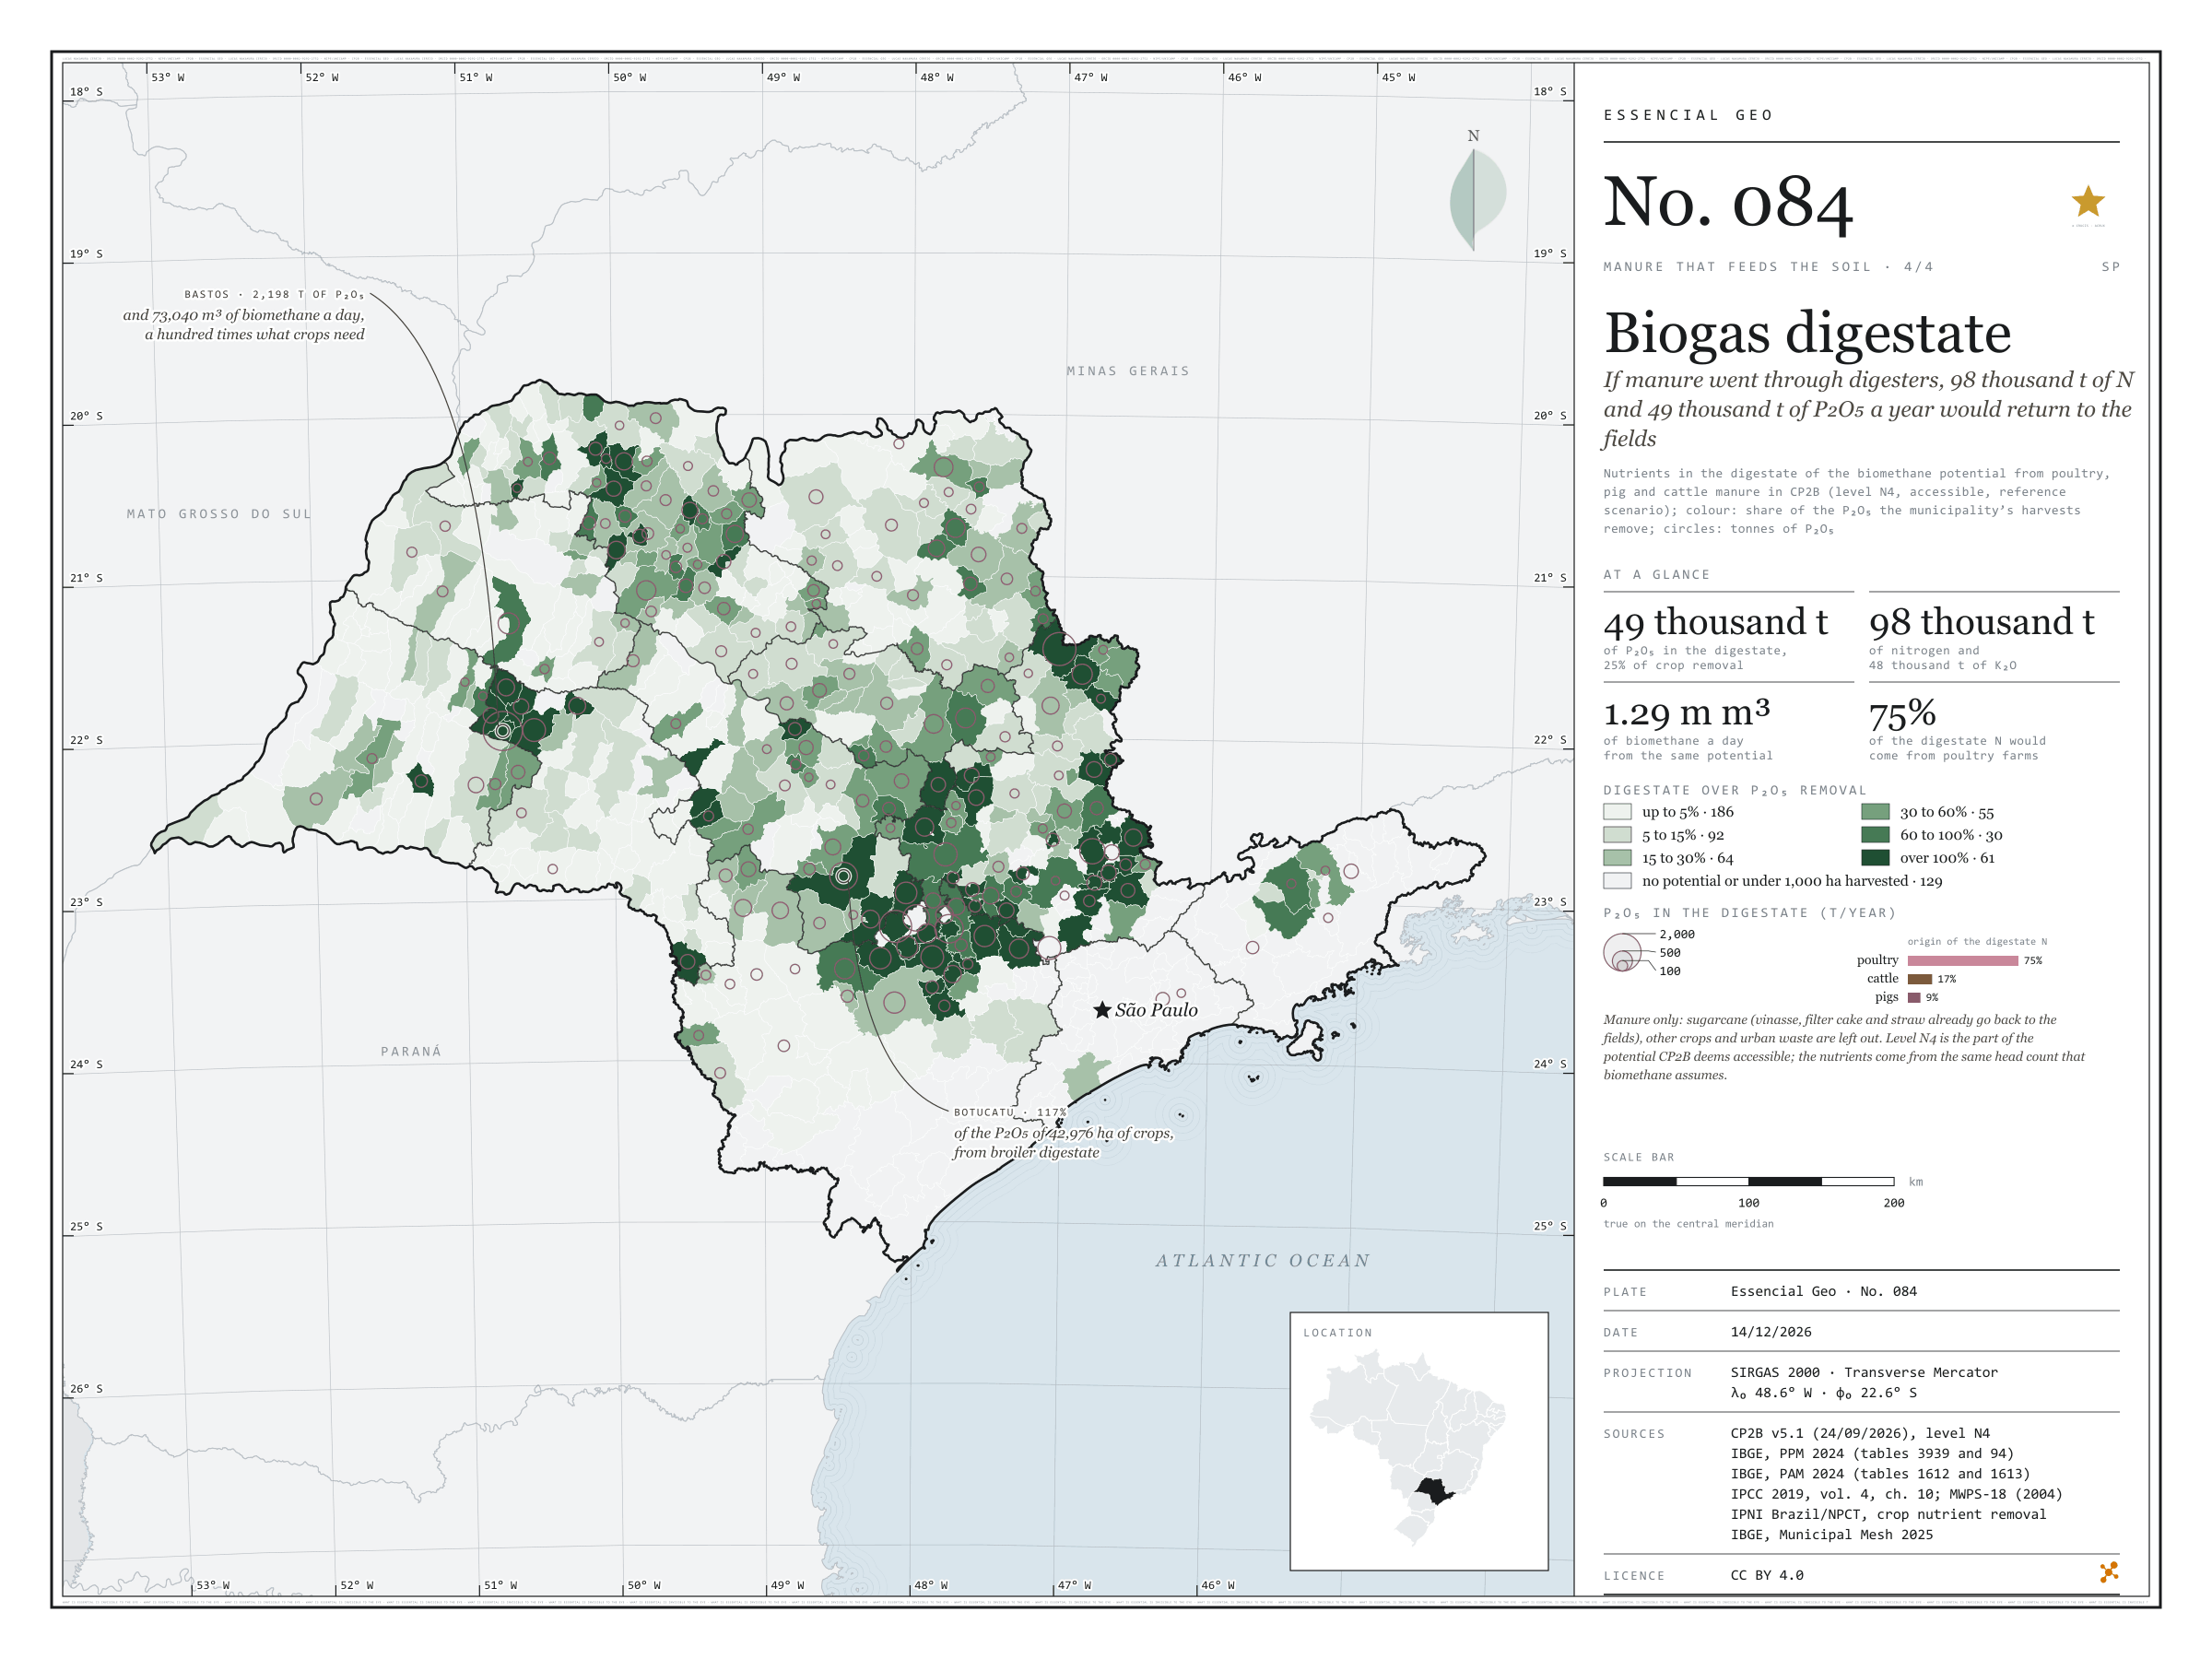
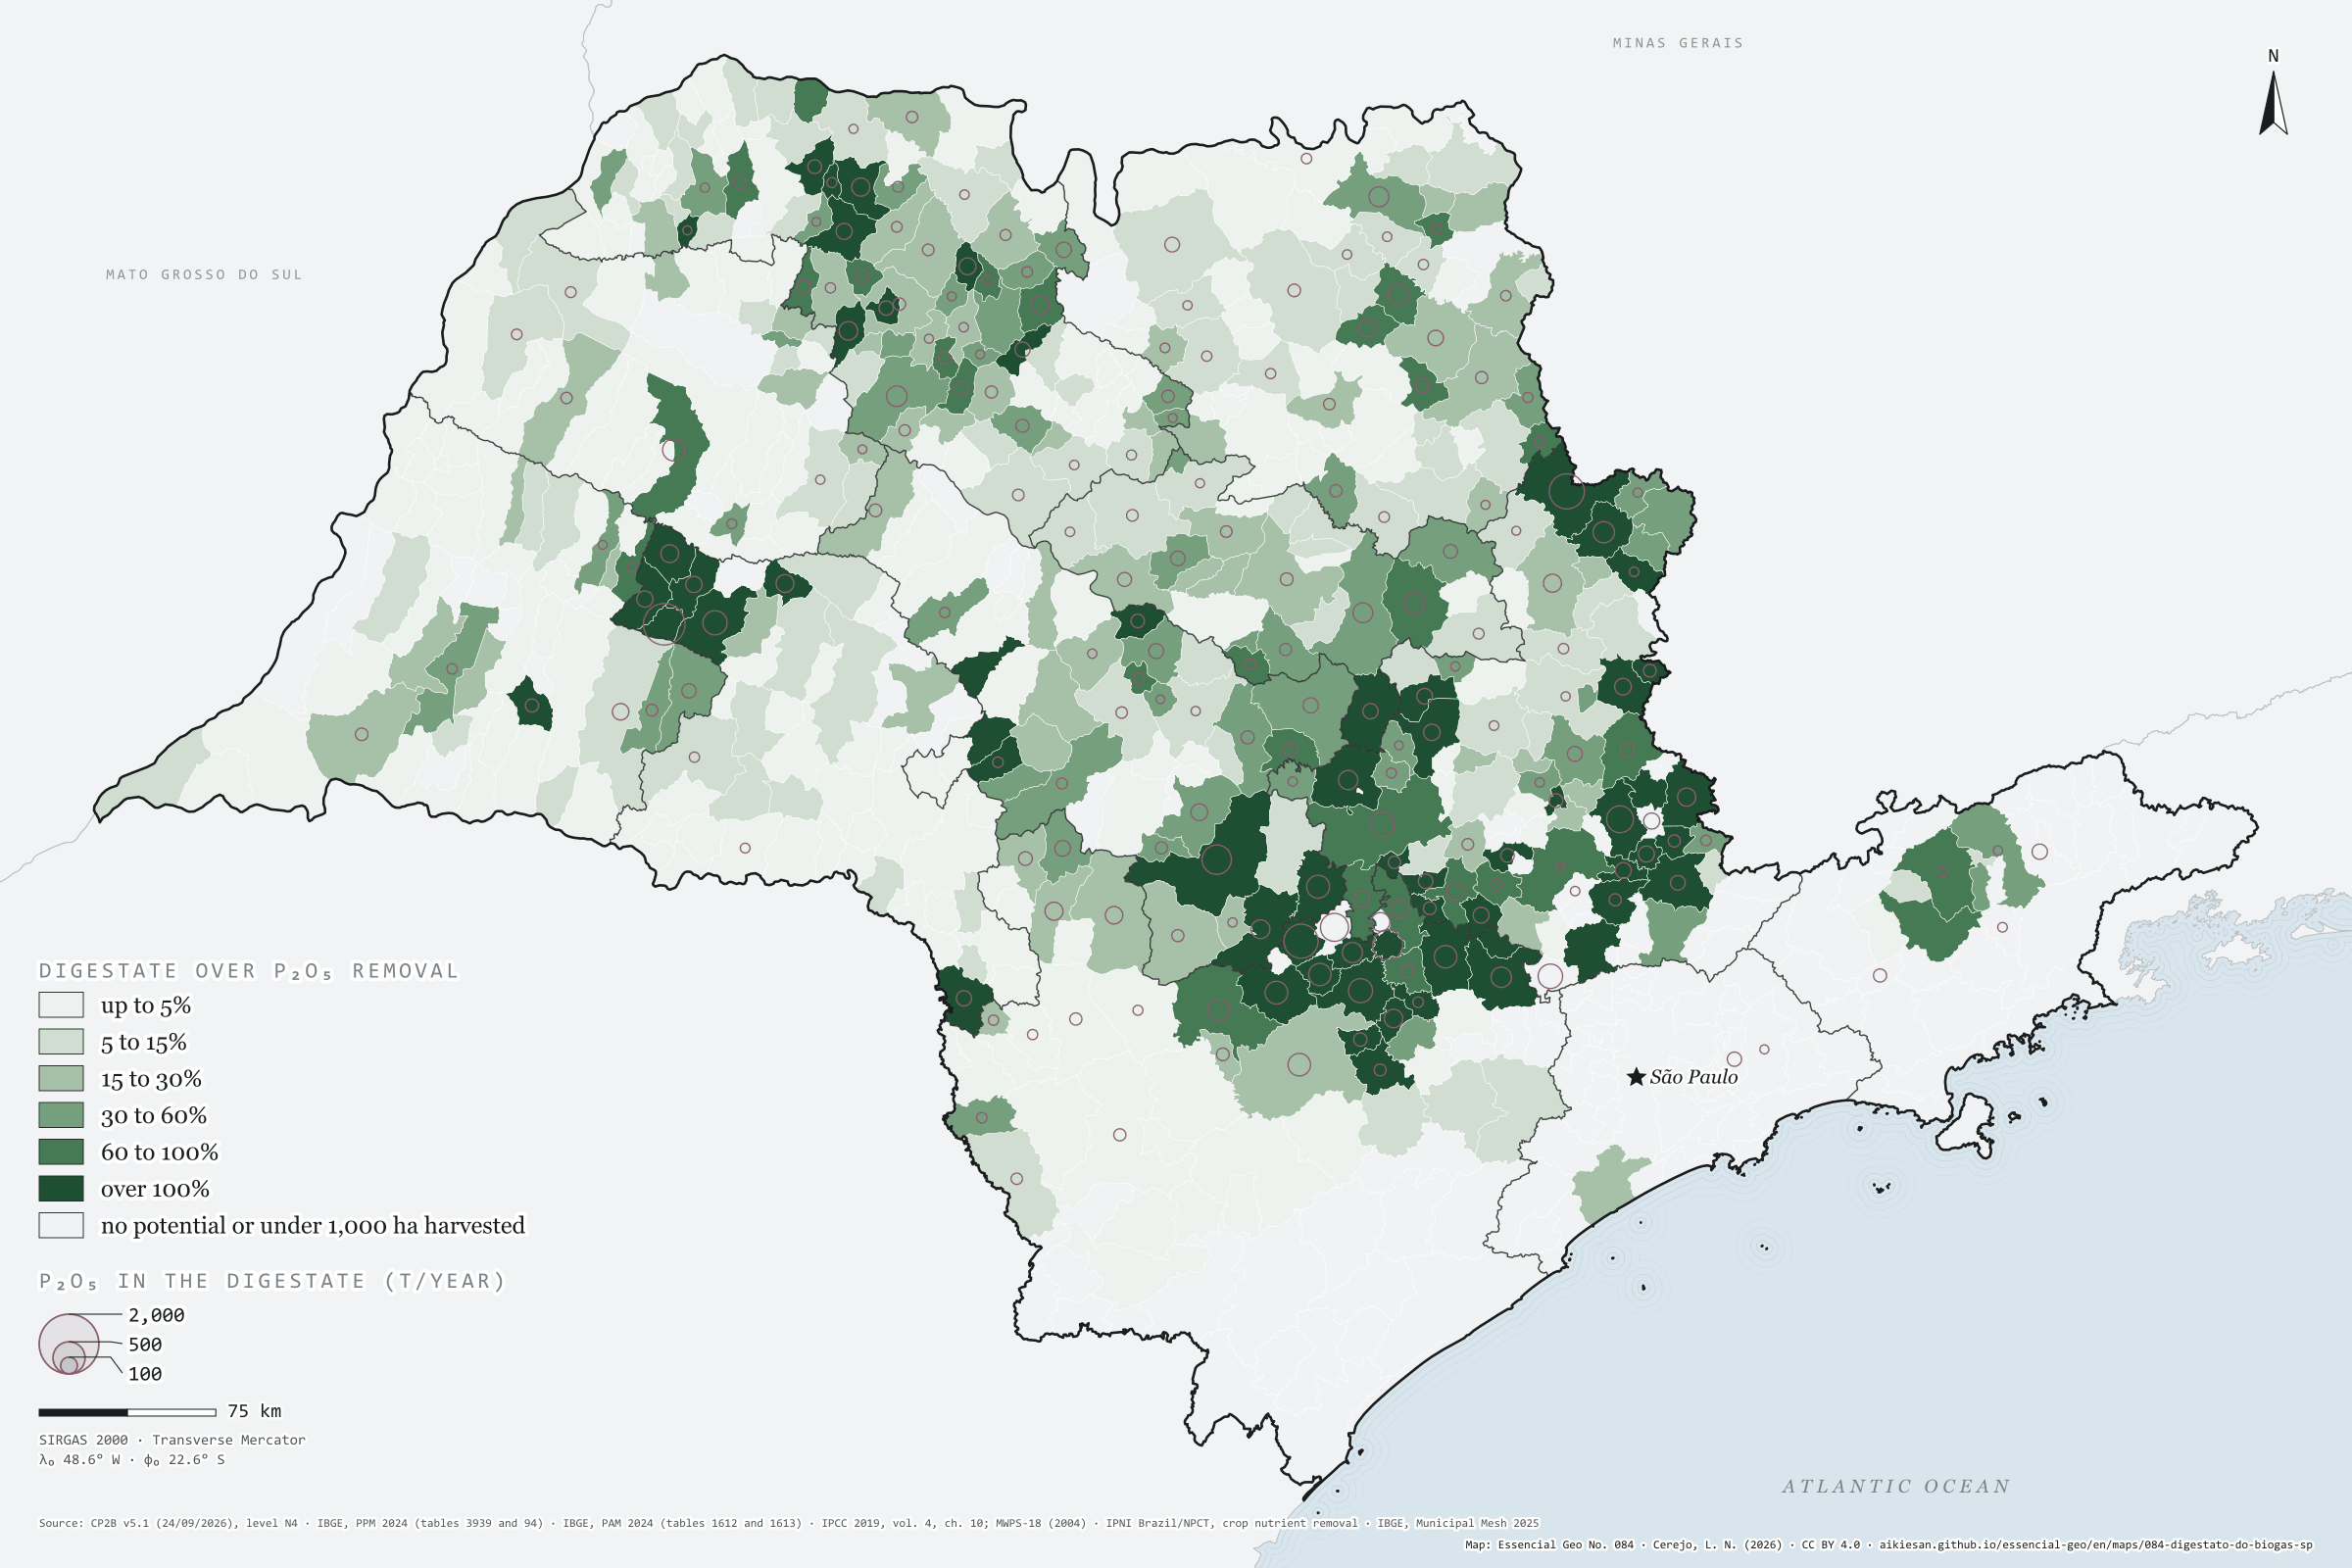
If manure went through digesters, 98,000 t of N and 49,000 t of P₂O₅ a year would return to the fields
Fig. 084São Paulo State (SP)EPSG:4674Source: CP2B (Unicamp), IBGE, IPCC, MidWest Plan Service, IPNI Brazil/NPCT
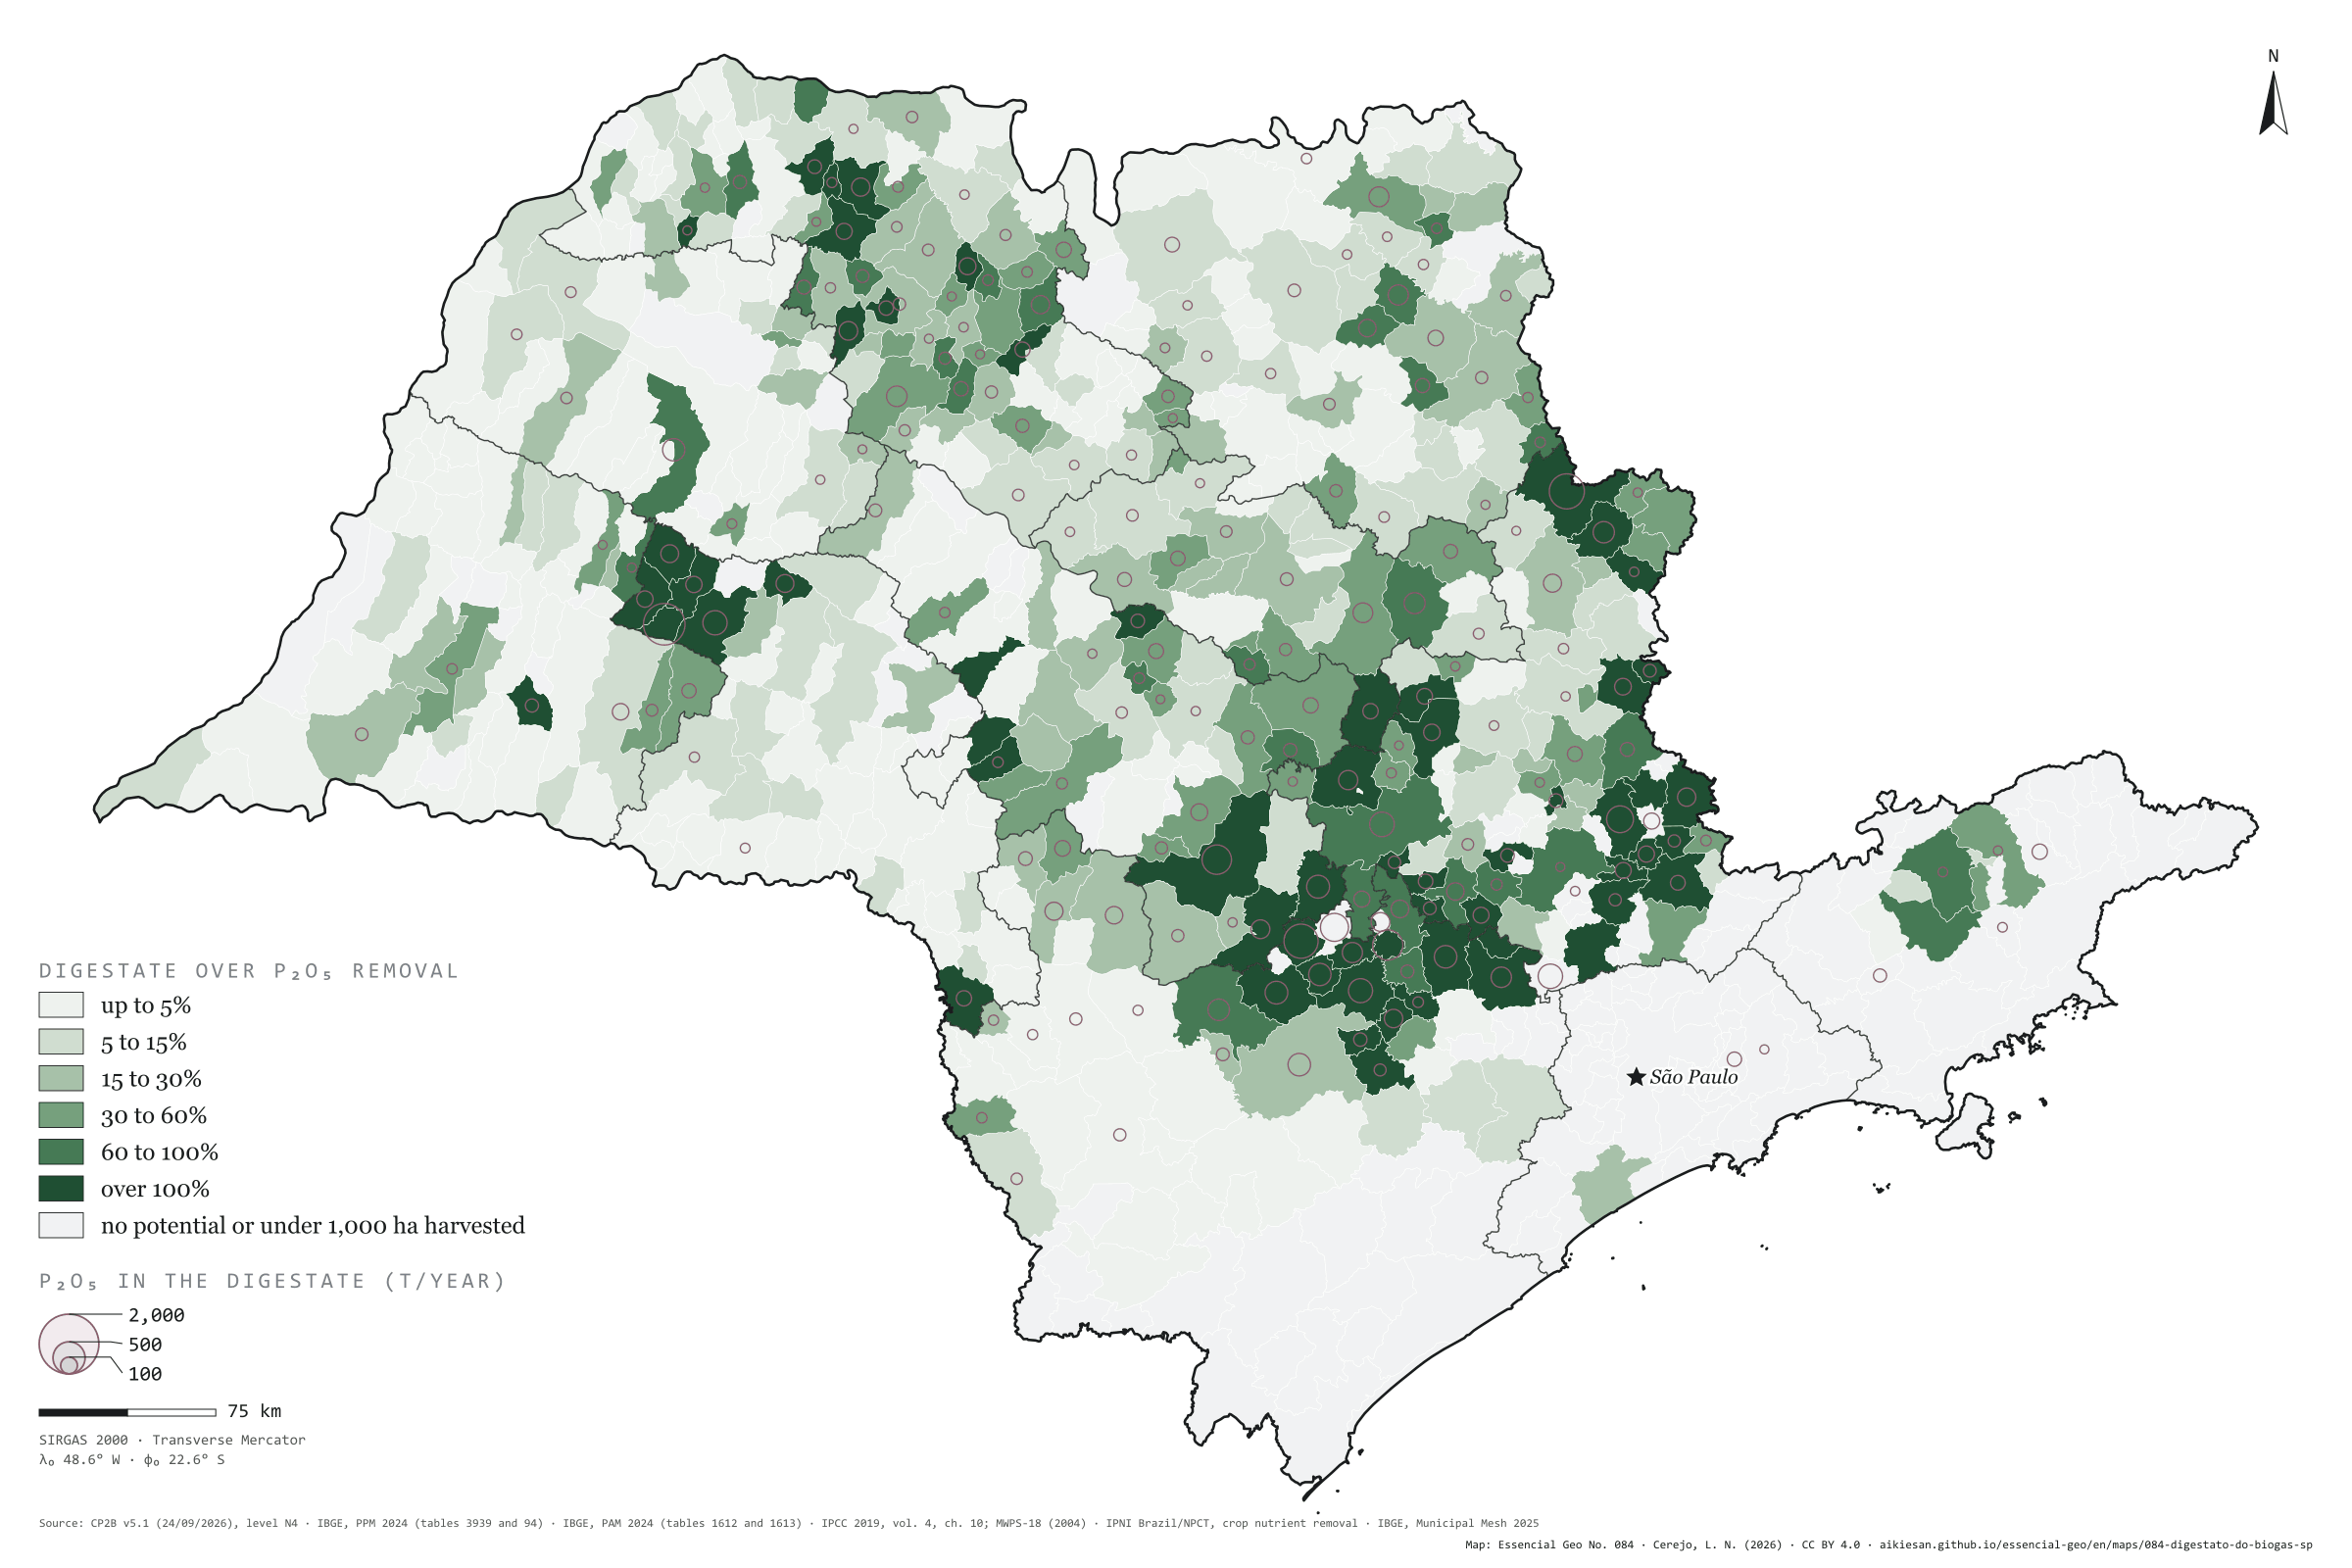
The biomethane potential of poultry, pig and cattle manure in São Paulo, at CP2B’s accessible level, is 1.29 million m³ a day. The digestate left by that biogas keeps the manure’s nutrients: about 98,000 tonnes of nitrogen, 49,000 of P₂O₅ and 48,000 of K₂O a year, equal to 25% of the phosphorus, 14% of the nitrogen and 9% of the potassium that the state’s harvests remove. Three quarters of the nitrogen would come from poultry farms. In 61 municipalities with at least 1,000 hectares harvested, digestate would supply all the P₂O₅ of the harvest. Bastos would have 2,200 tonnes of P₂O₅ in digestate, a hundred times what its crops remove; Botucatu, with 43,000 hectares of crops, 117%. Sugarcane, which makes up most of CP2B’s potential, is left out: vinasse, filter cake and straw already go back to the fields. Fourth and last plate of the collection “Manure that feeds the soil”.
Technical record · downloads · citation
At a glance
Nutrients in manure digestate (thousand t a year)
nitrogen (N)98
phosphorus (P₂O₅)49
potassium (K₂O)48
Origin of the digestate nitrogen (%)
poultry74.9%
cattle16.5%
pigs8.6%
Digestate P₂O₅ over the state’s crop removal
25%
1.29 million m³ of biomethane a day from the same potential
Layers
municipiospolygon645 municipalities: N, P₂O₅ and K₂O in manure digestate (CP2B N4), biomethane, and the share of crop removal it replaces (same GPKG as plate 081)
regioes_intermediariaspolygon11 intermediate geographic regions
Methane at level N4 of CP2B v5.1 (reference scenario) for manure from broilers and laying hens, pigs, and dairy, feedlot and grazing cattle, converted into equivalent head with each substrate’s mean parameters and multiplied by the N, P₂O₅ and K₂O excreted per head (IPCC 2019 and MWPS-18); digestate keeps these nutrients. Colour: digestate over the P₂O₅ removed by the municipality’s harvests (2024 PAM × IPNI), in six classes; circles: tonnes of P₂O₅.
The map without a frame, with legend, scale, reference system and credit written on it: ready for papers, lectures and slides. In two versions: with the basemap (neighbours and sea) or only the mapped area, on white.
CEREJO, Lucas Nakamura. O digestato do biogás: se os dejetos passassem pelo biodigestor, voltariam ao campo 98 mil t de N e 49 mil t de P₂O₅ por ano. Versão 1.0.0. [S. l.]: Essencial, 2026. Conjunto de dados. Disponível em: https://aikiesan.github.io/essencial-geo/en/maps/084-digestato-do-biogas-sp/. Acesso em: 10 nov. 2026.
Cerejo, L. N. (2026). O digestato do biogás: se os dejetos passassem pelo biodigestor, voltariam ao campo 98 mil t de N e 49 mil t de P₂O₅ por ano [Biogas digestate: If manure went through digesters, 98,000 t of N and 49,000 t of P₂O₅ a year would return to the fields] (Version 1.0.0) [Data set]. Essencial. https://aikiesan.github.io/essencial-geo/en/maps/084-digestato-do-biogas-sp/
@dataset{cerejo2026_digestato_do_biogas_sp,
  author    = {Cerejo, Lucas Nakamura},
  title     = {O digestato do biogás: Se os dejetos passassem pelo biodigestor, voltariam ao campo 98 mil t de N e 49 mil t de P₂O₅ por ano},
  year      = {2026},
  publisher = {Essencial},
  version   = {1.0.0},
  url       = {https://aikiesan.github.io/essencial-geo/en/maps/084-digestato-do-biogas-sp/},
  language  = {portuguese},
  note      = {English title: Biogas digestate: If manure went through digesters, 98,000 t of N and 49,000 t of P₂O₅ a year would return to the fields. Licence CC BY 4.0}
}
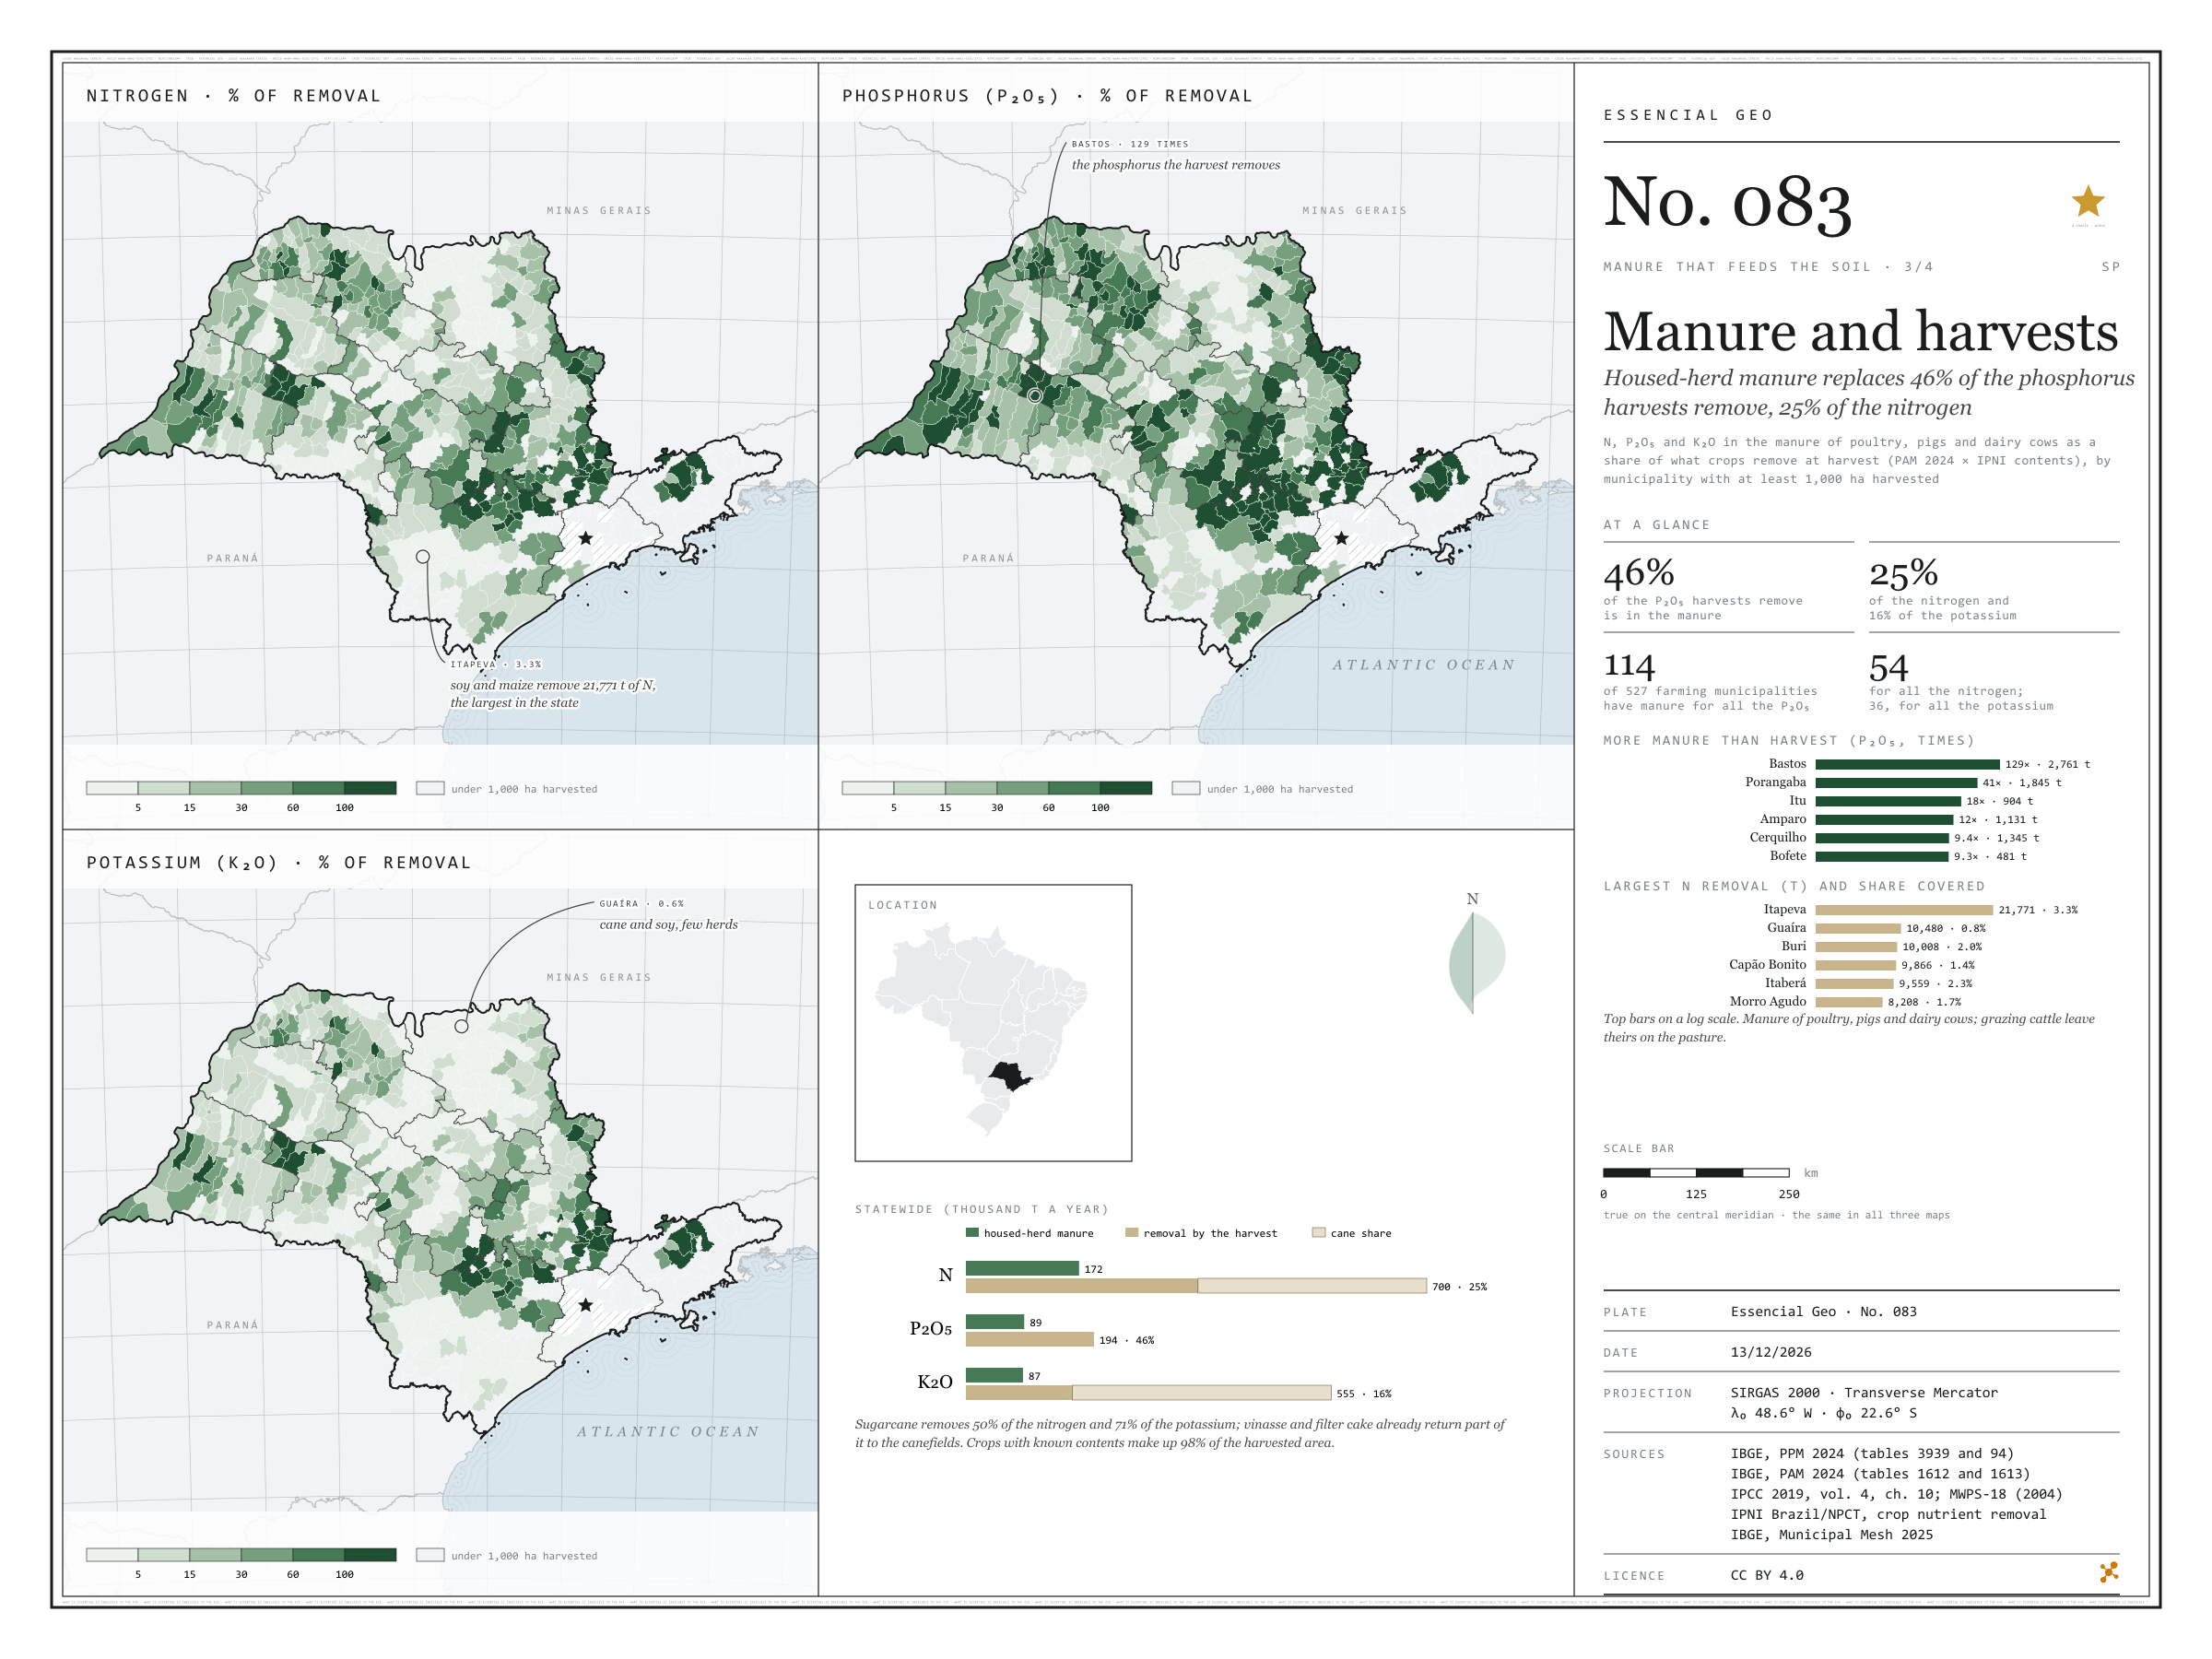
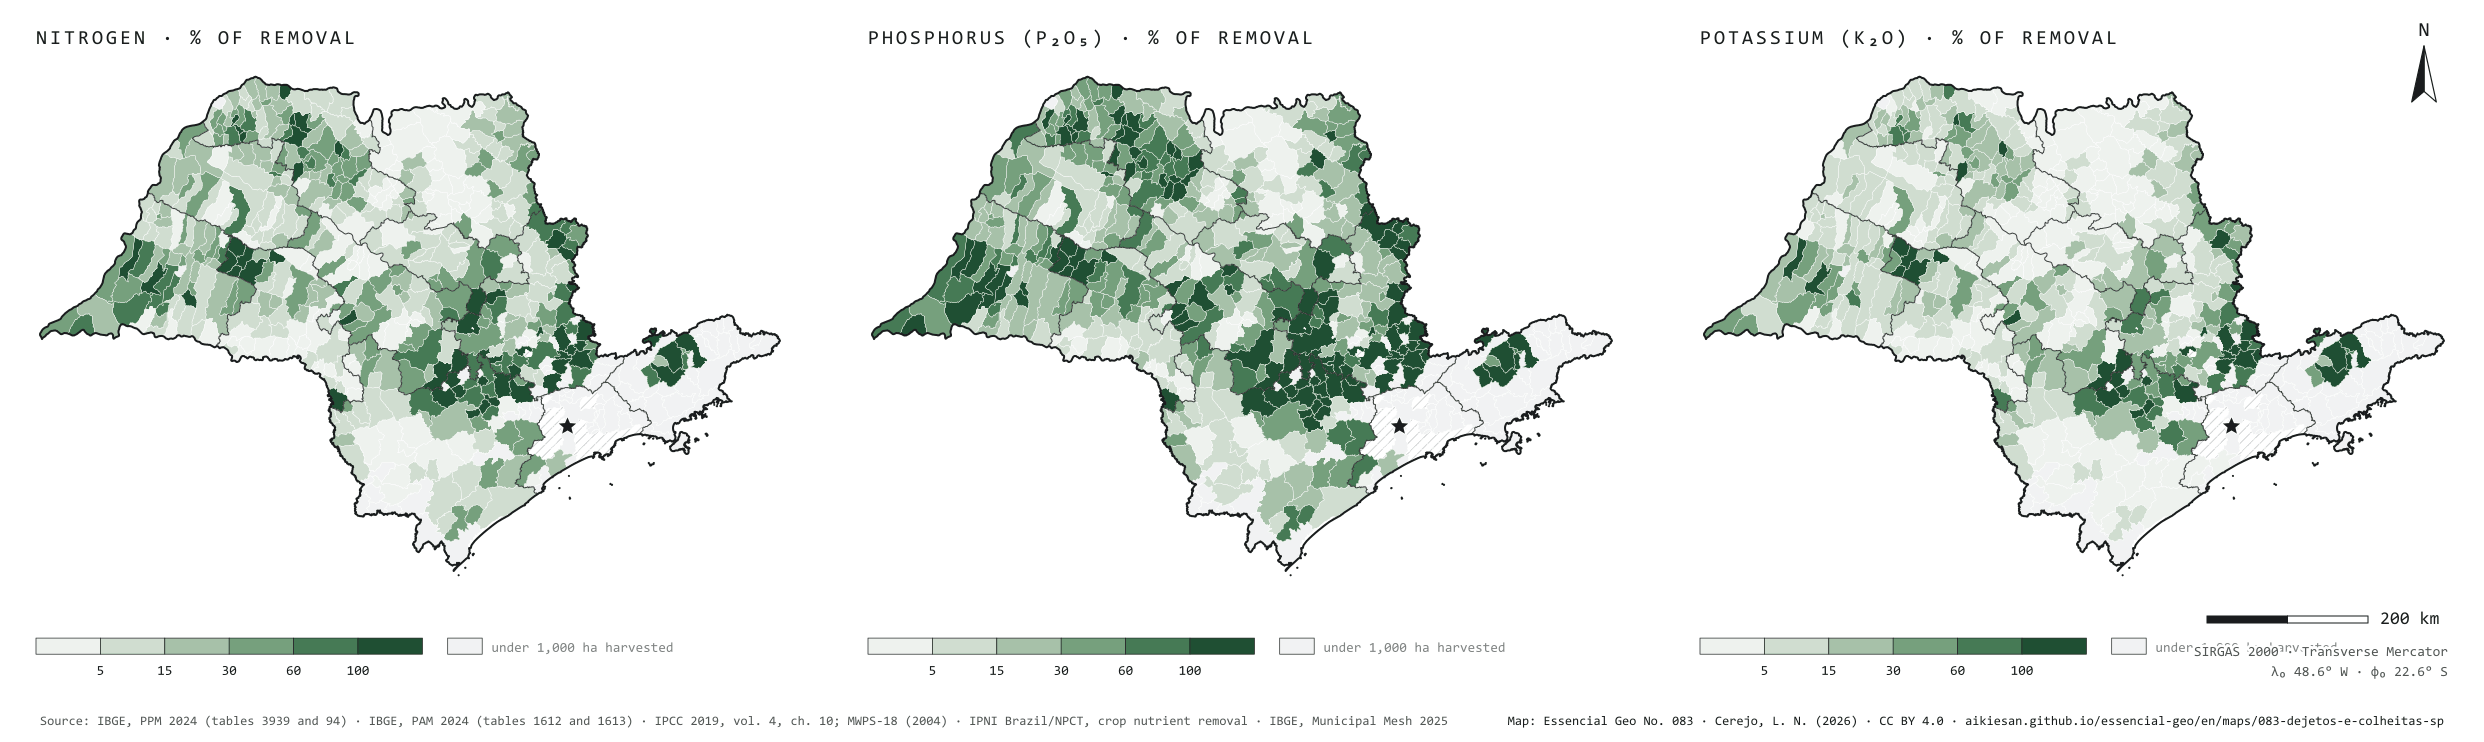
Housed-herd manure replaces 46% of the phosphorus harvests remove, 25% of the nitrogen
Fig. 083São Paulo State (SP)EPSG:4674Source: IBGE, IPNI Brazil/NPCT, IPCC, MidWest Plan Service
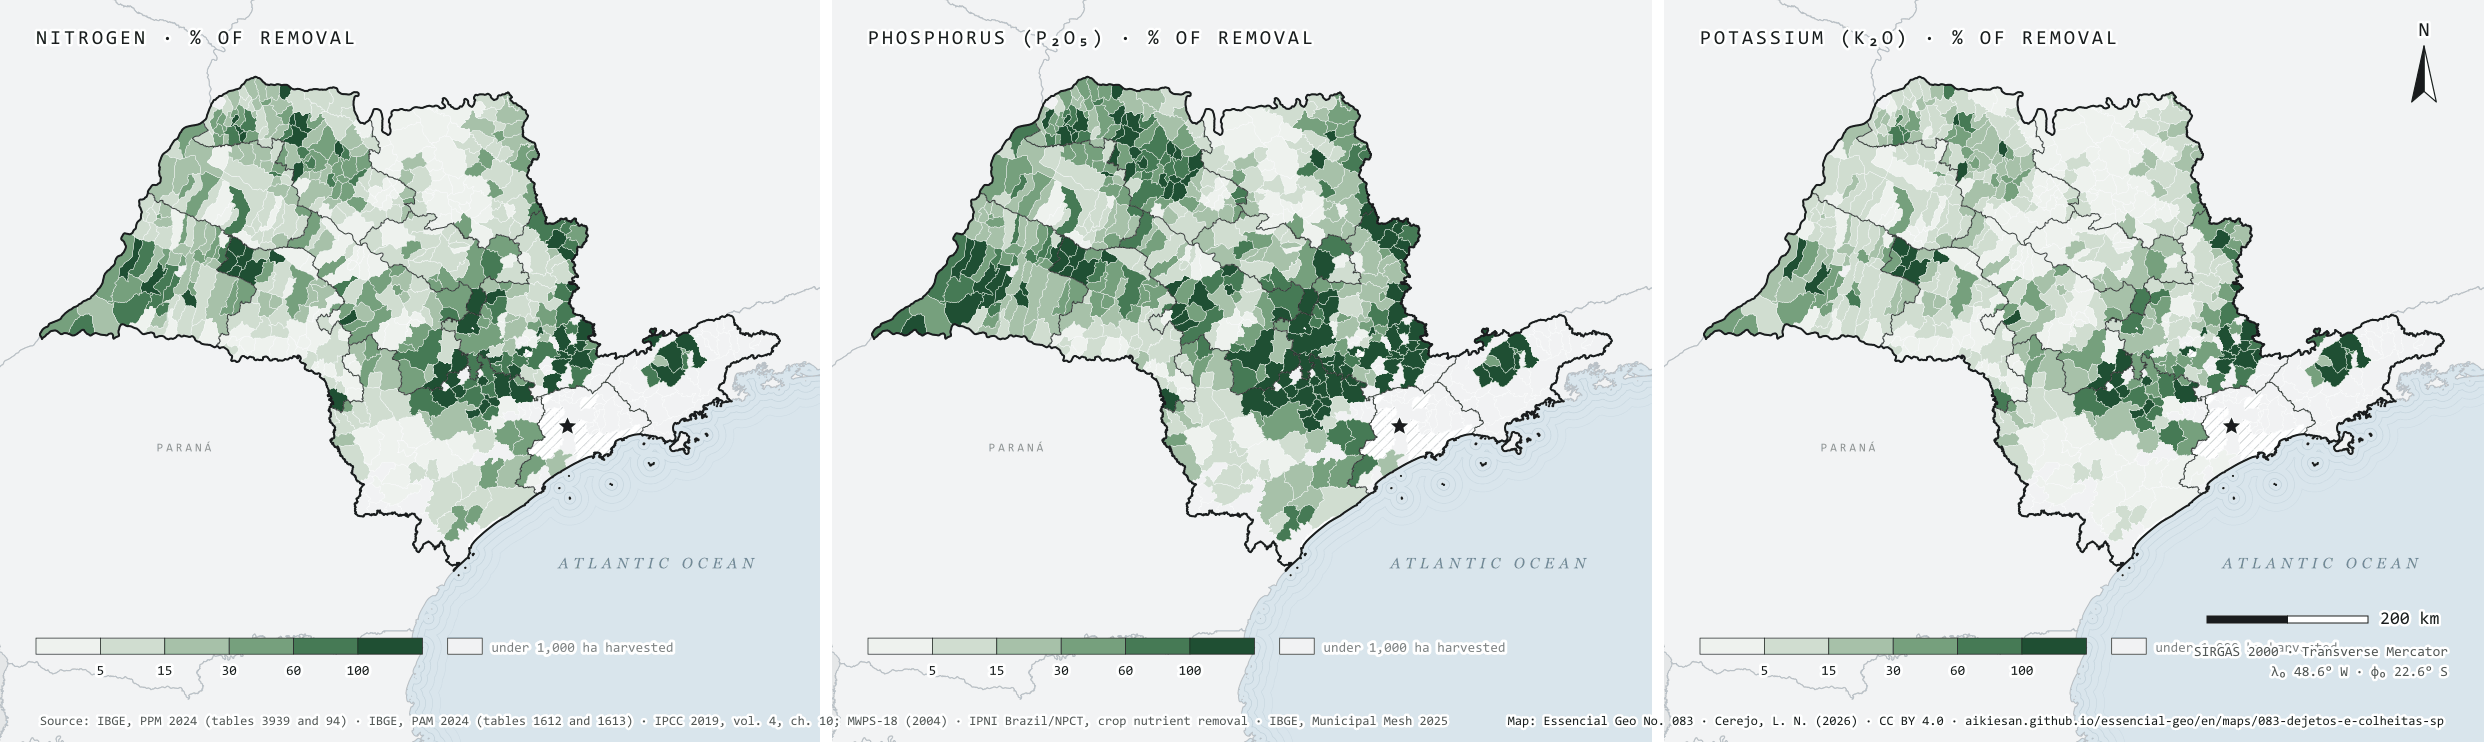
São Paulo’s harvests take from the soil, every year, about 700,000 tonnes of nitrogen, 194,000 of P₂O₅ and 555,000 of K₂O, by 2024 PAM production and IPNI contents. The manure of poultry, pigs and dairy cows, the part that can be collected, holds 172,000, 89,000 and 87,000: it replaces 46% of the phosphorus, 25% of the nitrogen and 16% of the potassium. Sugarcane weighs on the account: it removes half the nitrogen and 71% of the potassium, and part of that returns to the canefields with vinasse and filter cake. Of the 527 municipalities with at least 1,000 hectares harvested, 114 have manure to replace all the phosphorus, 54 all the nitrogen and 36 all the potassium. In the grain regions the account does not balance: Itapeva removes 21,800 tonnes of N at harvest, and local manure covers 3.3%. Third plate of the collection “Manure that feeds the soil”.
Technical record · downloads · citation
At a glance
Share of crop removal that housed-herd manure replaces, statewide (%)
phosphorus (P₂O₅)46
nitrogen (N)25
potassium (K₂O)16
Crop removal and housed-herd manure (thousand t a year)
N removed700
N in manure172
P₂O₅ removed194
P₂O₅ in manure89
K₂O removed555
K₂O in manure87
Farming municipalities with manure for all the harvest’s phosphorus
114of 527
with at least 1,000 hectares harvested
Layers
municipiospolygon645 municipalities: housed-herd manure, crop removal of N, P₂O₅ and K₂O and coverage (same GPKG as plate 081)
regioes_intermediariaspolygon11 intermediate geographic regions
N, P₂O₅ and K₂O in poultry, pig and dairy manure (2024 PPM × IPCC 2019 and MWPS-18) over the N, P₂O₅ and K₂O removed by the municipality’s temporary and permanent crops (2024 PAM production × IPNI Brazil contents in the harvested product), in six classes, in municipalities with at least 1,000 hectares harvested.
The map without a frame, with legend, scale, reference system and credit written on it: ready for papers, lectures and slides. In two versions: with the basemap (neighbours and sea) or only the mapped area, on white.
CEREJO, Lucas Nakamura. Dejetos e colheitas: o esterco confinado repõe 46% do fósforo que as colheitas levam, 25% do nitrogênio. Versão 1.0.0. [S. l.]: Essencial, 2026. Conjunto de dados. Disponível em: https://aikiesan.github.io/essencial-geo/en/maps/083-dejetos-e-colheitas-sp/. Acesso em: 10 nov. 2026.
Cerejo, L. N. (2026). Dejetos e colheitas: o esterco confinado repõe 46% do fósforo que as colheitas levam, 25% do nitrogênio [Manure and harvests: Housed-herd manure replaces 46% of the phosphorus harvests remove, 25% of the nitrogen] (Version 1.0.0) [Data set]. Essencial. https://aikiesan.github.io/essencial-geo/en/maps/083-dejetos-e-colheitas-sp/
@dataset{cerejo2026_dejetos_e_colheitas_sp,
  author    = {Cerejo, Lucas Nakamura},
  title     = {Dejetos e colheitas: O esterco confinado repõe 46% do fósforo que as colheitas levam, 25% do nitrogênio},
  year      = {2026},
  publisher = {Essencial},
  version   = {1.0.0},
  url       = {https://aikiesan.github.io/essencial-geo/en/maps/083-dejetos-e-colheitas-sp/},
  language  = {portuguese},
  note      = {English title: Manure and harvests: Housed-herd manure replaces 46% of the phosphorus harvests remove, 25% of the nitrogen. Licence CC BY 4.0}
}
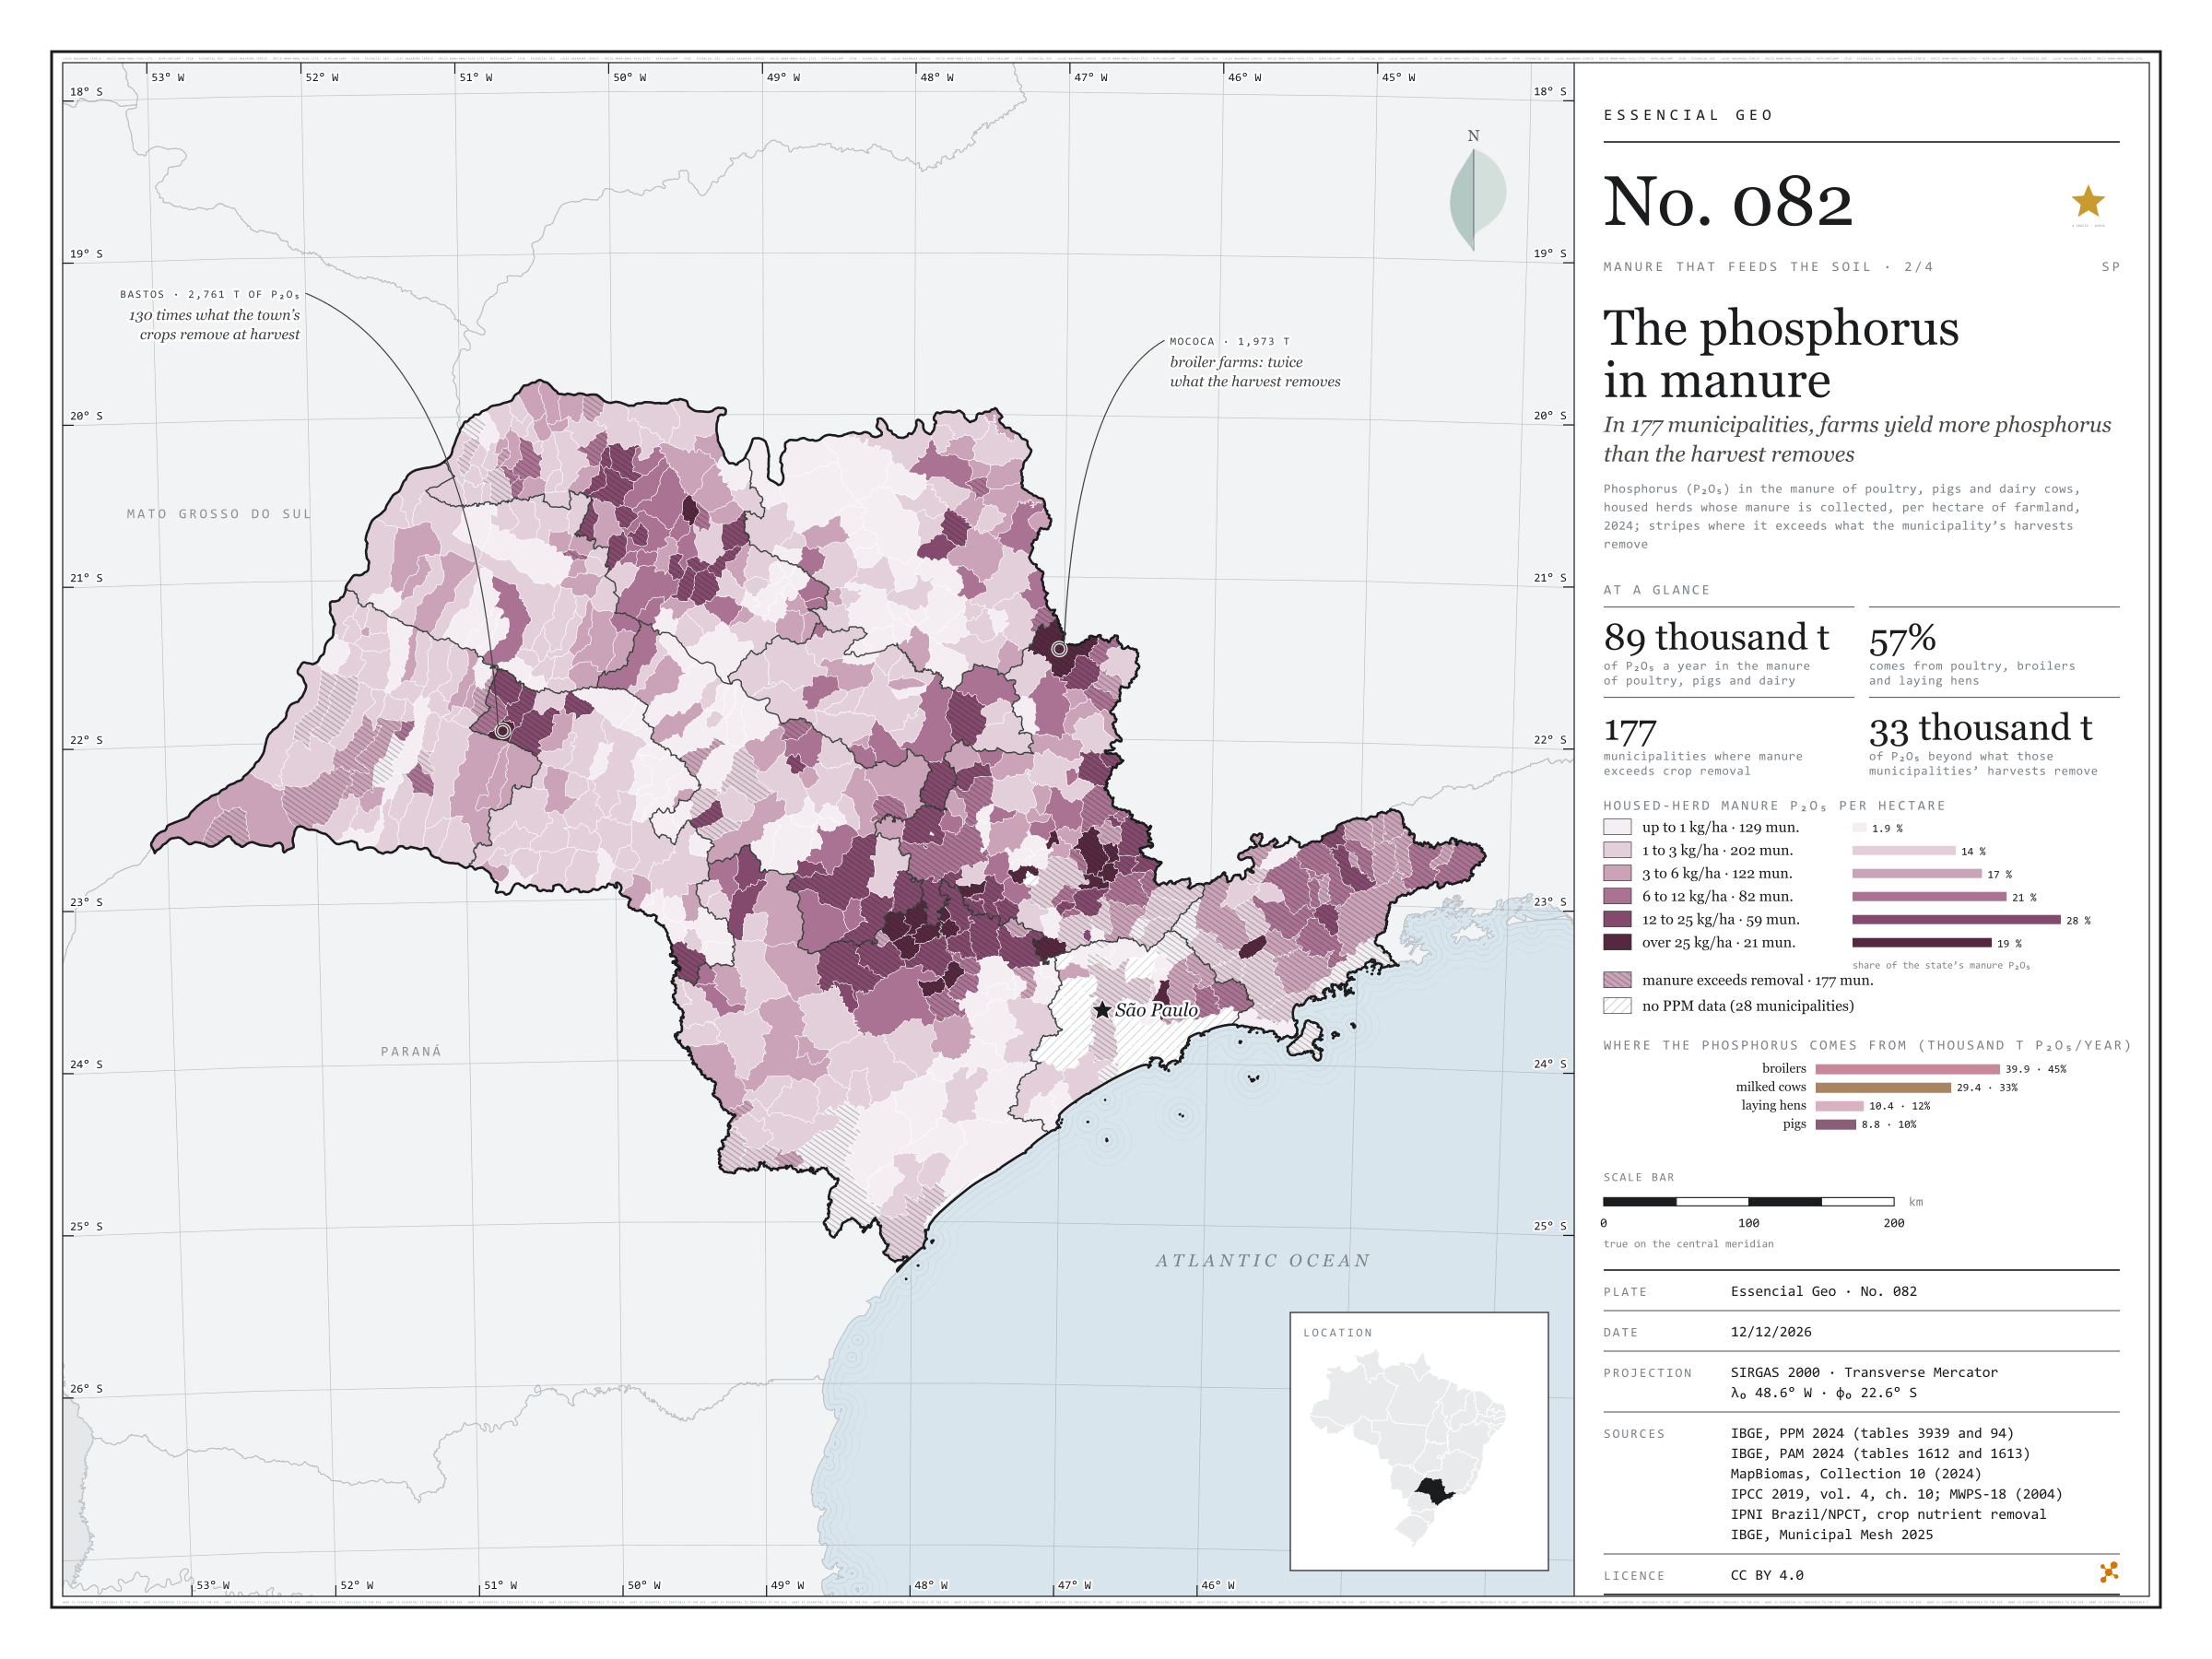
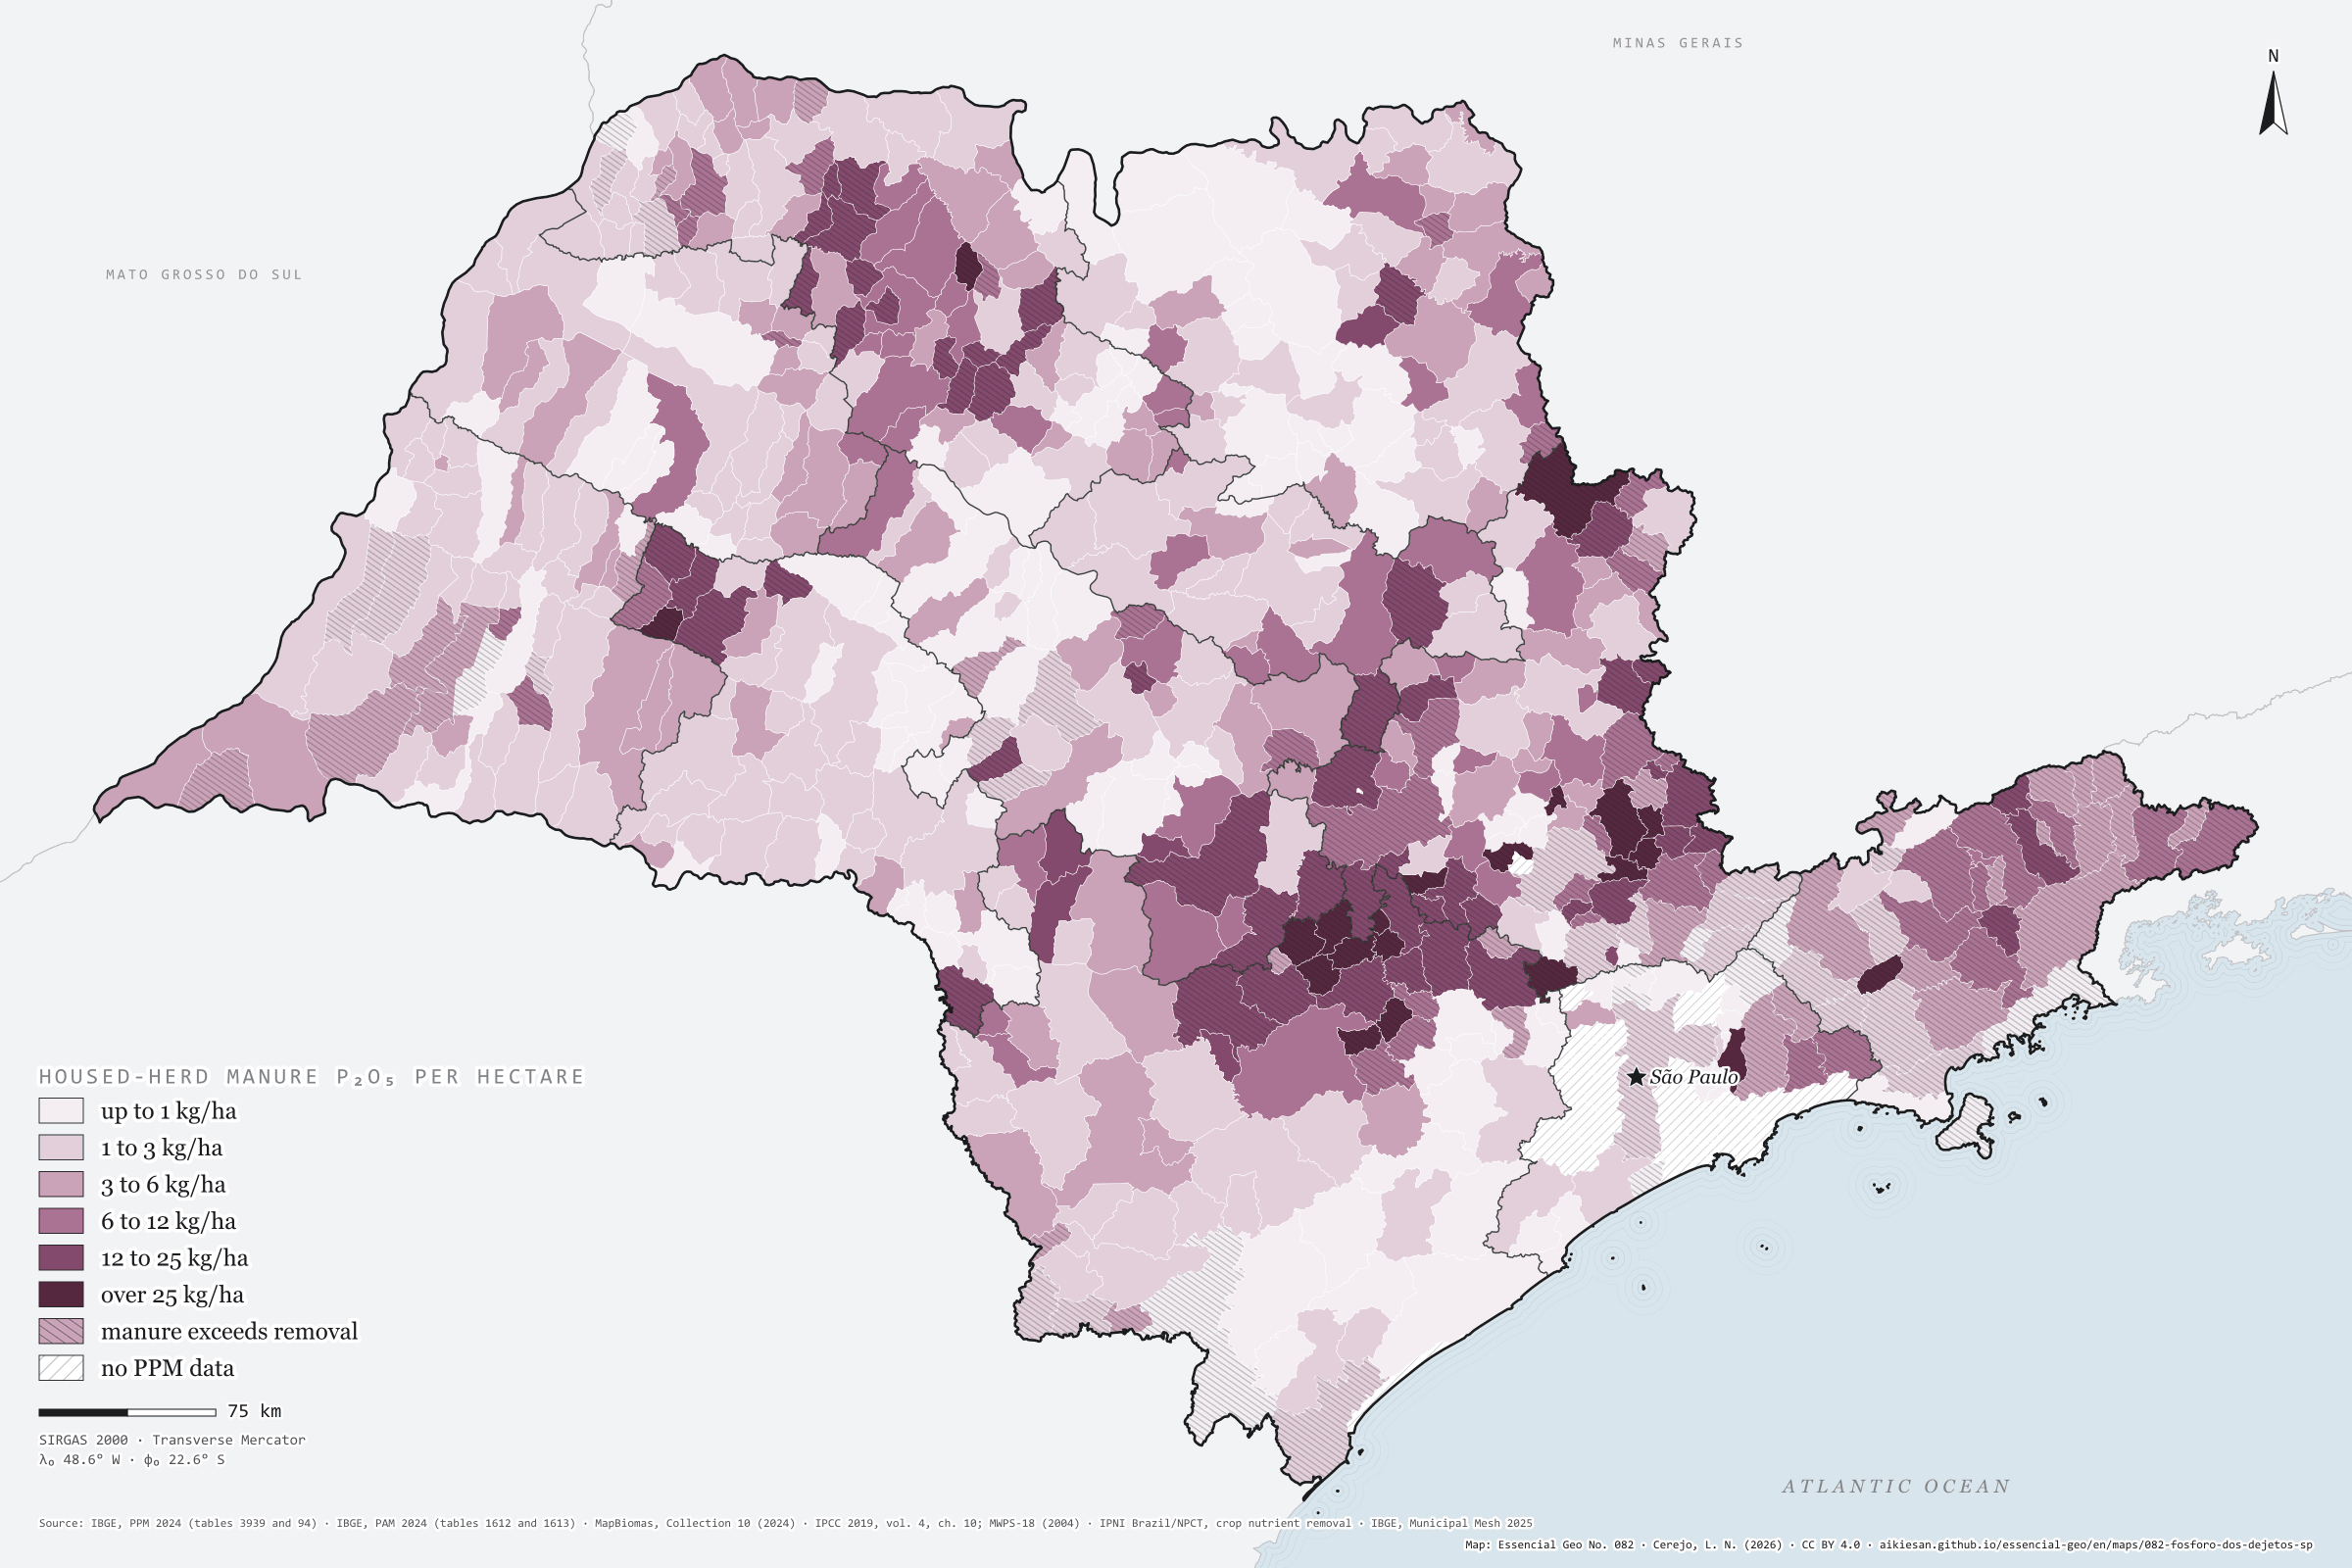
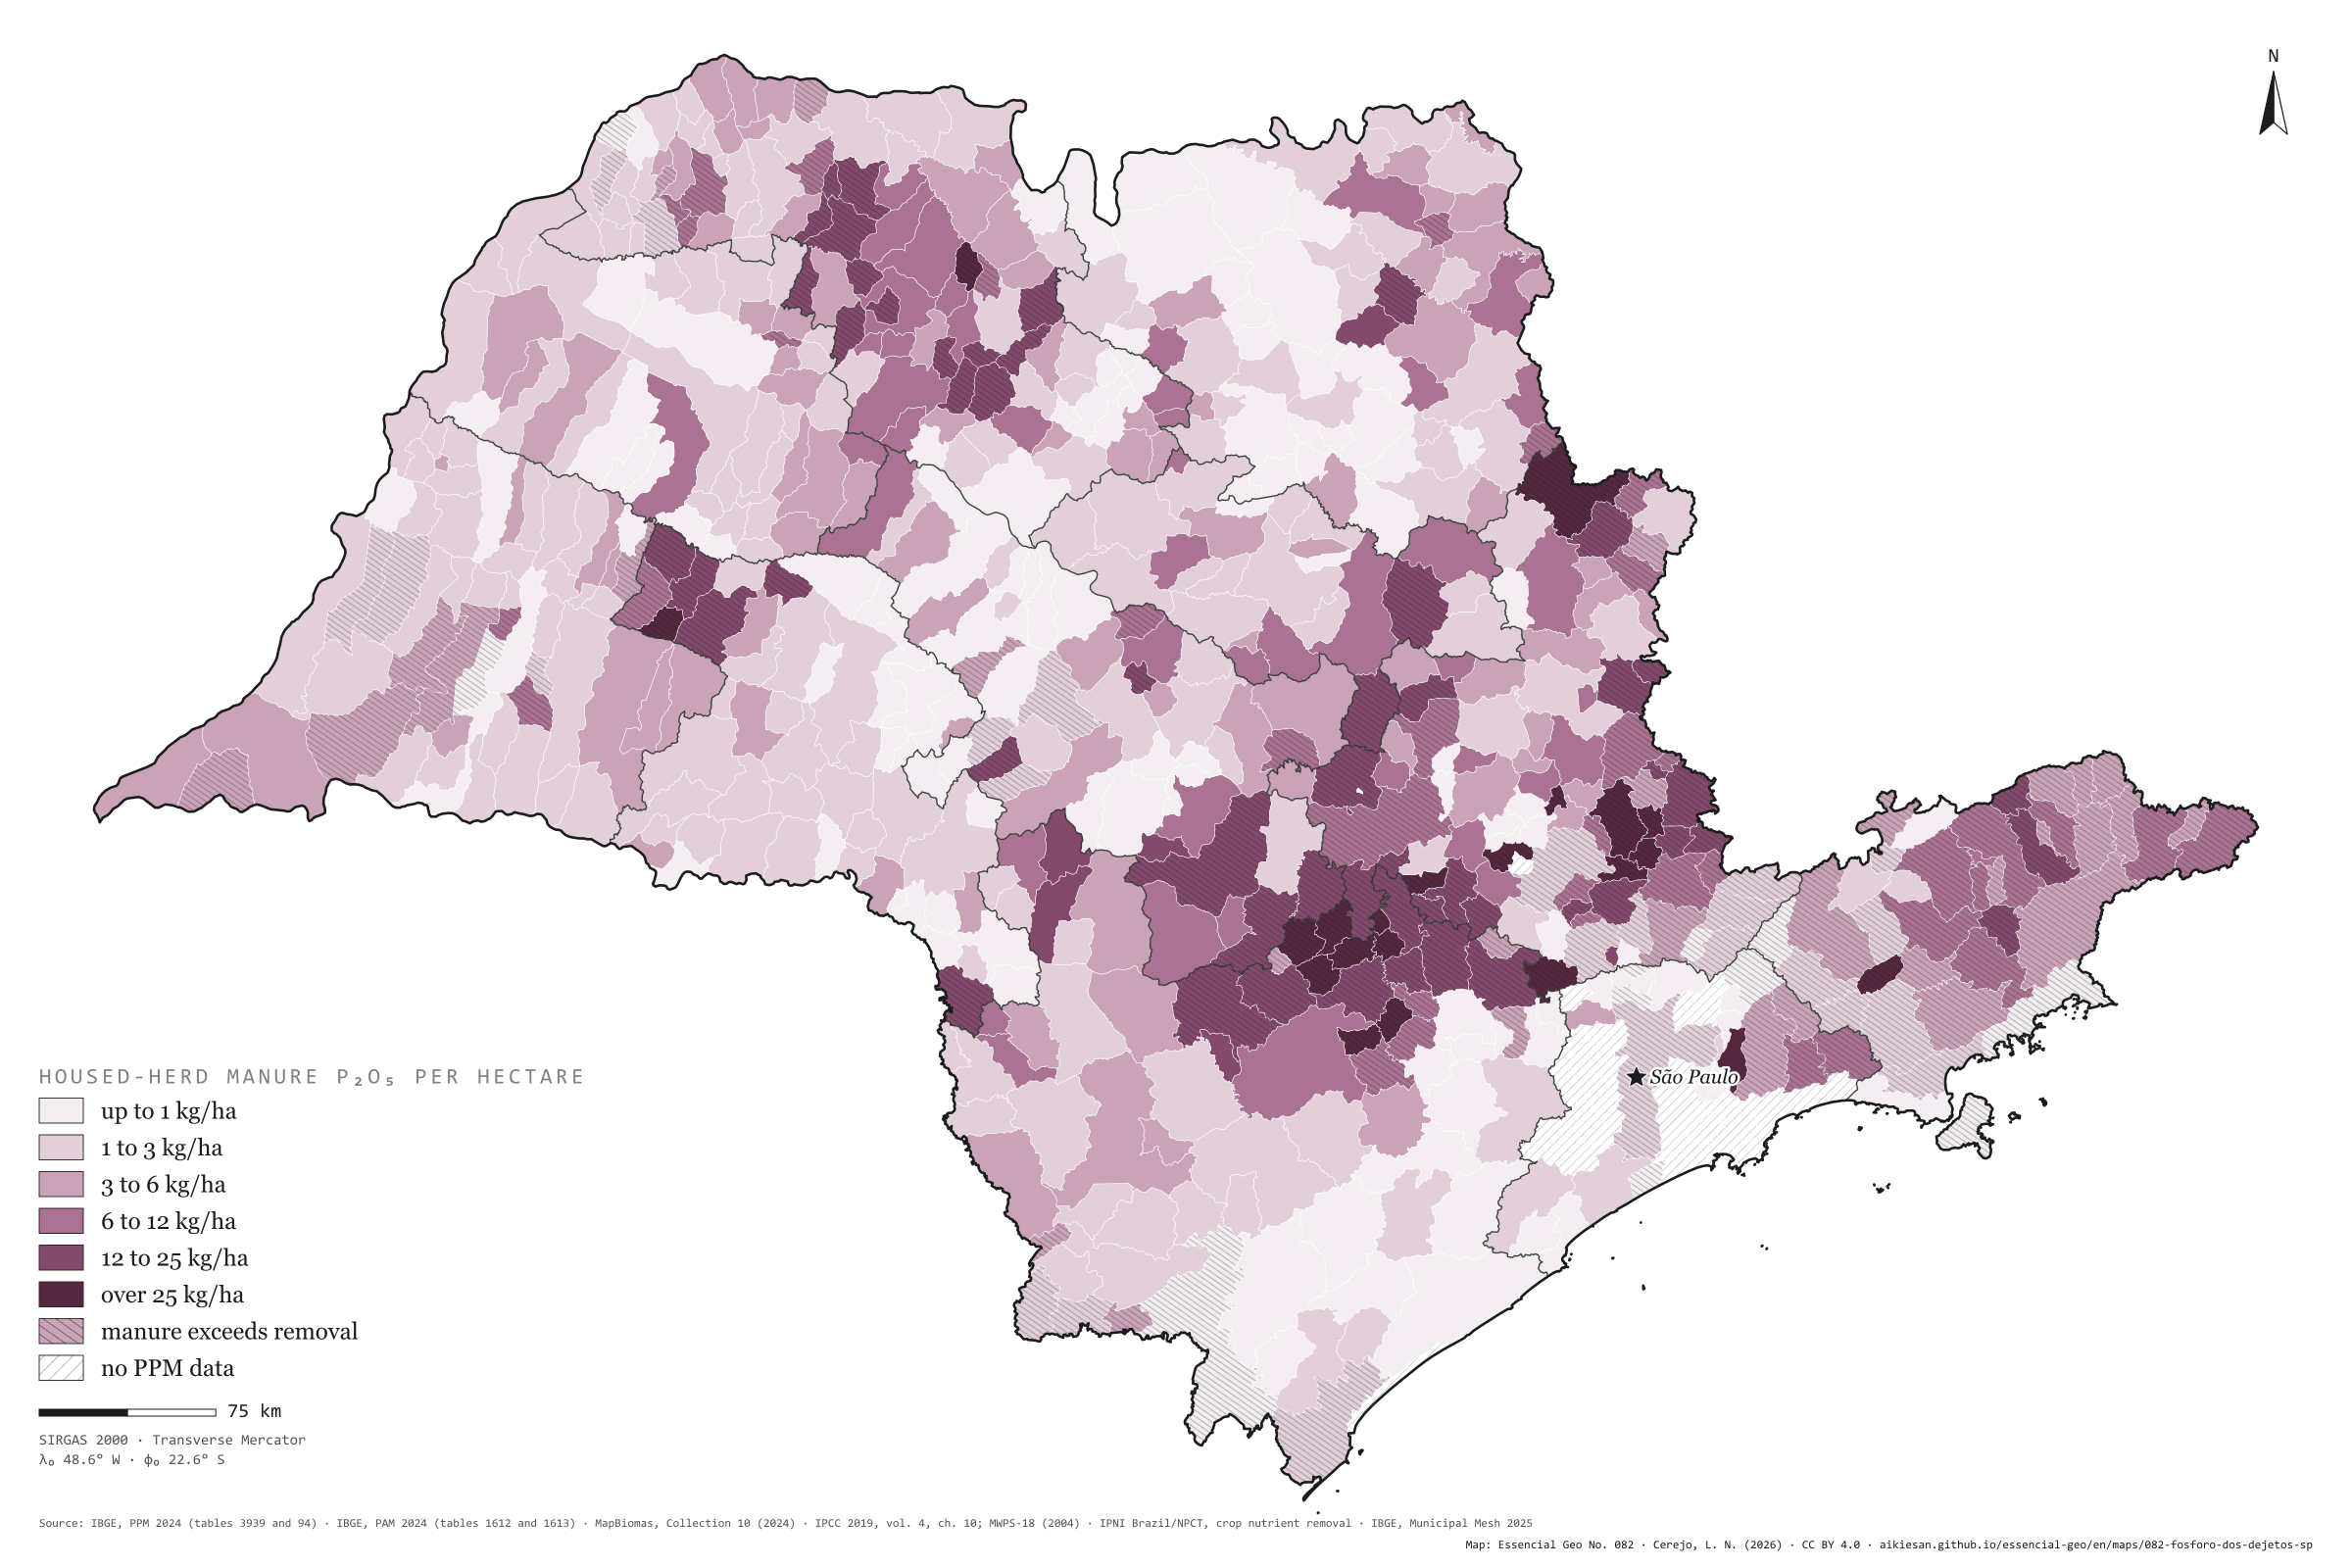
In 177 municipalities, farms yield more phosphorus than the harvest removes
Fig. 082São Paulo State (SP)EPSG:4674Source: IBGE, MapBiomas, IPCC, MidWest Plan Service, IPNI Brazil/NPCT
Poultry, pigs and dairy cows live in sheds and byres, and their manure can be collected: about 88,500 tonnes of P₂O₅ a year in São Paulo, 5.2 kg per farmland hectare. Broilers give 45%, milked cows 33%, laying hens 12% and pigs 10%. Phosphorus builds up where farms cluster: Bastos has 188 kg of P₂O₅ per hectare, Cerquilho 131, Jumirim 98, Cabreúva and Porangaba 81. In 177 municipalities, manure phosphorus exceeds what the municipality’s own harvests remove; together they hold 51,000 tonnes of P₂O₅ in manure, 33,000 more than their crops take. In Bastos, manure holds 130 times the phosphorus of the harvest; in Mococa, with 6.75 million broilers, twice as much. Second plate of the collection “Manure that feeds the soil”.
Technical record · downloads · citation
At a glance
Housed-herd manure P₂O₅ by the municipality’s kg per hectare class (t P₂O₅ a year)
up to 1 kg/ha1.9%
1 to 3 kg/ha13.8%
3 to 6 kg/ha17.3%
6 to 12 kg/ha20.6%
12 to 25 kg/ha27.8%
over 25 kg/ha18.6%
Manure P₂O₅ by herd (thousand t P₂O₅ a year)
broilers40
milked cows29
laying hens10
pigs8.8
Municipalities where manure phosphorus exceeds crop removal
177municipalities
33,000 t of P₂O₅ beyond what the harvests remove
Layers
municipiospolygon645 municipalities: herds, housed-herd manure N, P₂O₅ and K₂O, P₂O₅ per hectare and crop removal (same GPKG as plate 081)
regioes_intermediariaspolygon11 intermediate geographic regions
Head counts of hens, broilers, pigs, sows and milked cows in the 2024 PPM times the P₂O₅ excreted per head per year (IPCC 2019 nitrogen times the MWPS-18 P₂O₅/N ratio), per hectare of 2024 MapBiomas farmland, in six classes; stripes where that P₂O₅ exceeds the municipality’s crop removal (2024 PAM × IPNI contents).
The map without a frame, with legend, scale, reference system and credit written on it: ready for papers, lectures and slides. In two versions: with the basemap (neighbours and sea) or only the mapped area, on white.
CEREJO, Lucas Nakamura. O fósforo dos dejetos: em 177 municípios, as granjas dão mais fósforo do que a colheita leva. Versão 1.0.0. [S. l.]: Essencial, 2026. Conjunto de dados. Disponível em: https://aikiesan.github.io/essencial-geo/en/maps/082-fosforo-dos-dejetos-sp/. Acesso em: 10 nov. 2026.
Cerejo, L. N. (2026). O fósforo dos dejetos: em 177 municípios, as granjas dão mais fósforo do que a colheita leva [The phosphorus in manure: In 177 municipalities, farms yield more phosphorus than the harvest removes] (Version 1.0.0) [Data set]. Essencial. https://aikiesan.github.io/essencial-geo/en/maps/082-fosforo-dos-dejetos-sp/
@dataset{cerejo2026_fosforo_dos_dejetos_sp,
  author    = {Cerejo, Lucas Nakamura},
  title     = {O fósforo dos dejetos: Em 177 municípios, as granjas dão mais fósforo do que a colheita leva},
  year      = {2026},
  publisher = {Essencial},
  version   = {1.0.0},
  url       = {https://aikiesan.github.io/essencial-geo/en/maps/082-fosforo-dos-dejetos-sp/},
  language  = {portuguese},
  note      = {English title: The phosphorus in manure: In 177 municipalities, farms yield more phosphorus than the harvest removes. Licence CC BY 4.0}
}
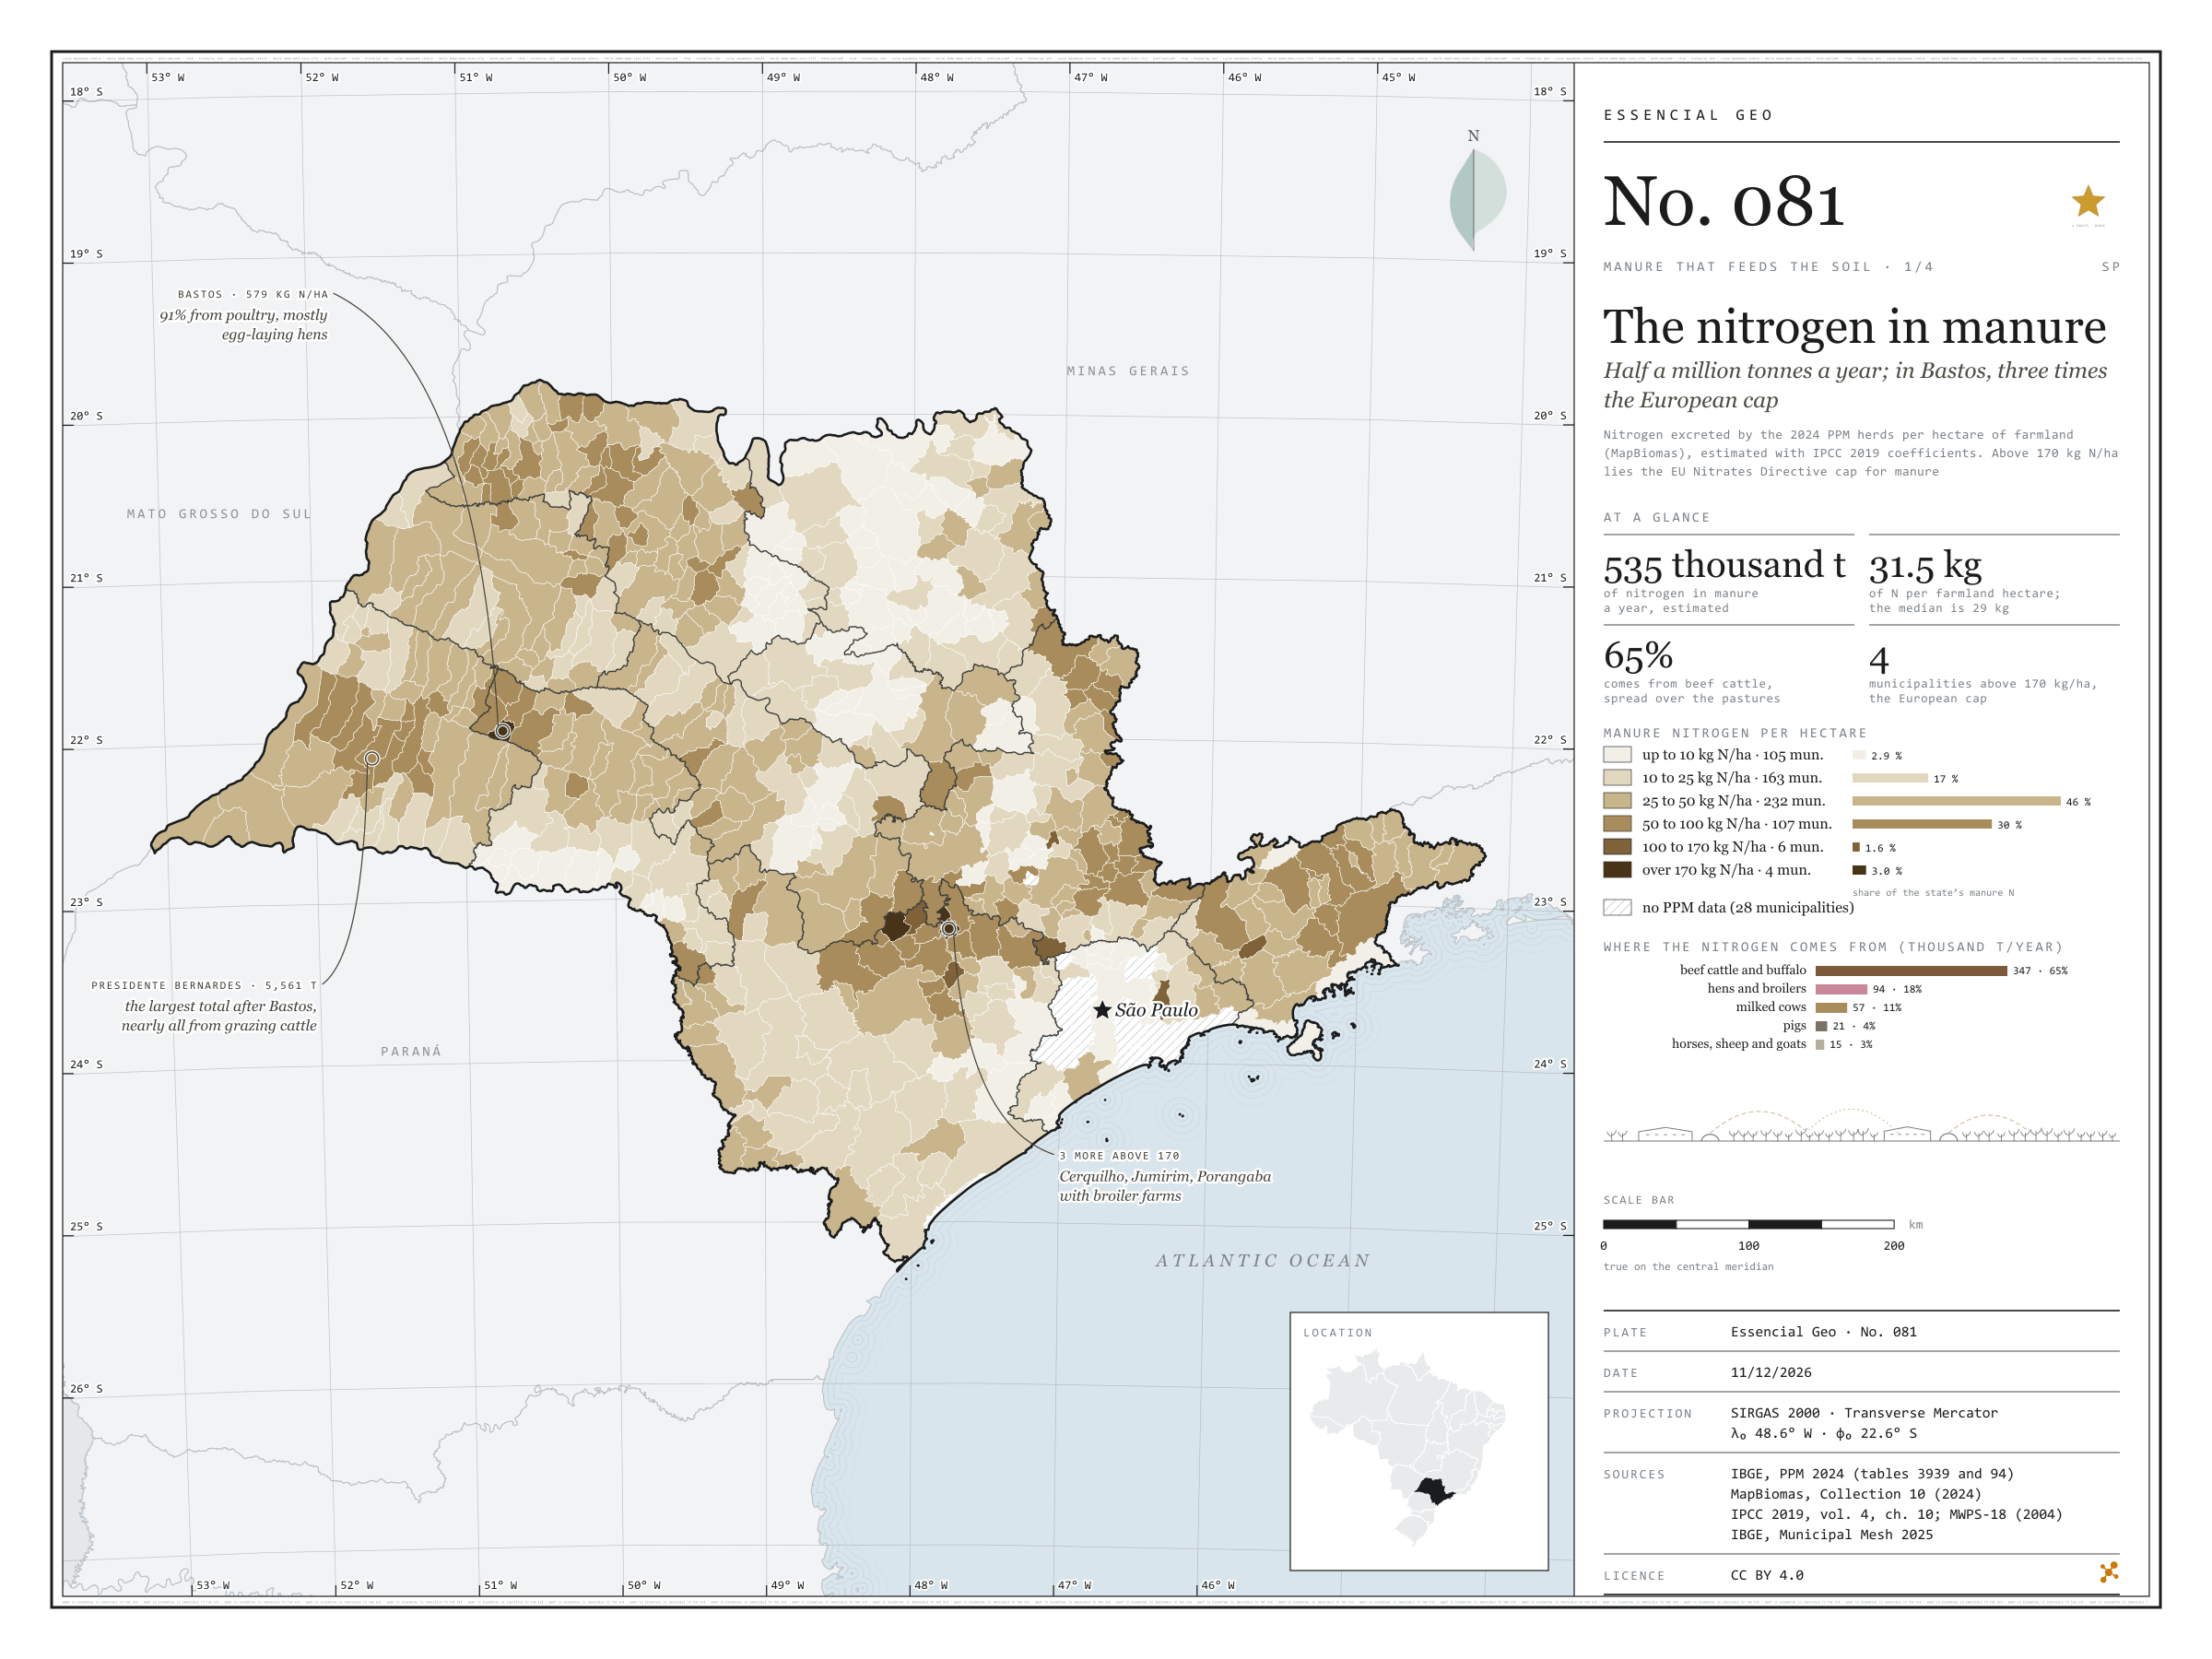
Half a million tonnes a year; in Bastos, three times the European cap
Fig. 081São Paulo State (SP)EPSG:4674Source: IBGE, MapBiomas, IPCC, MidWest Plan Service
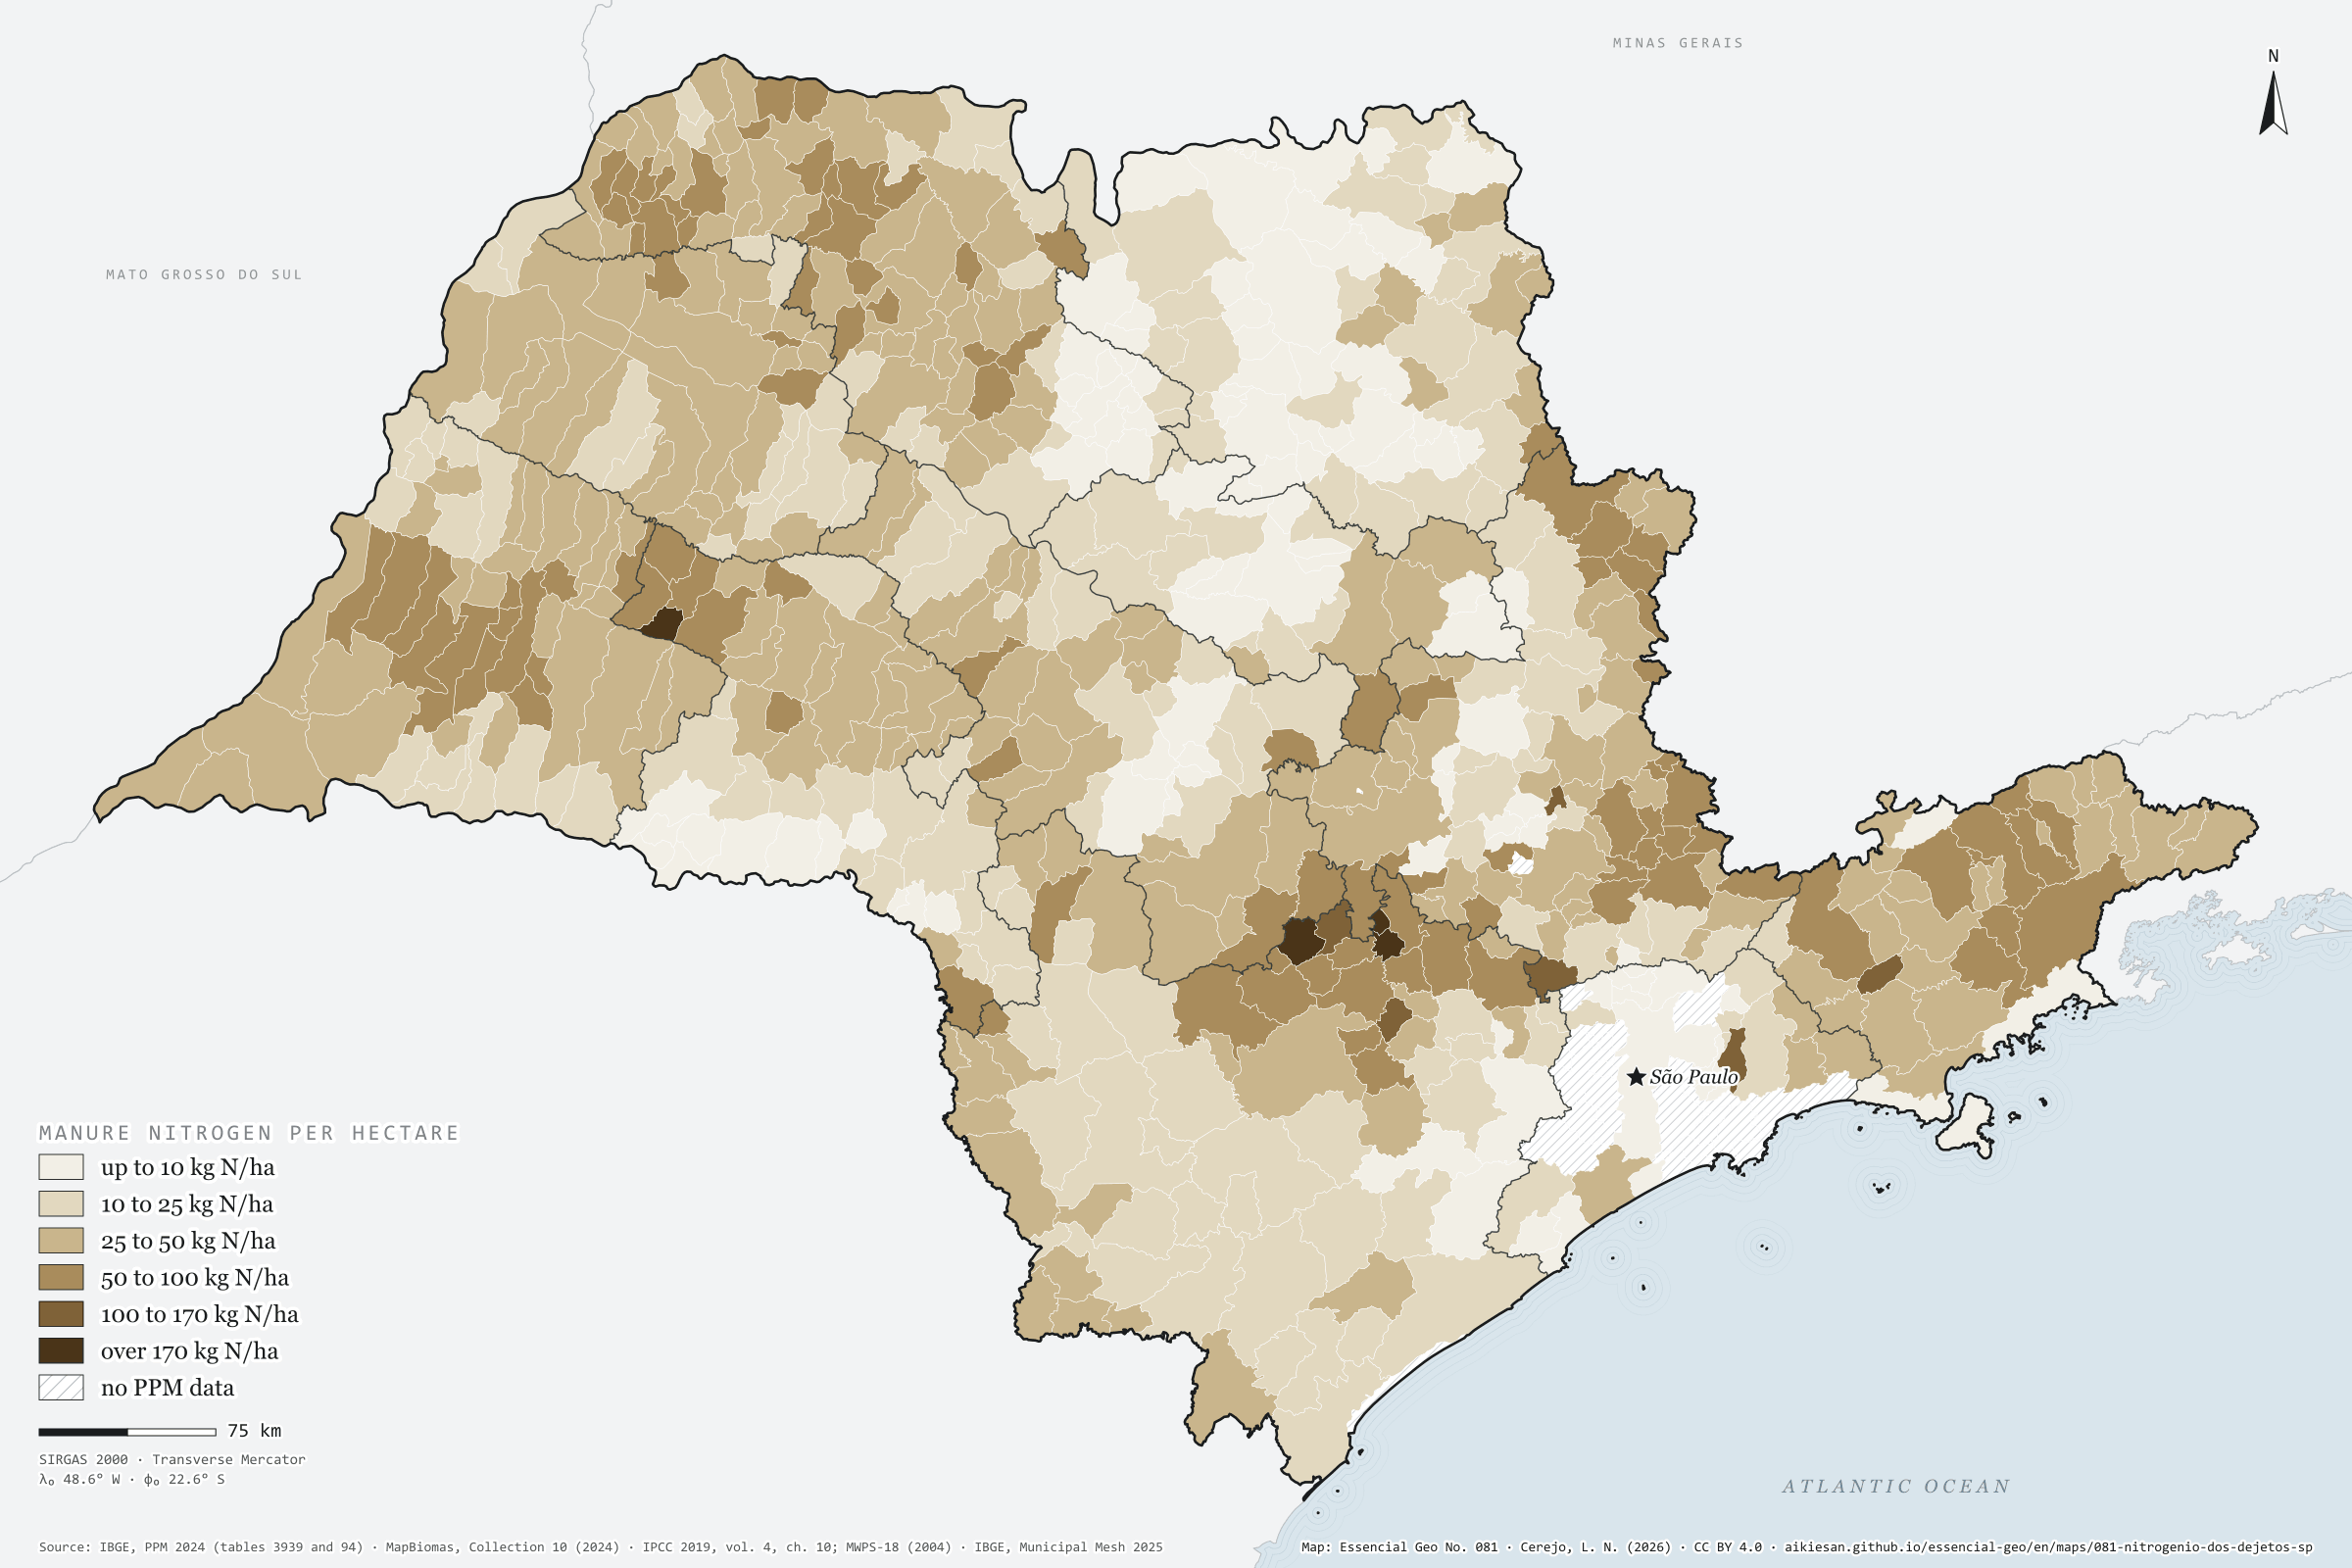
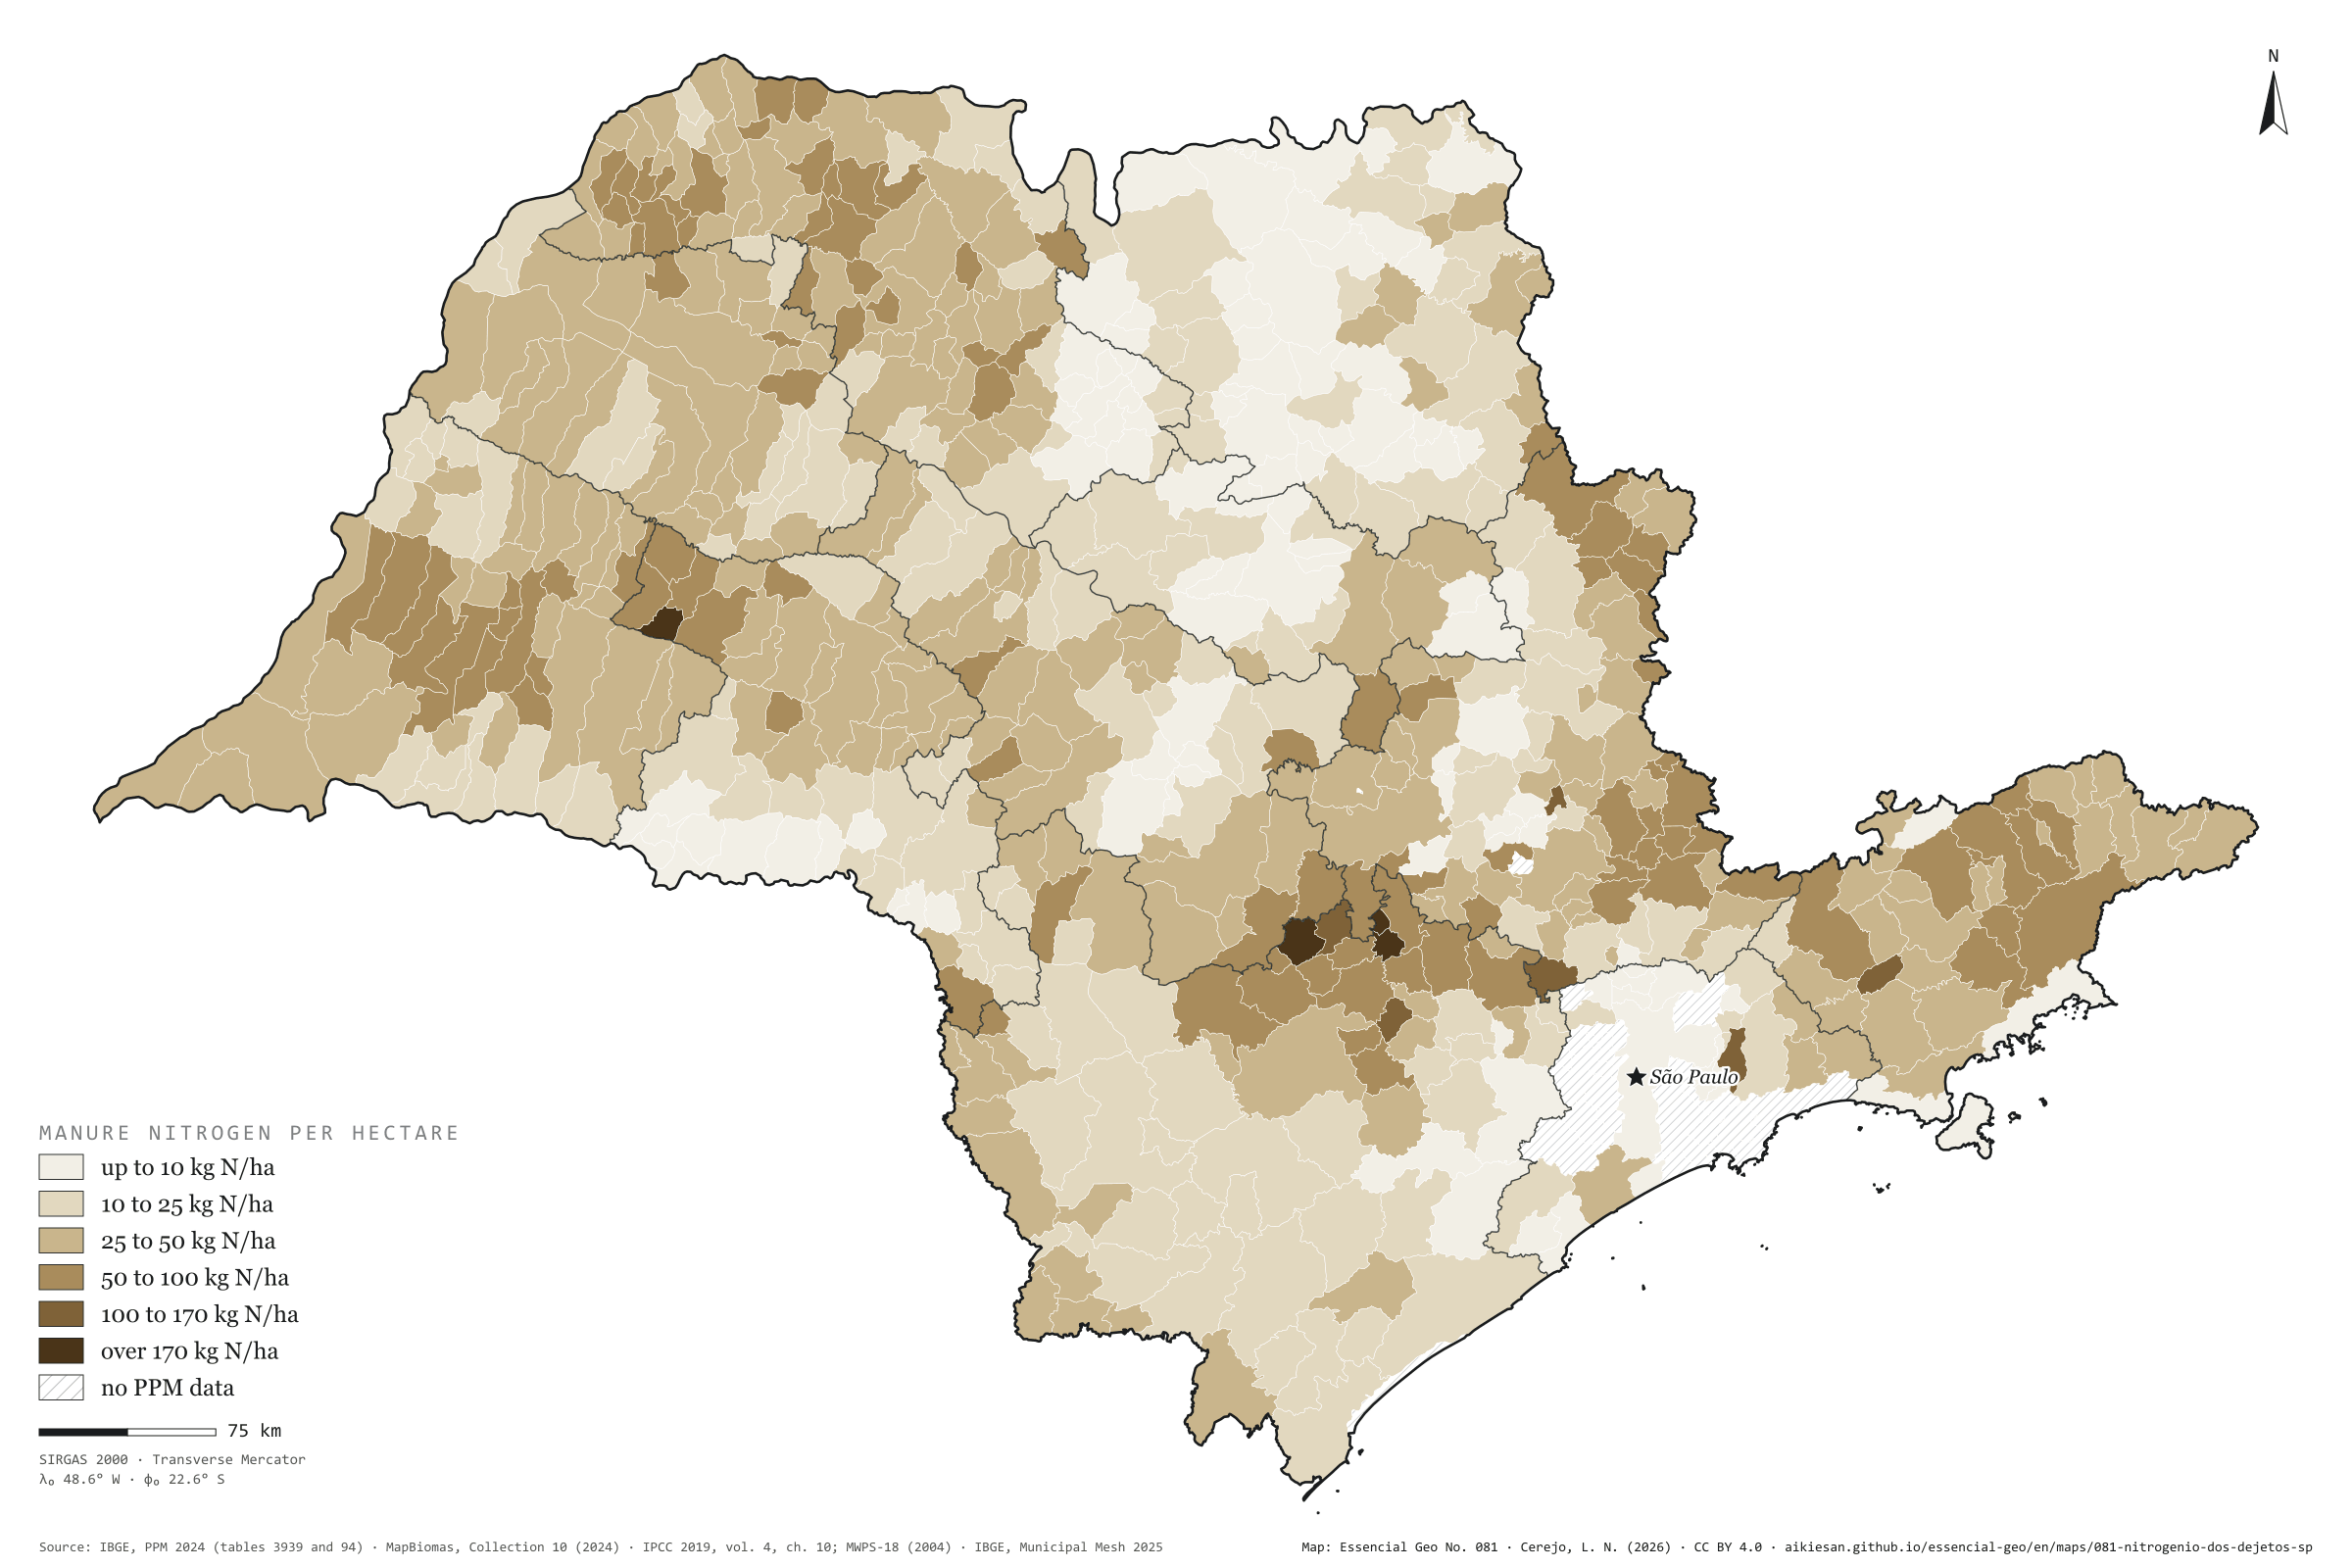
São Paulo’s herds excrete about 535,000 tonnes of nitrogen a year, by a calculation using the 2024 PPM head counts and IPCC coefficients. Over the 16.9 million hectares of MapBiomas farmland, that is 31.5 kg of N per hectare; the municipal median is 29 kg. Nearly two thirds (65%) comes from beef cattle, spread across the pastures; poultry gives 18%, dairy cows 11% and pigs 4%. The EU Nitrates Directive caps manure applied in vulnerable zones at 170 kg of N per hectare. Four São Paulo municipalities exceed it: Bastos, the egg capital, with 579 kg/ha, and Cerquilho (232), Jumirim (219) and Porangaba (171), with broiler farms. Presidente Bernardes, in the Pontal, has the largest total after Bastos: 5,600 tonnes, nearly all from grazing cattle. First plate of the collection “Manure that feeds the soil”.
Technical record · downloads · citation
At a glance
Manure nitrogen by the municipality’s kg N per hectare class (t N a year)
up to 10 kg/ha2.9%
10 to 25 kg/ha16.5%
25 to 50 kg/ha45.5%
50 to 100 kg/ha30.5%
100 to 170 kg/ha1.6%
over 170 kg/ha3%
Manure nitrogen by herd (thousand t N a year)
beef cattle and buffalo347
hens and broilers94
milked cows57
pigs21
horses, sheep and goats16
Manure nitrogen per farmland hectare
32kg/ha
535,000 t N a year, estimated
Layers
municipiospolygon645 municipalities: 2024 PPM herds, farmland and cropland; manure N, P₂O₅ and K₂O; crop removal; coverage; CP2B digestate
regioes_intermediariaspolygon11 intermediate geographic regions
Head counts of each herd in the 2024 PPM times the nitrogen excreted per head per year (IPCC 2019, Latin American means), summed by municipality and divided by the 2024 MapBiomas farmland (pasture, temporary and perennial crops, sugarcane, citrus and mixed use), in six classes; the last starts at the Nitrates Directive cap of 170 kg of N per hectare.
The map without a frame, with legend, scale, reference system and credit written on it: ready for papers, lectures and slides. In two versions: with the basemap (neighbours and sea) or only the mapped area, on white.
CEREJO, Lucas Nakamura. O nitrogênio dos dejetos: meio milhão de toneladas por ano; em Bastos, três vezes o teto europeu. Versão 1.0.0. [S. l.]: Essencial, 2026. Conjunto de dados. Disponível em: https://aikiesan.github.io/essencial-geo/en/maps/081-nitrogenio-dos-dejetos-sp/. Acesso em: 10 nov. 2026.
Cerejo, L. N. (2026). O nitrogênio dos dejetos: meio milhão de toneladas por ano; em Bastos, três vezes o teto europeu [The nitrogen in manure: Half a million tonnes a year; in Bastos, three times the European cap] (Version 1.0.0) [Data set]. Essencial. https://aikiesan.github.io/essencial-geo/en/maps/081-nitrogenio-dos-dejetos-sp/
@dataset{cerejo2026_nitrogenio_dos_dejetos_sp,
  author    = {Cerejo, Lucas Nakamura},
  title     = {O nitrogênio dos dejetos: Meio milhão de toneladas por ano; em Bastos, três vezes o teto europeu},
  year      = {2026},
  publisher = {Essencial},
  version   = {1.0.0},
  url       = {https://aikiesan.github.io/essencial-geo/en/maps/081-nitrogenio-dos-dejetos-sp/},
  language  = {portuguese},
  note      = {English title: The nitrogen in manure: Half a million tonnes a year; in Bastos, three times the European cap. Licence CC BY 4.0}
}
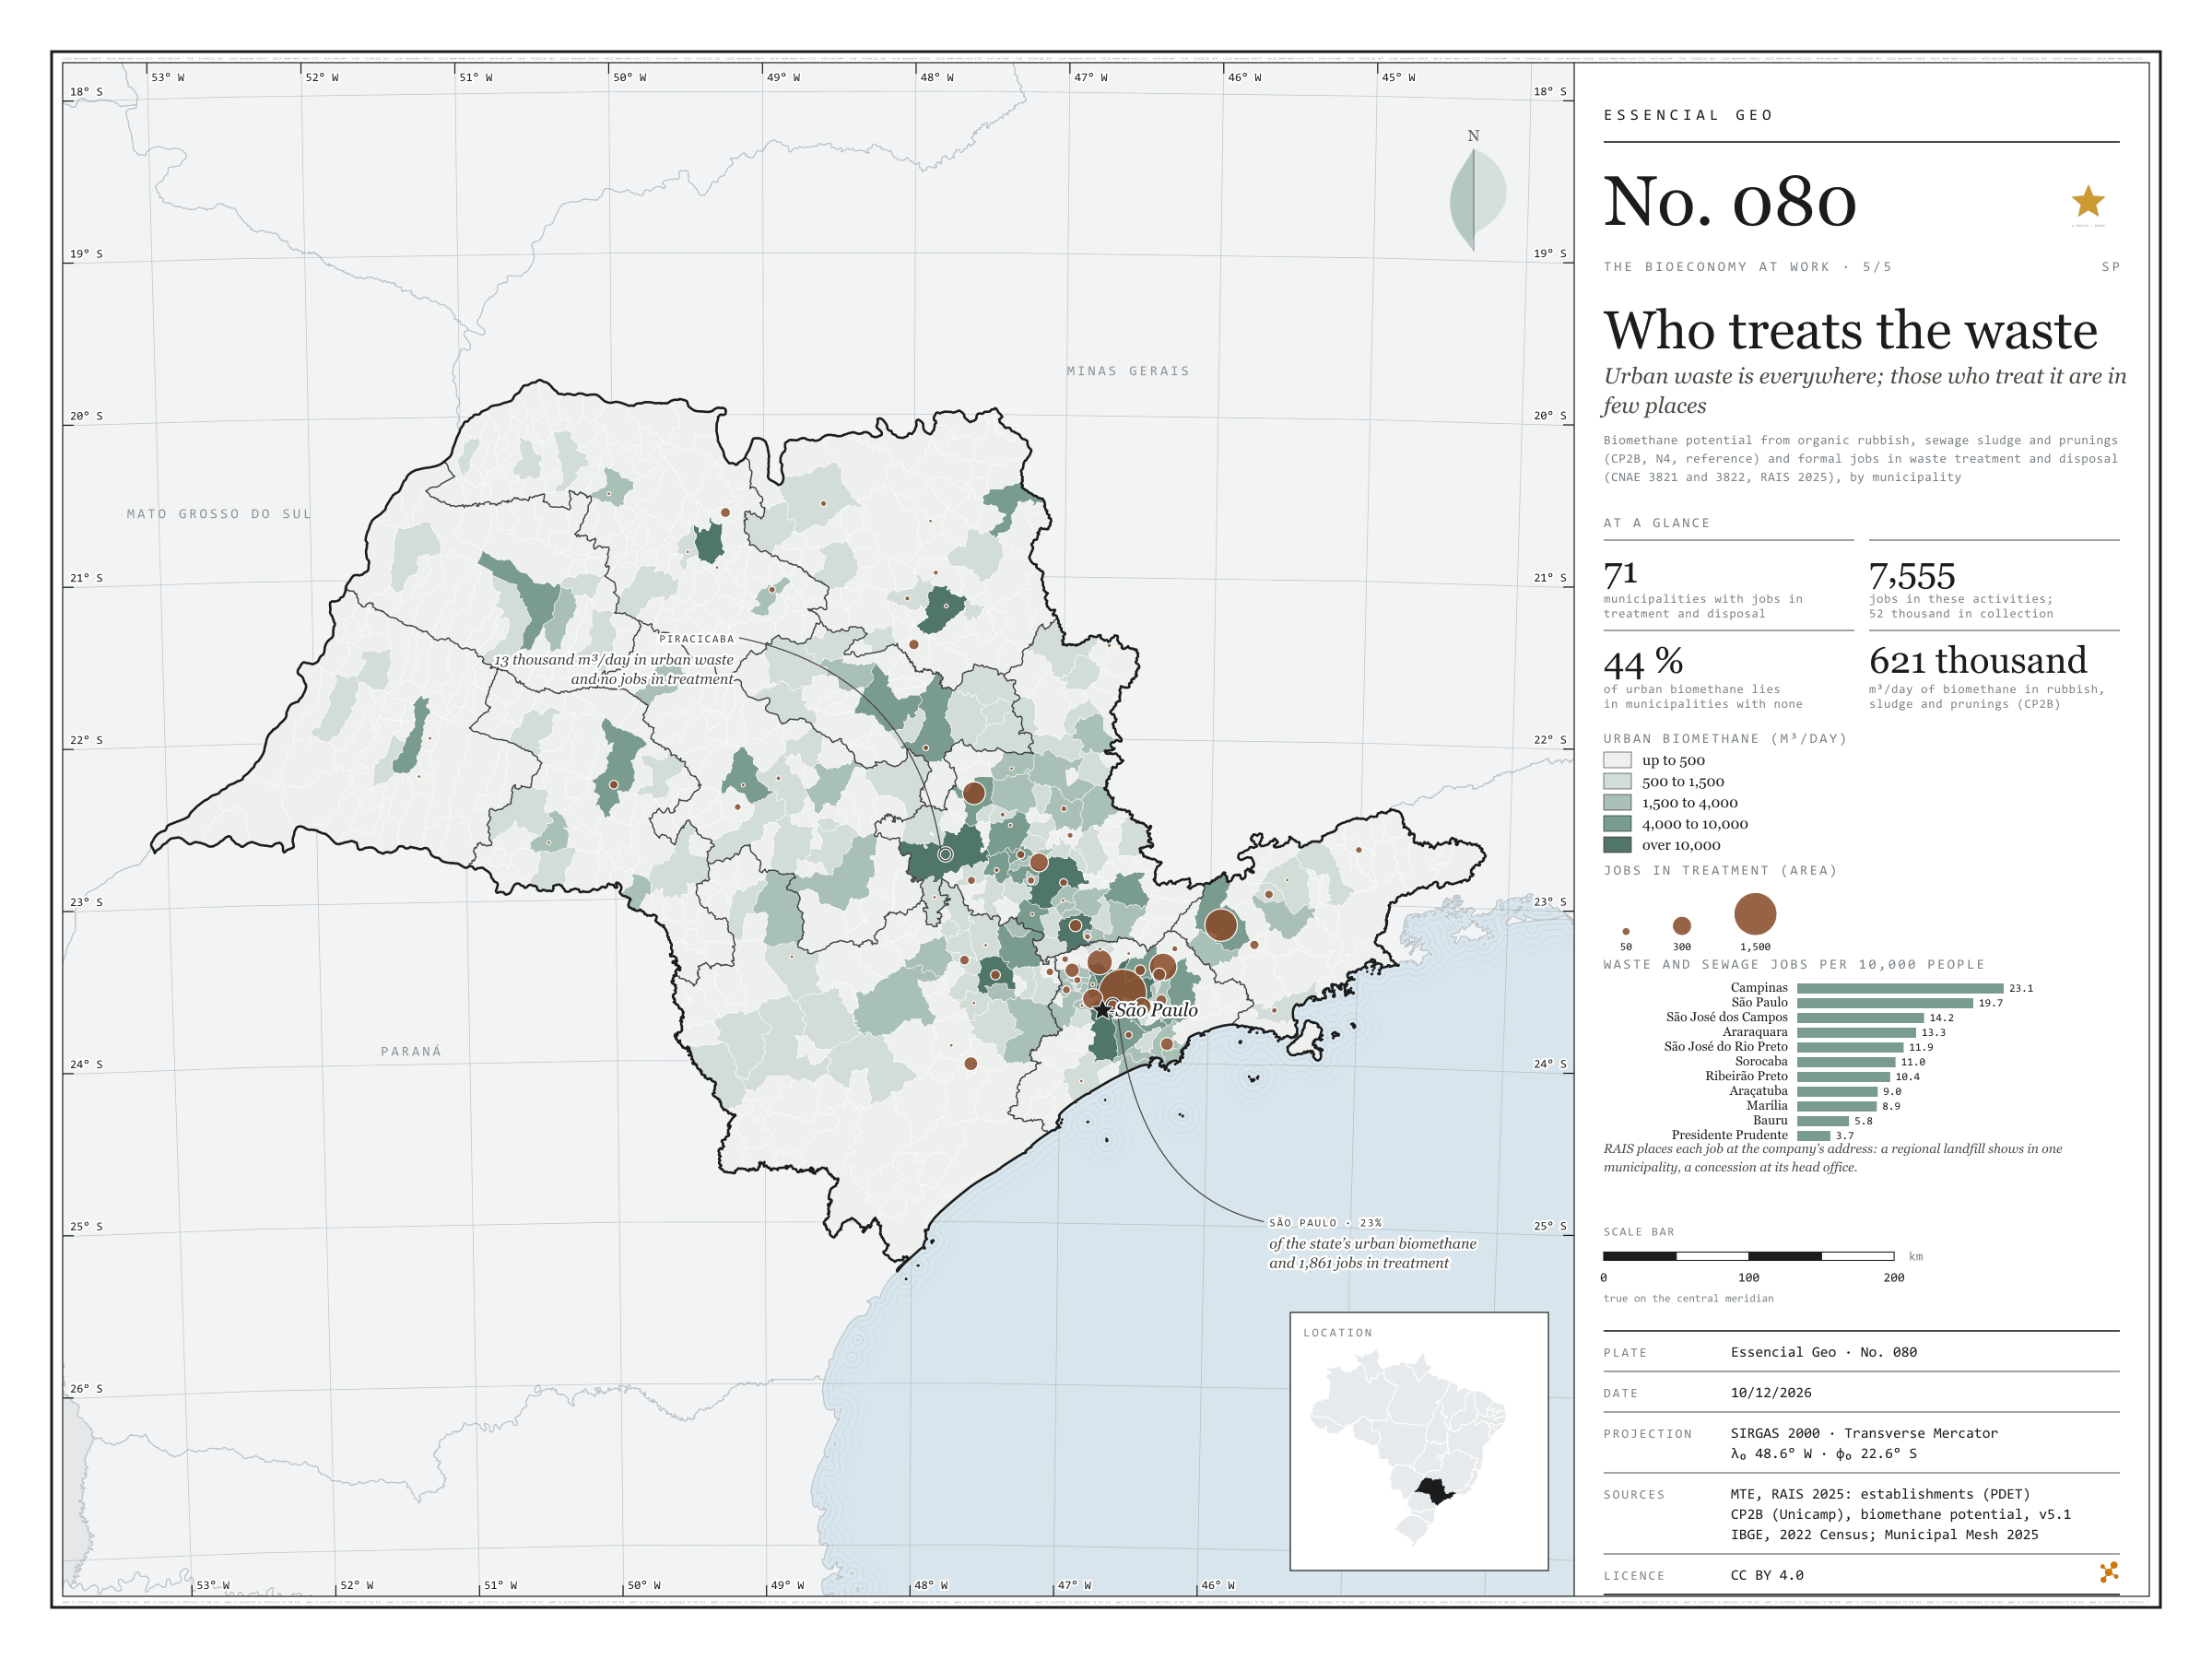
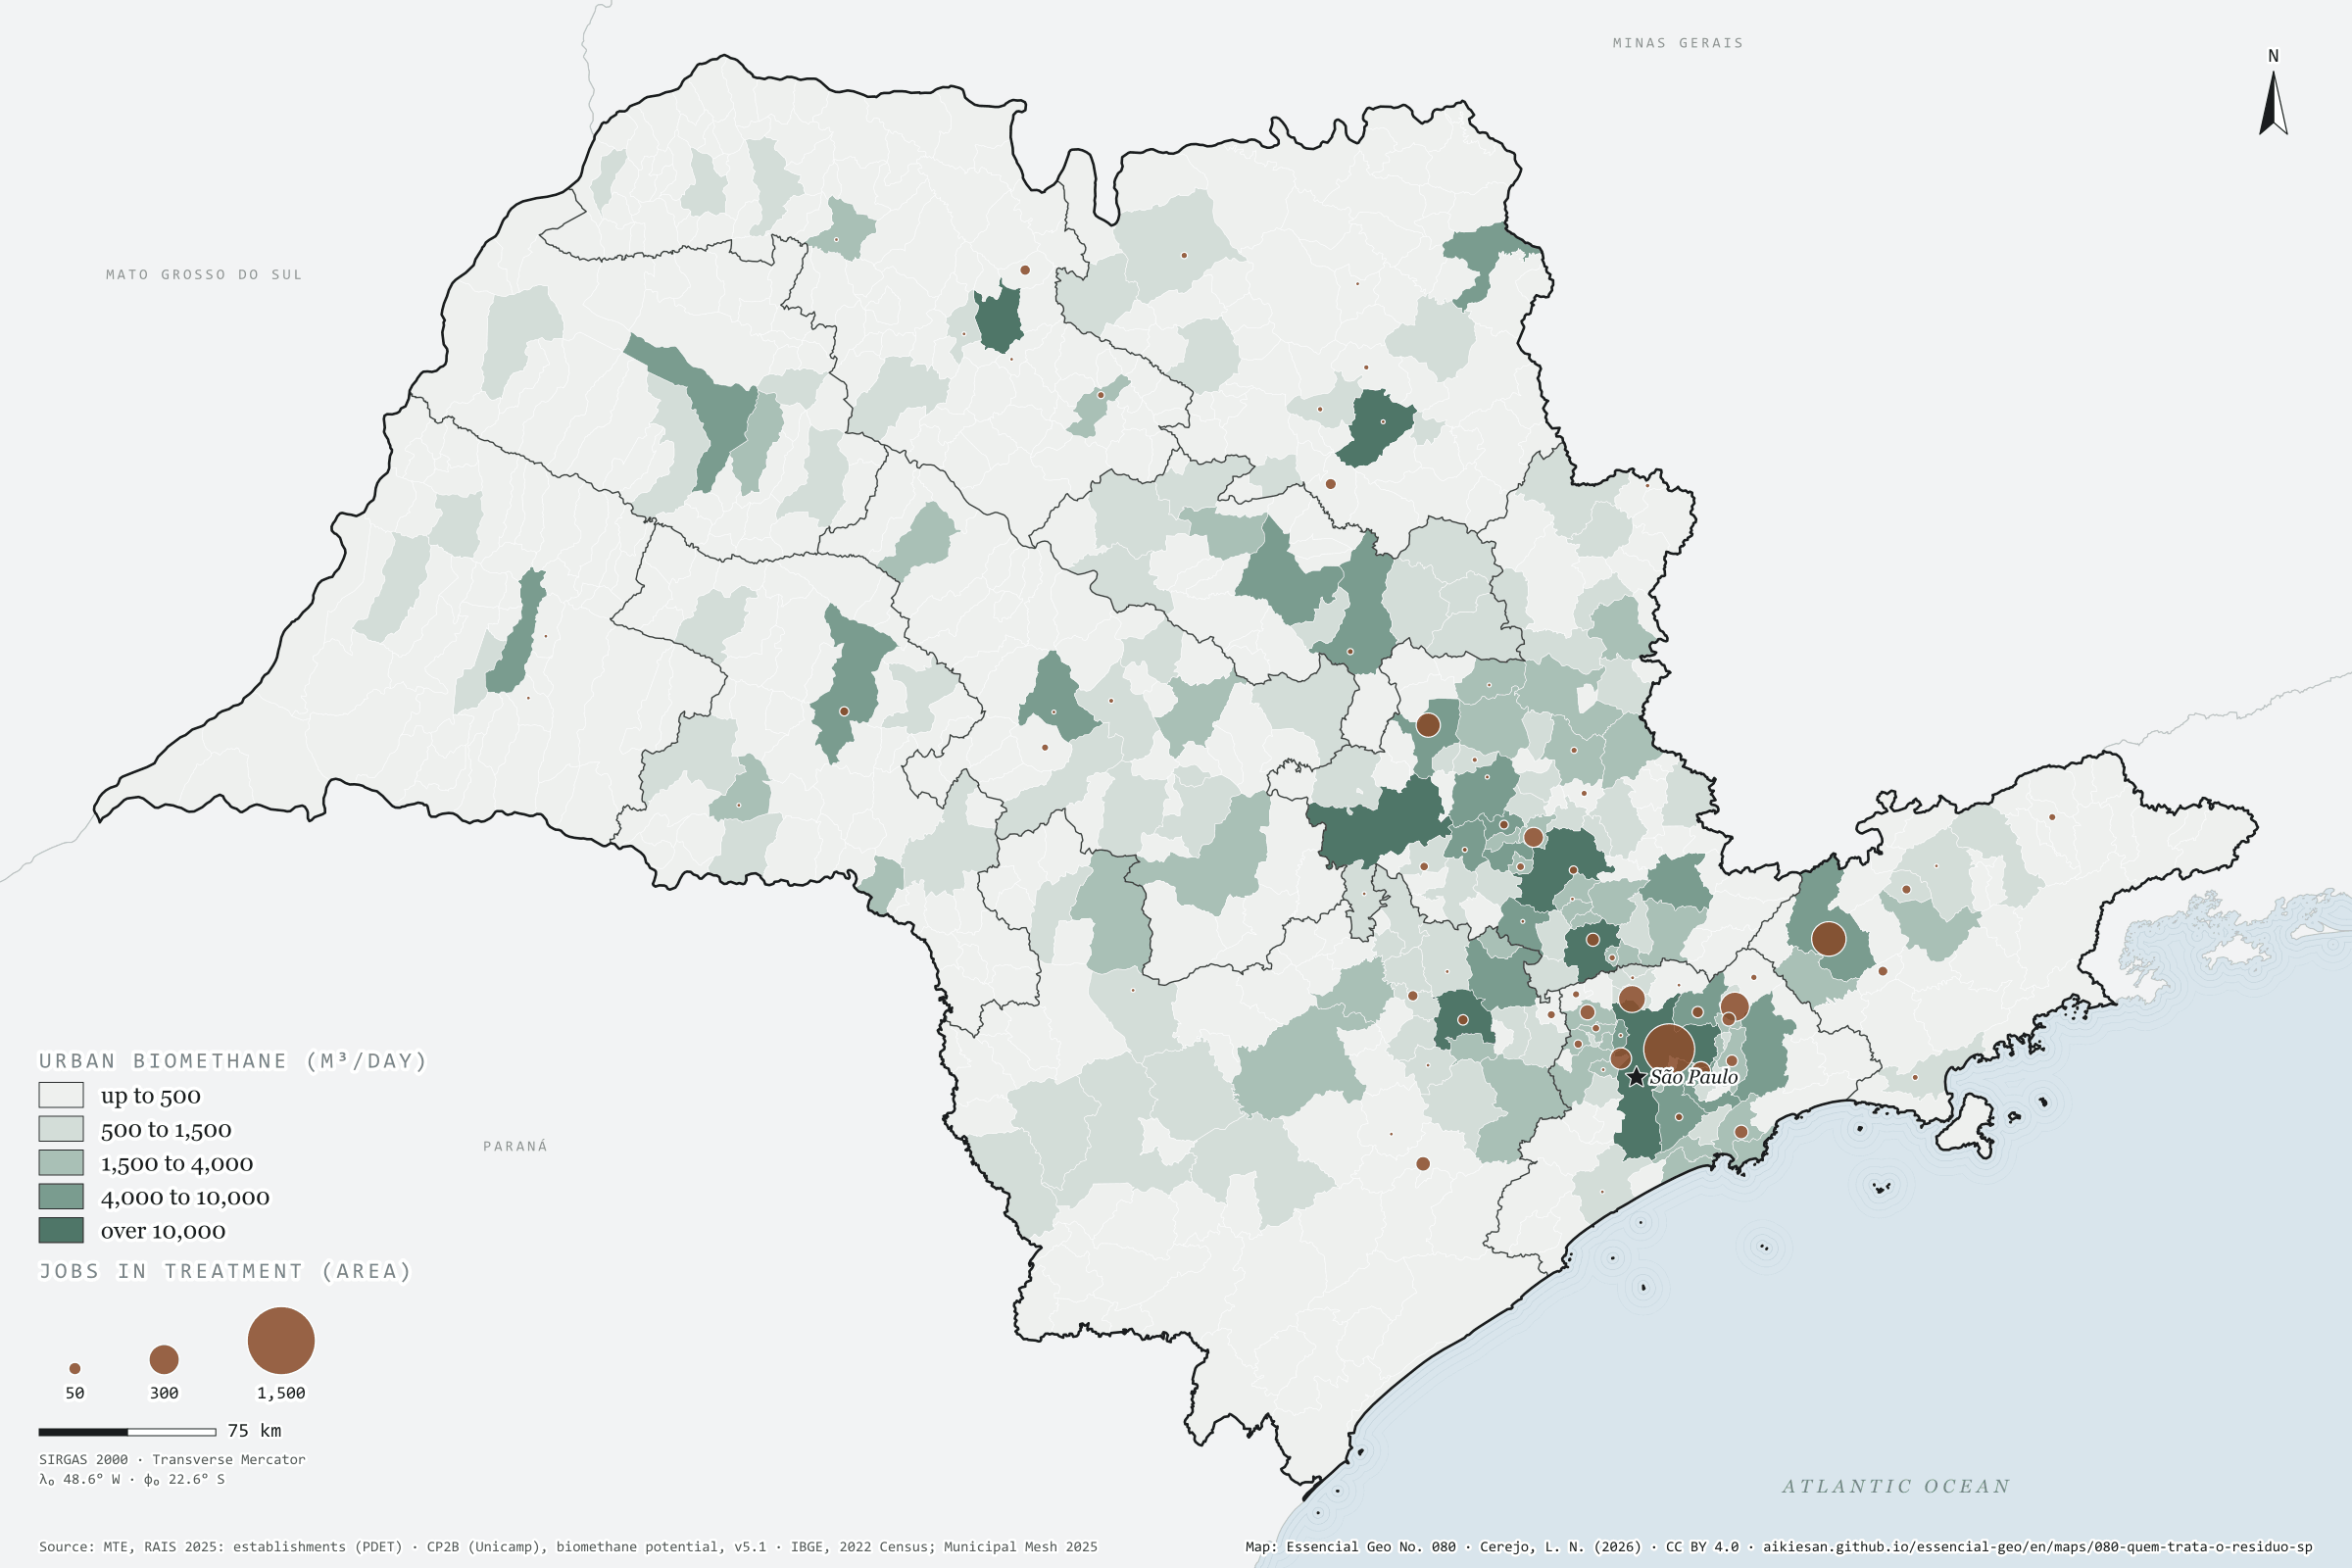
Urban waste is everywhere; those who treat it are in few places
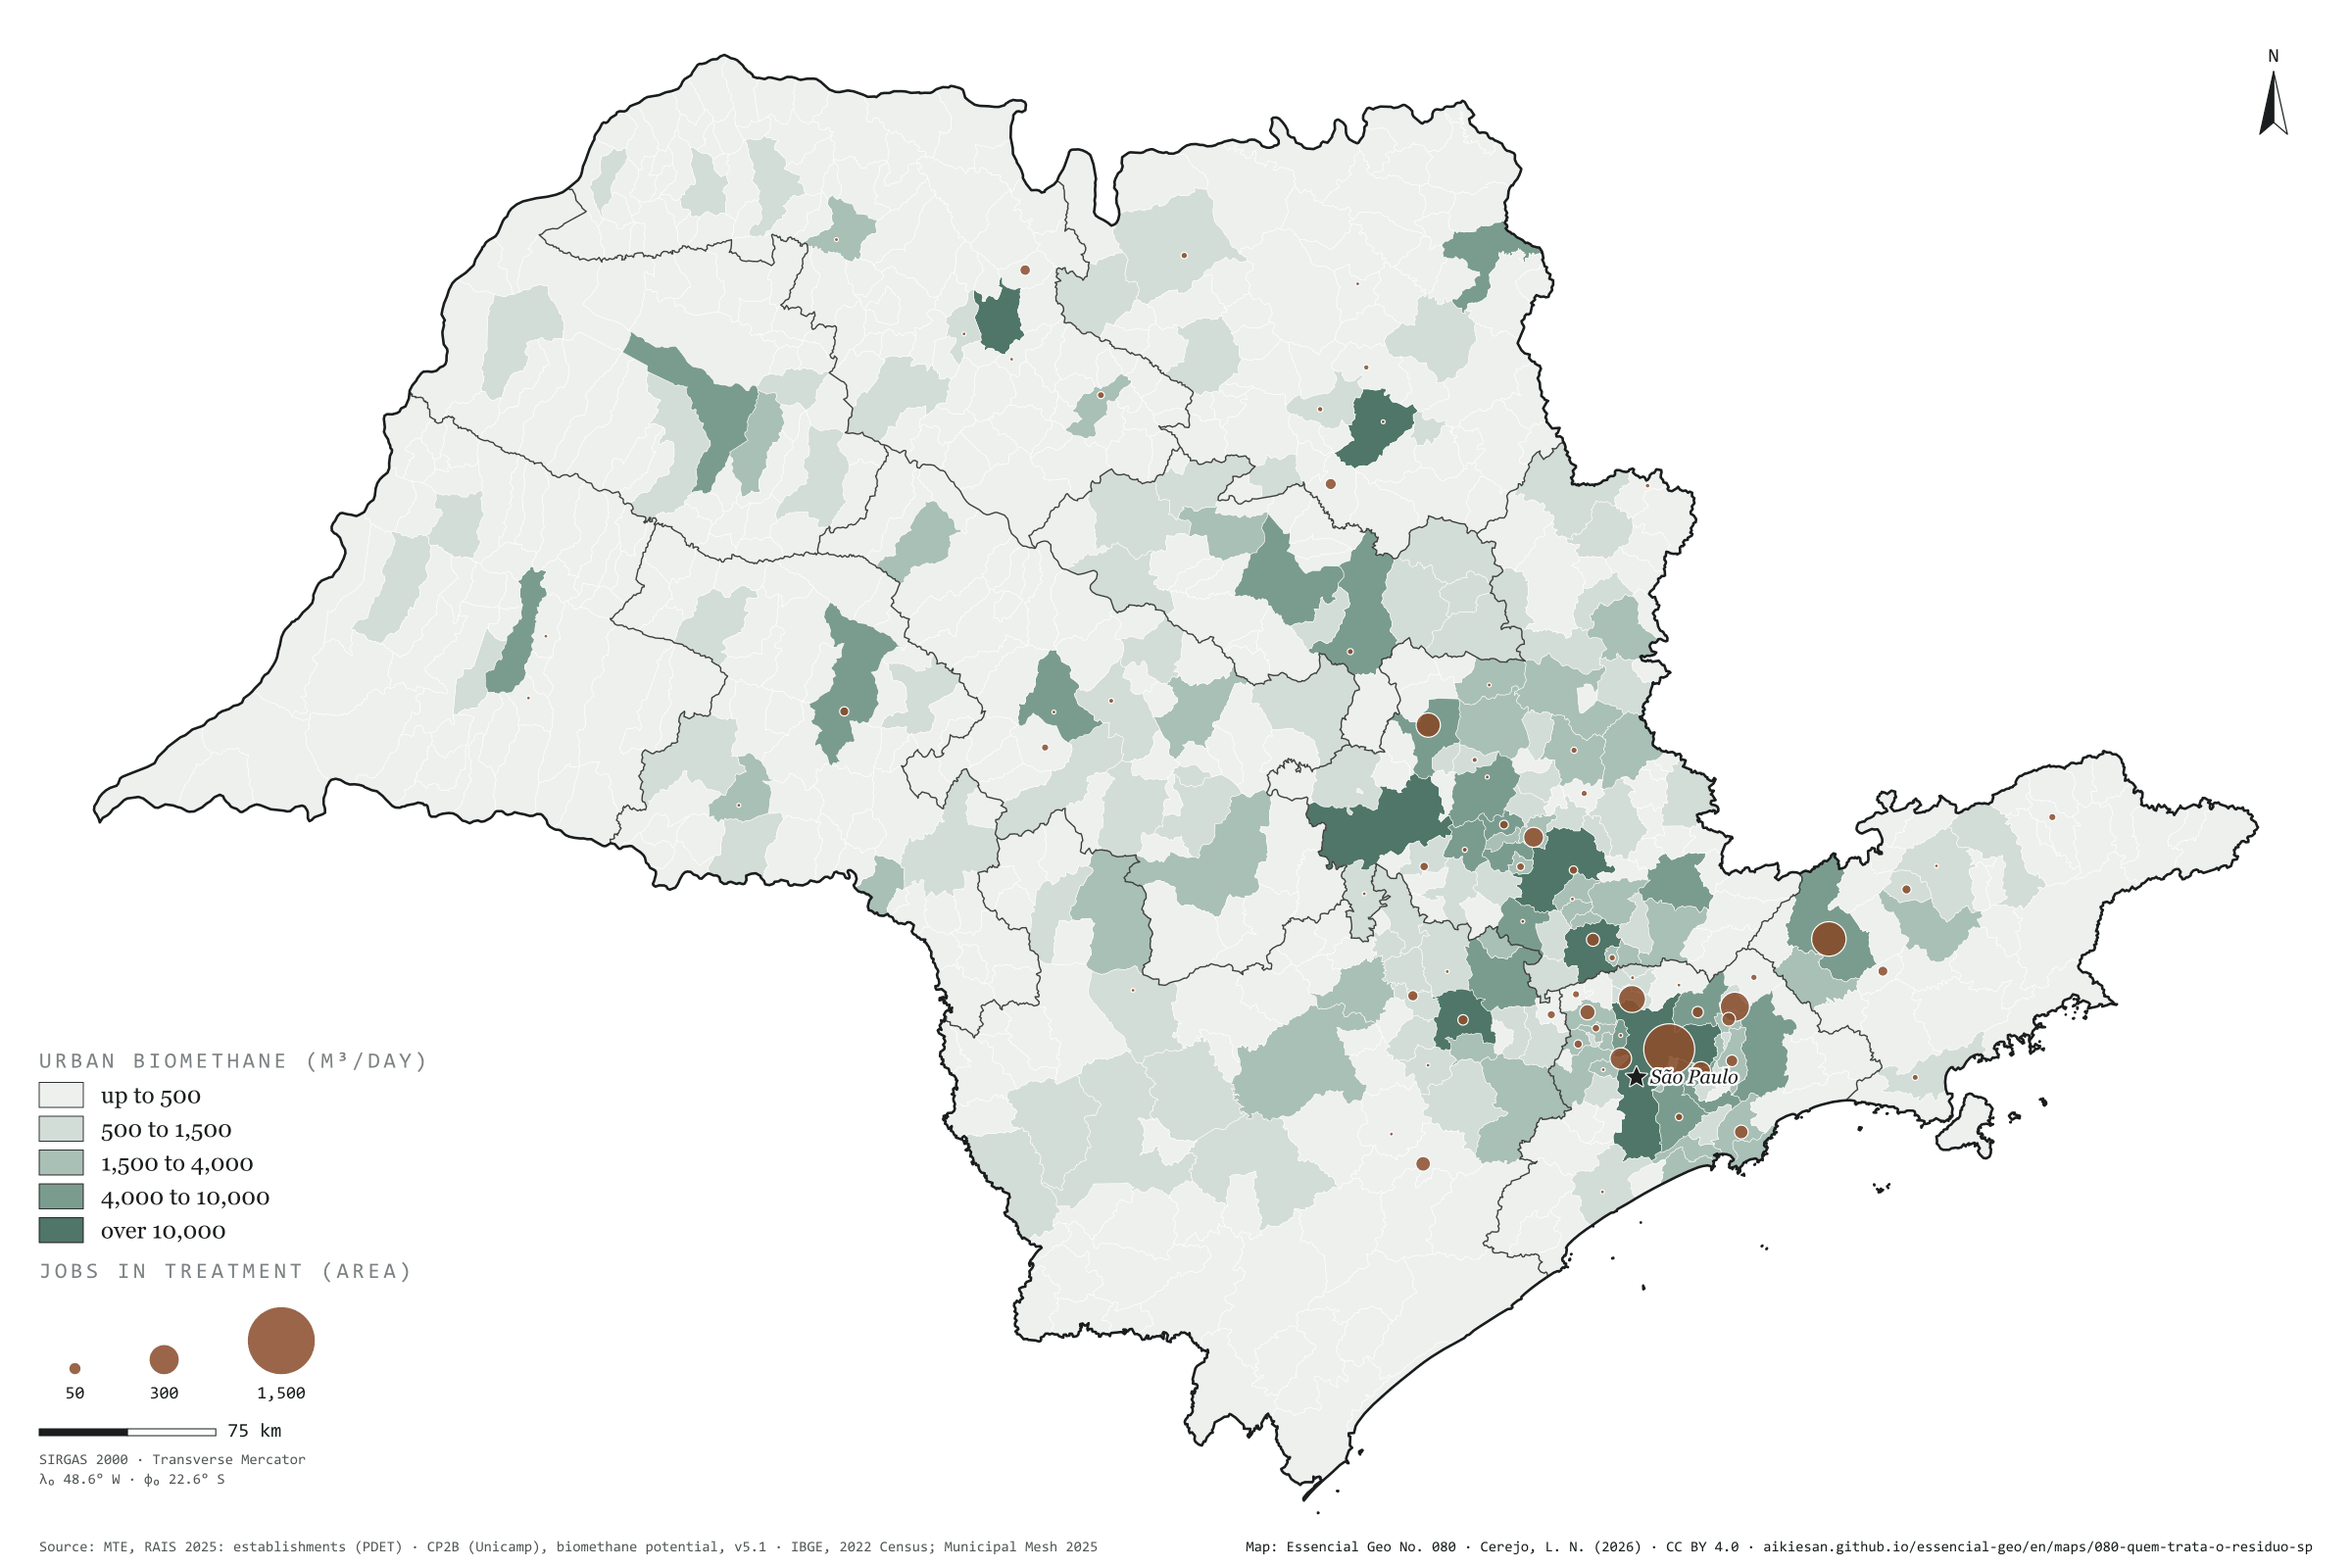
Fig. 080São Paulo State (SP)EPSG:4674Source: MTE/PDET, CP2B (Unicamp), IBGE
São Paulo’s organic rubbish, sewage sludge and prunings would yield 621,000 m³ of biomethane a day at CP2B’s accessible level, and that matter is in every town. Those who treat it are not. Only 71 of the 645 municipalities have formal jobs in waste treatment and disposal, landfills, composting and biogas plants: 7,555 in the state, against 52,000 in collection. The capital has 23% of urban biomethane and 1,861 of those jobs; São José dos Campos, Arujá and Caieiras come next. Yet 44% of urban biomethane lies in municipalities with no treatment jobs at all: Piracicaba has 13,000 m³ a day and none; São José do Rio Preto, 12,000 and none. There, waste travels to a landfill in another municipality or is handled by the council, outside the private count. Fifth and last plate of the collection “The bioeconomy at work”.
Technical record · downloads · citation
At a glance
Waste and sewage jobs, by activity (jobs)
Collection67.8%
Materials recovery15.8%
Treatment and disposal9.9%
Sewage6.4%
Urban biomethane in municipalities with no treatment jobs
44%
of 621,000 m³/day; 574 municipalities
Layers
municipiospolygon645 municipalities: jobs in sewage, collection, treatment and recovery, jobs per 10,000 people and urban biomethane potential (same GPKG as plate 076)
regioes_intermediariaspolygon11 intermediate geographic regions
Urban-waste biomethane potential by municipality (CP2B v5.1, level N4, reference scenario: organic waste, sewage sludge and prunings), in five classes, and circles proportional to active jobs on 31/12/2025 in waste treatment and disposal (CNAE 38.21 and 38.22, RAIS 2025).
The map without a frame, with legend, scale, reference system and credit written on it: ready for papers, lectures and slides. In two versions: with the basemap (neighbours and sea) or only the mapped area, on white.
CEREJO, Lucas Nakamura. Quem trata o resíduo: o resíduo urbano está em toda parte; quem o trata, em poucos lugares. Versão 1.0.0. [S. l.]: Essencial, 2026. Conjunto de dados. Disponível em: https://aikiesan.github.io/essencial-geo/en/maps/080-quem-trata-o-residuo-sp/. Acesso em: 10 nov. 2026.
Cerejo, L. N. (2026). Quem trata o resíduo: o resíduo urbano está em toda parte; quem o trata, em poucos lugares [Who treats the waste: Urban waste is everywhere; those who treat it are in few places] (Version 1.0.0) [Data set]. Essencial. https://aikiesan.github.io/essencial-geo/en/maps/080-quem-trata-o-residuo-sp/
@dataset{cerejo2026_quem_trata_o_residuo_sp,
  author    = {Cerejo, Lucas Nakamura},
  title     = {Quem trata o resíduo: O resíduo urbano está em toda parte; quem o trata, em poucos lugares},
  year      = {2026},
  publisher = {Essencial},
  version   = {1.0.0},
  url       = {https://aikiesan.github.io/essencial-geo/en/maps/080-quem-trata-o-residuo-sp/},
  language  = {portuguese},
  note      = {English title: Who treats the waste: Urban waste is everywhere; those who treat it are in few places. Licence CC BY 4.0}
}
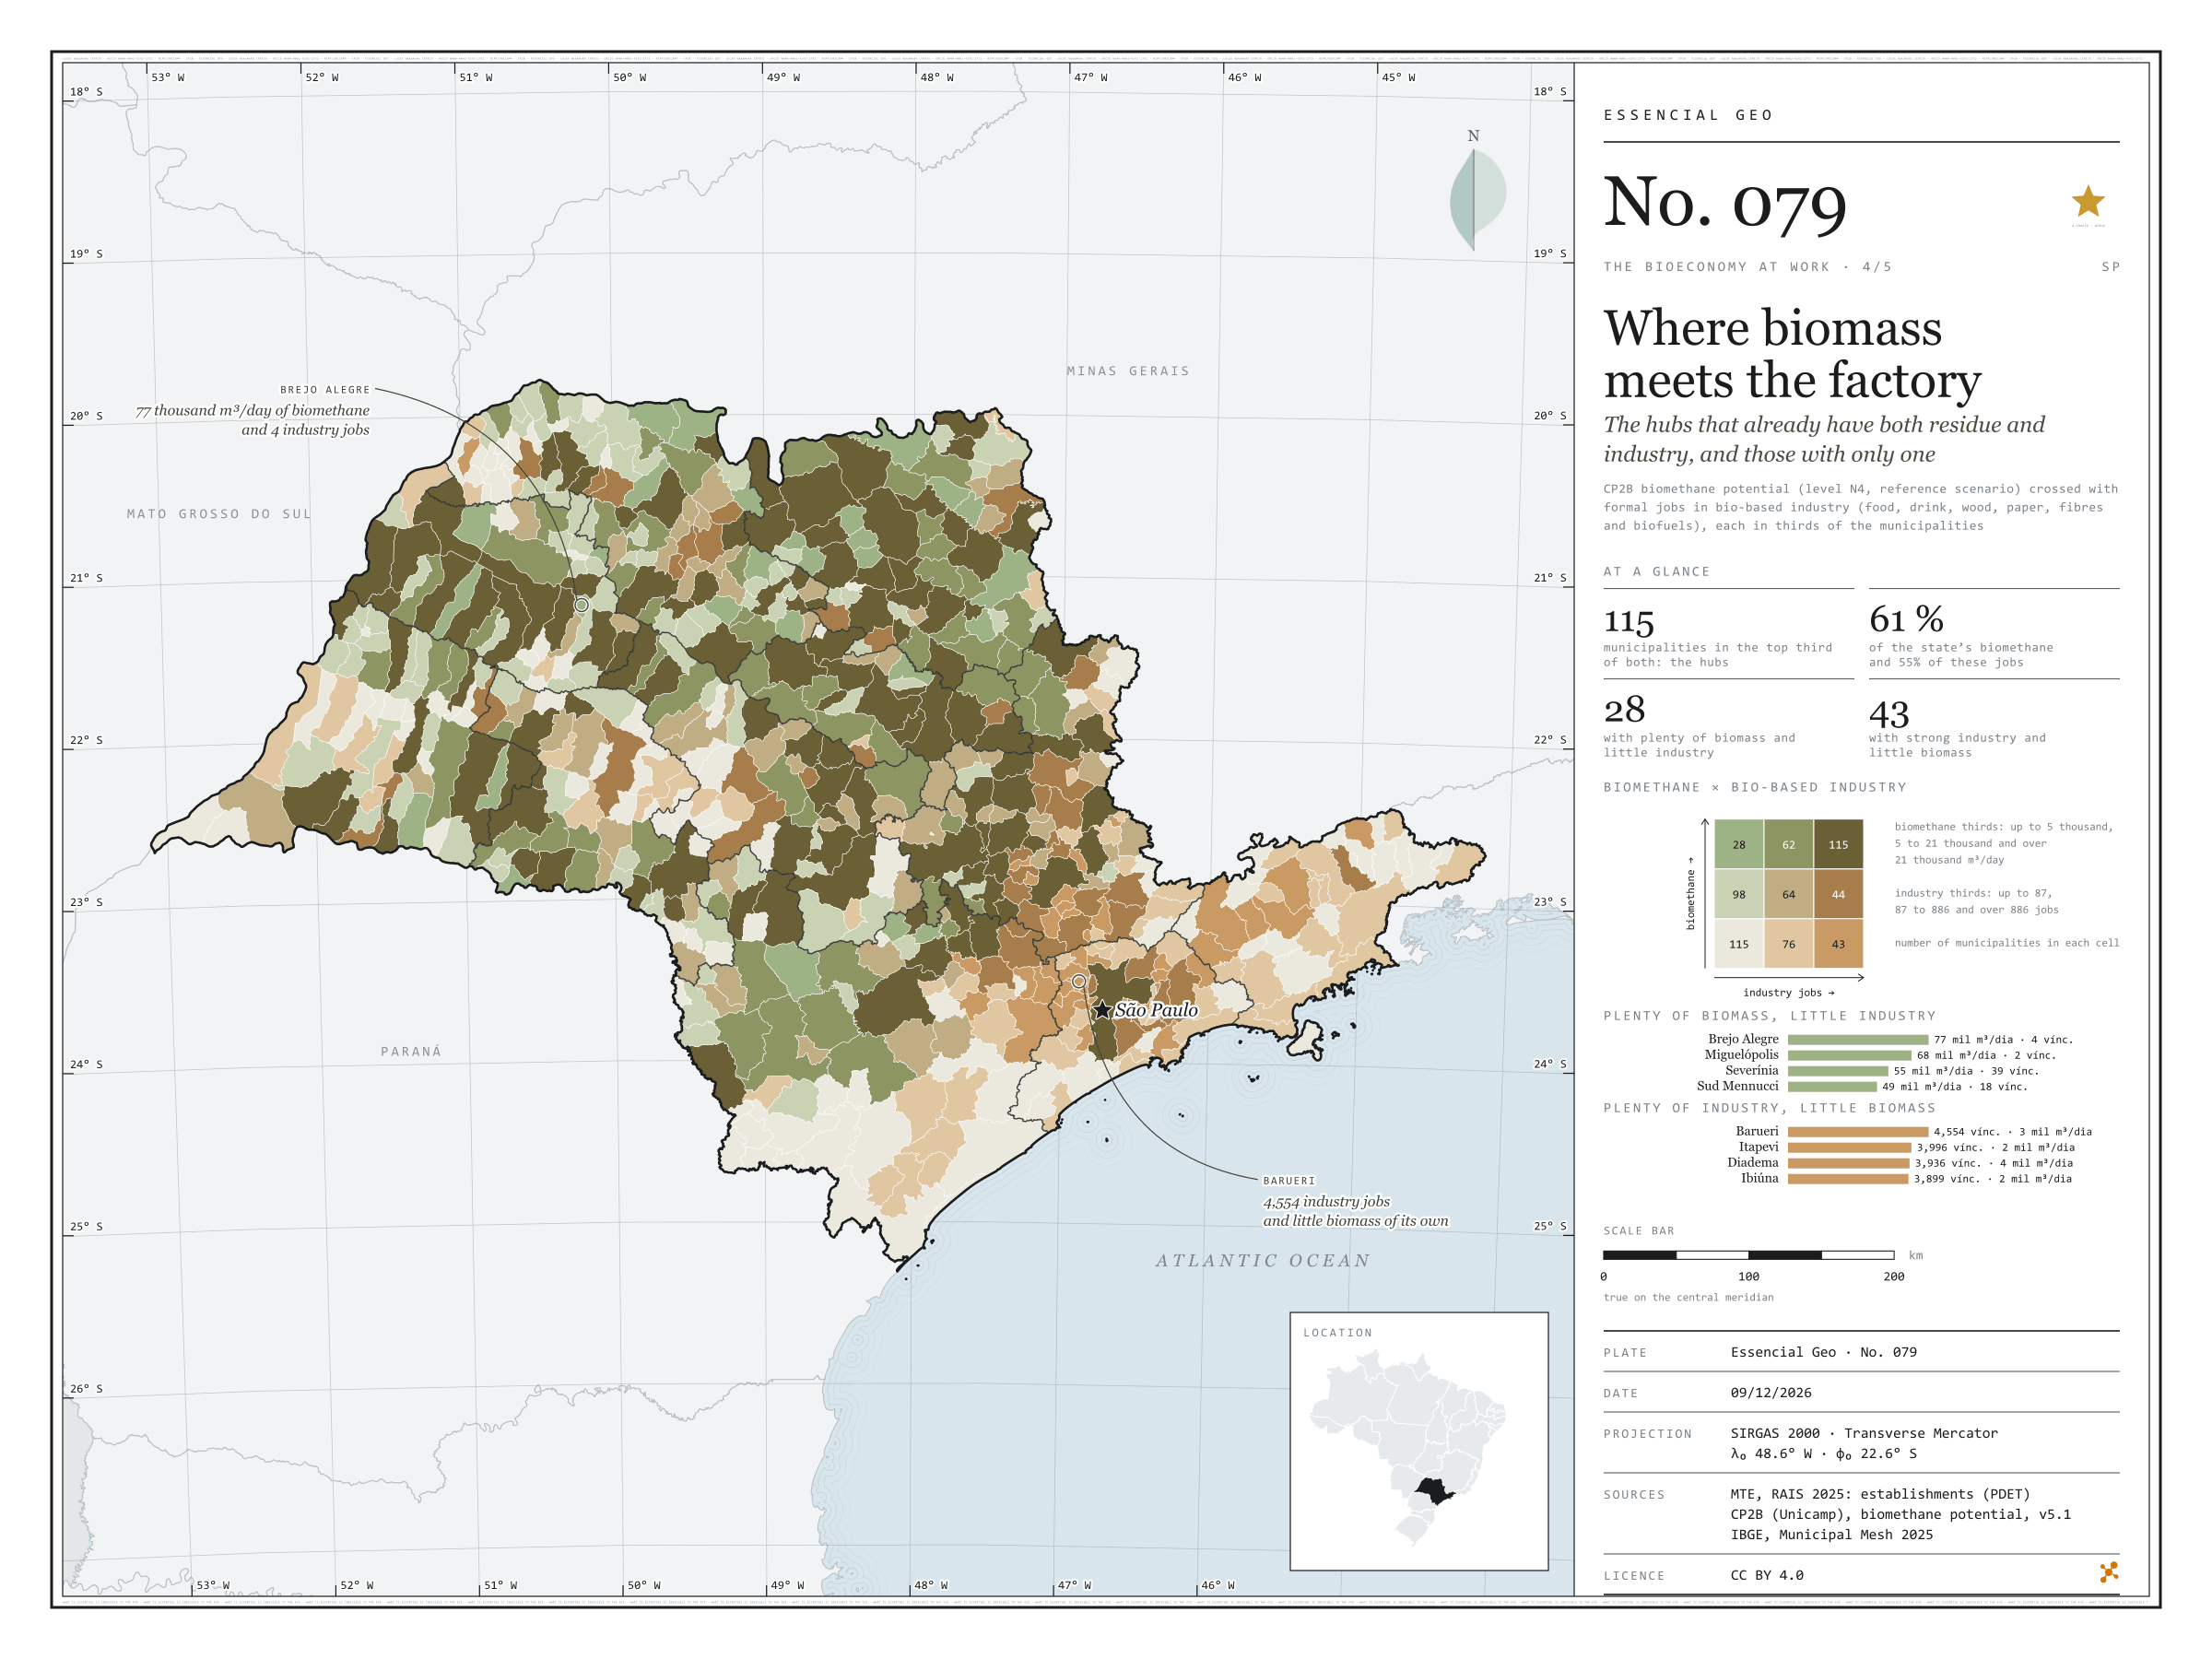
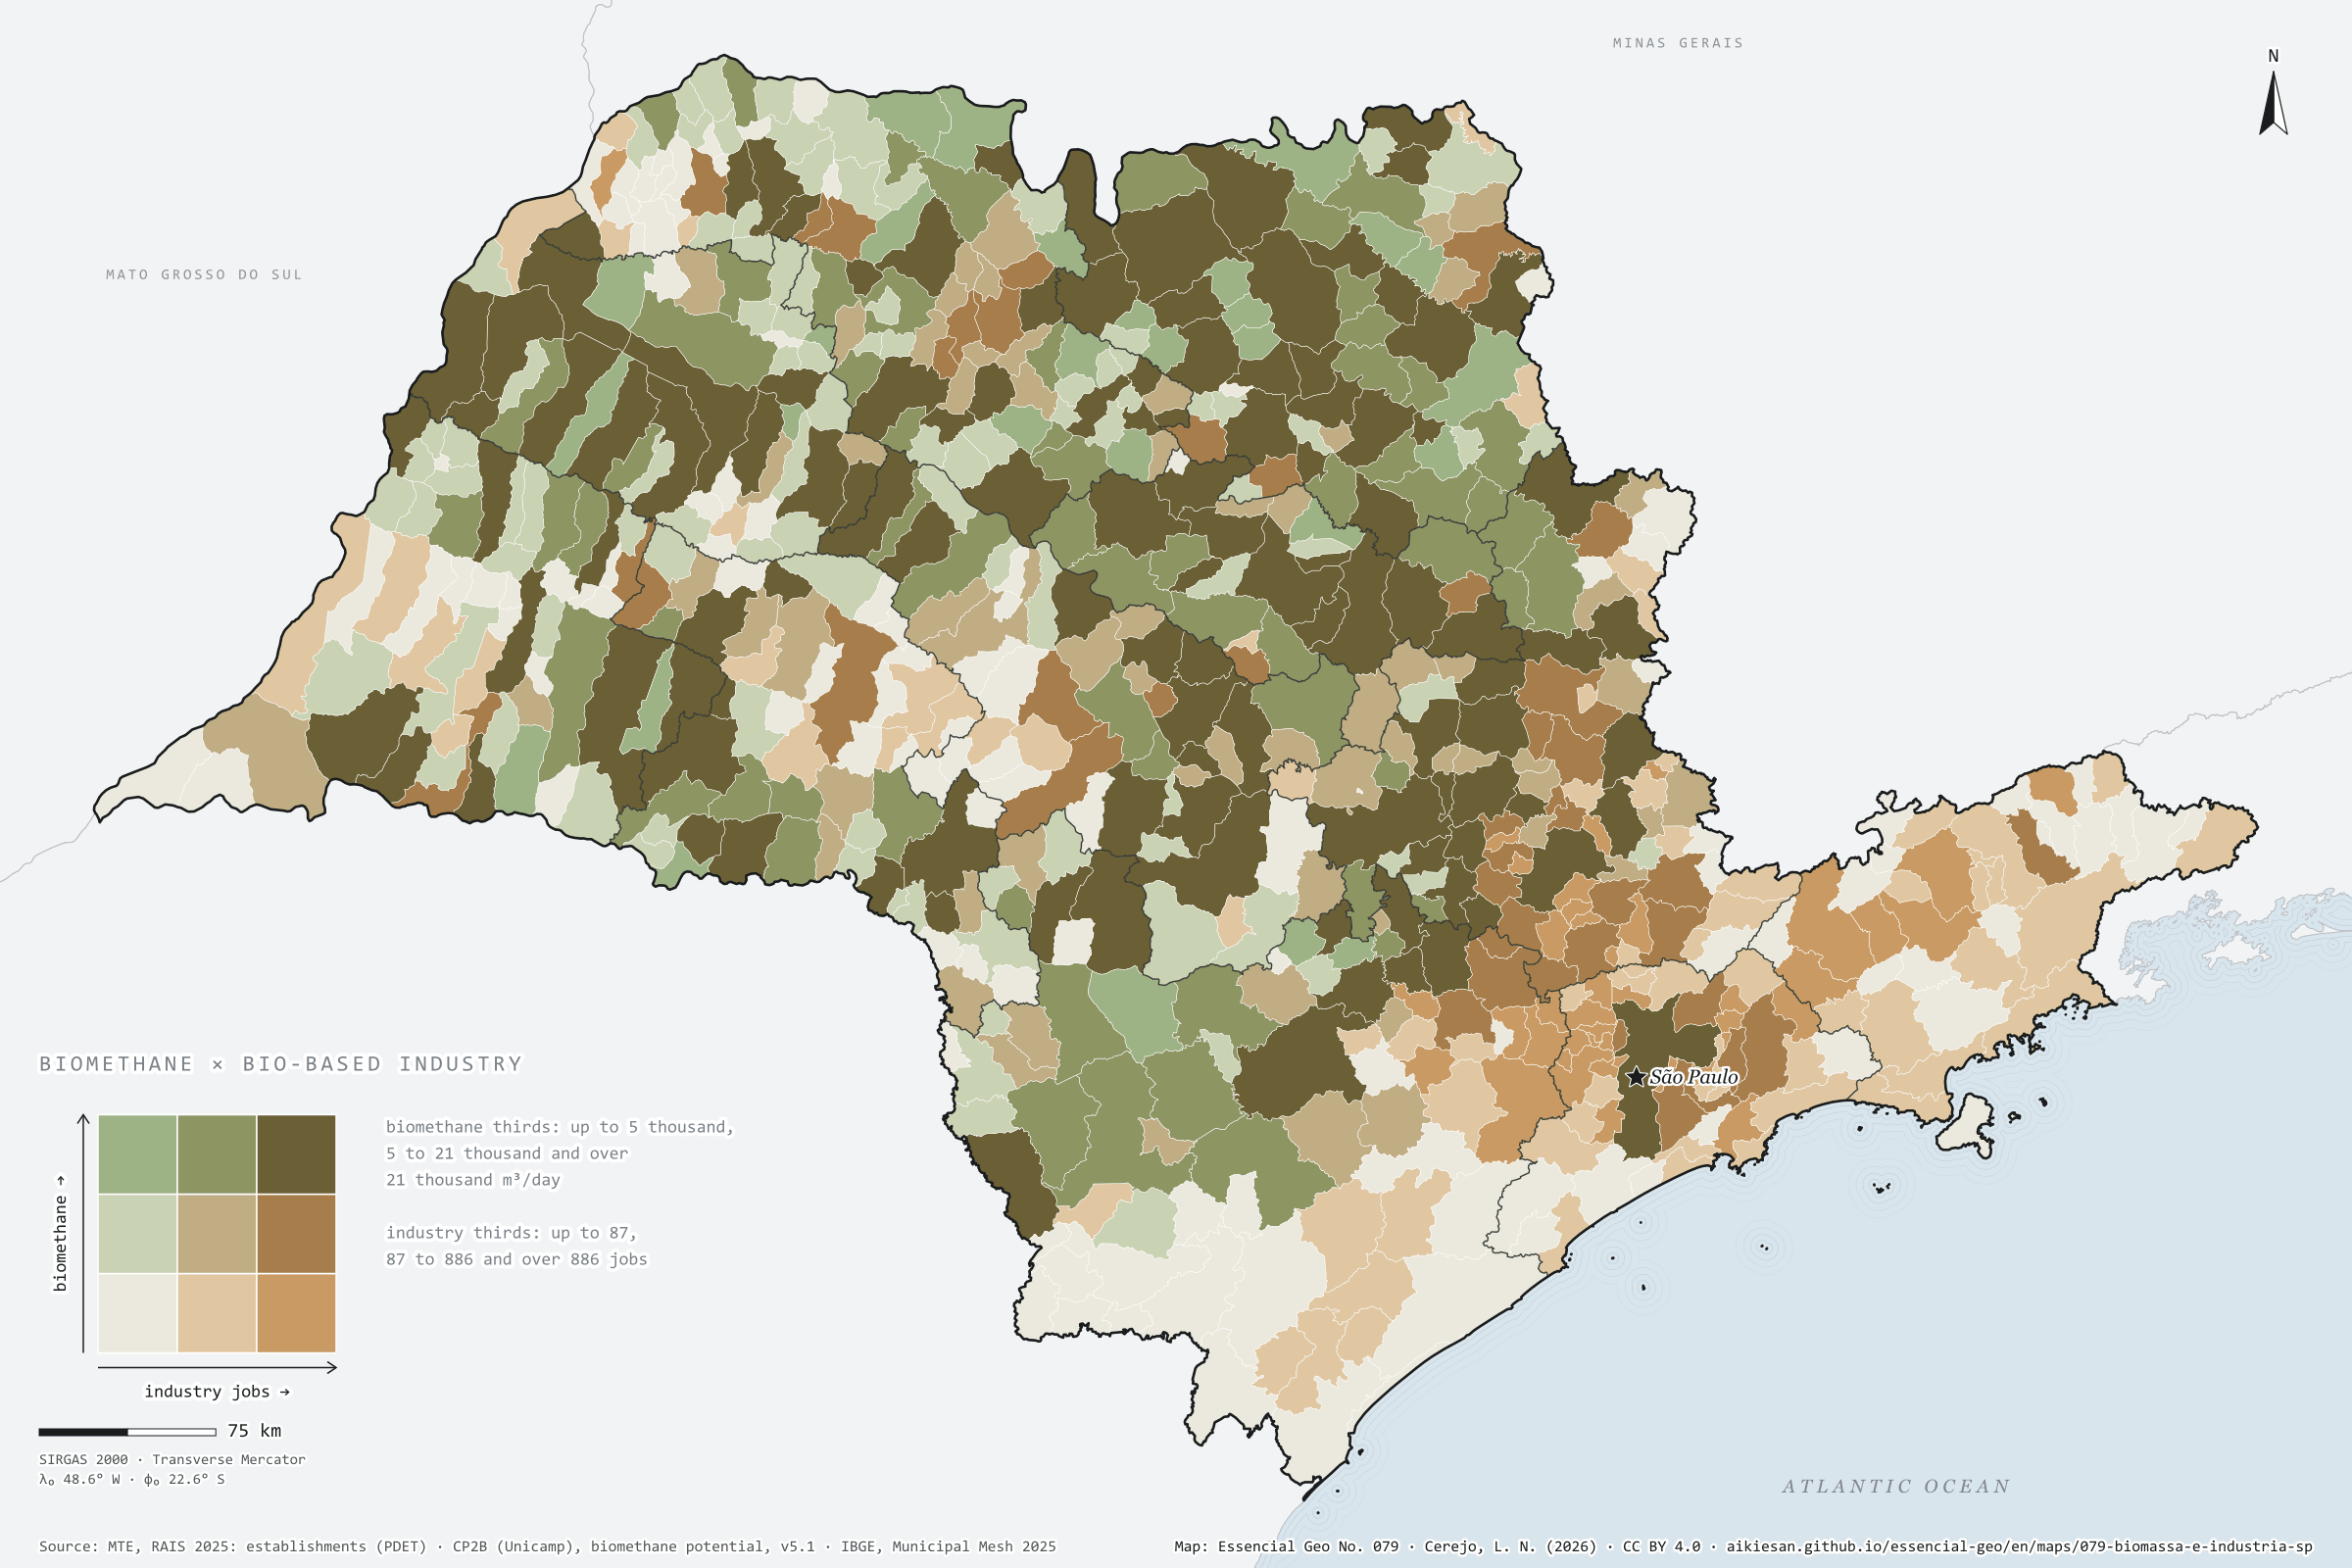
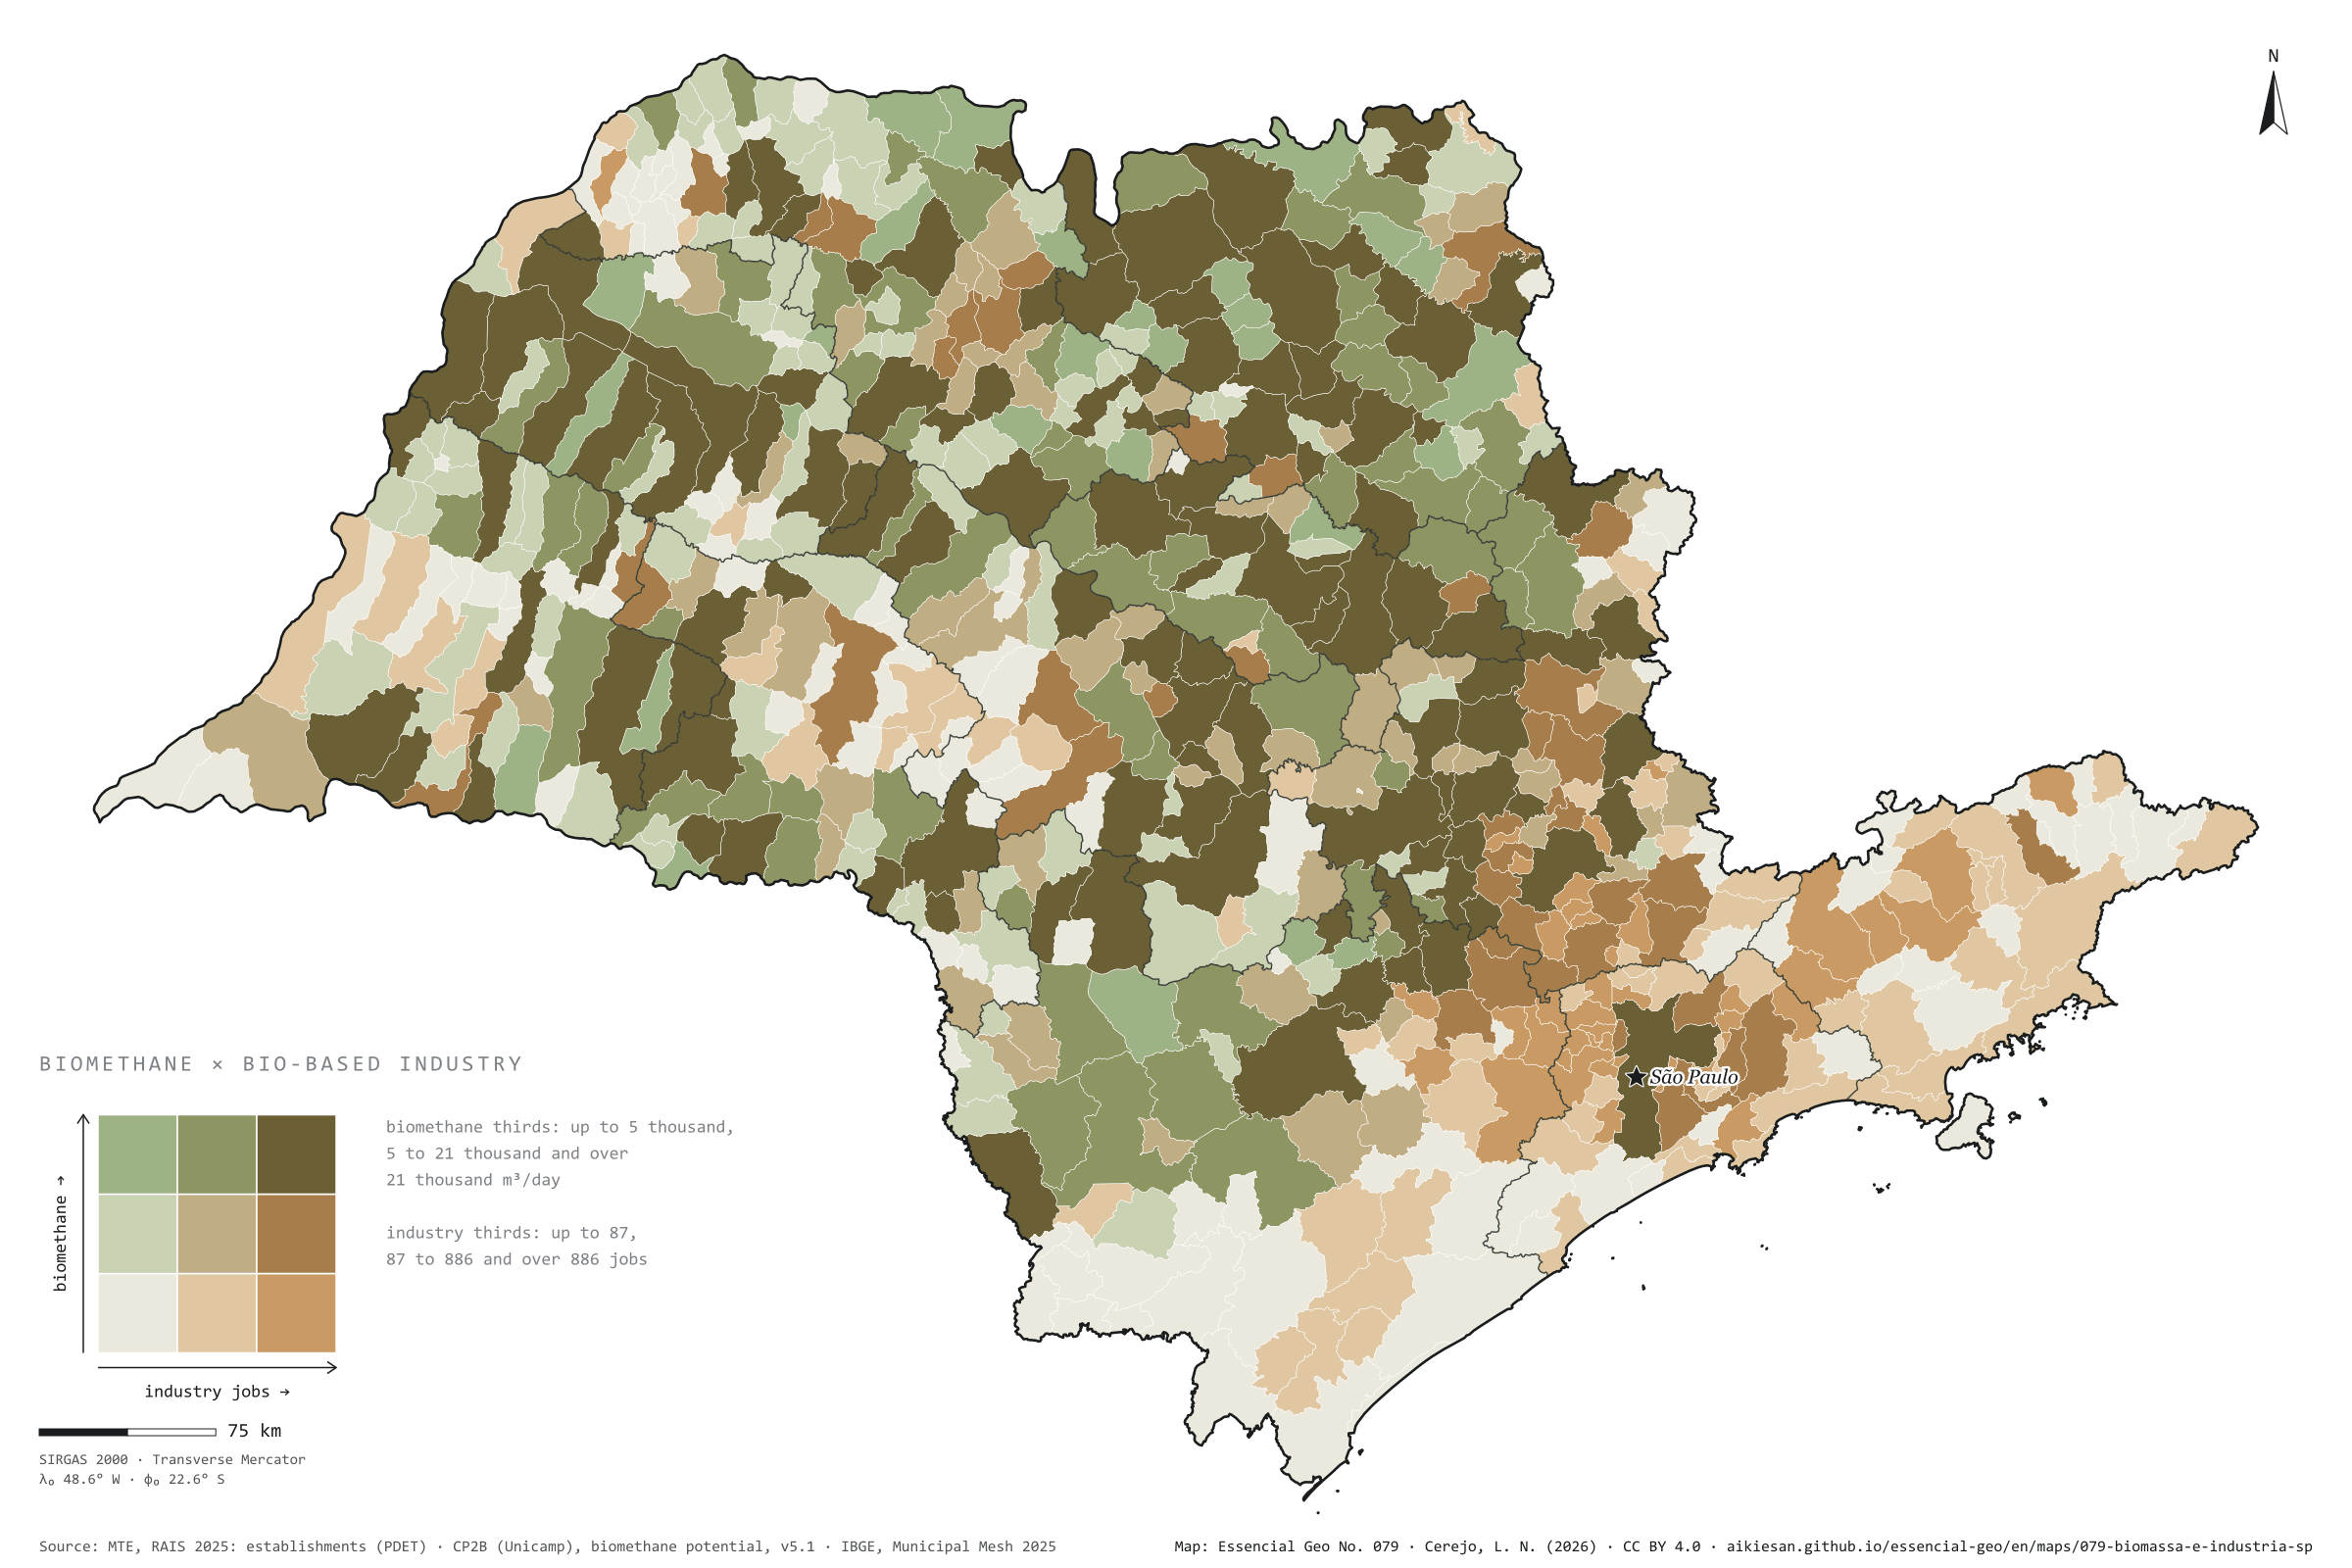
The hubs that already have both residue and industry, and those with only one
Fig. 079São Paulo State (SP)EPSG:4674Source: CP2B (Unicamp), MTE/PDET, IBGE
A bioeconomy hub needs two things in the same place: biomass and someone who knows how to convert it. This plate crosses the biomethane potential of residues (CP2B, accessible level, reference scenario) with formal jobs in bio-based industry (food, drink, wood, paper, fibres and biofuels), each split into thirds of the municipalities. In 115 municipalities both are in the top third: these are the hubs, with 61% of the state’s biomethane and 55% of those jobs, nearly all in the cane-growing north and centre. In 28, biomass is plentiful and industry scarce: Brejo Alegre has 77,000 m³ of biomethane a day and 4 industrial jobs. In 43, industry is strong and biomass is scarce, mostly in the metropolis: Barueri has 4,554 jobs and little residue of its own. Fourth plate of the collection “The bioeconomy at work”.
Technical record · downloads · citation
At a glance
Municipalities in the top third for both biomethane and industry
115municipalities
61% of the biomethane and 55% of the industry jobs
Municipalities with plenty of biomass and little industry
28municipalities
Municipalities with strong industry and little biomass
43municipalities
Layers
municipiospolygon645 municipalities: CP2B biomethane potential and bio-based industry jobs by segment (same GPKG as plate 076)
regioes_intermediariaspolygon11 intermediate geographic regions
Biomethane potential by municipality (CP2B v5.1, level N4, reference scenario) and active jobs on 31/12/2025 in bio-based industry (RAIS 2025), each split into thirds of the municipalities with a value; the cross gives nine classes.
The map without a frame, with legend, scale, reference system and credit written on it: ready for papers, lectures and slides. In two versions: with the basemap (neighbours and sea) or only the mapped area, on white.
CEREJO, Lucas Nakamura. Onde a biomassa encontra a fábrica: os polos que já têm resíduo e indústria, e os que só têm um dos dois. Versão 1.0.0. [S. l.]: Essencial, 2026. Conjunto de dados. Disponível em: https://aikiesan.github.io/essencial-geo/en/maps/079-biomassa-e-industria-sp/. Acesso em: 10 nov. 2026.
Cerejo, L. N. (2026). Onde a biomassa encontra a fábrica: os polos que já têm resíduo e indústria, e os que só têm um dos dois [Where biomass meets the factory: The hubs that already have both residue and industry, and those with only one] (Version 1.0.0) [Data set]. Essencial. https://aikiesan.github.io/essencial-geo/en/maps/079-biomassa-e-industria-sp/
@dataset{cerejo2026_biomassa_e_industria_sp,
  author    = {Cerejo, Lucas Nakamura},
  title     = {Onde a biomassa encontra a fábrica: Os polos que já têm resíduo e indústria, e os que só têm um dos dois},
  year      = {2026},
  publisher = {Essencial},
  version   = {1.0.0},
  url       = {https://aikiesan.github.io/essencial-geo/en/maps/079-biomassa-e-industria-sp/},
  language  = {portuguese},
  note      = {English title: Where biomass meets the factory: The hubs that already have both residue and industry, and those with only one. Licence CC BY 4.0}
}
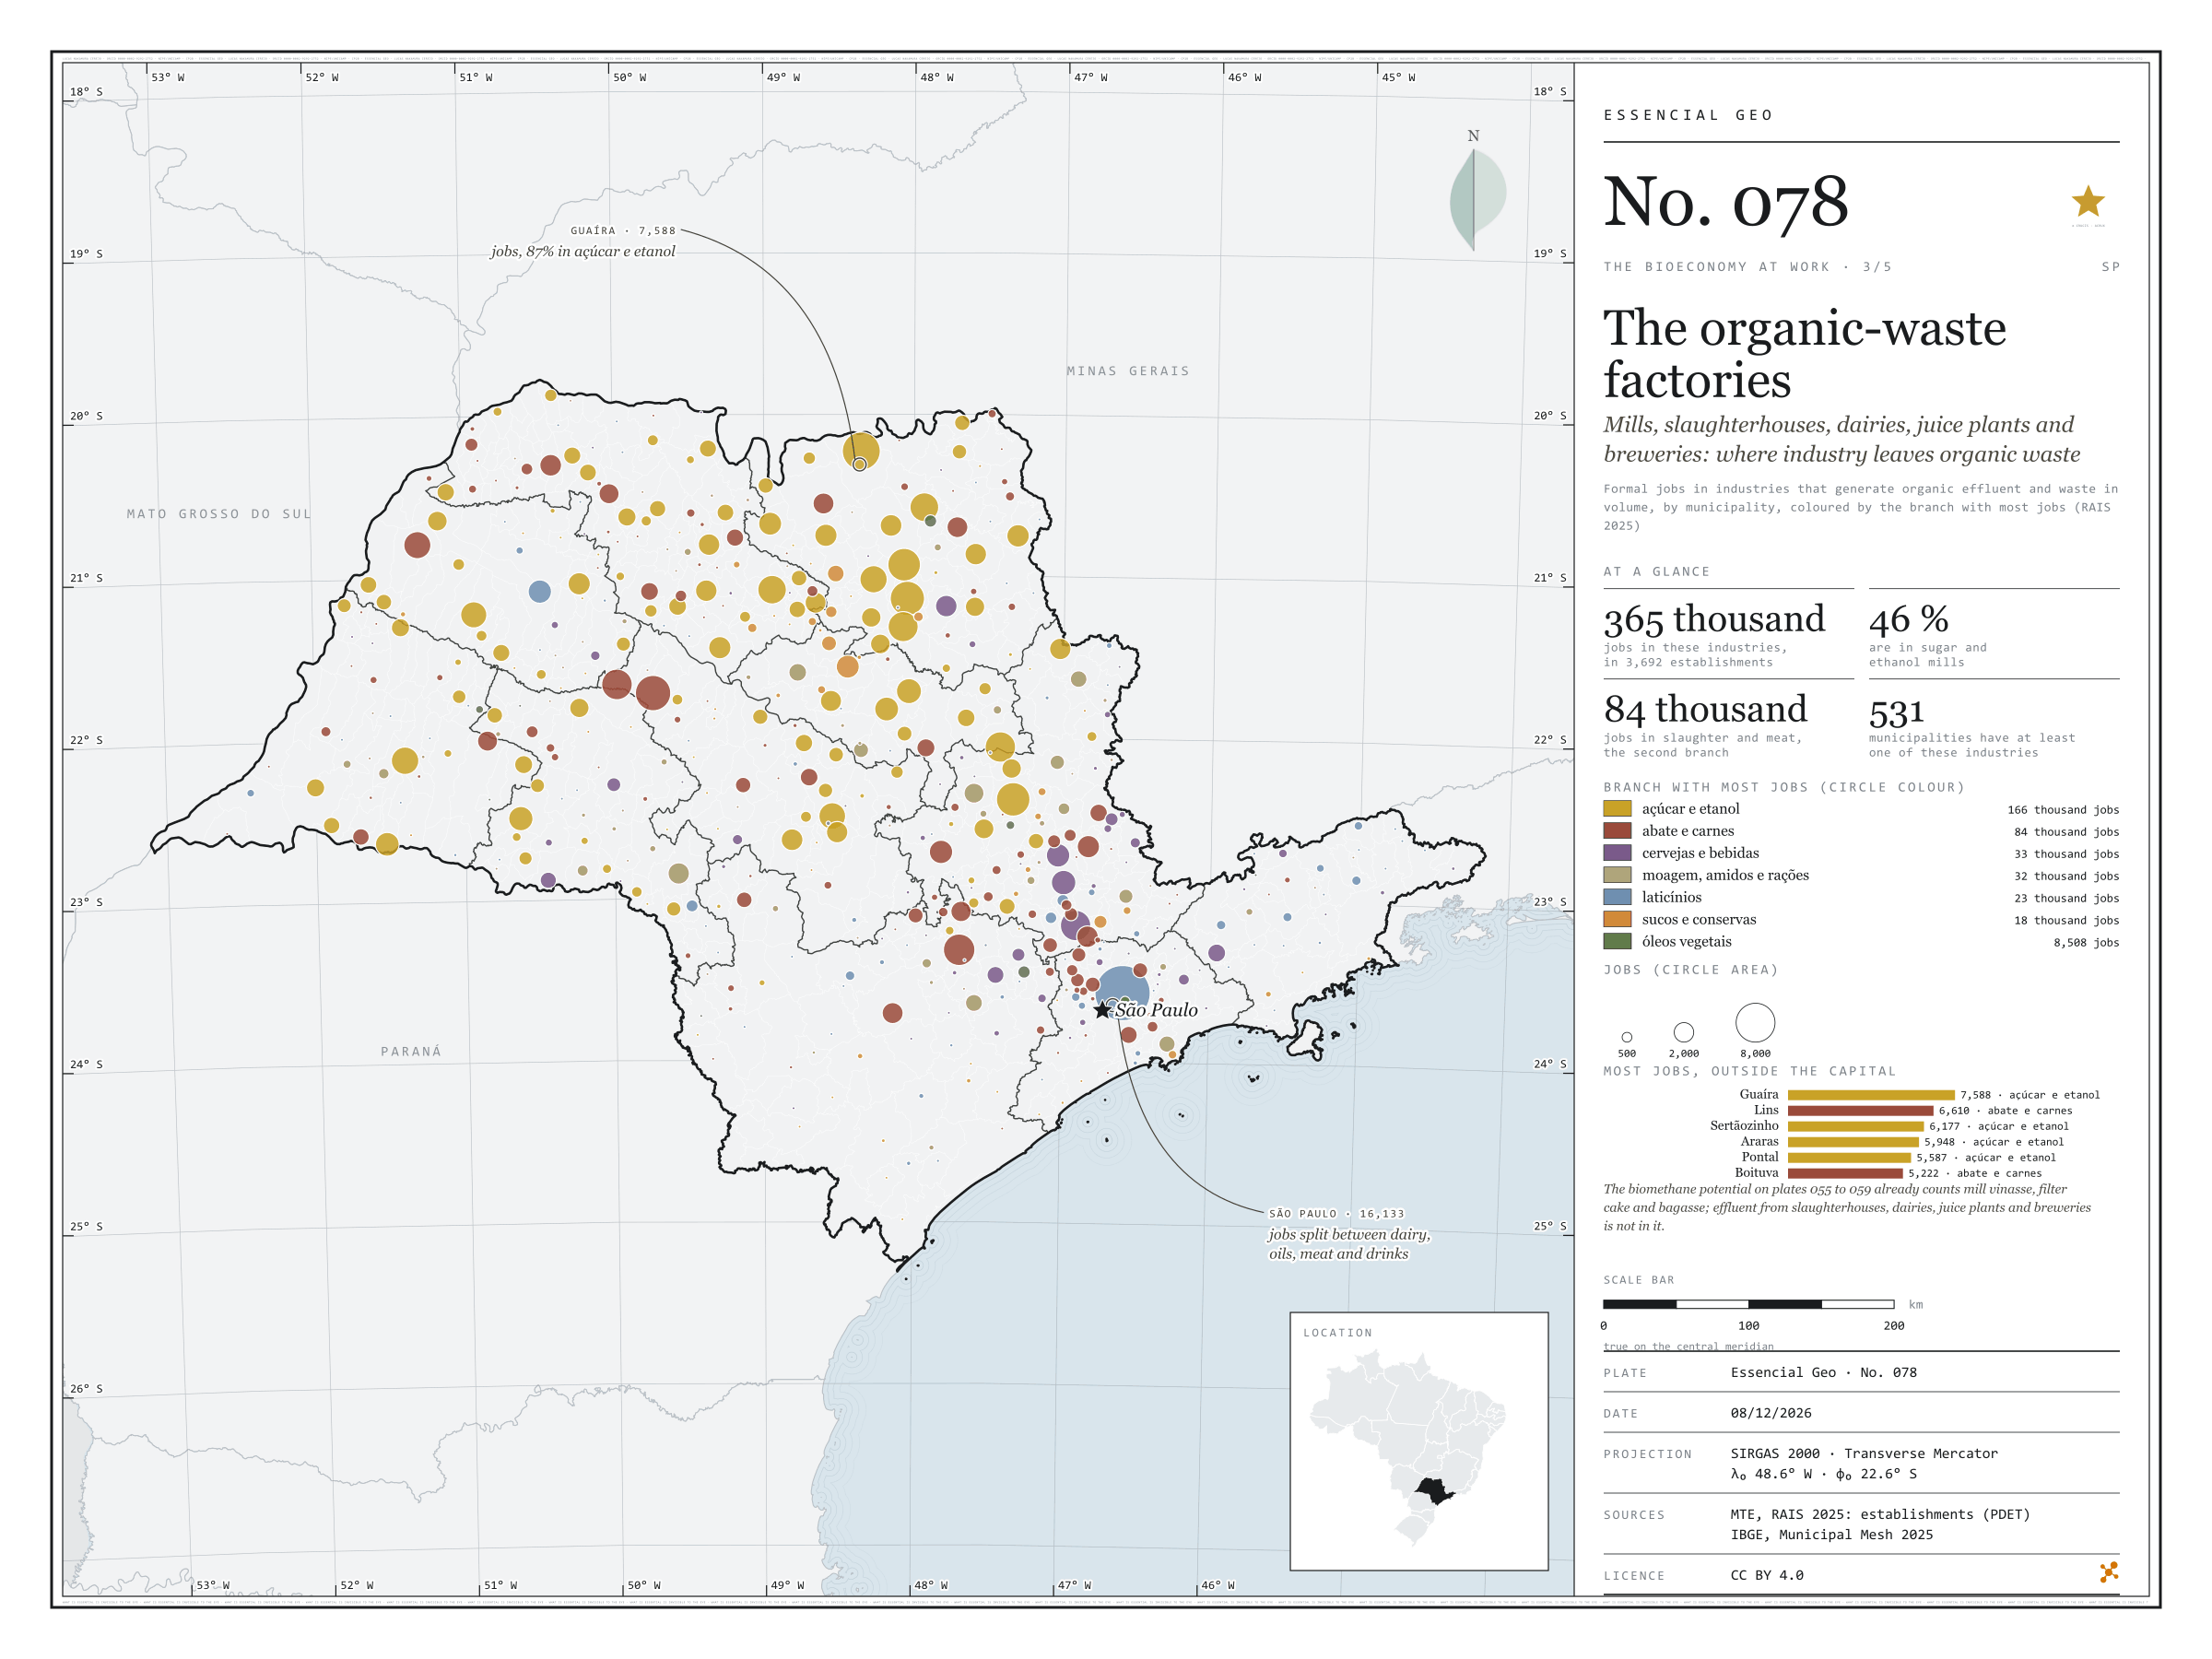
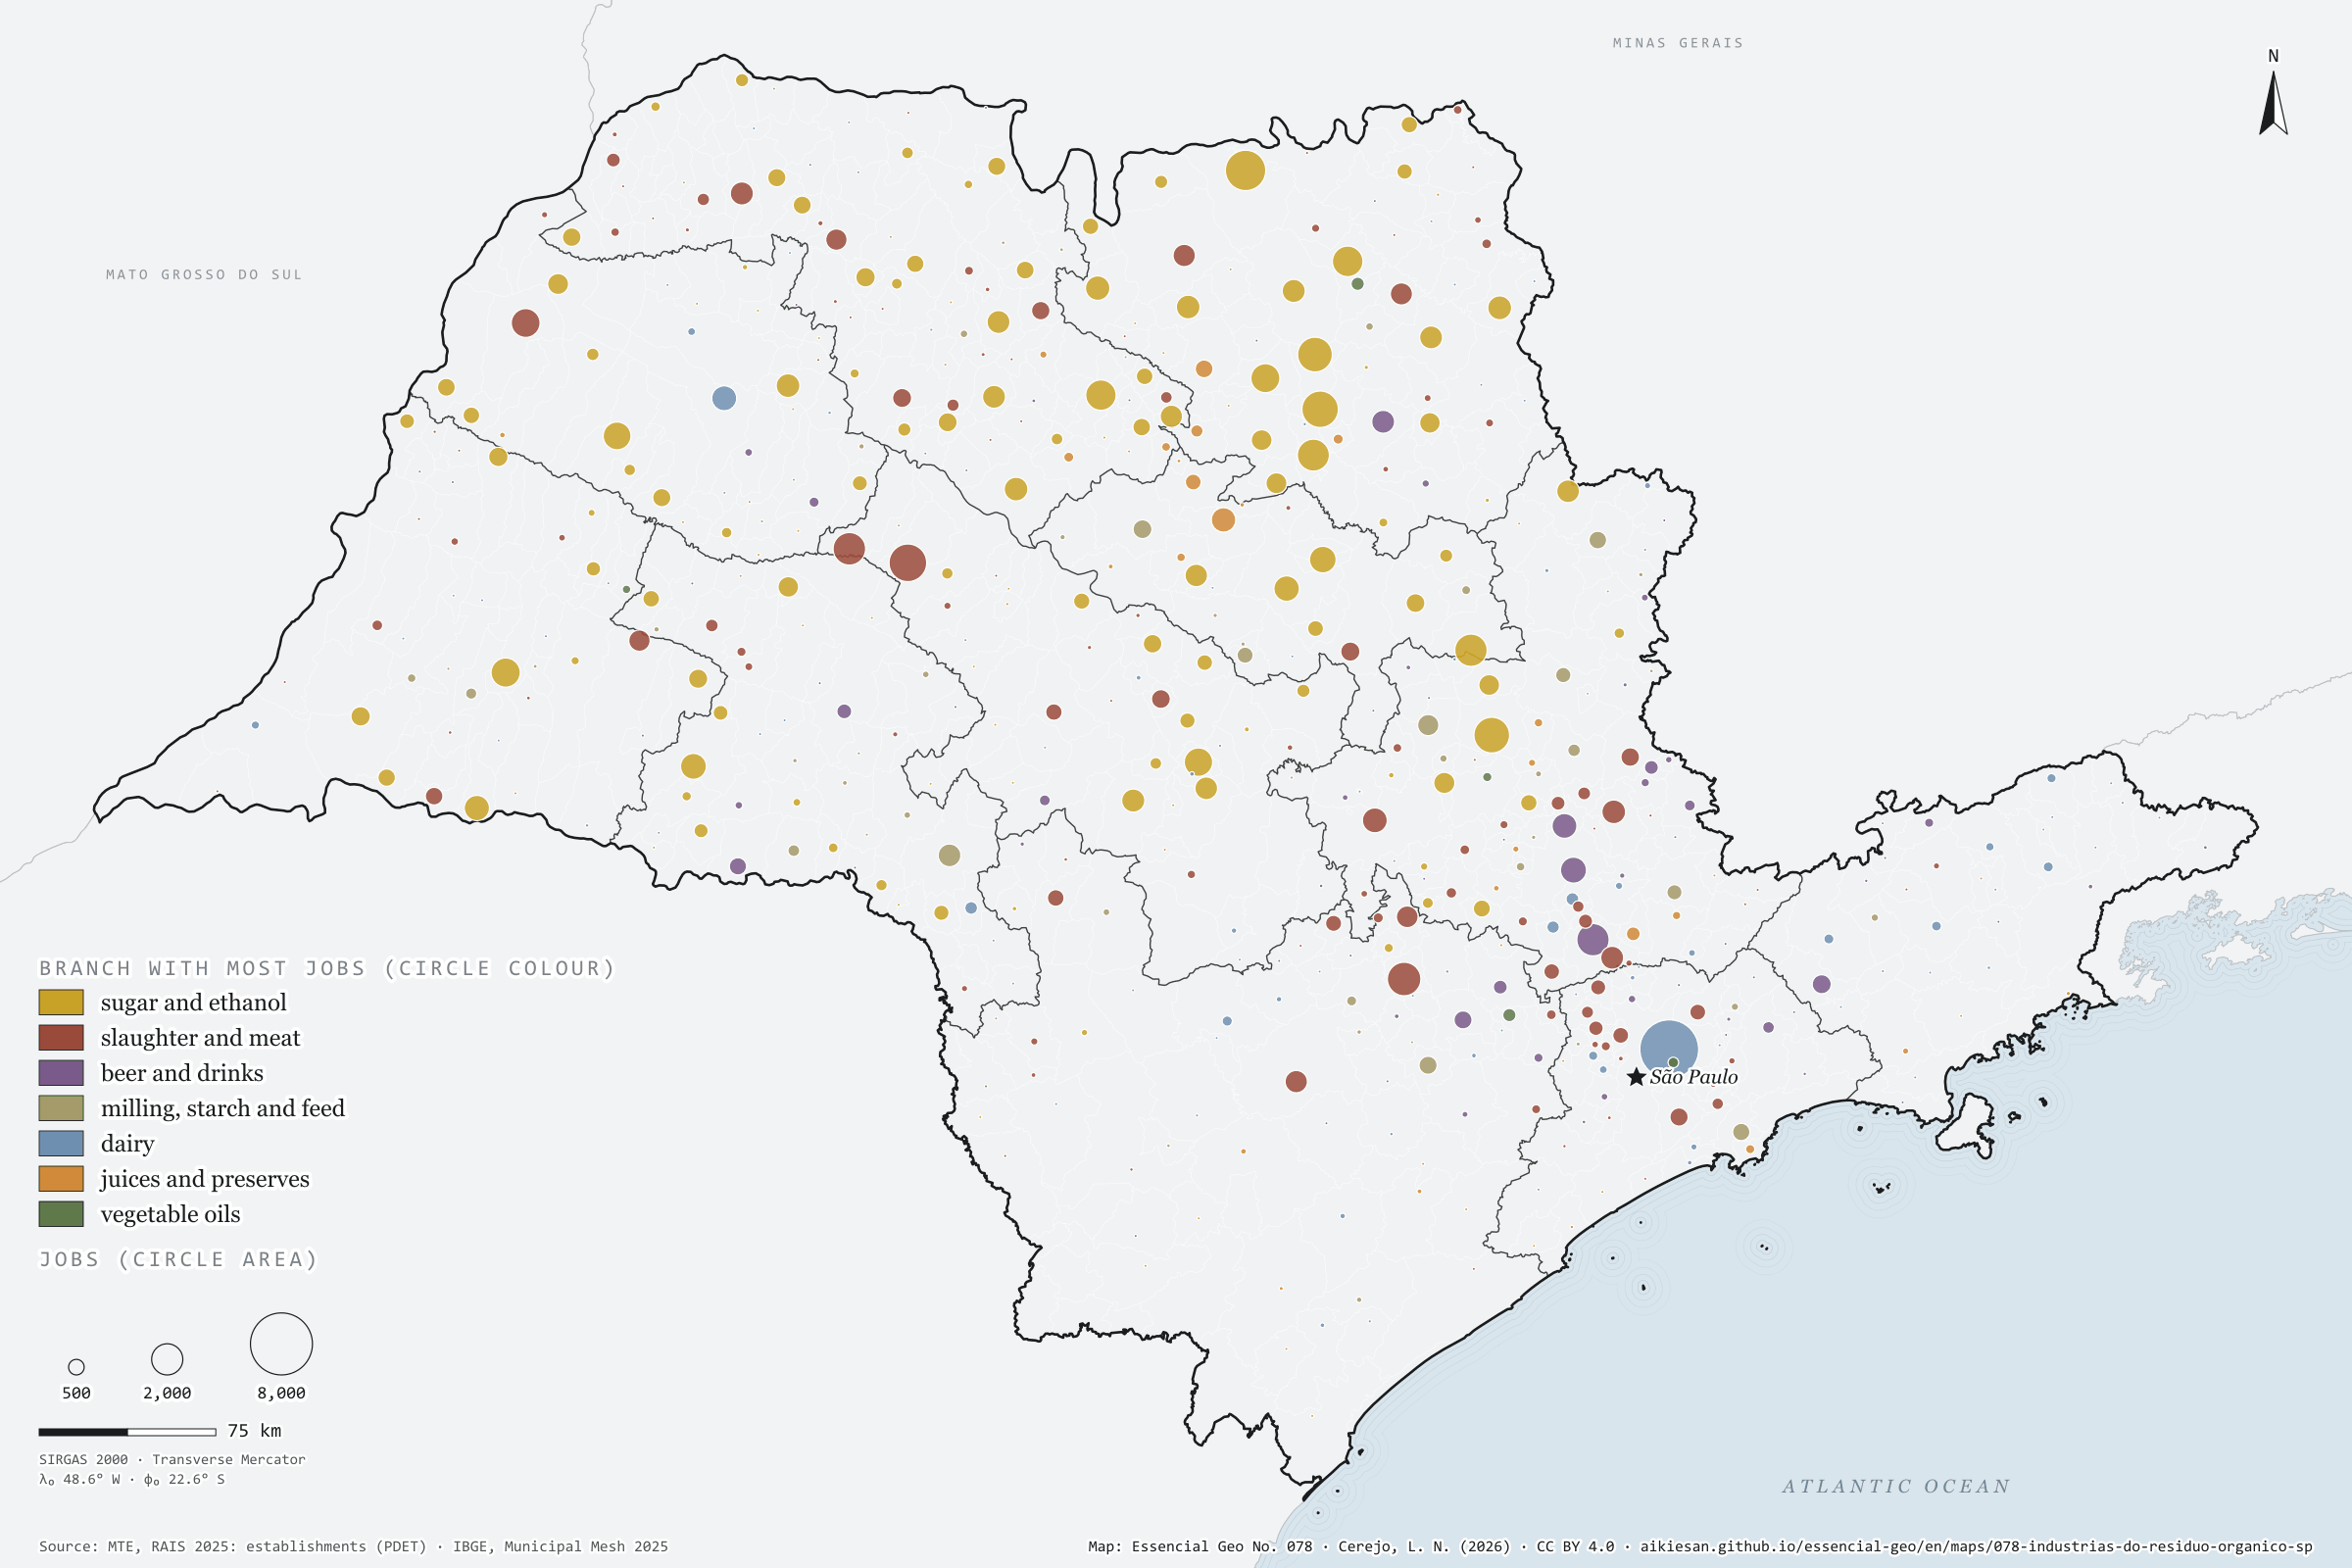
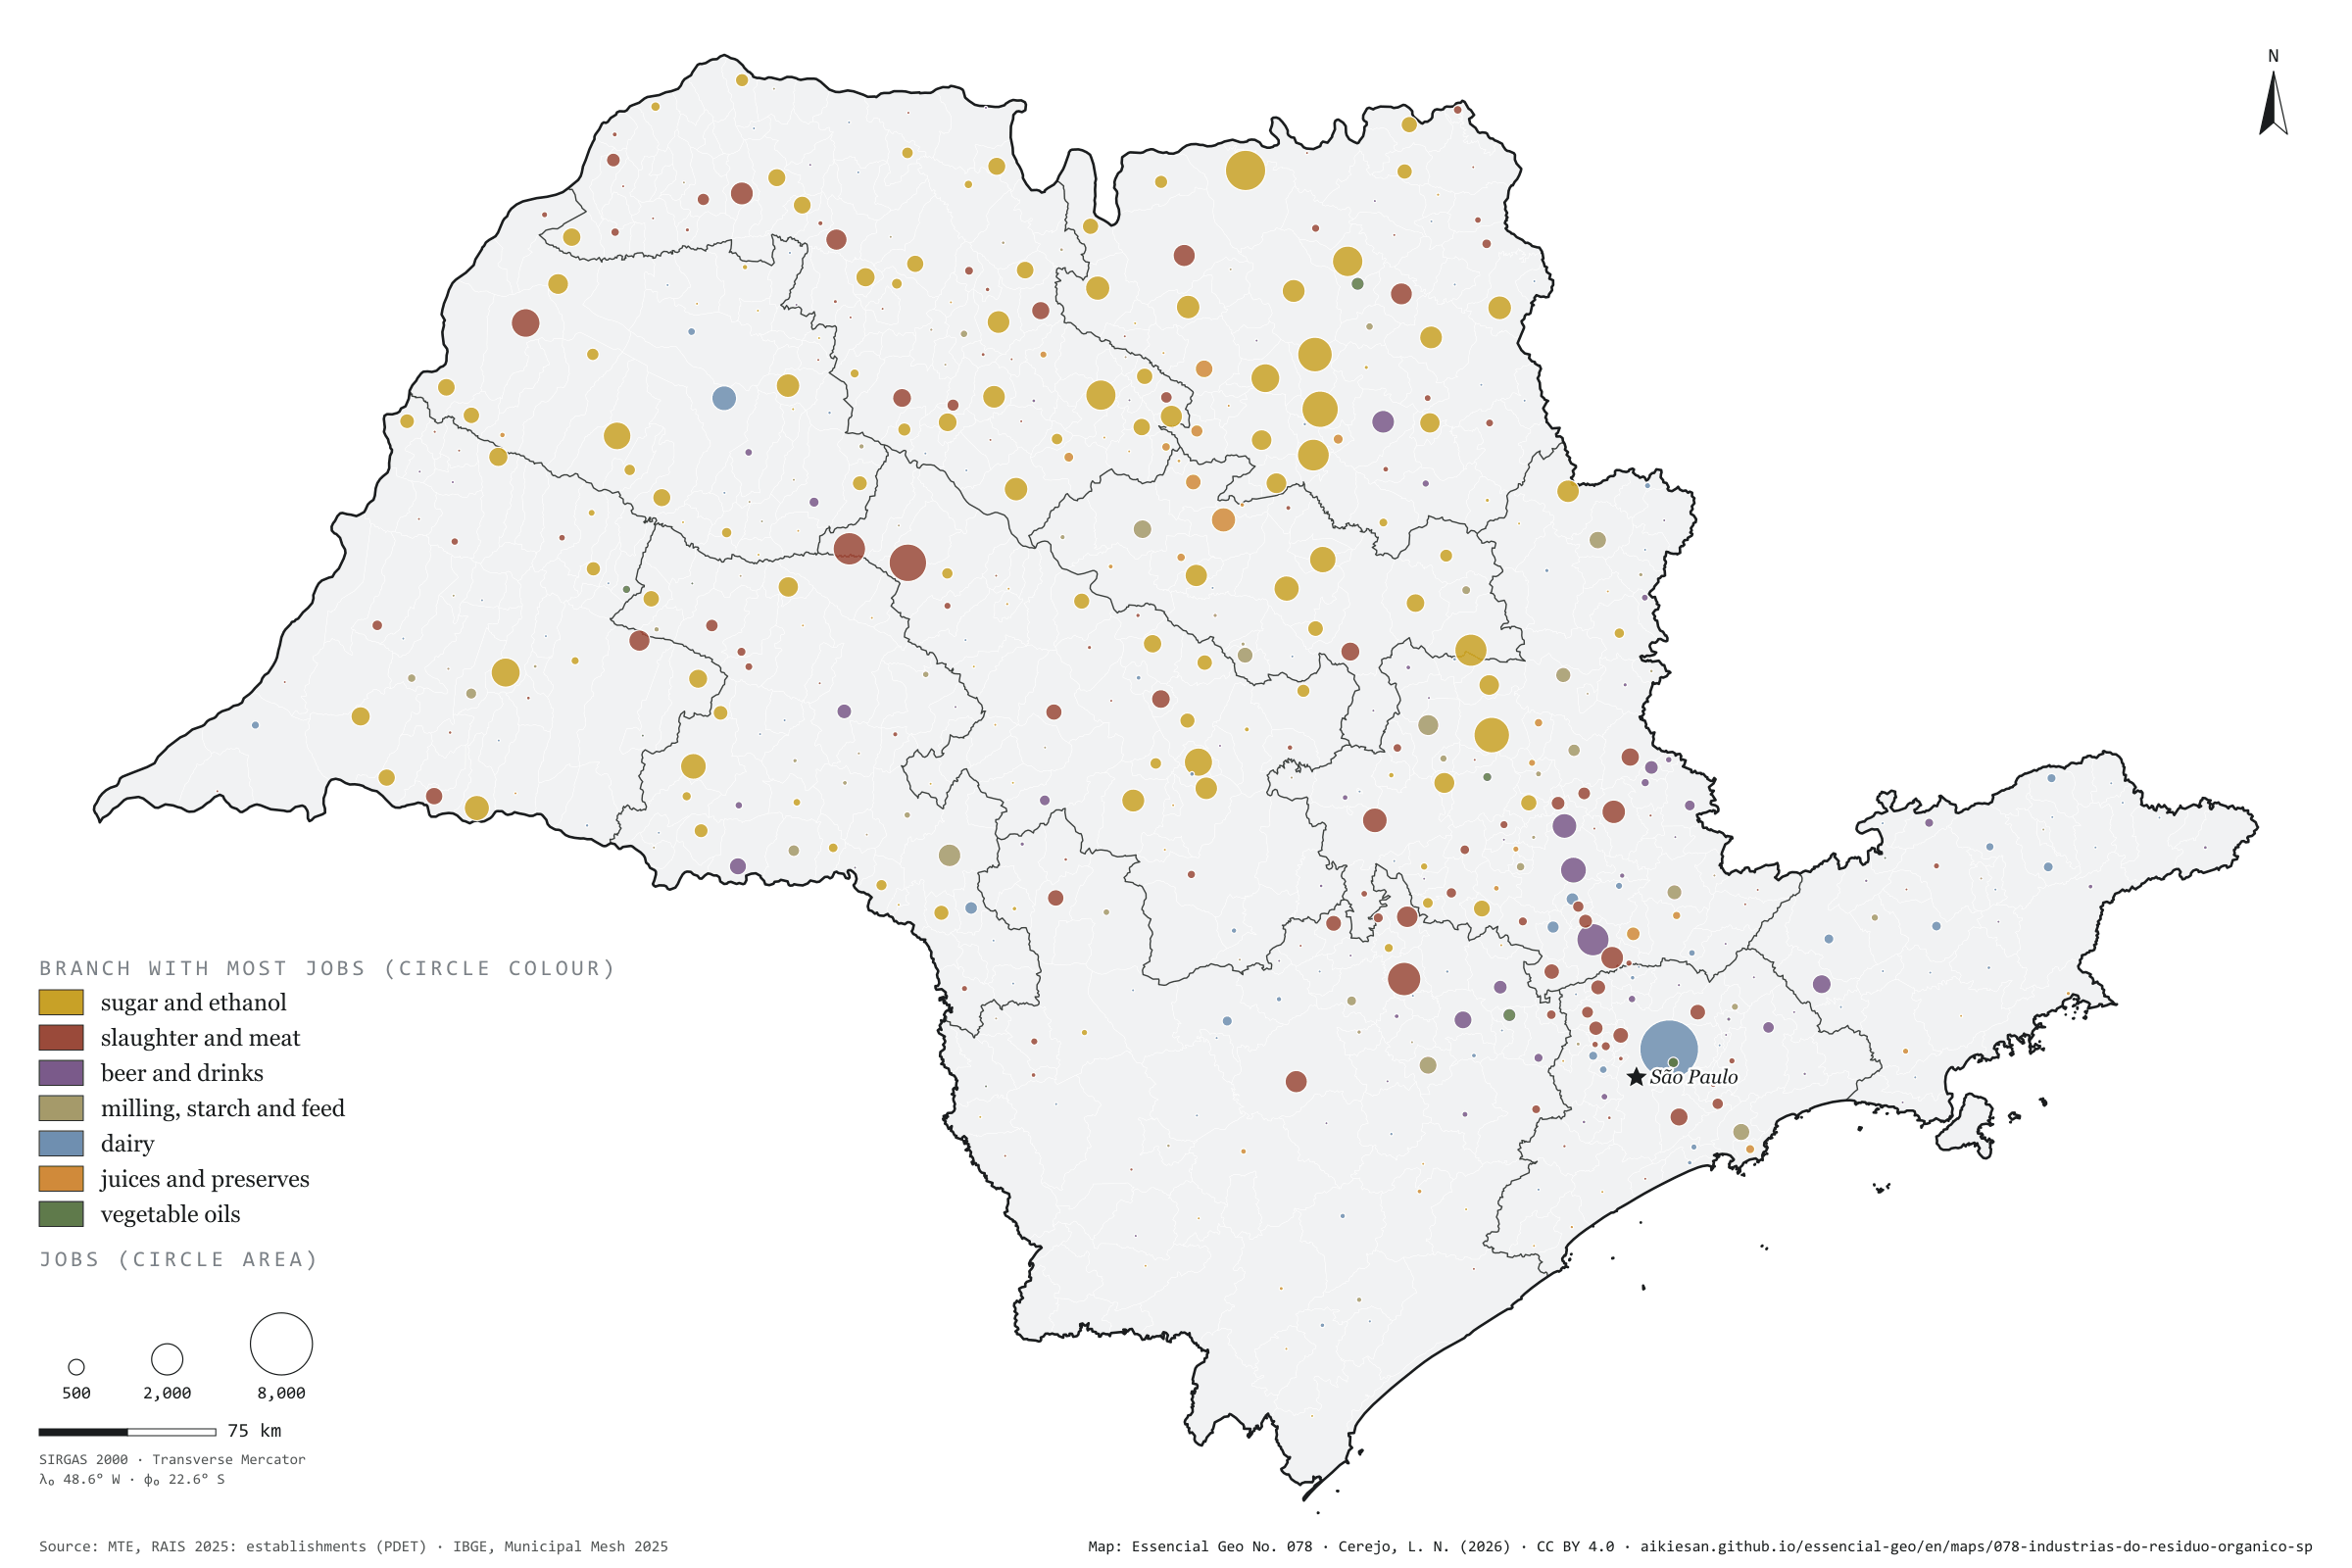
Mills, slaughterhouses, dairies, juice plants and breweries: where industry leaves organic waste
Fig. 078São Paulo State (SP)EPSG:4674Source: MTE/PDET, IBGE
Some industries leave organic waste in volume: vinasse, filter cake and bagasse at the mills; blood, rumen contents and fatty effluent at slaughterhouses; whey at dairies; pulp and peel at juice plants; yeast and spent grain at breweries. In São Paulo, 364,647 formal jobs are in these industries, in 3,692 establishments and 531 municipalities. Sugar and ethanol account for 46%; slaughter, 23%. The capital has the most jobs, 16,133, split between dairy, oils, slaughter and drinks. Inland the mill rules: in Guaíra, 87% of the 7,588 jobs are in sugar and ethanol; Sertãozinho and Araras follow close behind. Slaughter leads in 124 municipalities, the mills in 116 and dairies in 89. CP2B already counts cane residues; the effluent of the other industries is left out. Third plate of the collection “The bioeconomy at work”.
Technical record · downloads · citation
At a glance
Jobs in organic-waste-generating industries, by branch (jobs)
Sugar and ethanol45.5%
Slaughter23%
Drinks9.1%
Grain and feed8.8%
Dairy6.4%
Fruit and juice4.9%
Oils2.3%
Establishments in generating industries
3,692establishments
in 531 municipalities
Layers
municipiospolygon645 municipalities: jobs and establishments in generating industries, by branch, and the dominant branch (same GPKG as plate 076)
regioes_intermediariaspolygon11 intermediate geographic regions
Active jobs on 31/12/2025 in seven industrial branches that generate organic effluent and waste in volume (slaughter, dairy, fruit and juice, sugar and ethanol, oils, drinks, grain and feed), by CNAE class and municipality; circle proportional to the total, coloured by the branch with most jobs.
The map without a frame, with legend, scale, reference system and credit written on it: ready for papers, lectures and slides. In two versions: with the basemap (neighbours and sea) or only the mapped area, on white.
CEREJO, Lucas Nakamura. As fábricas do resíduo orgânico: usinas, frigoríficos, laticínios, sucos e cervejarias: onde a indústria deixa resíduo orgânico. Versão 1.0.0. [S. l.]: Essencial, 2026. Conjunto de dados. Disponível em: https://aikiesan.github.io/essencial-geo/en/maps/078-industrias-do-residuo-organico-sp/. Acesso em: 10 nov. 2026.
Cerejo, L. N. (2026). As fábricas do resíduo orgânico: usinas, frigoríficos, laticínios, sucos e cervejarias: onde a indústria deixa resíduo orgânico [The organic-waste factories: Mills, slaughterhouses, dairies, juice plants and breweries: where industry leaves organic waste] (Version 1.0.0) [Data set]. Essencial. https://aikiesan.github.io/essencial-geo/en/maps/078-industrias-do-residuo-organico-sp/
@dataset{cerejo2026_industrias_do_residuo_organico_sp,
  author    = {Cerejo, Lucas Nakamura},
  title     = {As fábricas do resíduo orgânico: Usinas, frigoríficos, laticínios, sucos e cervejarias: onde a indústria deixa resíduo orgânico},
  year      = {2026},
  publisher = {Essencial},
  version   = {1.0.0},
  url       = {https://aikiesan.github.io/essencial-geo/en/maps/078-industrias-do-residuo-organico-sp/},
  language  = {portuguese},
  note      = {English title: The organic-waste factories: Mills, slaughterhouses, dairies, juice plants and breweries: where industry leaves organic waste. Licence CC BY 4.0}
}