Skip to content
Essencial

No. 079 Energy · biomass The bioeconomy at work 4/5

Where biomass meets the factory

The hubs that already have both residue and industry, and those with only one

Record, downloads and citation
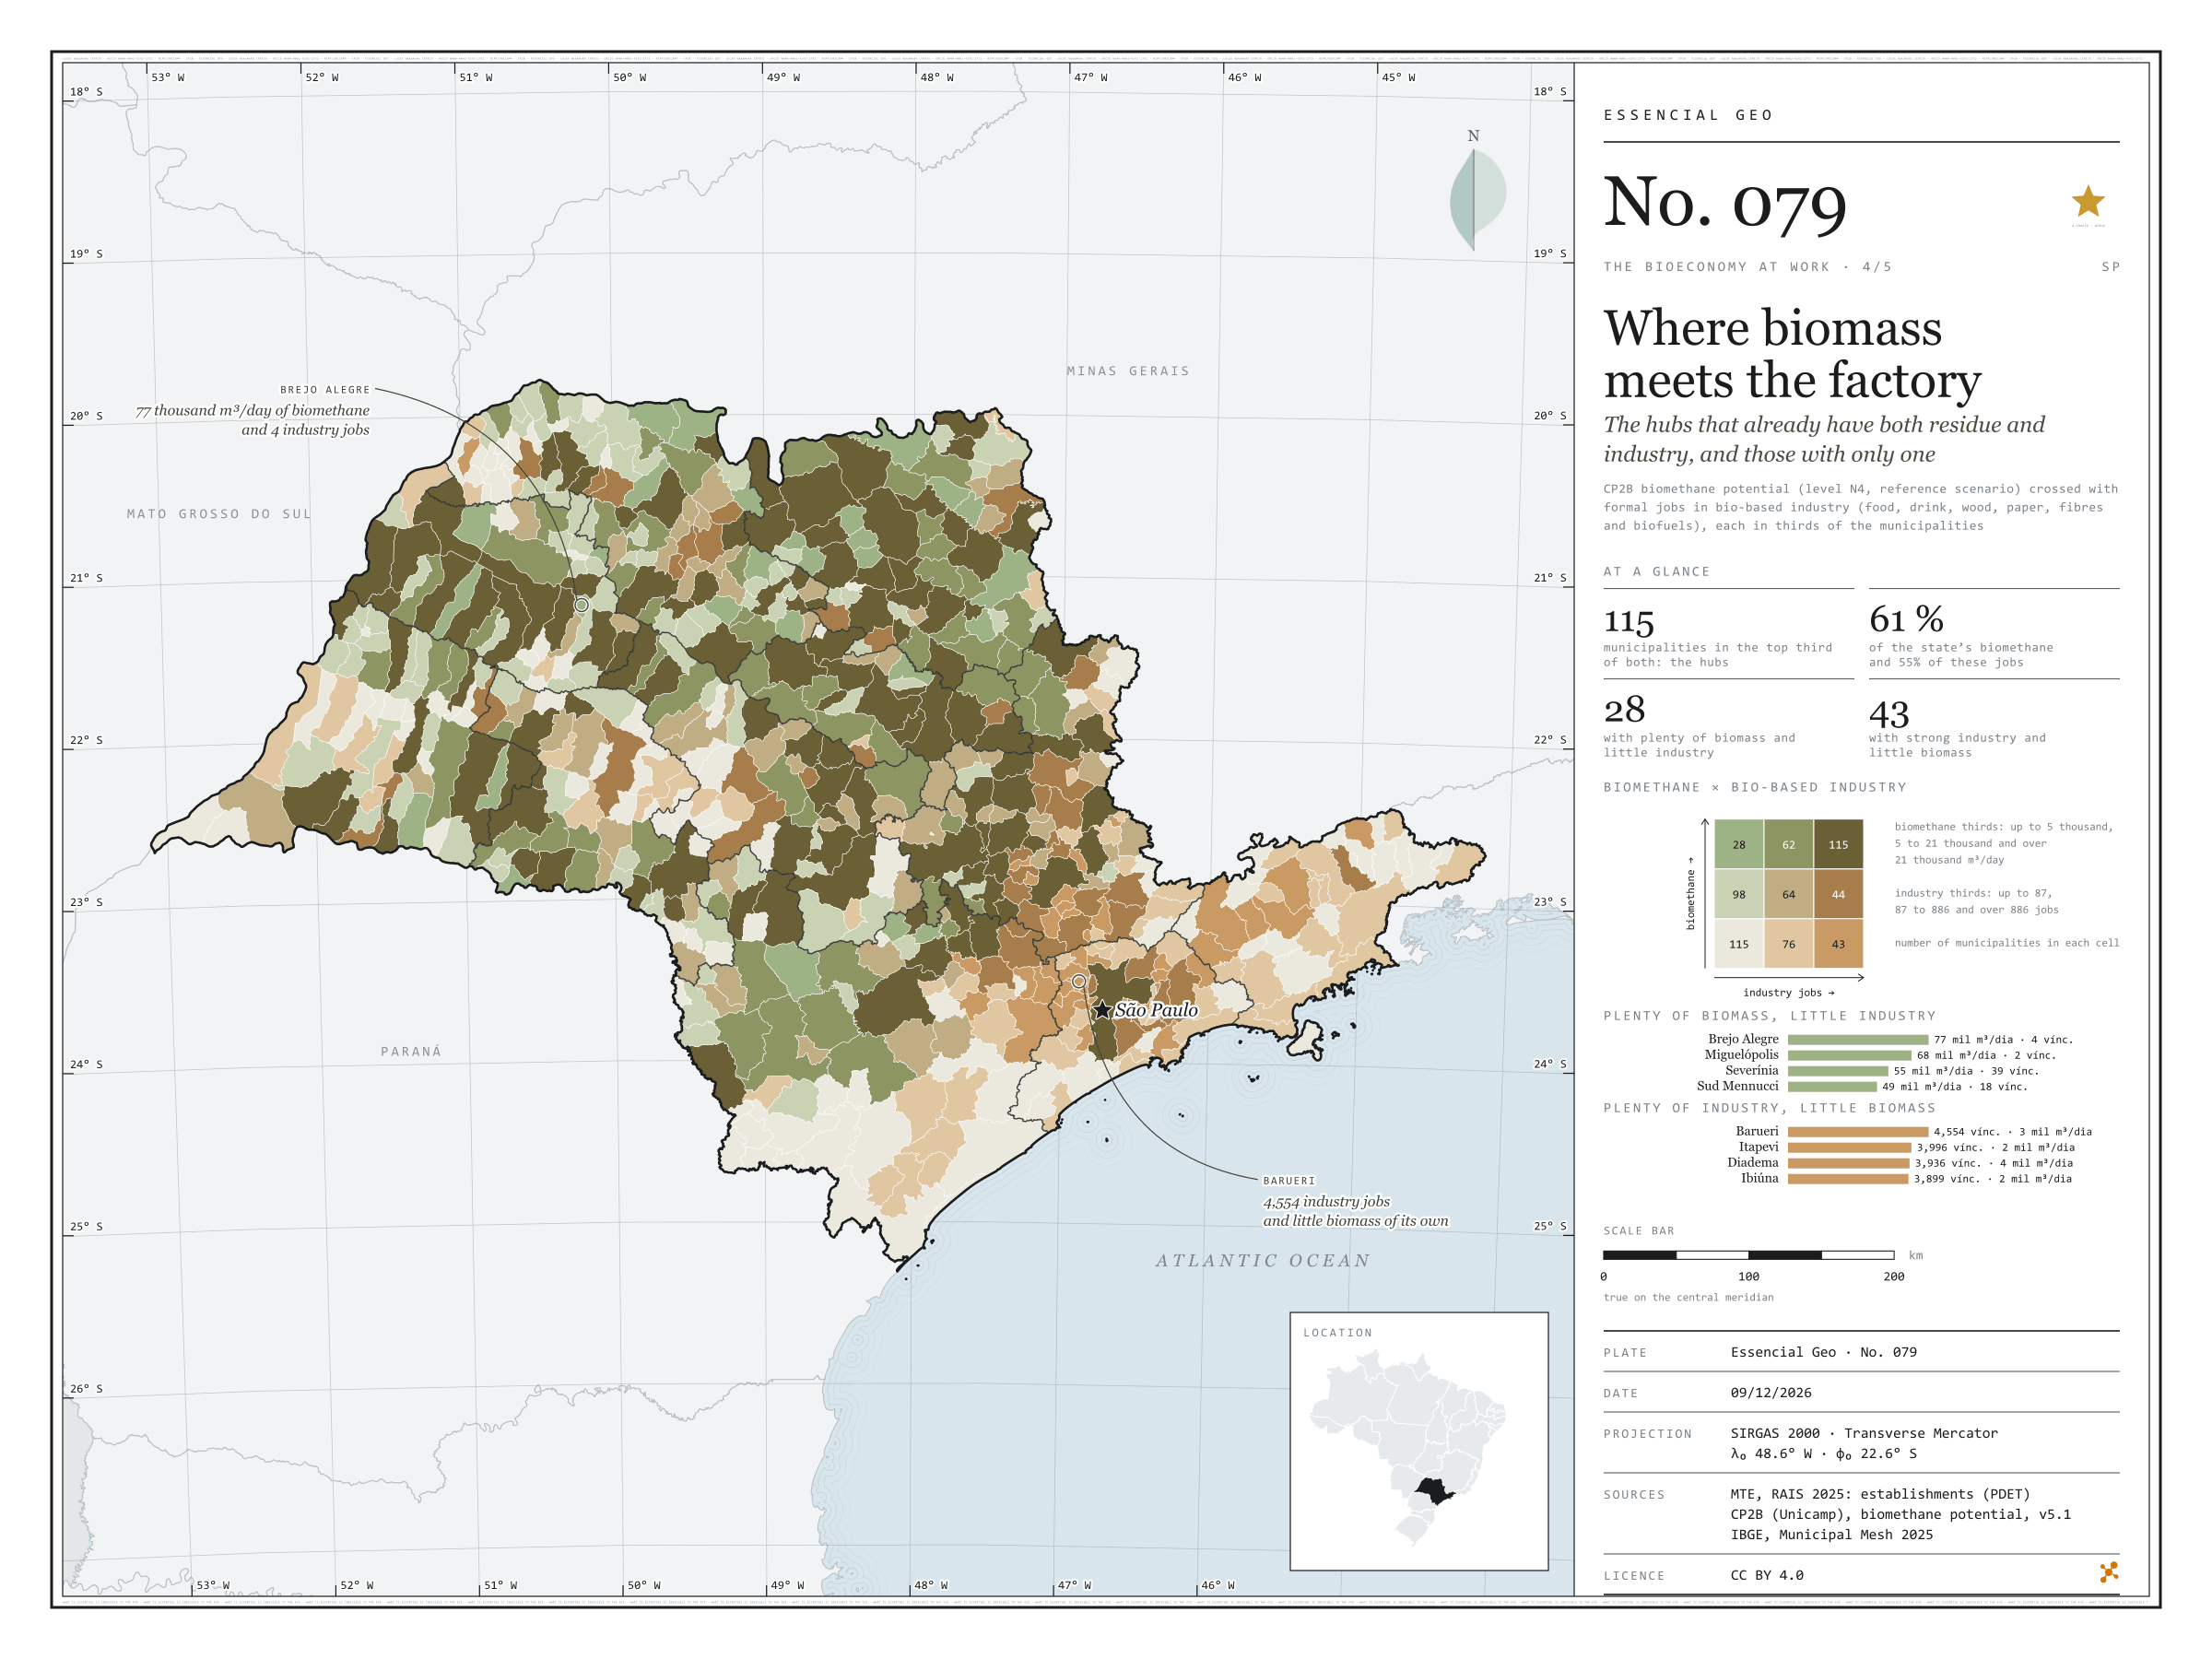
Fig. 079 São Paulo State (SP) EPSG:4674 Source: CP2B (Unicamp), MTE/PDET, IBGE

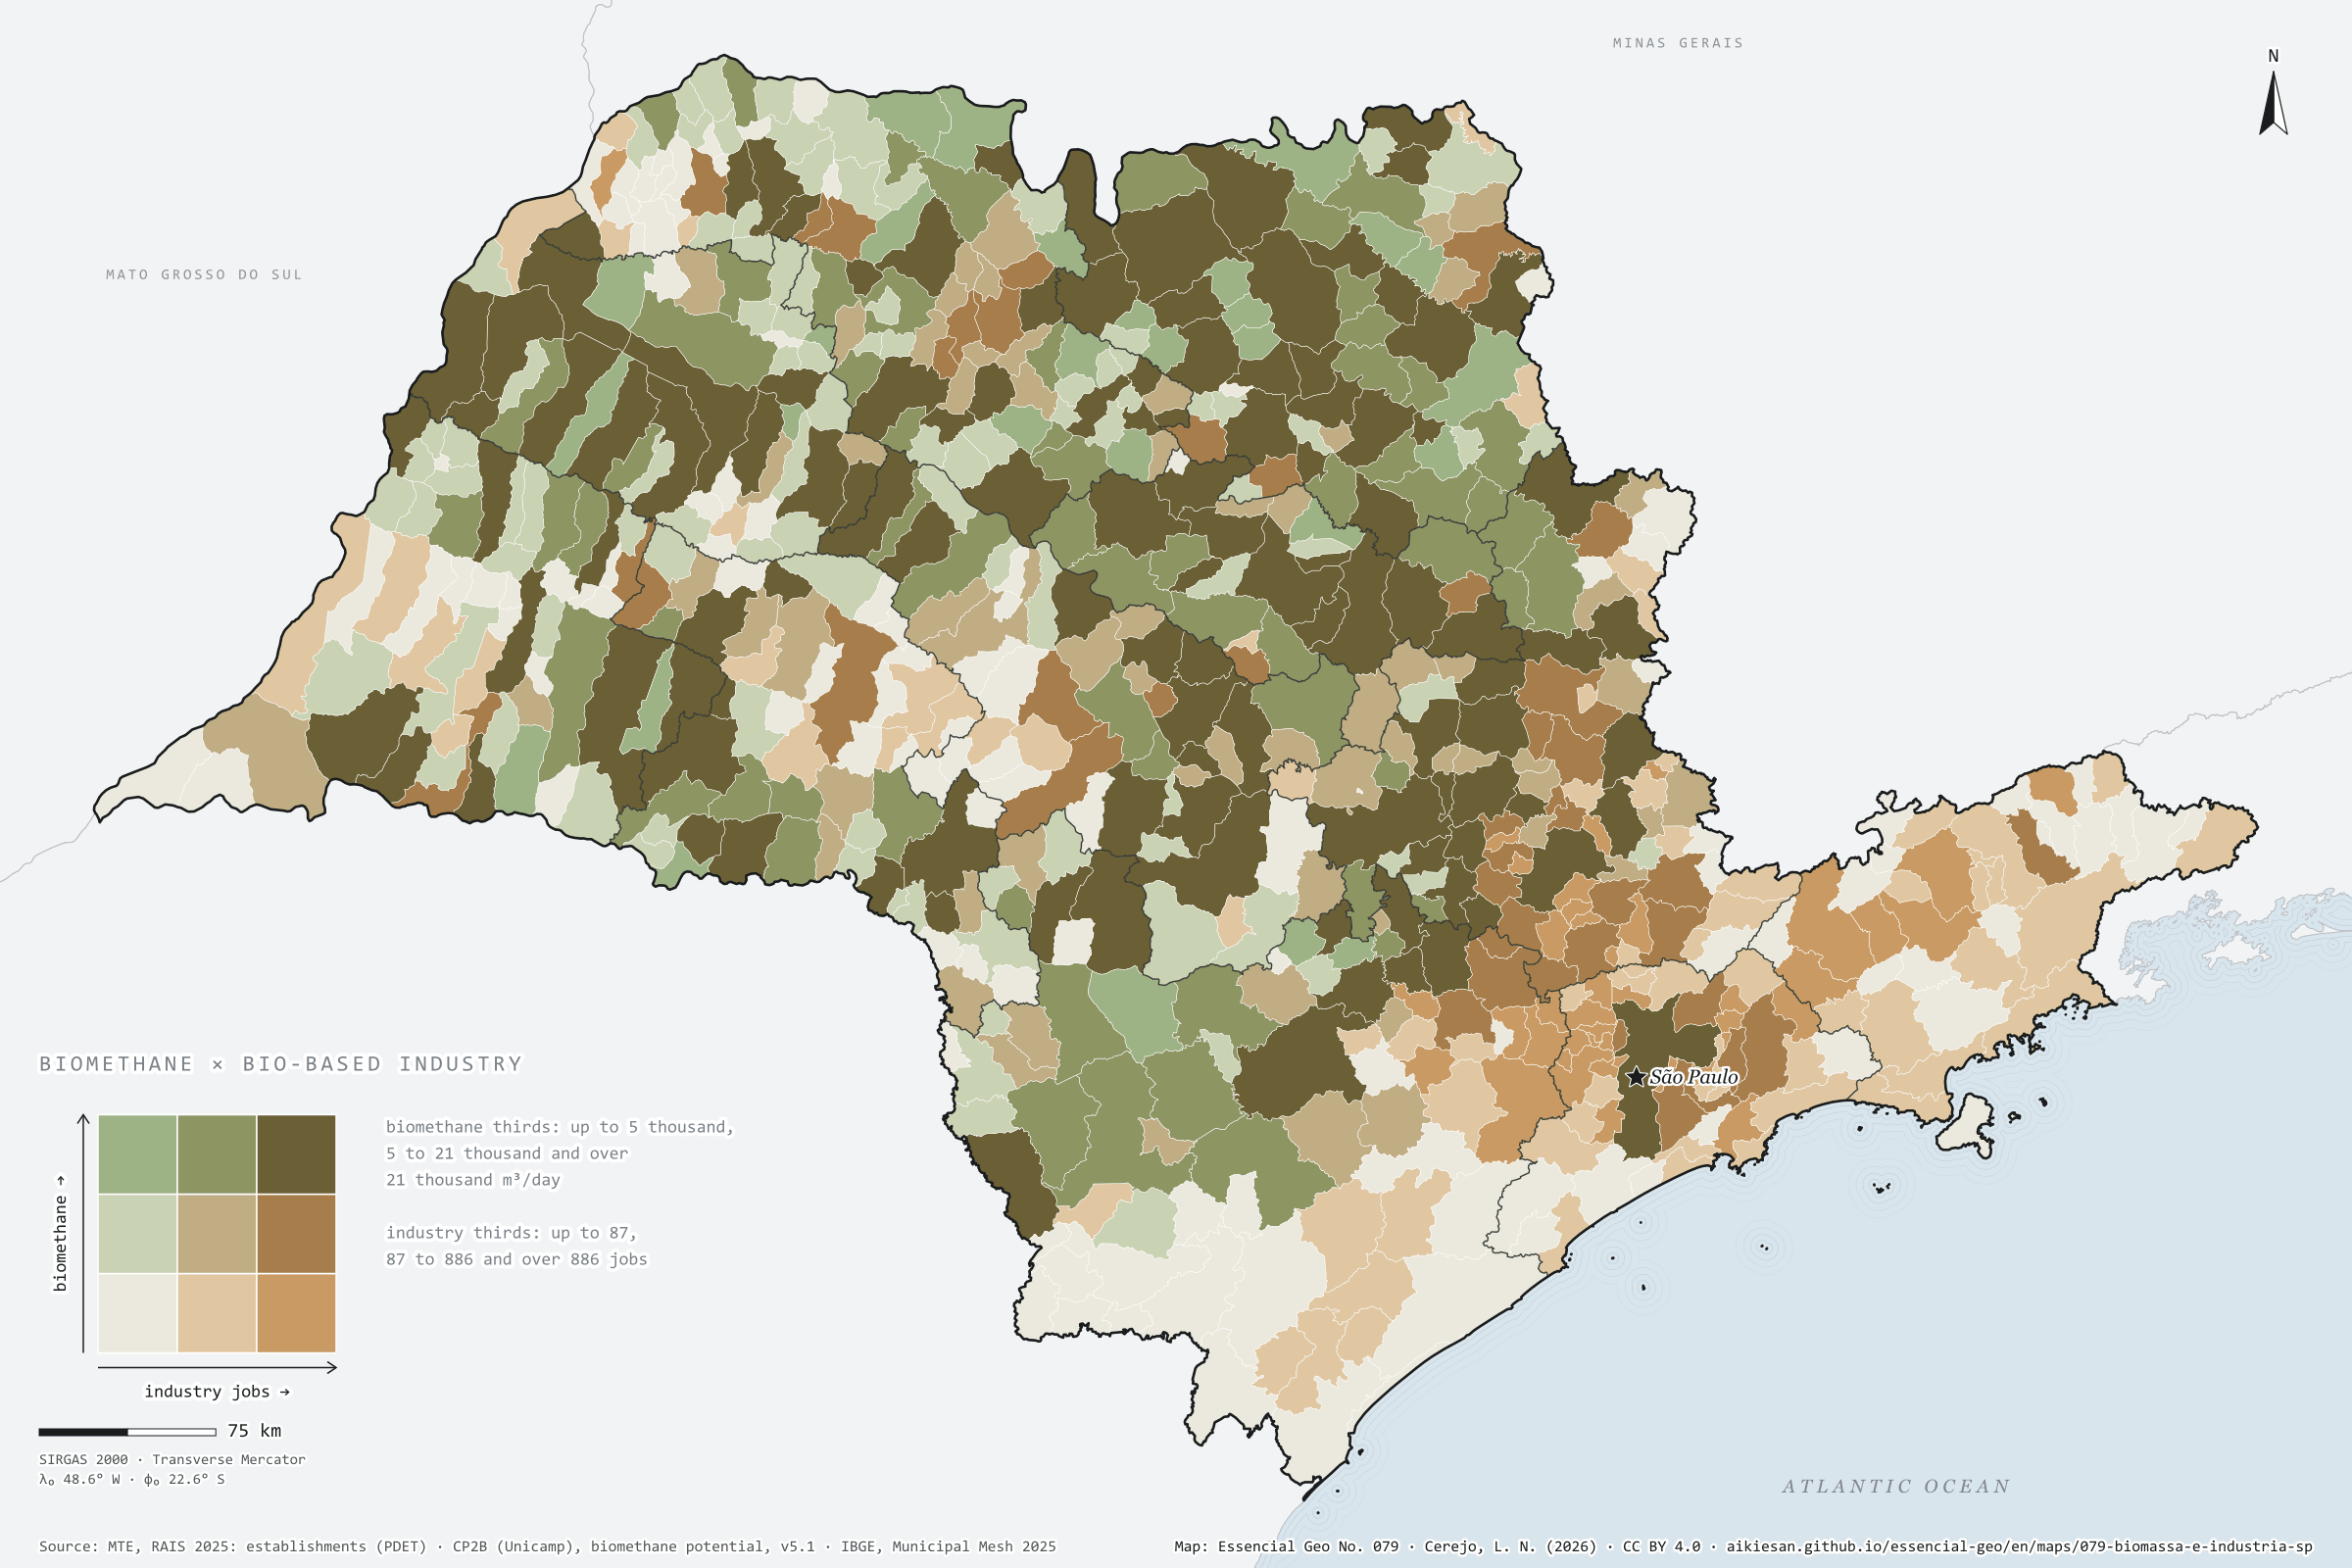
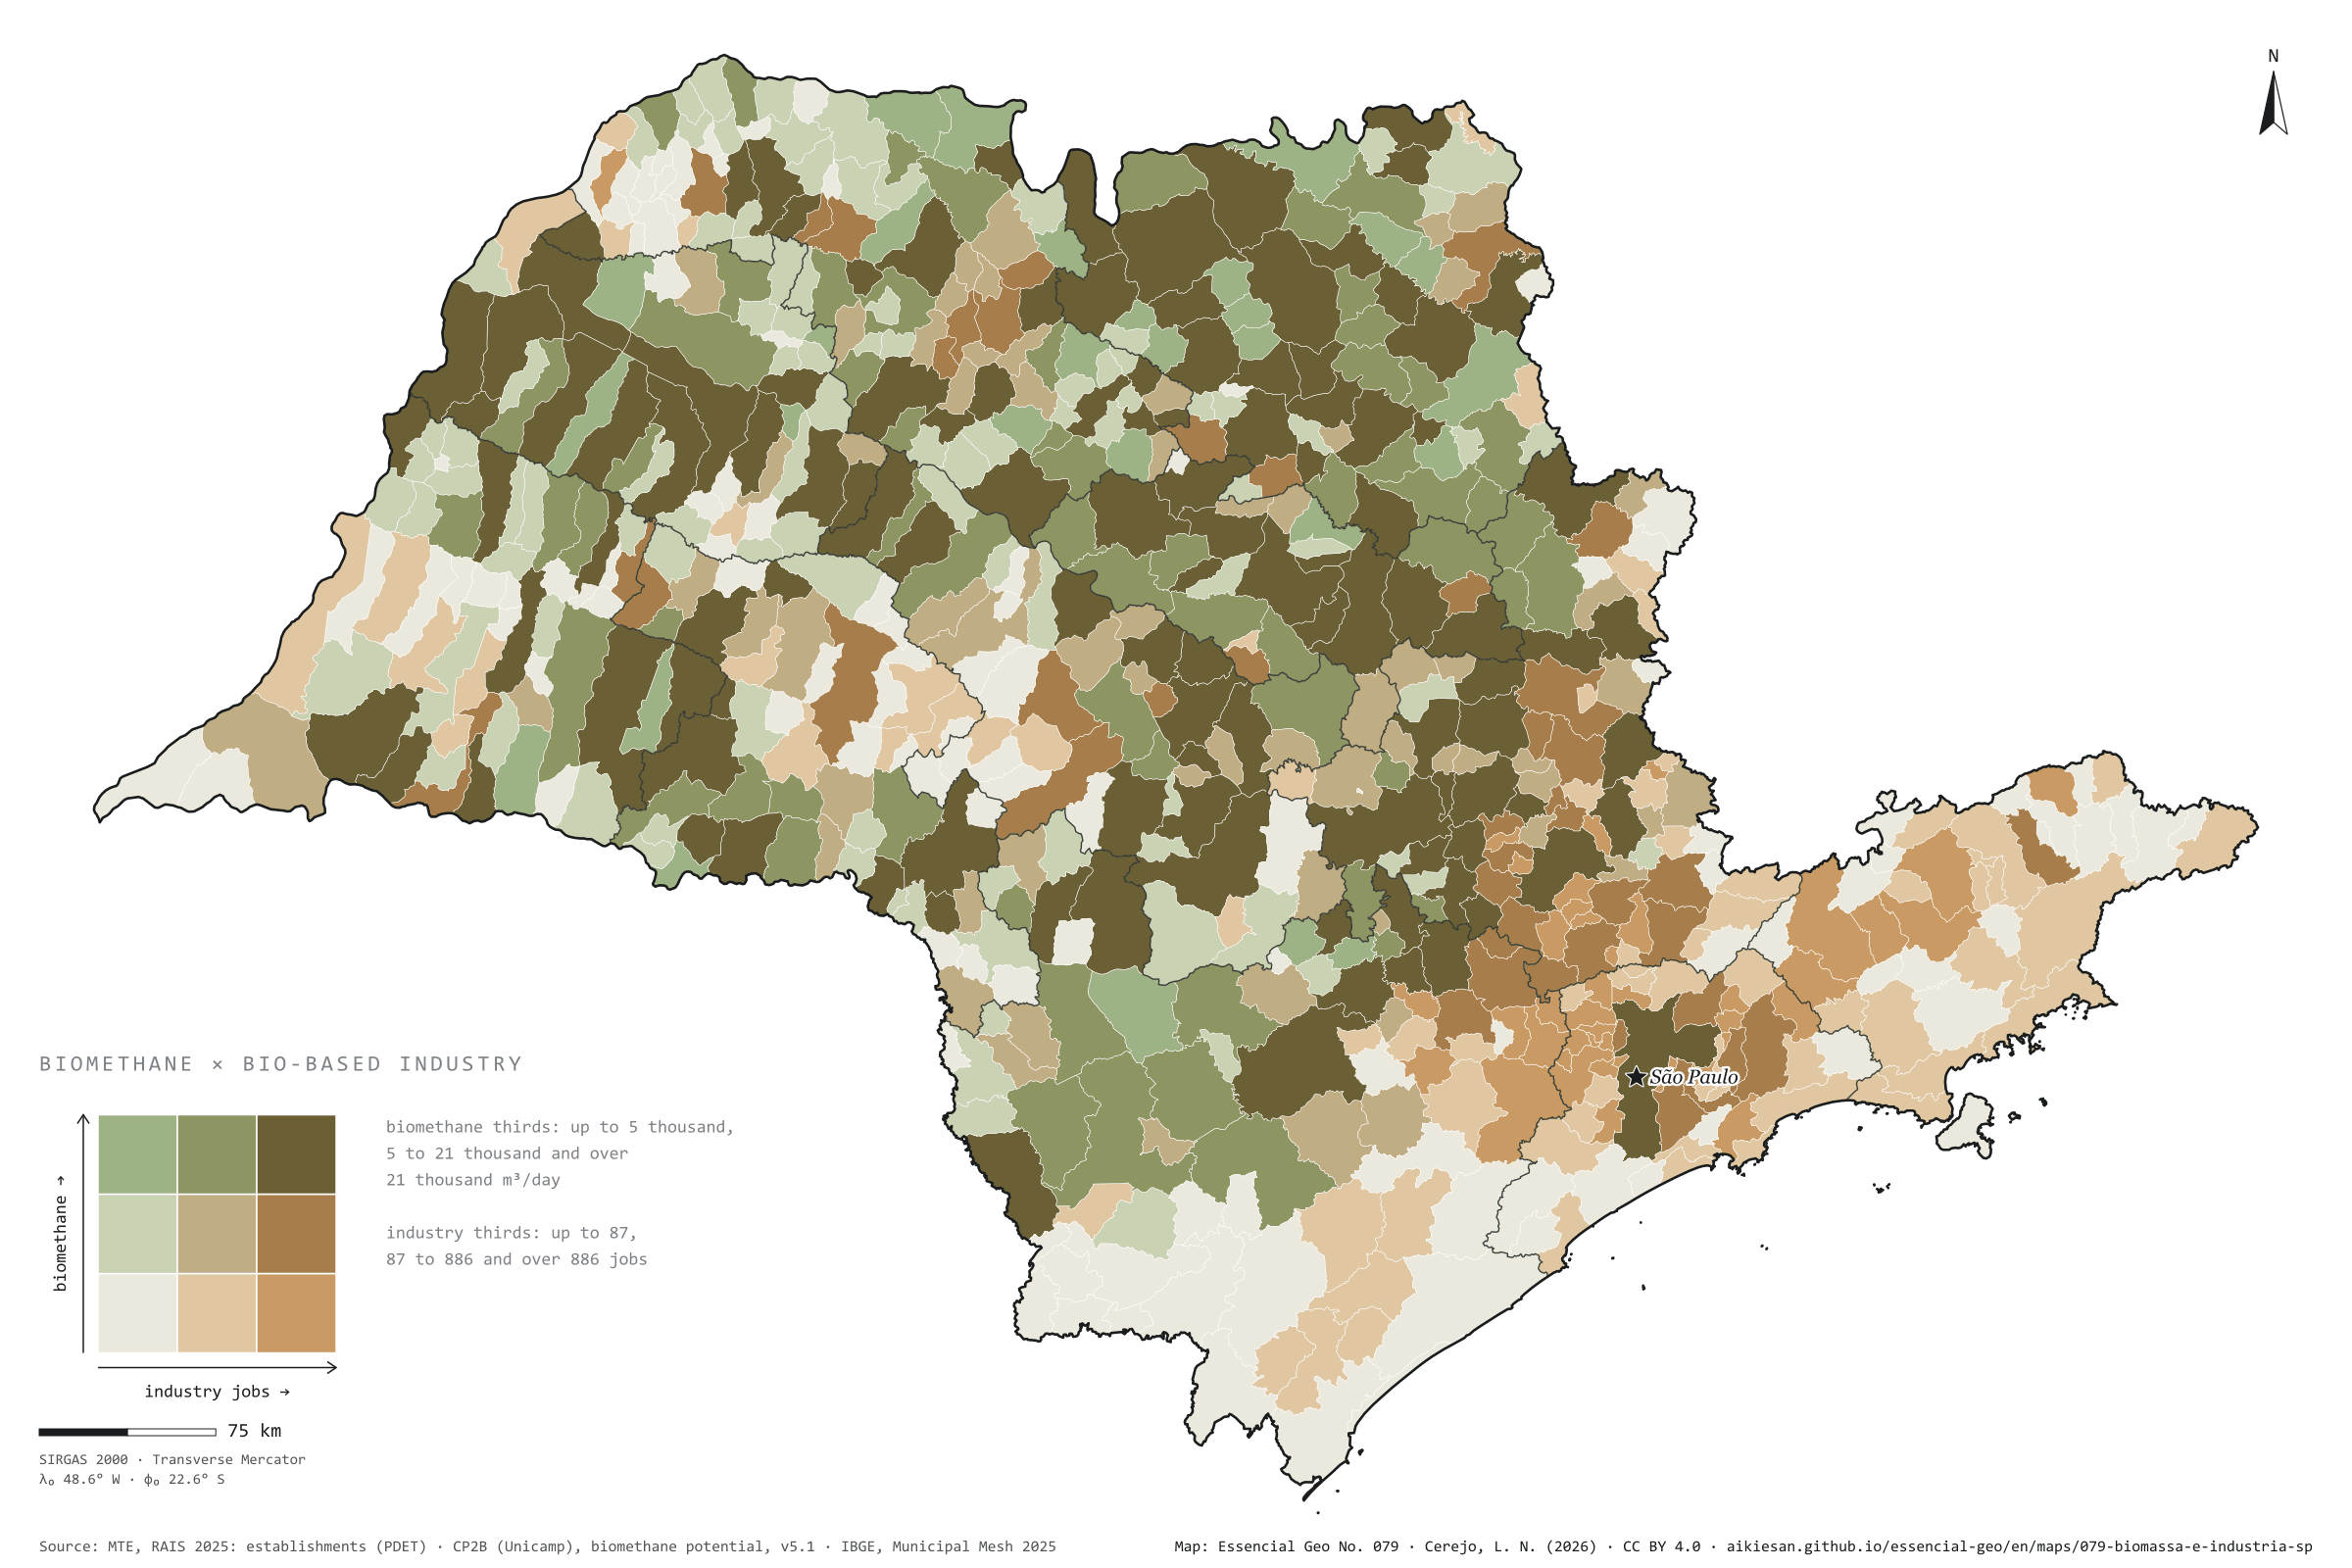
A bioeconomy hub needs two things in the same place: biomass and someone who knows how to convert it. This plate crosses the biomethane potential of residues (CP2B, accessible level, reference scenario) with formal jobs in bio-based industry (food, drink, wood, paper, fibres and biofuels), each split into thirds of the municipalities. In 115 municipalities both are in the top third: these are the hubs, with 61% of the state’s biomethane and 55% of those jobs, nearly all in the cane-growing north and centre. In 28, biomass is plentiful and industry scarce: Brejo Alegre has 77,000 m³ of biomethane a day and 4 industrial jobs. In 43, industry is strong and biomass is scarce, mostly in the metropolis: Barueri has 4,554 jobs and little residue of its own. Fourth plate of the collection “The bioeconomy at work”.

Technical record · downloads · citation

At a glance

Municipalities in the top third for both biomethane and industry

115 municipalities

61% of the biomethane and 55% of the industry jobs

Municipalities with plenty of biomass and little industry

28 municipalities

Municipalities with strong industry and little biomass

43 municipalities

Layers

  • municipios polygon 645 municipalities: CP2B biomethane potential and bio-based industry jobs by segment (same GPKG as plate 076)
  • regioes_intermediarias polygon 11 intermediate geographic regions
  • limite_estadual polygon State boundary

Metadata

Sources
CP2B (Unicamp) — biogas and biomethane potential by municipality, method v5.1 (2026)
MTE/PDET — RAIS 2025: establishments (RAIS ESTAB PUB), active jobs on 31/12 by CNAE 2.0 subclass and municipality (2025)
IBGE — Municipal Mesh 2025 (2025)
Extent
São Paulo State (SP)
CRS / Projection
SIRGAS 2000 (EPSG:4674)
EPSG:4674
Software
Node.js · d3-geo · QGIS
Method
Biomethane potential by municipality (CP2B v5.1, level N4, reference scenario) and active jobs on 31/12/2025 in bio-based industry (RAIS 2025), each split into thirds of the municipalities with a value; the cross gives nine classes.
Version
v1.0.0
Licence
CC BY 4.0
DOI
being registered on Zenodo

Downloads

Figure to reuse

The map without a frame, with legend, scale, reference system and credit written on it: ready for papers, lectures and slides. In two versions: with the basemap (neighbours and sea) or only the mapped area, on white.

Point a camera at it to open this page.

How to cite

Cerejo, L. N. (2026). Onde a biomassa encontra a fábrica: os polos que já têm resíduo e indústria, e os que só têm um dos dois [Where biomass meets the factory: The hubs that already have both residue and industry, and those with only one] (Version 1.0.0) [Data set]. Essencial. https://aikiesan.github.io/essencial-geo/en/maps/079-biomassa-e-industria-sp/

How to read this plate area, projection, scale, legend and source · 3 terms
1 Area
São Paulo State (SP) The area the plate covers. Outside it, neighbours and sea are drawn in grey, just for orientation.
2 Coordinates and projection
SIRGAS 2000 (EPSG:4674) The layers are in SIRGAS 2000; the drawing’s projection is written in the colophon at the foot of the panel.
3 Scale
Graphic scale bar in the panel The scale bar is true on the central meridian; away from it, measured distances vary a little.
4 Legend and layers
3 layers in the GeoPackage · polygon Read the legend before the map: it tells you whether a colour is a rate or a class, and whether a circle is a total.
5 Sources
CP2B (Unicamp) (2026); MTE/PDET (2025); IBGE (2025) Every figure comes from a public source, with its year. The data sheet gives each one’s address.

Terms on this plate

Biomethane
Biogas upgraded, with most of the CO₂ removed, to ANP’s specification, at which point it replaces natural gas in the pipeline, in industry and in the lorry’s tank.
N1 to N4 (potential levels)
CP2B’s four levels: N1 theoretical (all residue generated), N2 technical (after collection), N3 mobilisable (after competing uses and what already becomes biogas) and N4 accessible (after storage and the logistic factor).
RAIS
The Labour Ministry’s Annual Social Information Report: the formal jobs each establishment declares, with municipality and economic activity (CNAE).

Download

Layers, table and figures, under CC BY 4.0. Cite with the DOI.

Full record and citation

Method notes · No. 079

Biomass and bio-based industry across São Paulo’s municipalities

Português · English

Plate No. 079, the fourth of five in the collection The bioeconomy at work. Who treats urban waste is on plate 080.

In Europe, studies of bioeconomy regions (the JRC’s BioRegEU and the S2Biom supply maps) cross the available biomass with the industry able to use it, to find the hubs and the regions where one of the two is missing. This plate makes that cross with the CP2B potential and RAIS.

What the files contain

Layer (GPKG)GeometryContent
municipiospolygon645 municipalities: biometano, biometano_cana, biometano_pecuaria, biometano_urbano (m³/day) and the segments alimentos, madeira, fibras, biocombustiveis
regioes_intermediarias, limite_estadualpolygonreference

It is the GPKG of plate 076. The bivariate class comes from the fields above; the CSV has the municipal table, without geometry.

Method

  1. Biomass: biomethane potential of CP2B’s 17 residues, method v5.1, level N4 (accessible), reference scenario, in m³ per day.
  2. Bio-based industry: active jobs on 31/12/2025 (RAIS 2025) in the food, wood, fibre and biofuel segments of plate 077, without farming.
  3. Thirds of the municipalities with a value, closed on the right: biomethane up to 5,300, 5,300 to 20,800 and over 20,800 m³/day; industry up to 87, 88 to 886 and over 886 jobs. The 27 municipalities with no potential and the 38 with no industry jobs go in the bottom third.
  4. Nine classes from the cross; the hubs’ share adds up the biomethane and jobs of the 115 municipalities in the top third of both.

Limitations

  • The cross is one of proximity on the map, not of supply chain: a mill may be in one municipality and the residue it uses in the next. Real hubs extend beyond municipal boundaries.
  • Industry is measured by formal employment, which does not say whether the factory uses, or could use, local biomass.
  • The thirds are relative to the state: the top third starts at 20,800 m³/day of biomethane, which is already a lot compared with other states.

View this map’s folder on GitHub

Technical record

Technical record · No. 079

Where biomass meets the factory

At a glance

Municipalities in the top third for both biomethane and industry

115 municipalities

61% of the biomethane and 55% of the industry jobs

Municipalities with plenty of biomass and little industry

28 municipalities

Municipalities with strong industry and little biomass

43 municipalities

Layers

  • municipios polygon 645 municipalities: CP2B biomethane potential and bio-based industry jobs by segment (same GPKG as plate 076)
  • regioes_intermediarias polygon 11 intermediate geographic regions
  • limite_estadual polygon State boundary

Metadata

Sources
CP2B (Unicamp) — biogas and biomethane potential by municipality, method v5.1 (2026)
MTE/PDET — RAIS 2025: establishments (RAIS ESTAB PUB), active jobs on 31/12 by CNAE 2.0 subclass and municipality (2025)
IBGE — Municipal Mesh 2025 (2025)
Extent
São Paulo State (SP)
CRS / Projection
SIRGAS 2000 (EPSG:4674)
EPSG:4674
Software
Node.js · d3-geo · QGIS
Method
Biomethane potential by municipality (CP2B v5.1, level N4, reference scenario) and active jobs on 31/12/2025 in bio-based industry (RAIS 2025), each split into thirds of the municipalities with a value; the cross gives nine classes.
Version
v1.0.0
Licence
CC BY 4.0
DOI
being registered on Zenodo

Downloads

Figure to reuse

The map without a frame, with legend, scale, reference system and credit written on it: ready for papers, lectures and slides. In two versions: with the basemap (neighbours and sea) or only the mapped area, on white.

Point a camera at it to open this page.

How to cite

Cerejo, L. N. (2026). Onde a biomassa encontra a fábrica: os polos que já têm resíduo e indústria, e os que só têm um dos dois [Where biomass meets the factory: The hubs that already have both residue and industry, and those with only one] (Version 1.0.0) [Data set]. Essencial. https://aikiesan.github.io/essencial-geo/en/maps/079-biomassa-e-industria-sp/

100%