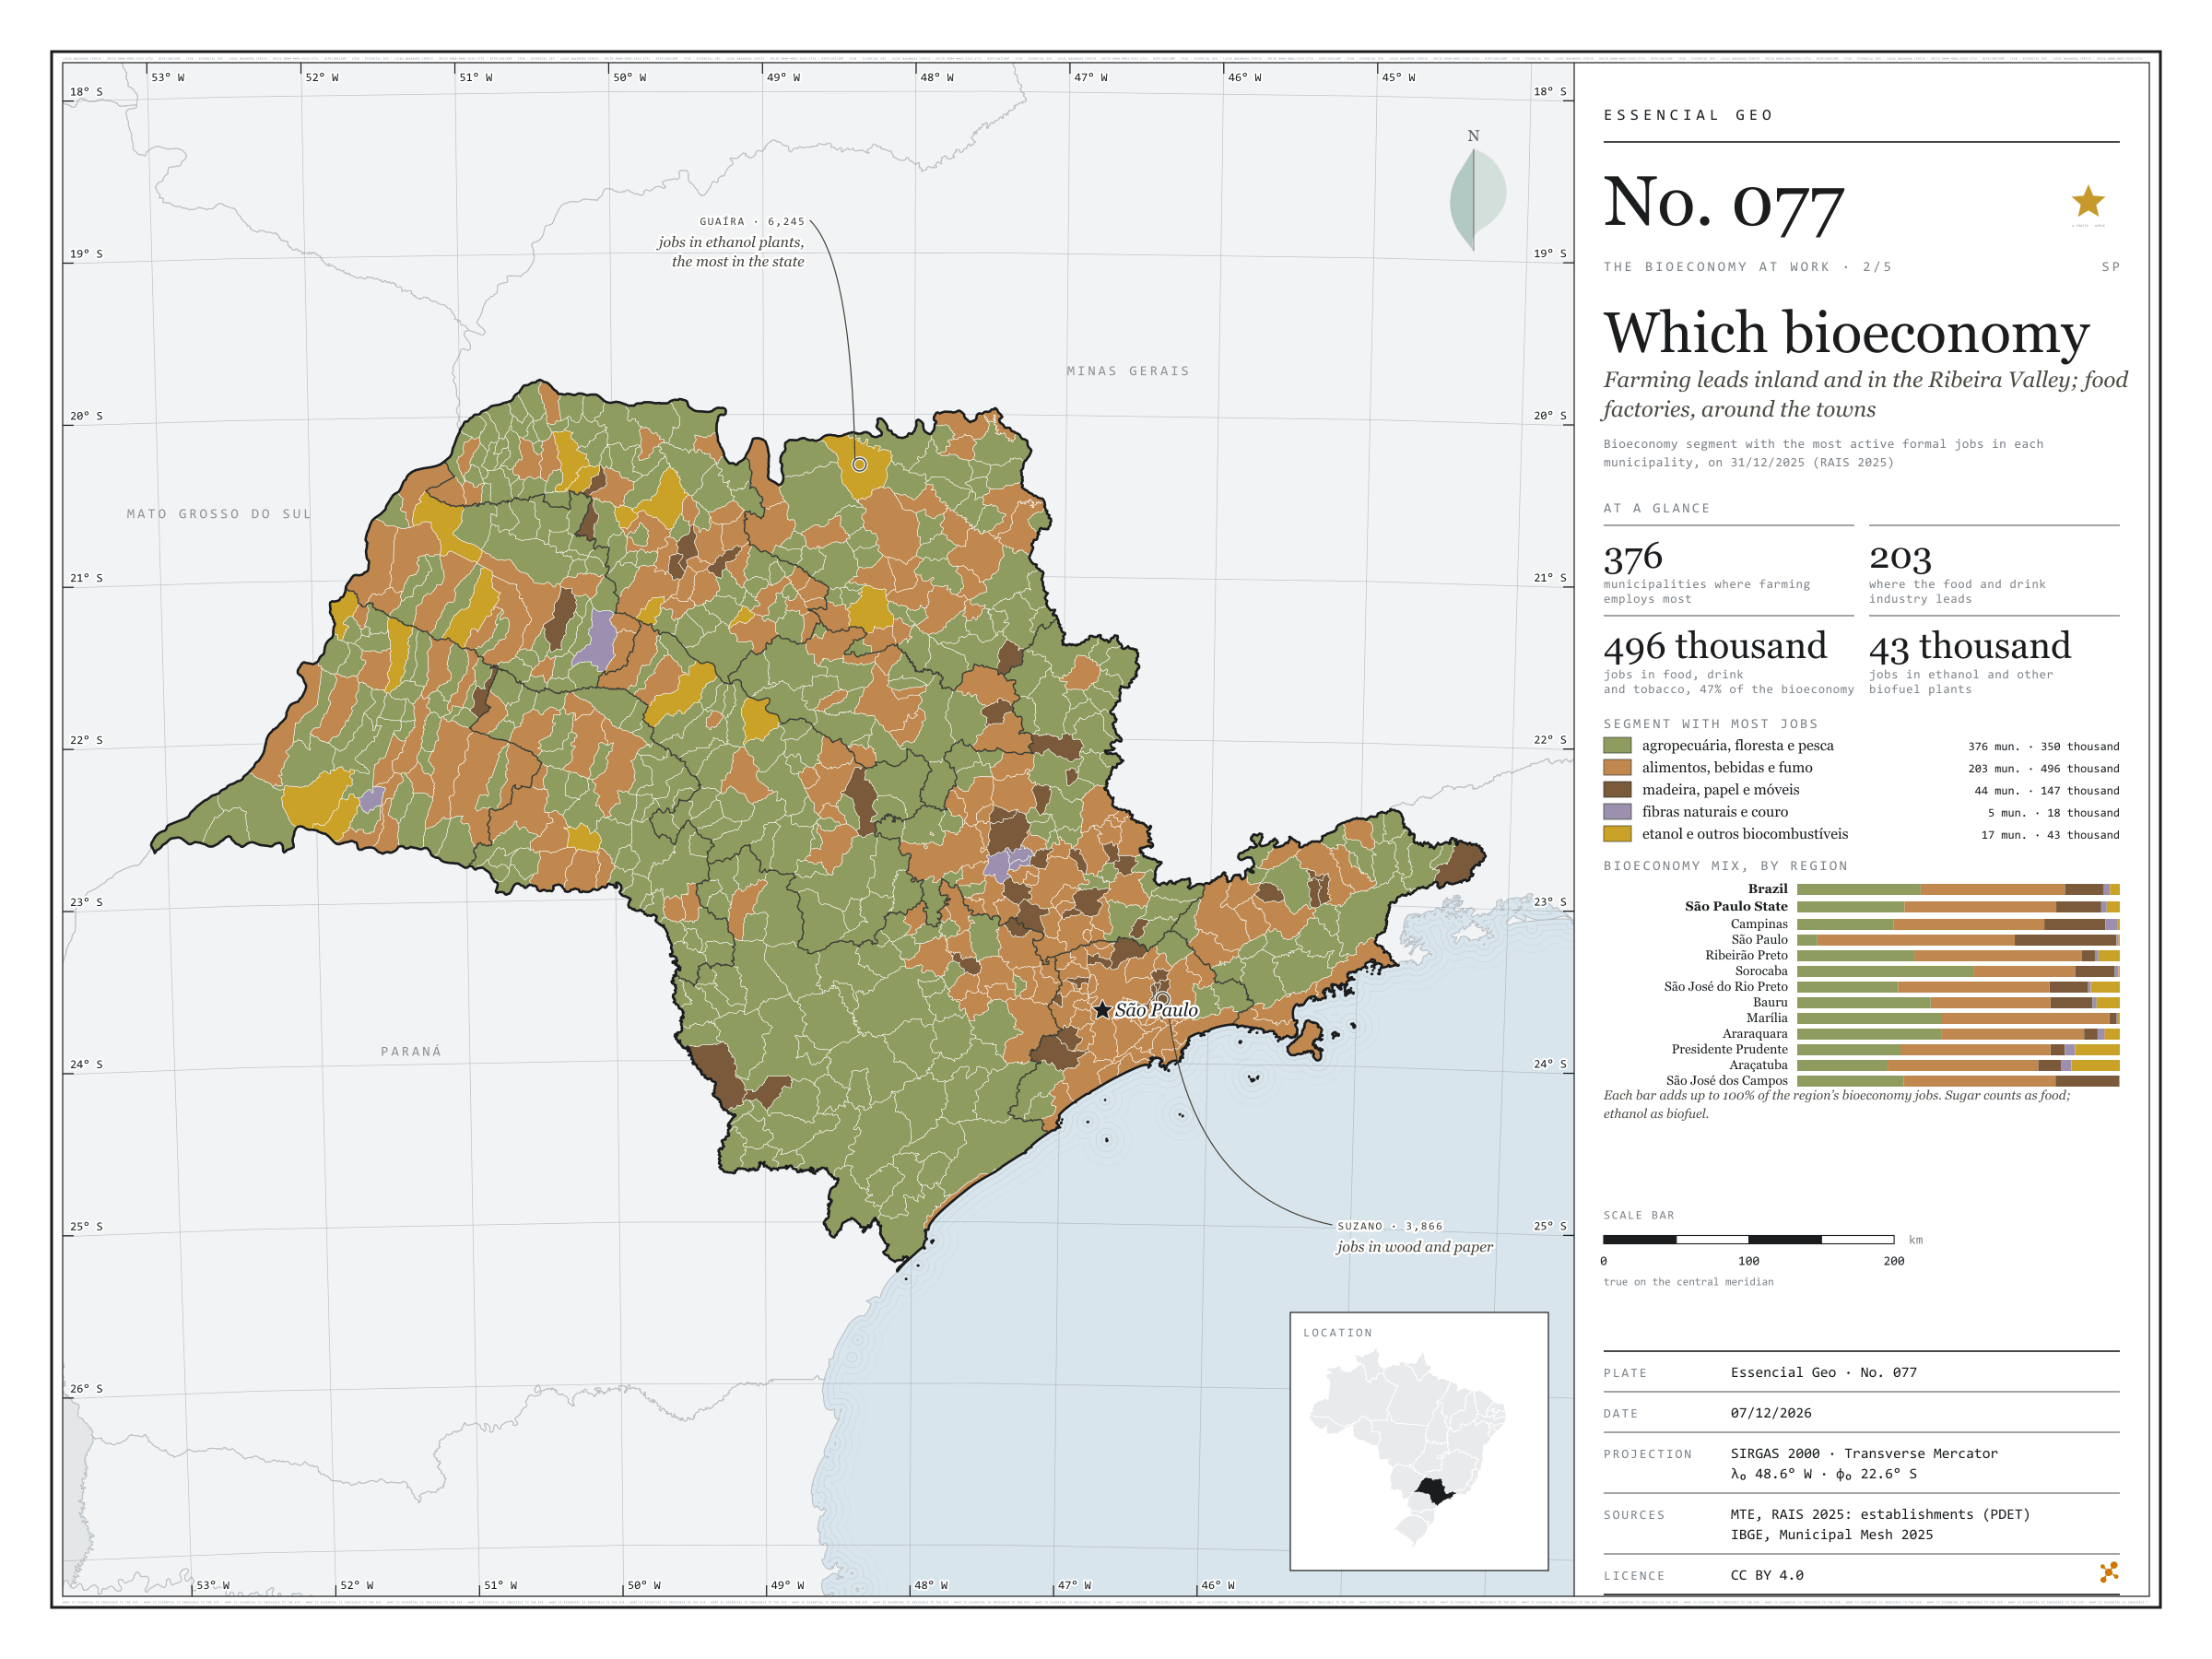
Farming leads inland and in the Ribeira Valley; food factories, around the towns
Fig. 077São Paulo State (SP)EPSG:4674Source: MTE/PDET, JRC (European Commission), IBGE
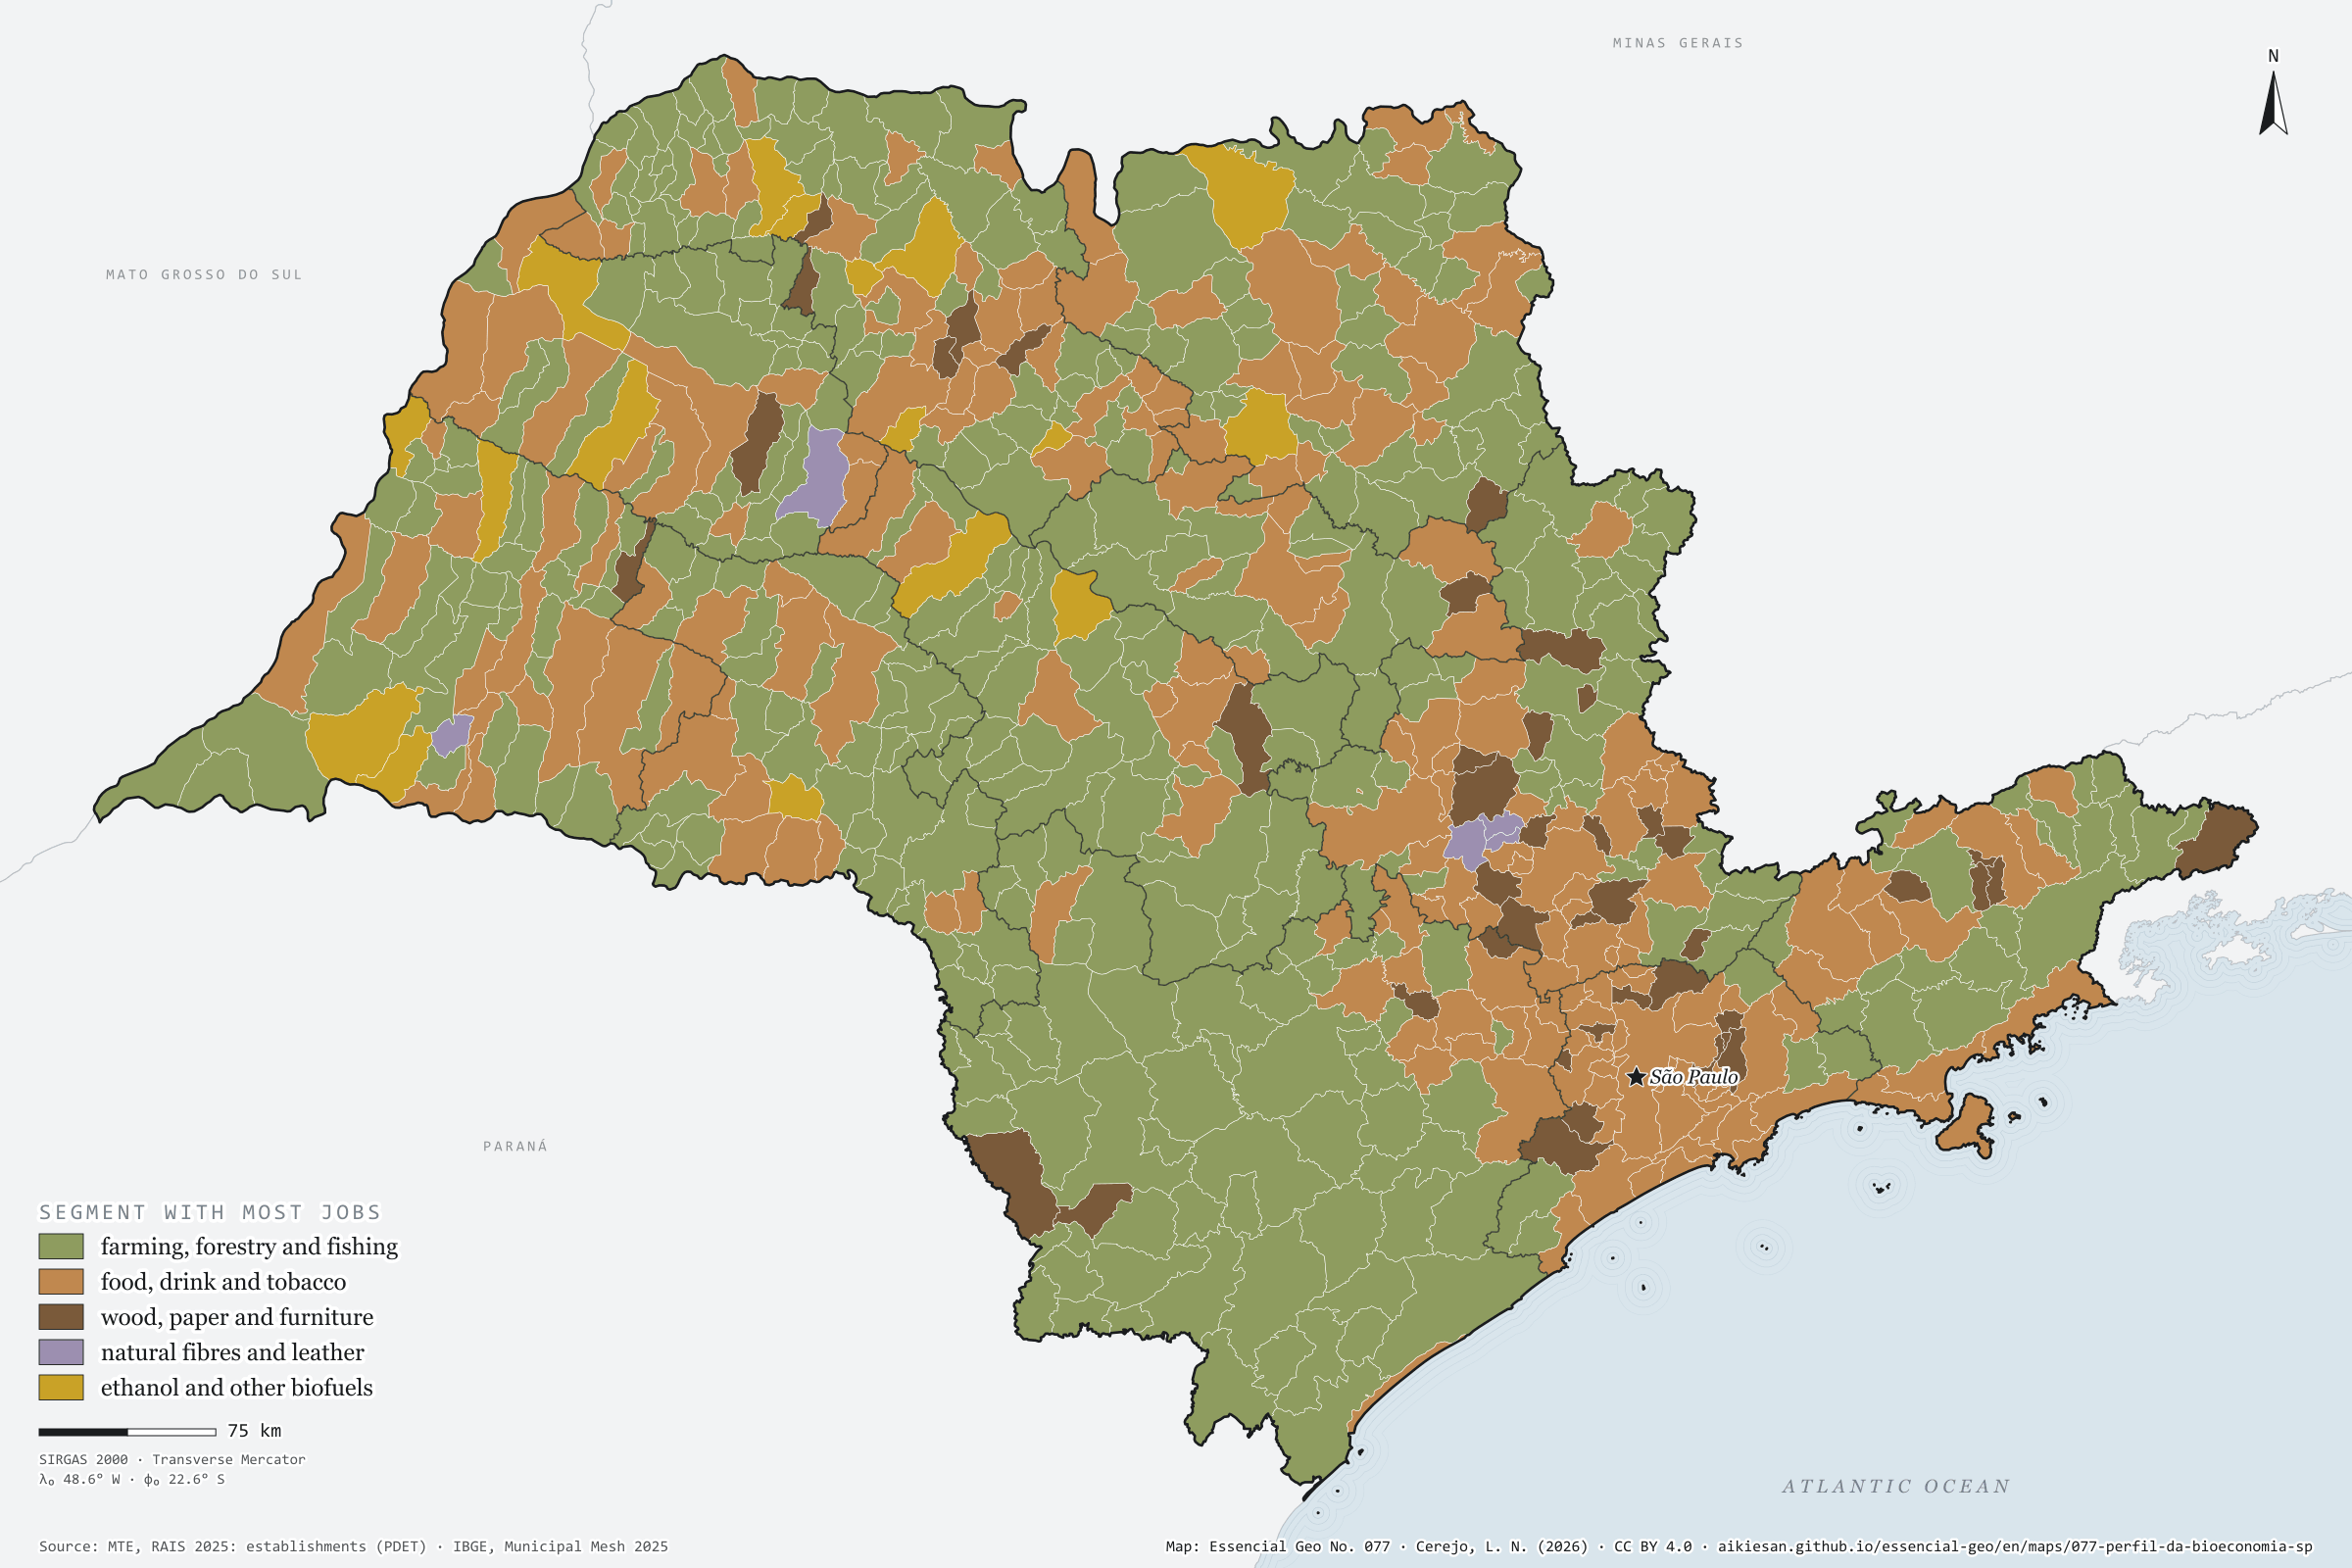
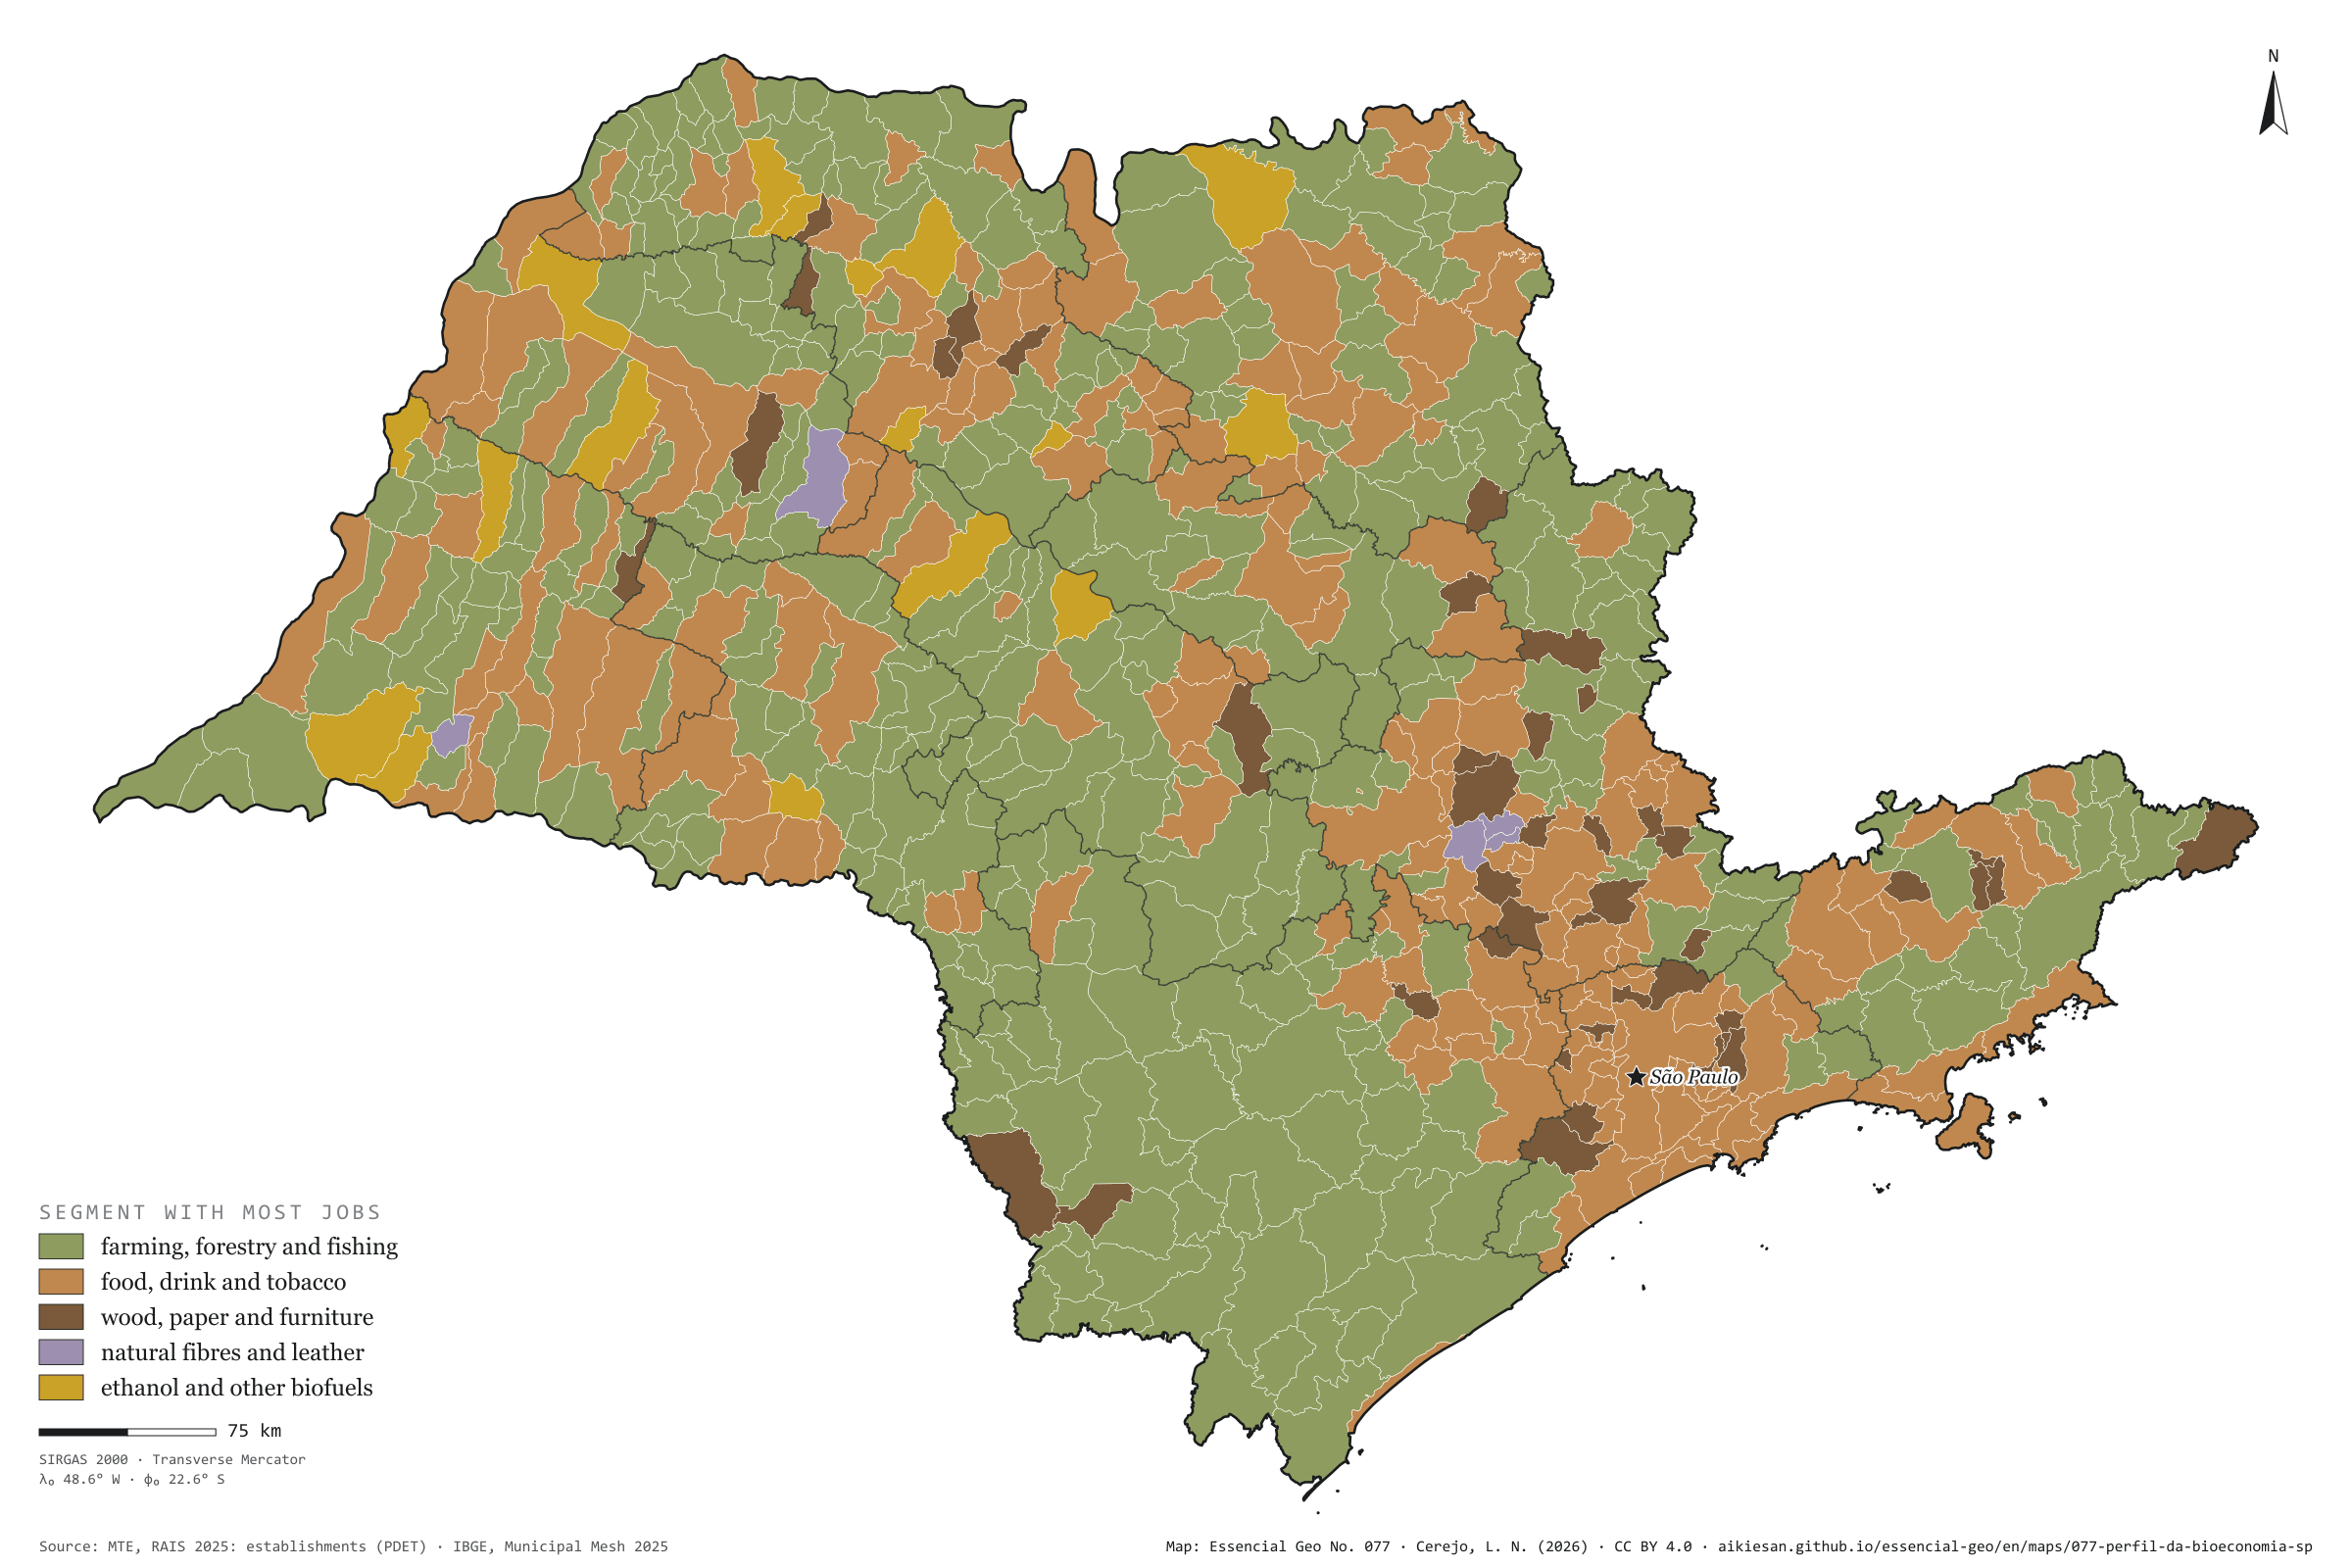
São Paulo’s bioeconomy is, above all, a food factory: food, drink and tobacco account for 496,000 of the 1.05 million formal jobs, 47%, against 45% in Brazil. Farming, fishing and forestry have 350,000, 33%, below the country’s 38%. Wood, paper and wooden furniture have 147,000; biofuels, 43,000; natural fibres and leather, 18,000. By municipality, farming leads in 376 of the 645, nearly all small, in the west and the Ribeira Valley. The food industry leads in 203, around the mid-sized towns and the metropolis. Wood and paper lead in 44, such as Suzano, with 3,866 jobs. Ethanol mills lead in 17, among them Guaíra, with 6,245 jobs in biofuels. Fibres and leather lead in 5. Second plate of the collection “The bioeconomy at work”.
Technical record · downloads · citation
At a glance
Bioeconomy jobs by segment (jobs)
Food, drink and tobacco47.1%
Farming, fishing and forestry33.2%
Wood and paper13.9%
Biofuels4%
Fibres and leather1.7%
Municipalities where farming is the segment with most jobs
376municipalities
of 645; food leads in 203
Layers
municipiospolygon645 municipalities: bioeconomy jobs by segment and dominant segment (same GPKG as plate 076)
regioes_intermediariaspolygon11 intermediate geographic regions
Bioeconomy active jobs on 31/12/2025, within the European JRC scope, split into five segments by CNAE subclass; each municipality takes the colour of the segment with most jobs.
The map without a frame, with legend, scale, reference system and credit written on it: ready for papers, lectures and slides. In two versions: with the basemap (neighbours and sea) or only the mapped area, on white.
CEREJO, Lucas Nakamura. Que bioeconomia: o campo lidera no interior e no Vale do Ribeira; a fábrica de alimentos, em volta das cidades. Versão 1.0.0. [S. l.]: Essencial, 2026. Conjunto de dados. Disponível em: https://aikiesan.github.io/essencial-geo/en/maps/077-perfil-da-bioeconomia-sp/. Acesso em: 10 nov. 2026.
Cerejo, L. N. (2026). Que bioeconomia: o campo lidera no interior e no Vale do Ribeira; a fábrica de alimentos, em volta das cidades [Which bioeconomy: Farming leads inland and in the Ribeira Valley; food factories, around the towns] (Version 1.0.0) [Data set]. Essencial. https://aikiesan.github.io/essencial-geo/en/maps/077-perfil-da-bioeconomia-sp/
@dataset{cerejo2026_perfil_da_bioeconomia_sp,
  author    = {Cerejo, Lucas Nakamura},
  title     = {Que bioeconomia: O campo lidera no interior e no Vale do Ribeira; a fábrica de alimentos, em volta das cidades},
  year      = {2026},
  publisher = {Essencial},
  version   = {1.0.0},
  url       = {https://aikiesan.github.io/essencial-geo/en/maps/077-perfil-da-bioeconomia-sp/},
  language  = {portuguese},
  note      = {English title: Which bioeconomy: Farming leads inland and in the Ribeira Valley; food factories, around the towns. Licence CC BY 4.0}
}
Fig. 076São Paulo State (SP)EPSG:4674Source: MTE/PDET, JRC (European Commission), IBGE
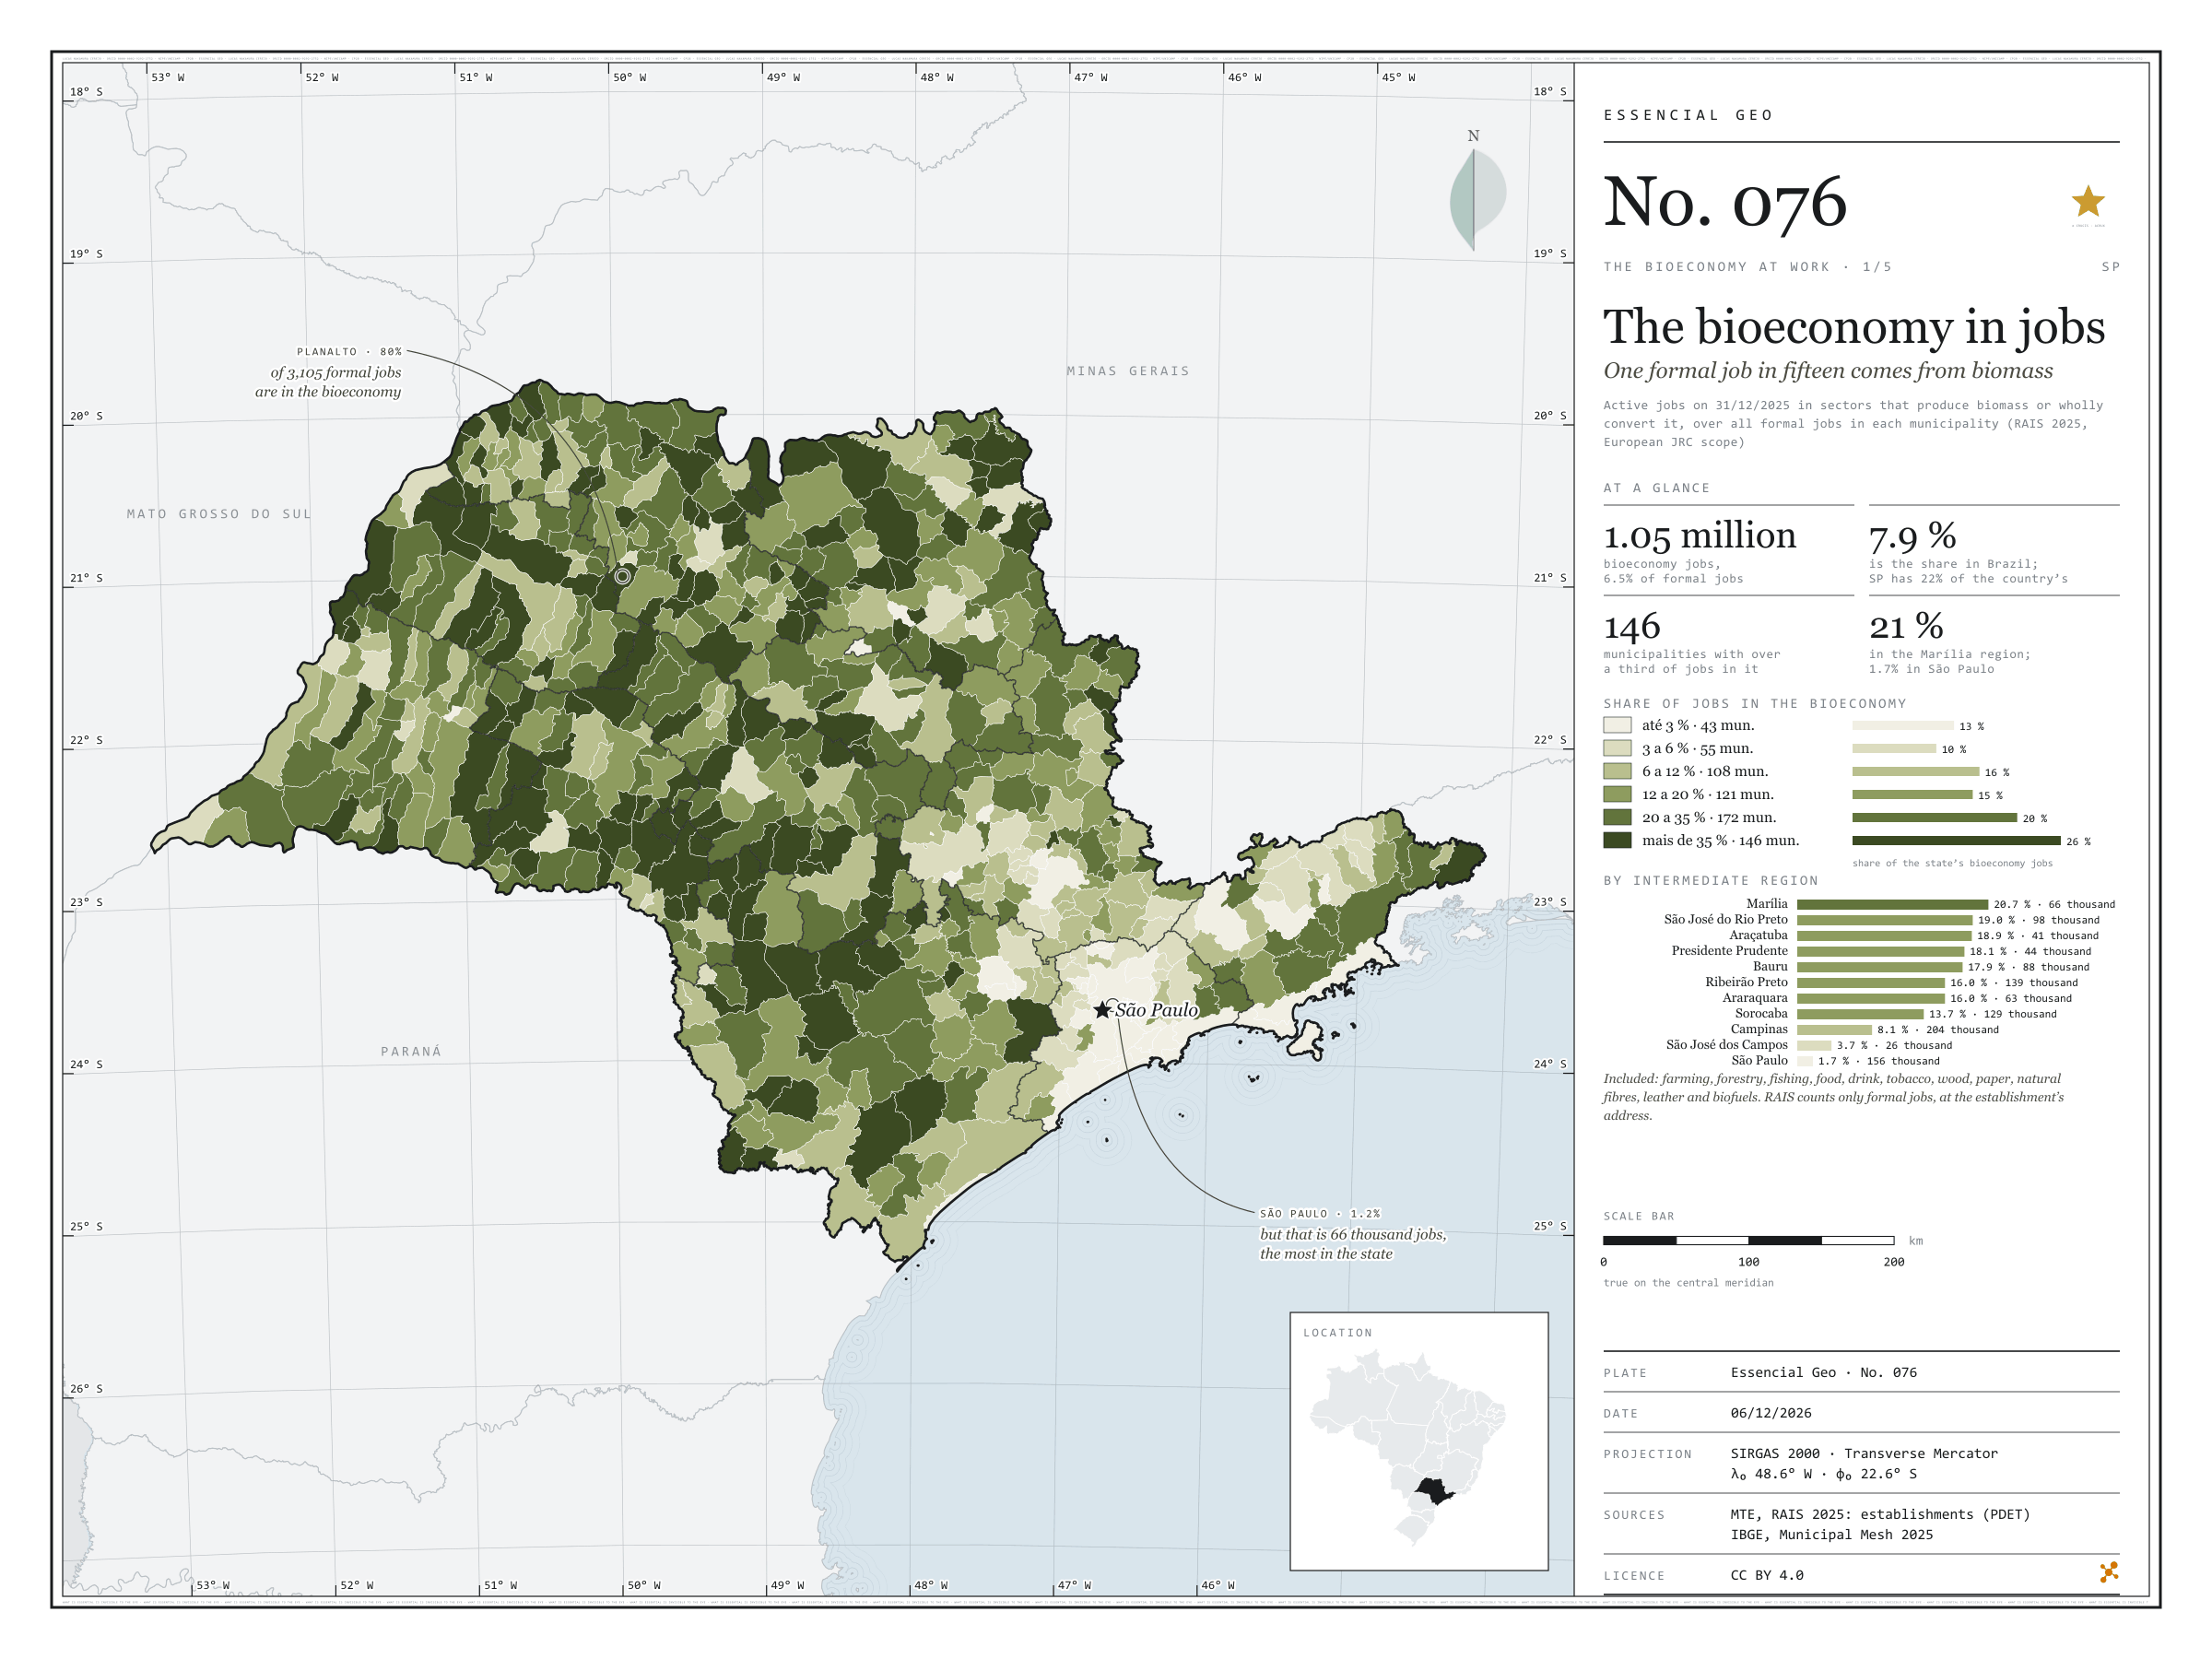
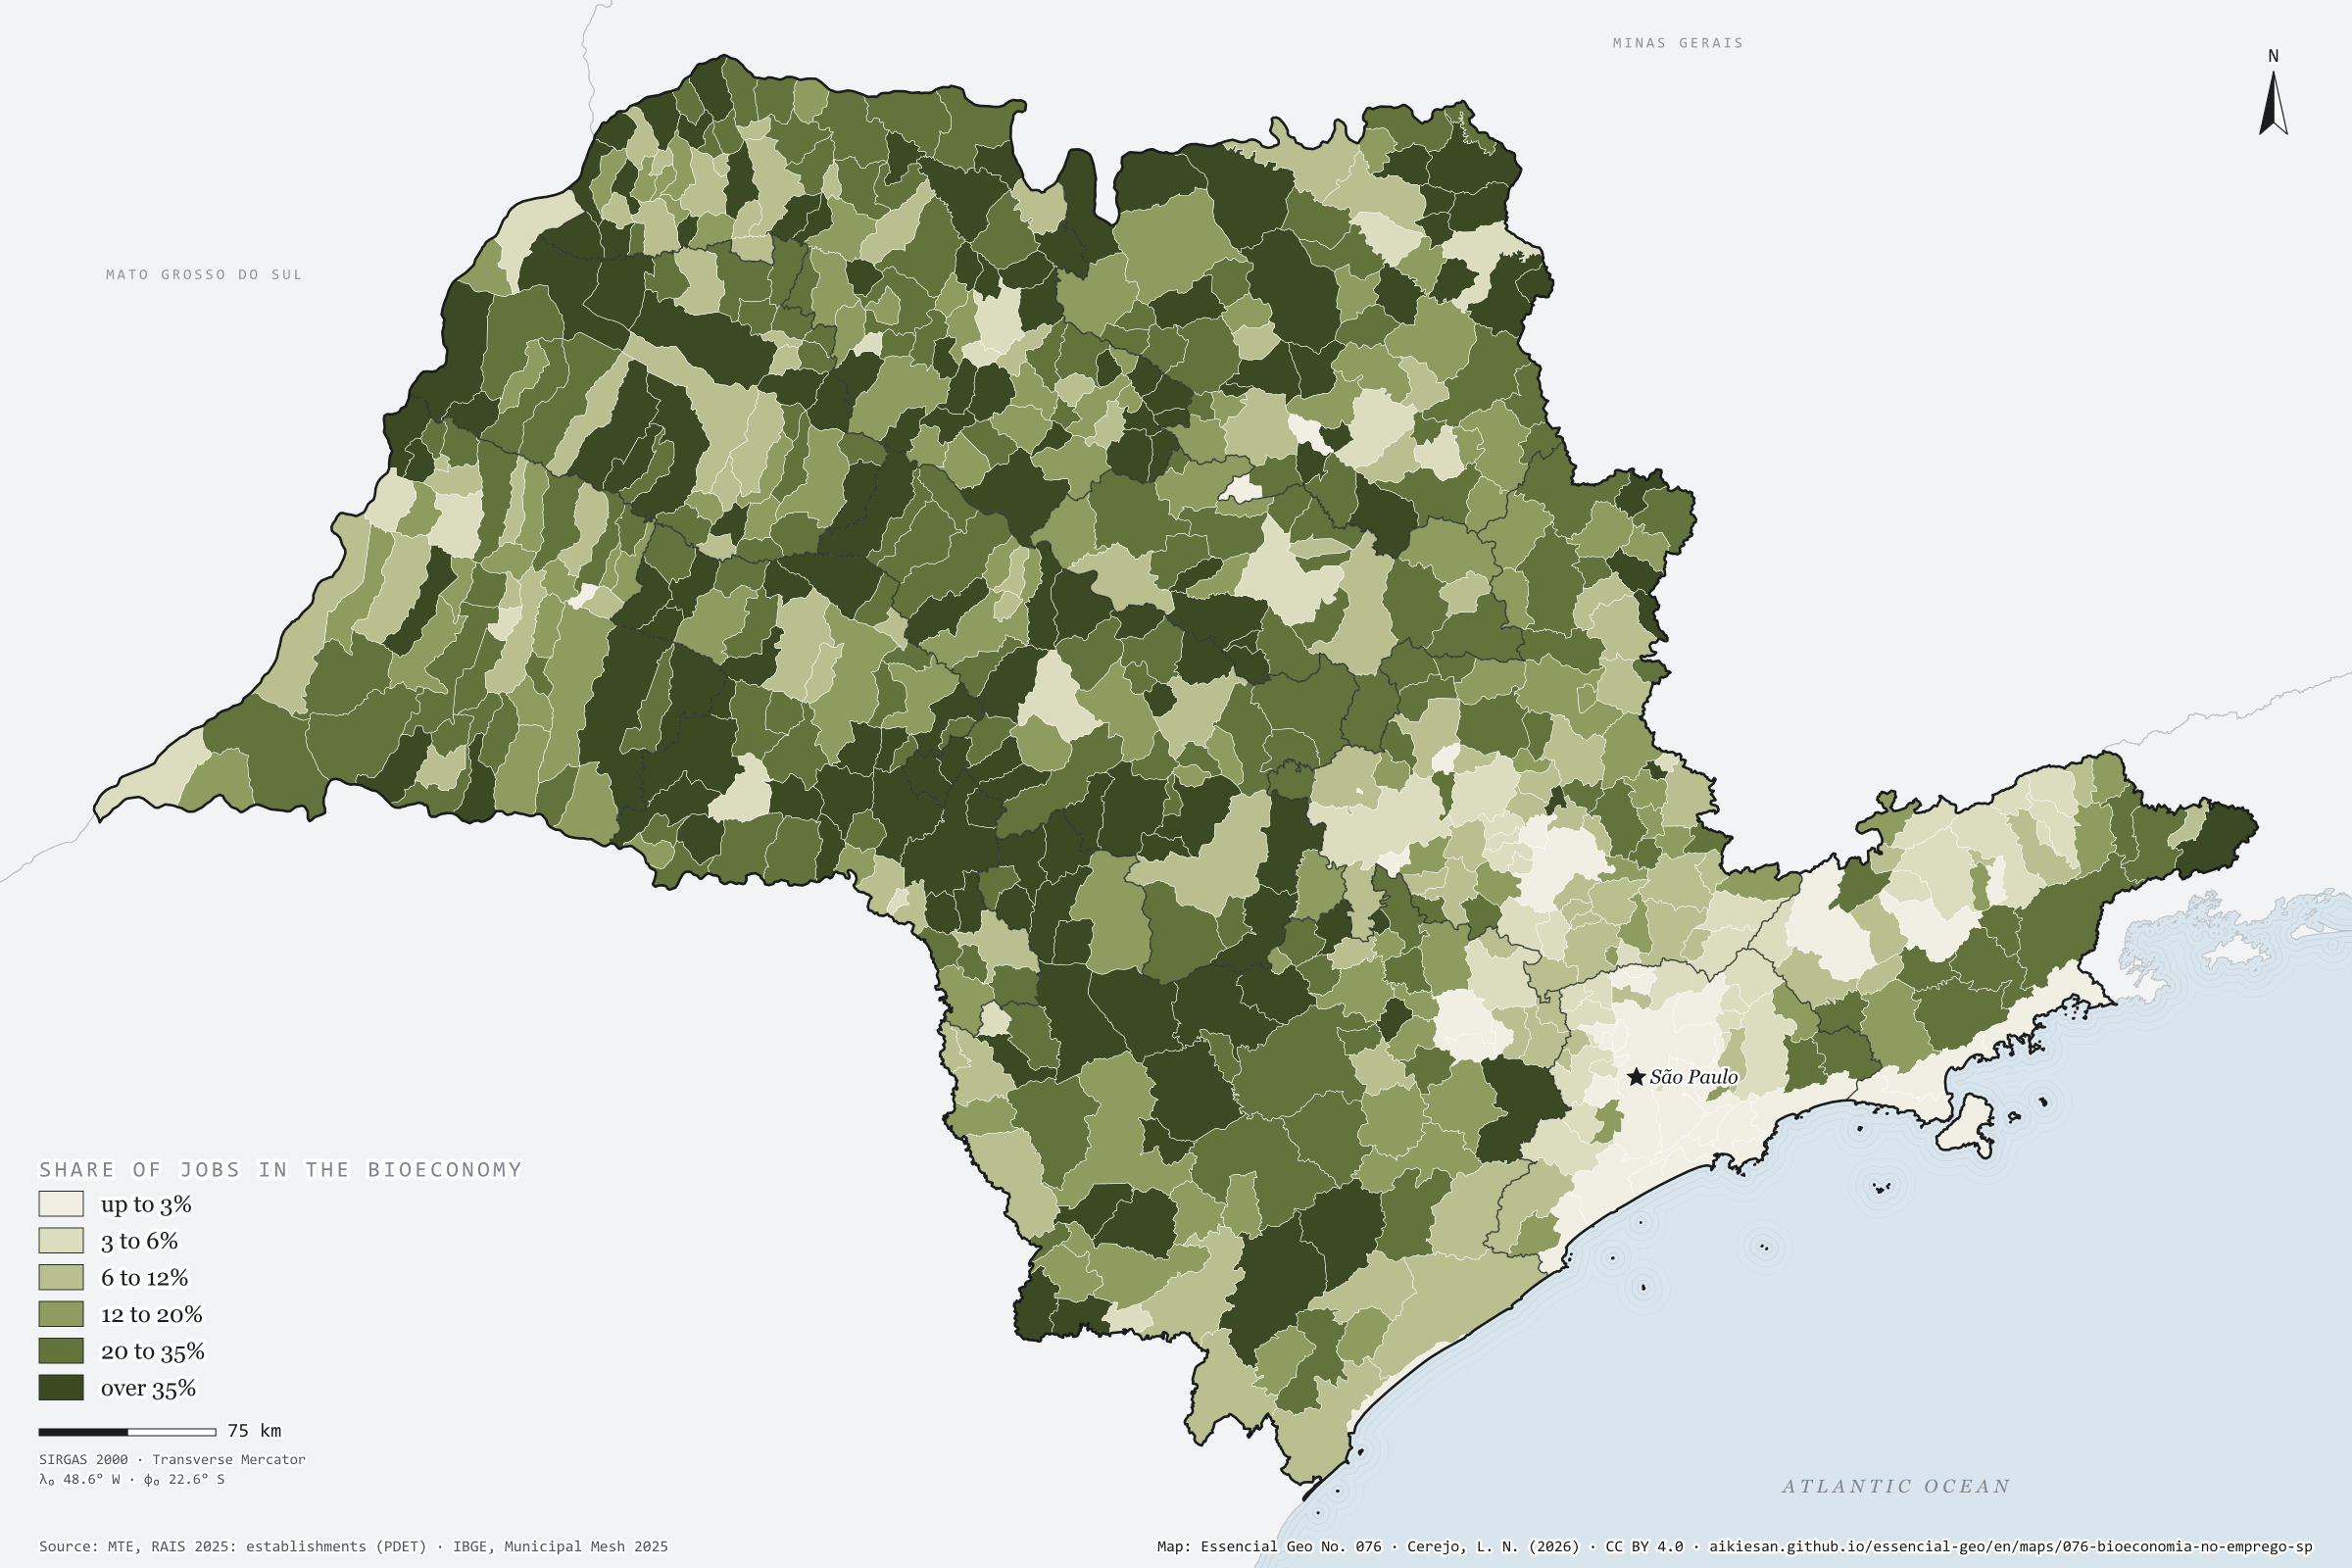
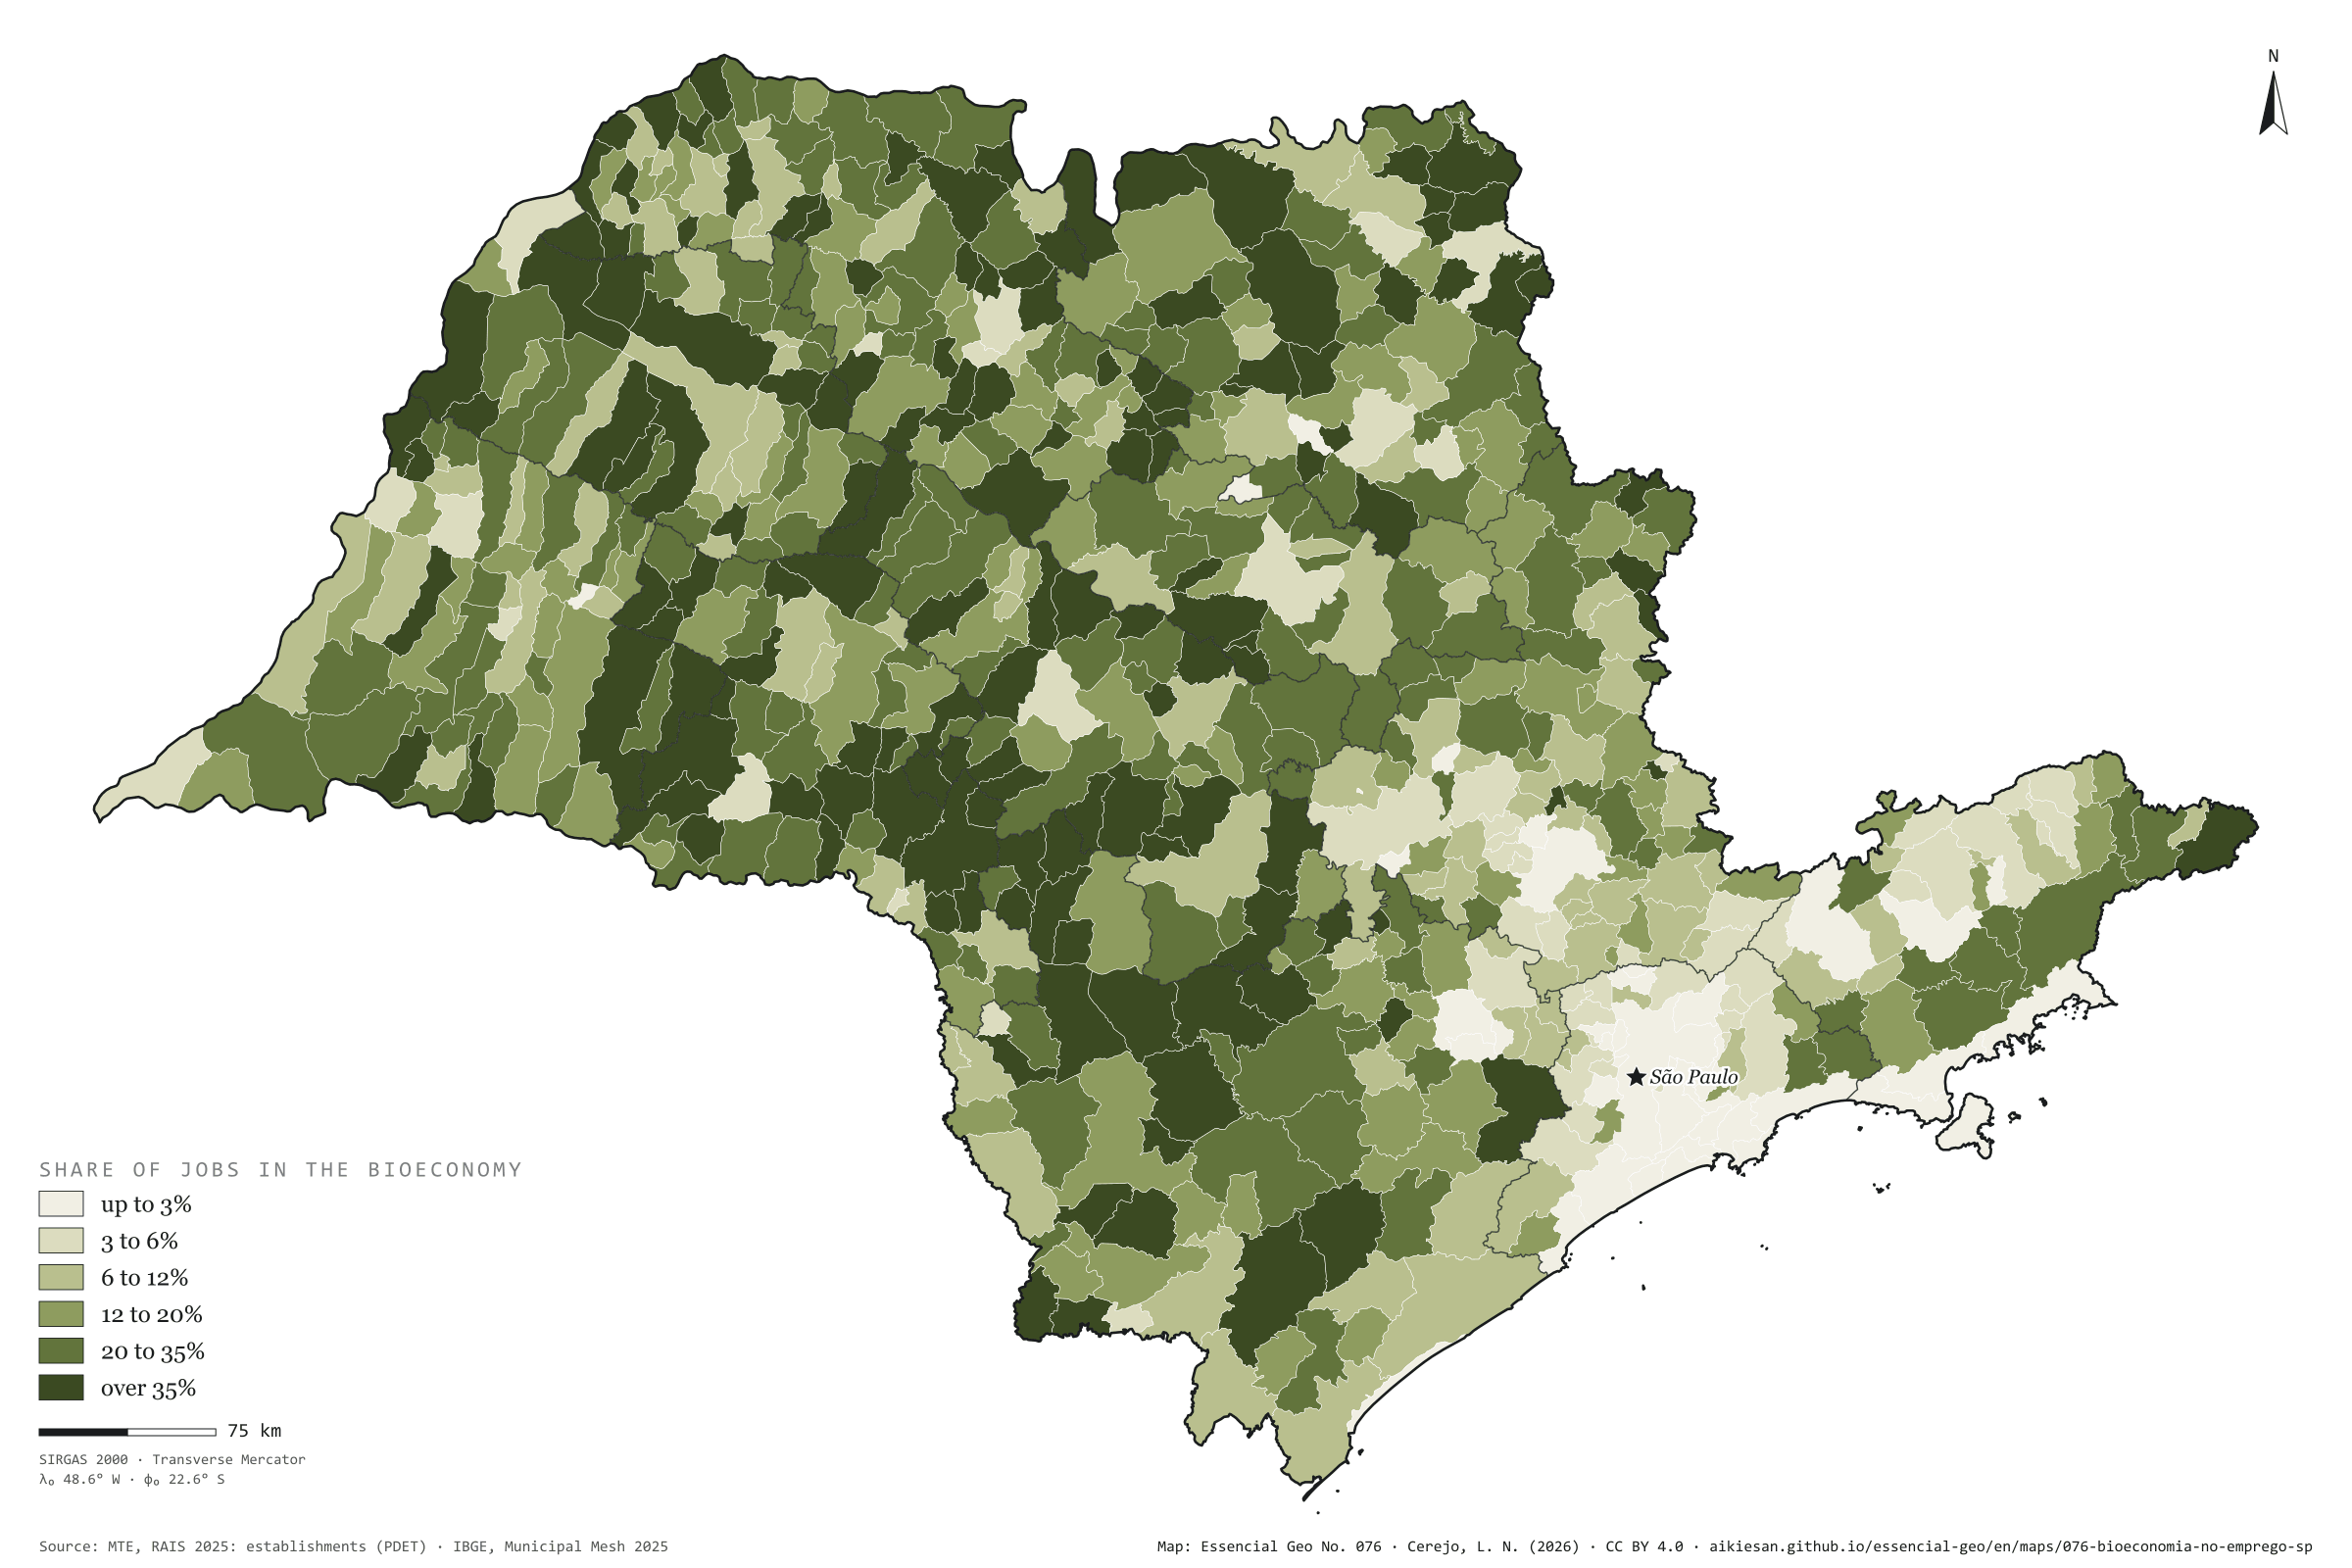
On 31 December 2025, 1.05 million formal jobs in São Paulo were in the bioeconomy: in farming, fishing and forestry, and in the industries that wholly convert biomass, such as food, drink, wood, paper, natural fibres, leather and biofuels. This is the scope the European Commission’s Joint Research Centre (JRC) uses to measure the European Union’s bioeconomy. They are 6.5% of the state’s 16.16 million jobs, below Brazil’s 7.9%, yet SP holds 22% of the country’s formal bioeconomy. The share grows westwards: 20.7% in the Marília region, 1.7% in the São Paulo region. In 146 municipalities over 35% of formal jobs come from biomass; in Planalto, 80%. The capital has the largest number, 66,000 jobs, but only 1.2% of its own. First plate of the collection “The bioeconomy at work”.
Technical record · downloads · citation
At a glance
Bioeconomy jobs by the bioeconomy’s share of the municipality’s jobs (jobs)
up to 3%12.6%
3 to 6%10.4%
6 to 12%15.8%
12 to 20%14.9%
20 to 35%20.5%
over 35%25.9%
Formal jobs in the bioeconomy
6.5%
1.05 million jobs; Brazil, 7.9%
SP’s share of Brazil’s formal bioeconomy
22%
of 4.74 million jobs
Layers
municipiospolygon645 municipalities: jobs, bioeconomy jobs by segment, share and location quotient, organic-waste-generating industries, waste and sewage, CP2B biomethane potential and population
regioes_intermediariaspolygon11 intermediate geographic regions
Active jobs on 31/12/2025 in the bioeconomy’s CNAE subclasses (farming, fishing and forestry; food, drink and tobacco; wood, paper and wooden furniture; natural fibres and leather; biofuels), within the European JRC scope, over all active jobs in each municipality, in six classes.
The map without a frame, with legend, scale, reference system and credit written on it: ready for papers, lectures and slides. In two versions: with the basemap (neighbours and sea) or only the mapped area, on white.
CEREJO, Lucas Nakamura. A bioeconomia no emprego: um em cada quinze empregos formais vem da biomassa. Versão 1.0.0. [S. l.]: Essencial, 2026. Conjunto de dados. Disponível em: https://aikiesan.github.io/essencial-geo/en/maps/076-bioeconomia-no-emprego-sp/. Acesso em: 10 nov. 2026.
Cerejo, L. N. (2026). A bioeconomia no emprego: um em cada quinze empregos formais vem da biomassa [The bioeconomy in jobs: One formal job in fifteen comes from biomass] (Version 1.0.0) [Data set]. Essencial. https://aikiesan.github.io/essencial-geo/en/maps/076-bioeconomia-no-emprego-sp/
@dataset{cerejo2026_bioeconomia_no_emprego_sp,
  author    = {Cerejo, Lucas Nakamura},
  title     = {A bioeconomia no emprego: Um em cada quinze empregos formais vem da biomassa},
  year      = {2026},
  publisher = {Essencial},
  version   = {1.0.0},
  url       = {https://aikiesan.github.io/essencial-geo/en/maps/076-bioeconomia-no-emprego-sp/},
  language  = {portuguese},
  note      = {English title: The bioeconomy in jobs: One formal job in fifteen comes from biomass. Licence CC BY 4.0}
}
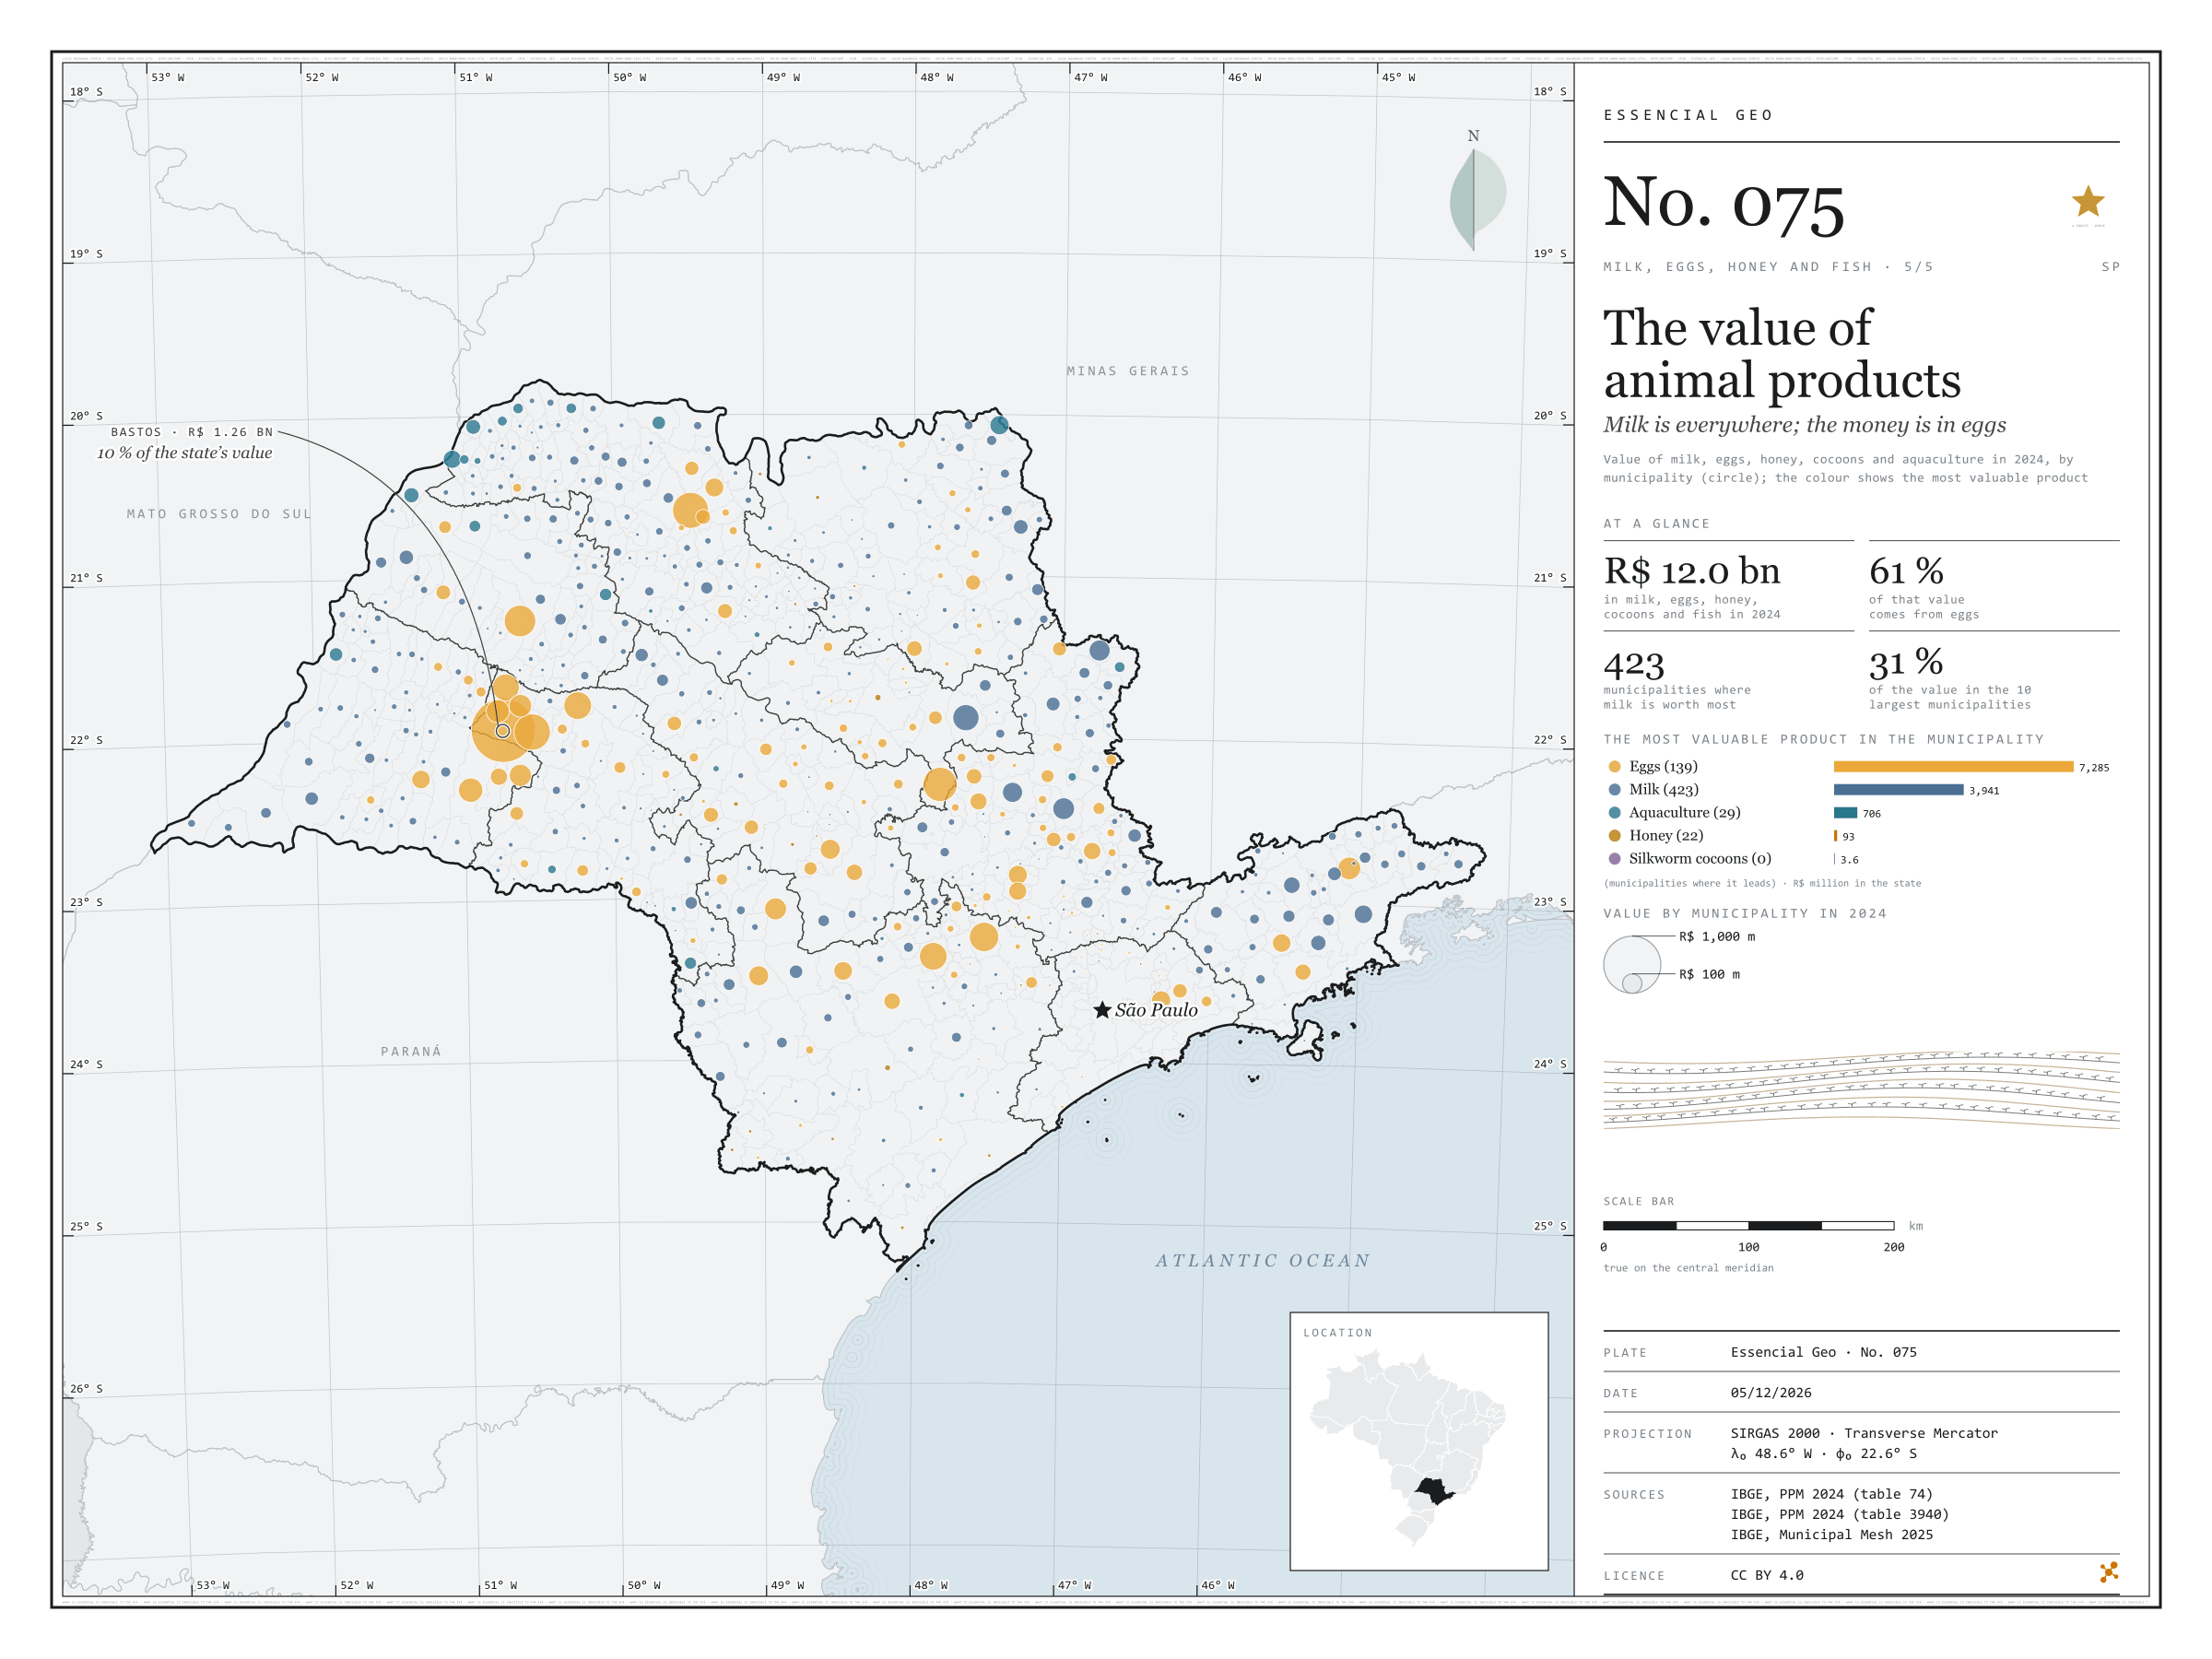
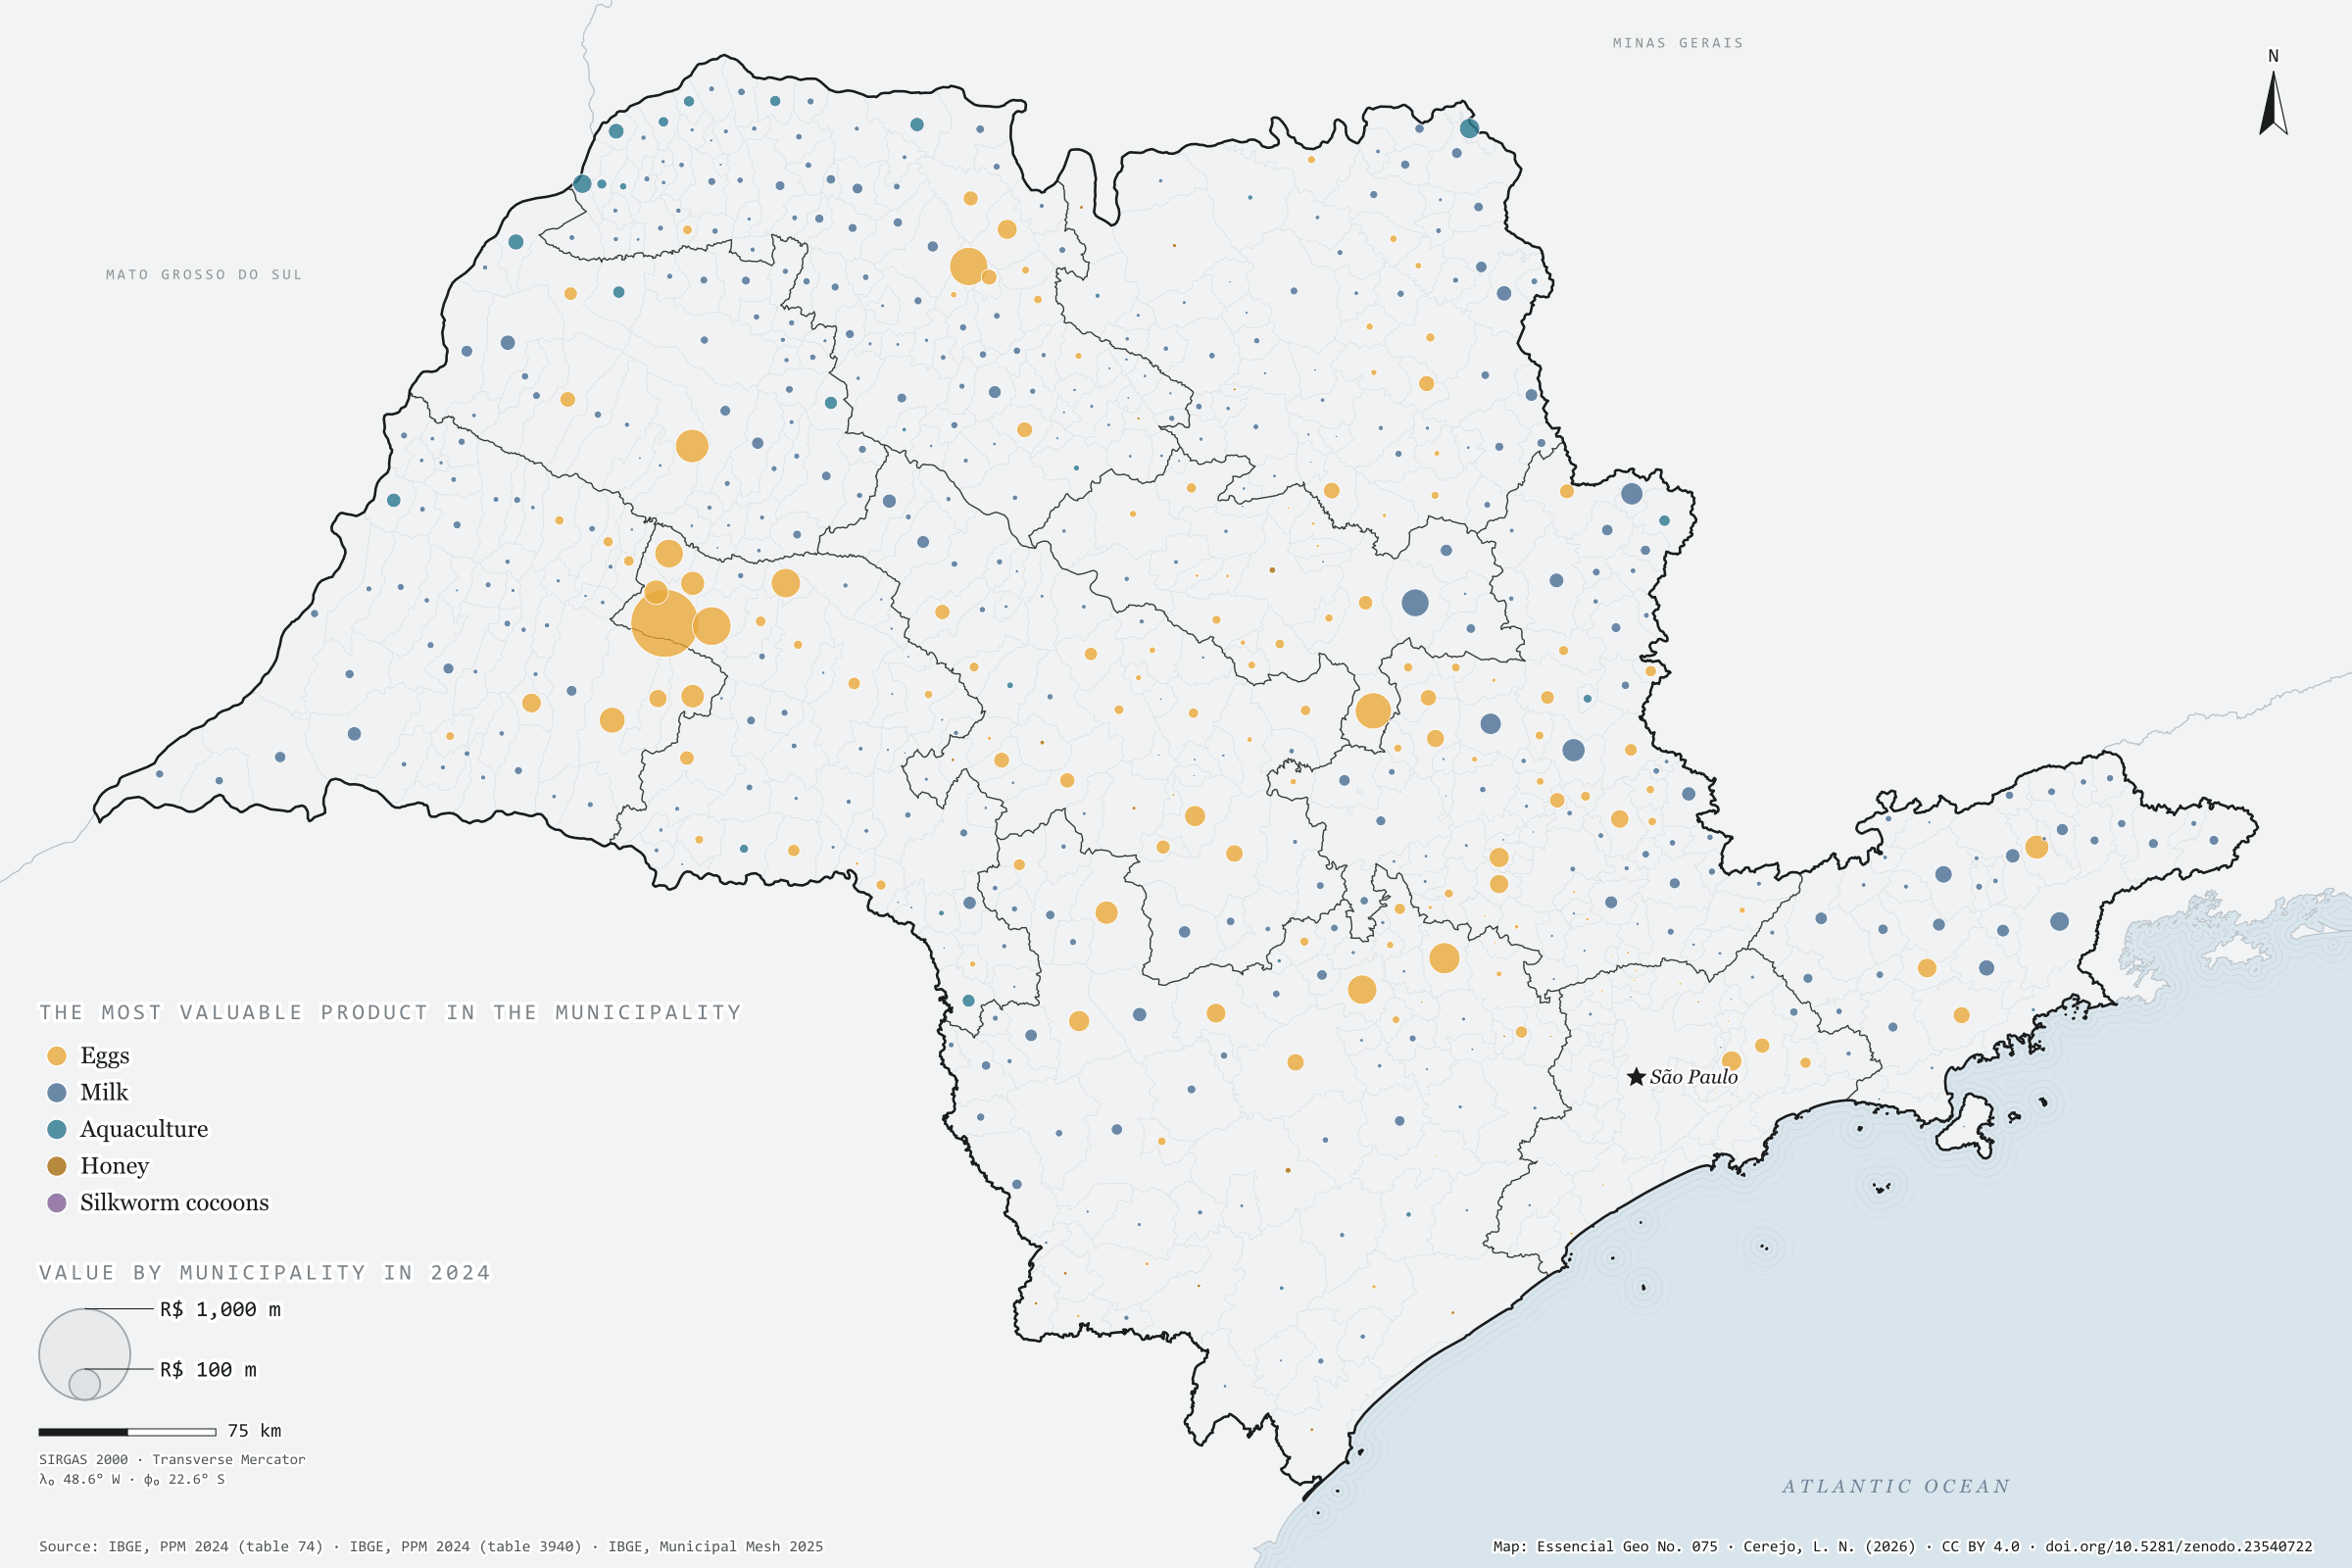
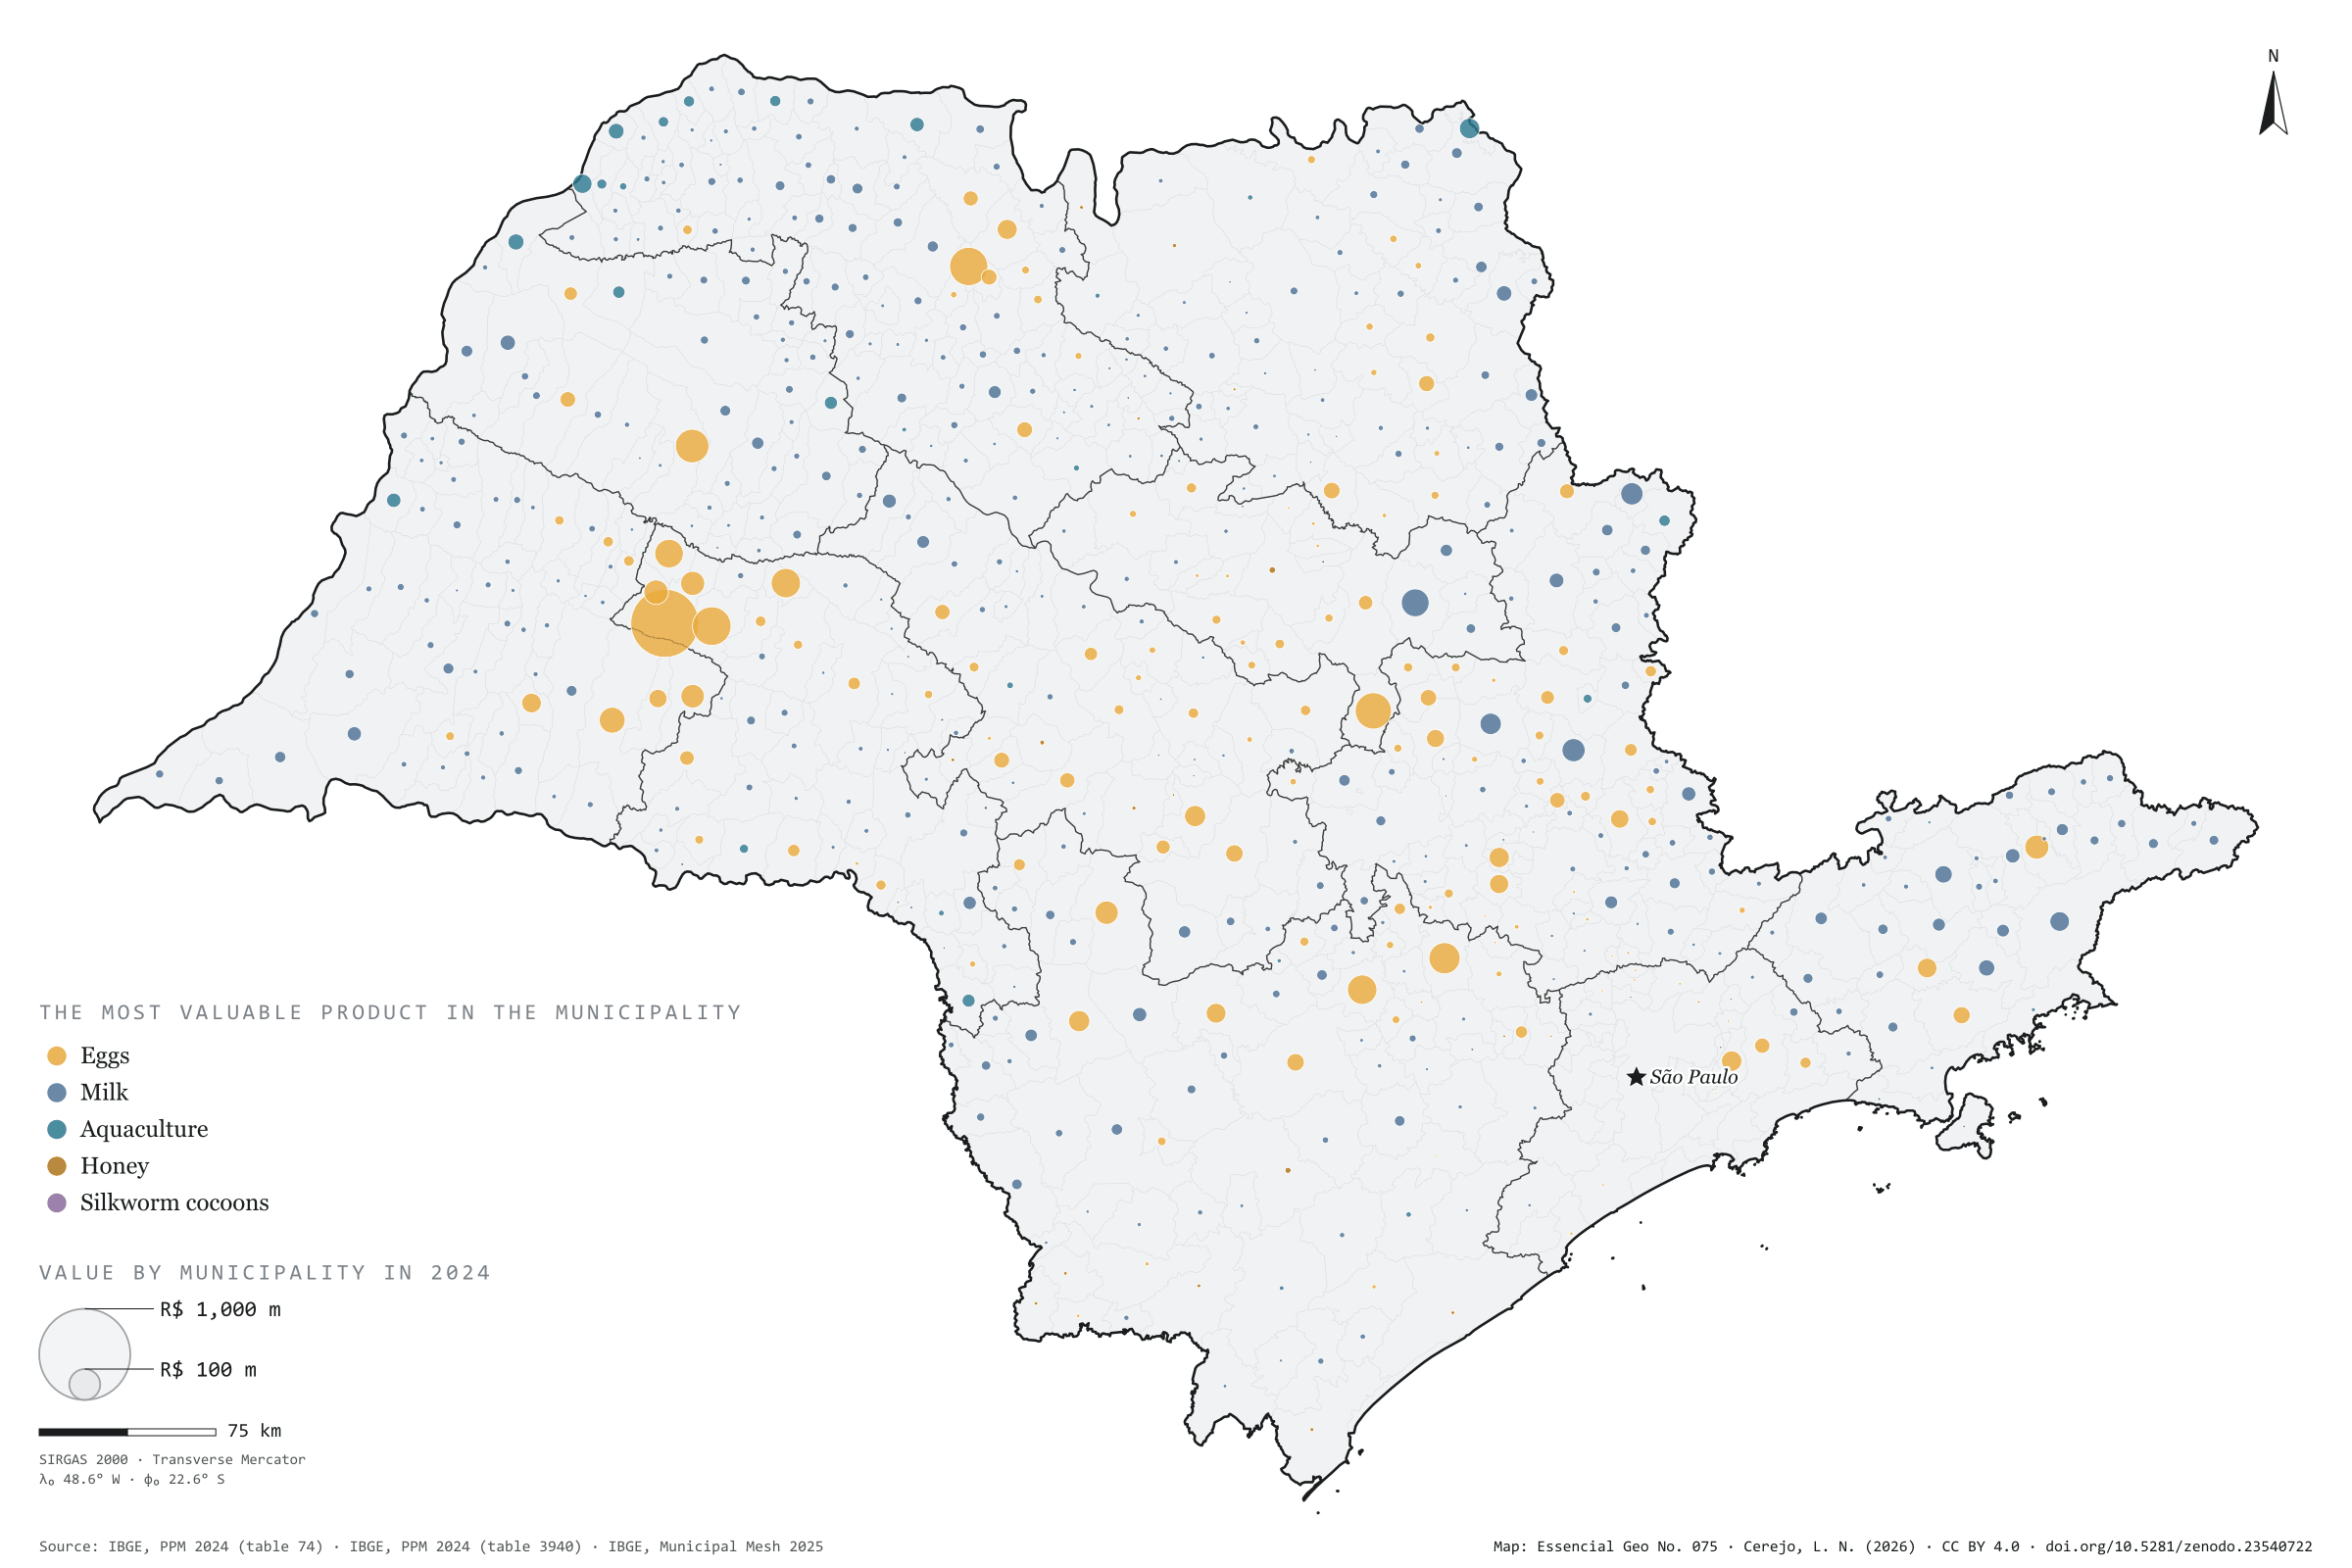
Milk, eggs, honey, silkworm cocoons and farmed fish were worth R$ 12.0 billion in São Paulo in 2024, according to the Municipal Livestock Survey. Eggs accounted for 61% of that value (R$ 7.3 billion), milk for 33% (R$ 3.9 billion), aquaculture for 6% and honey for less than 1%. On the map, however, the colour seen most is milk’s: it is the most valuable product in 423 municipalities, against 139 for eggs, 29 for aquaculture and 22 for honey. The egg money is concentrated in a few hubs. Bastos alone adds up to R$ 1.26 billion, 10% of the state, followed by Tupã, Mirassolândia and Itirapina; in the last two, eggs are more than 98% of the value. The ten largest municipalities account for 31% of the total. The survey does not include meat: the value of slaughtered animals is left out. Fifth and last plate of the collection “Milk, eggs, honey and fish”.
Technical record · downloads · citation
At a glance
Value of animal products in 2024
12,028,732thousand reais
Milk, eggs, honey, cocoons and aquaculture; meat not included
Municipalities where milk is the most valuable product
423
Eggs in 139, aquaculture in 29 and honey in 22; 32 with no reported value
Value by product in 2024 (thousand reais)
Eggs7,284,736
Milk3,941,474
Aquaculture706,286
Honey92,598
Cocoons3,638
Layers
valorpoint613 municipalities with reported value: value of each product and total (thousand reais), dominant product and its share
municipiospolygon645 municipalities, with the same fields
regioes_intermediariaspolygon11 intermediate geographic regions
Value of milk, hen and quail eggs, honey and cocoons (table 74) and aquaculture (table 3940) from PPM 2024, added up by municipality; circles with area proportional to the total, coloured by the most valuable product.
The map without a frame, with legend, scale, reference system and credit written on it: ready for papers, lectures and slides. In two versions: with the basemap (neighbours and sea) or only the mapped area, on white.
CEREJO, Lucas Nakamura. O valor da produção animal: o leite está em toda parte; o dinheiro, nos ovos. Versão 1.0.0. [S. l.]: Zenodo, 2026. Conjunto de dados. DOI: 10.5281/zenodo.23540722. Disponível em: https://doi.org/10.5281/zenodo.23540722. Acesso em: 10 nov. 2026.
Cerejo, L. N. (2026). O valor da produção animal: o leite está em toda parte; o dinheiro, nos ovos [The value of animal products: Milk is everywhere; the money is in eggs] (Version 1.0.0) [Data set]. Zenodo. https://doi.org/10.5281/zenodo.23540722
@dataset{cerejo2026_producao_animal_sp,
  author    = {Cerejo, Lucas Nakamura},
  title     = {O valor da produção animal: O leite está em toda parte; o dinheiro, nos ovos},
  year      = {2026},
  publisher = {Zenodo},
  version   = {1.0.0},
  doi       = {10.5281/zenodo.23540722},
  url       = {https://doi.org/10.5281/zenodo.23540722},
  language  = {portuguese},
  note      = {English title: The value of animal products: Milk is everywhere; the money is in eggs. Licence CC BY 4.0}
}
Fig. 074São Paulo state (SP)EPSG:4674Source: IBGE, MapBiomas
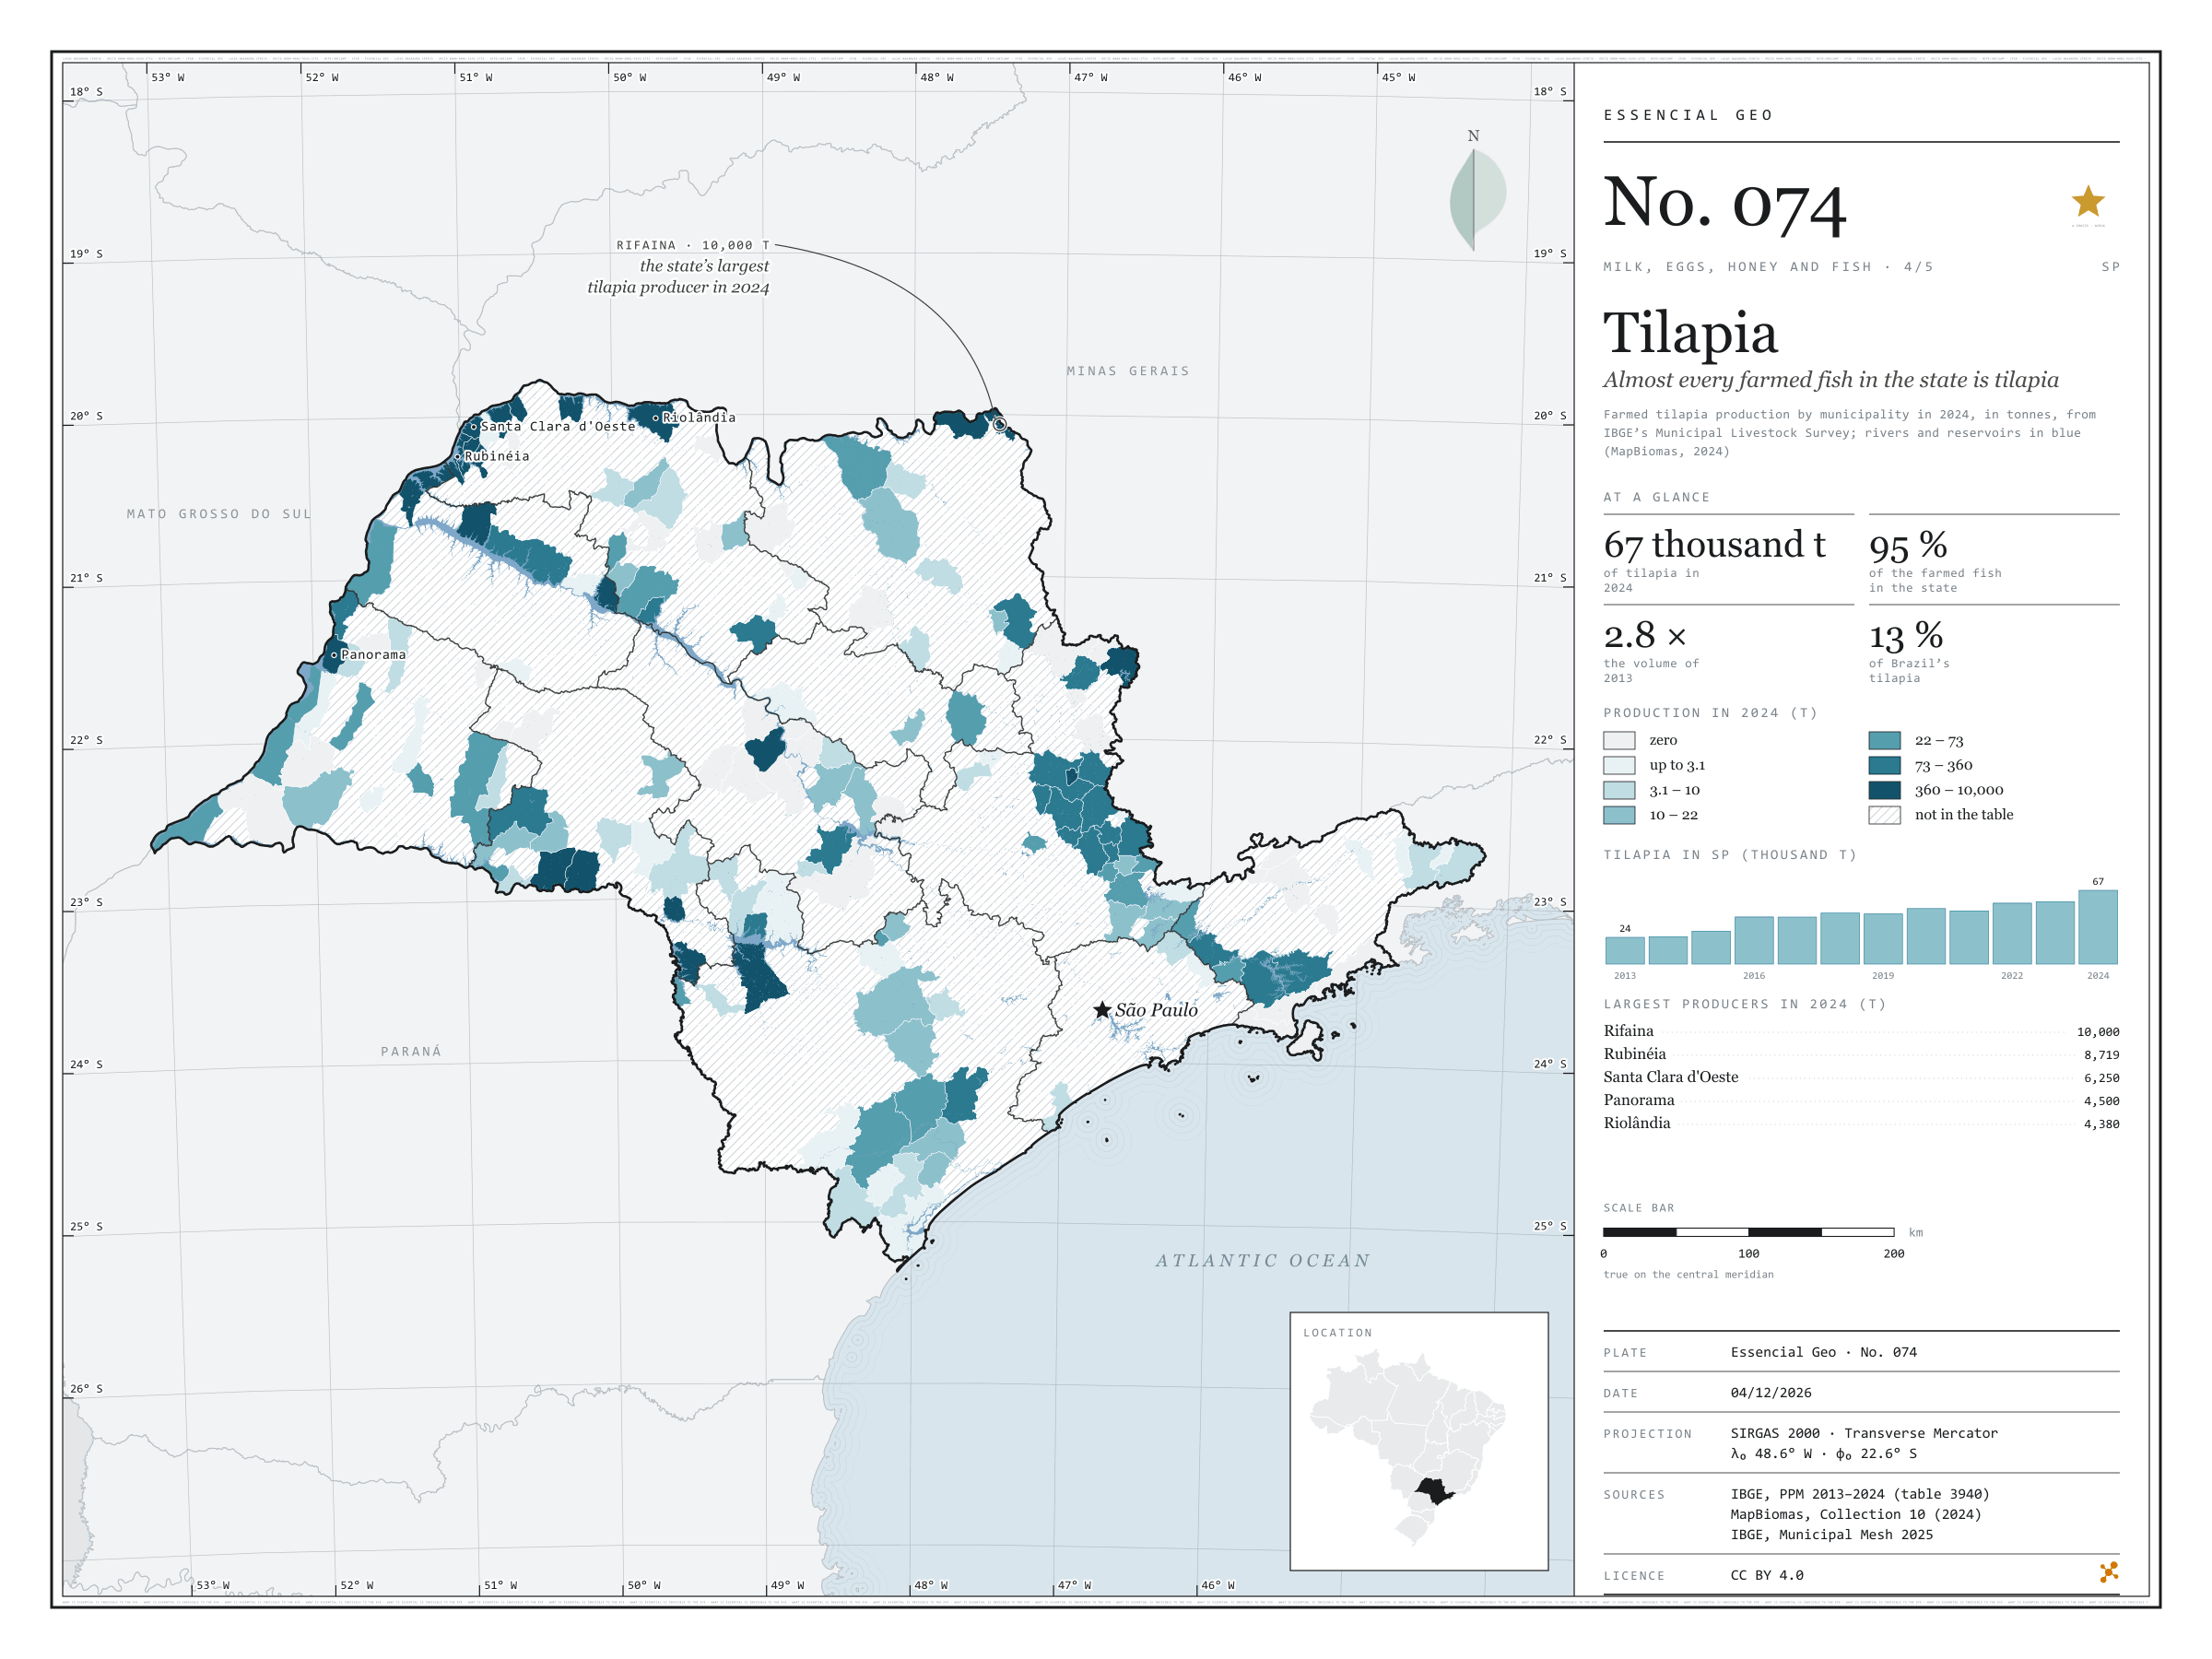
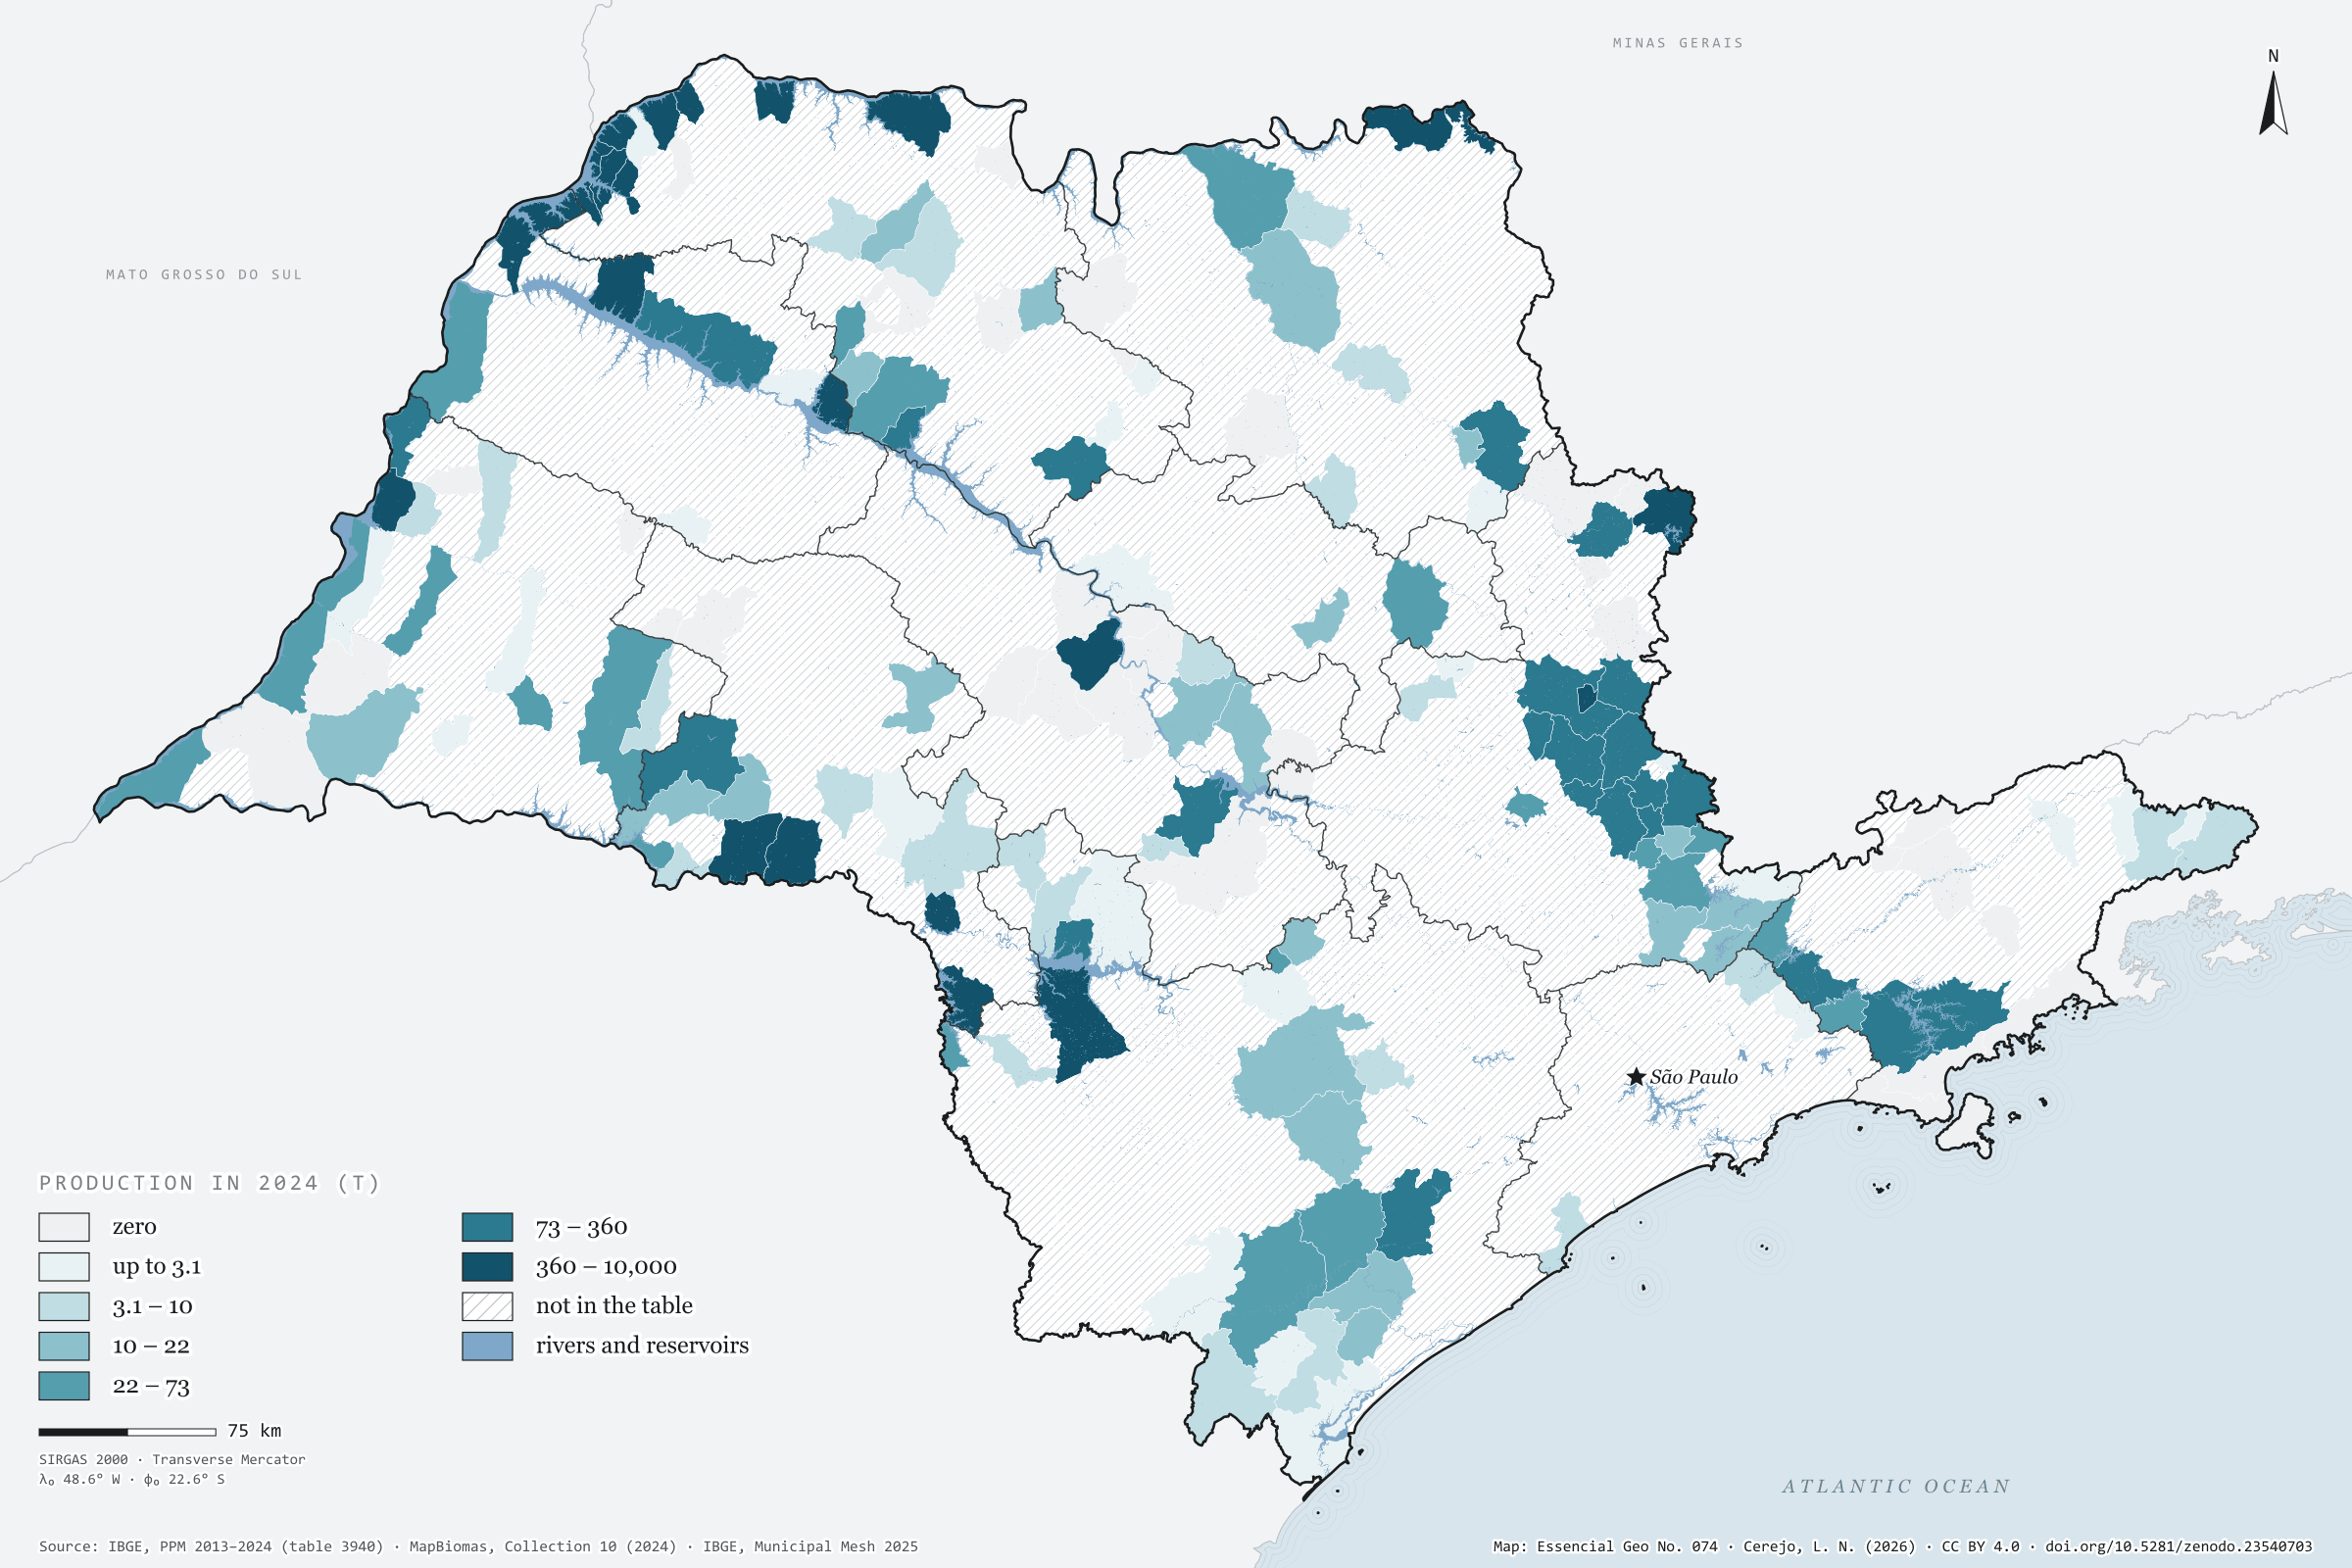
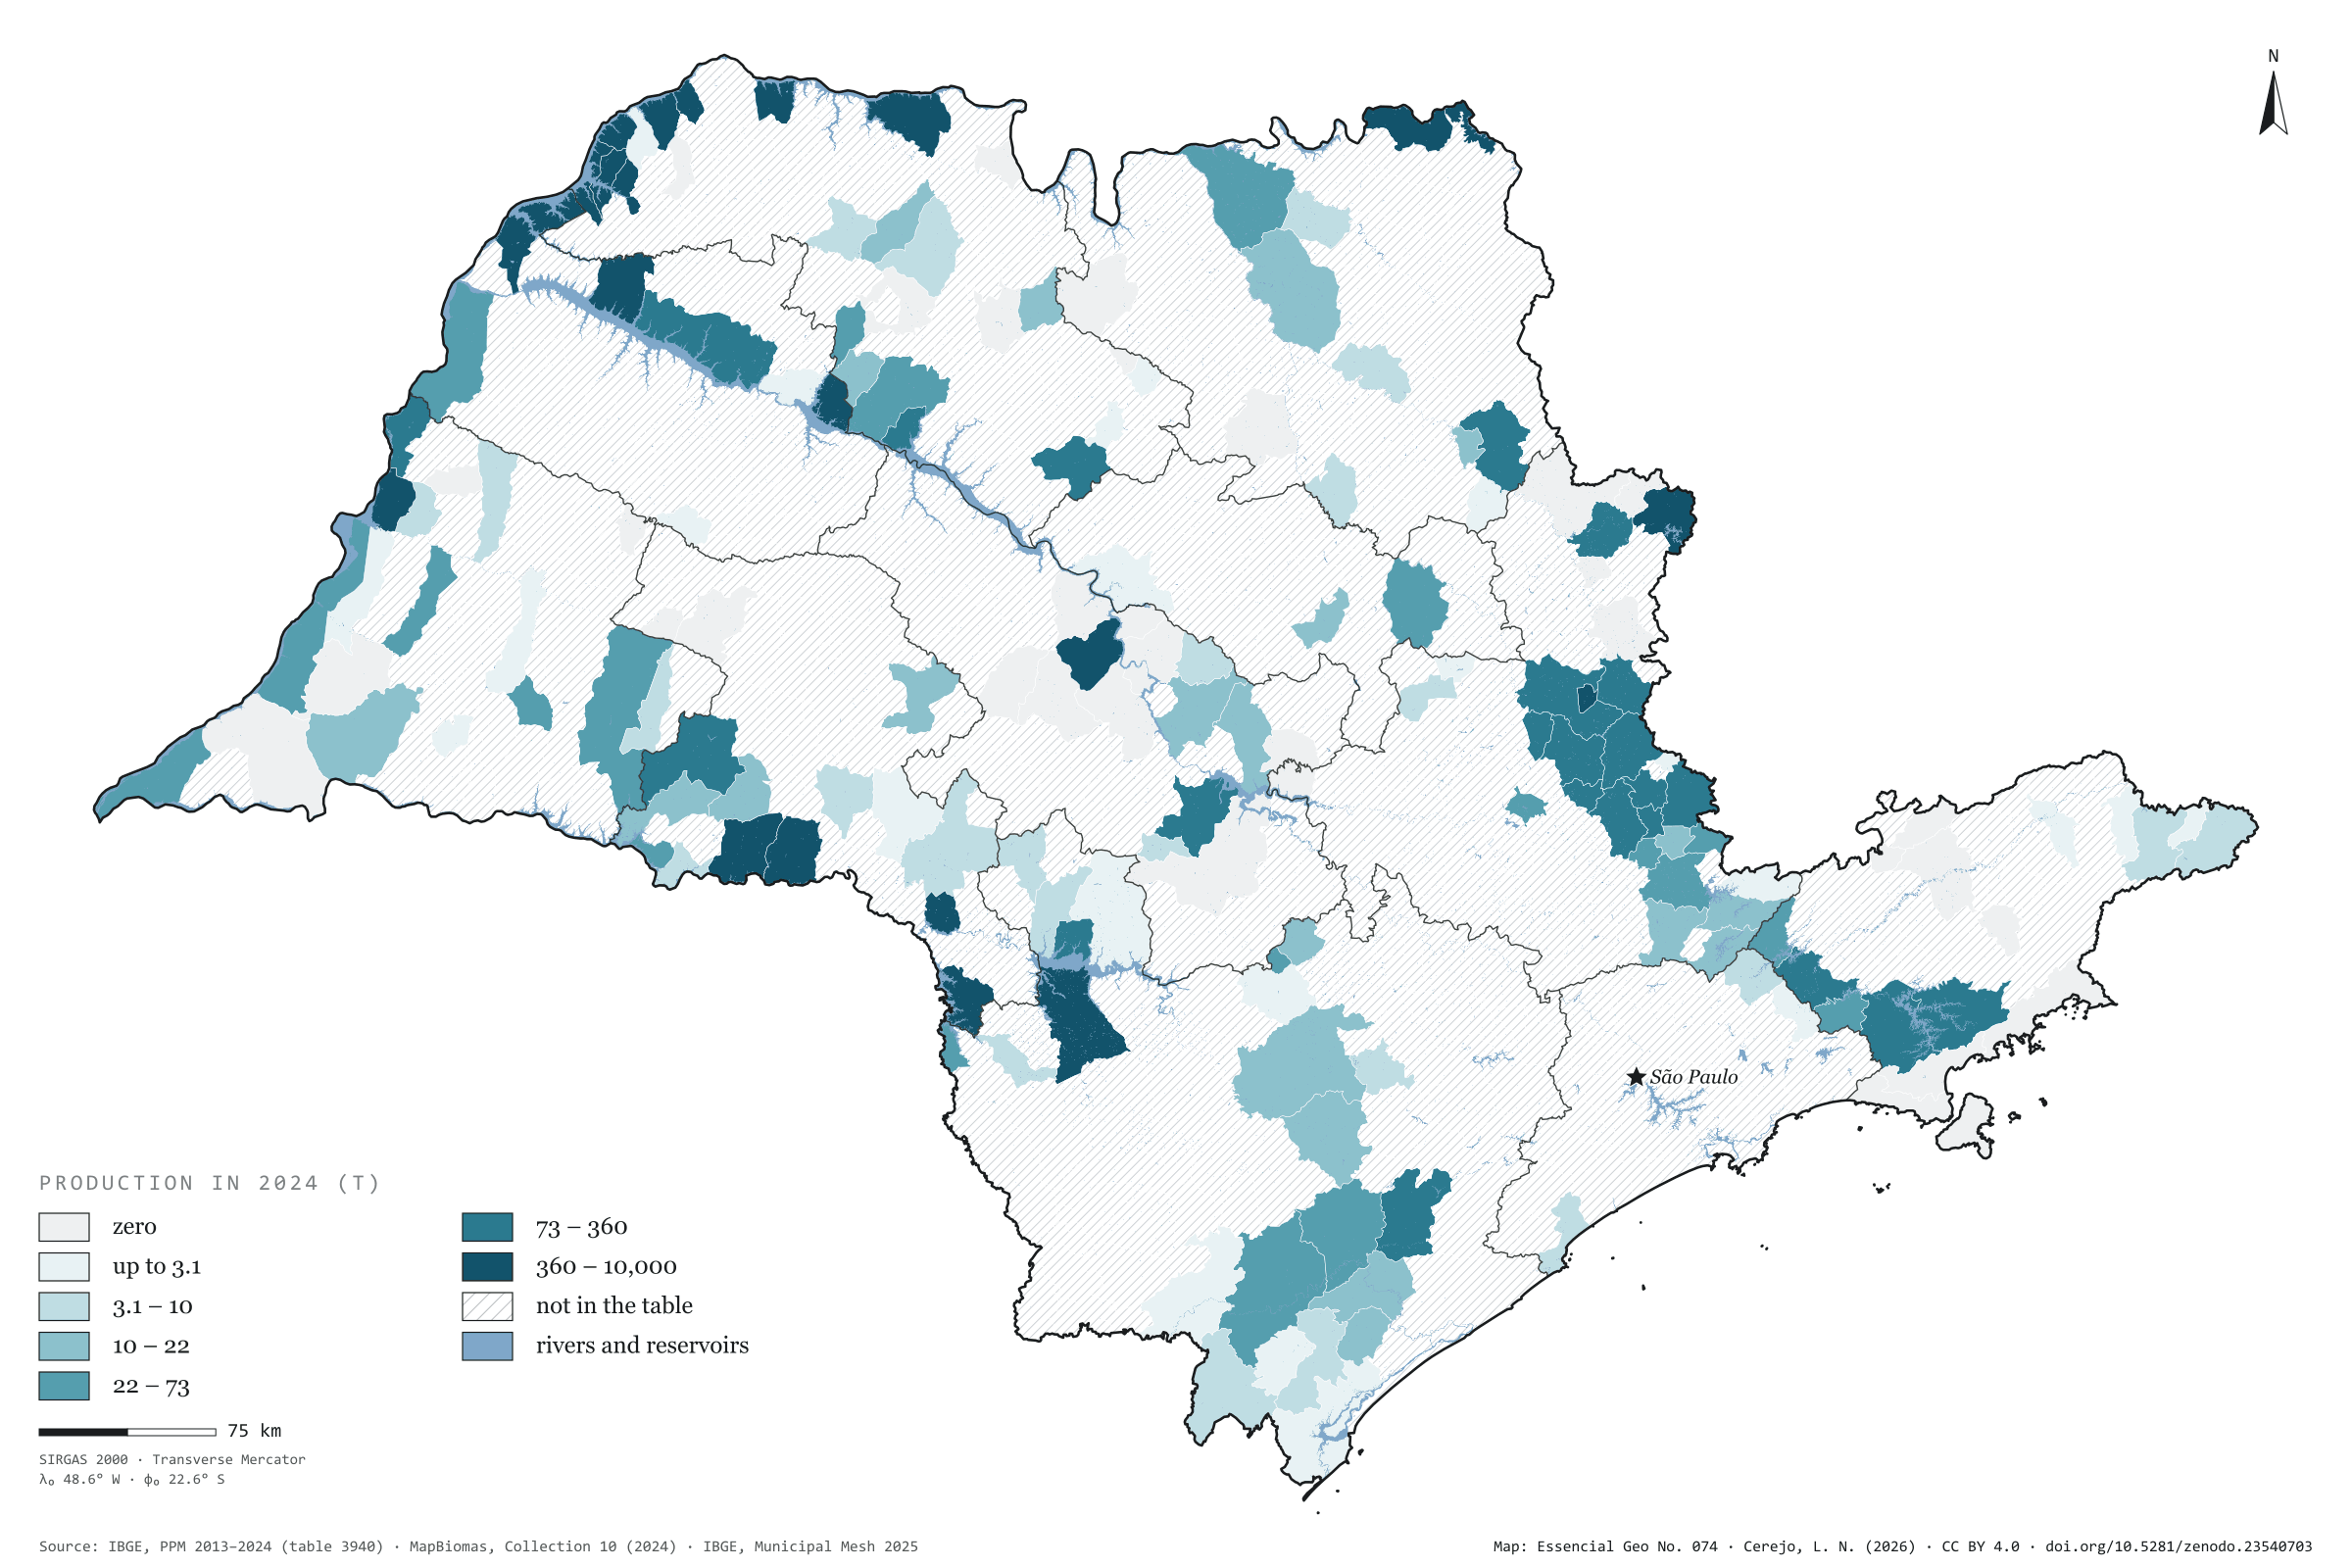
São Paulo farmed 67,000 tonnes of tilapia in 2024, 2.8 times the volume of 2013, the first year of the Municipal Livestock Survey’s aquaculture series. Tilapia is 95% of all fish farmed in the state. Brazil grew even faster, from 169,000 to 499,000 tonnes, and the state’s share stood at 13.4%. Farming is concentrated: 134 municipalities report production, and the ten largest account for 72%. The largest sit on the reservoirs of the Grande and Paraná rivers. Rifaina, on the border with Minas Gerais, leads with 10,000 tonnes, followed by Rubinéia, Santa Clara d'Oeste, Panorama and Riolândia. The São José do Rio Preto region, in the north-west, produces 42% of the total on its own. On the map, MapBiomas water shows the rivers and reservoirs, and hatching marks the 476 municipalities with no reported production. Fourth plate of the collection “Milk, eggs, honey and fish”.
Technical record · downloads · citation
At a glance
Tilapia in 2024
67,058,737kg
In 2013 it was 24,329,347 kg; the share of Brazil went from 14.4% to 13.4%
Tilapia’s share of farmed fish in SP
95%
Out of 70,548,417 kg of fish of all species in 2024
Largest producers in 2024 (kg)
Rifaina10,000,000
Rubinéia8,718,900
Santa Clara d'Oeste6,250,000
Panorama4,500,000
Riolândia4,379,950
Layers
municipiospolygon645 municipalities: tilapia production in 2013 and 2024 (kg) and data status in 2024
regioes_intermediariaspolygon11 intermediate geographic regions
Tilapia production from PPM 2024 by municipality in six quantile classes; state series from 2013 to 2024; rivers, lakes and reservoirs from the MapBiomas 2024 water classes over the map.
The map without a frame, with legend, scale, reference system and credit written on it: ready for papers, lectures and slides. In two versions: with the basemap (neighbours and sea) or only the mapped area, on white.
CEREJO, Lucas Nakamura. Tilápia: quase todo peixe criado no estado é tilápia. Versão 1.0.0. [S. l.]: Zenodo, 2026. Conjunto de dados. DOI: 10.5281/zenodo.23540703. Disponível em: https://doi.org/10.5281/zenodo.23540703. Acesso em: 10 nov. 2026.
Cerejo, L. N. (2026). Tilápia: quase todo peixe criado no estado é tilápia [Tilapia: Almost every farmed fish in the state is tilapia] (Version 1.0.0) [Data set]. Zenodo. https://doi.org/10.5281/zenodo.23540703
@dataset{cerejo2026_tilapia_sp,
  author    = {Cerejo, Lucas Nakamura},
  title     = {Tilápia: Quase todo peixe criado no estado é tilápia},
  year      = {2026},
  publisher = {Zenodo},
  version   = {1.0.0},
  doi       = {10.5281/zenodo.23540703},
  url       = {https://doi.org/10.5281/zenodo.23540703},
  language  = {portuguese},
  note      = {English title: Tilapia: Almost every farmed fish in the state is tilapia. Licence CC BY 4.0}
}
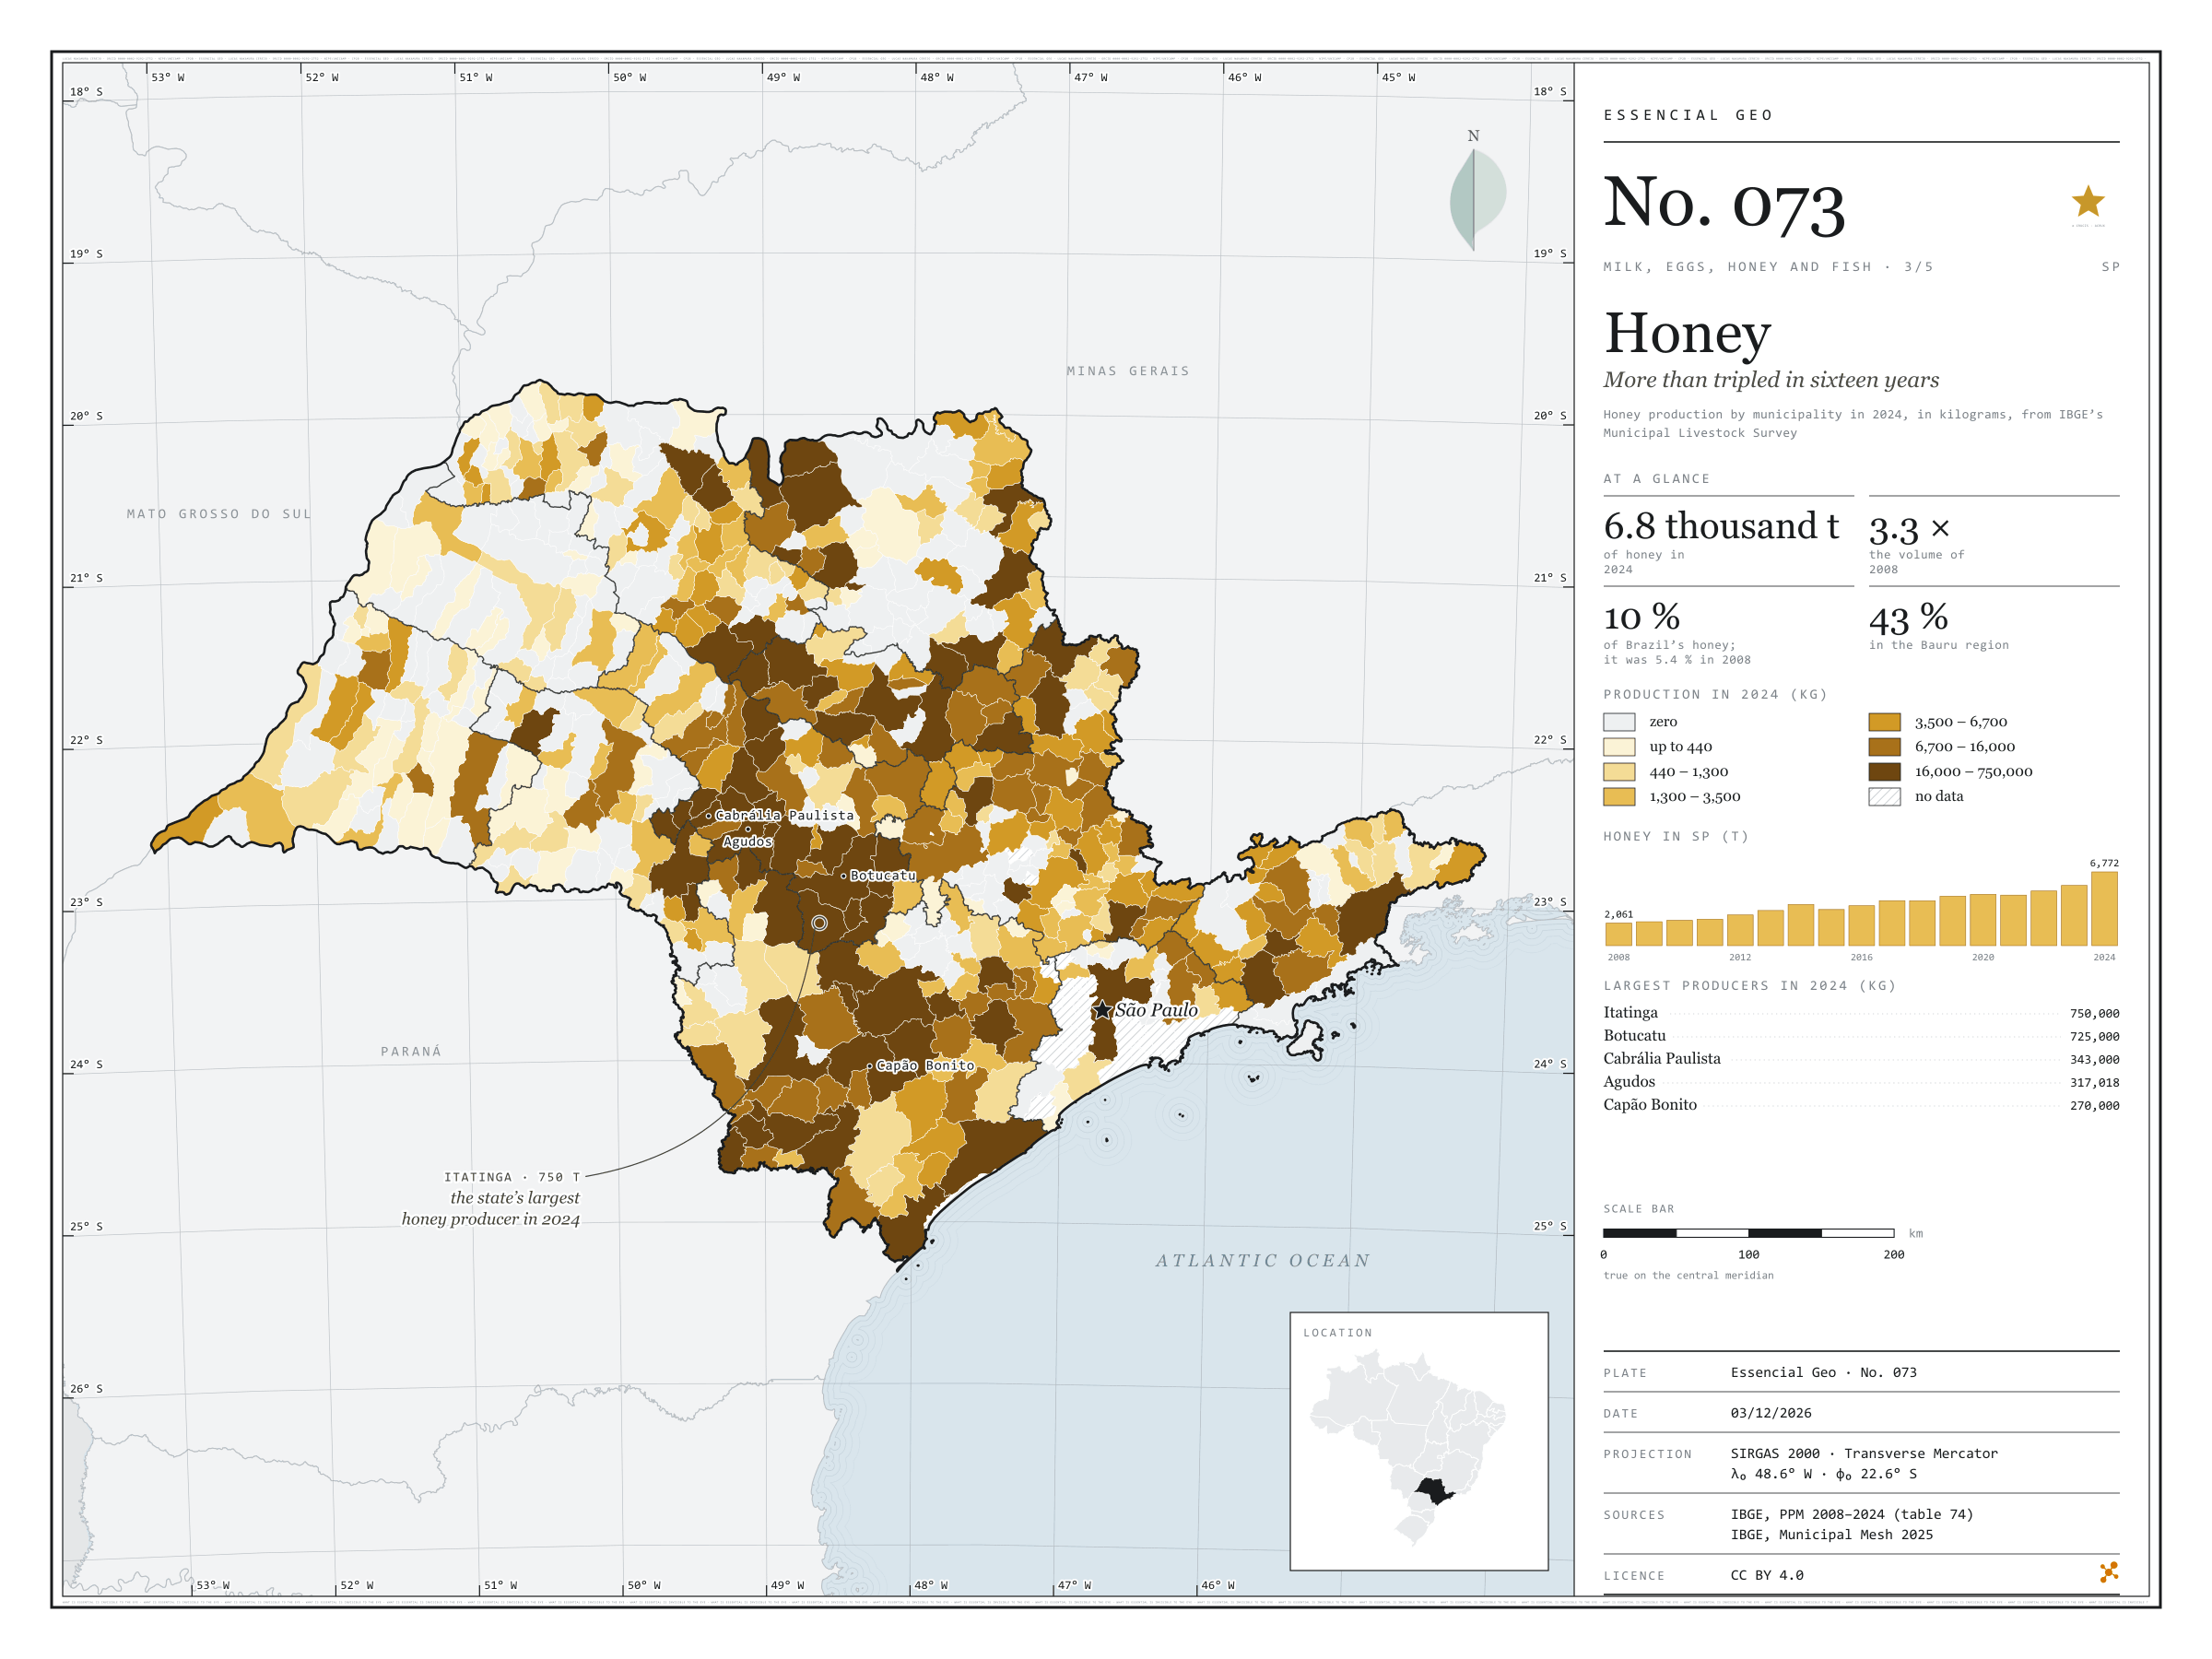
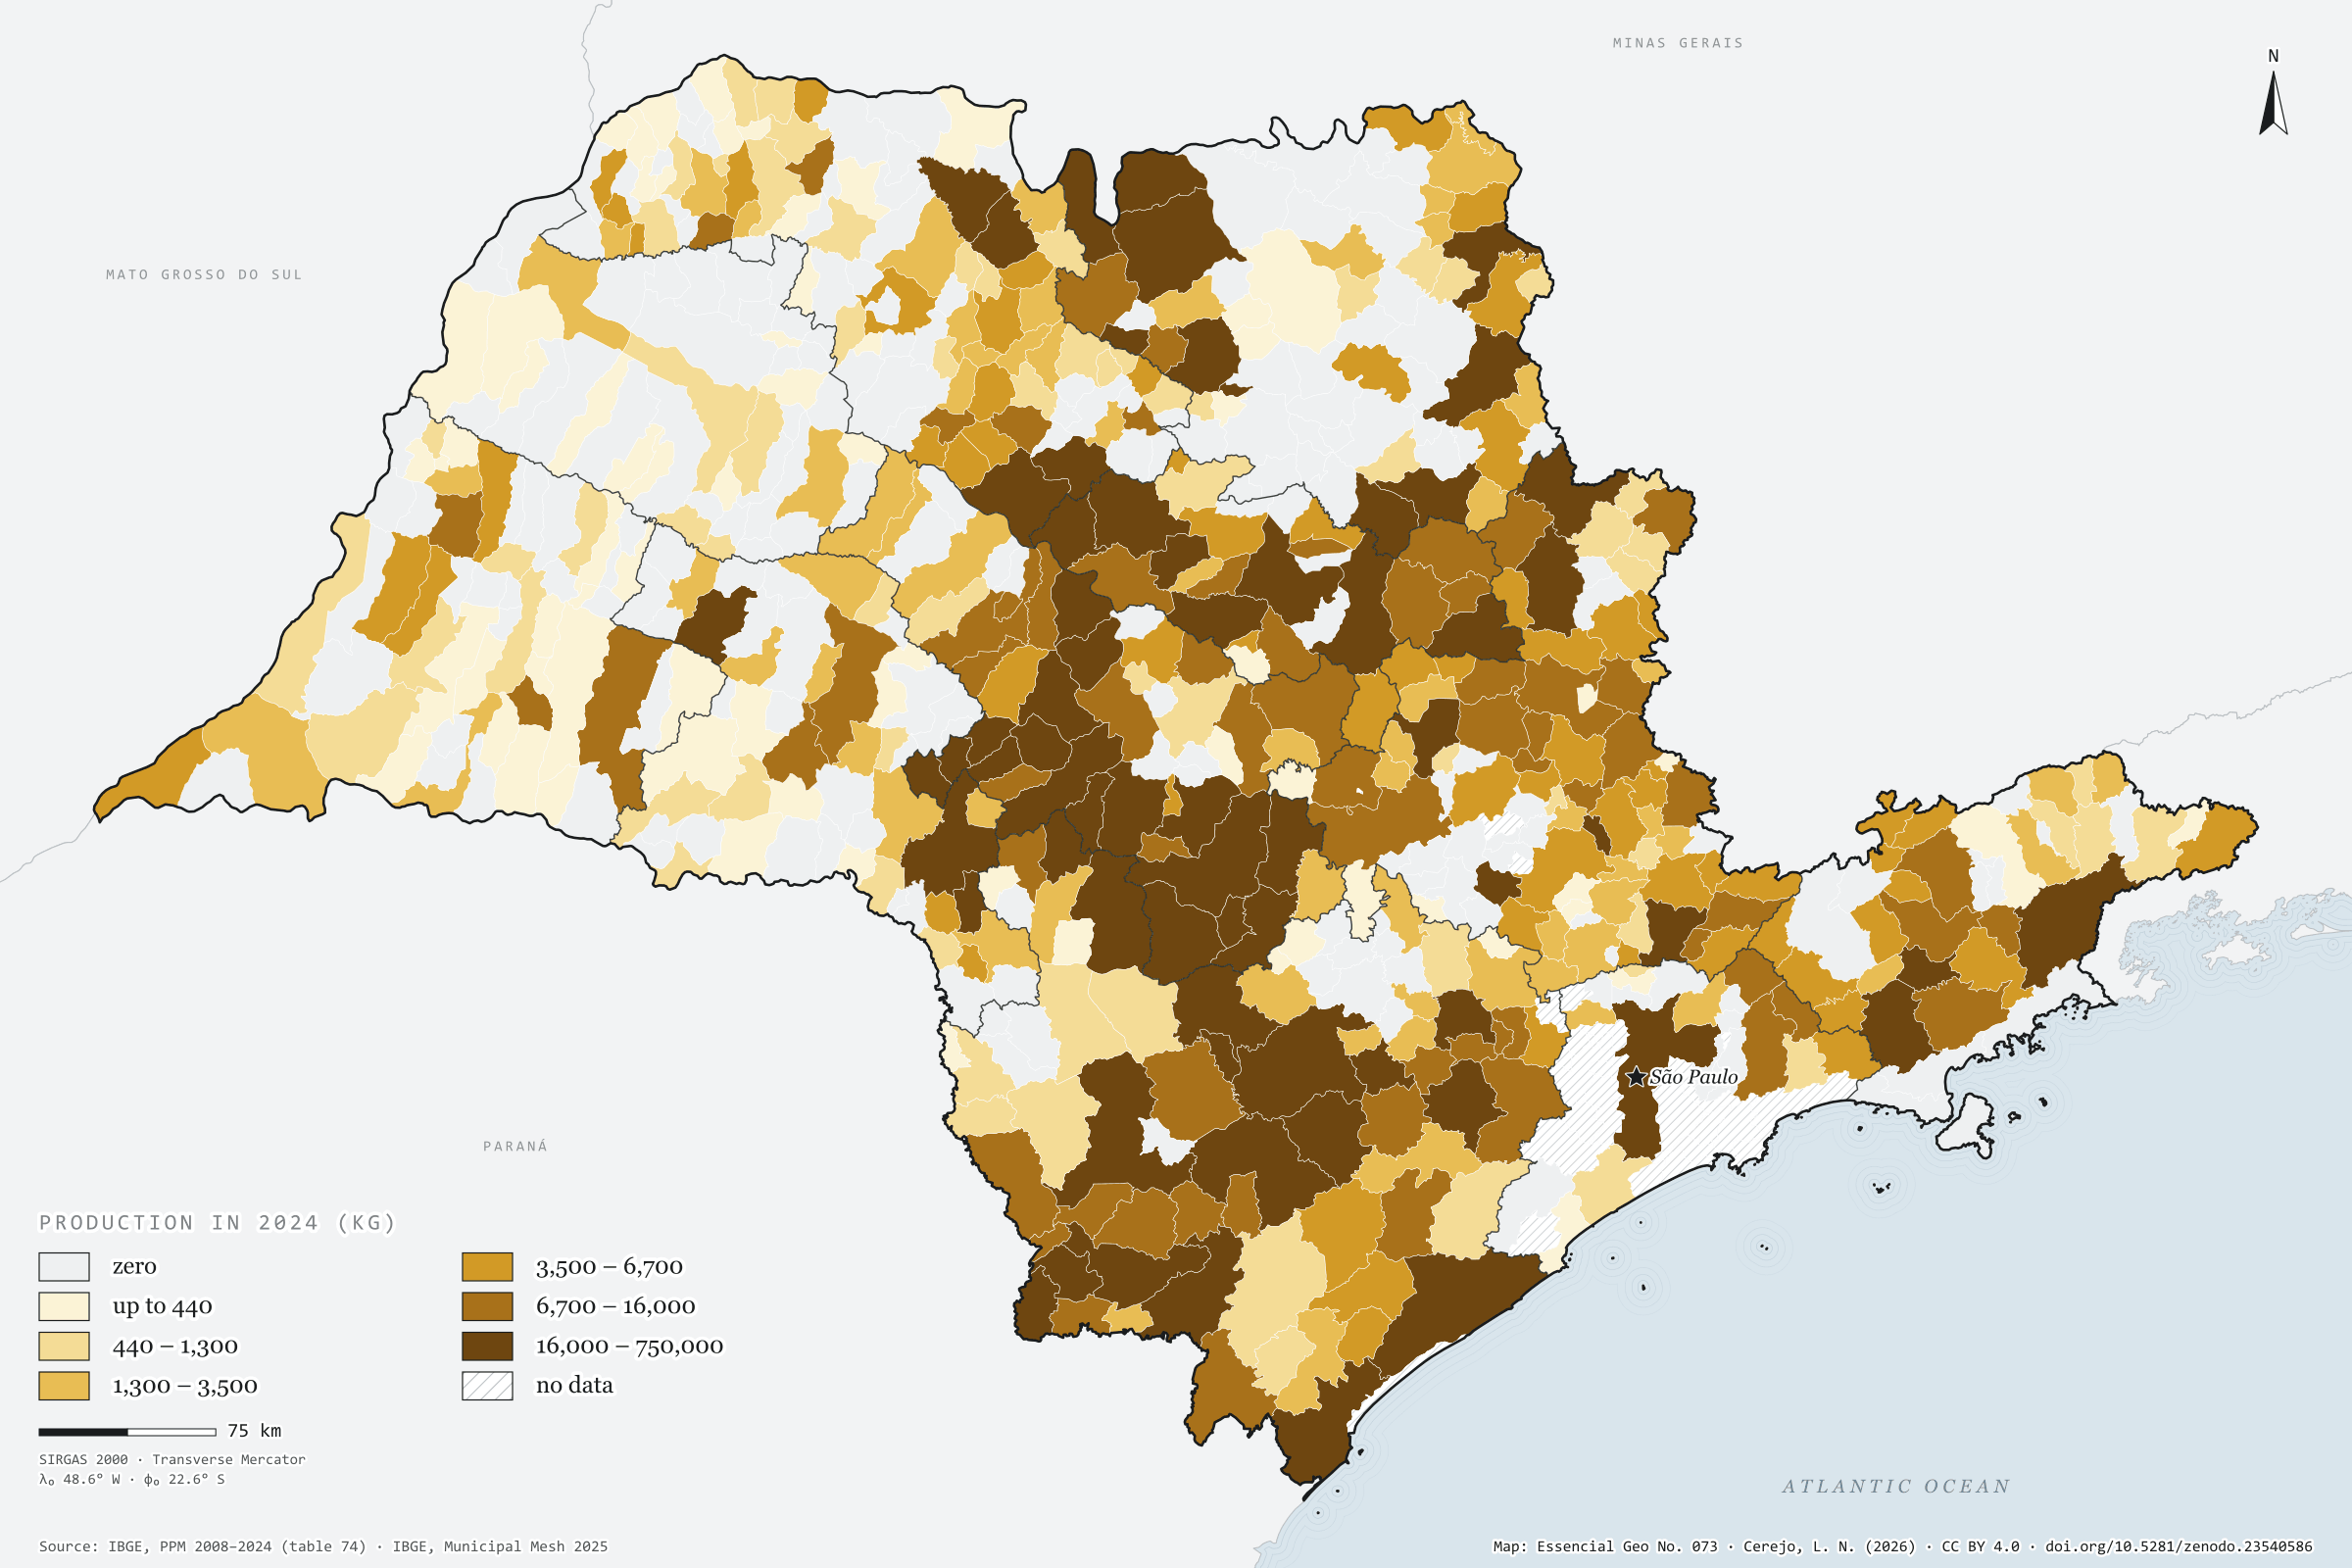
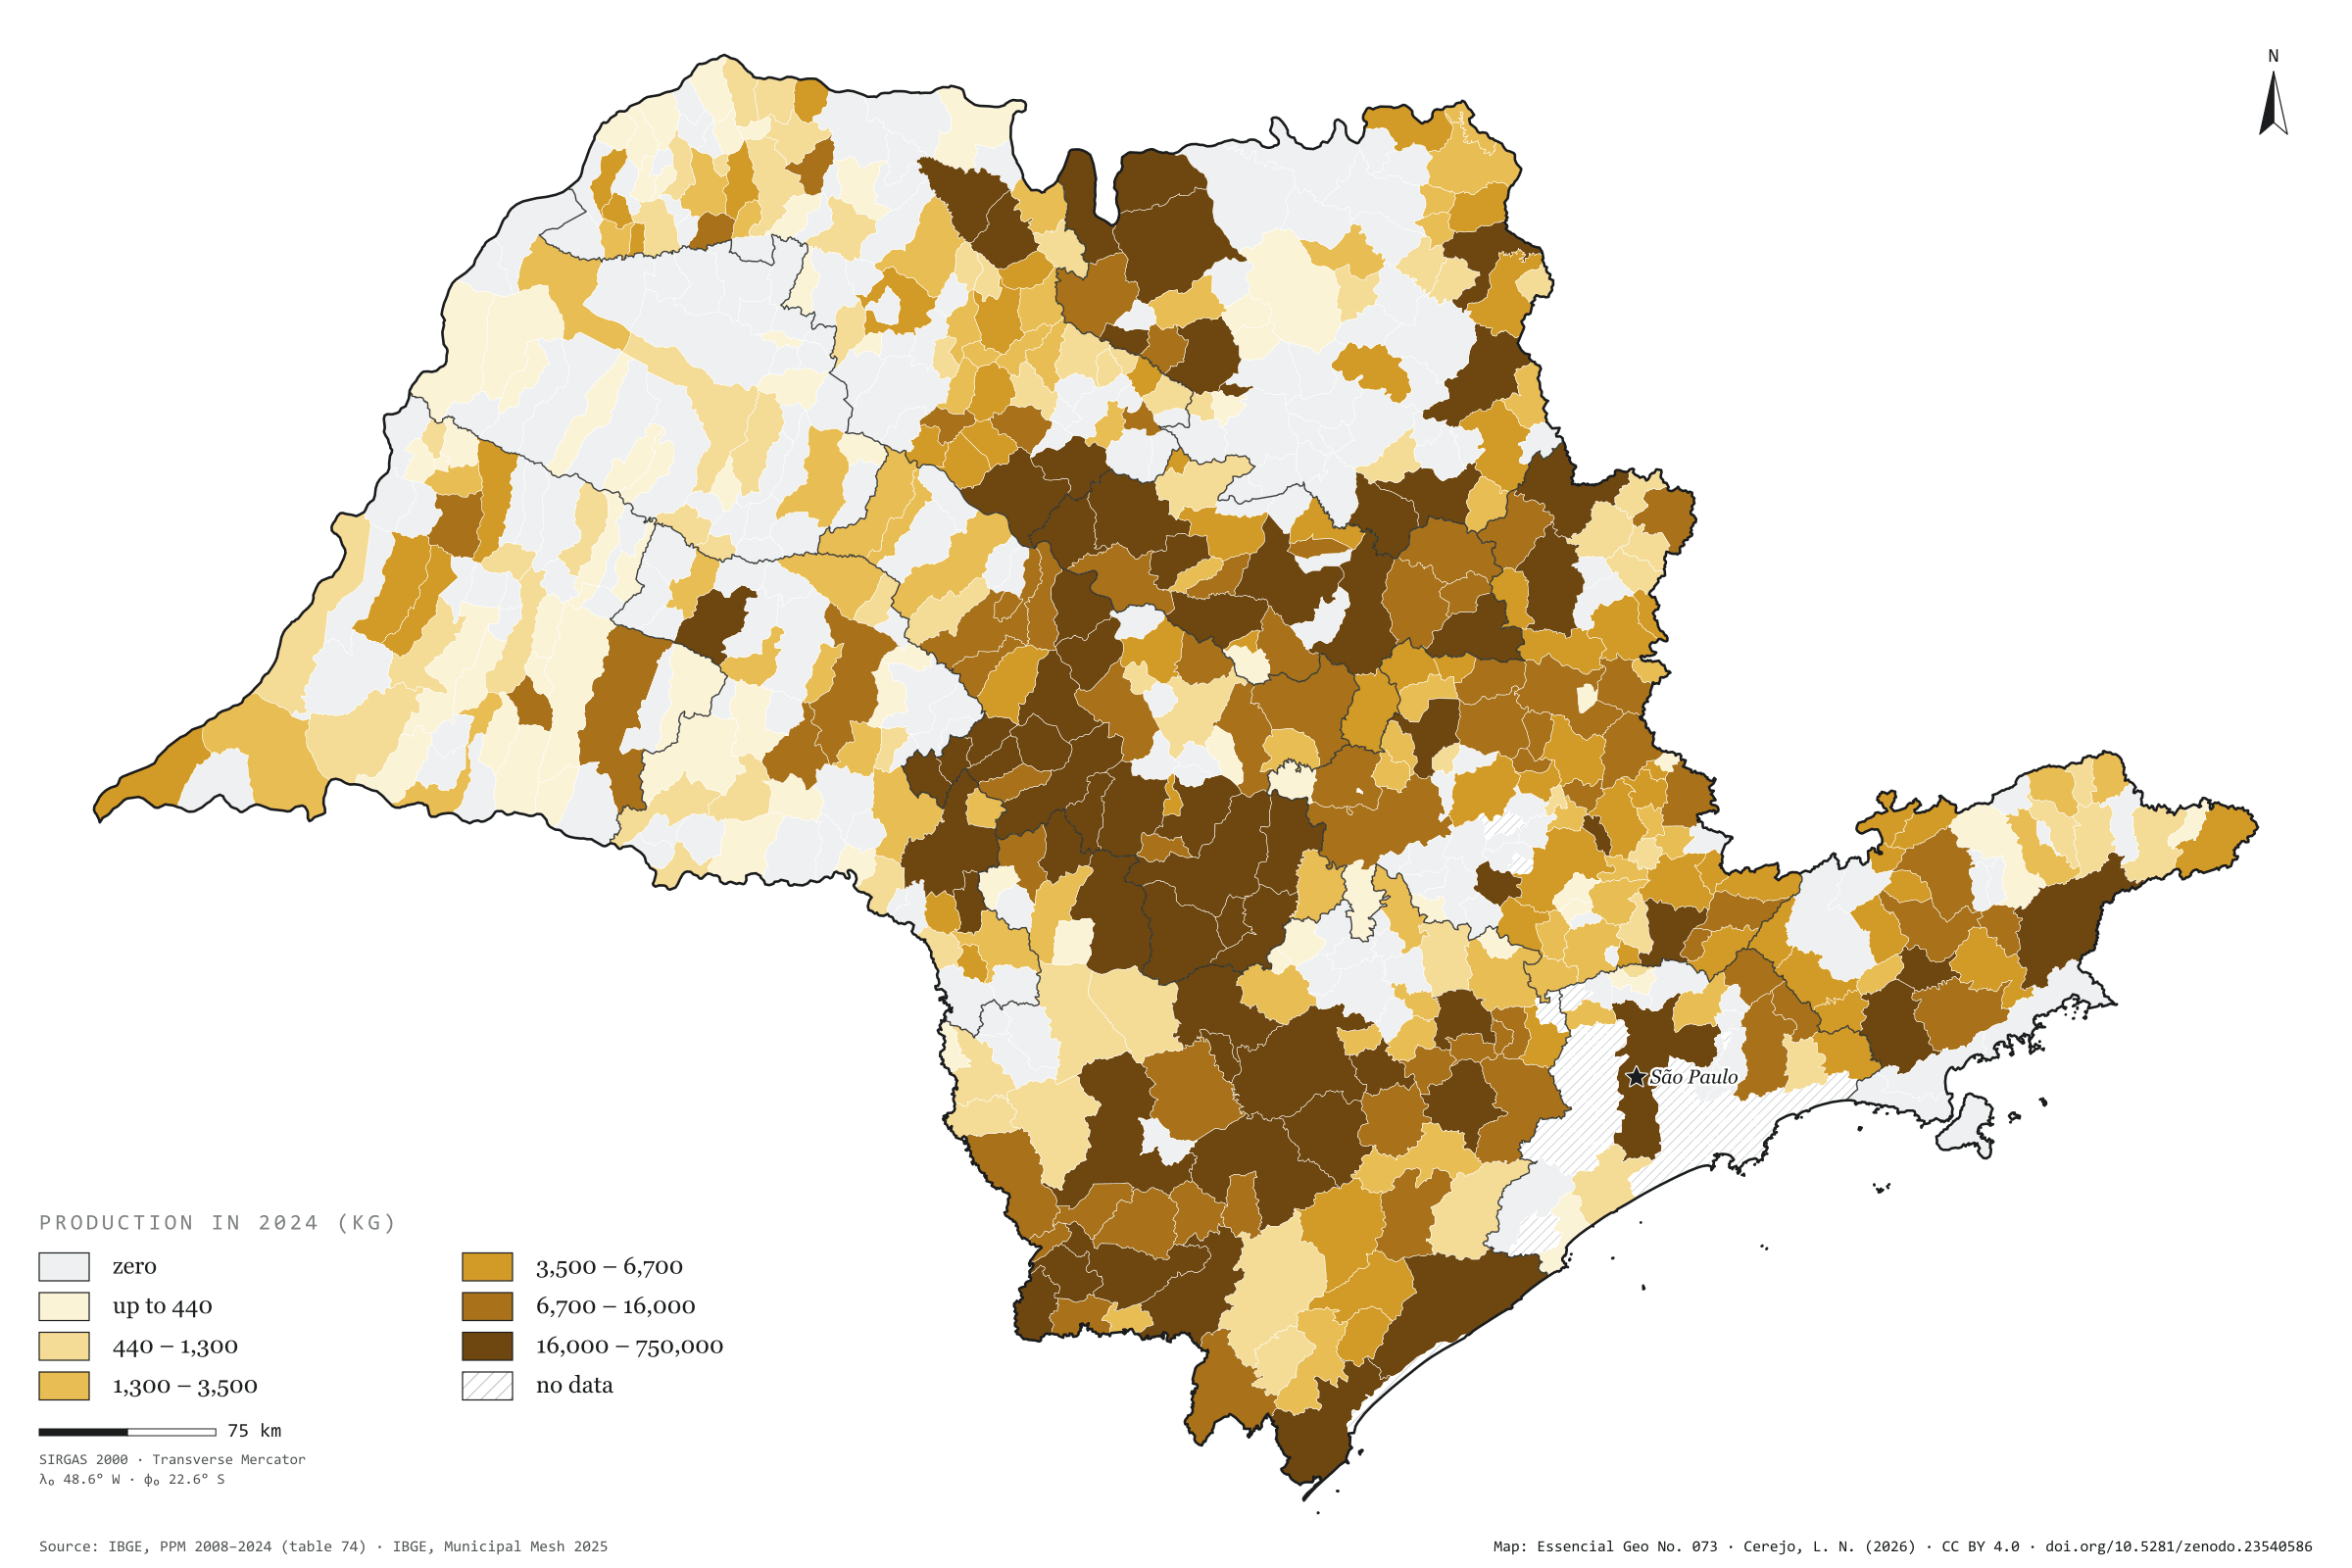
São Paulo produced 6,800 tonnes of honey in 2024, 3.3 times what it produced in 2008. Production grew in almost every year and jumped by 23% from 2023 to 2024 alone. In Brazil the growth was smaller, from 37,800 to 67,300 tonnes, and the state’s share almost doubled, from 5.4% to 10.1%. Honey is concentrated in the centre-south of the state, around Botucatu: the Bauru intermediate region produces 43% of the total. Itatinga, with 750 tonnes, and Botucatu, with 725, add up to 22% of the state’s honey; Cabrália Paulista, Agudos and Capão Bonito follow, and the ten largest produce 49%. The number of producing municipalities is the same in both years, 408: the growth came from those already producing. The west, by contrast, barely shows. Third plate of the collection “Milk, eggs, honey and fish”.
Technical record · downloads · citation
At a glance
Honey in 2024
6,772,329kg
In 2008 it was 2,061,425 kg; the share of Brazil went from 5.4% to 10.1%
Honey in the Bauru intermediate region
43%
2,930,210 kg in 2024
Largest producers in 2024 (kg)
Itatinga750,000
Botucatu725,000
Cabrália Paulista343,000
Agudos317,018
Capão Bonito270,000
Layers
municipiospolygon645 municipalities: honey production in 2008 and 2024 (kg) and data status in 2024
regioes_intermediariaspolygon11 intermediate geographic regions
The map without a frame, with legend, scale, reference system and credit written on it: ready for papers, lectures and slides. In two versions: with the basemap (neighbours and sea) or only the mapped area, on white.
CEREJO, Lucas Nakamura. Mel: mais que triplicou em dezesseis anos. Versão 1.0.0. [S. l.]: Zenodo, 2026. Conjunto de dados. DOI: 10.5281/zenodo.23540586. Disponível em: https://doi.org/10.5281/zenodo.23540586. Acesso em: 10 nov. 2026.
Cerejo, L. N. (2026). Mel: mais que triplicou em dezesseis anos [Honey: More than tripled in sixteen years] (Version 1.0.0) [Data set]. Zenodo. https://doi.org/10.5281/zenodo.23540586
@dataset{cerejo2026_mel_sp,
  author    = {Cerejo, Lucas Nakamura},
  title     = {Mel: Mais que triplicou em dezesseis anos},
  year      = {2026},
  publisher = {Zenodo},
  version   = {1.0.0},
  doi       = {10.5281/zenodo.23540586},
  url       = {https://doi.org/10.5281/zenodo.23540586},
  language  = {portuguese},
  note      = {English title: Honey: More than tripled in sixteen years. Licence CC BY 4.0}
}
Fig. 072São Paulo state (SP)EPSG:4674Source: IBGE, CP2B (Unicamp)
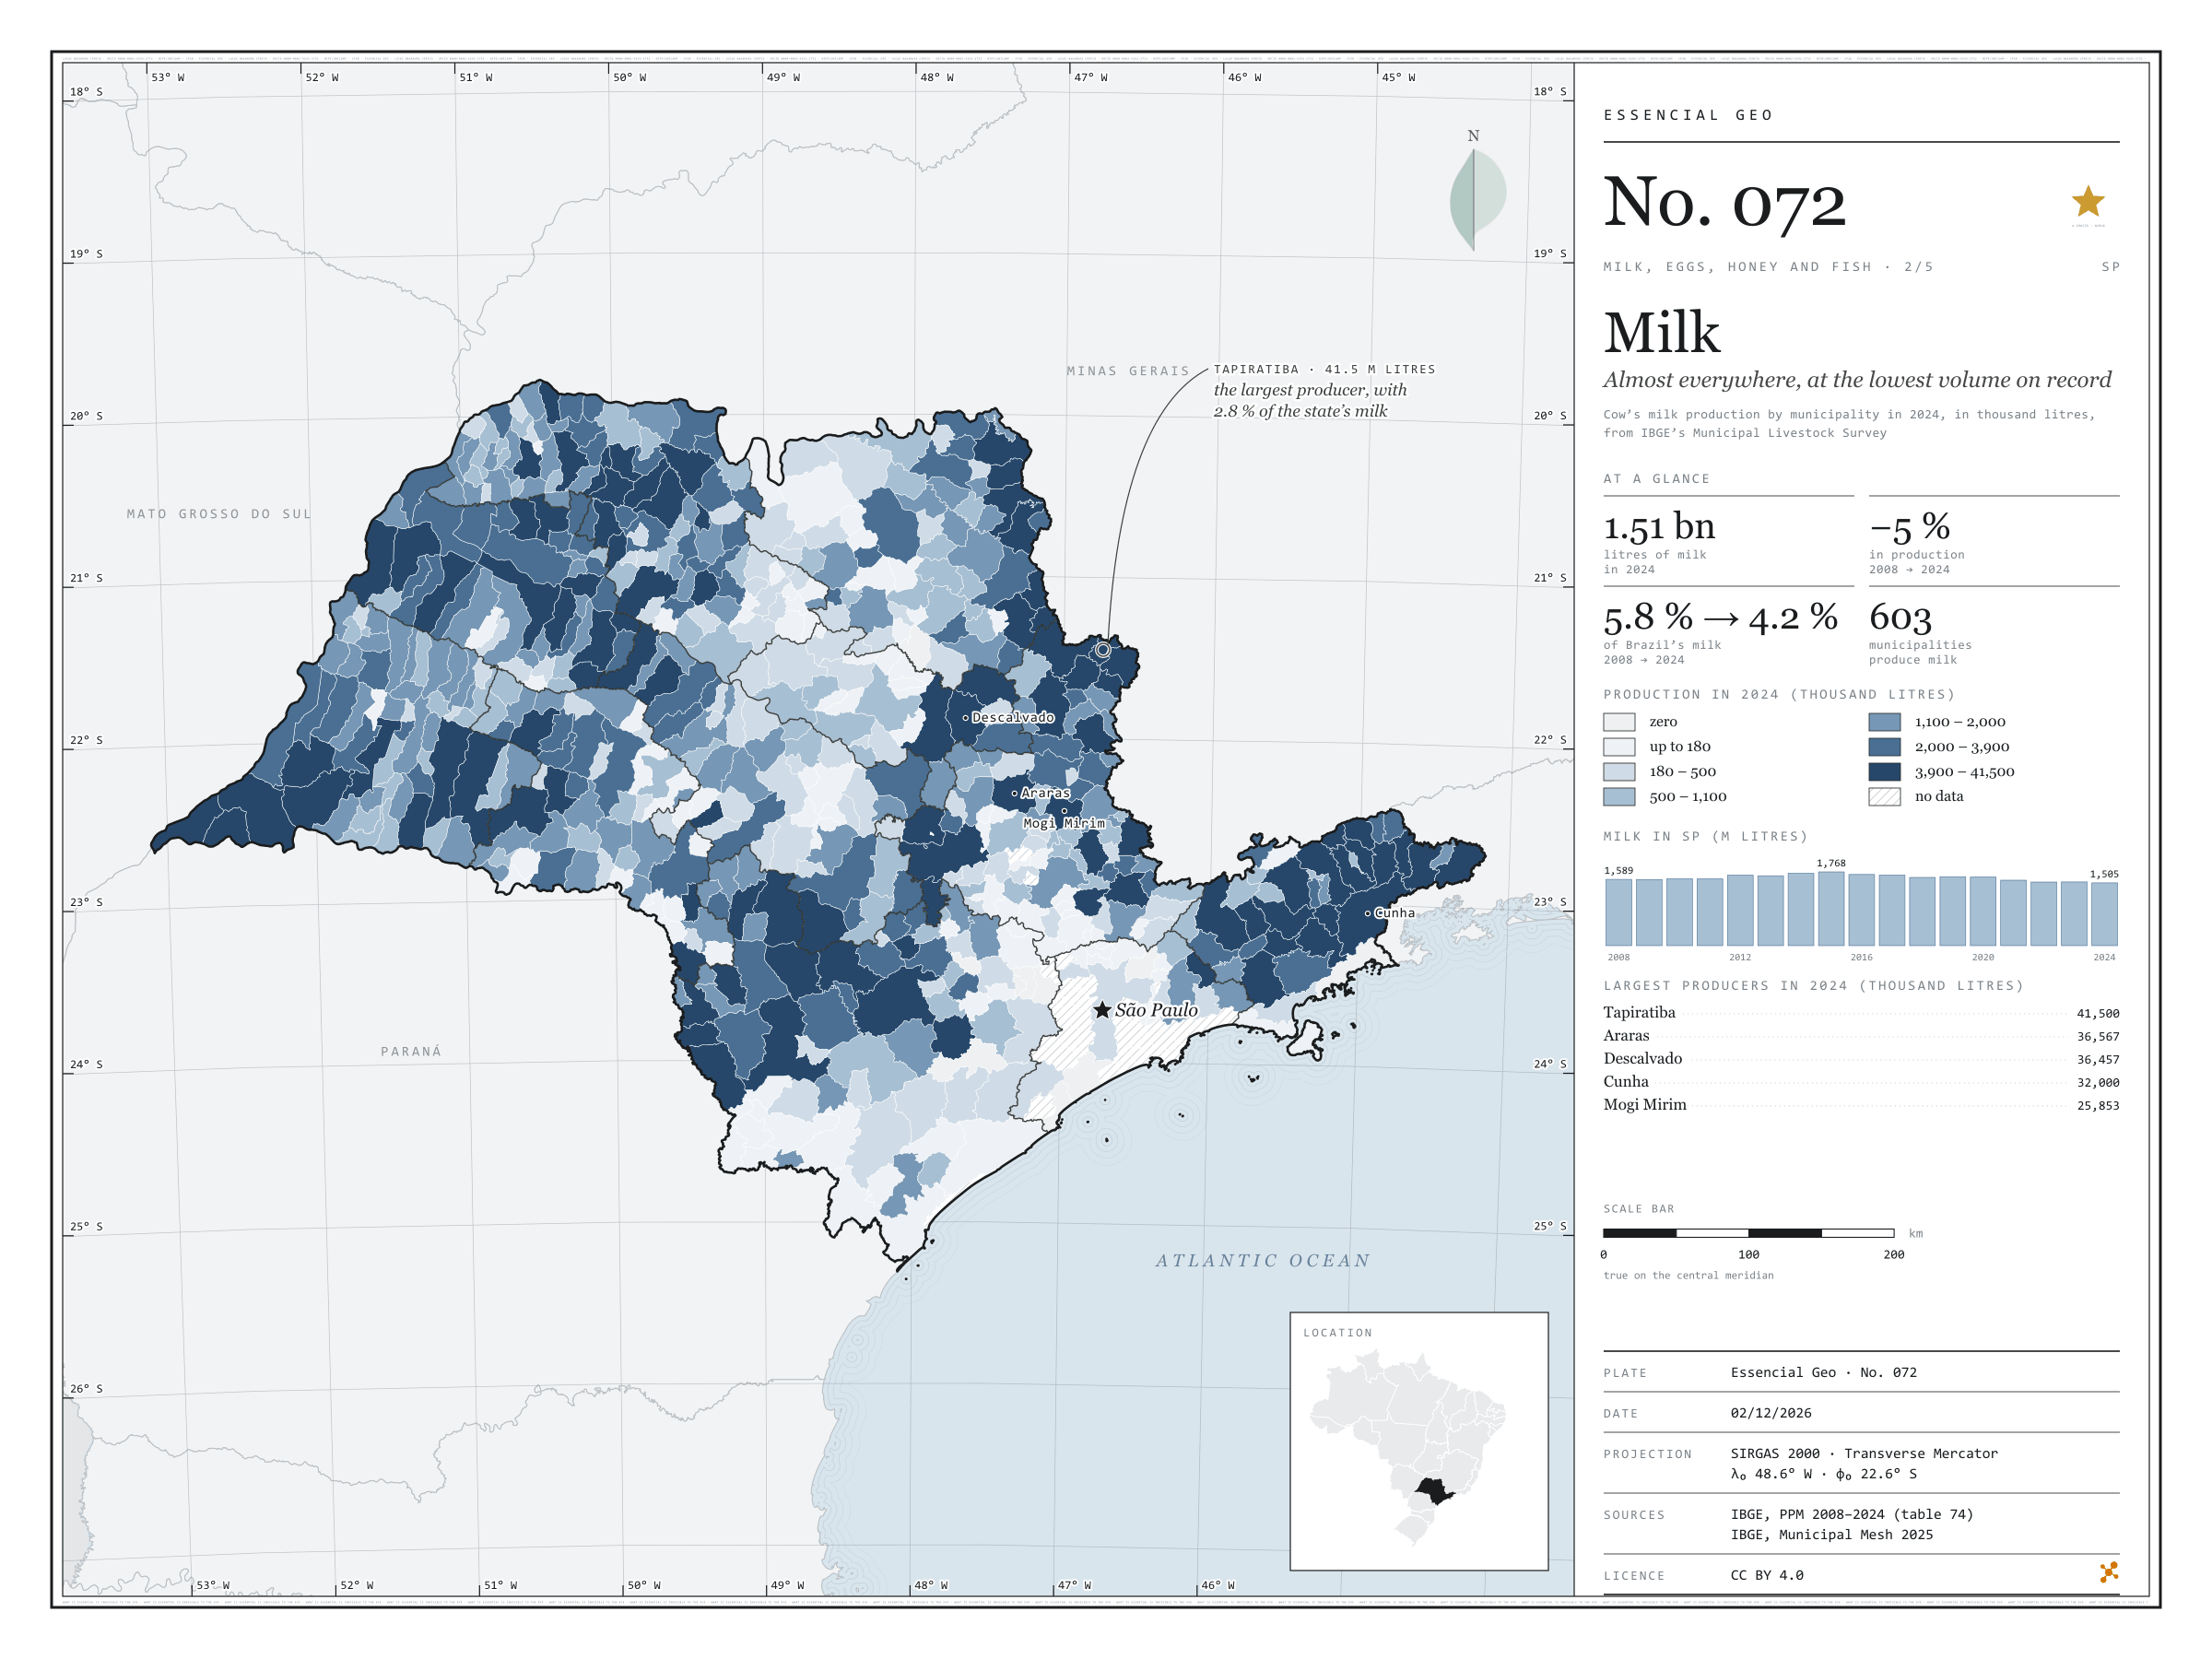
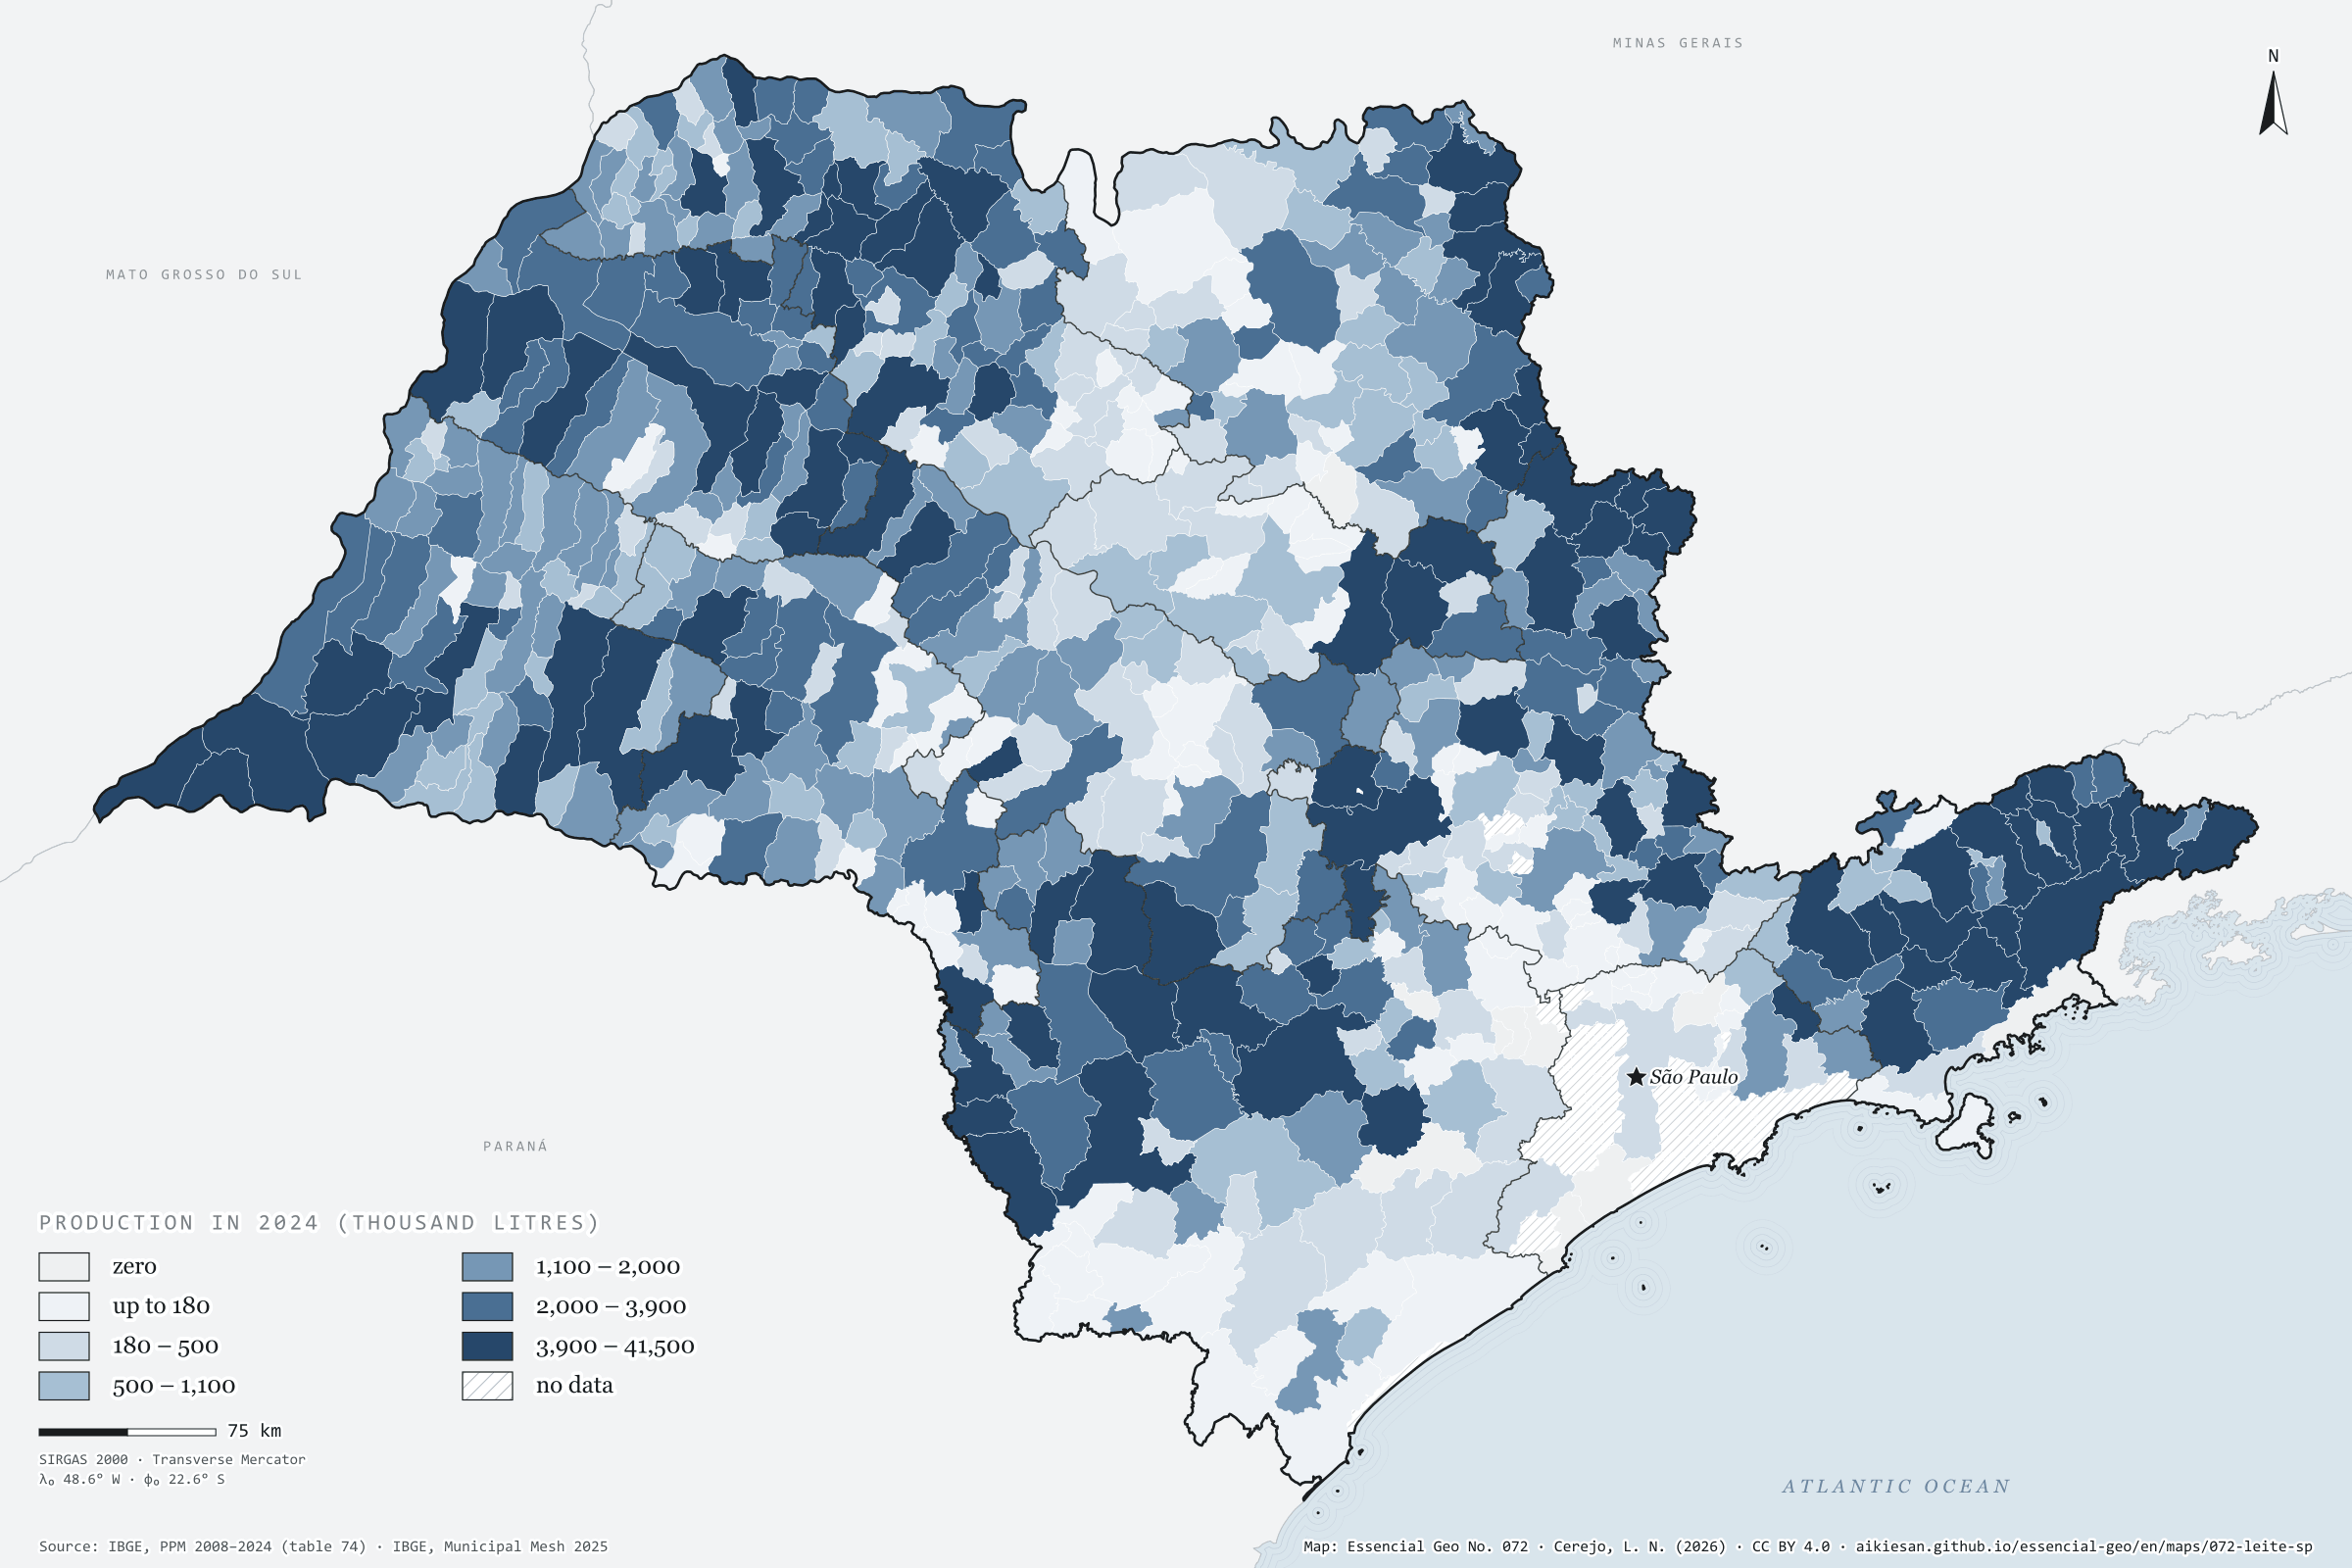
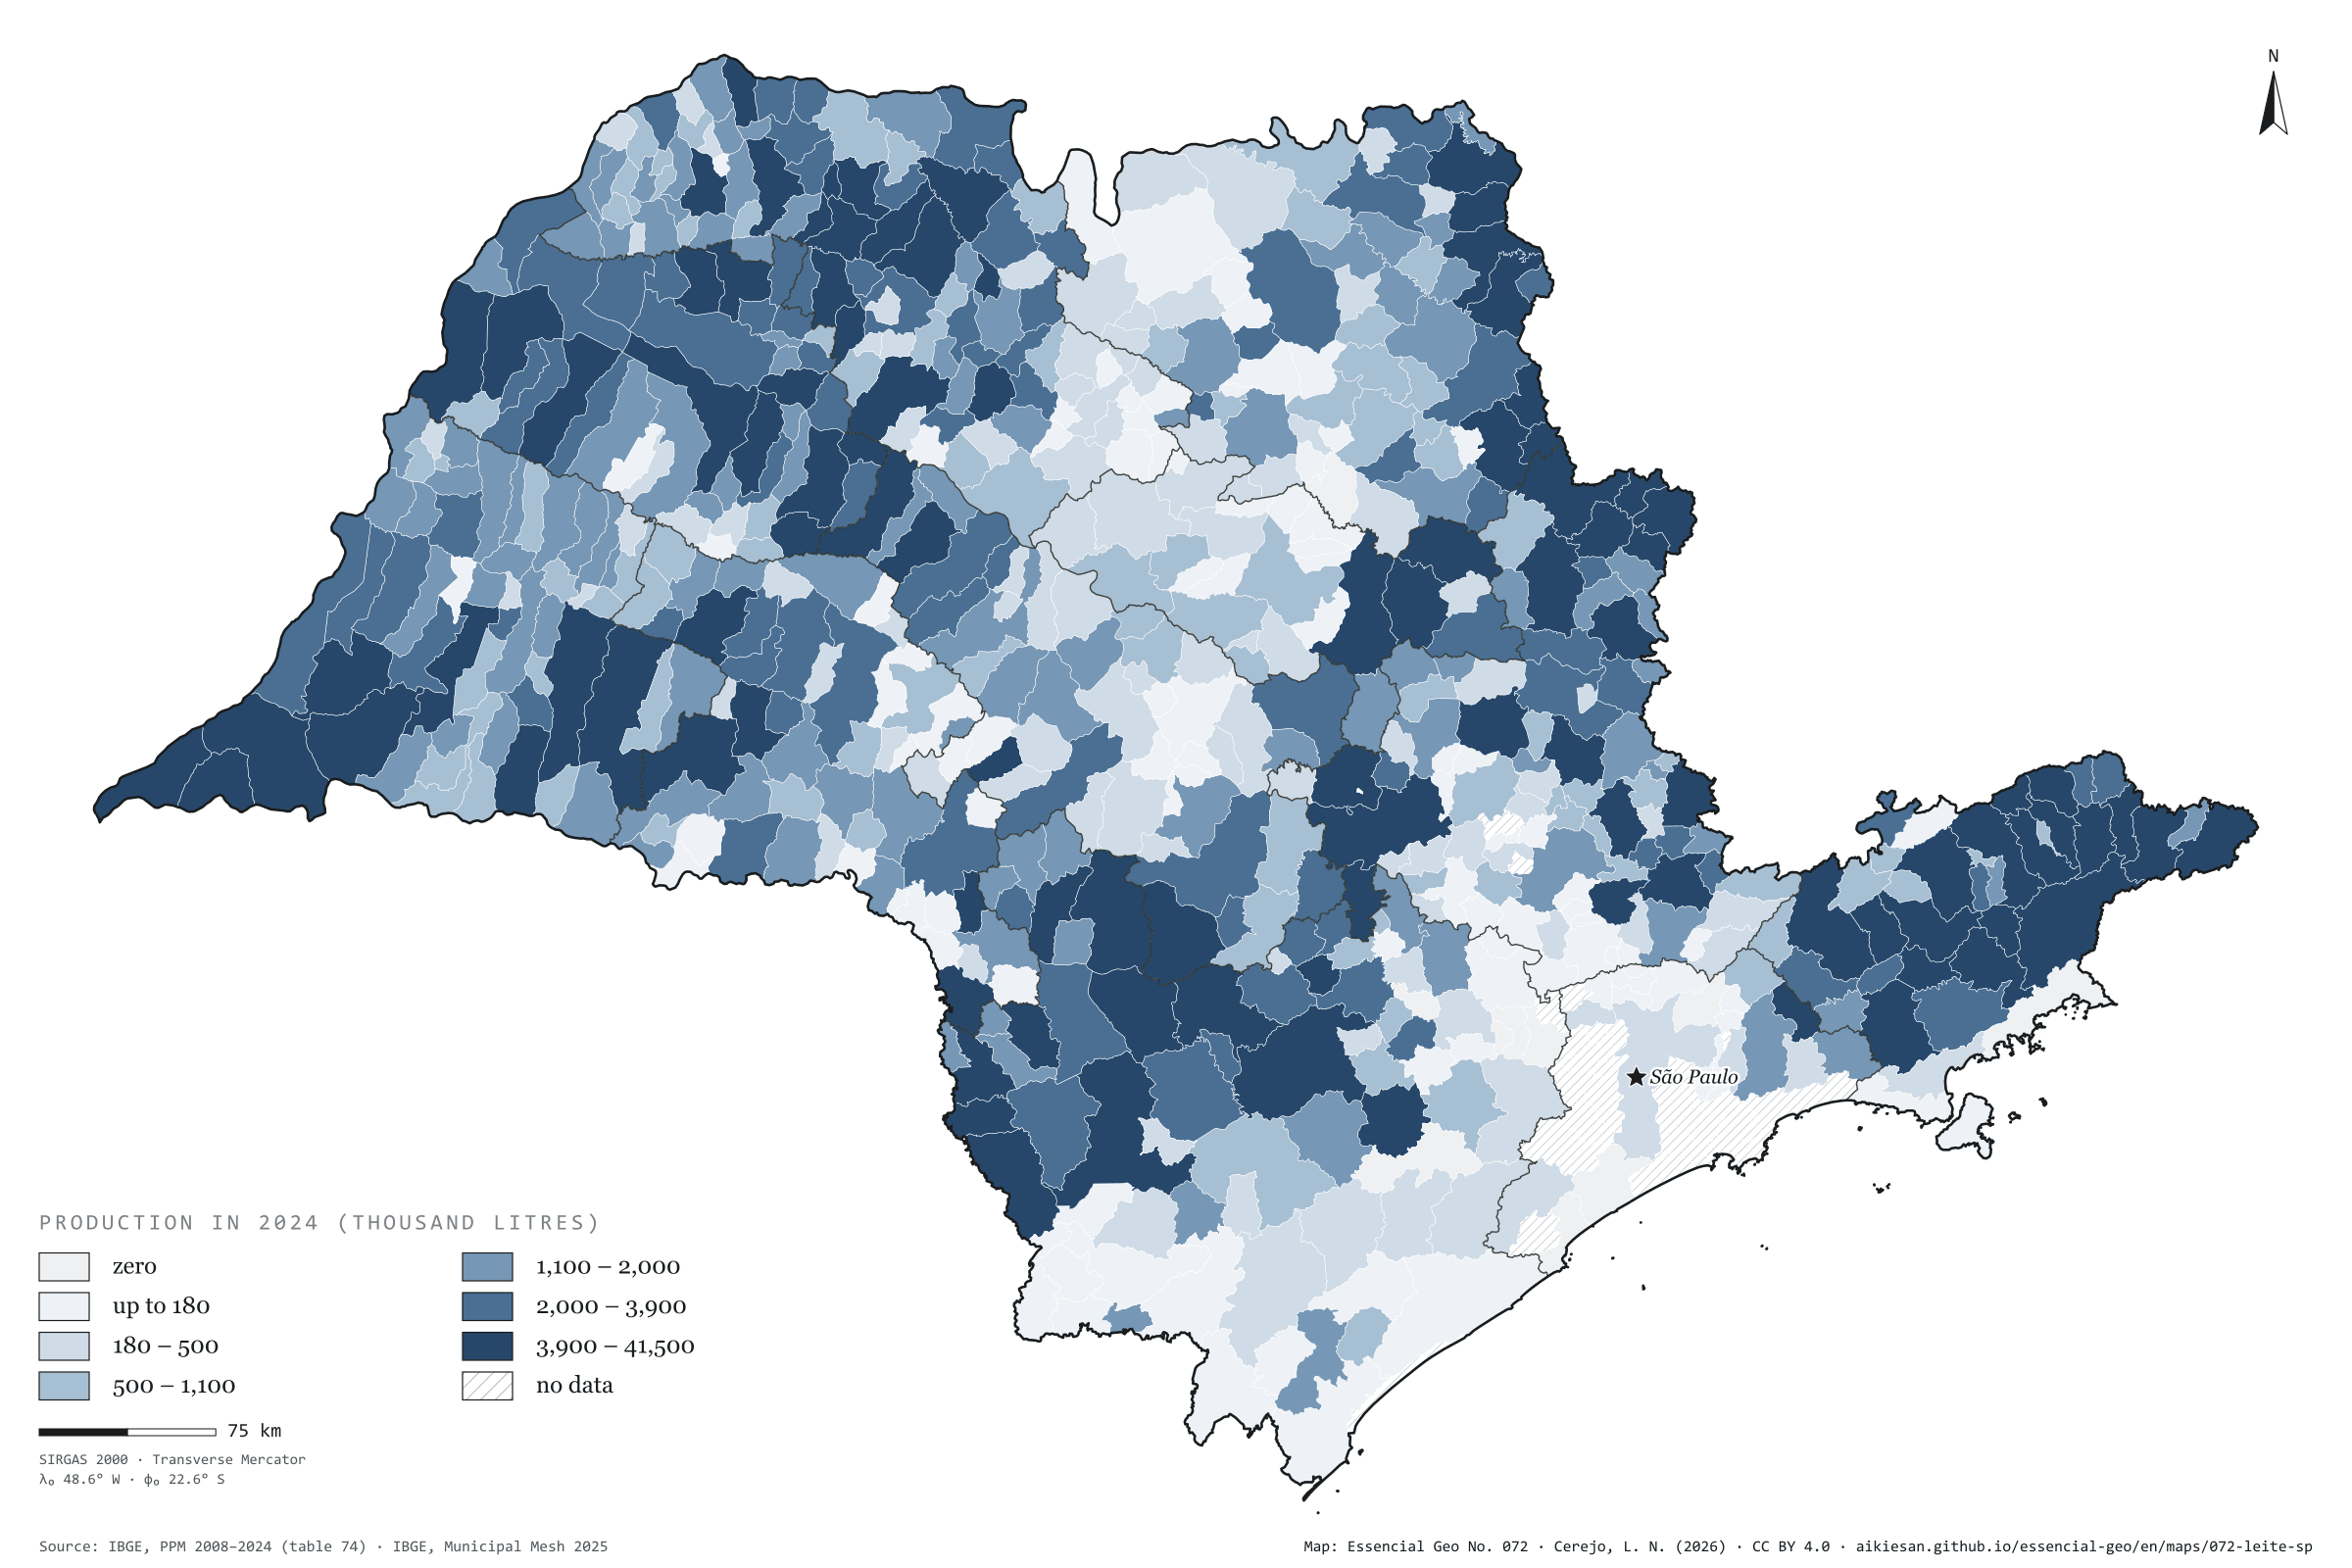
São Paulo produced 1.51 billion litres of cow’s milk in 2024, the lowest volume since 2008. The peak came in 2015, at 1.77 billion; since then production has fallen by 15%, while Brazil’s rose to 35.7 billion litres. The state’s share went from 5.8% in 2008 to 4.2%. Milk is the most widespread animal product in the state: 603 of the 645 municipalities report some, and the ten largest add up to only 18%. Tapiratiba, in the north-east, leads with 41.5 million litres, 2.8% of the total, followed by Araras, Descalvado and Cunha. The darkest tones appear in the west, the north-east and the Paraíba valley, where Cunha and São Luiz do Paraitinga are among the six largest. The Campinas and São José dos Campos regions produce a third of the state’s milk. Second plate of the collection “Milk, eggs, honey and fish”.
Technical record · downloads · citation
At a glance
Cow’s milk in 2024
1,505,077thousand litres
In 2008 it was 1,588,943 thousand litres, and at the 2015 peak 1,768,416; the share of Brazil went from 5.8% to 4.2%
Municipalities producing milk
603
Out of 645; the ten largest account for 17.7% of the total
Largest producers in 2024 (thousand litres)
Tapiratiba41,500
Araras36,567
Descalvado36,457
Cunha32,000
Mogi Mirim25,853
Layers
municipiospolygon645 municipalities: milk production in 2008 and 2024 (thousand litres), data status in 2024 and dairy-cattle biomethane
regioes_intermediariaspolygon11 intermediate geographic regions
Cow’s milk production from PPM 2024 by municipality in six quantile classes; state series from 2008 to 2024; biomethane potential of dairy-cattle manure (in the files only) at the accessible level of the CP2B method.
The map without a frame, with legend, scale, reference system and credit written on it: ready for papers, lectures and slides. In two versions: with the basemap (neighbours and sea) or only the mapped area, on white.
CEREJO, Lucas Nakamura. Leite: em quase todo o estado, no menor volume da série. Versão 1.0.0. [S. l.]: Essencial, 2026. Conjunto de dados. Disponível em: https://aikiesan.github.io/essencial-geo/en/maps/072-leite-sp/. Acesso em: 10 nov. 2026.
Cerejo, L. N. (2026). Leite: em quase todo o estado, no menor volume da série [Milk: Almost everywhere, at the lowest volume on record] (Version 1.0.0) [Data set]. Essencial. https://aikiesan.github.io/essencial-geo/en/maps/072-leite-sp/
@dataset{cerejo2026_leite_sp,
  author    = {Cerejo, Lucas Nakamura},
  title     = {Leite: Em quase todo o estado, no menor volume da série},
  year      = {2026},
  publisher = {Essencial},
  version   = {1.0.0},
  url       = {https://aikiesan.github.io/essencial-geo/en/maps/072-leite-sp/},
  language  = {portuguese},
  note      = {English title: Milk: Almost everywhere, at the lowest volume on record. Licence CC BY 4.0}
}
Fig. 071São Paulo state (SP)EPSG:4674Source: IBGE, CP2B (Unicamp)
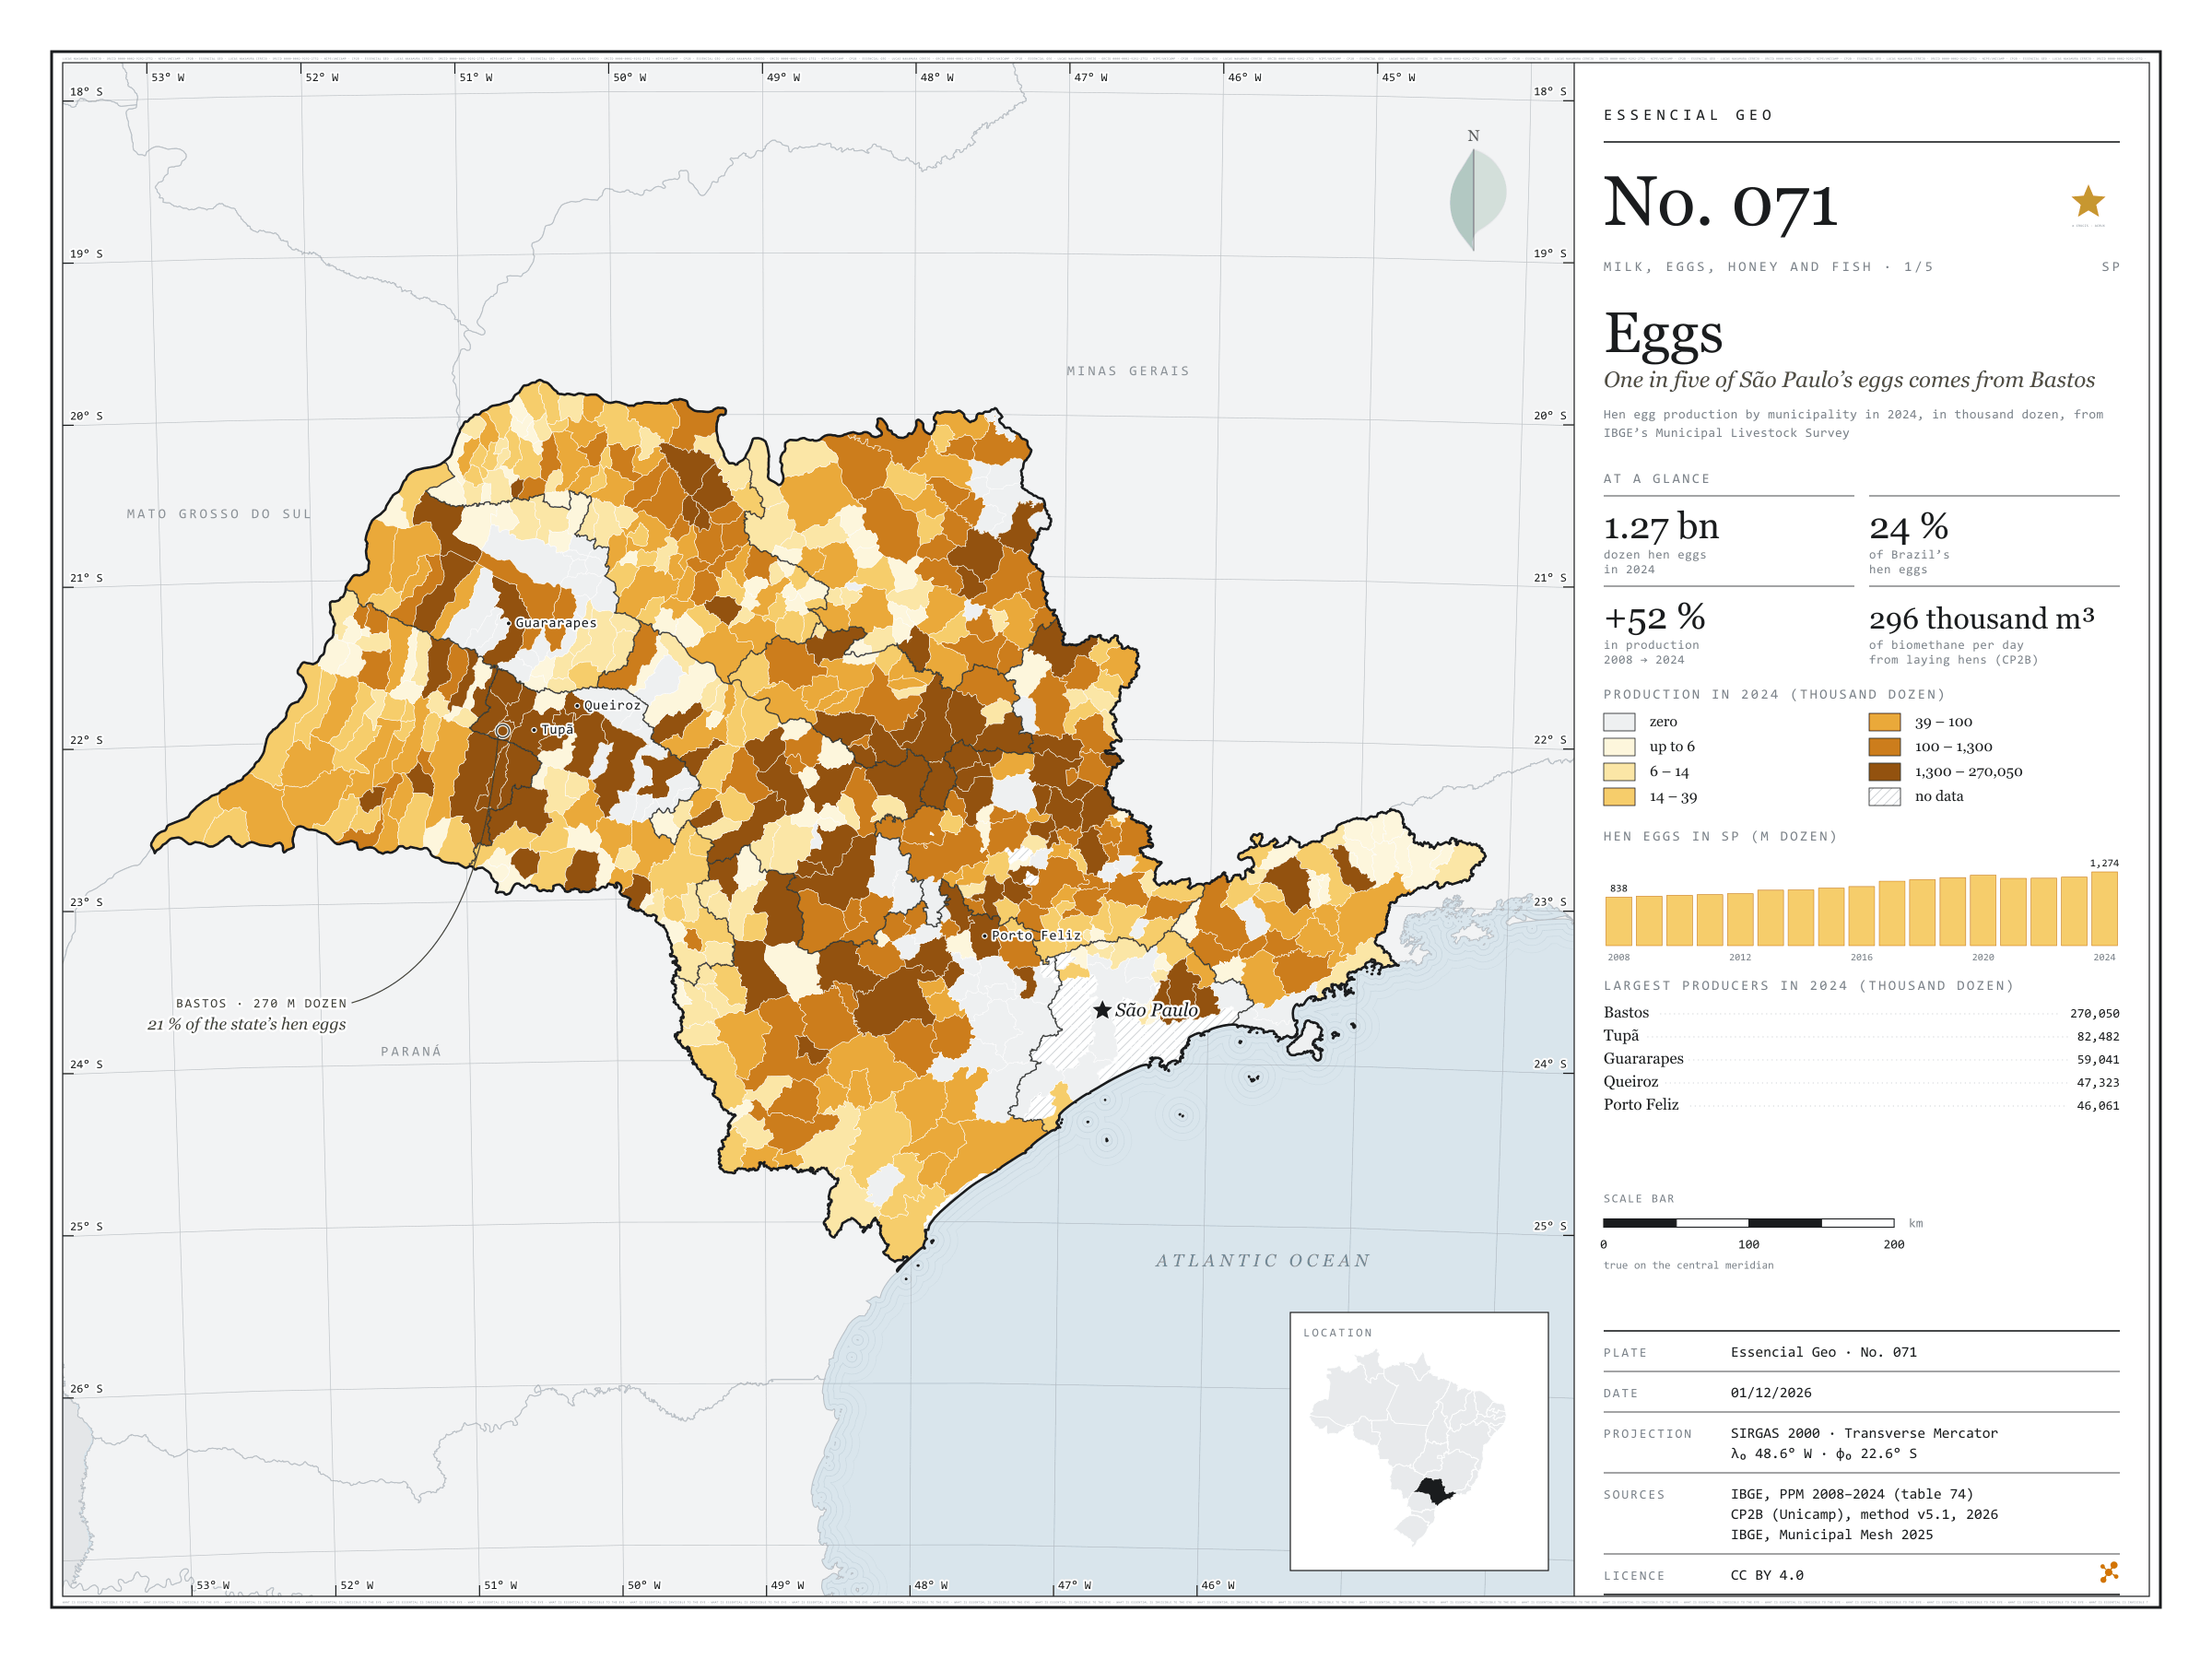
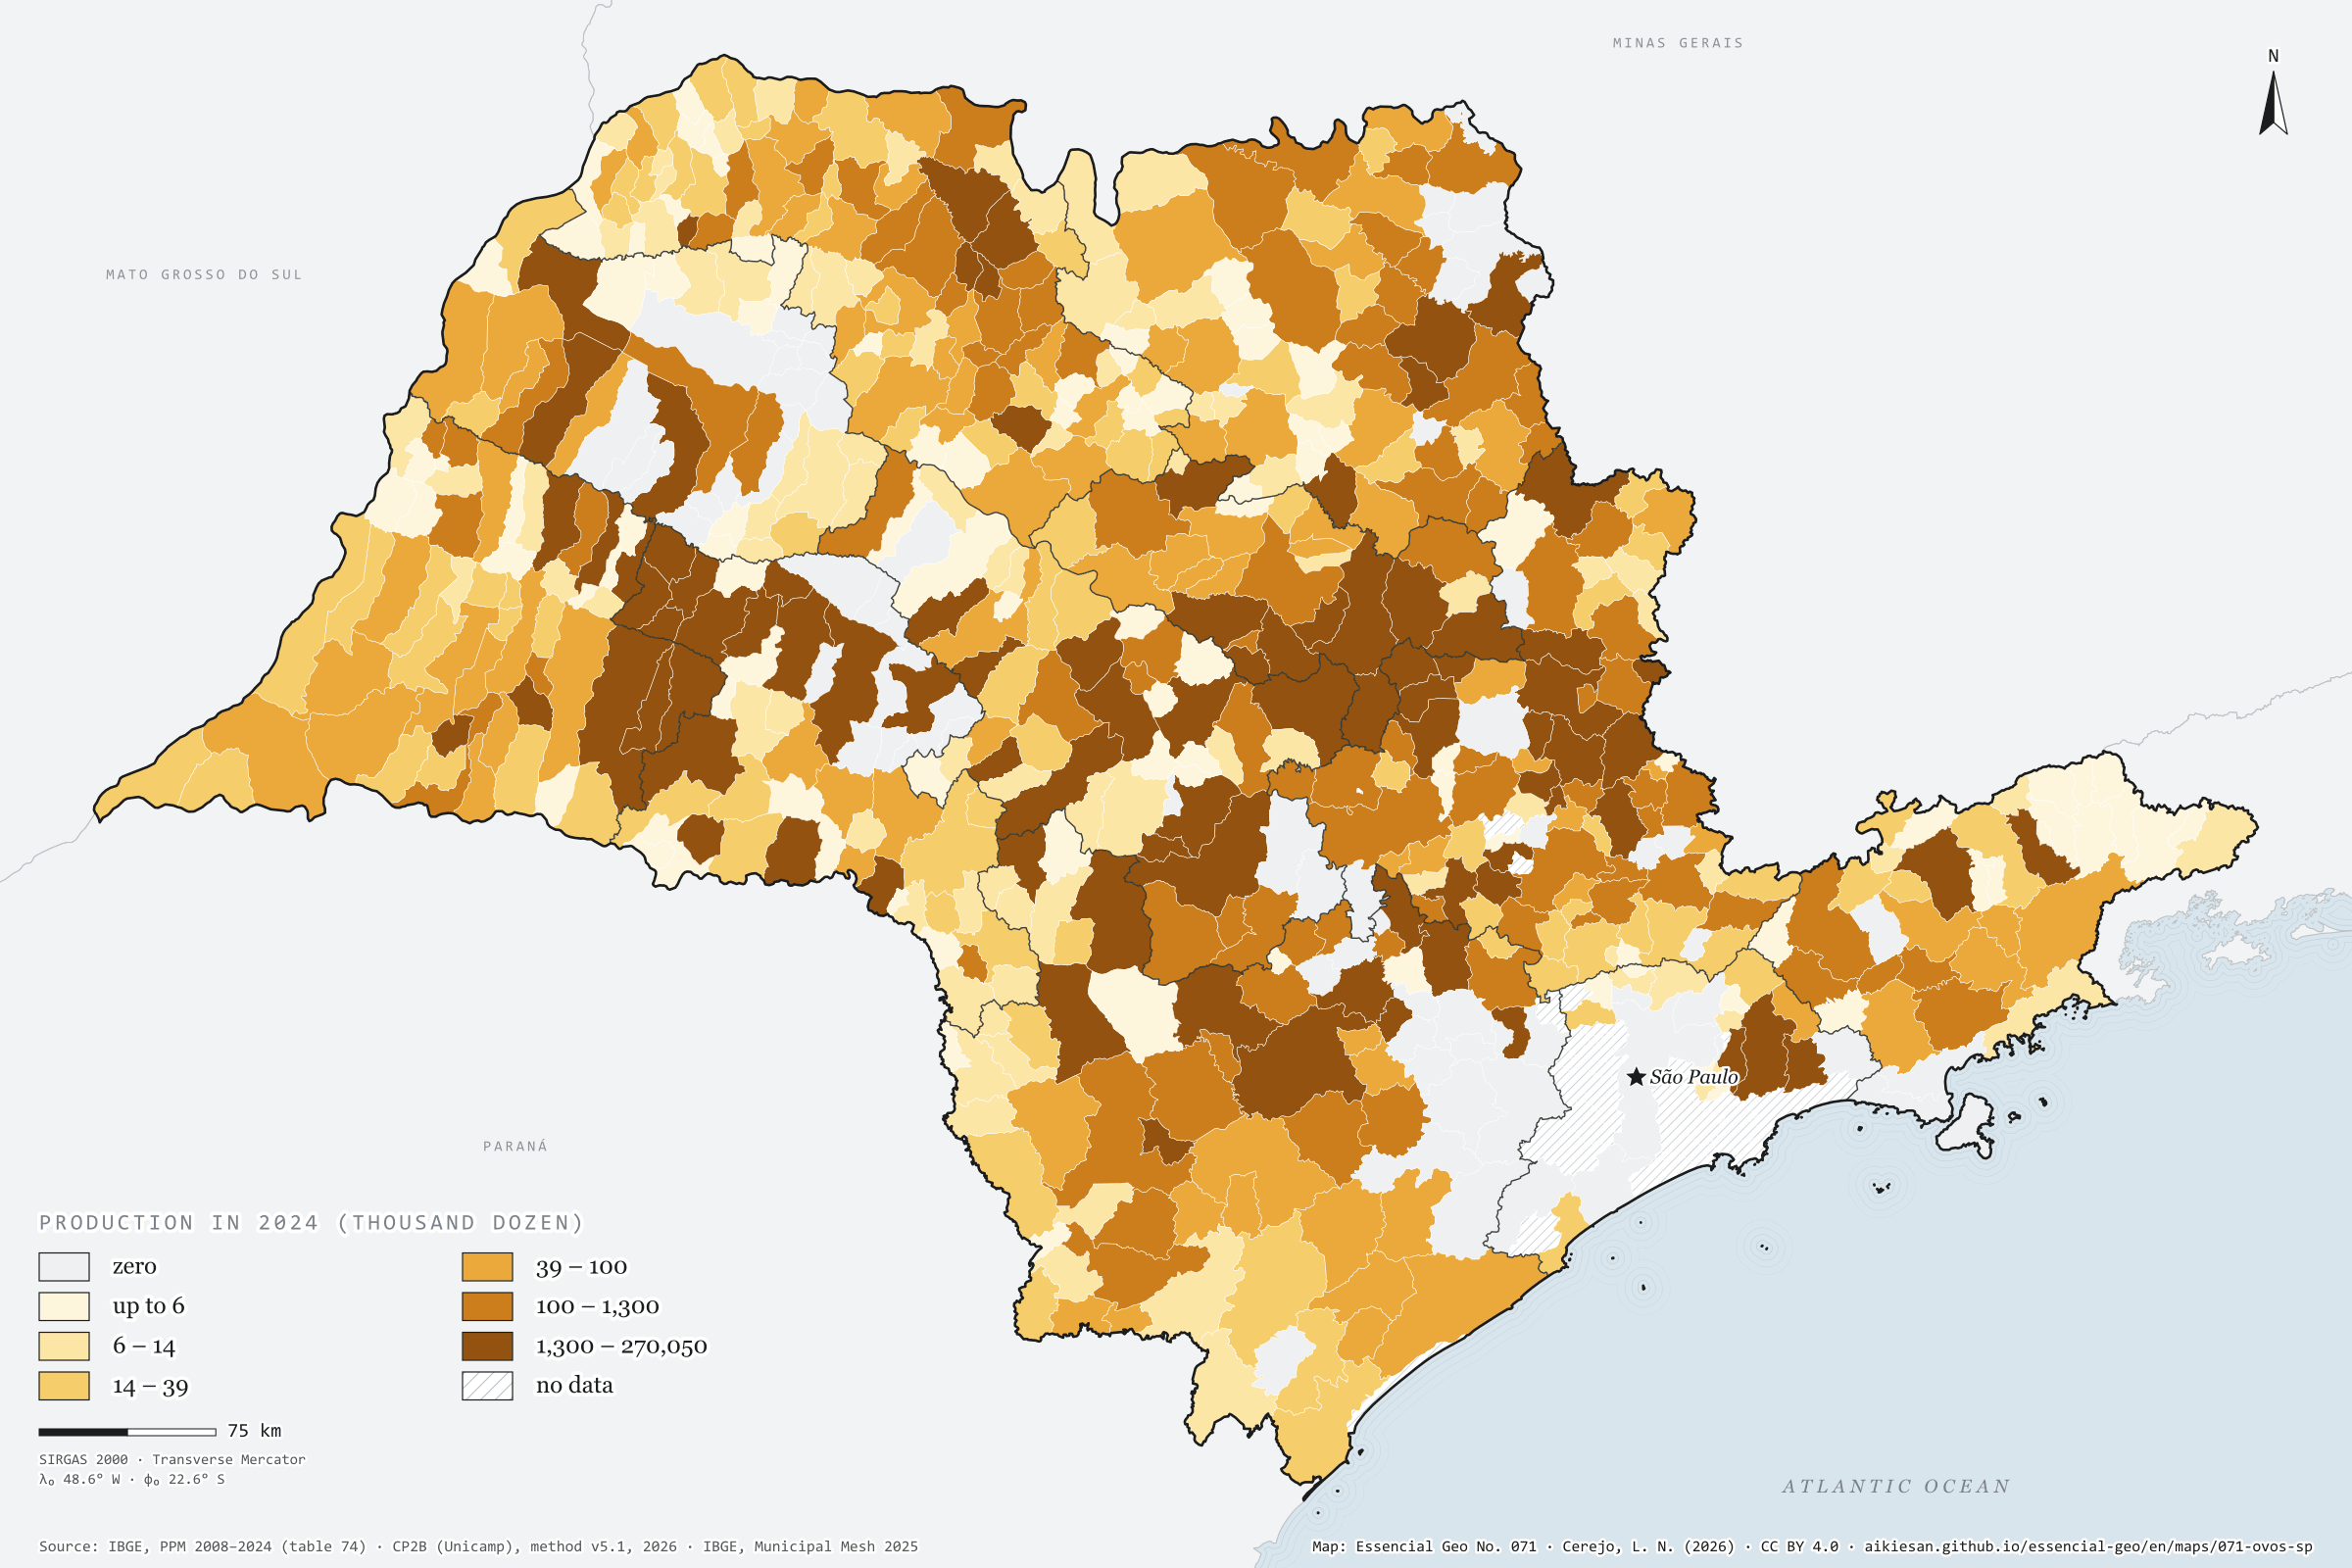
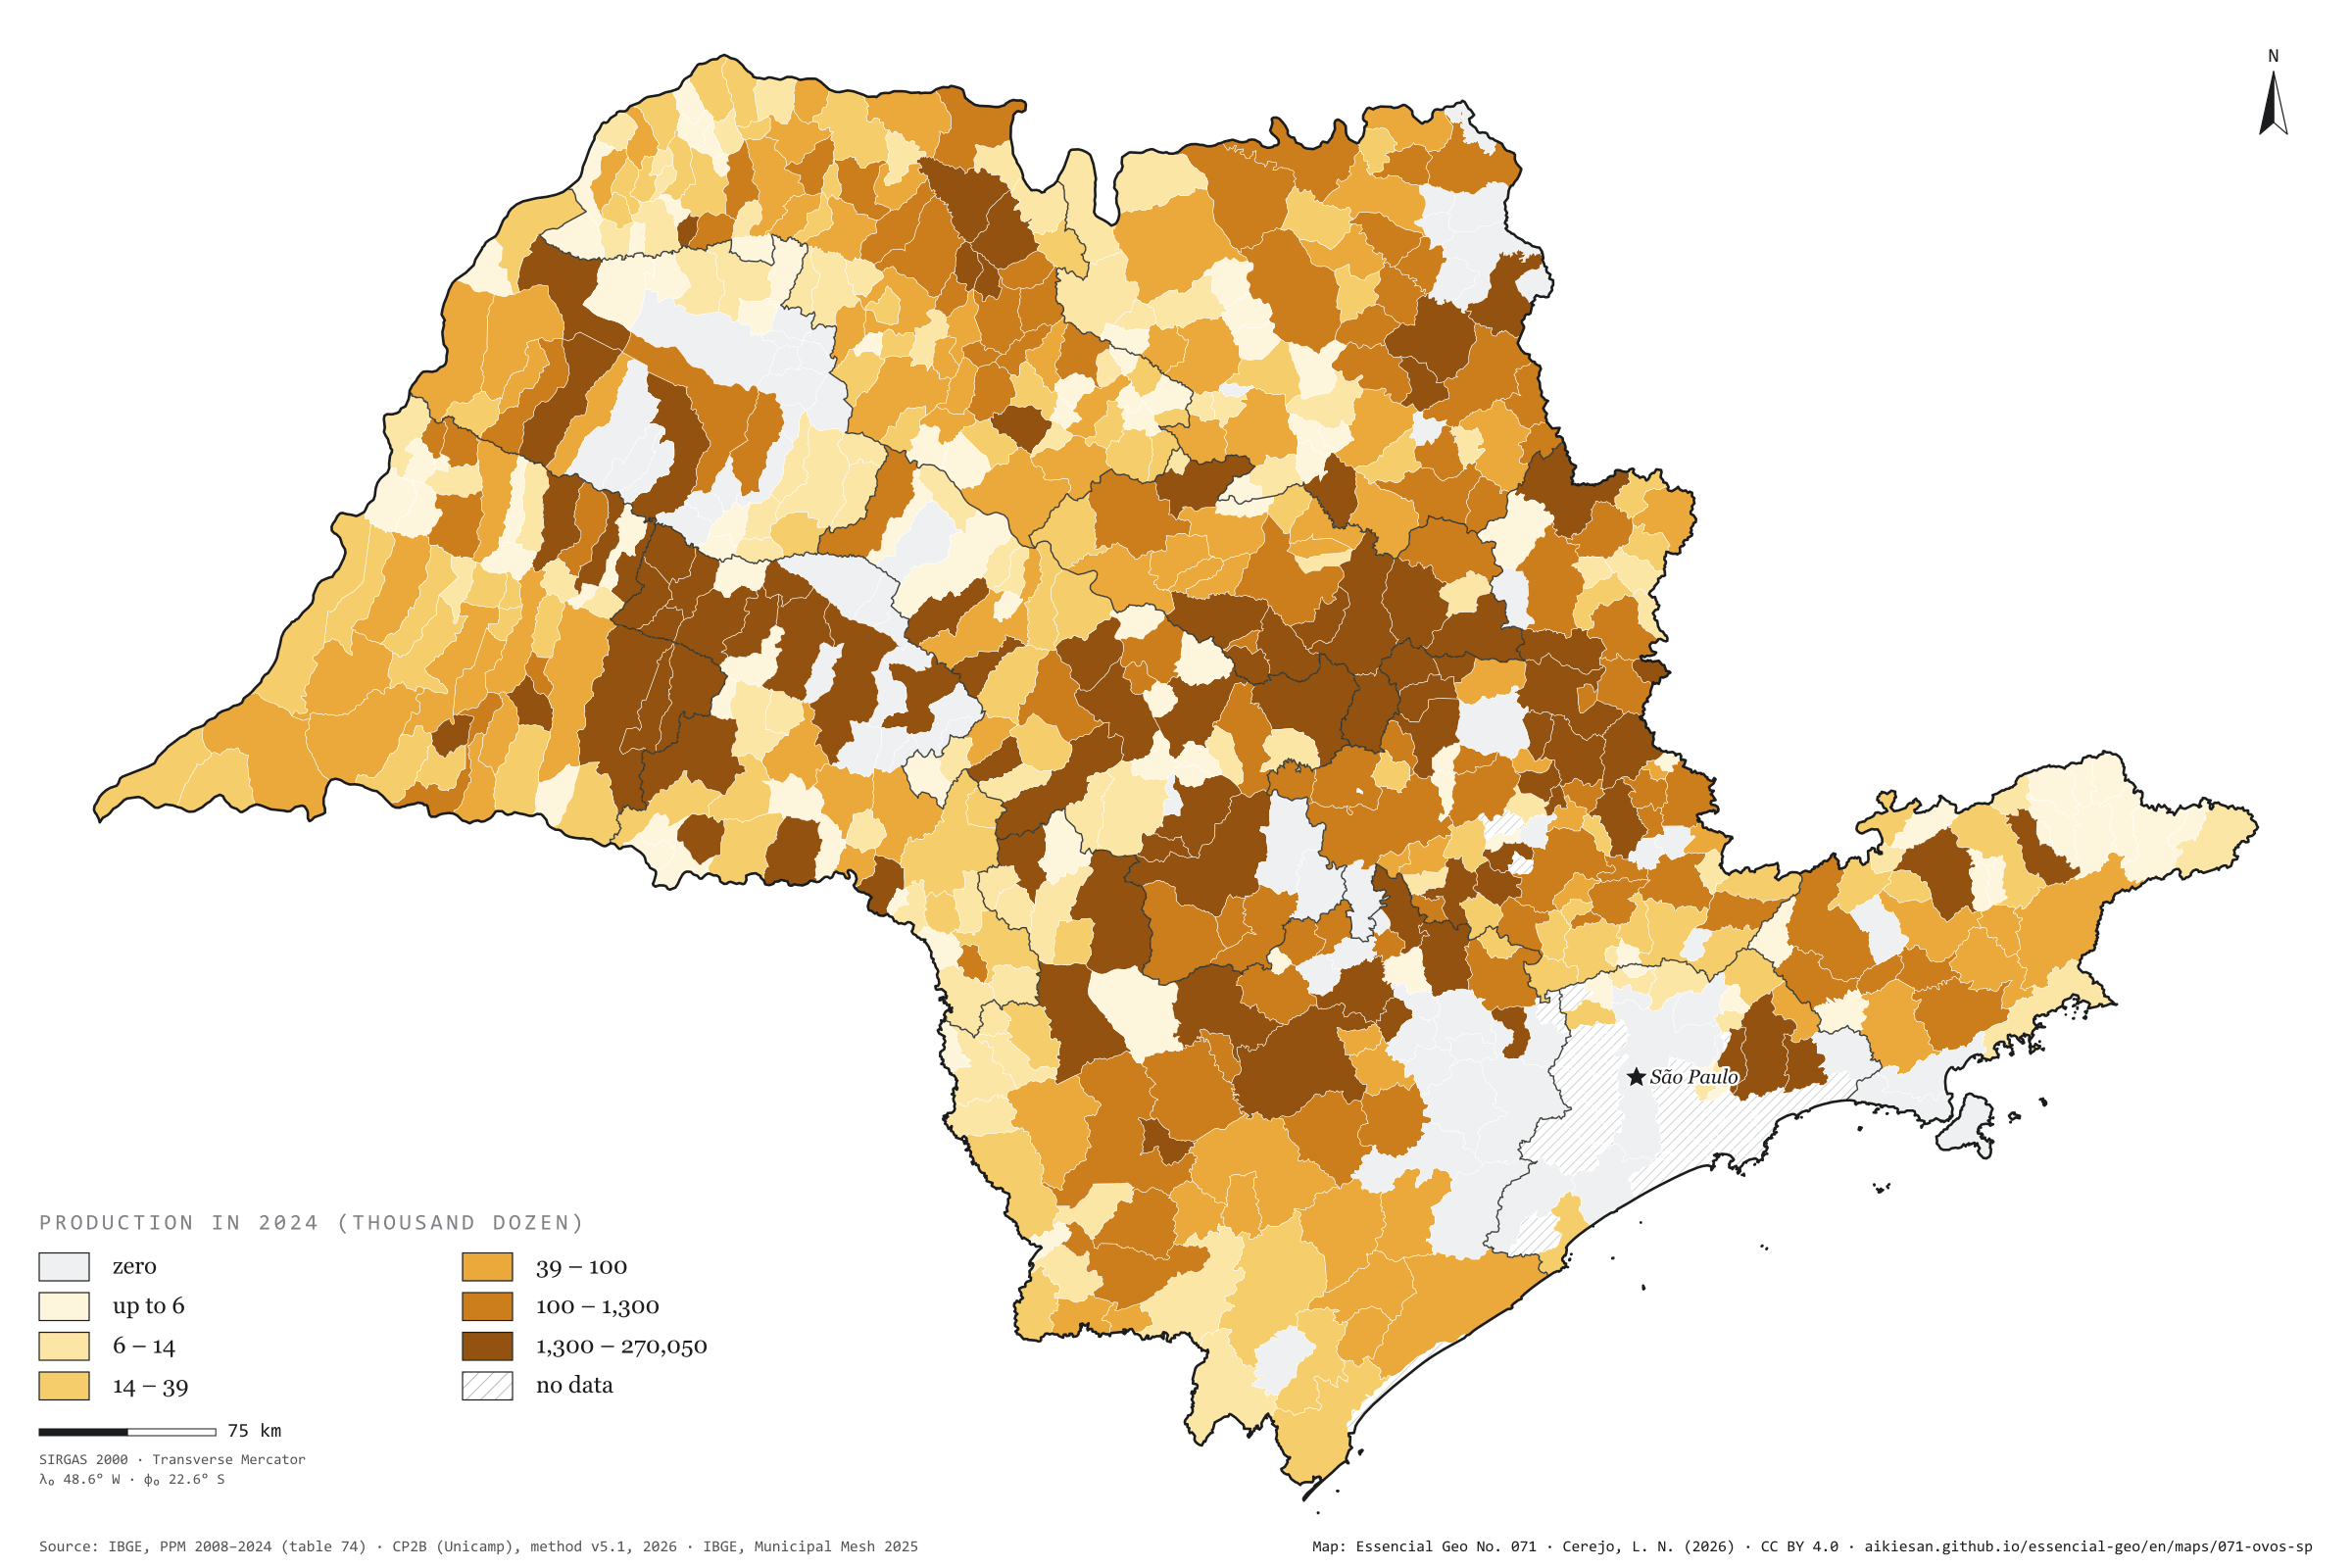
São Paulo produced 1.27 billion dozen hen eggs in 2024, 52% more than in 2008 and 23.6% of Brazil’s total. Bastos alone, in the Marília region, produced 270 million dozen, one in five of the state’s eggs. With Tupã and its neighbours, the Marília region accounts for 42% of production, and the ten largest municipalities for 54%. Even so, 540 municipalities report some production, and eggs appear across almost the whole map; only Greater São Paulo and the coast lack data. Laying-hen manure is also a residue: by the CP2B method it could yield 296,000 m³ of biomethane a day across the state, 62,600 of them in Bastos. Quail eggs went the other way, falling from 82.8 to 37.3 million dozen. First plate of the collection “Milk, eggs, honey and fish”.
Technical record · downloads · citation
At a glance
Hen eggs in 2024
1,274,158thousand dozen
In 2008 it was 837,888 thousand dozen; the share of Brazil went from 27.3% to 23.6%
Biomethane from laying-hen manure
296,316m³/day
Accessible level of the CP2B method, reference scenario; 62,572 m³/day in Bastos
Largest producers in 2024 (thousand dozen)
Bastos270,050
Tupã82,482
Guararapes59,041
Queiroz47,323
Porto Feliz46,061
Layers
municipiospolygon645 municipalities: hen egg production in 2008 and 2024 (thousand dozen), data status in 2024 and laying-hen biomethane
regioes_intermediariaspolygon11 intermediate geographic regions
Hen egg production from PPM 2024 by municipality in six quantile classes; state series from 2008 to 2024; biomethane potential of laying-hen manure at the accessible level of the CP2B method.
The map without a frame, with legend, scale, reference system and credit written on it: ready for papers, lectures and slides. In two versions: with the basemap (neighbours and sea) or only the mapped area, on white.
CEREJO, Lucas Nakamura. Ovos: um em cada cinco ovos paulistas sai de Bastos. Versão 1.0.0. [S. l.]: Essencial, 2026. Conjunto de dados. Disponível em: https://aikiesan.github.io/essencial-geo/en/maps/071-ovos-sp/. Acesso em: 10 nov. 2026.
Cerejo, L. N. (2026). Ovos: um em cada cinco ovos paulistas sai de Bastos [Eggs: One in five of São Paulo’s eggs comes from Bastos] (Version 1.0.0) [Data set]. Essencial. https://aikiesan.github.io/essencial-geo/en/maps/071-ovos-sp/
@dataset{cerejo2026_ovos_sp,
  author    = {Cerejo, Lucas Nakamura},
  title     = {Ovos: Um em cada cinco ovos paulistas sai de Bastos},
  year      = {2026},
  publisher = {Essencial},
  version   = {1.0.0},
  url       = {https://aikiesan.github.io/essencial-geo/en/maps/071-ovos-sp/},
  language  = {portuguese},
  note      = {English title: Eggs: One in five of São Paulo’s eggs comes from Bastos. Licence CC BY 4.0}
}
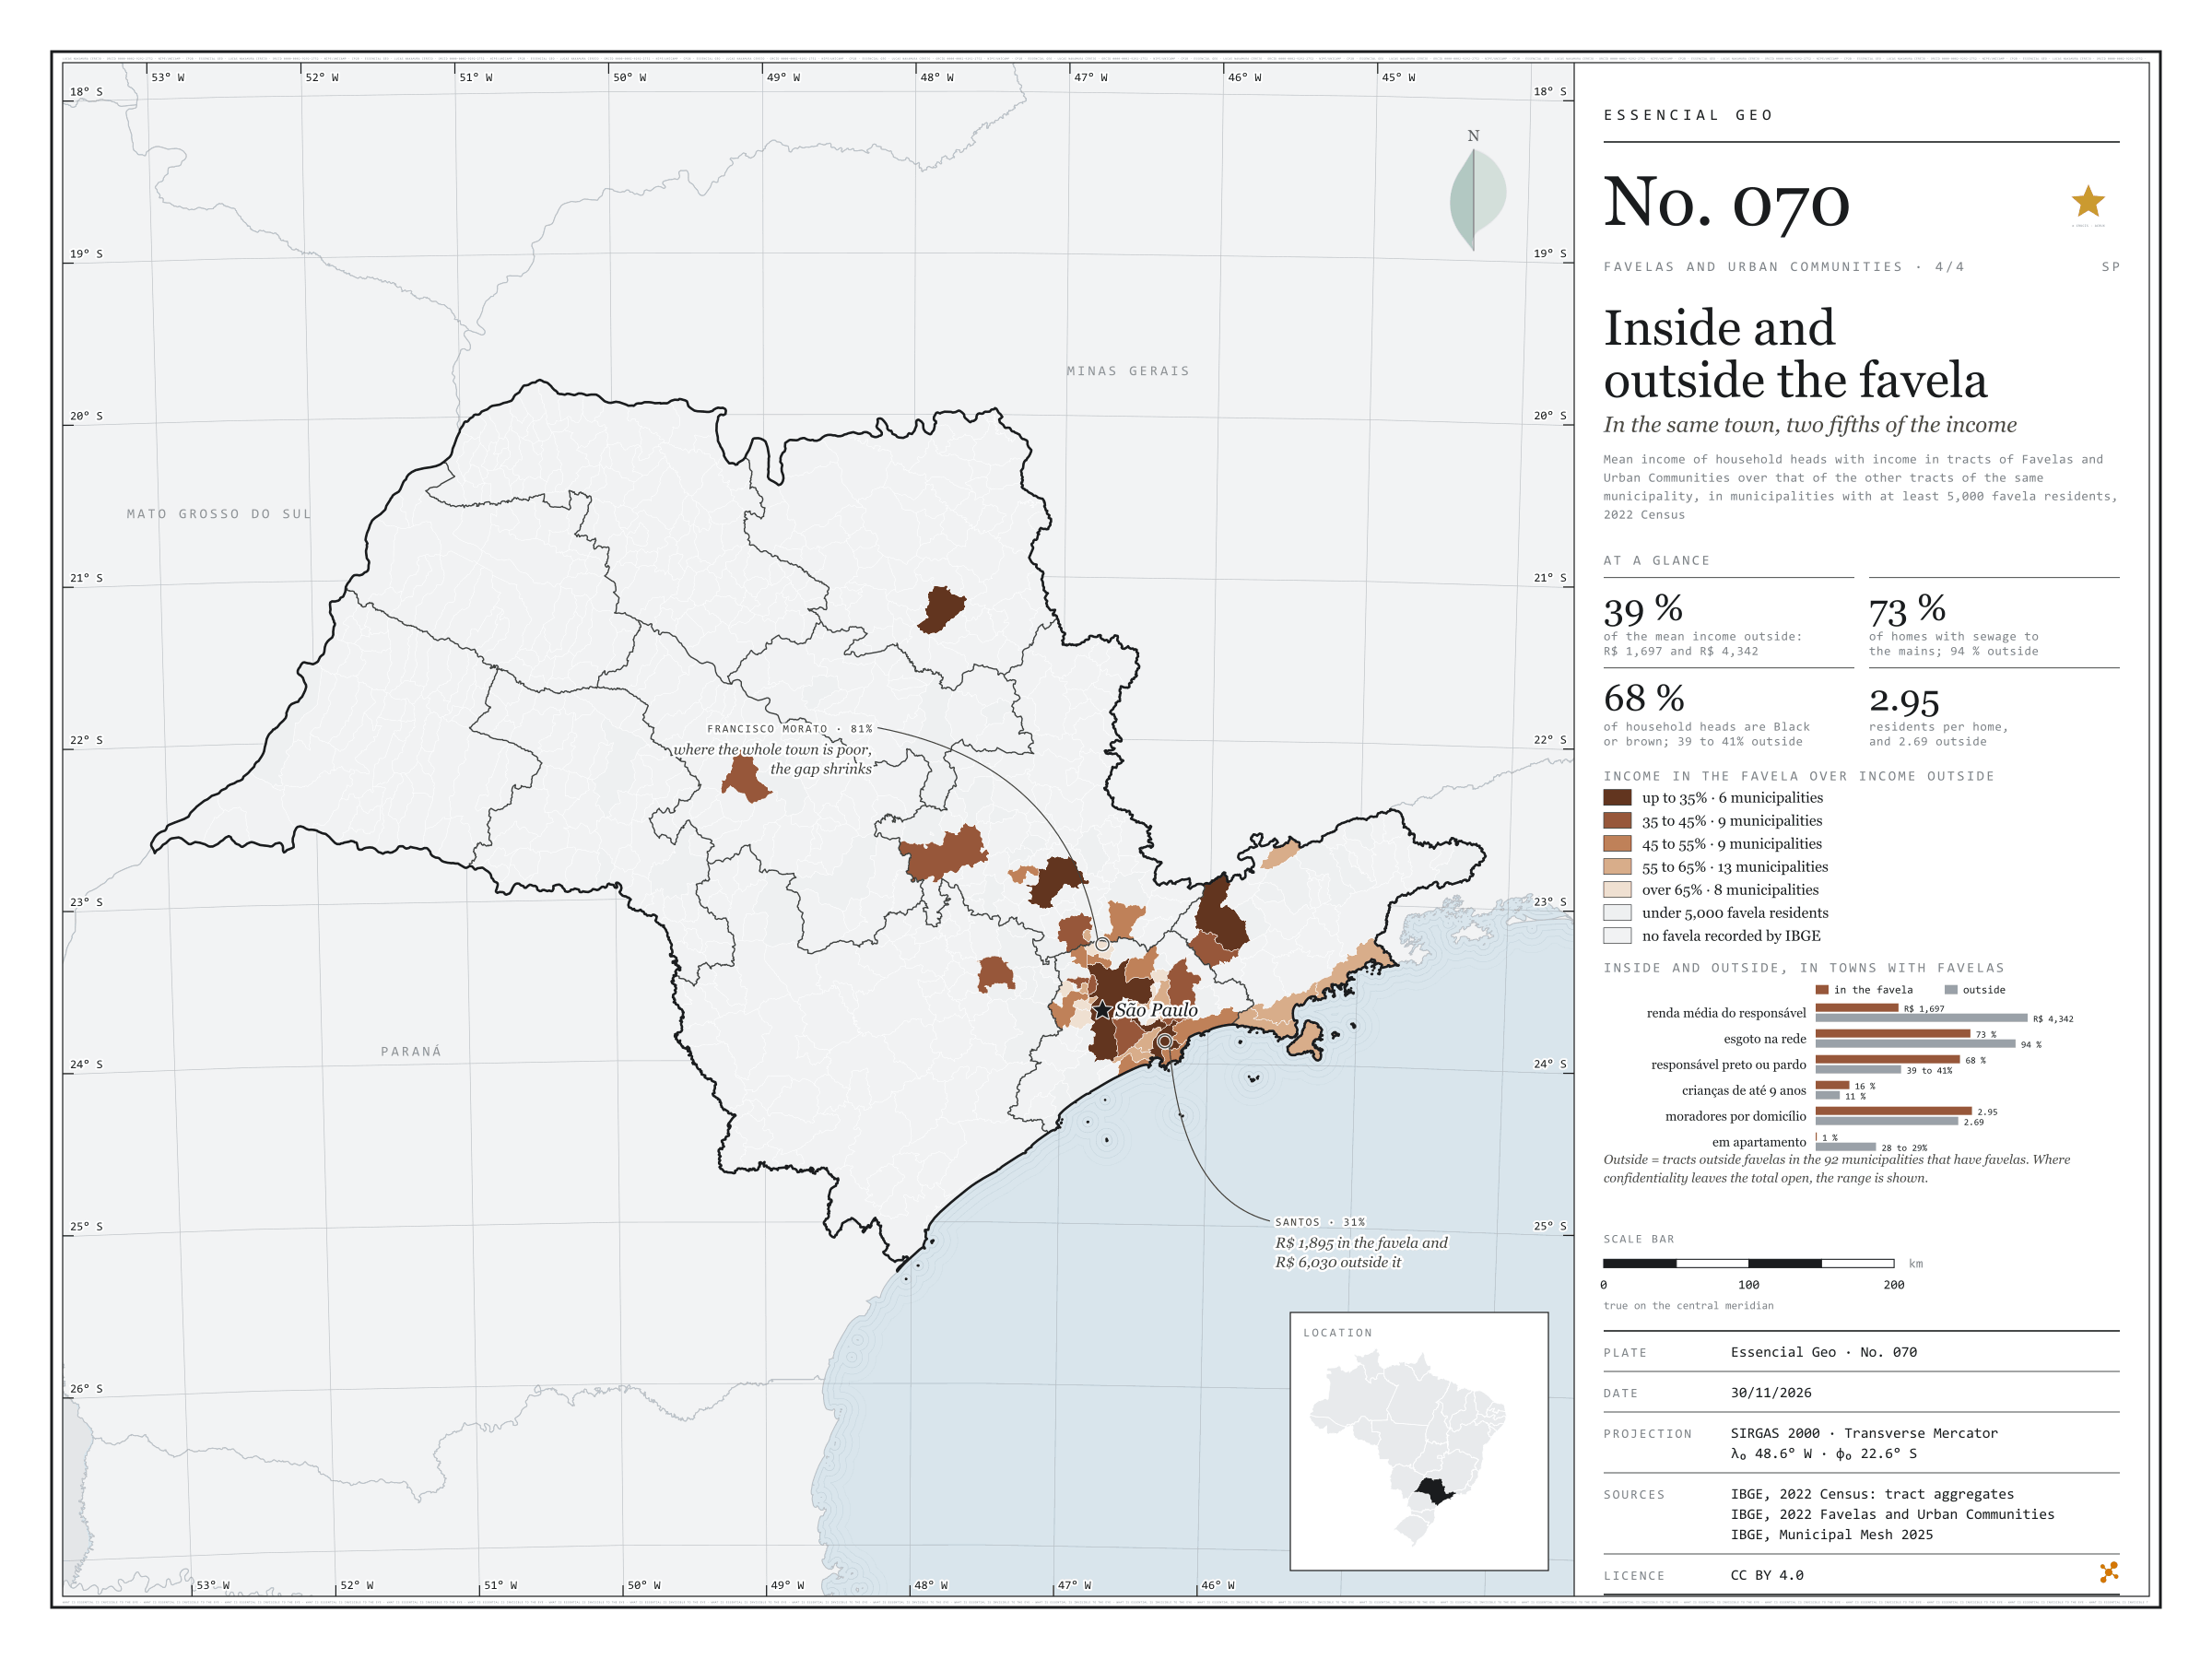
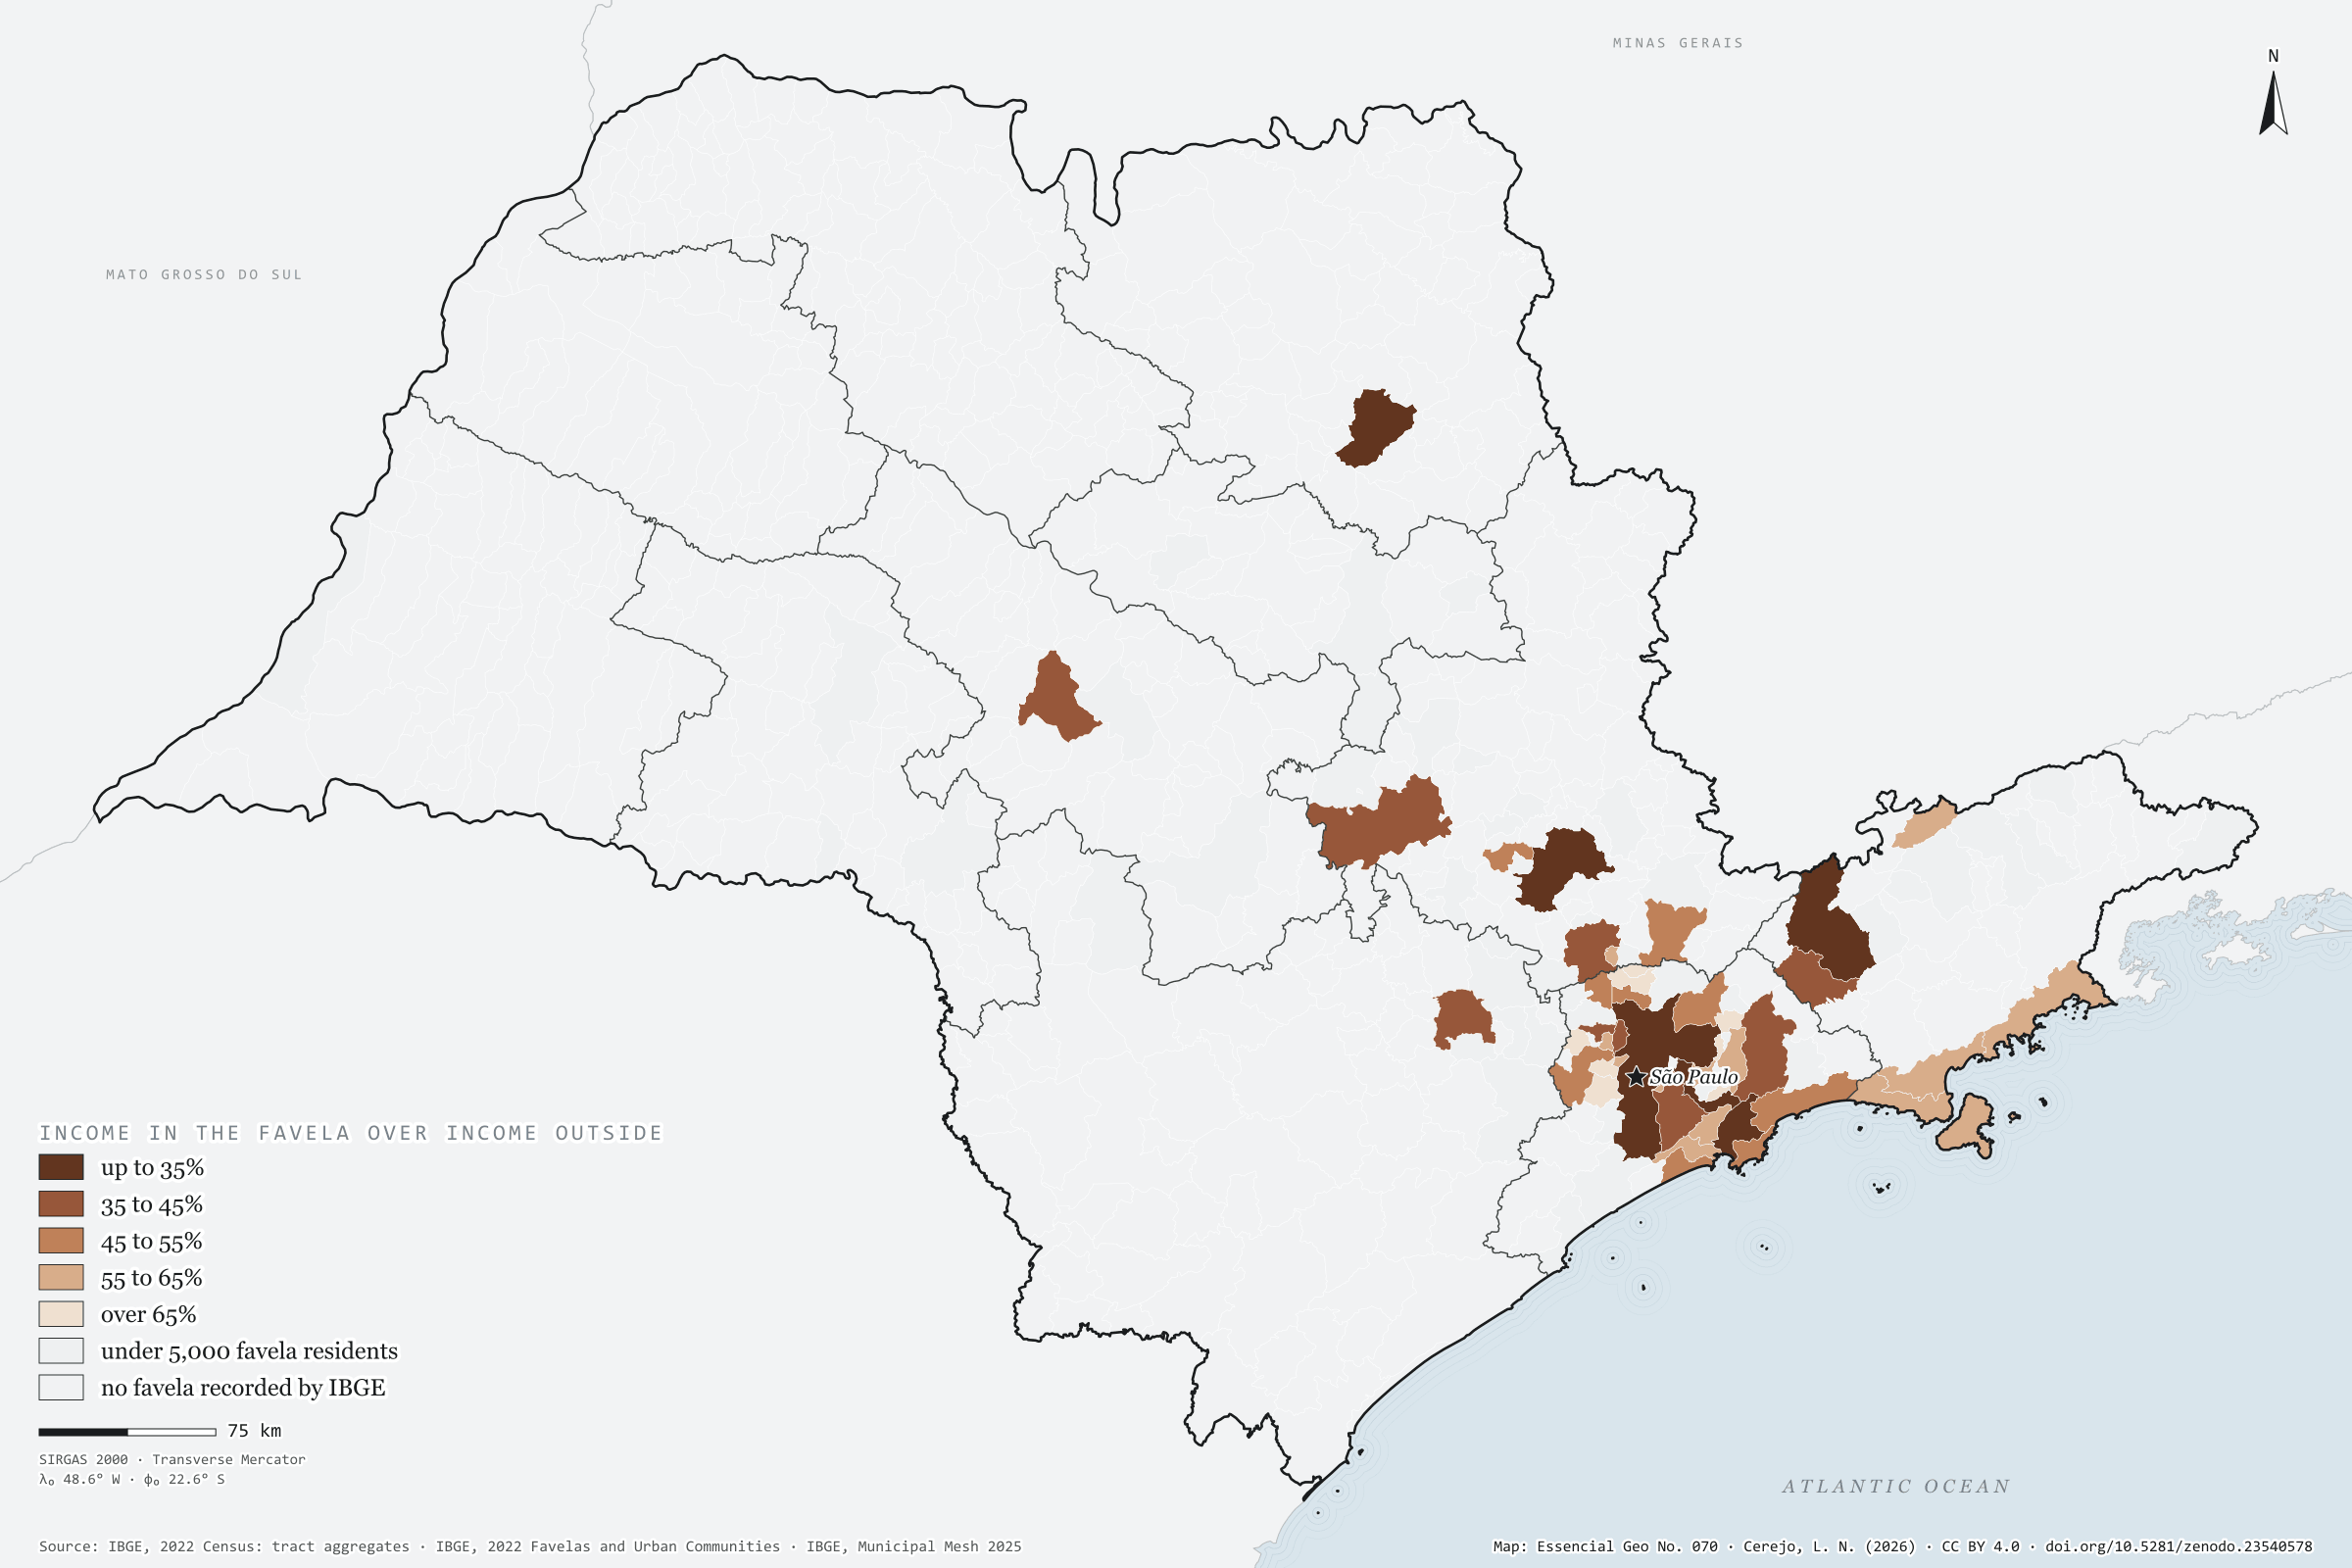
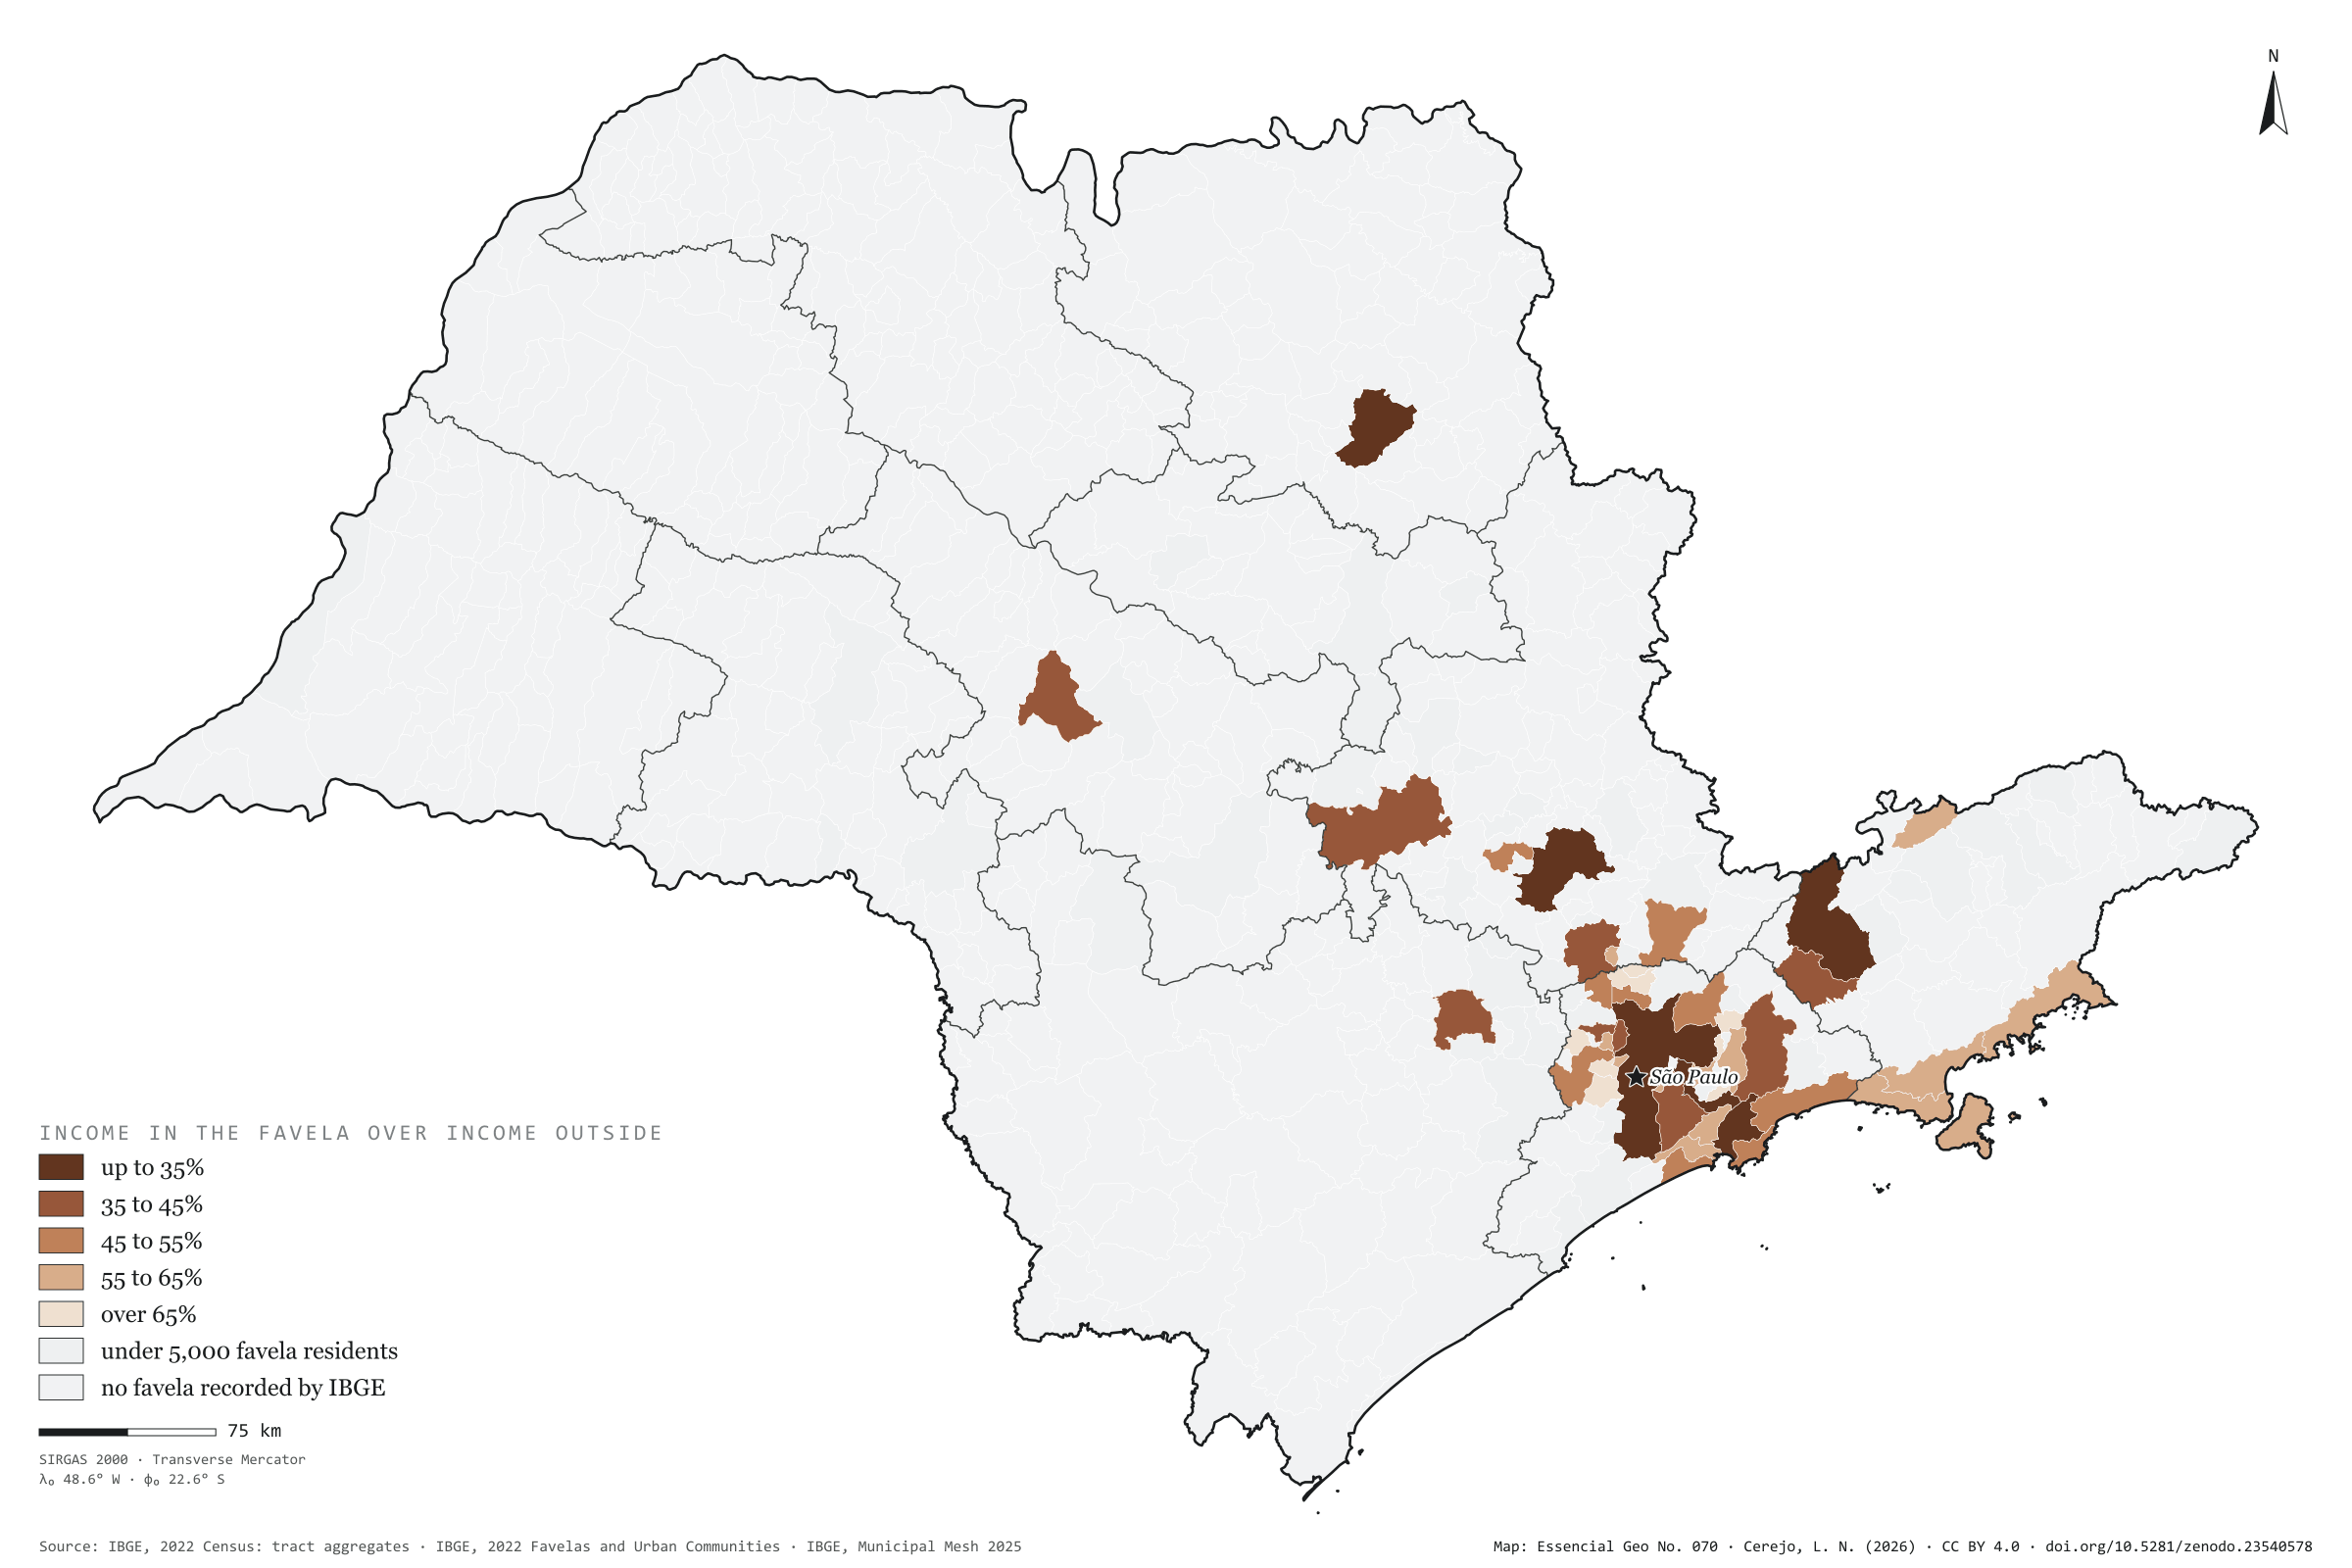
In the 92 São Paulo municipalities that have favelas, the mean income of the household head is R$ 1,697 in the favelas and R$ 4,342 in the rest of the same town: 2.6 times as much. Inside, 73% of homes have sewage to the mains, against 94% outside; 68% of household heads are Black or brown, against about 40%; 16% of residents are aged 9 or under, against 11%; and almost no one lives in a flat (0.5%, against 28%). The map compares income inside and outside in each of the 45 municipalities with at least 5,000 favela residents. The gap is widest in rich towns: in Santos and São Paulo, income in the favela is 31% of that outside; in Ribeirão Preto and São José dos Campos, 33%. It narrows where the whole town is poor, as in Francisco Morato, Itaquaquecetuba and Rio Grande da Serra, at 81%. Last plate of the collection “Favelas and urban communities”.
Technical record · downloads · citation
At a glance
Municipalities by income in the favela over income outside (municipalities)
up to 35%13.3%
35 to 45%20%
45 to 55%20%
55 to 65%28.9%
over 65%17.8%
Mean household-head income in the favela
1,697R$
R$ 4,342 outside, in the same municipalities
Favela homes with sewage to the mains
73%
94% outside
Layers
municipiospolygon645 municipalities: mean income inside and outside favelas and the ratio between them, plus people in favelas and surroundings
setores_fcupolygon8,008 tracts in Favelas and Urban Communities
regioes_intermediariaspolygon11 intermediate geographic regions
Mean income of household heads with income in tracts of Favelas and Urban Communities over that of the other tracts of the same municipality, from the 2022 Census tract aggregates, in municipalities with at least 5,000 favela residents, in five classes.
The map without a frame, with legend, scale, reference system and credit written on it: ready for papers, lectures and slides. In two versions: with the basemap (neighbours and sea) or only the mapped area, on white.
CEREJO, Lucas Nakamura. Dentro e fora da favela: na mesma cidade, dois quintos da renda. Versão 1.0.0. [S. l.]: Zenodo, 2026. Conjunto de dados. DOI: 10.5281/zenodo.23540578. Disponível em: https://doi.org/10.5281/zenodo.23540578. Acesso em: 10 nov. 2026.
Cerejo, L. N. (2026). Dentro e fora da favela: na mesma cidade, dois quintos da renda [Inside and outside the favela: In the same town, two fifths of the income] (Version 1.0.0) [Data set]. Zenodo. https://doi.org/10.5281/zenodo.23540578
@dataset{cerejo2026_dentro_e_fora_das_favelas_sp,
  author    = {Cerejo, Lucas Nakamura},
  title     = {Dentro e fora da favela: Na mesma cidade, dois quintos da renda},
  year      = {2026},
  publisher = {Zenodo},
  version   = {1.0.0},
  doi       = {10.5281/zenodo.23540578},
  url       = {https://doi.org/10.5281/zenodo.23540578},
  language  = {portuguese},
  note      = {English title: Inside and outside the favela: In the same town, two fifths of the income. Licence CC BY 4.0}
}