No street light at the door: 15% in São Paulo’s favelas, 9% in Brazil’s
Fig. 069São Paulo State (SP)EPSG:4674Source: IBGE
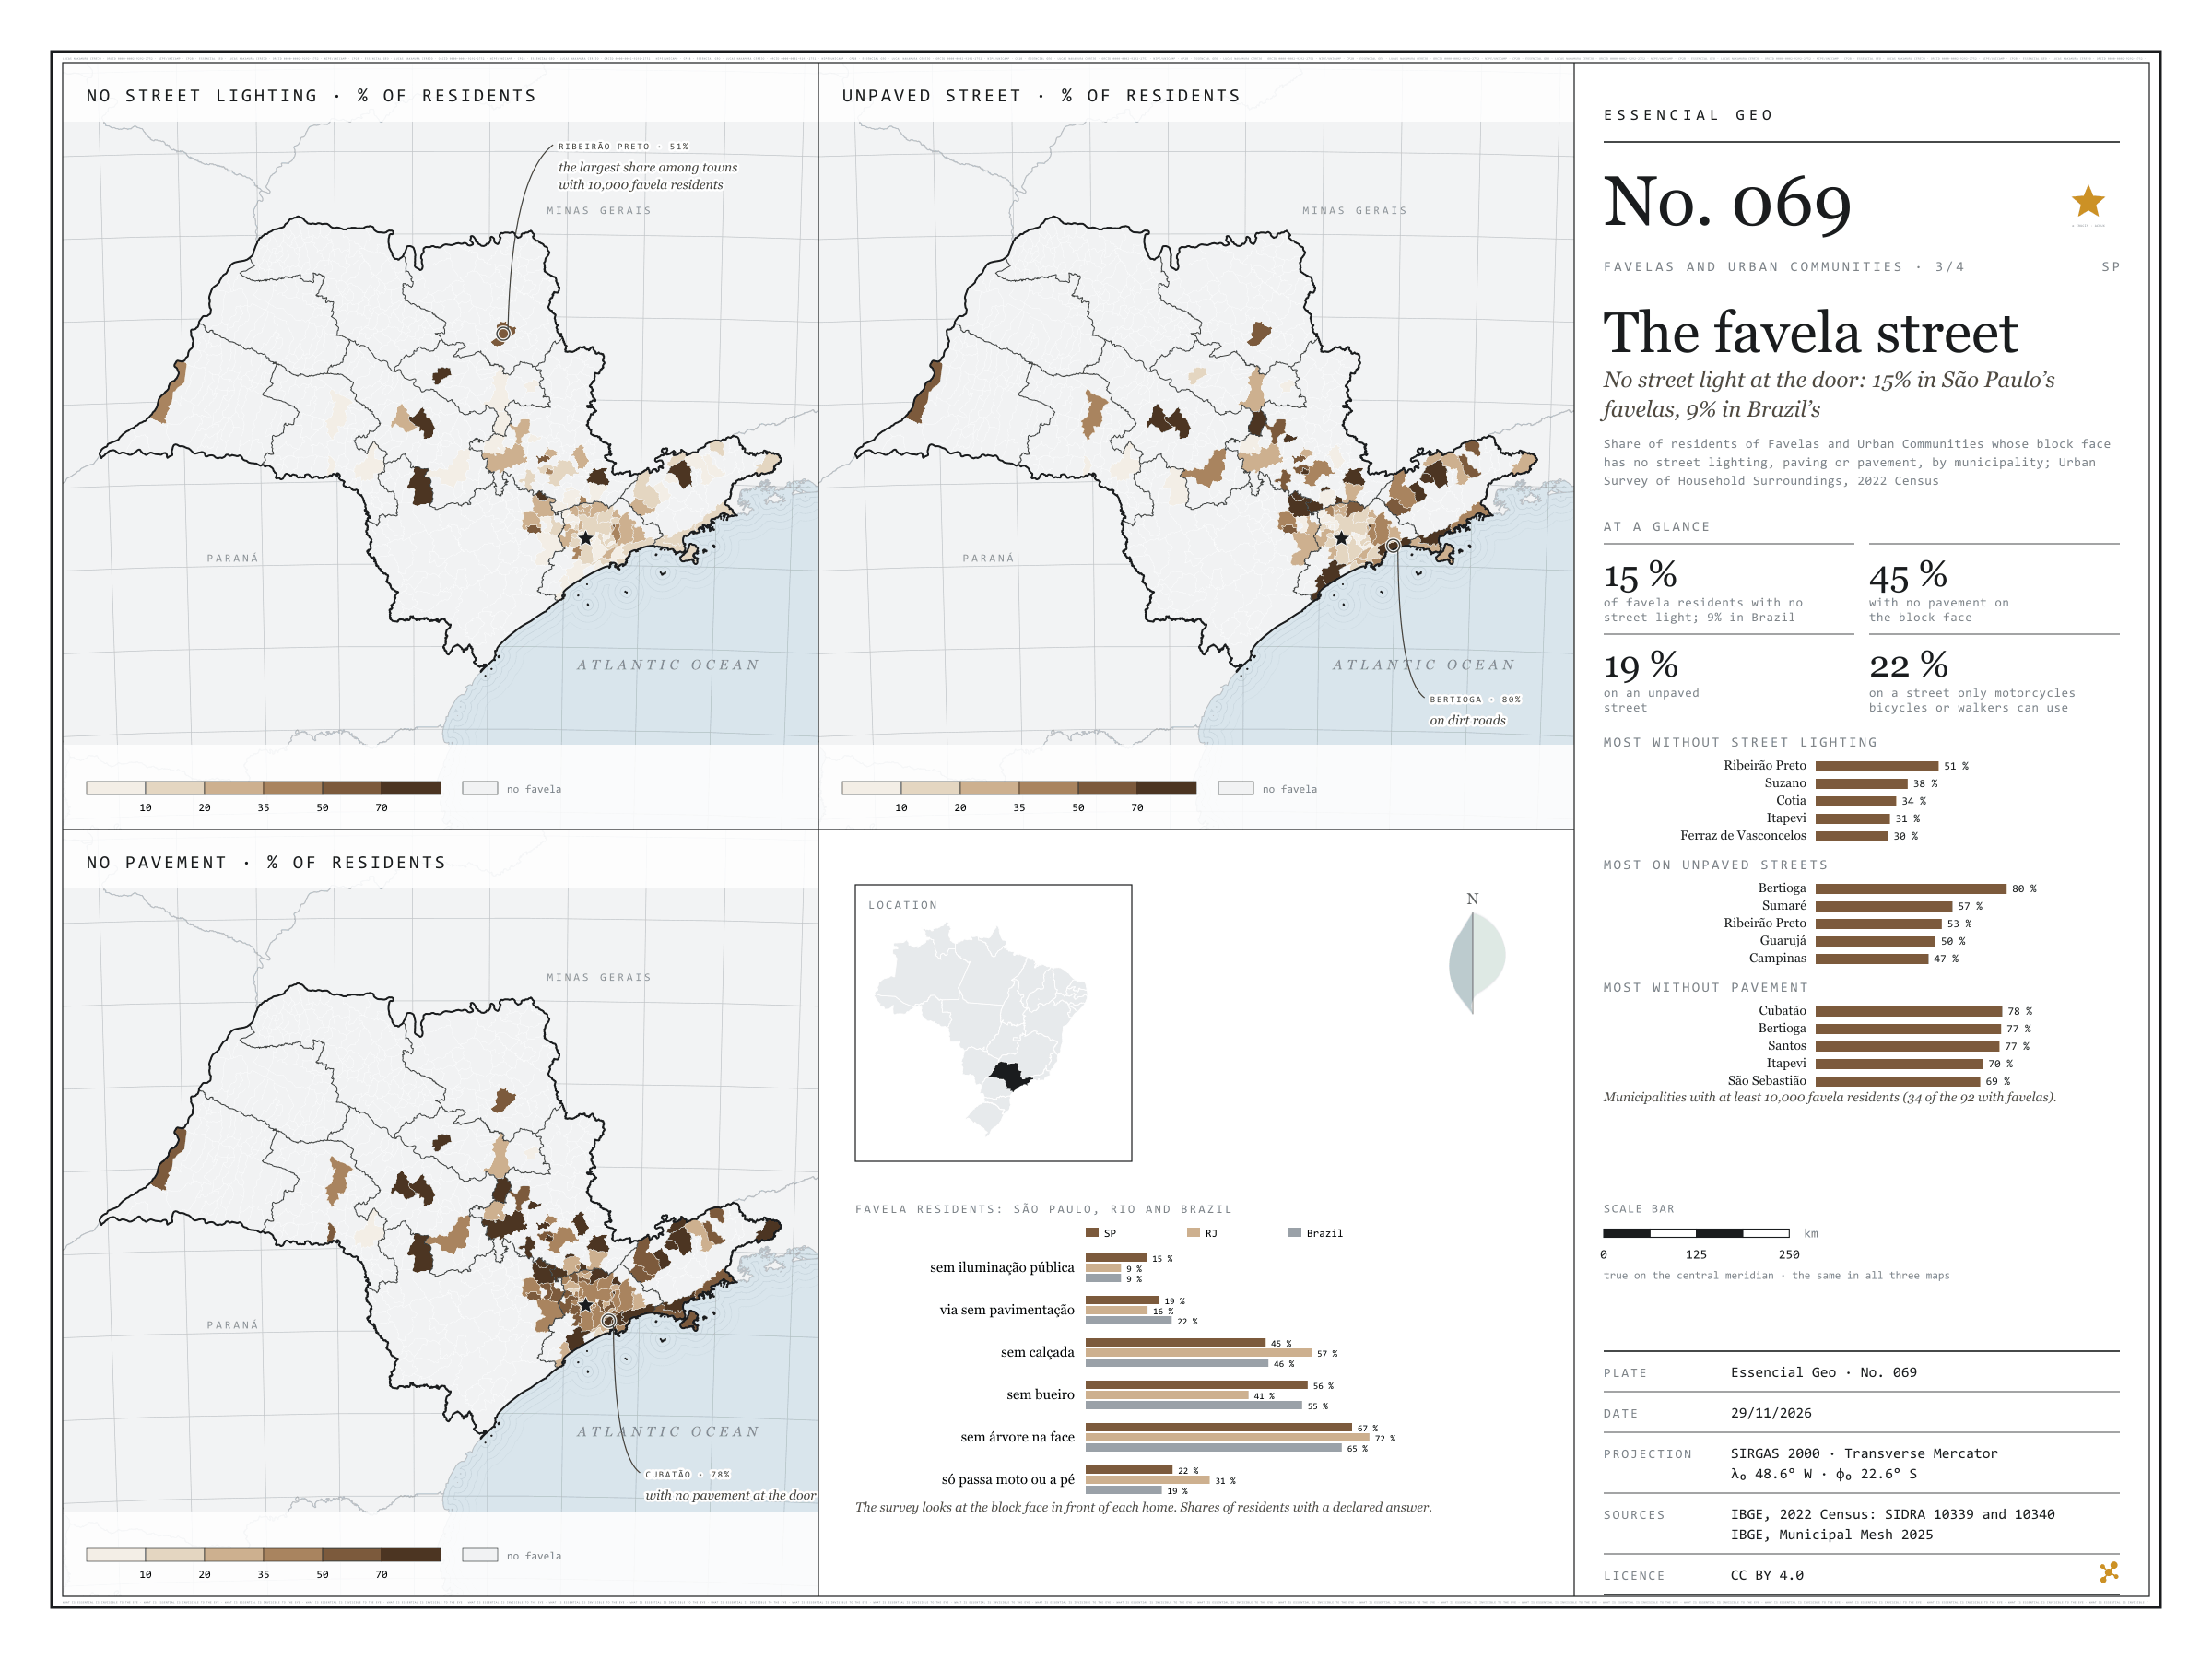
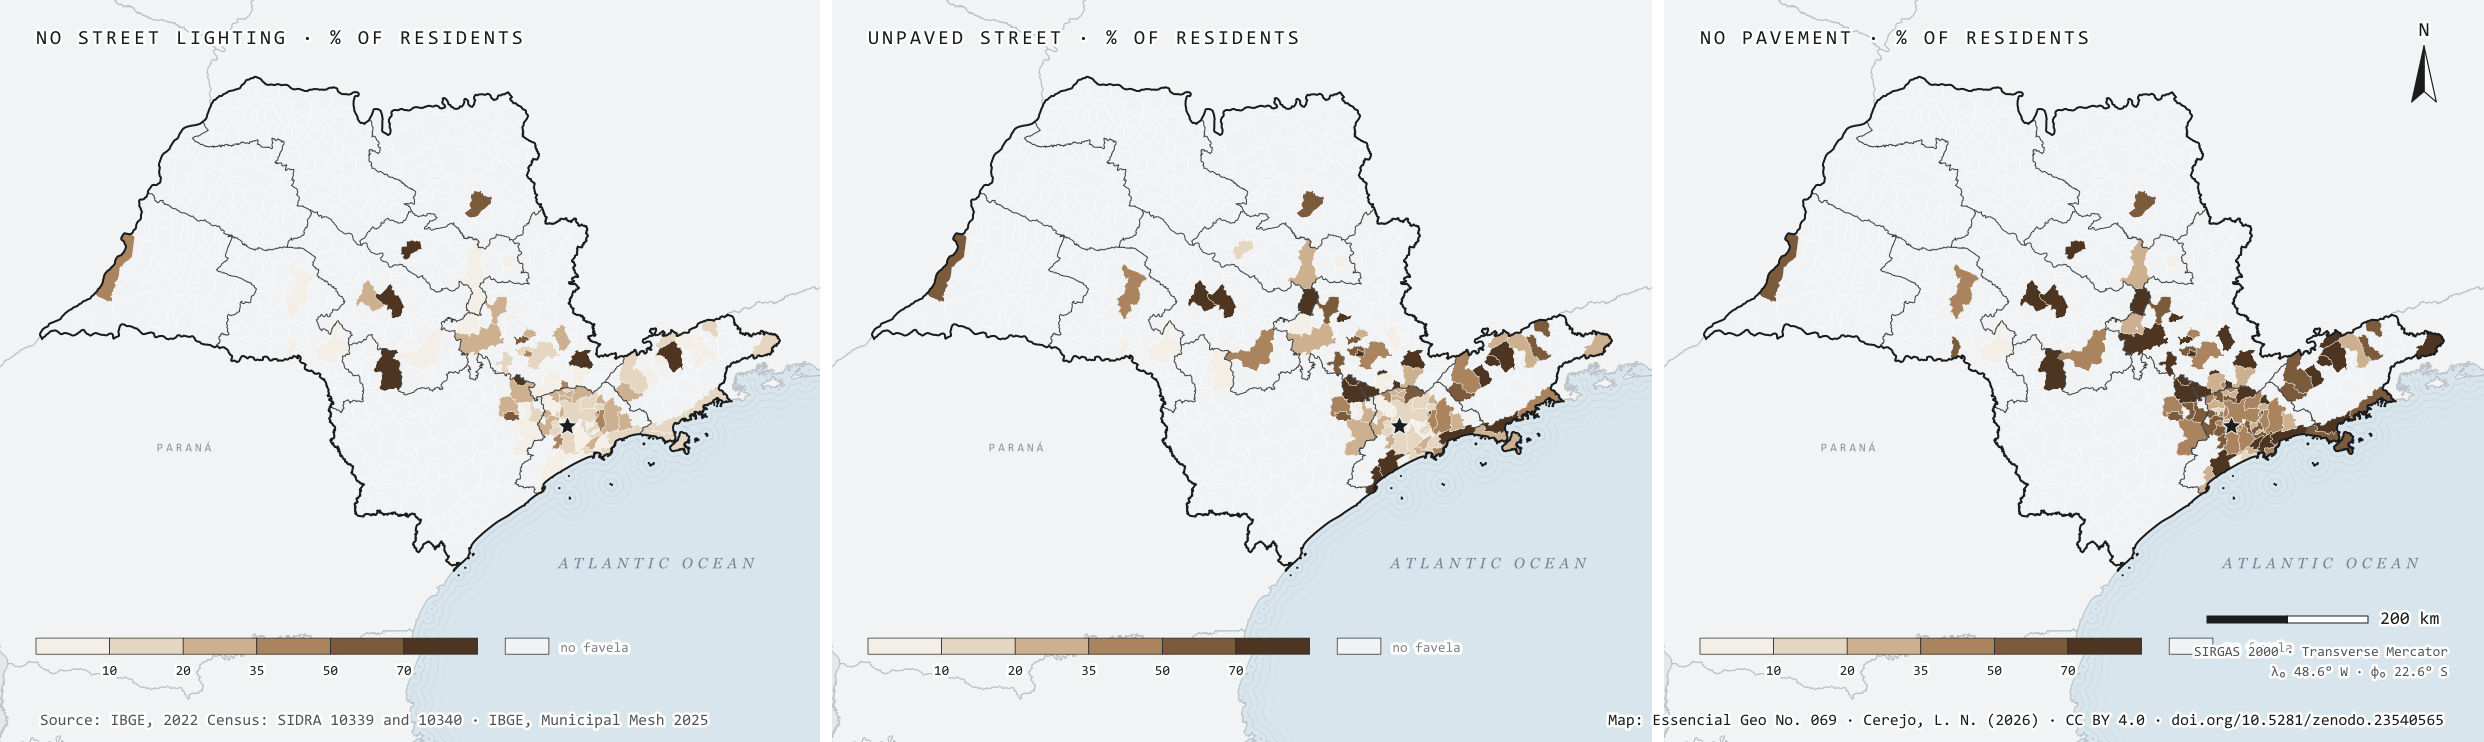
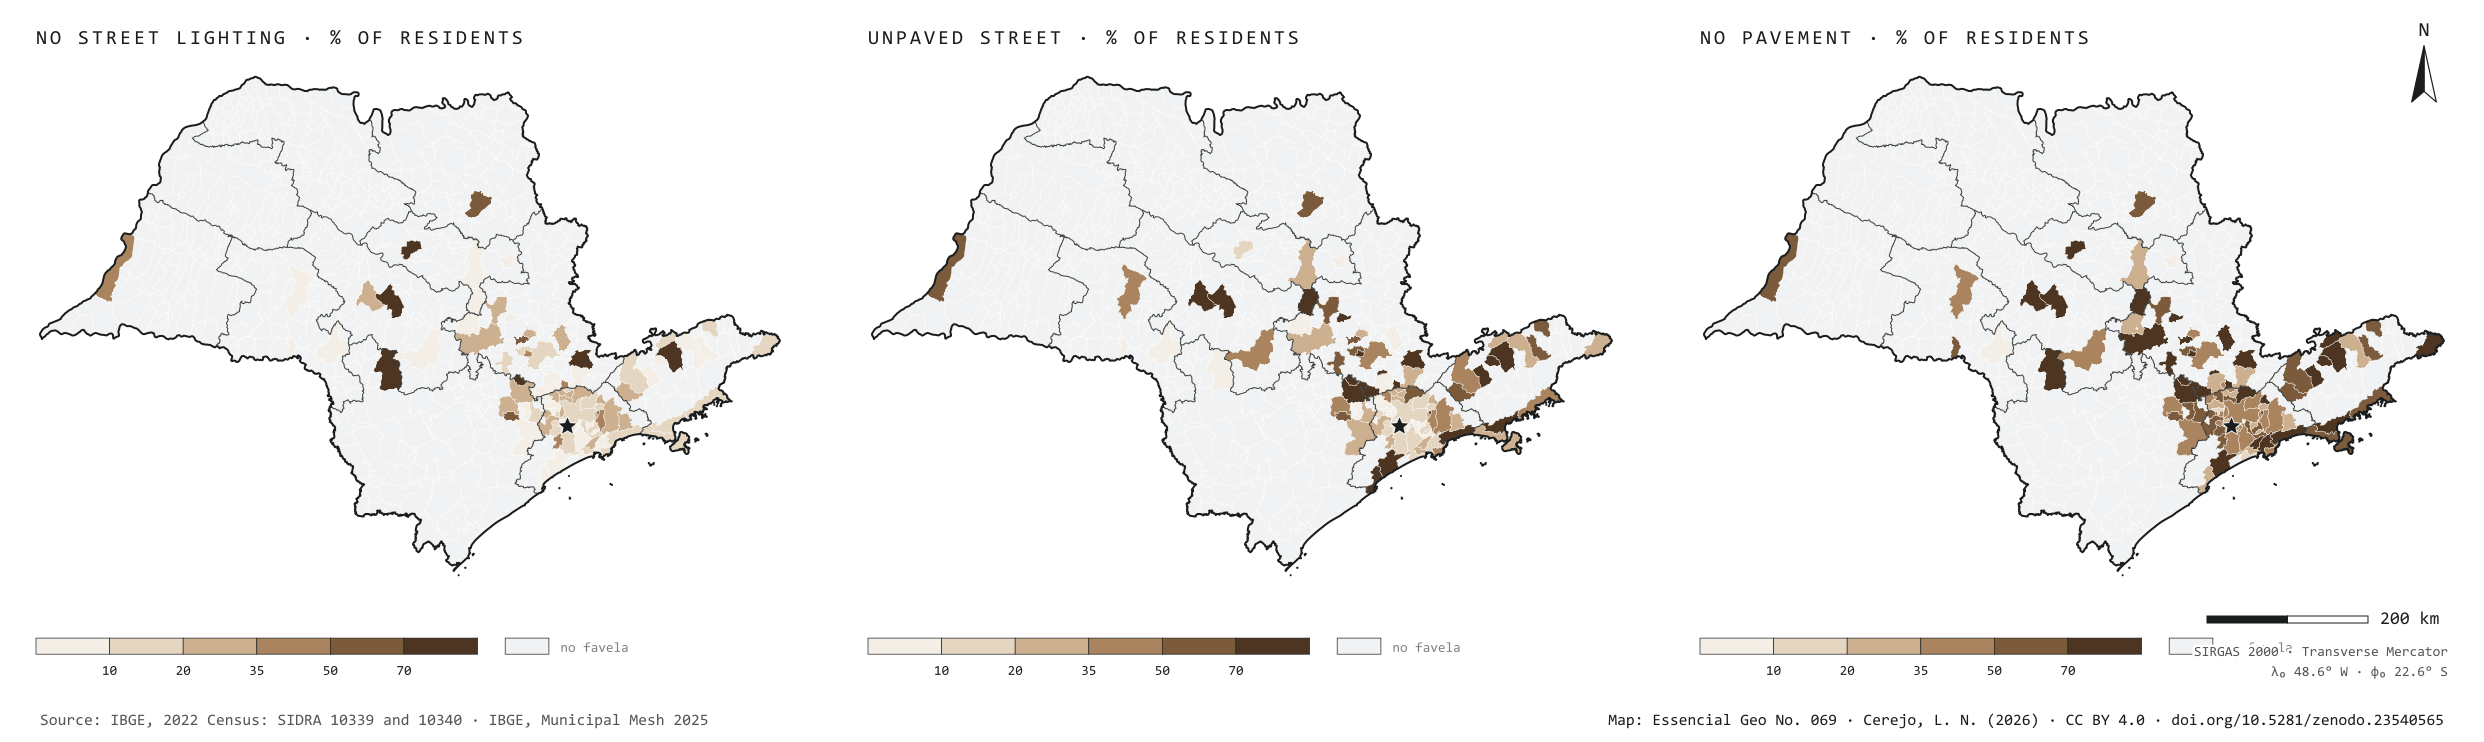
In the 2022 Census, the Urban Survey of Household Surroundings looked at the block face in front of each home. In São Paulo’s favelas, 15% of residents have no street lighting at the door, against 9% in the favelas of Rio and of Brazil as a whole. Paving is better than average: 19% live on an unpaved street, against 22% in Brazil. But 45% have no pavement to walk on, 56% no storm drain and 67% not a single tree on the block face, and for 22% the street only lets through motorbikes, bicycles or people on foot. Among the 34 municipalities with at least 10,000 favela residents, Ribeirão Preto leads on missing light, with 51% of residents in the dark; Bertioga on dirt roads, with 80%; and Cubatão on missing pavements, with 78%, ahead of Bertioga and Santos. The three maps share one frame: only the 92 municipalities with favelas.
Technical record · downloads · citation
At a glance
Favela residents with no street lighting on their block face
15%
8.9% in Brazil and in Rio de Janeiro
Favela residents with no pavement
45%
46.1% in Brazil
Favela residents on unpaved streets
19%
21.7% in Brazil
Layers
municipiospolygon645 municipalities: favela residents with surveyed surroundings and the shares without street lighting, paving, storm drains, pavement and trees, and on streets for motorbikes or pedestrians only
setores_fcupolygon8,008 tracts in Favelas and Urban Communities
regioes_intermediariaspolygon11 intermediate geographic regions
Residents of Favelas and Urban Communities whose block face has no street lighting, paving or pavement over residents with the feature declared, by municipality, from SIDRA 10340, in six classes; municipalities without favelas shown apart.
The map without a frame, with legend, scale, reference system and credit written on it: ready for papers, lectures and slides. In two versions: with the basemap (neighbours and sea) or only the mapped area, on white.
CEREJO, Lucas Nakamura. A rua da favela: sem luz pública na porta: 15 % nas favelas paulistas, 9 % nas do país. Versão 1.0.0. [S. l.]: Zenodo, 2026. Conjunto de dados. DOI: 10.5281/zenodo.23540565. Disponível em: https://doi.org/10.5281/zenodo.23540565. Acesso em: 10 nov. 2026.
Cerejo, L. N. (2026). A rua da favela: sem luz pública na porta: 15 % nas favelas paulistas, 9 % nas do país [The favela street: No street light at the door: 15% in São Paulo’s favelas, 9% in Brazil’s] (Version 1.0.0) [Data set]. Zenodo. https://doi.org/10.5281/zenodo.23540565
@dataset{cerejo2026_entorno_das_favelas_sp,
  author    = {Cerejo, Lucas Nakamura},
  title     = {A rua da favela: Sem luz pública na porta: 15 % nas favelas paulistas, 9 % nas do país},
  year      = {2026},
  publisher = {Zenodo},
  version   = {1.0.0},
  doi       = {10.5281/zenodo.23540565},
  url       = {https://doi.org/10.5281/zenodo.23540565},
  language  = {portuguese},
  note      = {English title: The favela street: No street light at the door: 15% in São Paulo’s favelas, 9% in Brazil’s. Licence CC BY 4.0}
}
Fig. 068Greater São Paulo and the Santos coast (SP)EPSG:4674Source: IBGE
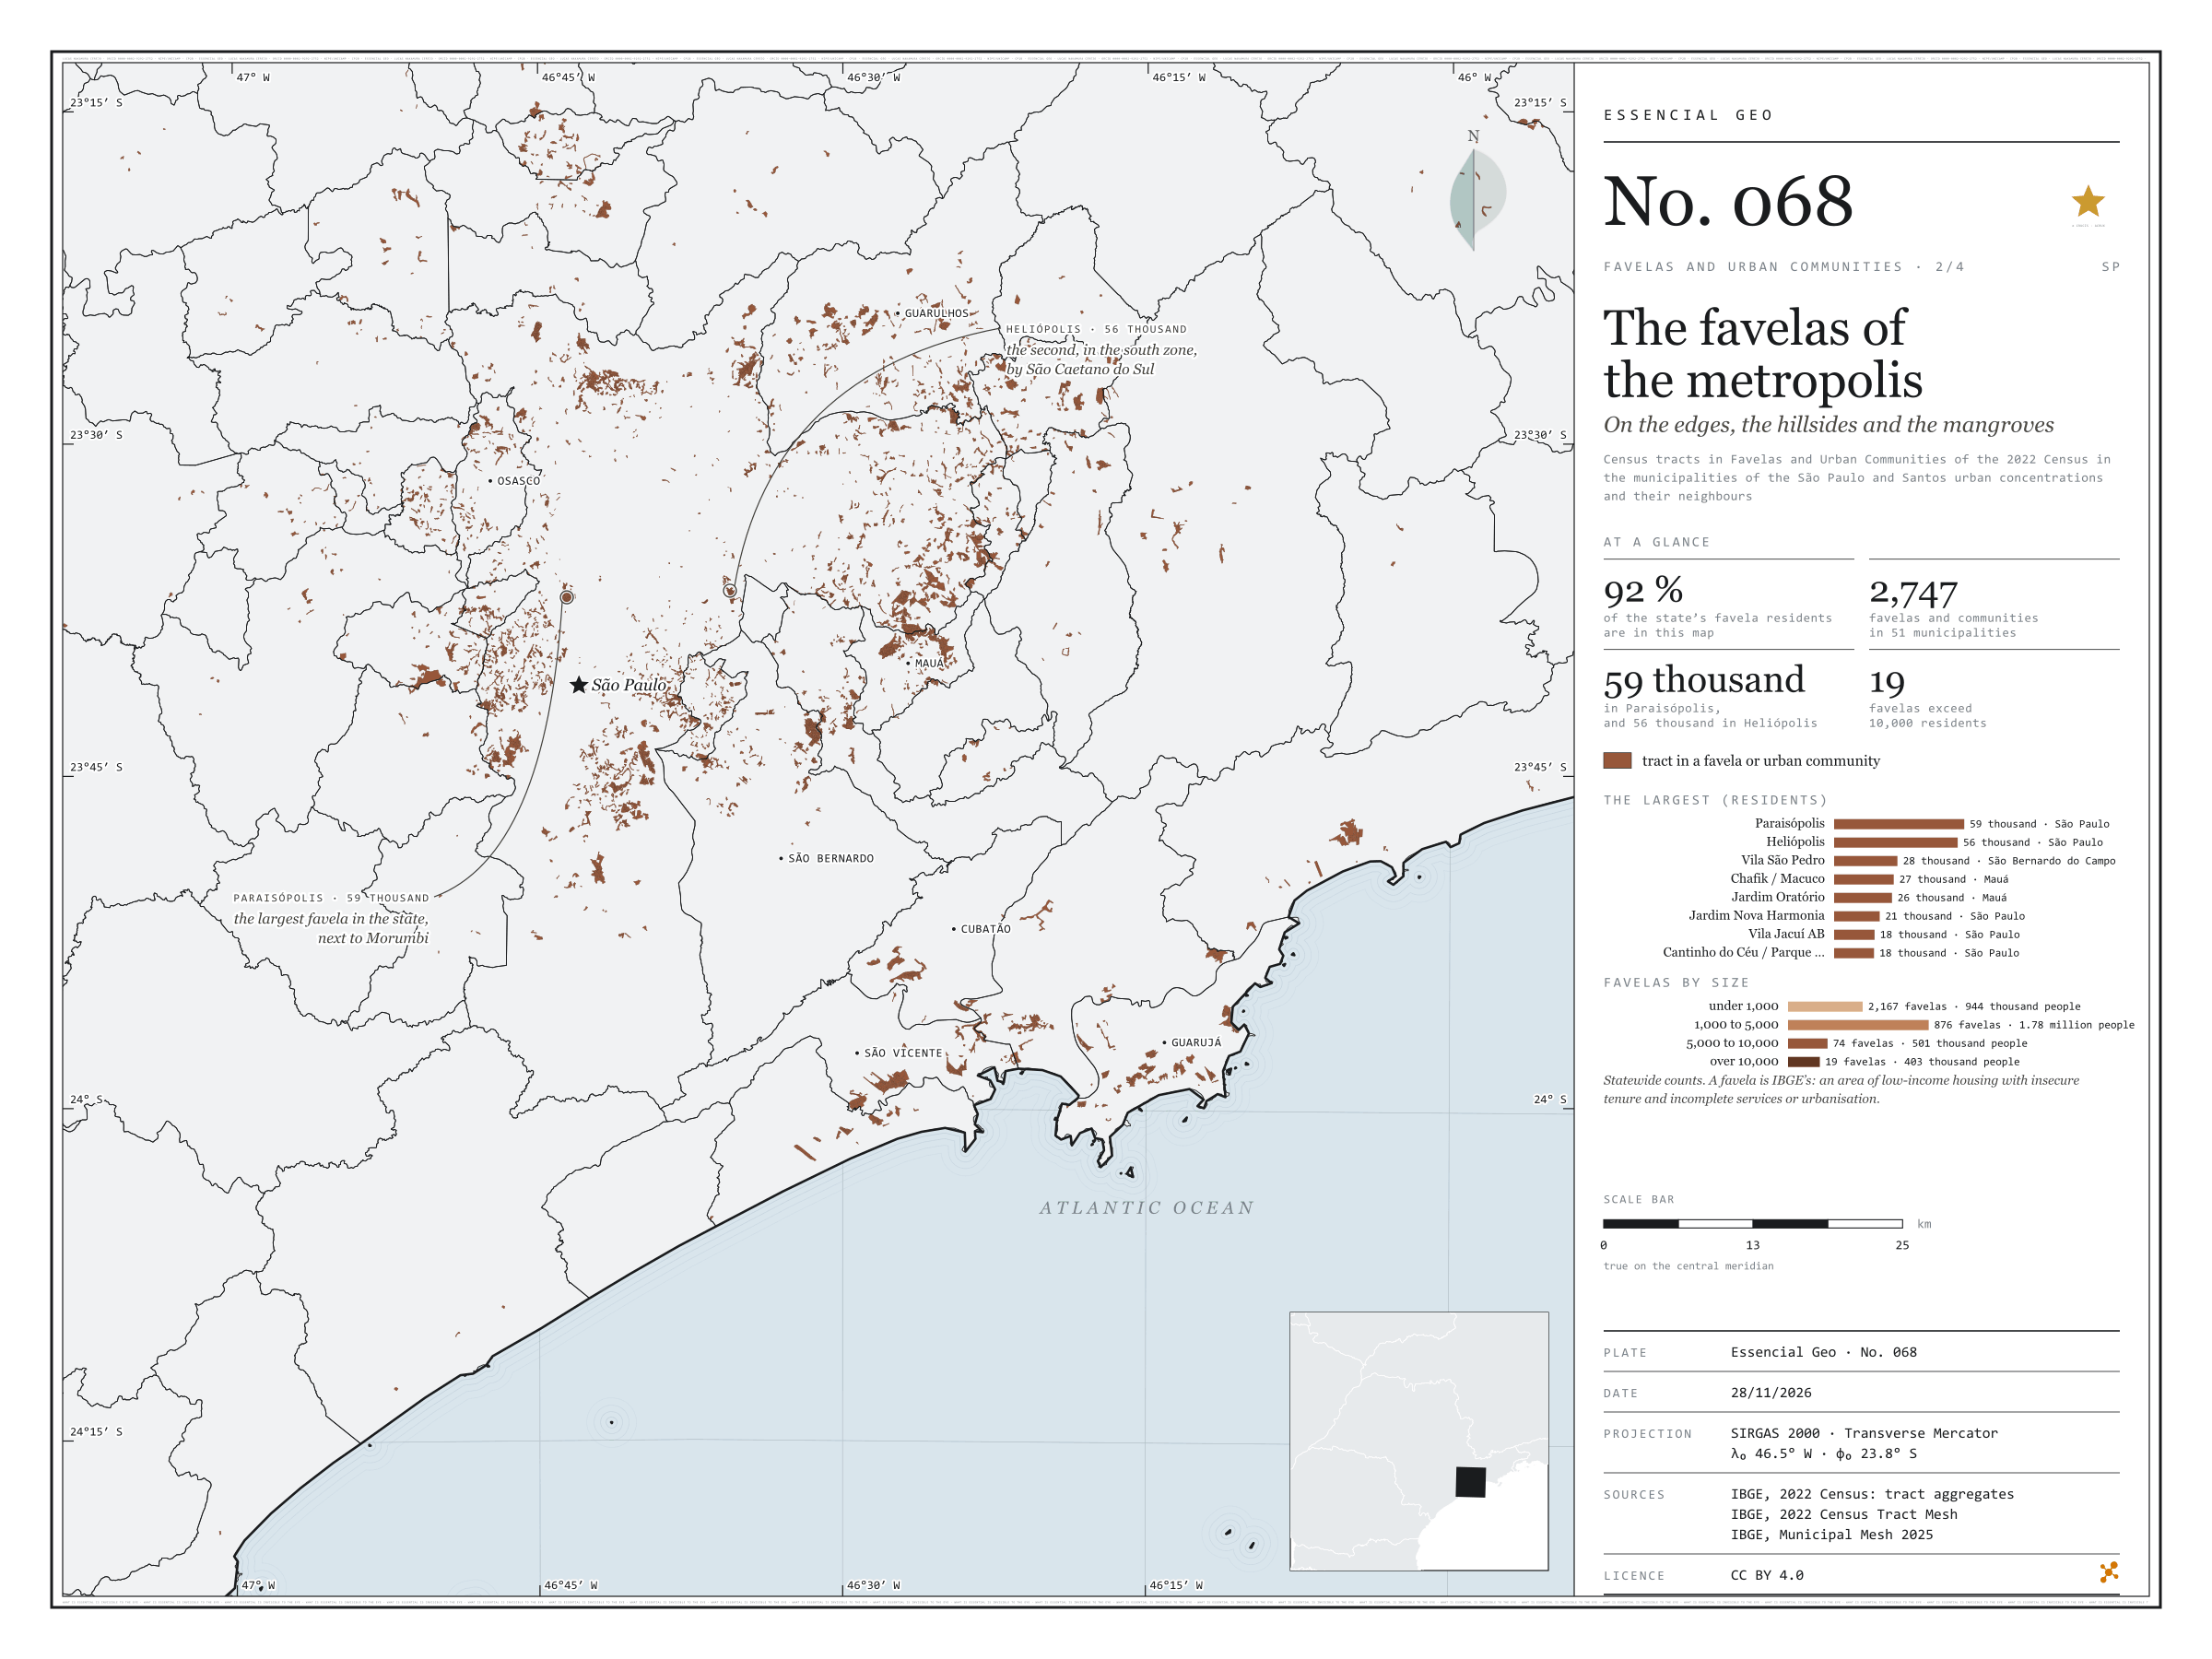
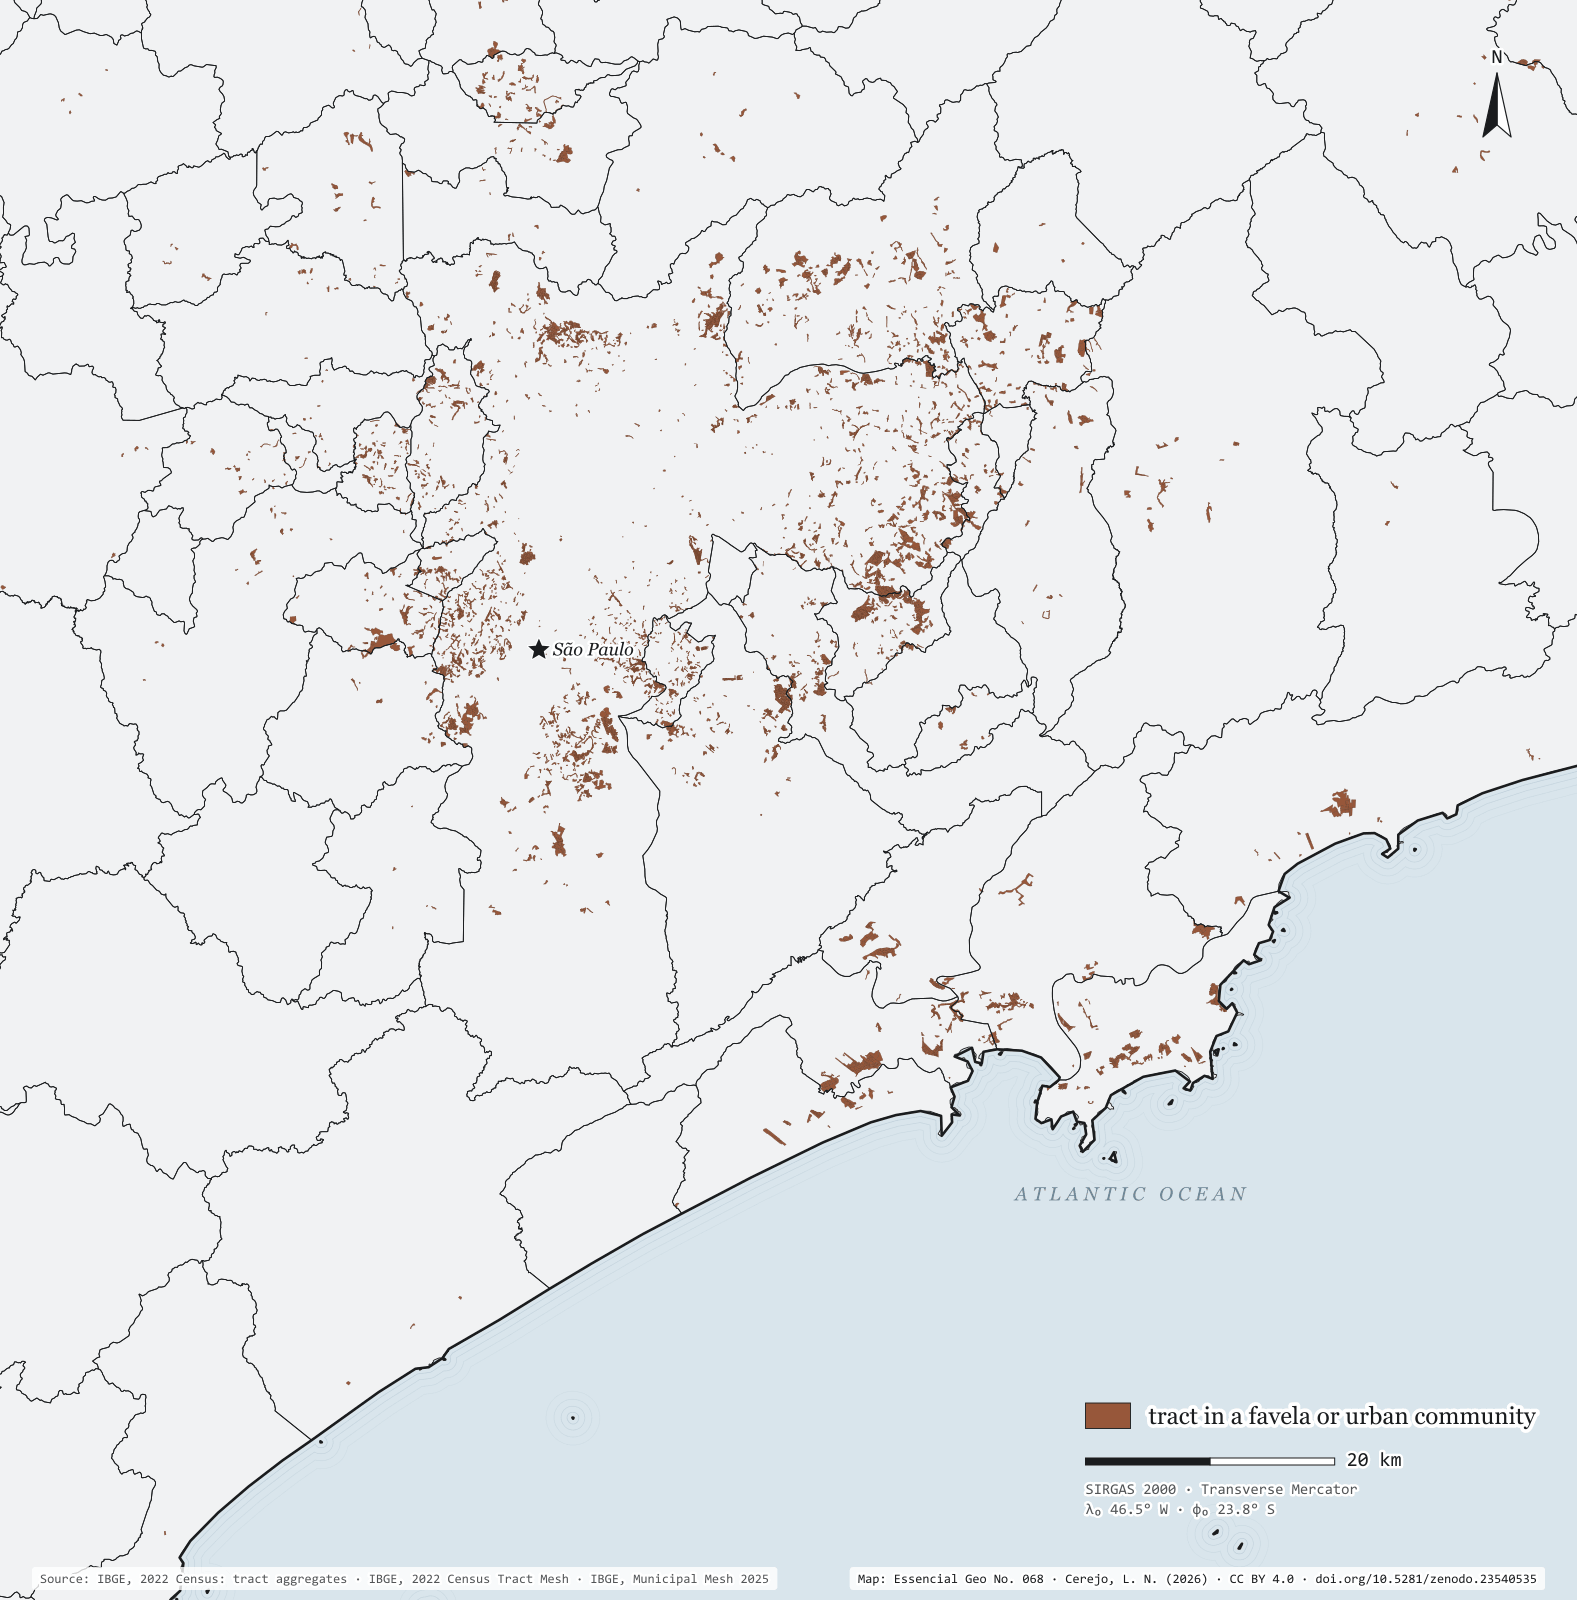
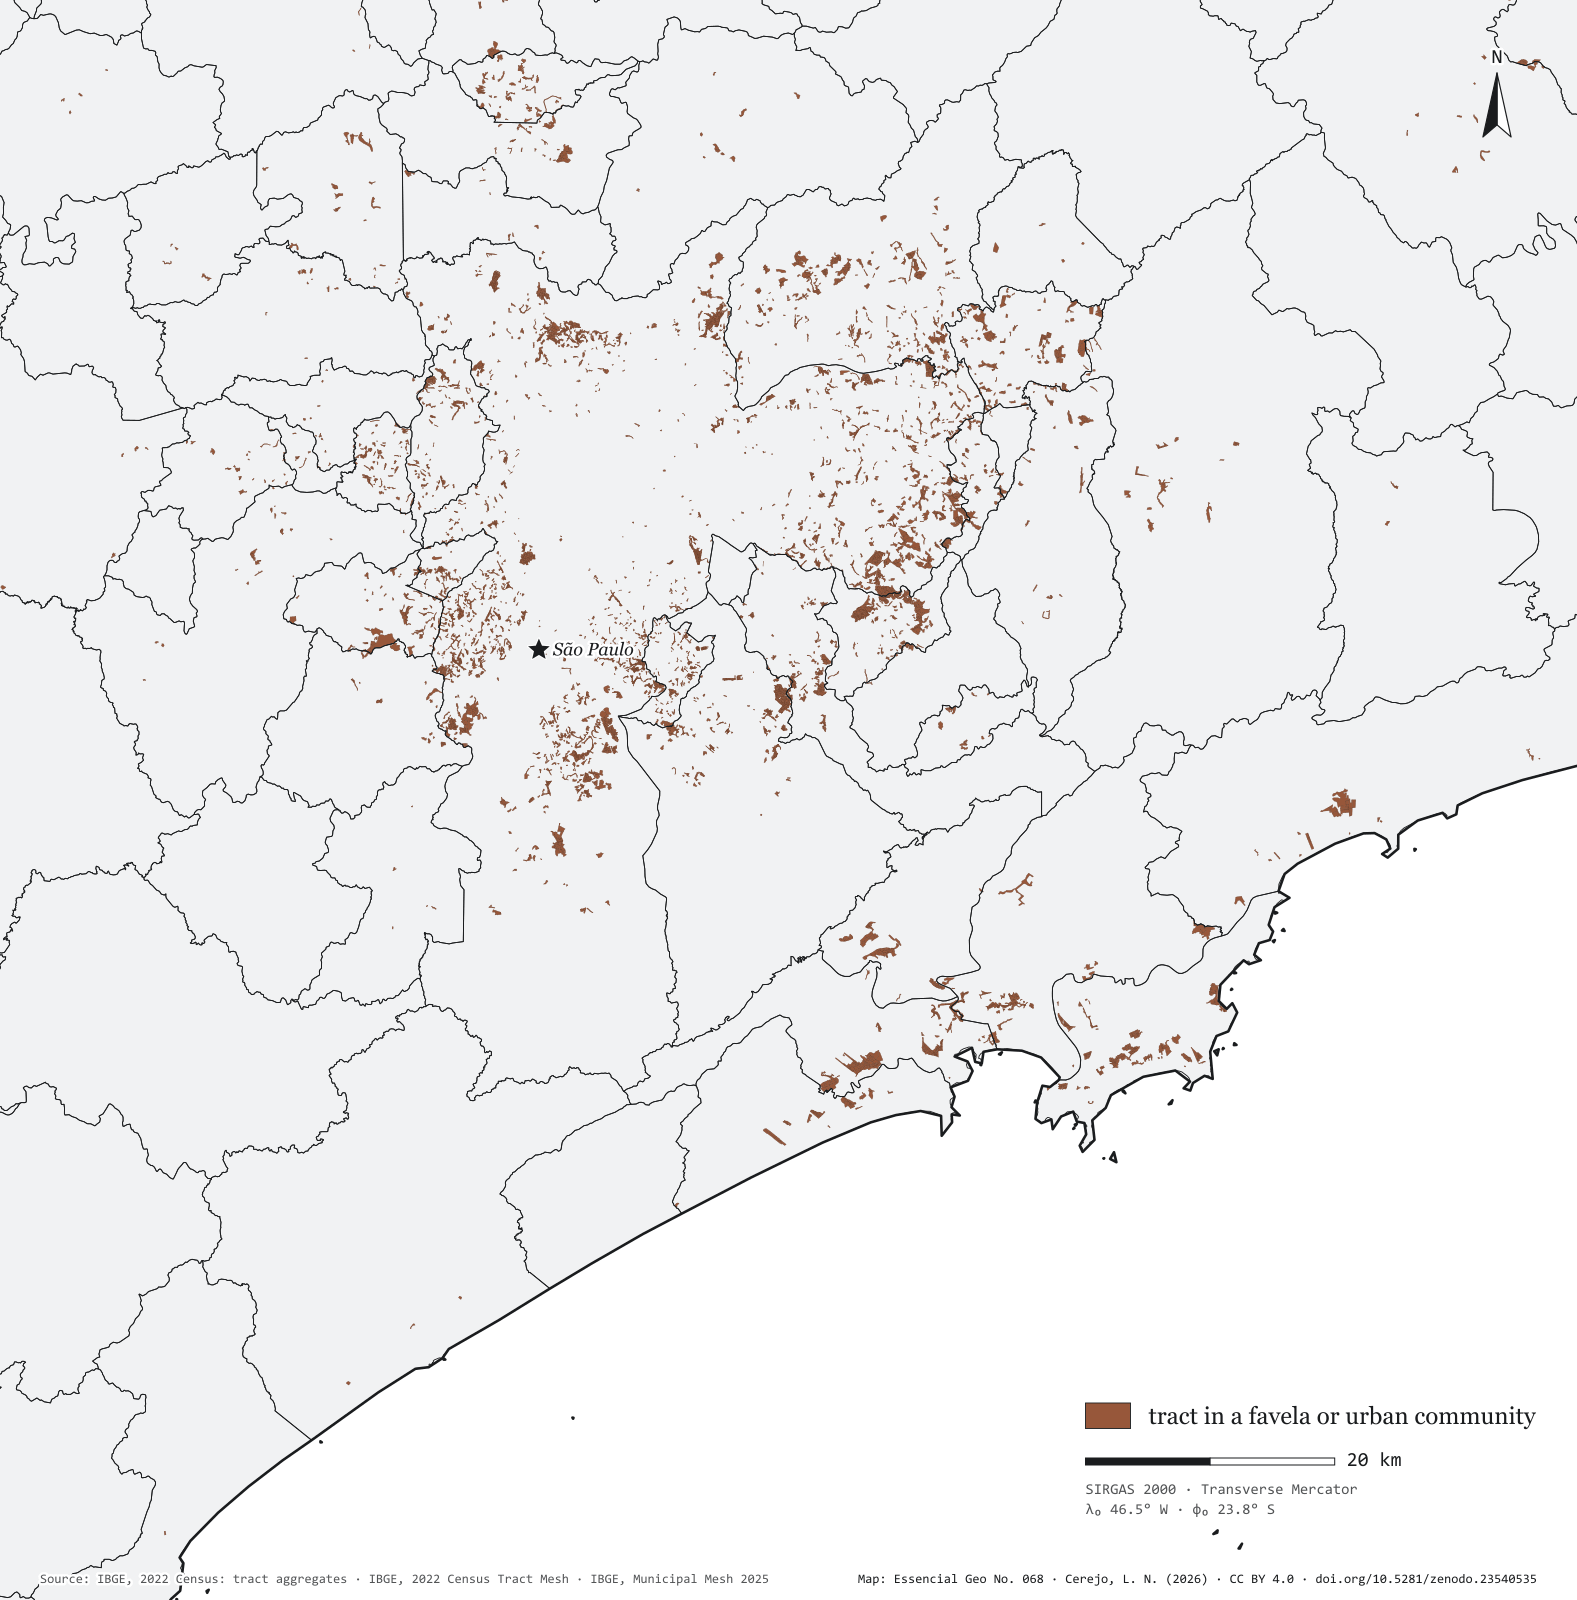
Seen tract by tract, the favelas of Greater São Paulo and the Santos coast are not one patch but hundreds of fragments on valley floors, hillsides and the edges of reservoirs, streams and mangroves. The map window, from Francisco Morato to Guarujá, holds 92% of the state’s favela residents, in 2,747 communities across 51 municipalities. The two largest are in the capital: Paraisópolis, with 59,000 residents, beside Morumbi, and Heliópolis, with 56,000, in the south, next to São Caetano do Sul. Then come Vila São Pedro, in São Bernardo do Campo, with 28,000, and Chafik/Macuco and Jardim Oratório, in Mauá. In the state, only 19 favelas exceed 10,000 residents, with 403,000 people between them; most are small: 2,167 have fewer than 1,000 residents, and the bulk of the population, 1.78 million, lives in the 876 with 1,000 to 5,000.
Technical record · downloads · citation
At a glance
Favela residents by favela size, statewide (people)
under 1,00026%
1,000 to 5,00049.1%
5,000 to 10,00013.8%
over 10,00011.1%
The state’s favela residents in this window
92%
2,747 favelas and communities in 51 municipalities
Residents of Paraisópolis
58,527people
Layers
setores_fcupolygon8,008 tracts in Favelas and Urban Communities: community code and name, municipality, people and occupied households
municipiospolygon645 municipalities: people, people in favelas, number of communities and population share
regioes_intermediariaspolygon11 intermediate geographic regions
Census tracts coded as a Favela or Urban Community in the 2022 Census aggregates, drawn over the municipal mesh; residents of each community = sum of people in its tracts.
The map without a frame, with legend, scale, reference system and credit written on it: ready for papers, lectures and slides. In two versions: with the basemap (neighbours and sea) or only the mapped area, on white.
CEREJO, Lucas Nakamura. As favelas da metrópole: nas margens, nas encostas e nos mangues. Versão 1.0.0. [S. l.]: Zenodo, 2026. Conjunto de dados. DOI: 10.5281/zenodo.23540535. Disponível em: https://doi.org/10.5281/zenodo.23540535. Acesso em: 10 nov. 2026.
Cerejo, L. N. (2026). As favelas da metrópole: nas margens, nas encostas e nos mangues [The favelas of the metropolis: On the banks, the slopes and the mangroves] (Version 1.0.0) [Data set]. Zenodo. https://doi.org/10.5281/zenodo.23540535
@dataset{cerejo2026_favelas_na_metropole_sp,
  author    = {Cerejo, Lucas Nakamura},
  title     = {As favelas da metrópole: Nas margens, nas encostas e nos mangues},
  year      = {2026},
  publisher = {Zenodo},
  version   = {1.0.0},
  doi       = {10.5281/zenodo.23540535},
  url       = {https://doi.org/10.5281/zenodo.23540535},
  language  = {portuguese},
  note      = {English title: The favelas of the metropolis: On the banks, the slopes and the mangroves. Licence CC BY 4.0}
}
One in twelve people in São Paulo, nearly all in the metropolis and on the coast
Fig. 067São Paulo State (SP)EPSG:4674Source: IBGE
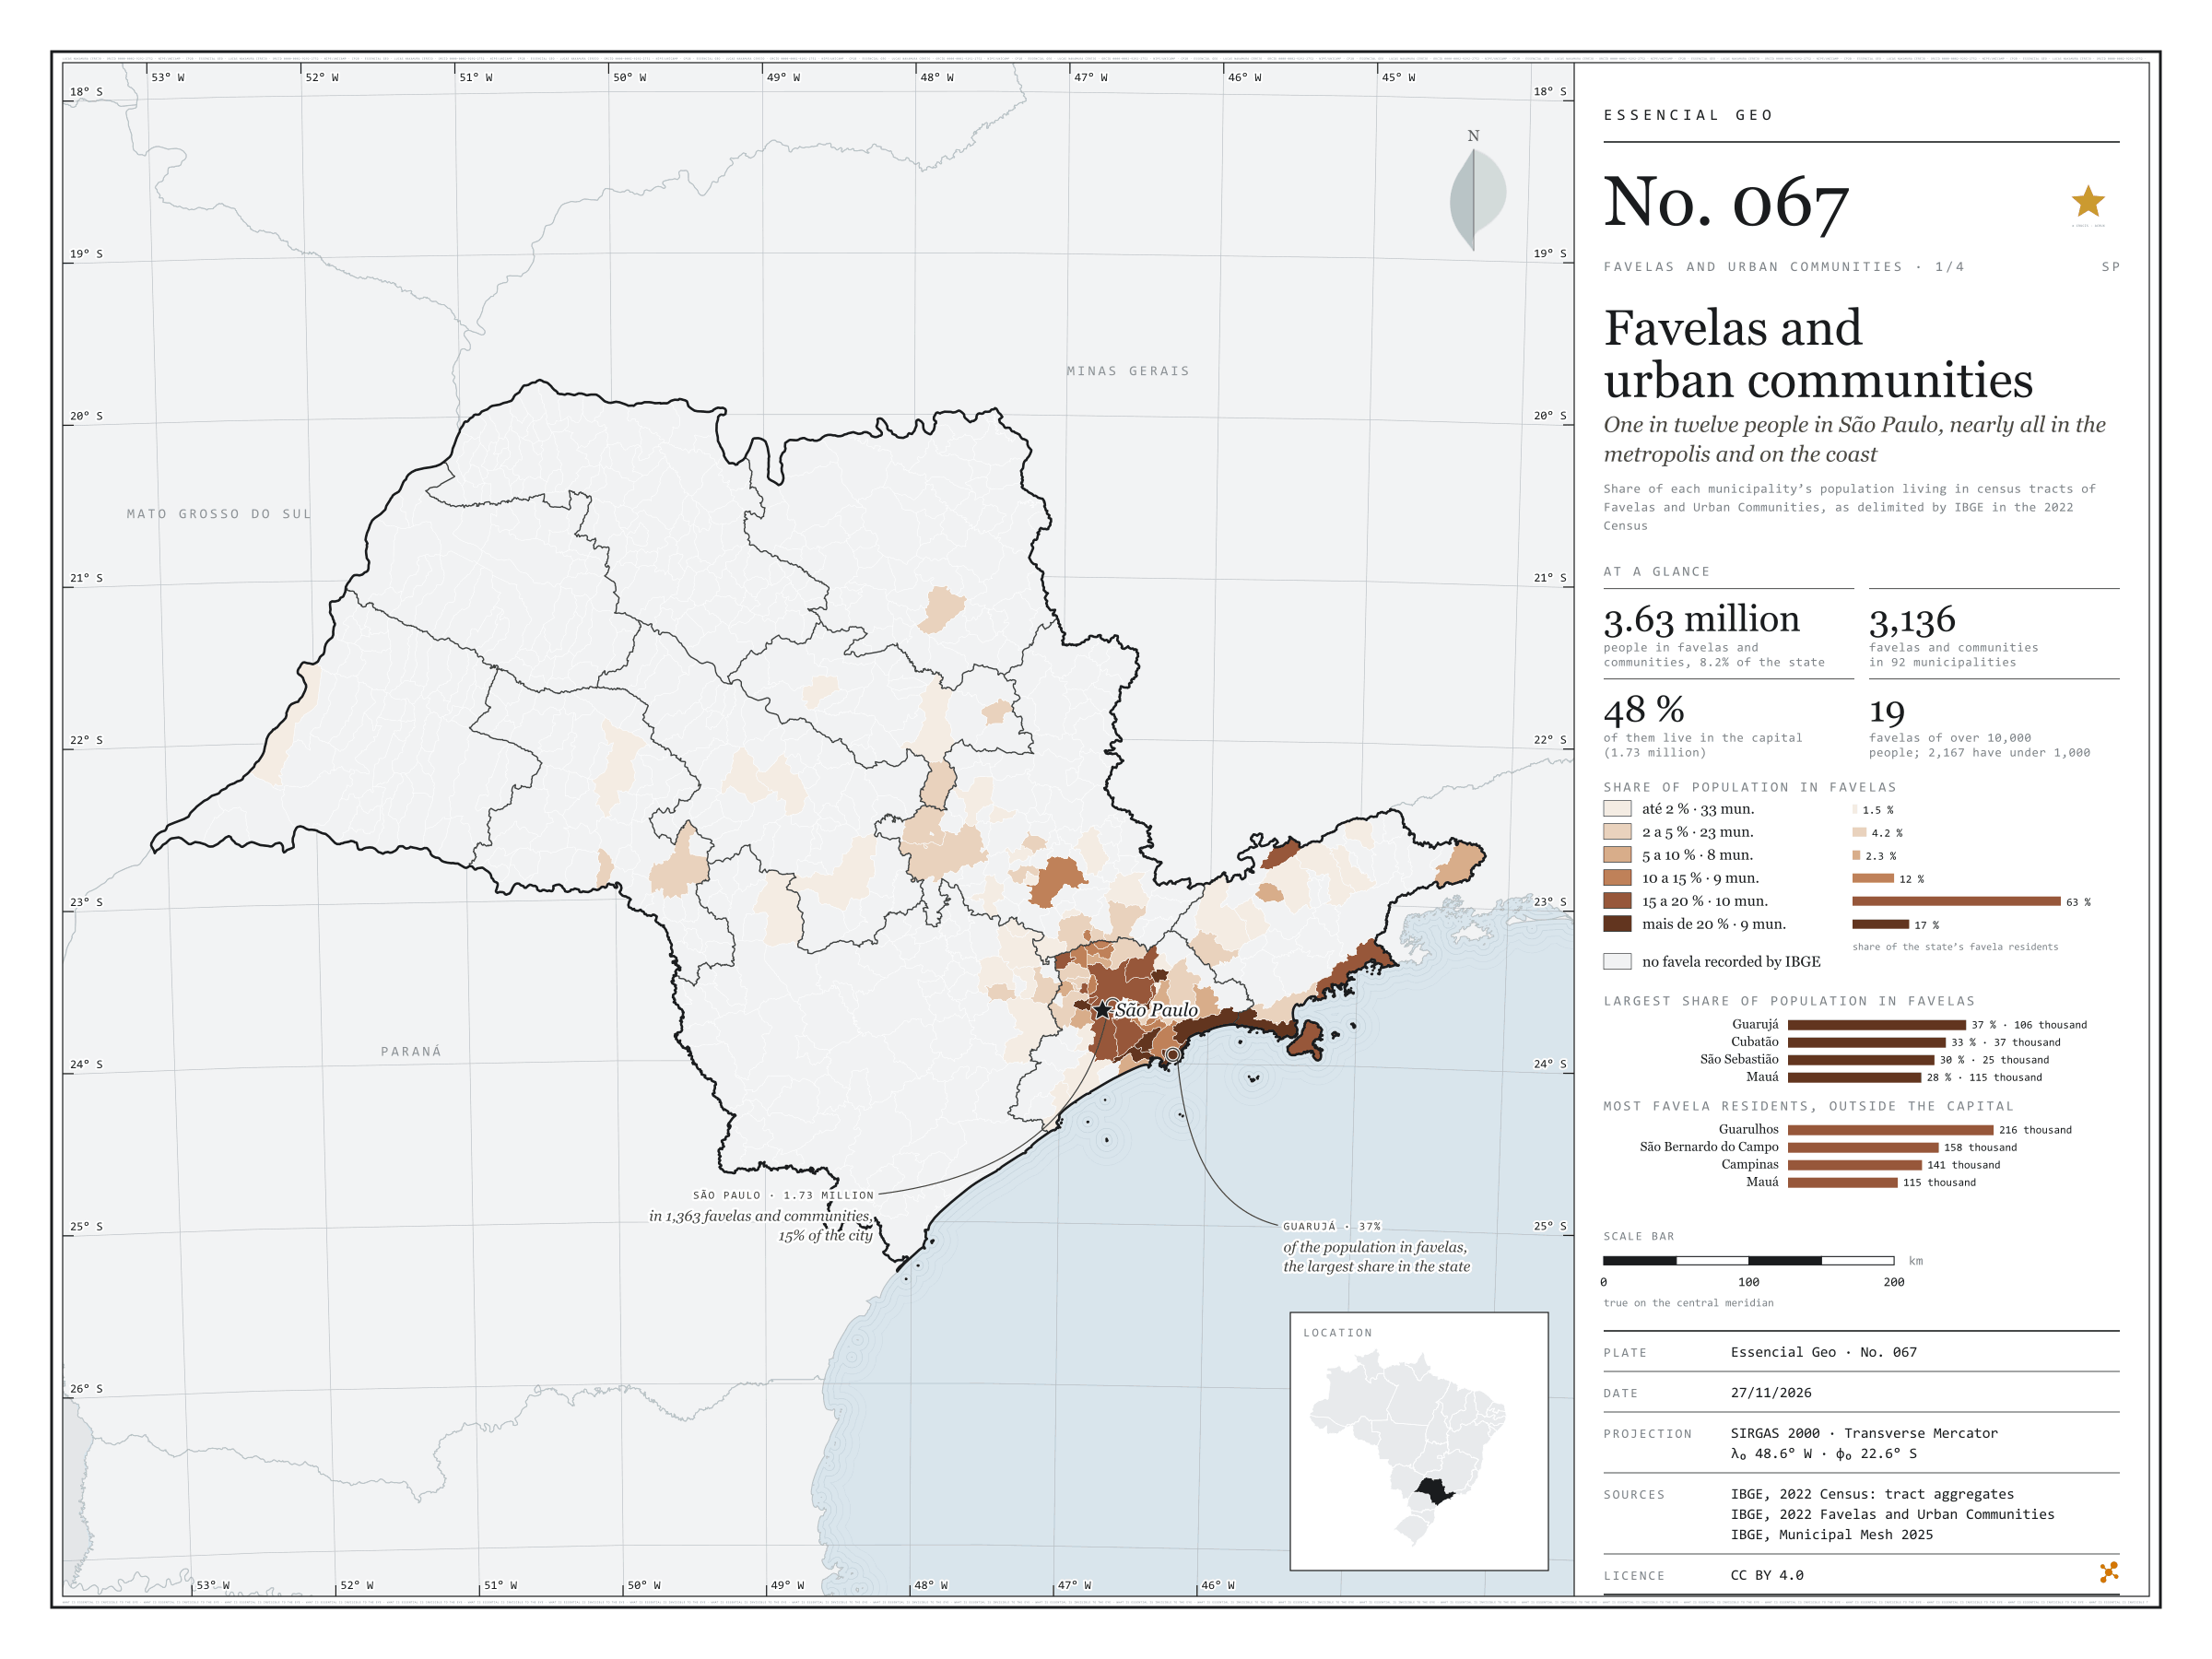
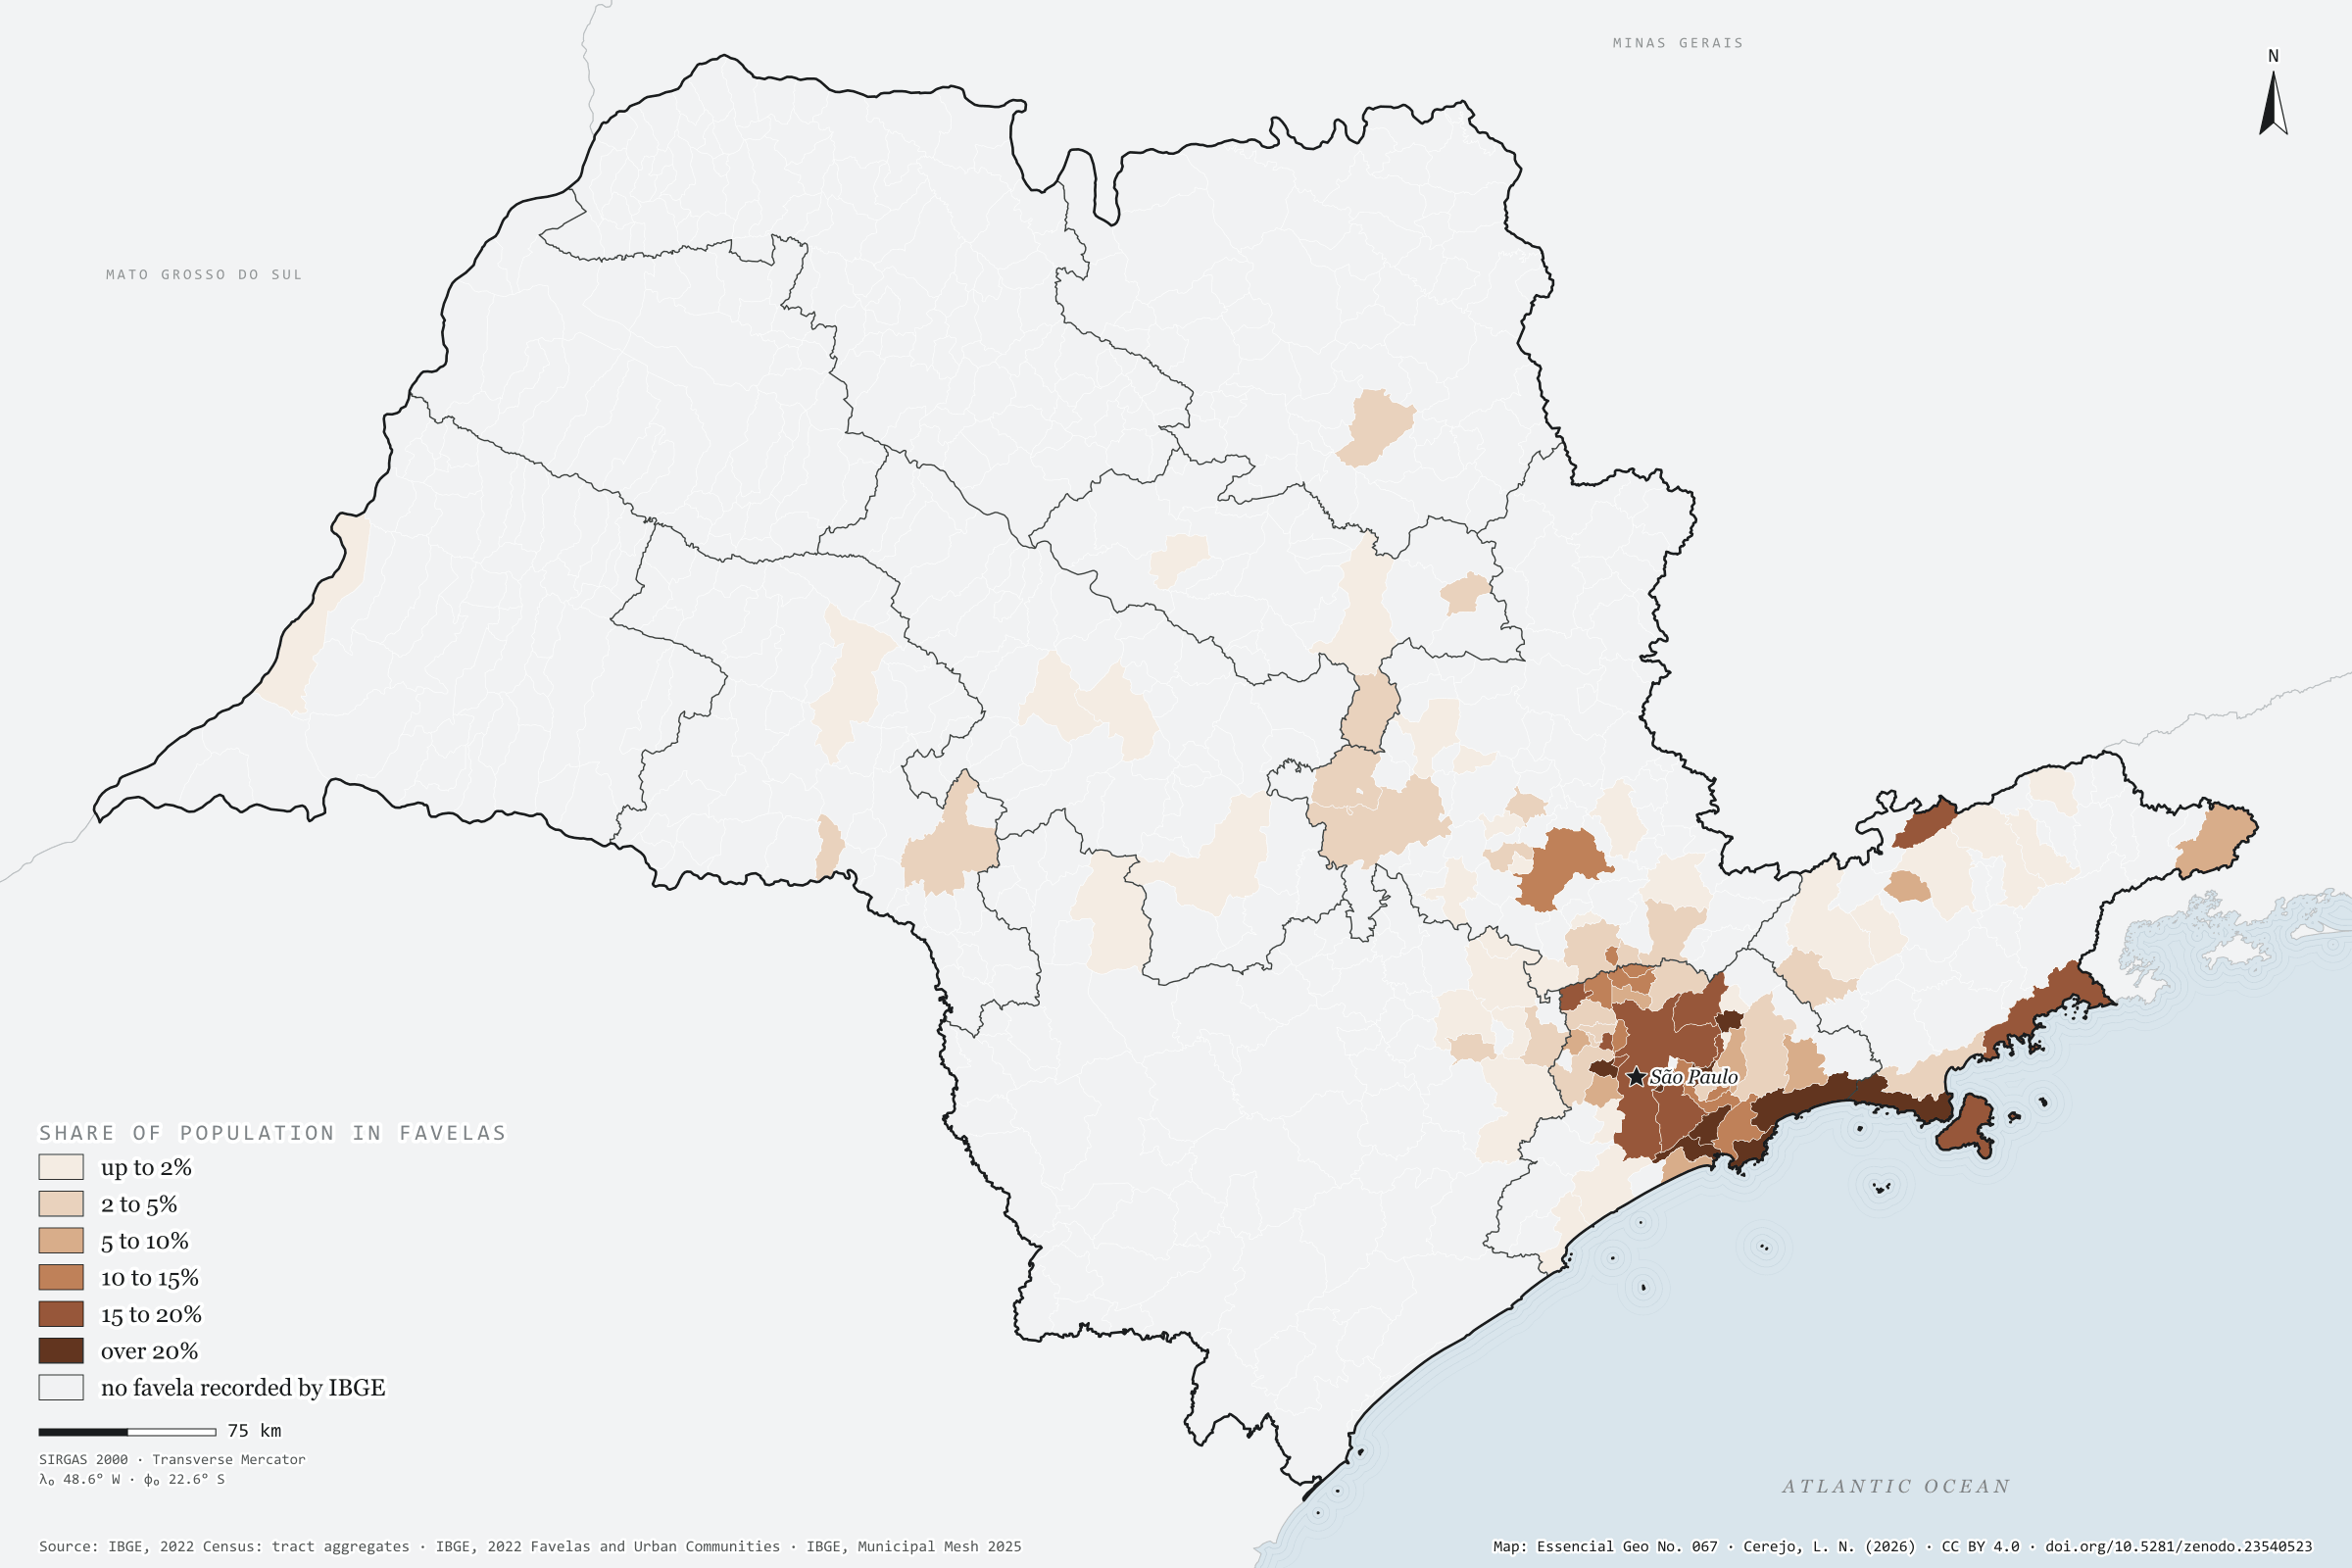
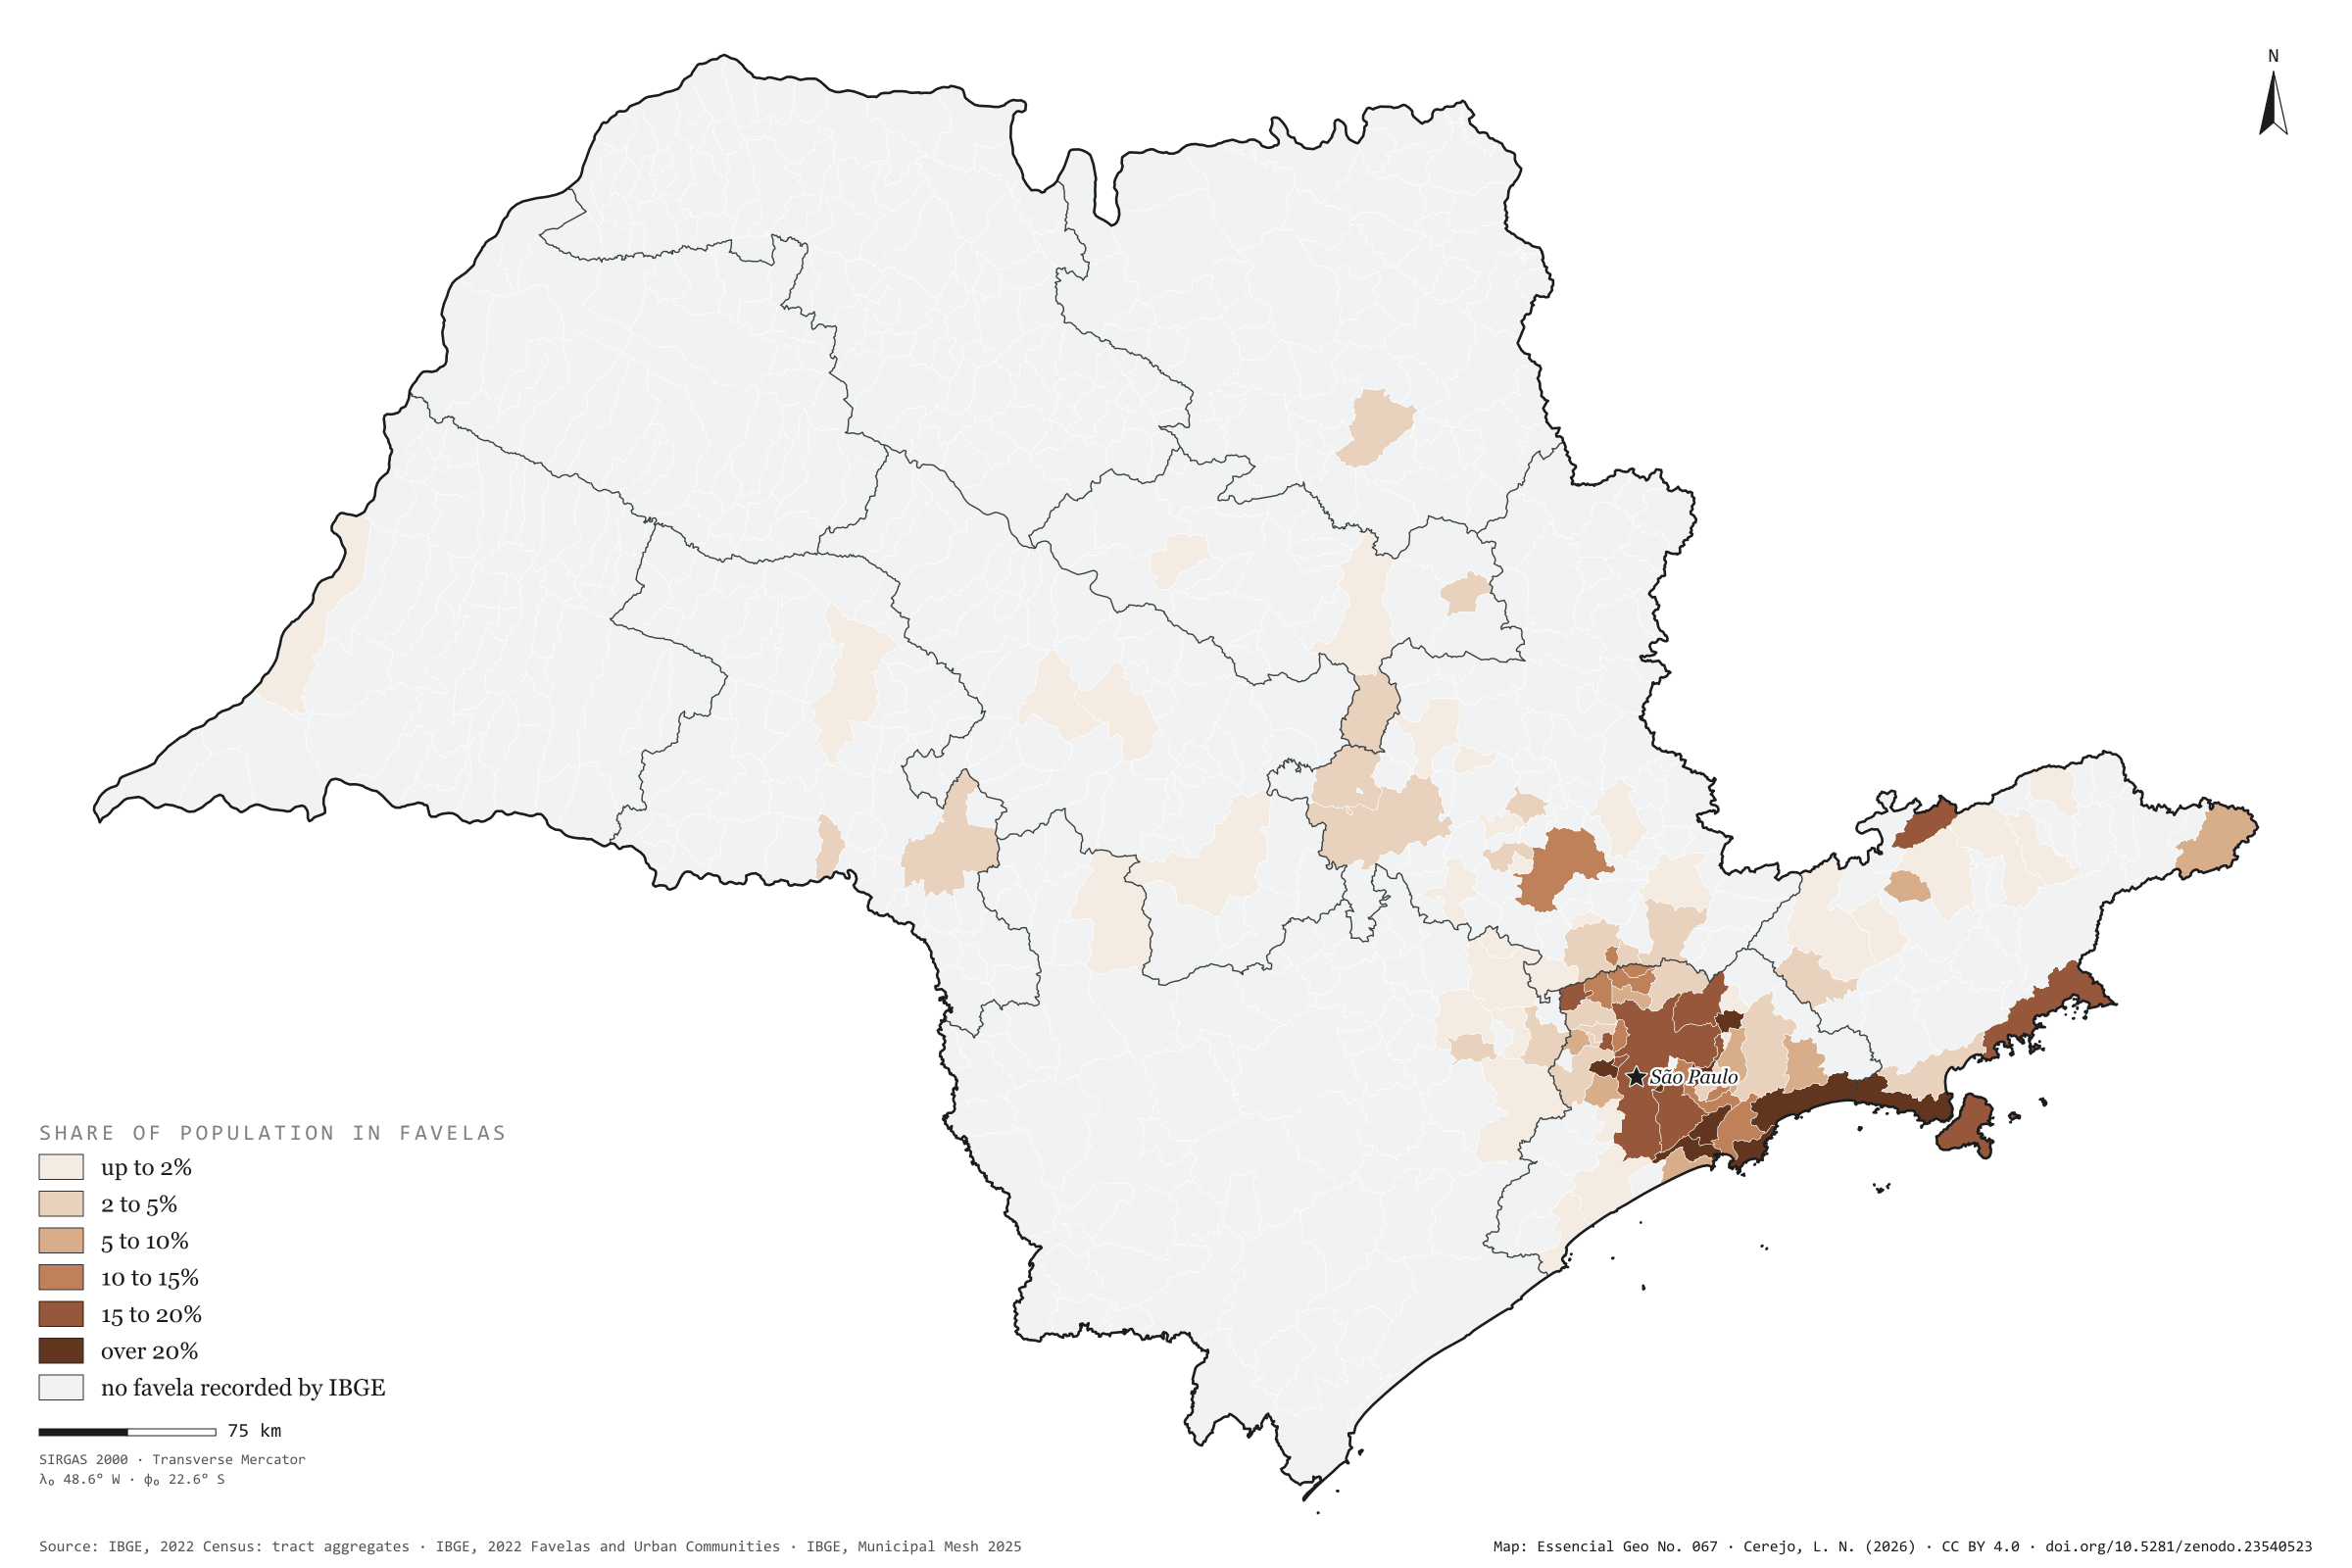
In 2022, 3.63 million people in São Paulo lived in tracts that IBGE classed as Favelas and Urban Communities: 8.2% of the population, one in twelve. There are 3,136 favelas and communities in 92 of the 645 municipalities. The capital has 1.73 million residents in them, nearly half the state’s total, in 1,363 communities: 15% of the city. By share of population, the coast leads: in Guarujá, 37% of residents live in favelas; in Cubatão, 33%; in São Sebastião, 30%. Outside the capital, the town with most people in favelas is Guarulhos, with 216,000, ahead of São Bernardo do Campo and Campinas. Inland, the exception is Campinas, with 12% of its population in favelas; in Ribeirão Preto it is 3%, in Sorocaba 2%. First plate of the collection “Favelas and urban communities”.
Technical record · downloads · citation
At a glance
Favela residents by the municipality’s share of population in favelas (people)
up to 2%1.5%
2 to 5%4.2%
5 to 10%2.3%
10 to 15%12.5%
15 to 20%62.5%
over 20%17%
People in favelas and urban communities
8.2%
3.63 million people
Favelas and urban communities
3,136communities
in 92 municipalities
Layers
setores_fcupolygon8,008 tracts in Favelas and Urban Communities: community code and name, municipality, people and occupied households
municipiospolygon645 municipalities: people, people in favelas, number of communities, population share, surroundings and income inside and outside
regioes_intermediariaspolygon11 intermediate geographic regions
People in census tracts coded as a Favela or Urban Community over all people in each municipality, from the 2022 Census tract aggregates, in six classes; municipalities with no recorded favela shown apart.
The map without a frame, with legend, scale, reference system and credit written on it: ready for papers, lectures and slides. In two versions: with the basemap (neighbours and sea) or only the mapped area, on white.
CEREJO, Lucas Nakamura. Favelas e comunidades urbanas: um em cada doze paulistas, quase todos na metrópole e no litoral. Versão 1.0.0. [S. l.]: Zenodo, 2026. Conjunto de dados. DOI: 10.5281/zenodo.23540523. Disponível em: https://doi.org/10.5281/zenodo.23540523. Acesso em: 10 nov. 2026.
Cerejo, L. N. (2026). Favelas e comunidades urbanas: um em cada doze paulistas, quase todos na metrópole e no litoral [Favelas and urban communities: One in twelve people in São Paulo, nearly all in the metropolis and on the coast] (Version 1.0.0) [Data set]. Zenodo. https://doi.org/10.5281/zenodo.23540523
@dataset{cerejo2026_favelas_sp,
  author    = {Cerejo, Lucas Nakamura},
  title     = {Favelas e comunidades urbanas: Um em cada doze paulistas, quase todos na metrópole e no litoral},
  year      = {2026},
  publisher = {Zenodo},
  version   = {1.0.0},
  doi       = {10.5281/zenodo.23540523},
  url       = {https://doi.org/10.5281/zenodo.23540523},
  language  = {portuguese},
  note      = {English title: Favelas and urban communities: One in twelve people in São Paulo, nearly all in the metropolis and on the coast. Licence CC BY 4.0}
}
Three in every hundred people in São Paulo live in the countryside
Fig. 066São Paulo State (SP)EPSG:4674Source: IBGE
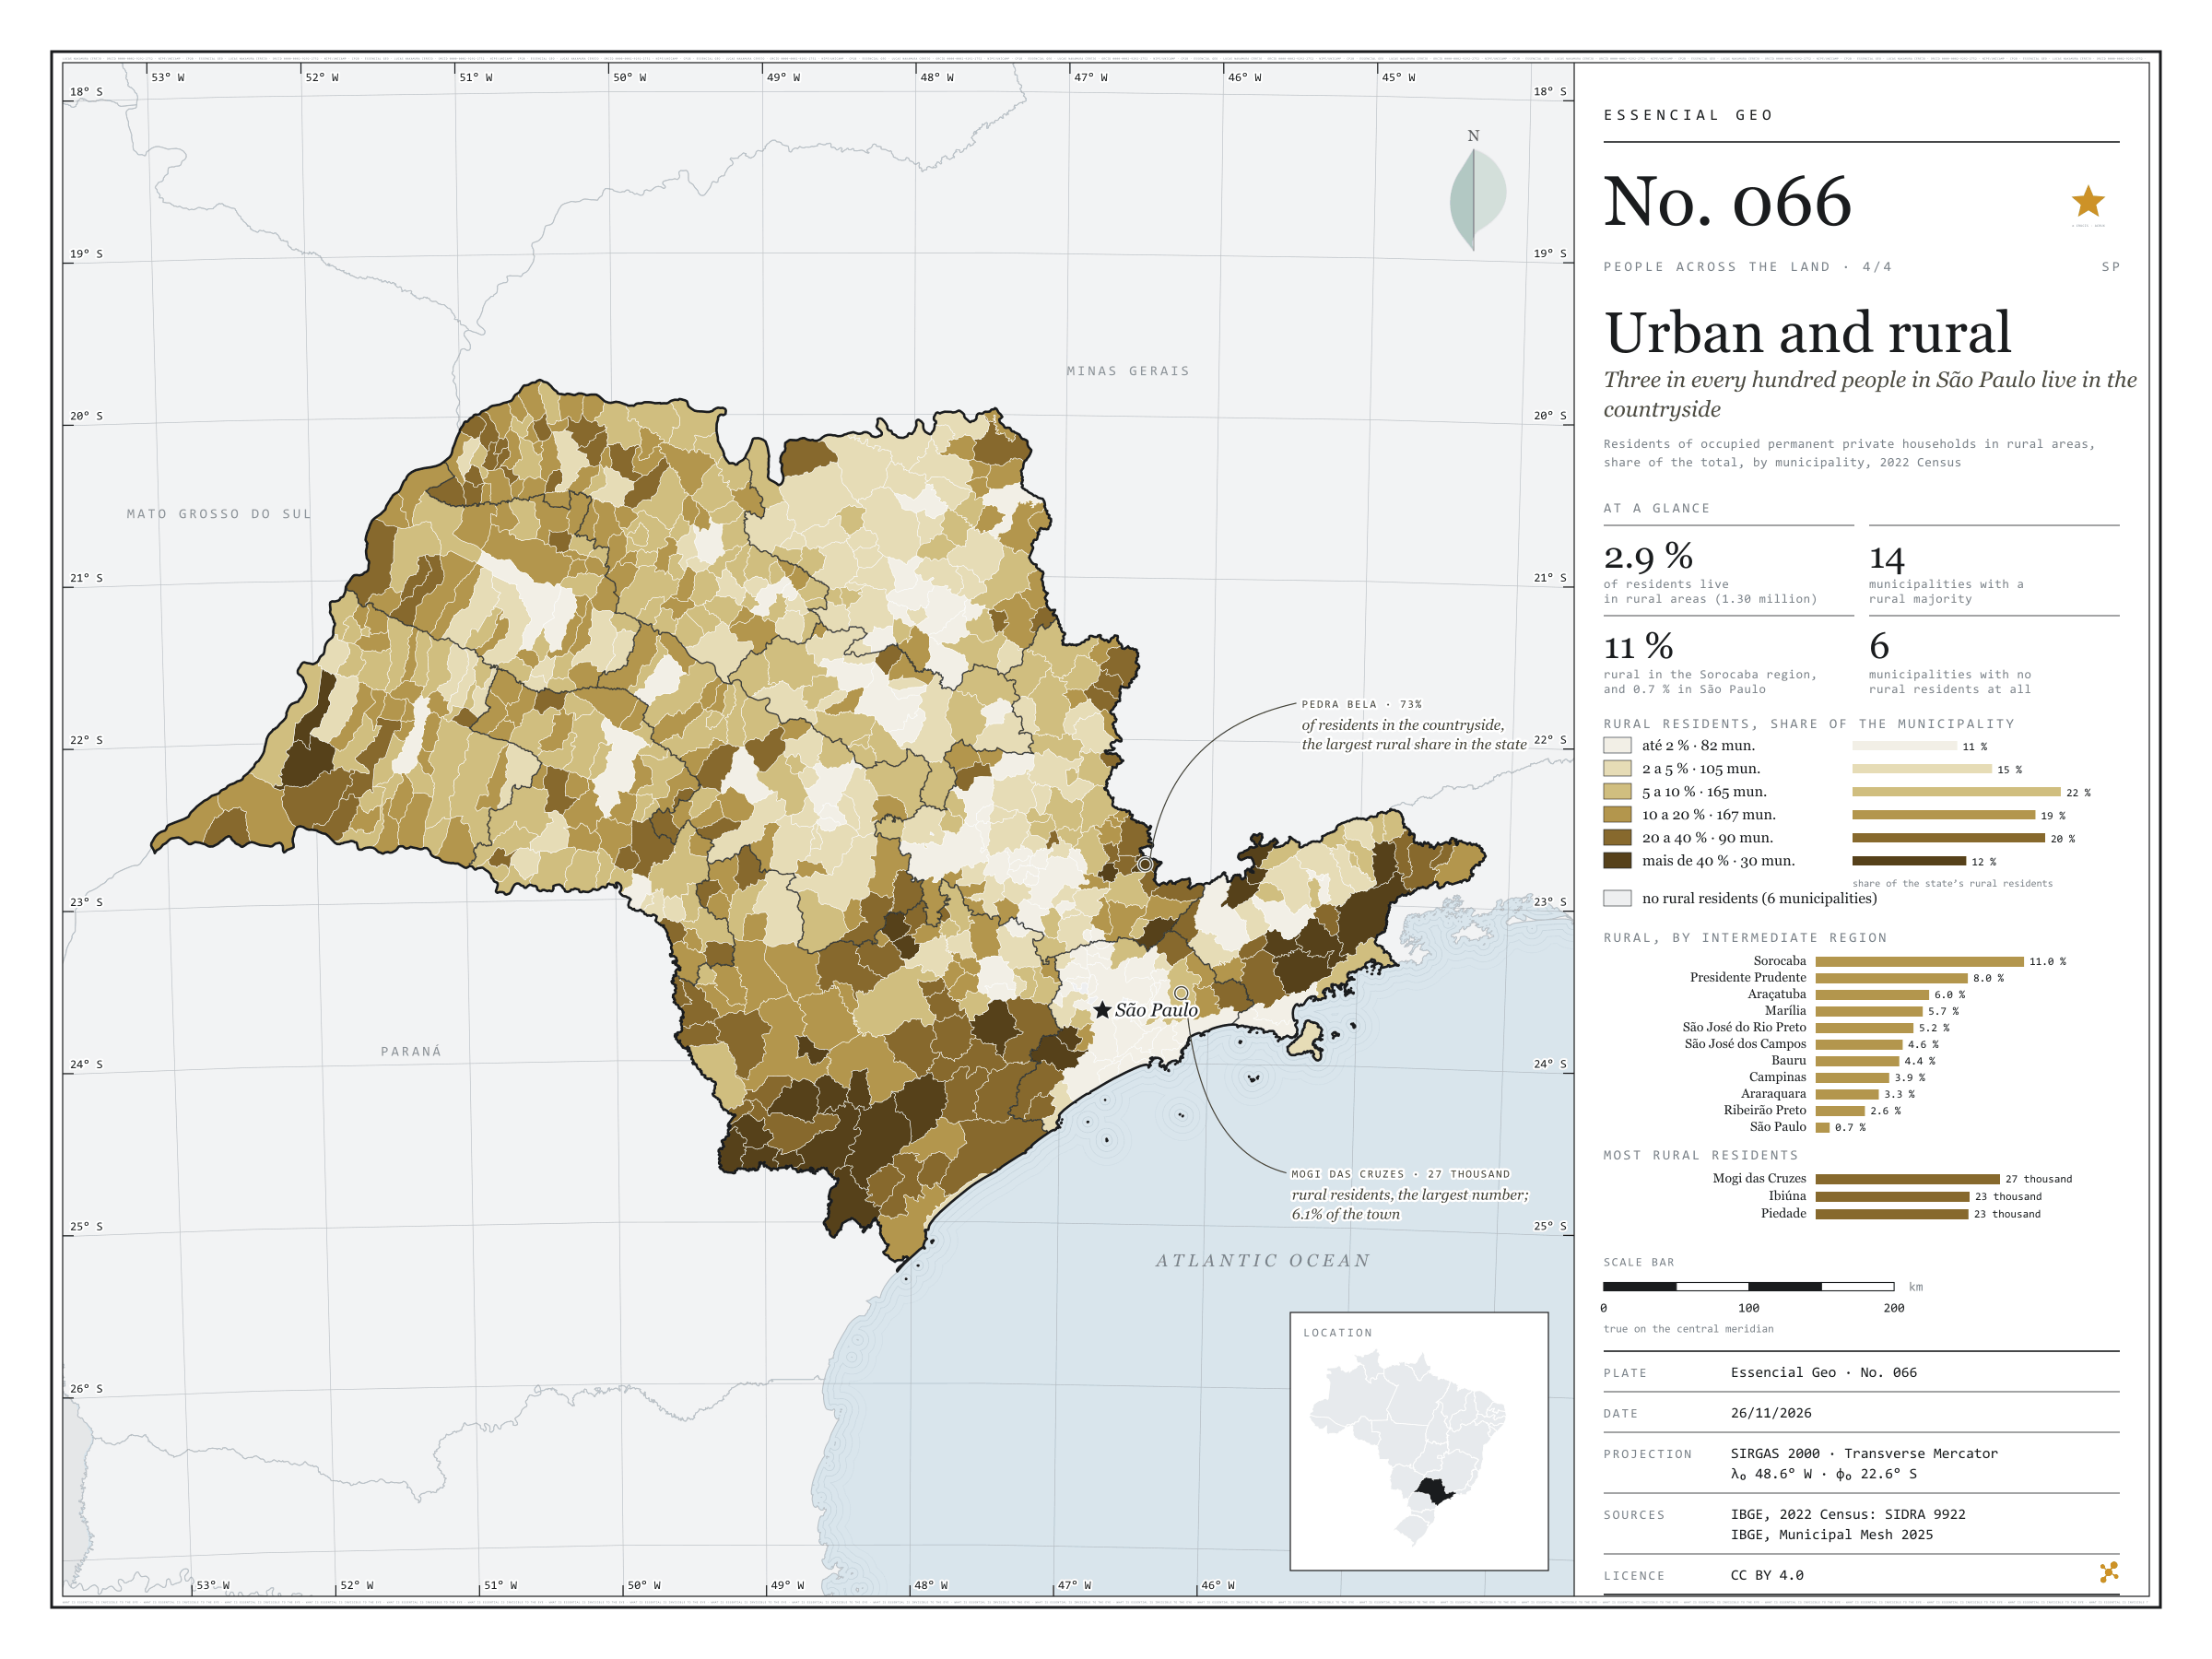
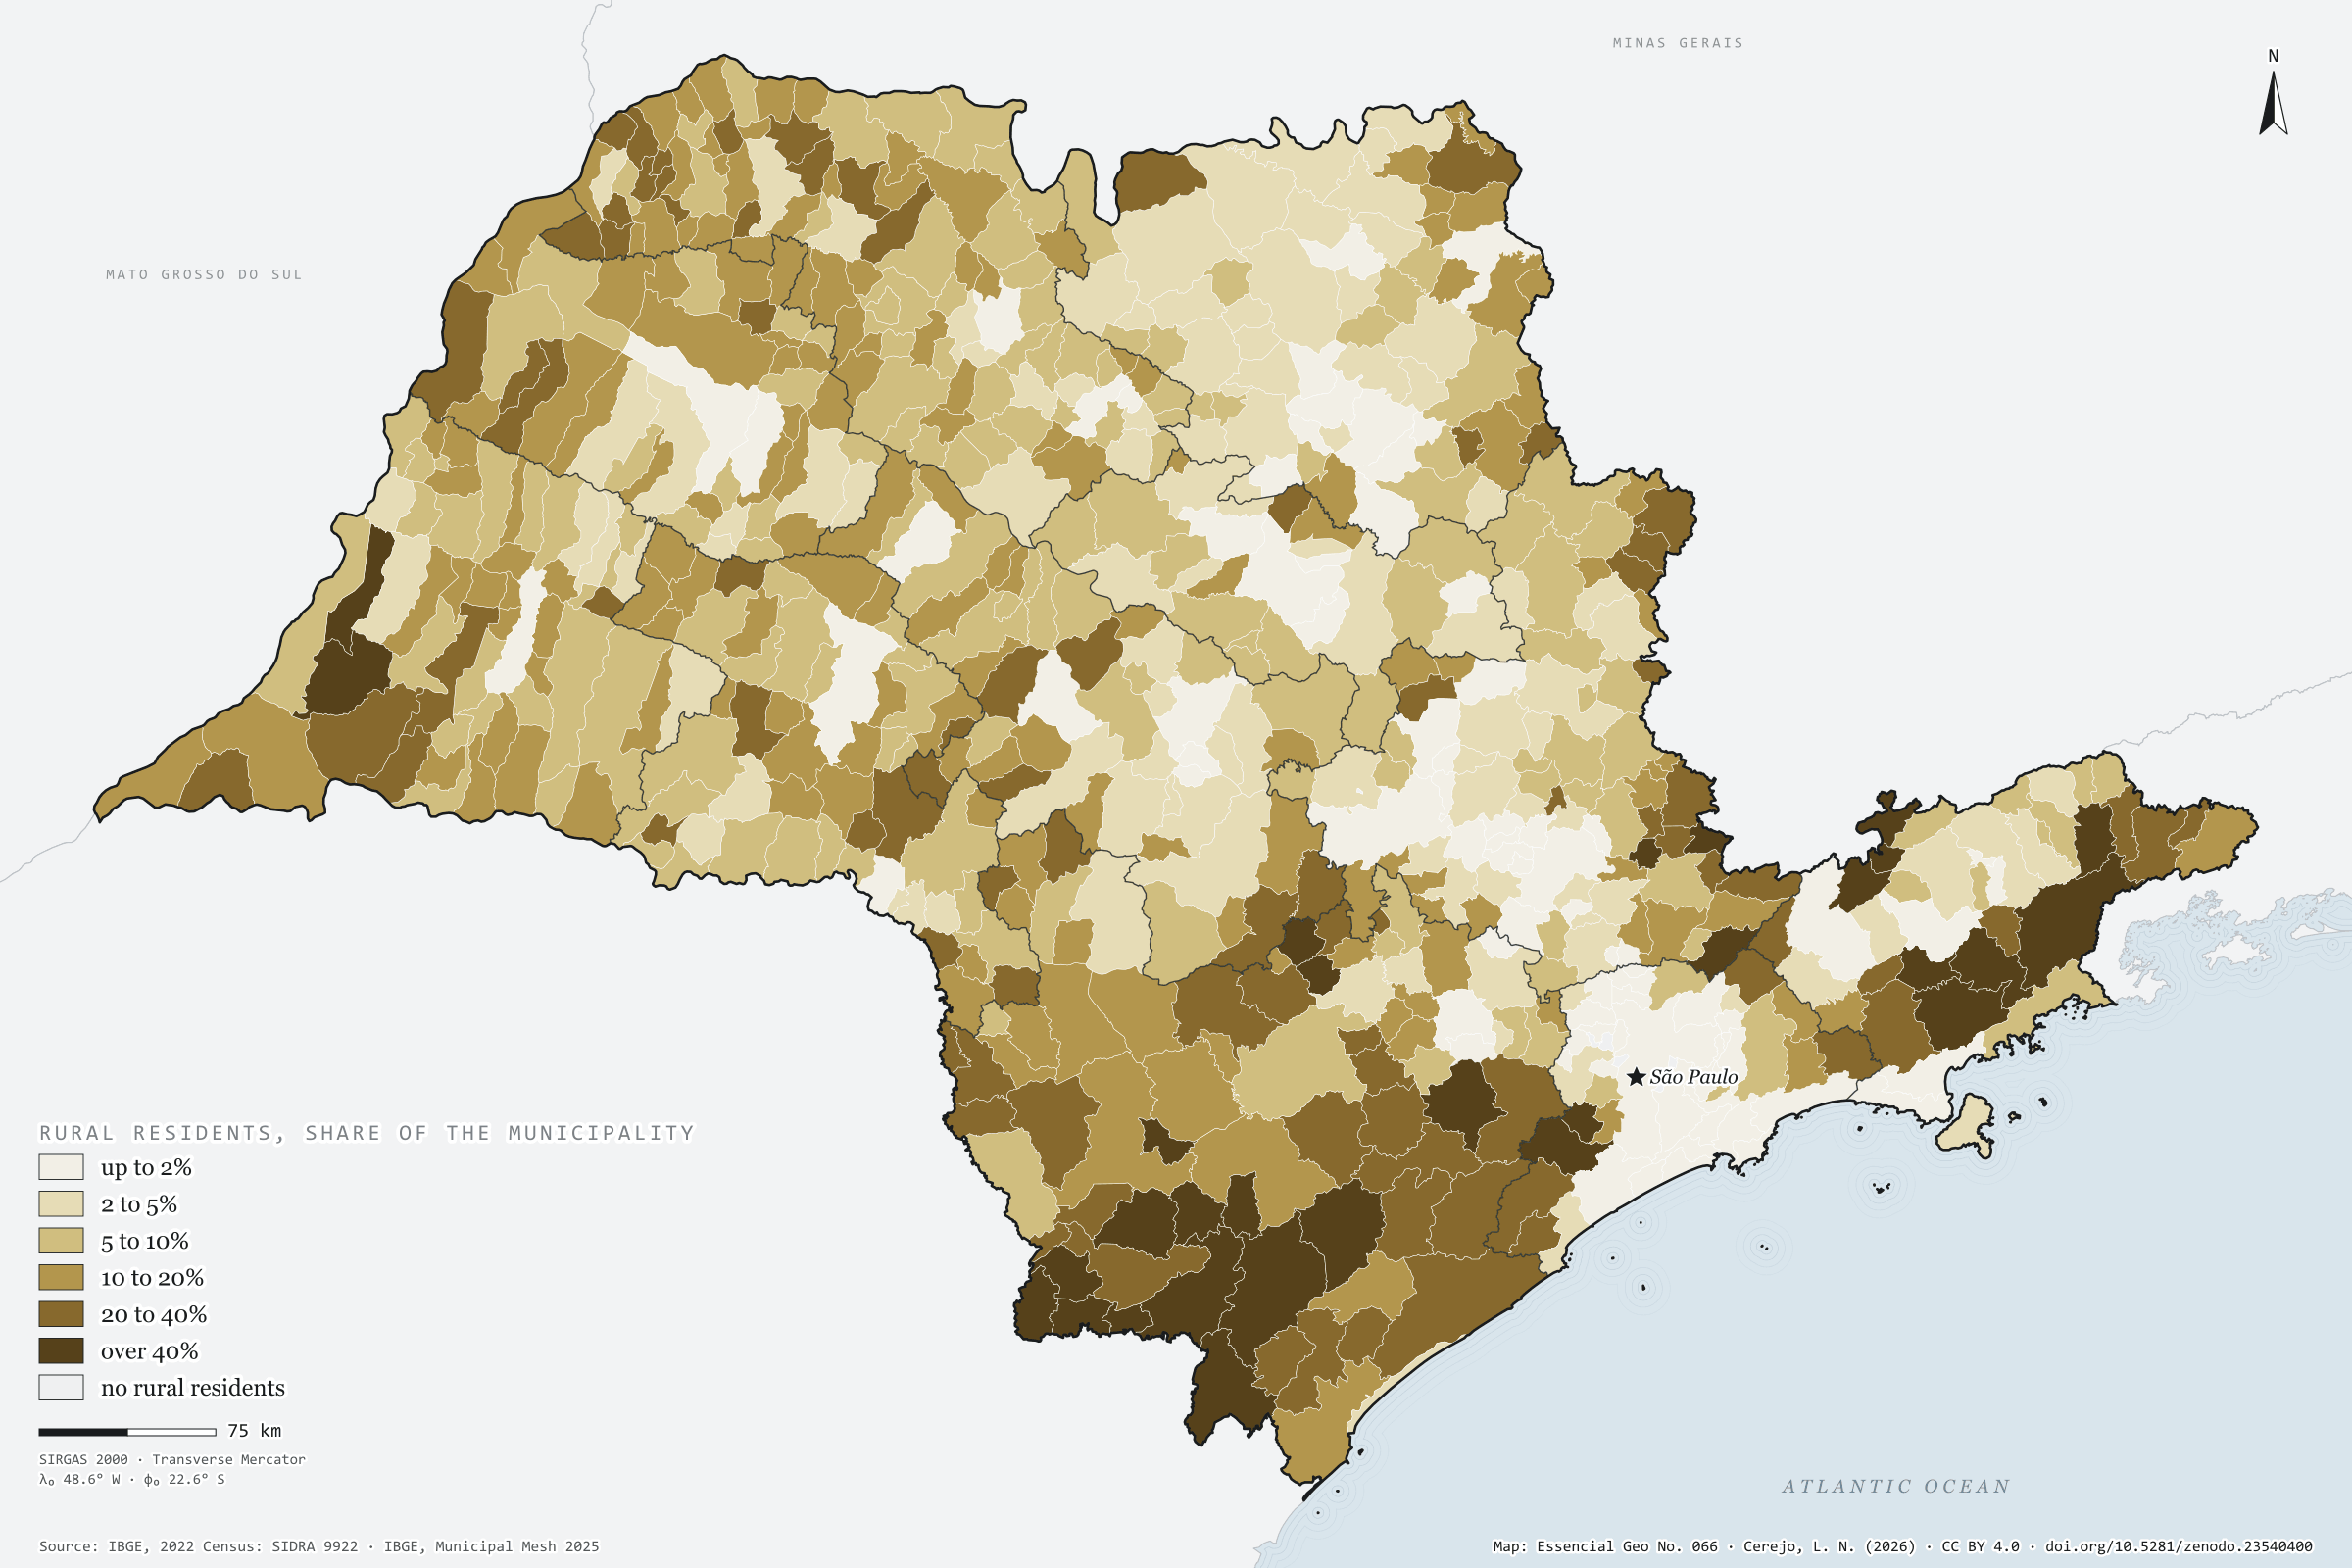
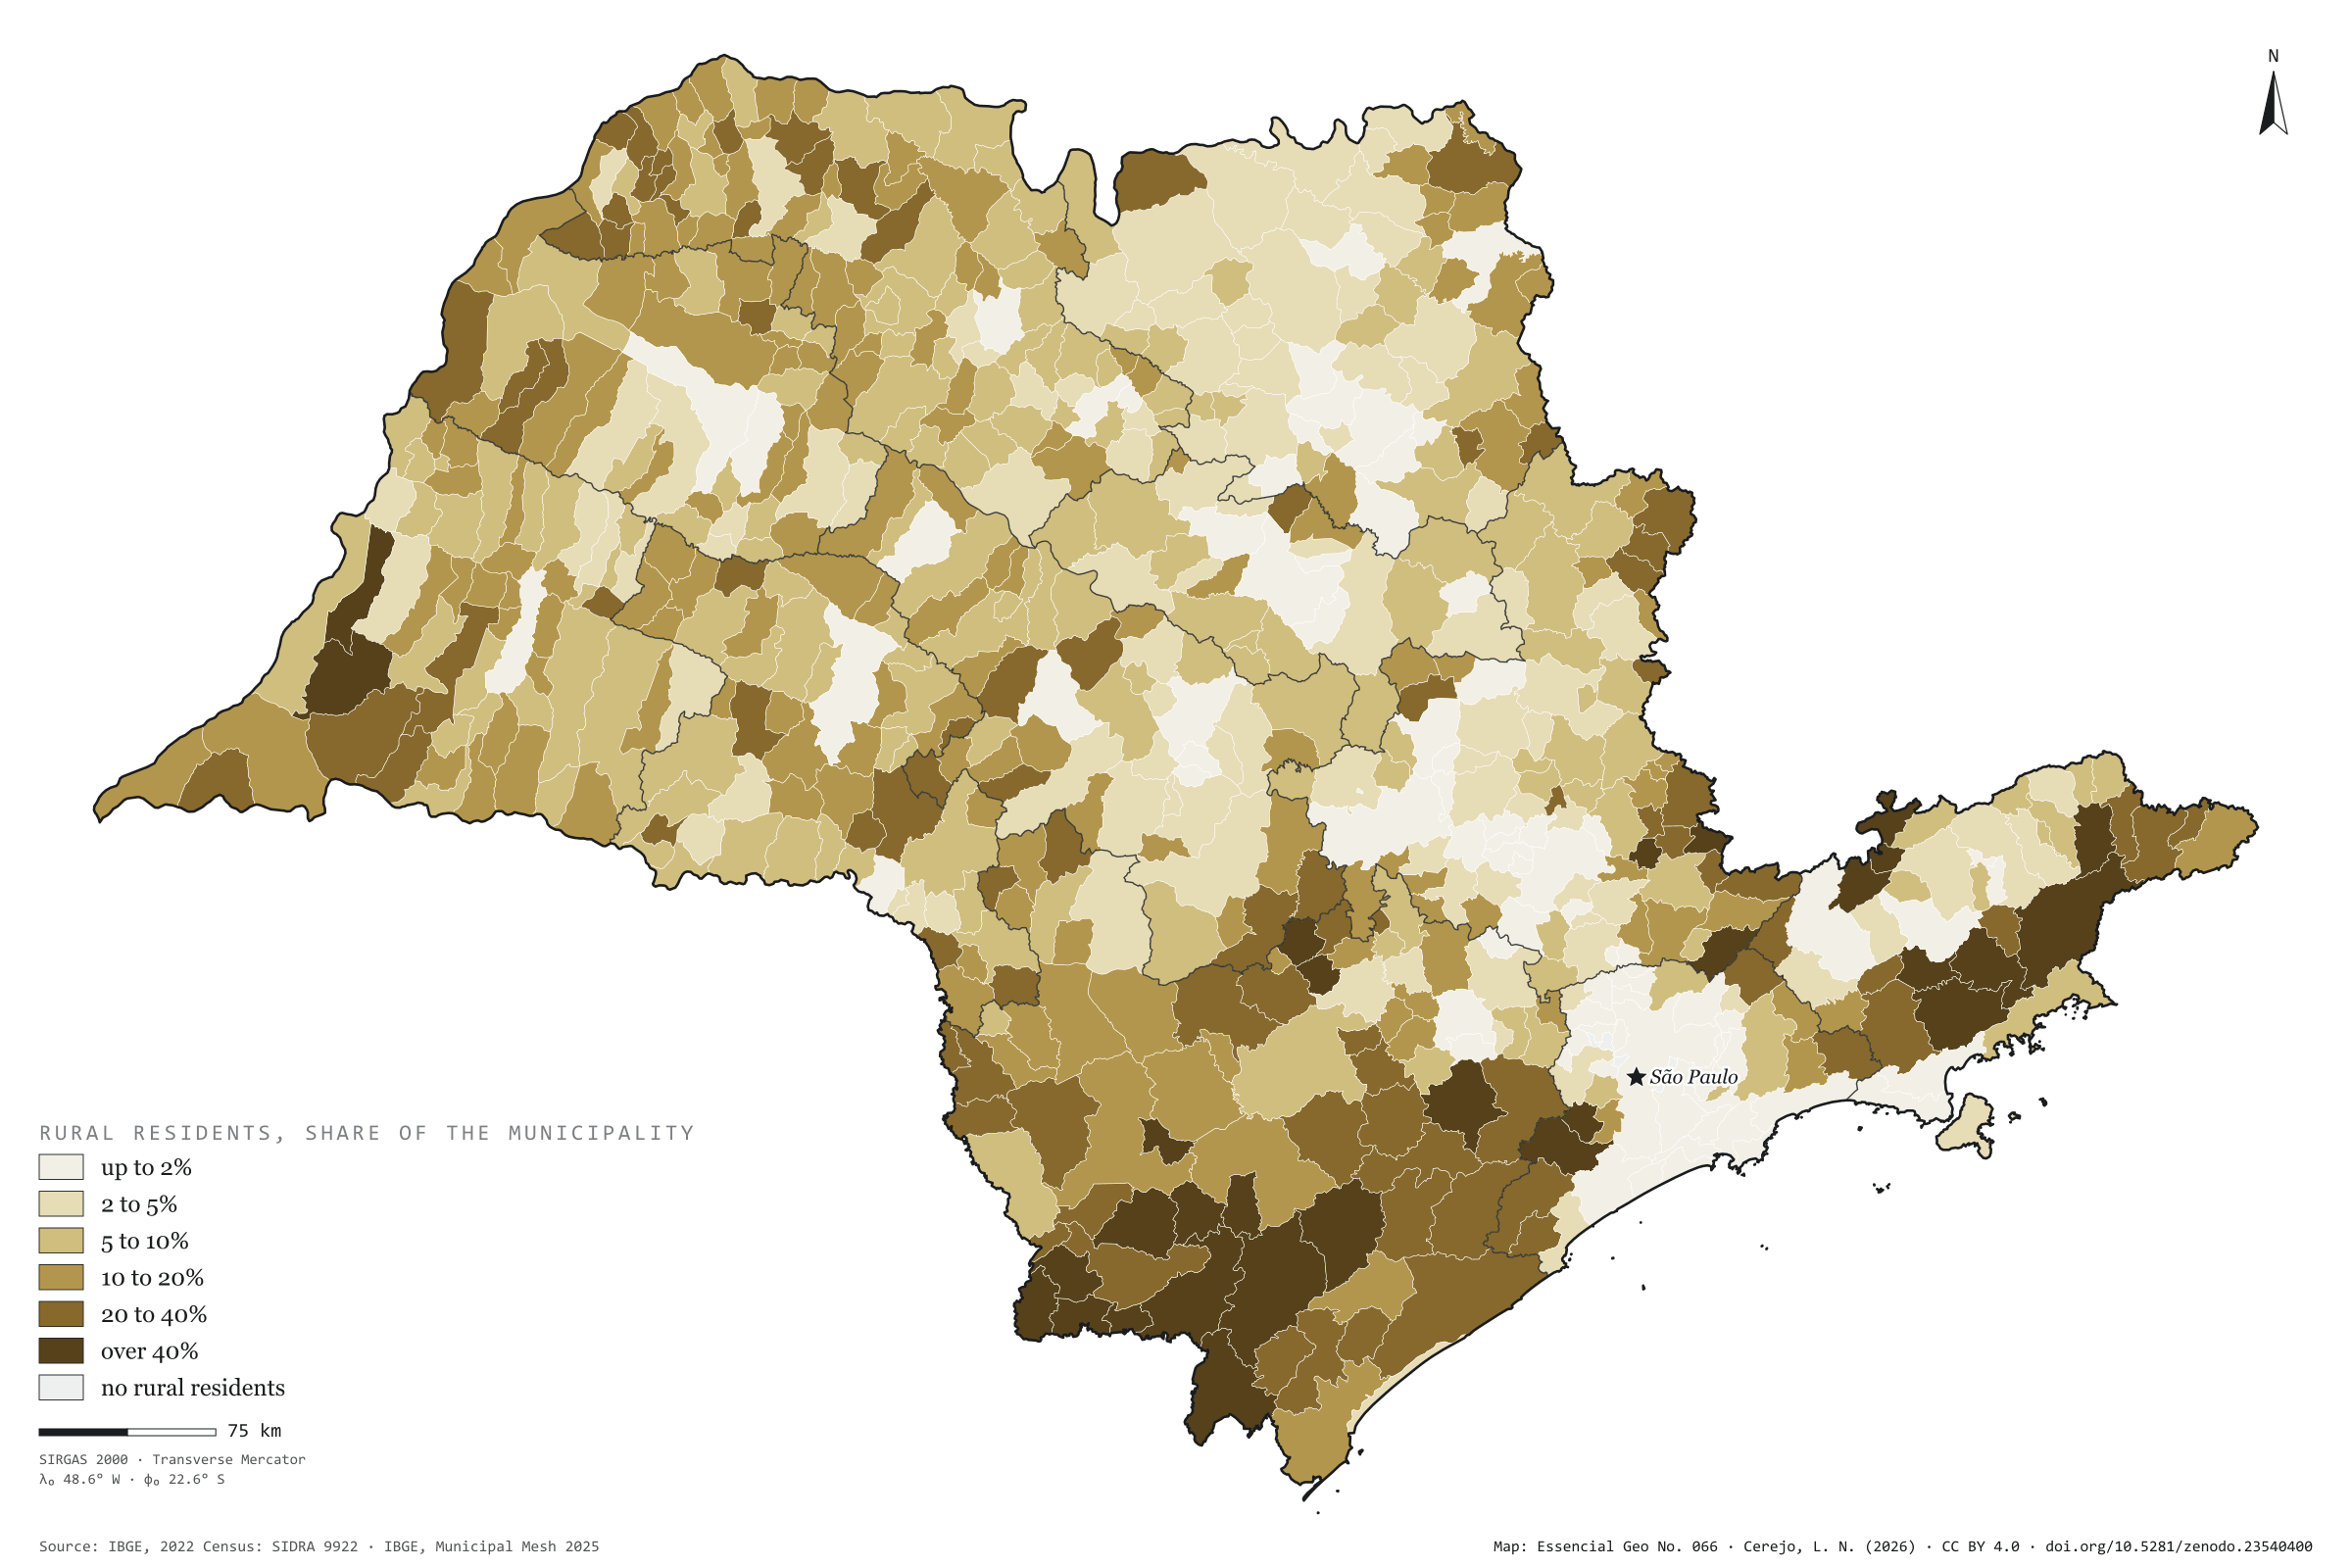
Of the 44.1 million residents of private households in São Paulo, 1.30 million live in rural areas: 2.9%, three in every hundred. The state’s countryside is concentrated in the south and east: in the Sorocaba intermediate region, 11% of residents are rural; in Presidente Prudente, 8%; in São Paulo, 0.7%. The map darkens in the Ribeira Valley and the upper Paranapanema, the Mantiqueira and the Serra do Mar, where towns are small and homes scattered. Pedra Bela, on the border with Minas Gerais, has 73% of its residents in the countryside, and 14 municipalities have a rural majority. In numbers, the largest countryside is Mogi das Cruzes’s, with 27,000 rural residents, ahead of Ibiúna and Piedade; the capital has 16,000. Five municipalities in Greater São Paulo, and Águas de São Pedro, have none. Last plate of the collection “People across the land”.
Technical record · downloads · citation
At a glance
Rural residents by the municipality’s rural share (people)
up to 2%11.1%
2 to 5%14.8%
5 to 10%22.1%
10 to 20%19.4%
20 to 40%20.5%
over 40%12.1%
Residents of rural households
2.9%
1.30 million of 44.1 million
Municipalities with a rural majority
14municipalities
Layers
municipiospolygon645 municipalities: urban and rural households and residents, rural share, age and sex (the same layer as plate 064)
regioes_intermediariaspolygon11 intermediate geographic regions
Residents of occupied permanent private households in rural areas over all residents of those households, by municipality, from SIDRA 9922, in six classes; municipalities with no rural residents shown apart.
The map without a frame, with legend, scale, reference system and credit written on it: ready for papers, lectures and slides. In two versions: with the basemap (neighbours and sea) or only the mapped area, on white.
CEREJO, Lucas Nakamura. Urbano e rural: três em cada cem paulistas moram no campo. Versão 1.0.0. [S. l.]: Zenodo, 2026. Conjunto de dados. DOI: 10.5281/zenodo.23540400. Disponível em: https://doi.org/10.5281/zenodo.23540400. Acesso em: 10 nov. 2026.
Cerejo, L. N. (2026). Urbano e rural: três em cada cem paulistas moram no campo [Urban and rural: Three in every hundred people in São Paulo live in the countryside] (Version 1.0.0) [Data set]. Zenodo. https://doi.org/10.5281/zenodo.23540400
@dataset{cerejo2026_urbano_e_rural_sp,
  author    = {Cerejo, Lucas Nakamura},
  title     = {Urbano e rural: Três em cada cem paulistas moram no campo},
  year      = {2026},
  publisher = {Zenodo},
  version   = {1.0.0},
  doi       = {10.5281/zenodo.23540400},
  url       = {https://doi.org/10.5281/zenodo.23540400},
  language  = {portuguese},
  note      = {English title: Urban and rural: Three in every hundred people in São Paulo live in the countryside. Licence CC BY 4.0}
}
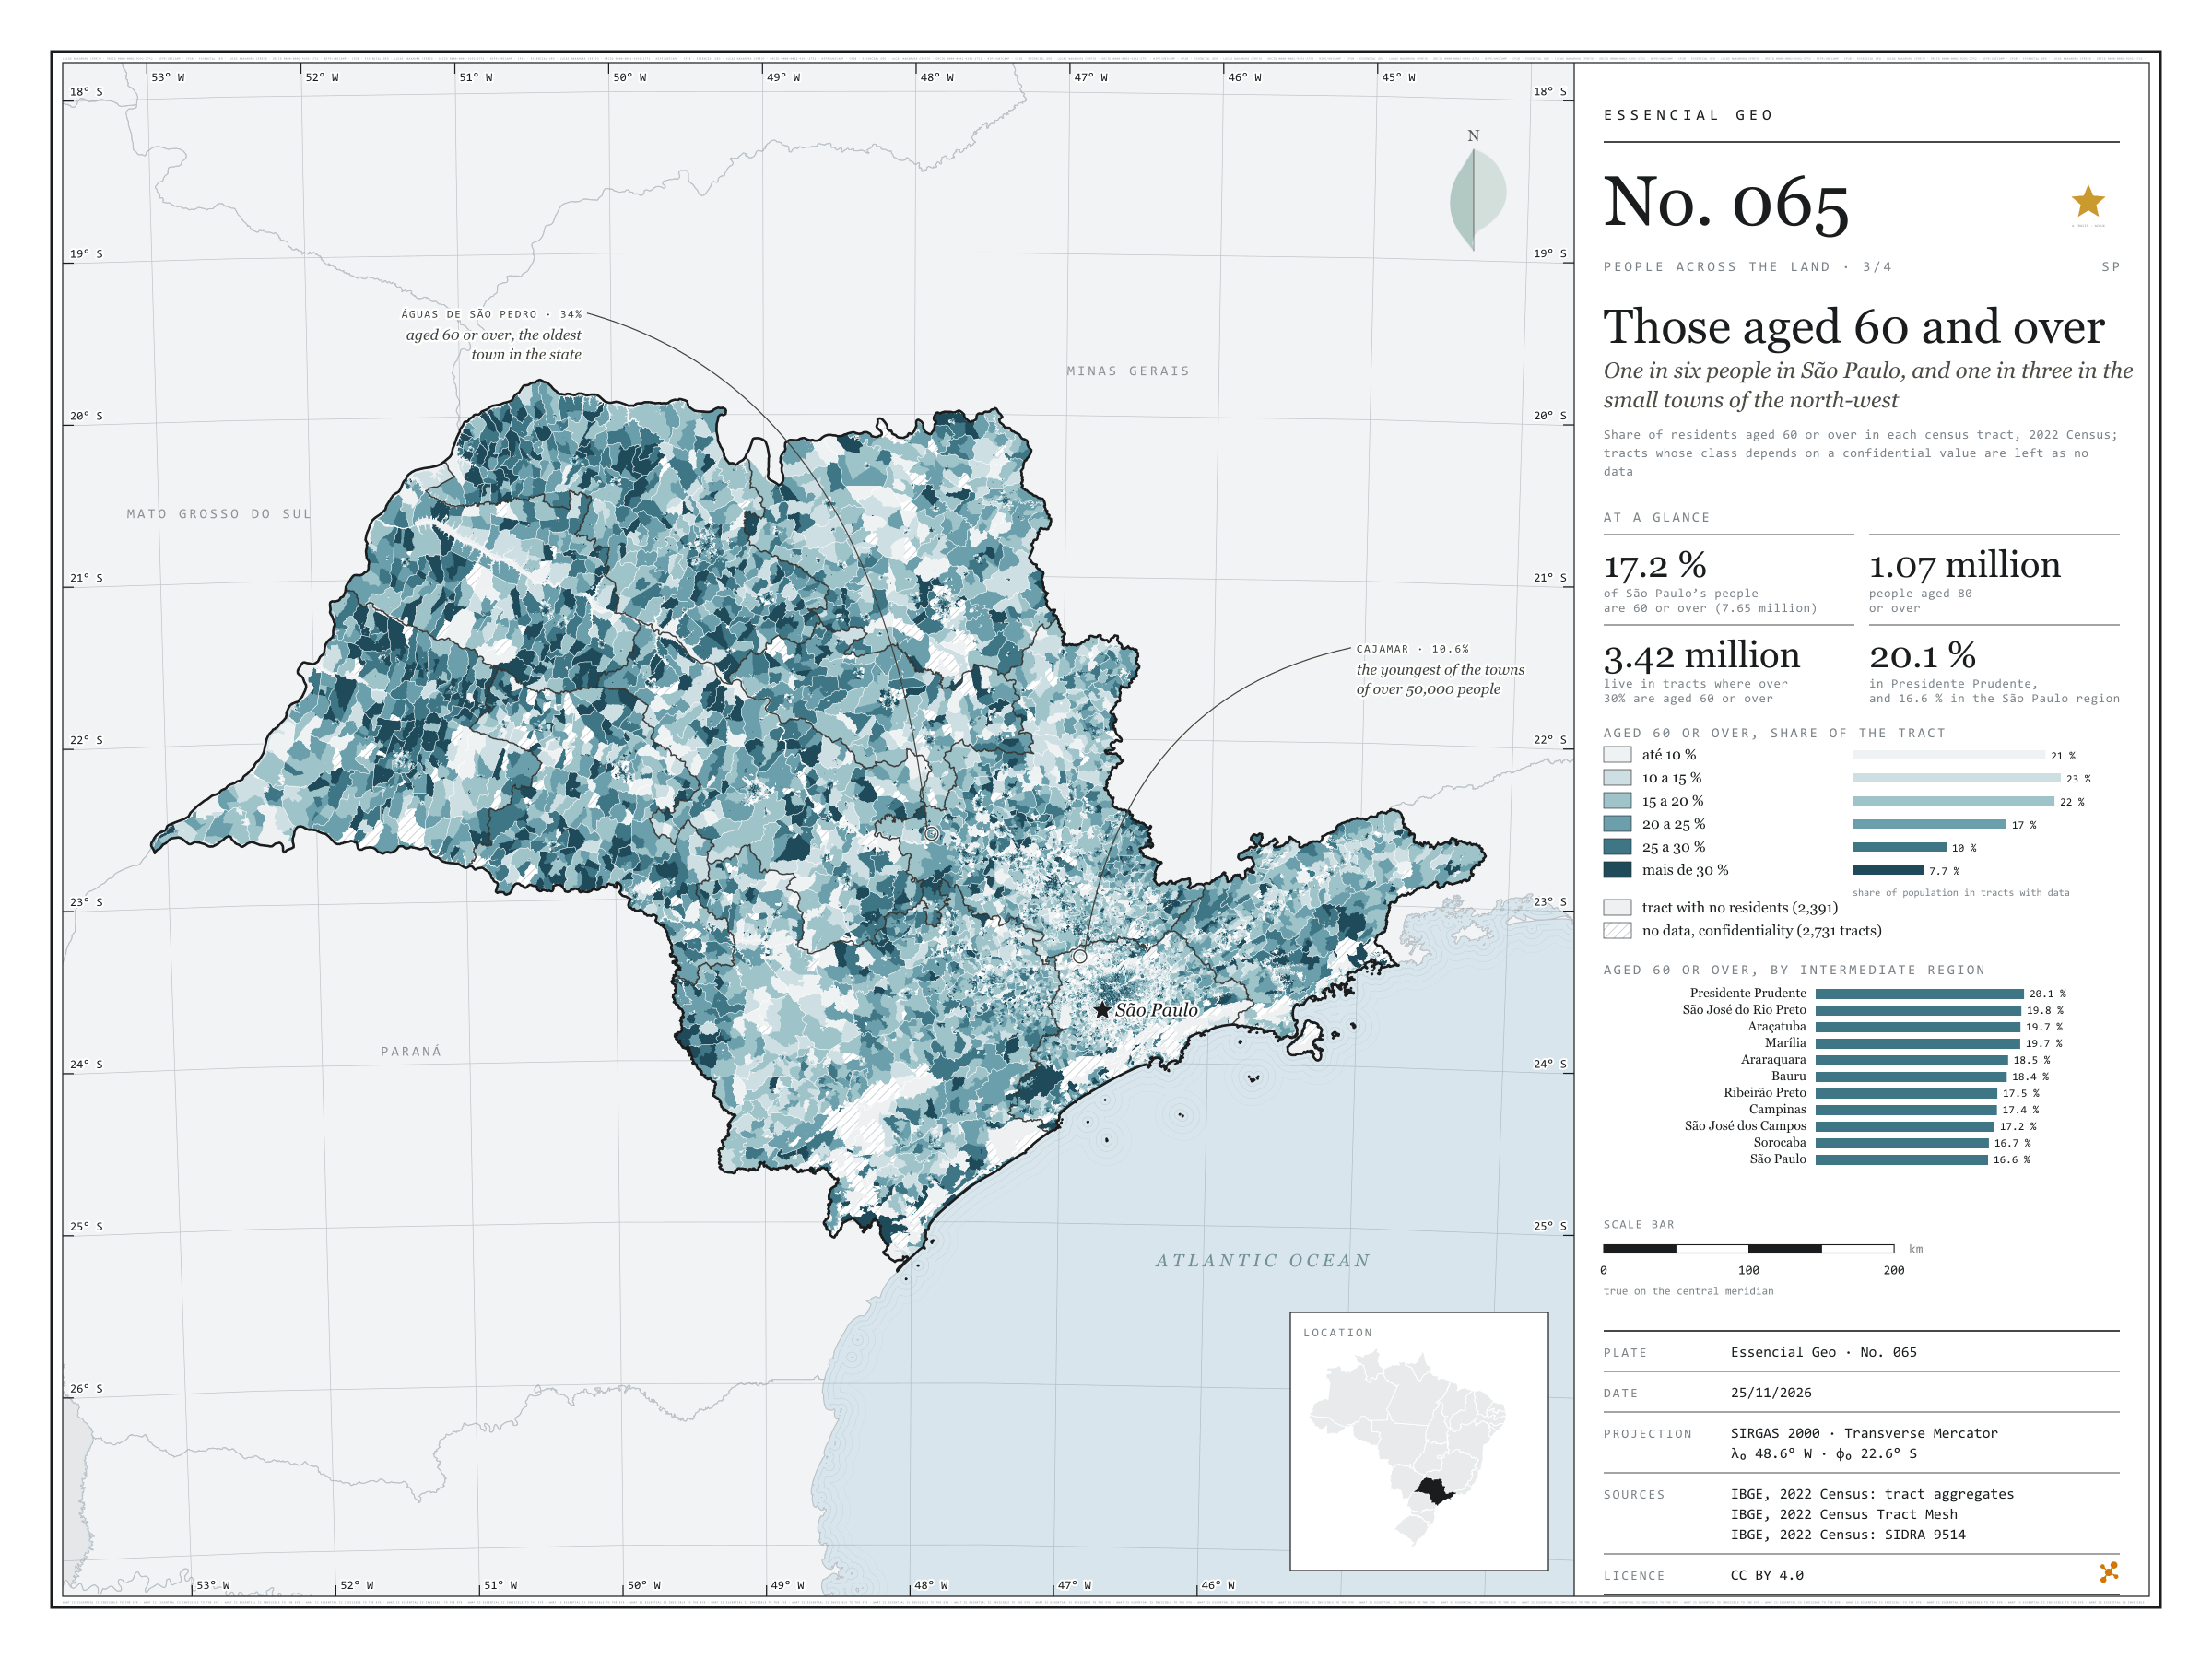
One in six people in São Paulo, and one in three in the small towns of the north-west
Fig. 065São Paulo State (SP)EPSG:4674Source: IBGE
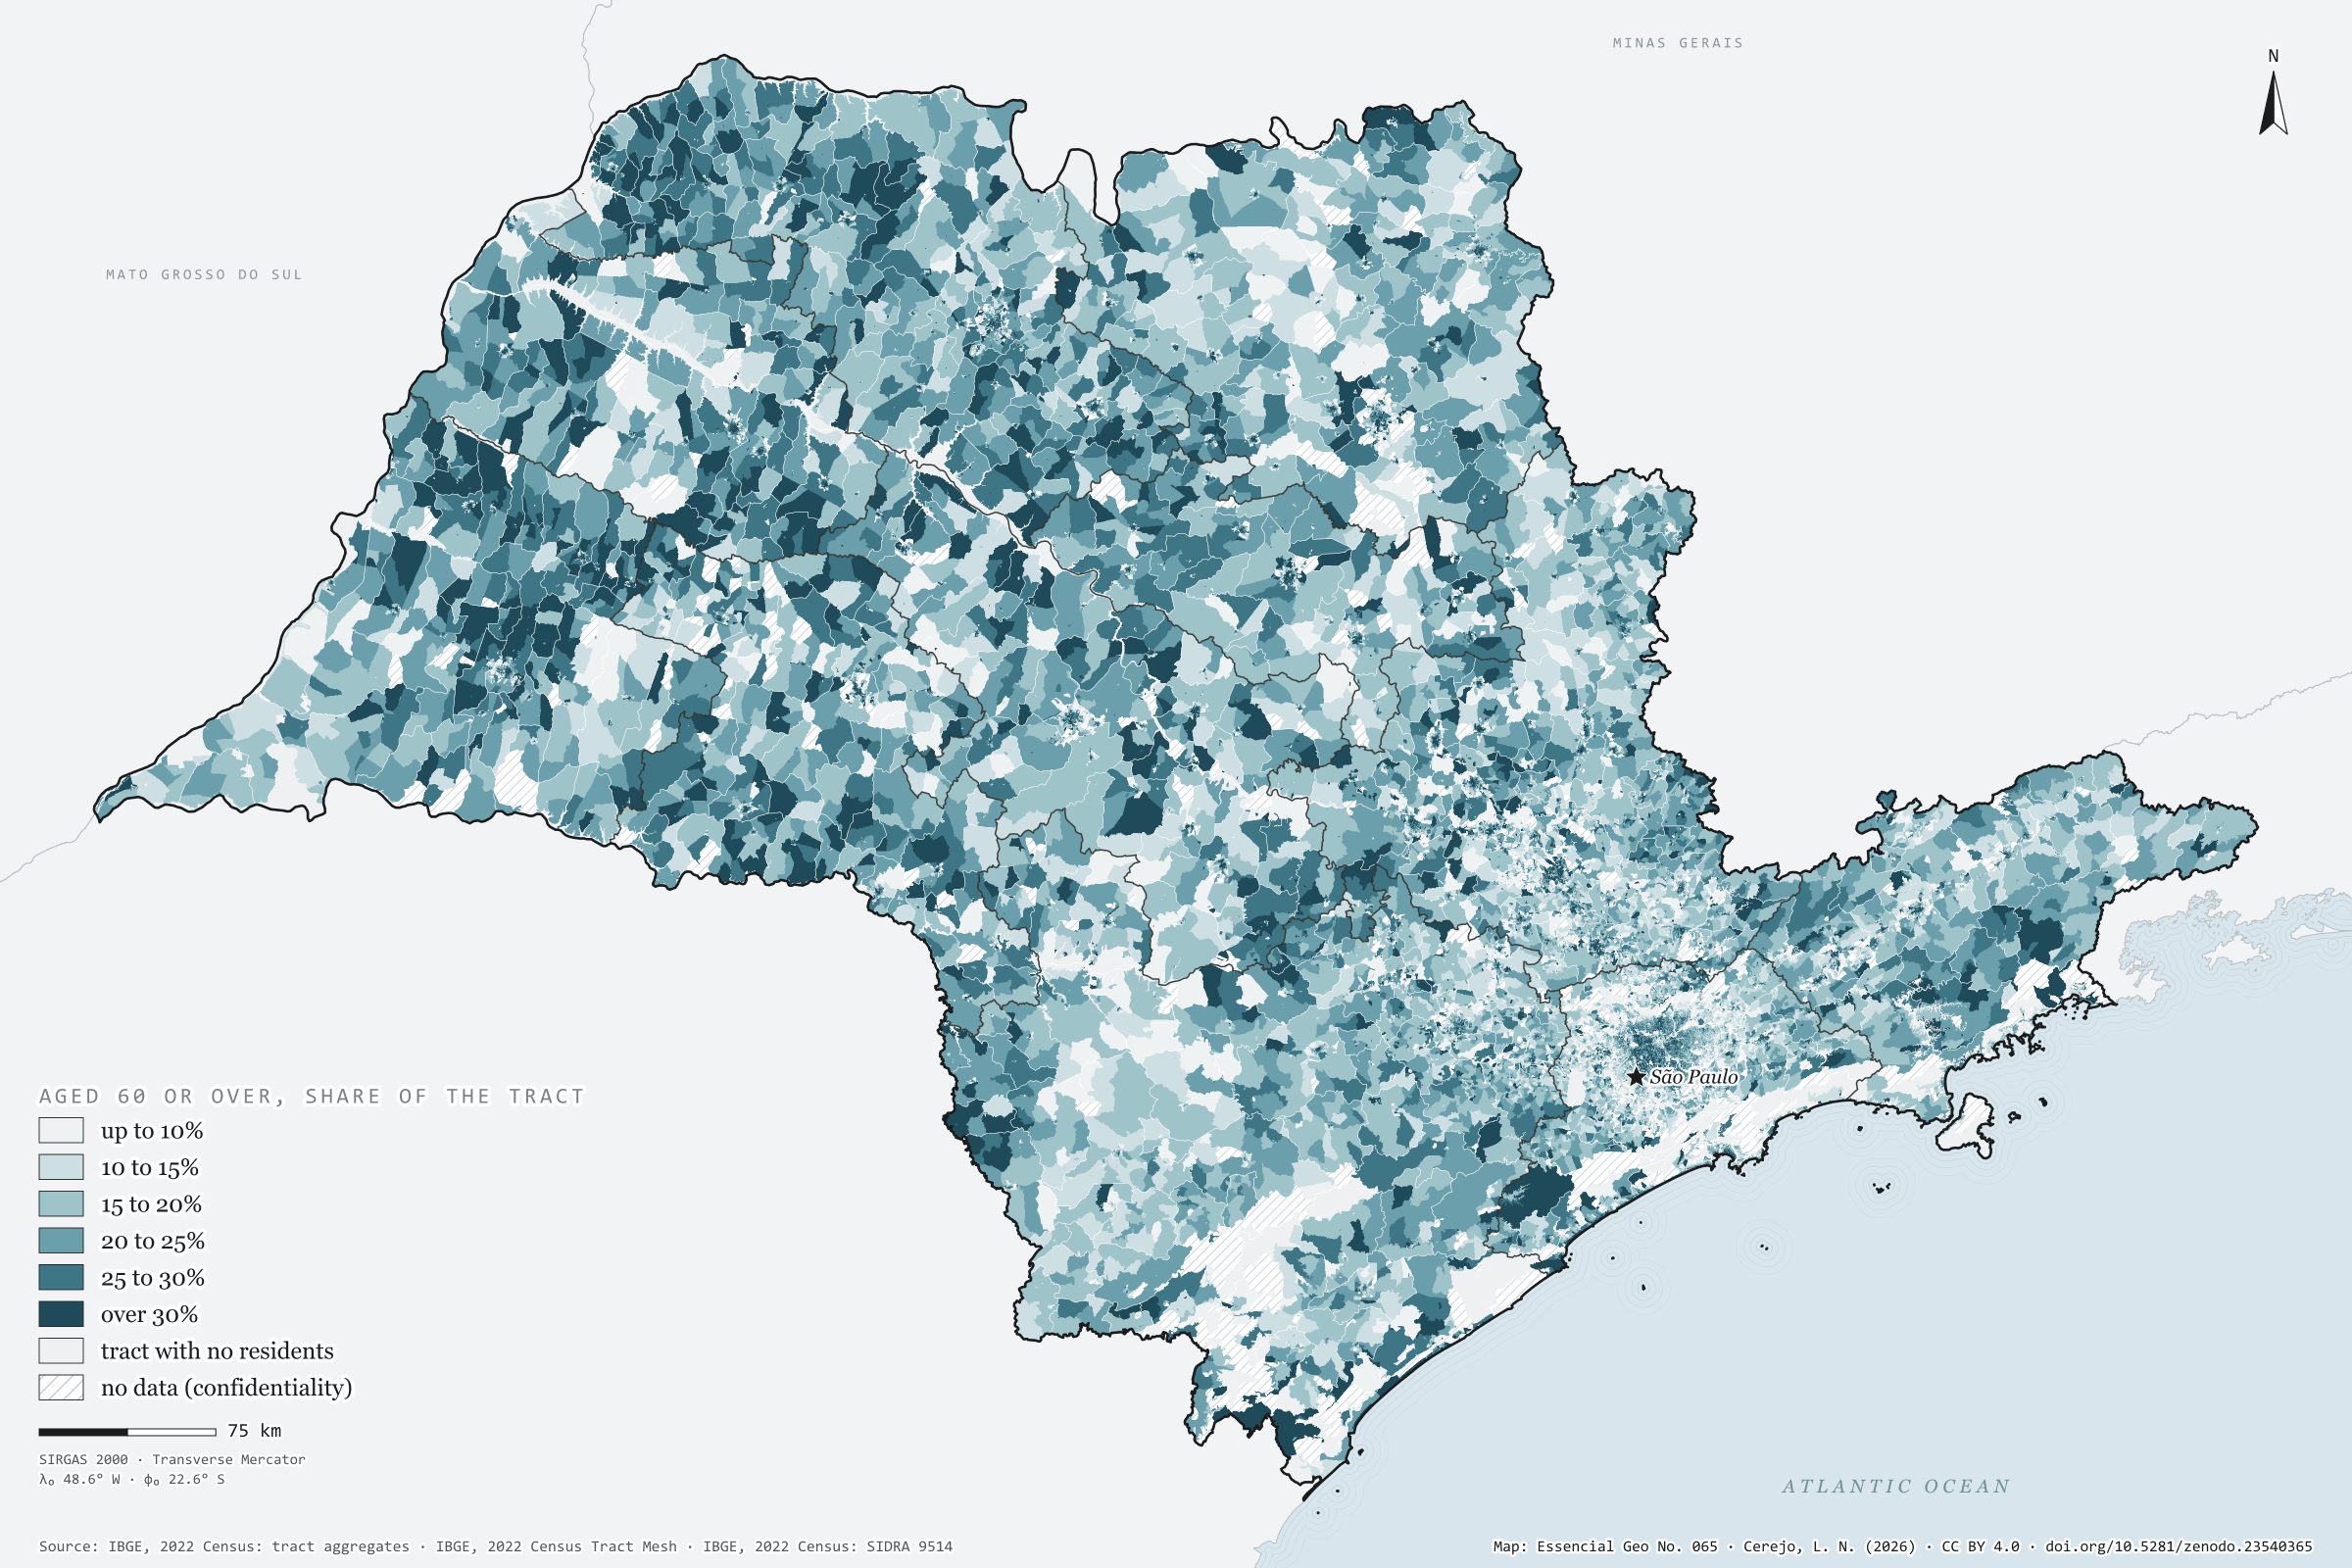
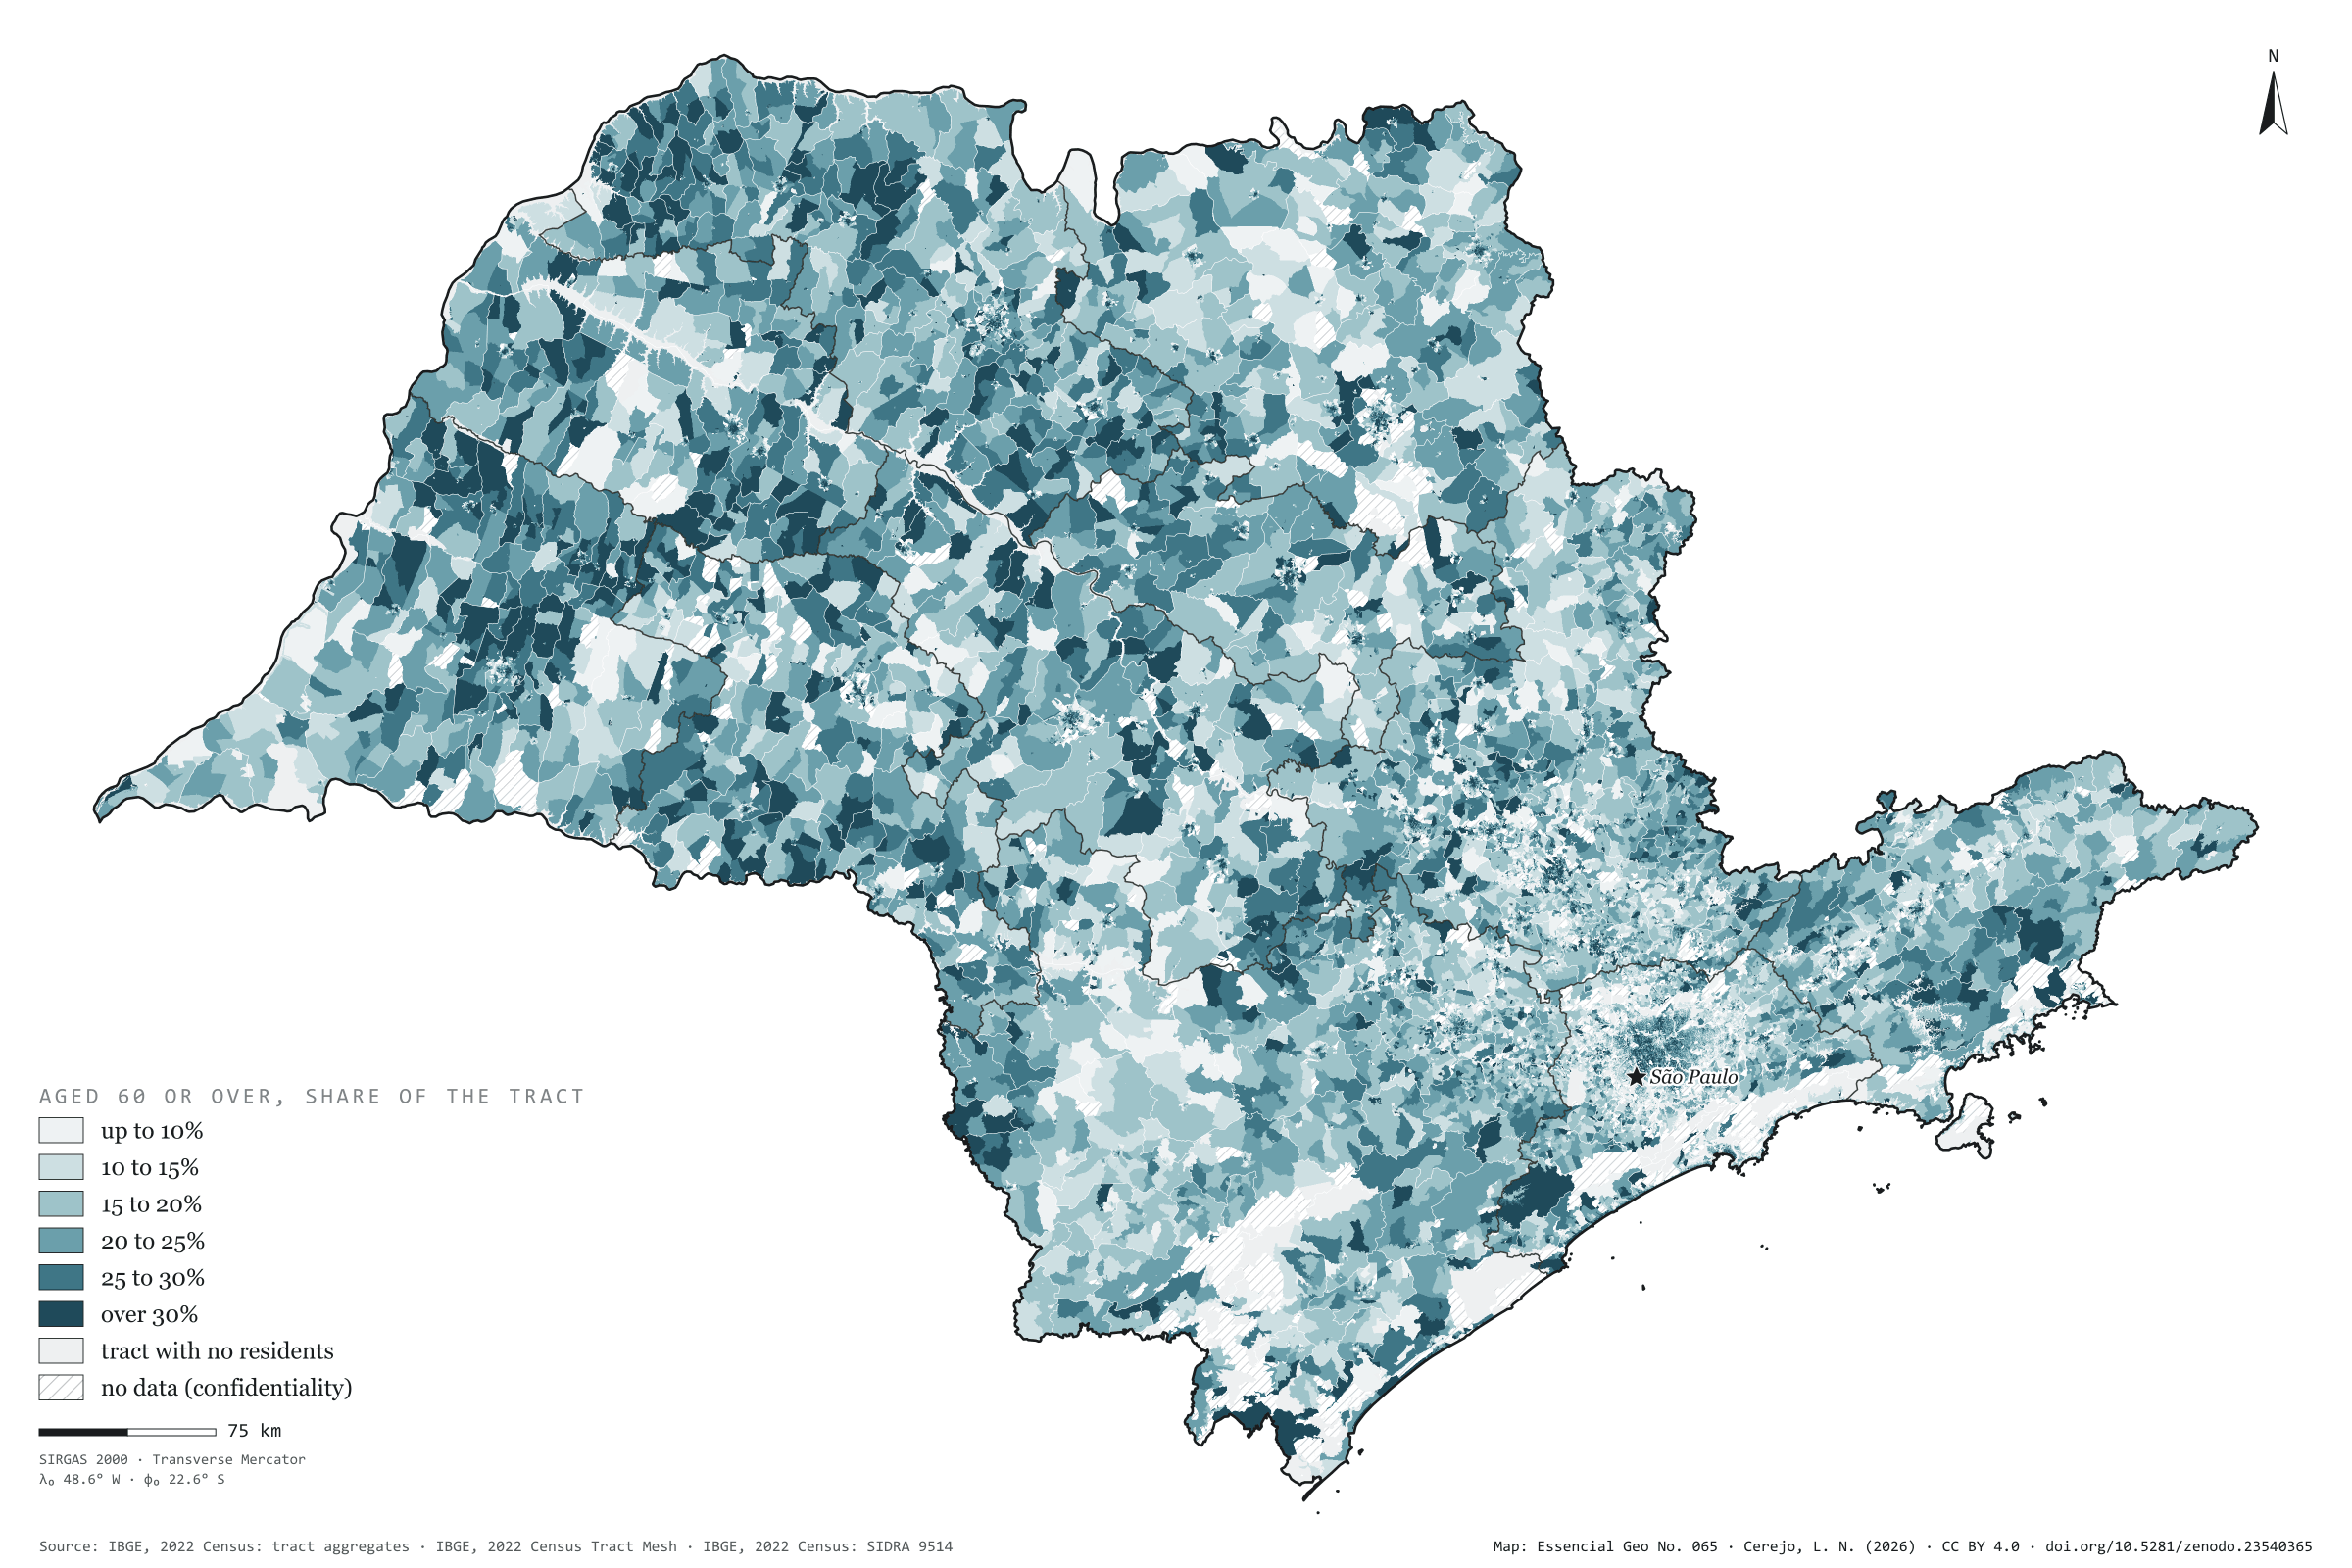
In 2022, 7.65 million people in São Paulo were aged 60 or over: 17.2% of the population, one in six. Over a million were past 80. Tract by tract, the map shows where they live. The dark blue of tracts where over 30% are 60 or older, home to 3.4 million people, spreads across the north-west and west: in the Presidente Prudente region, 20.1% are 60 or over; in the São Paulo region, 16.6%. In small towns such as Turmalina, Nova Canaã Paulista and Santana da Ponte Pensa, almost one in three; in Águas de São Pedro, 34%, the highest share in the state. Cajamar, in Greater São Paulo, is the youngest of the towns of over 50,000 people, with 10.6%. Plate 064 shows median age and the ageing index by municipality. Third plate of the collection “People across the land”.
Technical record · downloads · citation
At a glance
Population by share aged 60 or over in the tract (people)
up to 10%20.9%
10 to 15%22.6%
15 to 20%21.9%
20 to 25%16.7%
25 to 30%10.2%
over 30%7.7%
People aged 60 or over
17%
7.65 million of 44.4 million
People aged 80 or over
1,067,356people
Layers
setorespolygon103,319 tracts: people by age group and 60-plus class (the same layer as plate 063)
regioes_intermediariaspolygon11 intermediate geographic regions
People aged 60 to 69 and 70 or over as a share of each 2022 Census tract’s population, in six classes; confidential counts are worth 1 or 2, and a tract gets a class only when it is the same in both cases; state, municipal and regional totals from SIDRA 9514, without confidentiality.
The map without a frame, with legend, scale, reference system and credit written on it: ready for papers, lectures and slides. In two versions: with the basemap (neighbours and sea) or only the mapped area, on white.
CEREJO, Lucas Nakamura. Os de 60 anos ou mais: um em cada seis paulistas, e um em cada três nas cidades pequenas do noroeste. Versão 1.0.0. [S. l.]: Zenodo, 2026. Conjunto de dados. DOI: 10.5281/zenodo.23540365. Disponível em: https://doi.org/10.5281/zenodo.23540365. Acesso em: 10 nov. 2026.
Cerejo, L. N. (2026). Os de 60 anos ou mais: um em cada seis paulistas, e um em cada três nas cidades pequenas do noroeste [Those aged 60 and over: One in six people in São Paulo, and one in three in the small towns of the north-west] (Version 1.0.0) [Data set]. Zenodo. https://doi.org/10.5281/zenodo.23540365
@dataset{cerejo2026_idosos_sp,
  author    = {Cerejo, Lucas Nakamura},
  title     = {Os de 60 anos ou mais: Um em cada seis paulistas, e um em cada três nas cidades pequenas do noroeste},
  year      = {2026},
  publisher = {Zenodo},
  version   = {1.0.0},
  doi       = {10.5281/zenodo.23540365},
  url       = {https://doi.org/10.5281/zenodo.23540365},
  language  = {portuguese},
  note      = {English title: Those aged 60 and over: One in six people in São Paulo, and one in three in the small towns of the north-west. Licence CC BY 4.0}
}
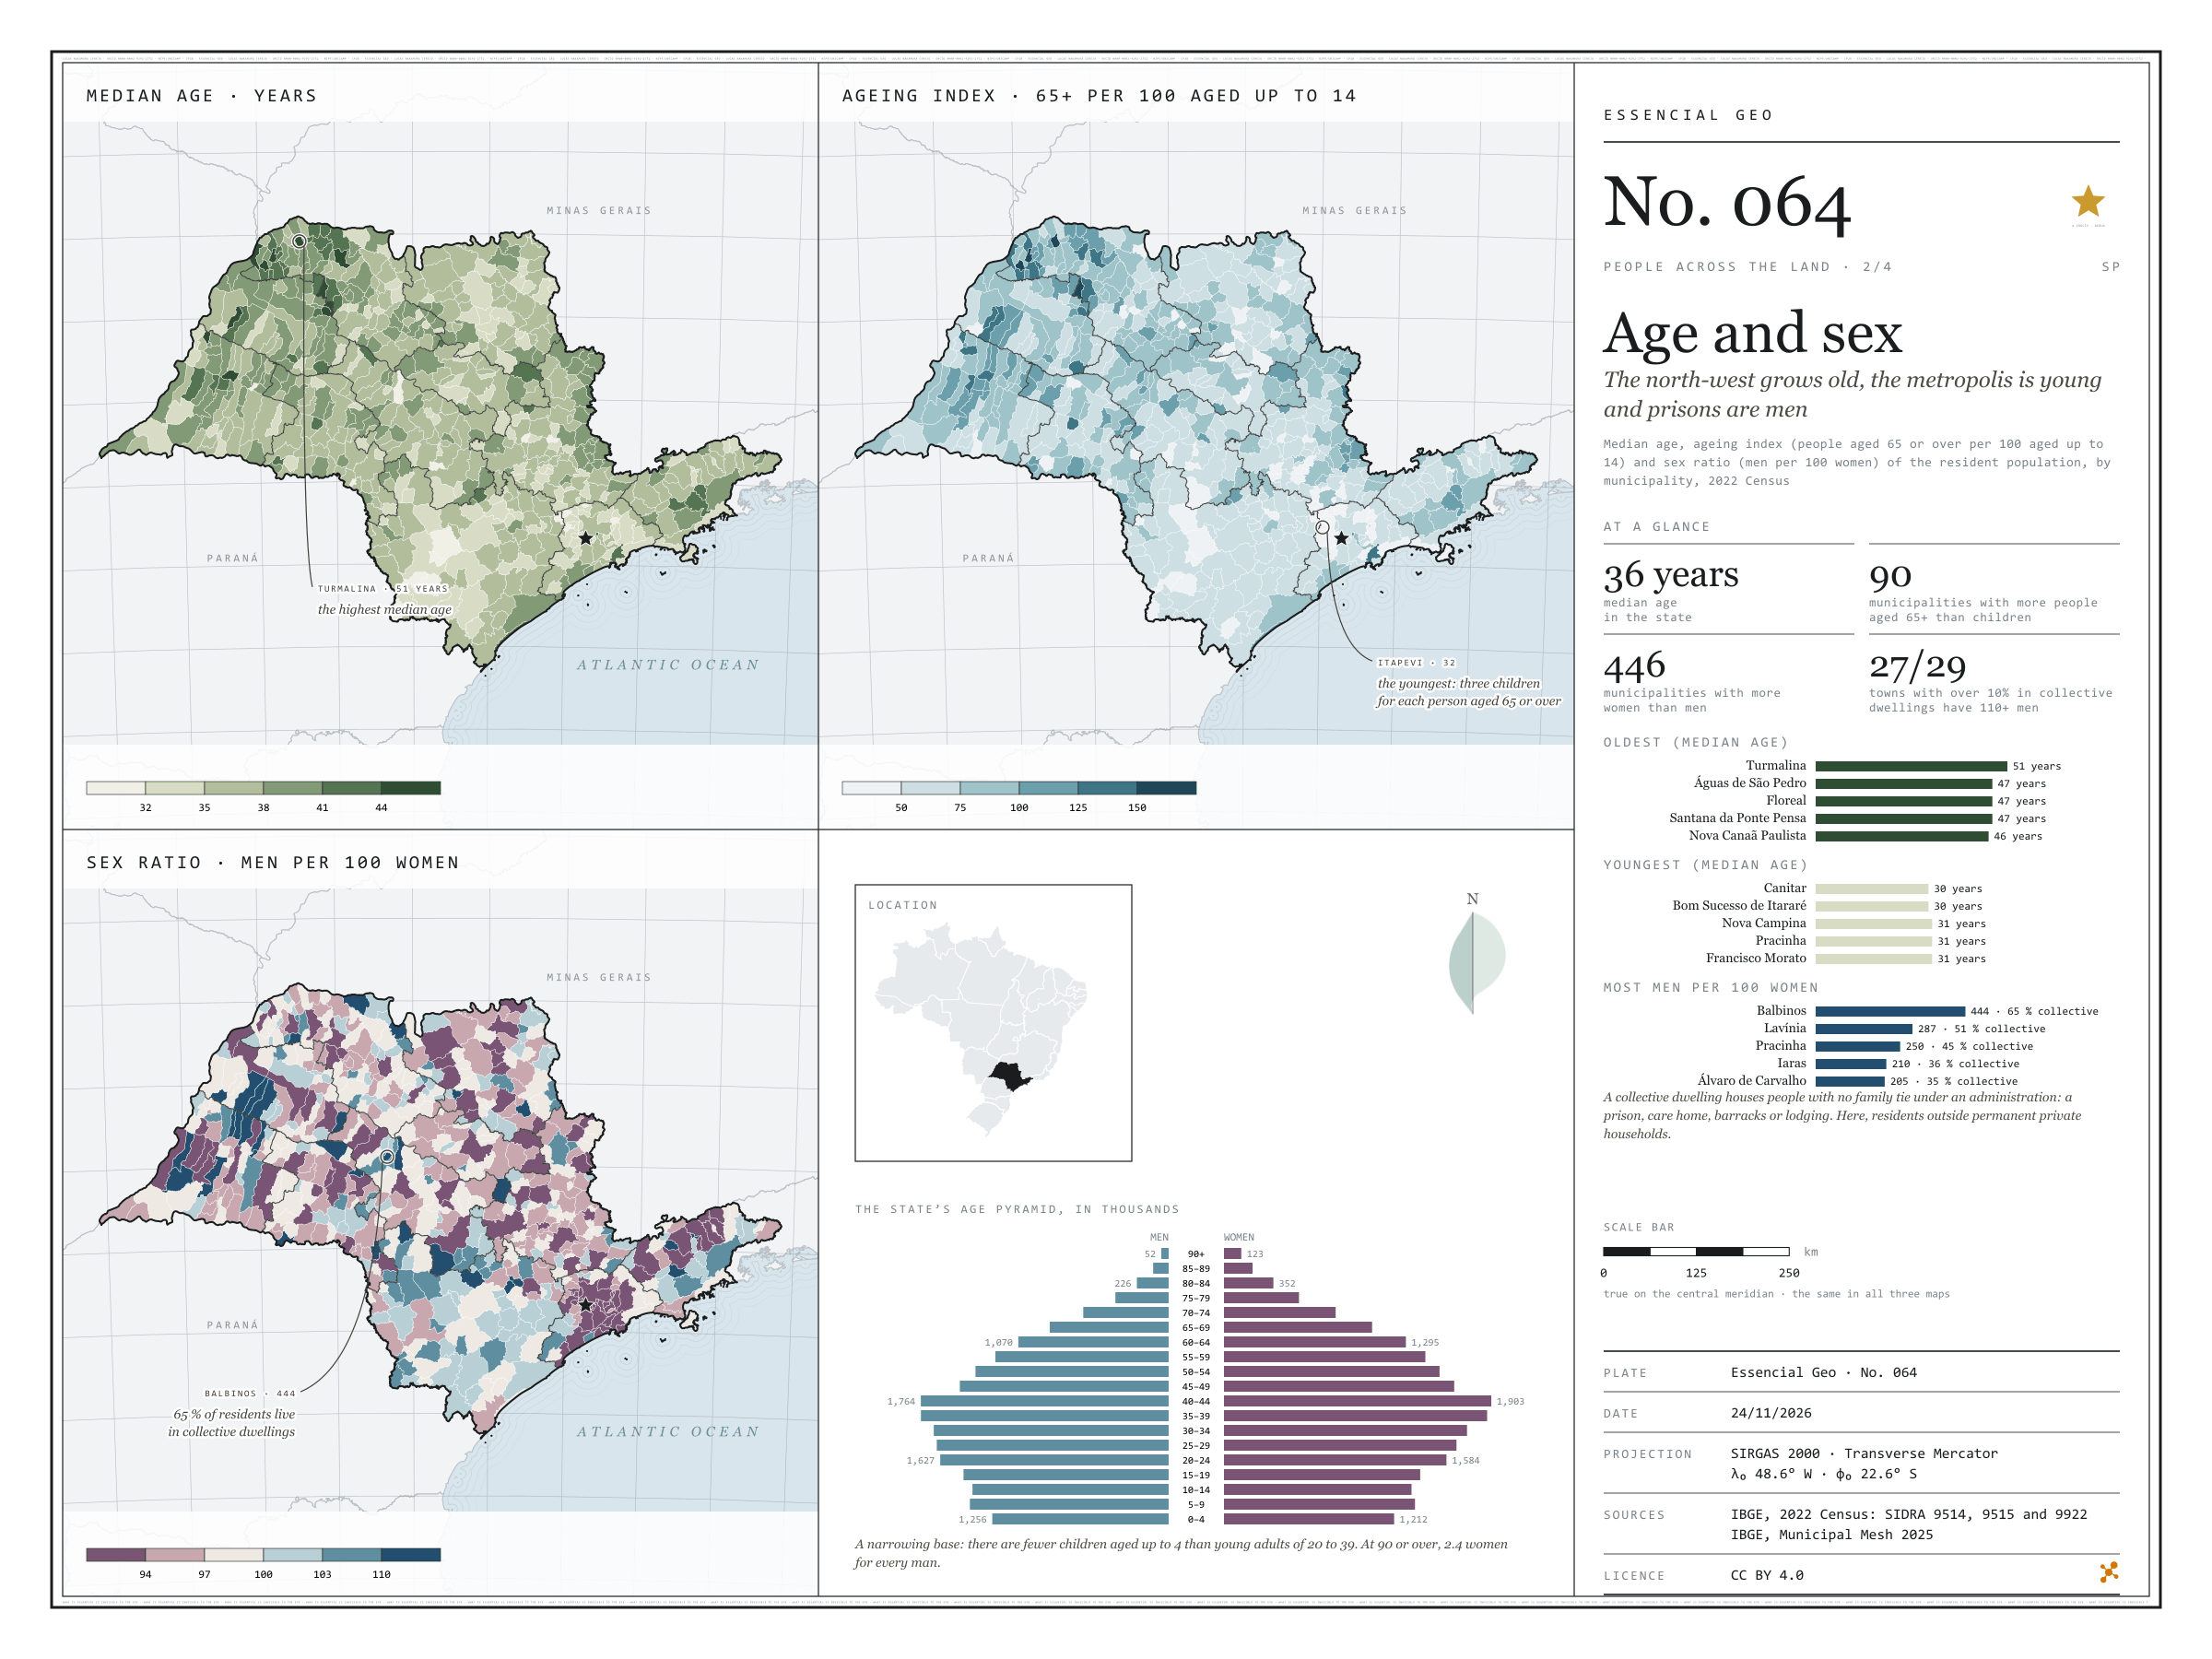
The north-west grows old, the metropolis is young and prisons are men
Fig. 064São Paulo State (SP)EPSG:4674Source: IBGE
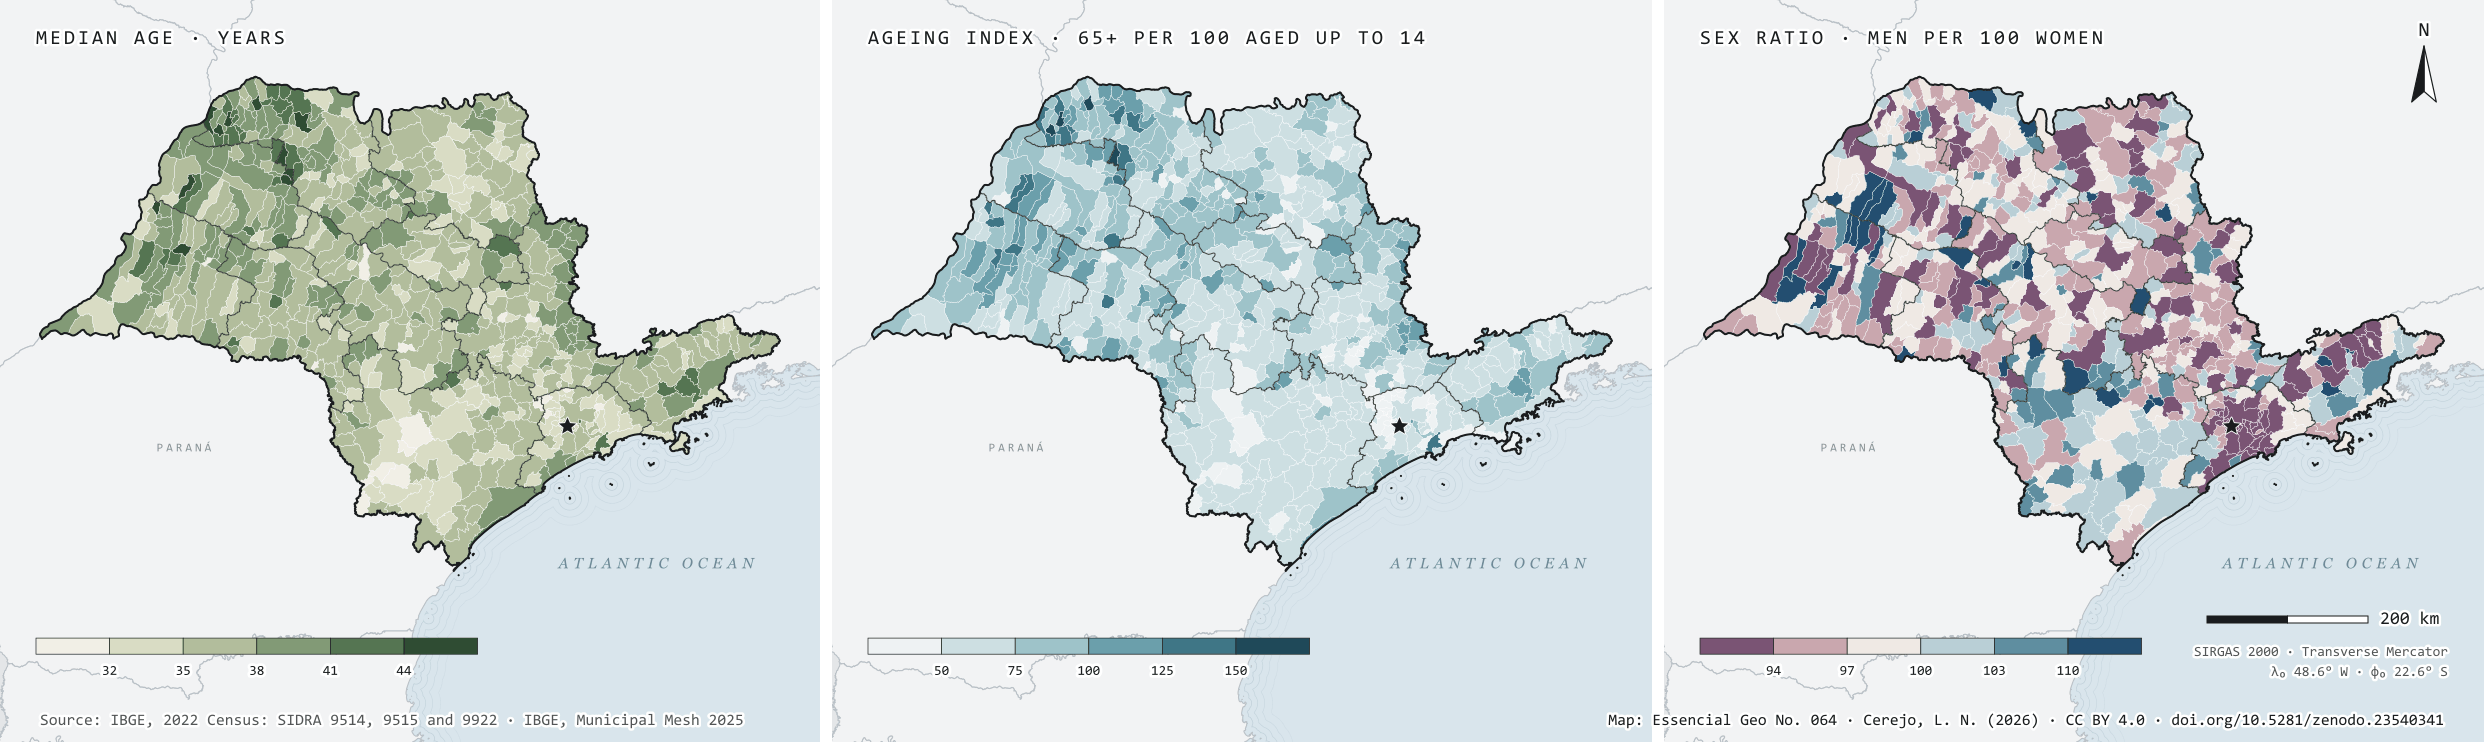
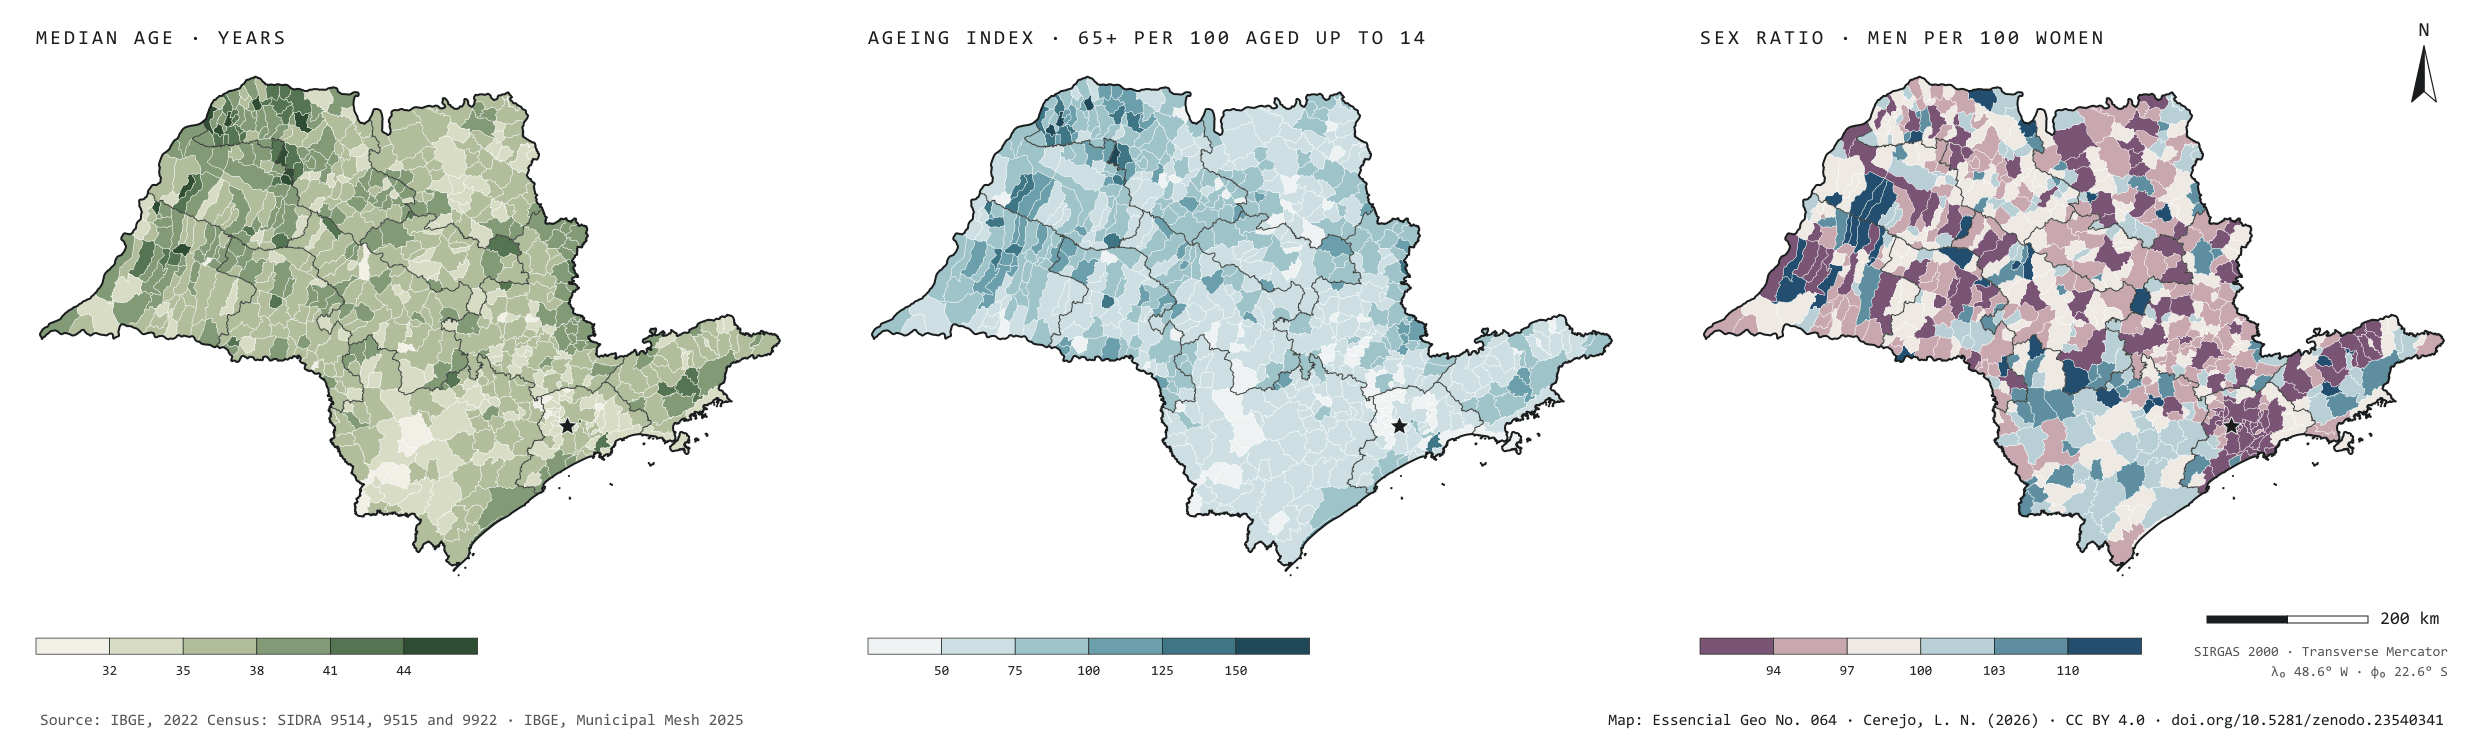
The median age in São Paulo is 36: half the people are younger, half older. But the state is ageing unevenly. In the north-west, in small towns such as Turmalina (51), Floreal and Santana da Ponte Pensa (47), there are already more people aged 65 or over than children up to 14: 90 municipalities are like this. In Greater São Paulo the index falls to 32 in Itapevi, three children per older person. In 446 of the 645 municipalities there are more women than men; Santos has 83 men per 100 women. The sex ratio map has dark blue patches: Balbinos has 444 men per 100 women, and 65% of its residents live in collective dwellings. Of the 29 towns with over 10% of their people in such dwellings, prisons among them, 27 exceed 110 men per 100 women. Second plate of the collection “People across the land”.
Technical record · downloads · citation
At a glance
Municipalities by median age (municipalities)
up to 32 years2.6%
33 to 3522%
36 to 3842.9%
39 to 4124.7%
42 to 445.9%
45 or over1.9%
Median age in the state
36years
Municipalities with more people aged 65 or over than aged up to 14
90municipalities
Municipalities with more women than men
446municipalities
Layers
municipiospolygon645 municipalities: people, men, women, median age, ageing index, sex ratio, aged up to 14 and 60 or over, urban and rural households and residents, residents outside private households
regioes_intermediariaspolygon11 intermediate geographic regions
Median age, ageing index (people aged 65 or over per 100 aged up to 14) and sex ratio (men per 100 women) of the resident population by municipality, from SIDRA 9515, in six classes each; the state’s pyramid from SIDRA 9514; residents outside occupied permanent private households = population (9514) minus residents of those households (9922).
The map without a frame, with legend, scale, reference system and credit written on it: ready for papers, lectures and slides. In two versions: with the basemap (neighbours and sea) or only the mapped area, on white.
CEREJO, Lucas Nakamura. Idade e sexo: o noroeste envelhece, a metrópole é jovem e os presídios são homens. Versão 1.0.0. [S. l.]: Zenodo, 2026. Conjunto de dados. DOI: 10.5281/zenodo.23540341. Disponível em: https://doi.org/10.5281/zenodo.23540341. Acesso em: 10 nov. 2026.
Cerejo, L. N. (2026). Idade e sexo: o noroeste envelhece, a metrópole é jovem e os presídios são homens [Age and sex: The north-west grows old, the metropolis is young and prisons are men] (Version 1.0.0) [Data set]. Zenodo. https://doi.org/10.5281/zenodo.23540341
@dataset{cerejo2026_idade_e_sexo_sp,
  author    = {Cerejo, Lucas Nakamura},
  title     = {Idade e sexo: O noroeste envelhece, a metrópole é jovem e os presídios são homens},
  year      = {2026},
  publisher = {Zenodo},
  version   = {1.0.0},
  doi       = {10.5281/zenodo.23540341},
  url       = {https://doi.org/10.5281/zenodo.23540341},
  language  = {portuguese},
  note      = {English title: Age and sex: The north-west grows old, the metropolis is young and prisons are men. Licence CC BY 4.0}
}
Half of São Paulo’s people fit in half a per cent of the state
Fig. 063São Paulo State (SP)EPSG:4674Source: IBGE
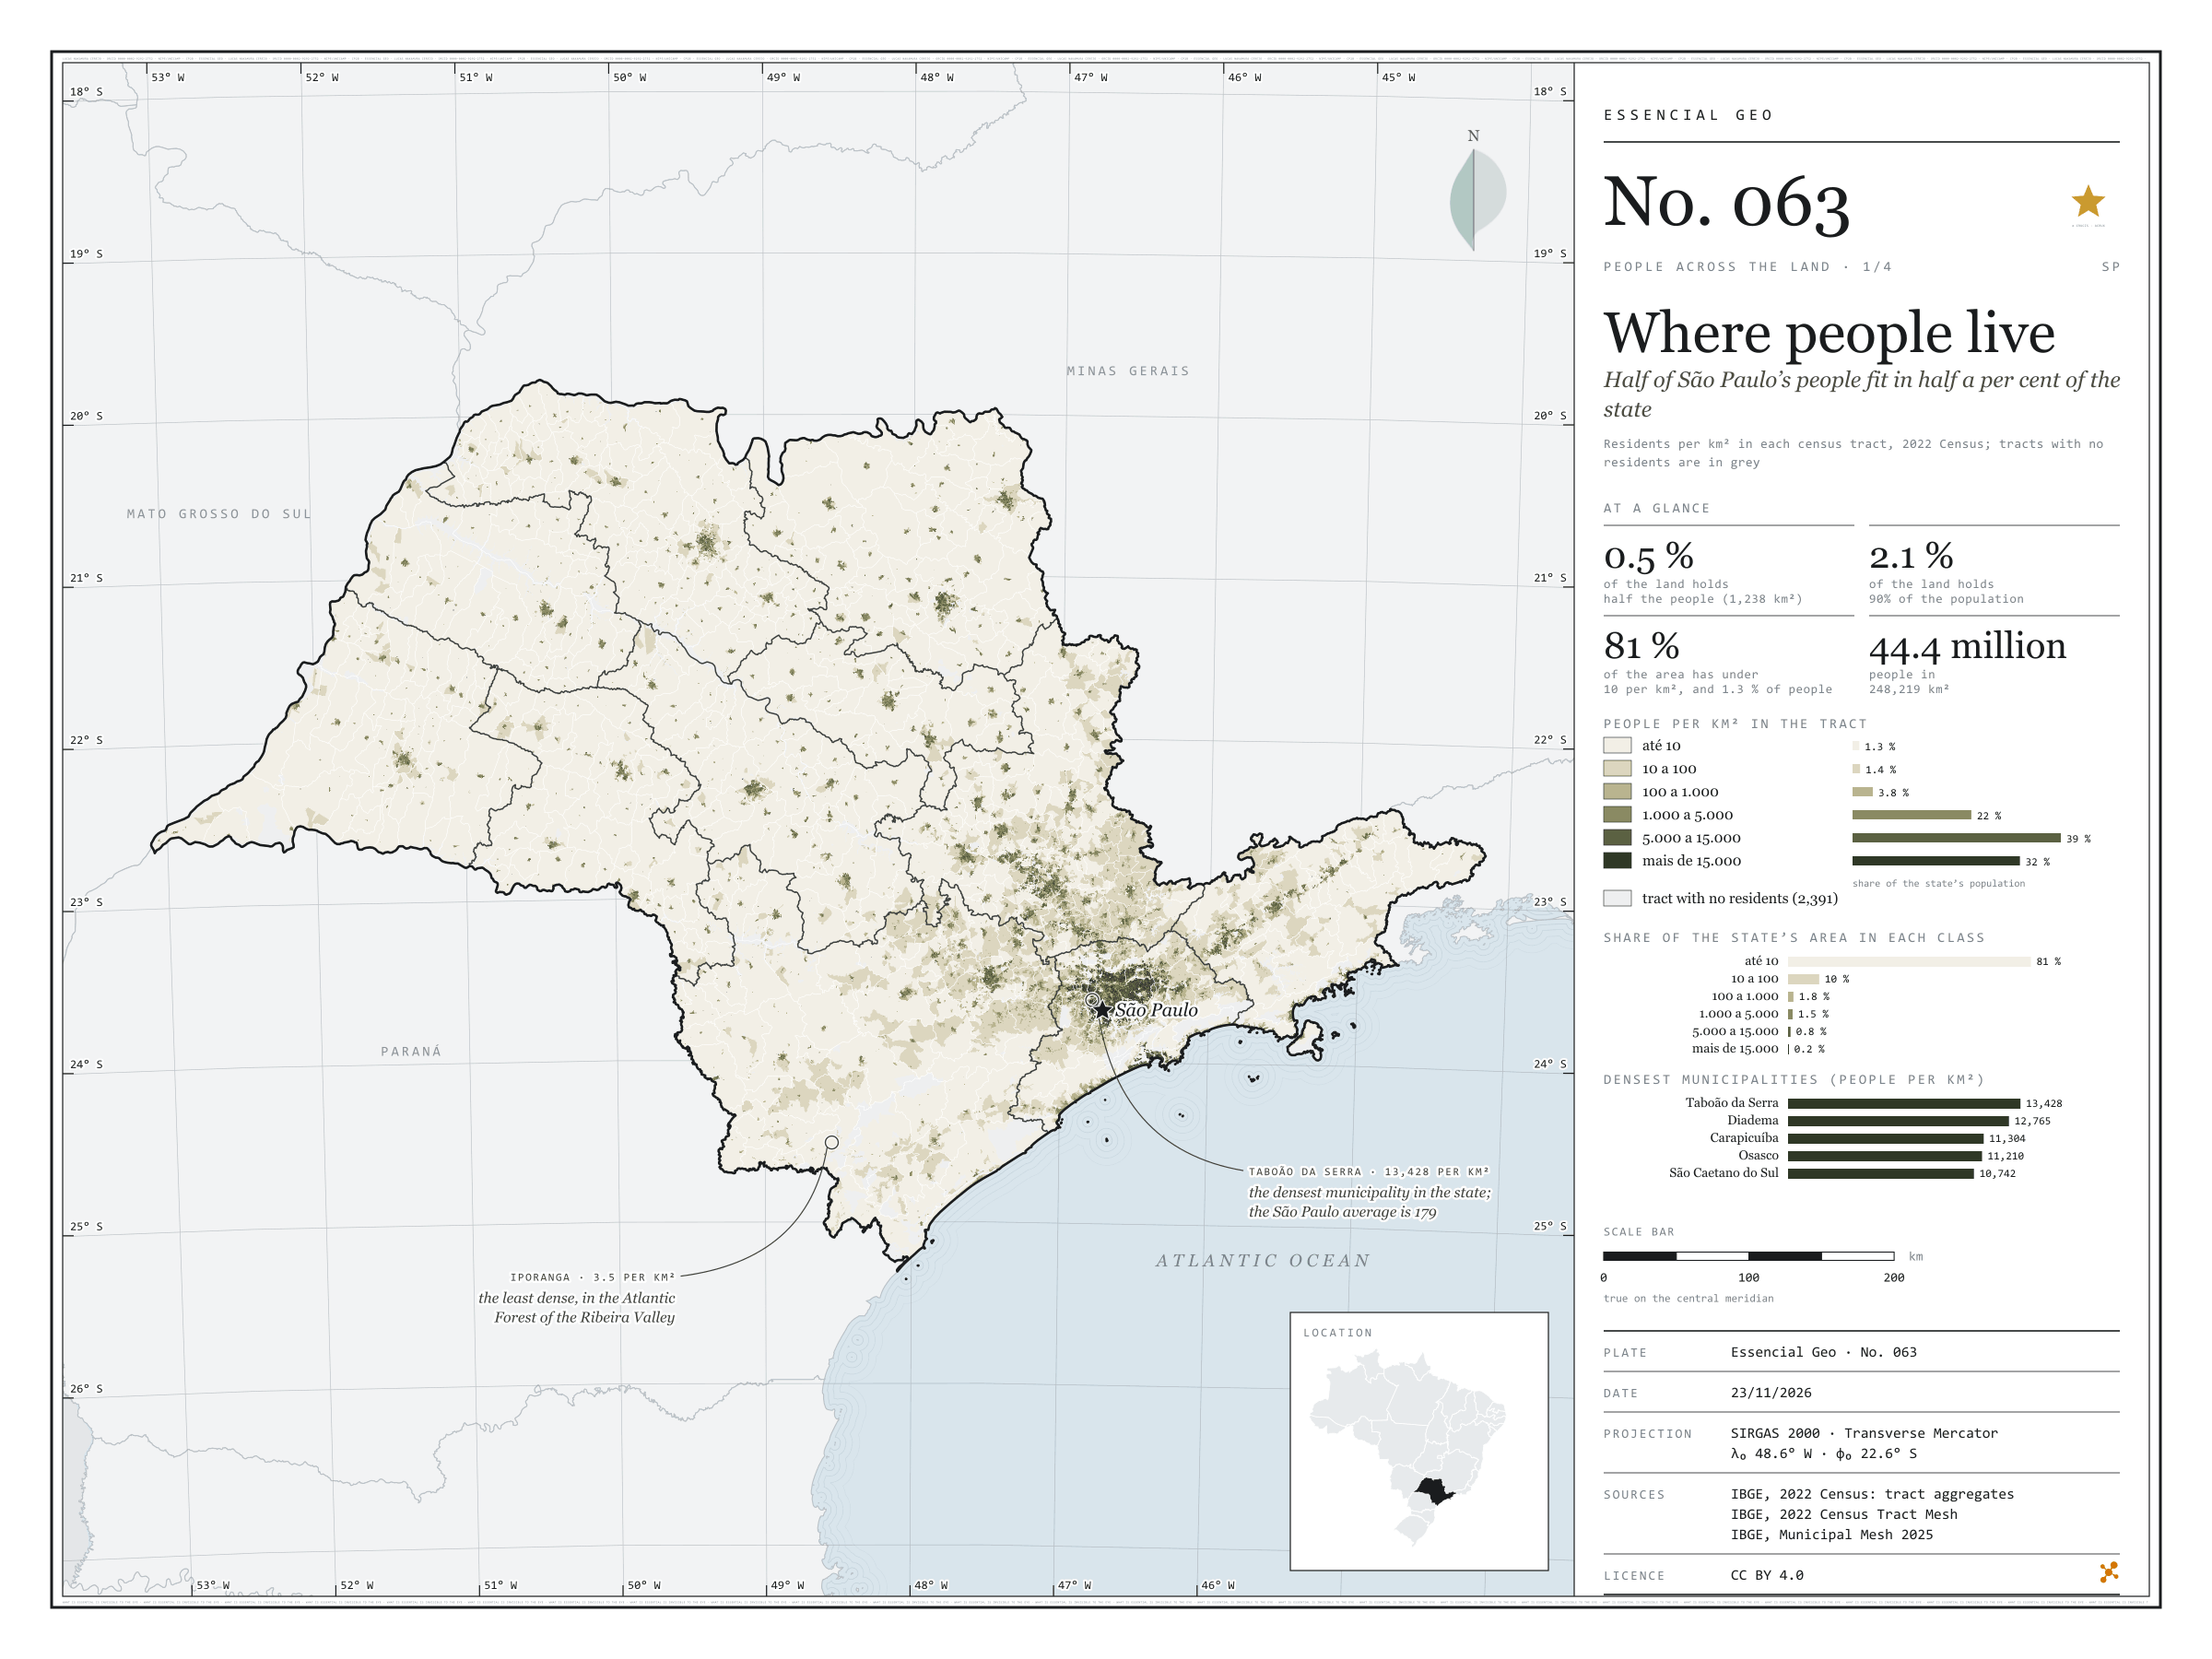
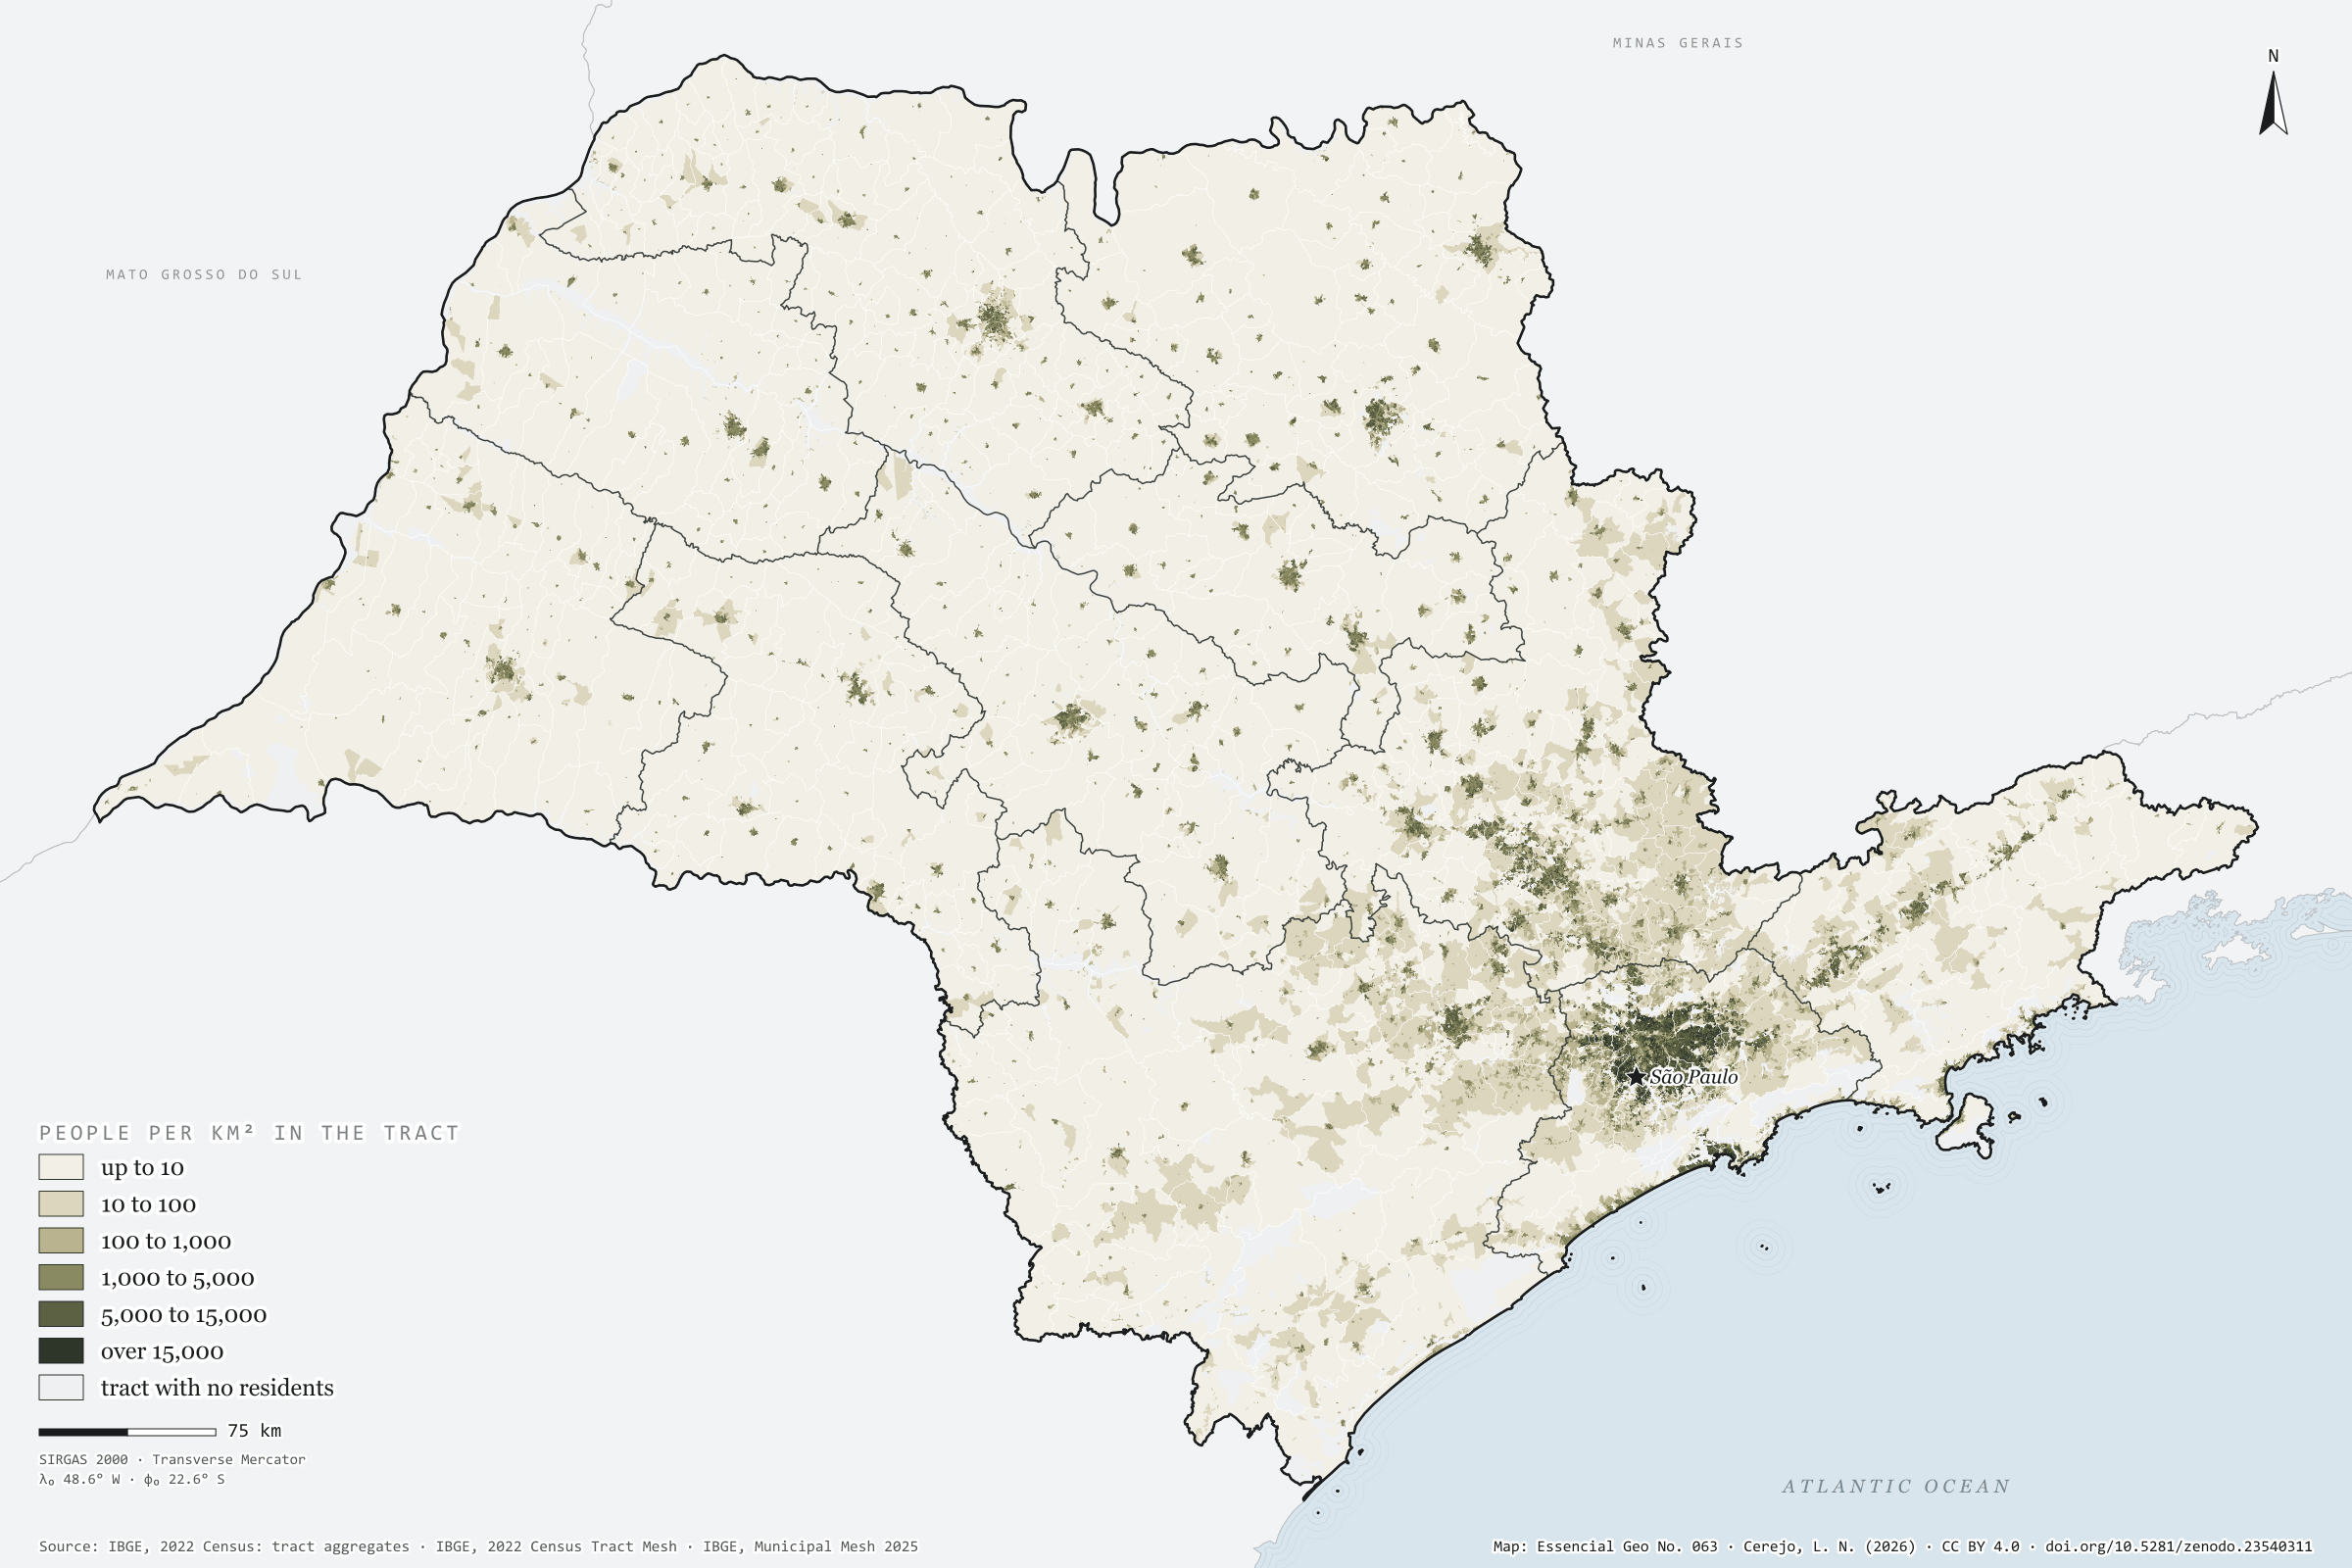
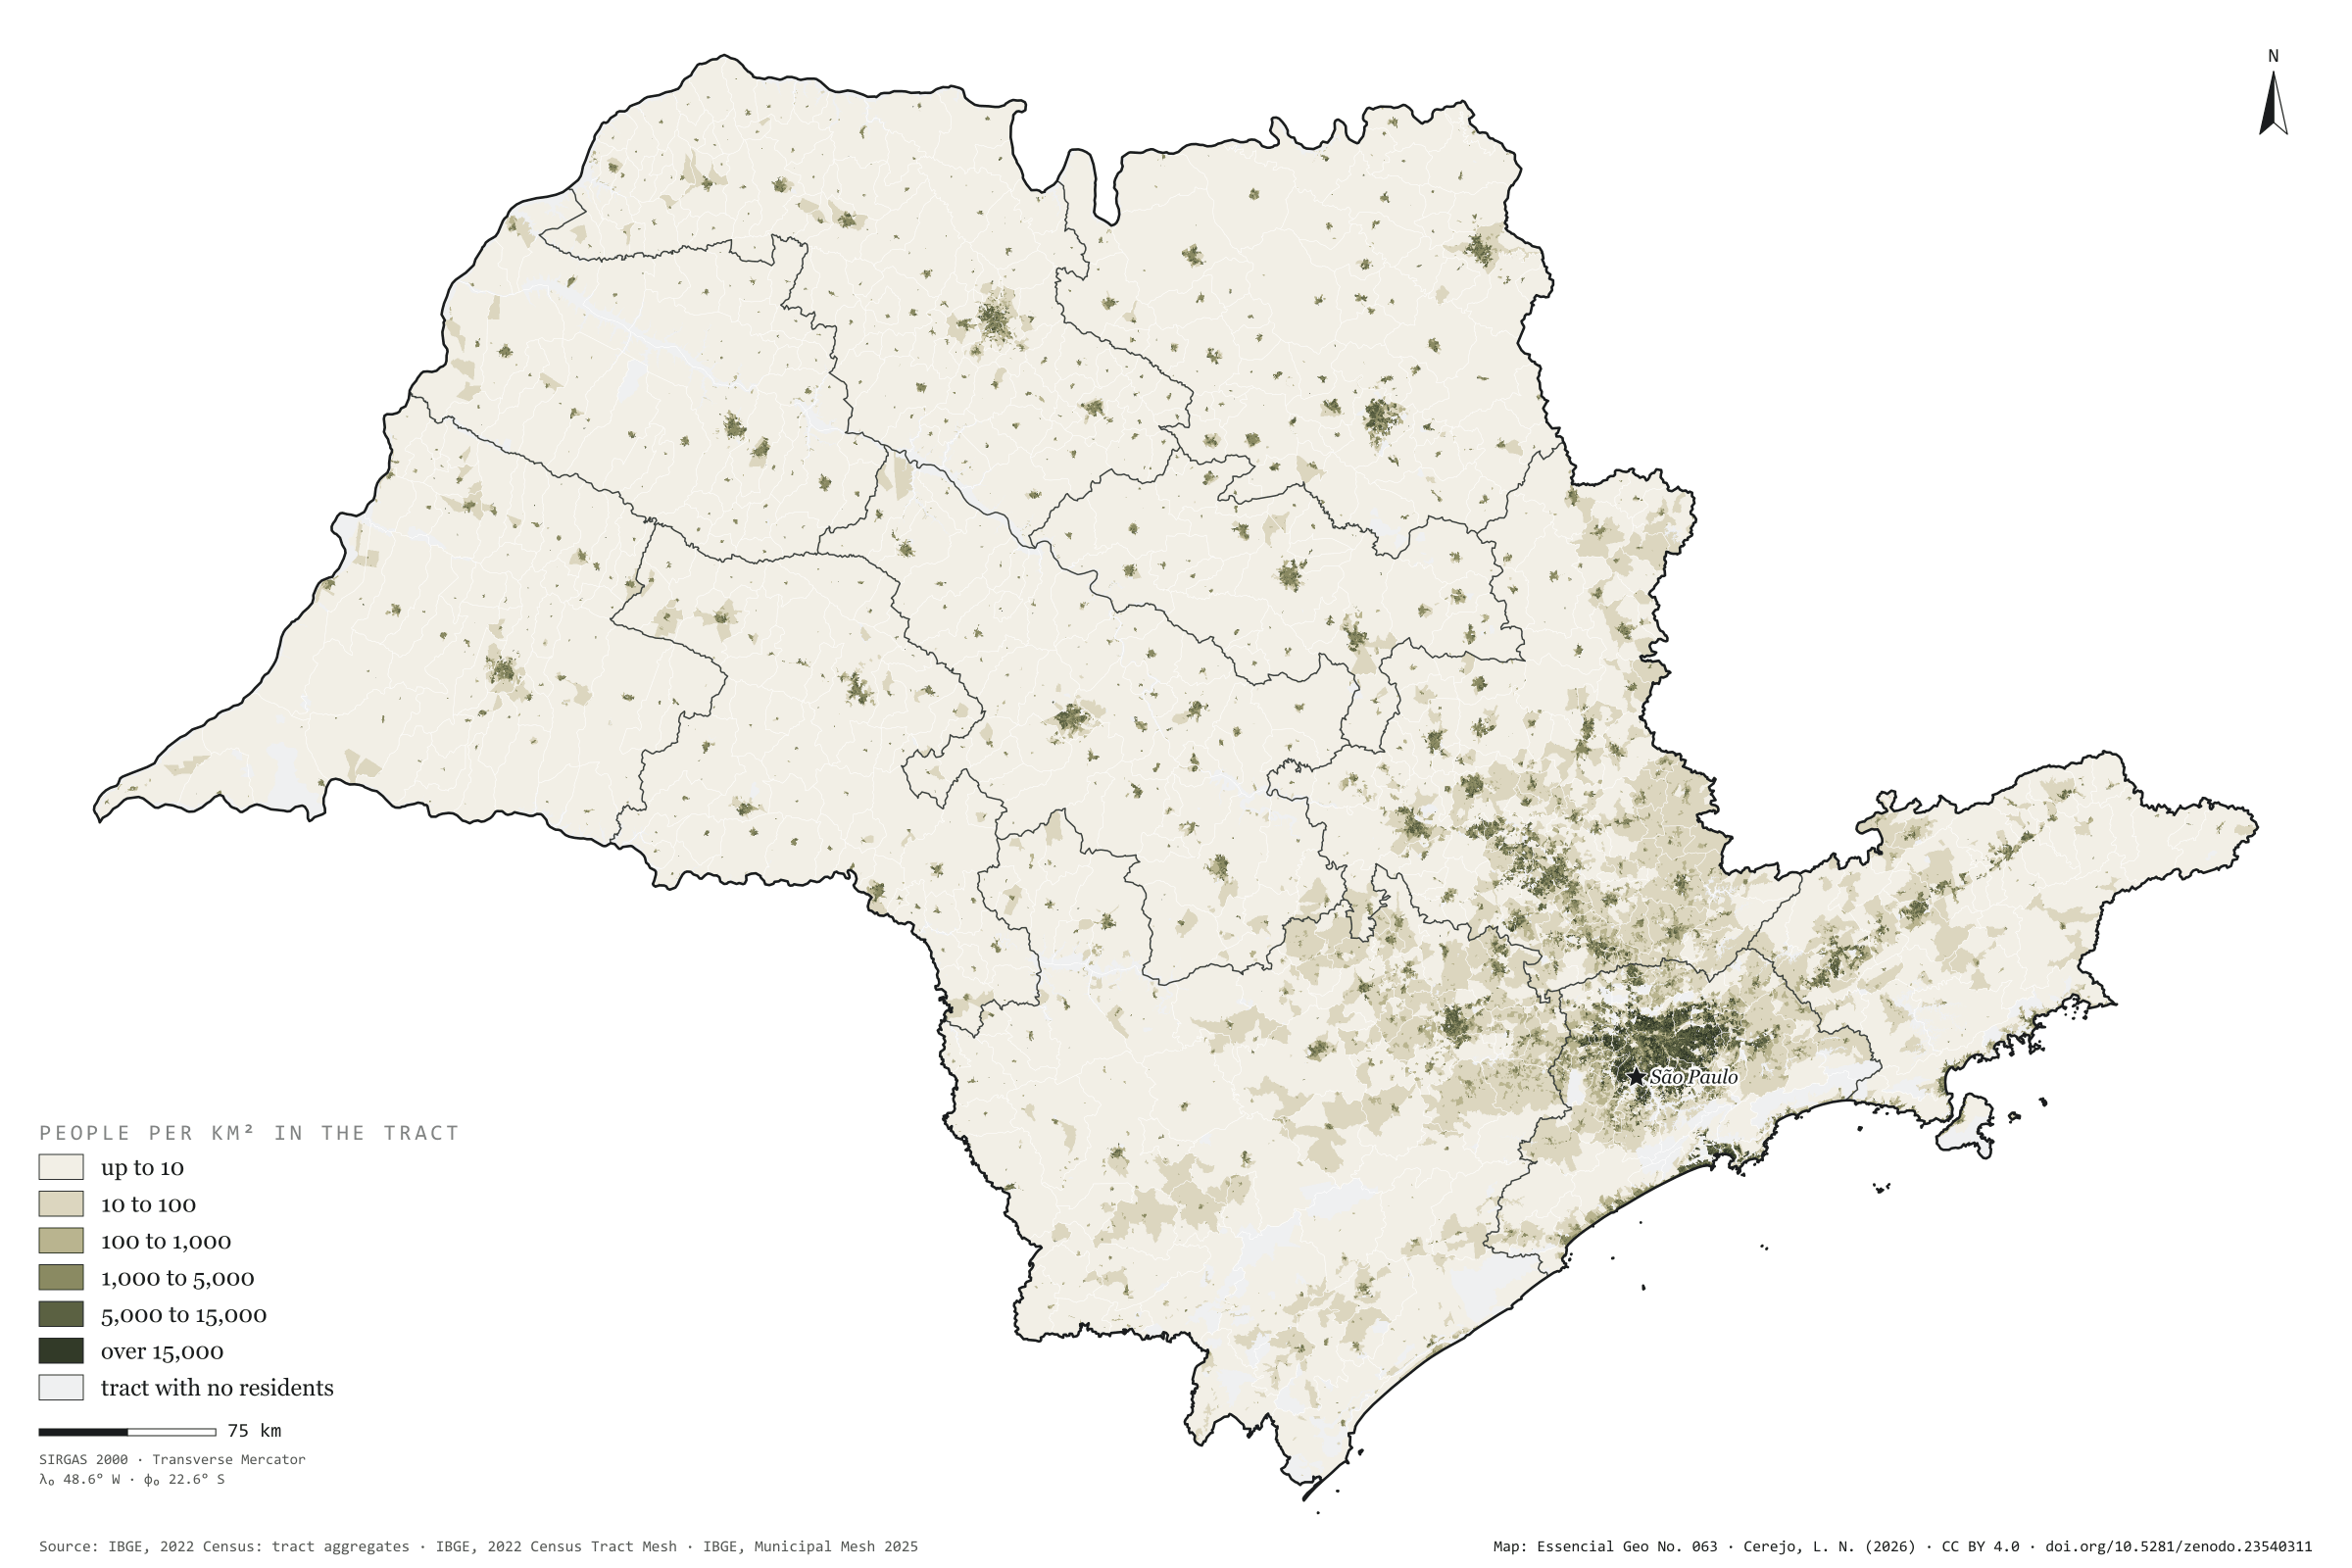
São Paulo has 44.4 million people on 248,000 km², 179 per km² on average. But the average misleads. Half the population lives in census tracts that together cover 1,238 km², 0.5% of the state; 90% live on 2.1%. At the other end, 81% of the area has fewer than 10 residents per km² and holds 1.3% of the people. The map is almost all cream, with dark dots for the towns and one continuous patch in Greater São Paulo, reaching towards Campinas, Sorocaba and the Paraíba Valley. The densest municipality is Taboão da Serra, with 13,428 residents per km², followed by Diadema and Carapicuíba; the capital has 7,521. The least dense is Iporanga, in the Ribeira Valley, with 3.5. First plate of the collection “People across the land”.
Technical record · downloads · citation
At a glance
Population by tract density (residents per km²) (people)
up to 101.3%
10 to 1001.4%
100 to 1,0003.8%
1,000 to 5,00022.5%
5,000 to 15,00039.4%
over 15,00031.6%
Share of the land where half the population lives
0.5%
1,238 km² of 248,219 km²
Residents per km² in the state
179people per km²
Layers
setorespolygon103,319 tracts: area, people, residents per km², people by age group and density and 60-plus classes
regioes_intermediariaspolygon11 intermediate geographic regions
Residents per km² of each 2022 Census tract (the tract’s own area), in six classes; share of the state’s population and area in each class; cumulative area of tracts from densest to least dense until they hold half and 90% of the population.
The map without a frame, with legend, scale, reference system and credit written on it: ready for papers, lectures and slides. In two versions: with the basemap (neighbours and sea) or only the mapped area, on white.
CEREJO, Lucas Nakamura. Onde mora a gente: metade dos paulistas cabe em meio por cento do estado. Versão 1.0.0. [S. l.]: Zenodo, 2026. Conjunto de dados. DOI: 10.5281/zenodo.23540311. Disponível em: https://doi.org/10.5281/zenodo.23540311. Acesso em: 10 nov. 2026.
Cerejo, L. N. (2026). Onde mora a gente: metade dos paulistas cabe em meio por cento do estado [Where people live: Half of São Paulo’s people fit in half a per cent of the state] (Version 1.0.0) [Data set]. Zenodo. https://doi.org/10.5281/zenodo.23540311
@dataset{cerejo2026_densidade_sp,
  author    = {Cerejo, Lucas Nakamura},
  title     = {Onde mora a gente: Metade dos paulistas cabe em meio por cento do estado},
  year      = {2026},
  publisher = {Zenodo},
  version   = {1.0.0},
  doi       = {10.5281/zenodo.23540311},
  url       = {https://doi.org/10.5281/zenodo.23540311},
  language  = {portuguese},
  note      = {English title: Where people live: Half of São Paulo’s people fit in half a per cent of the state. Licence CC BY 4.0}
}
Fig. 062São Paulo State (SP)EPSG:4674Source: ANEEL, IBGE
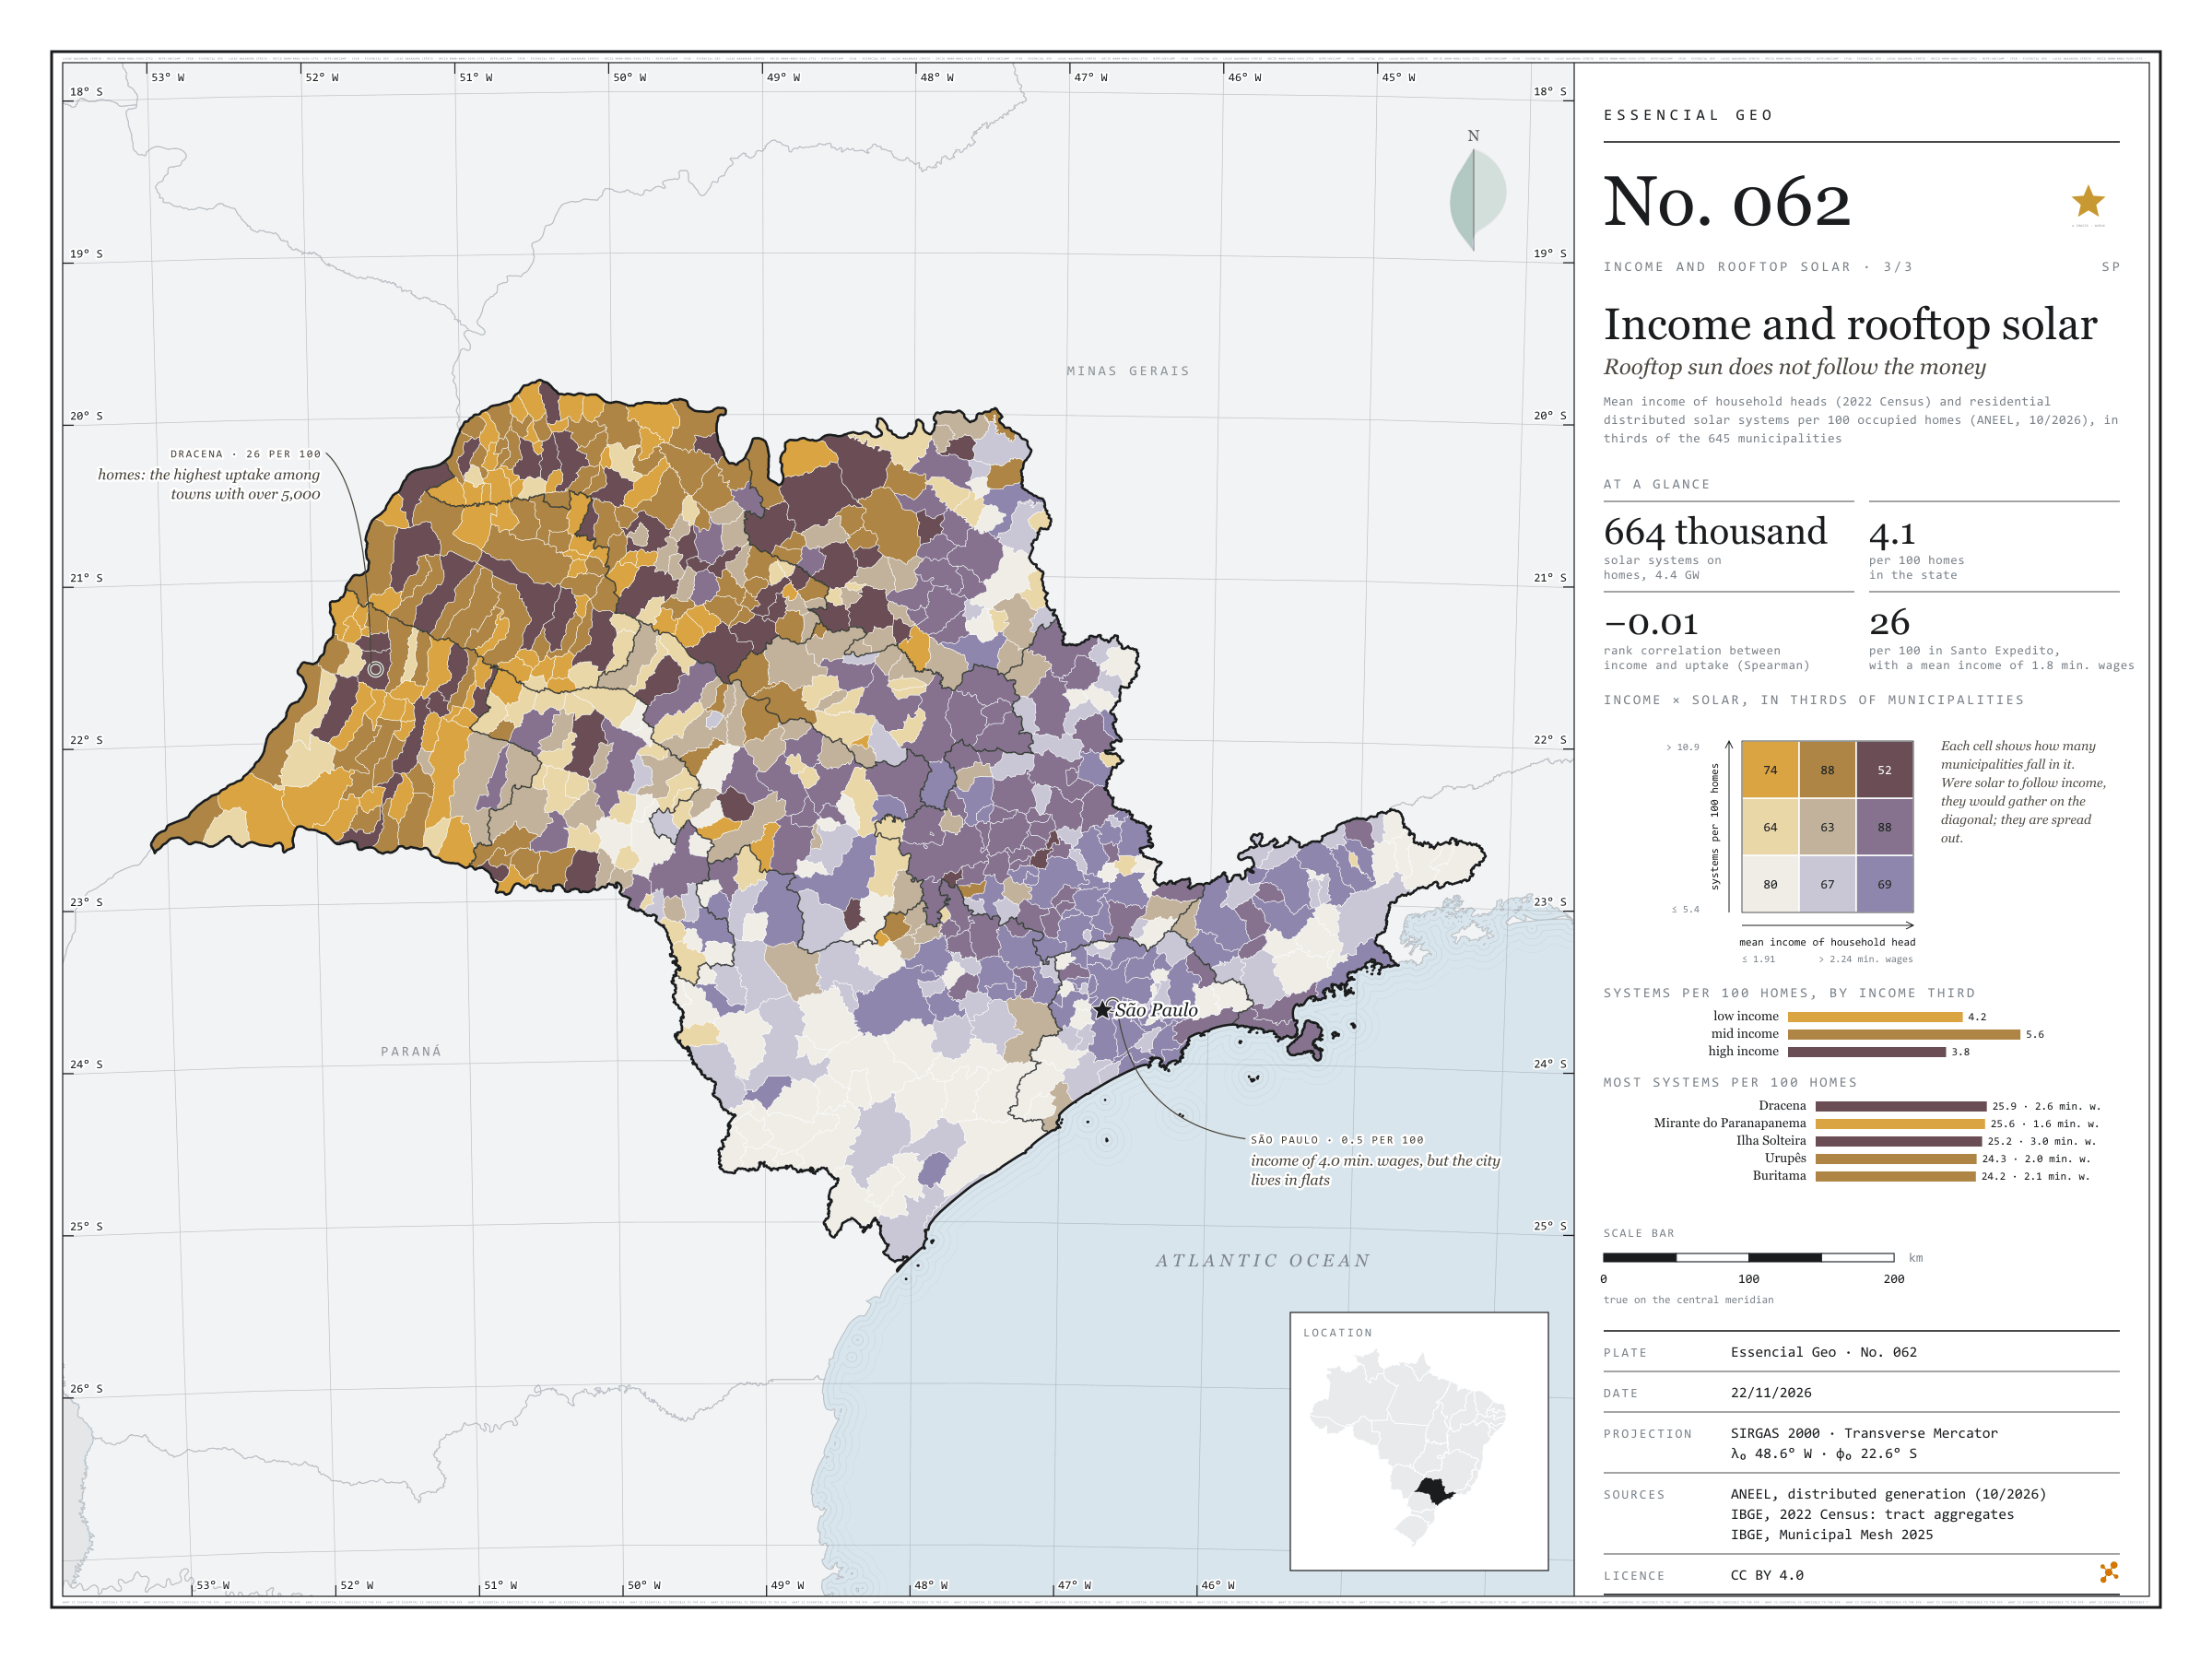
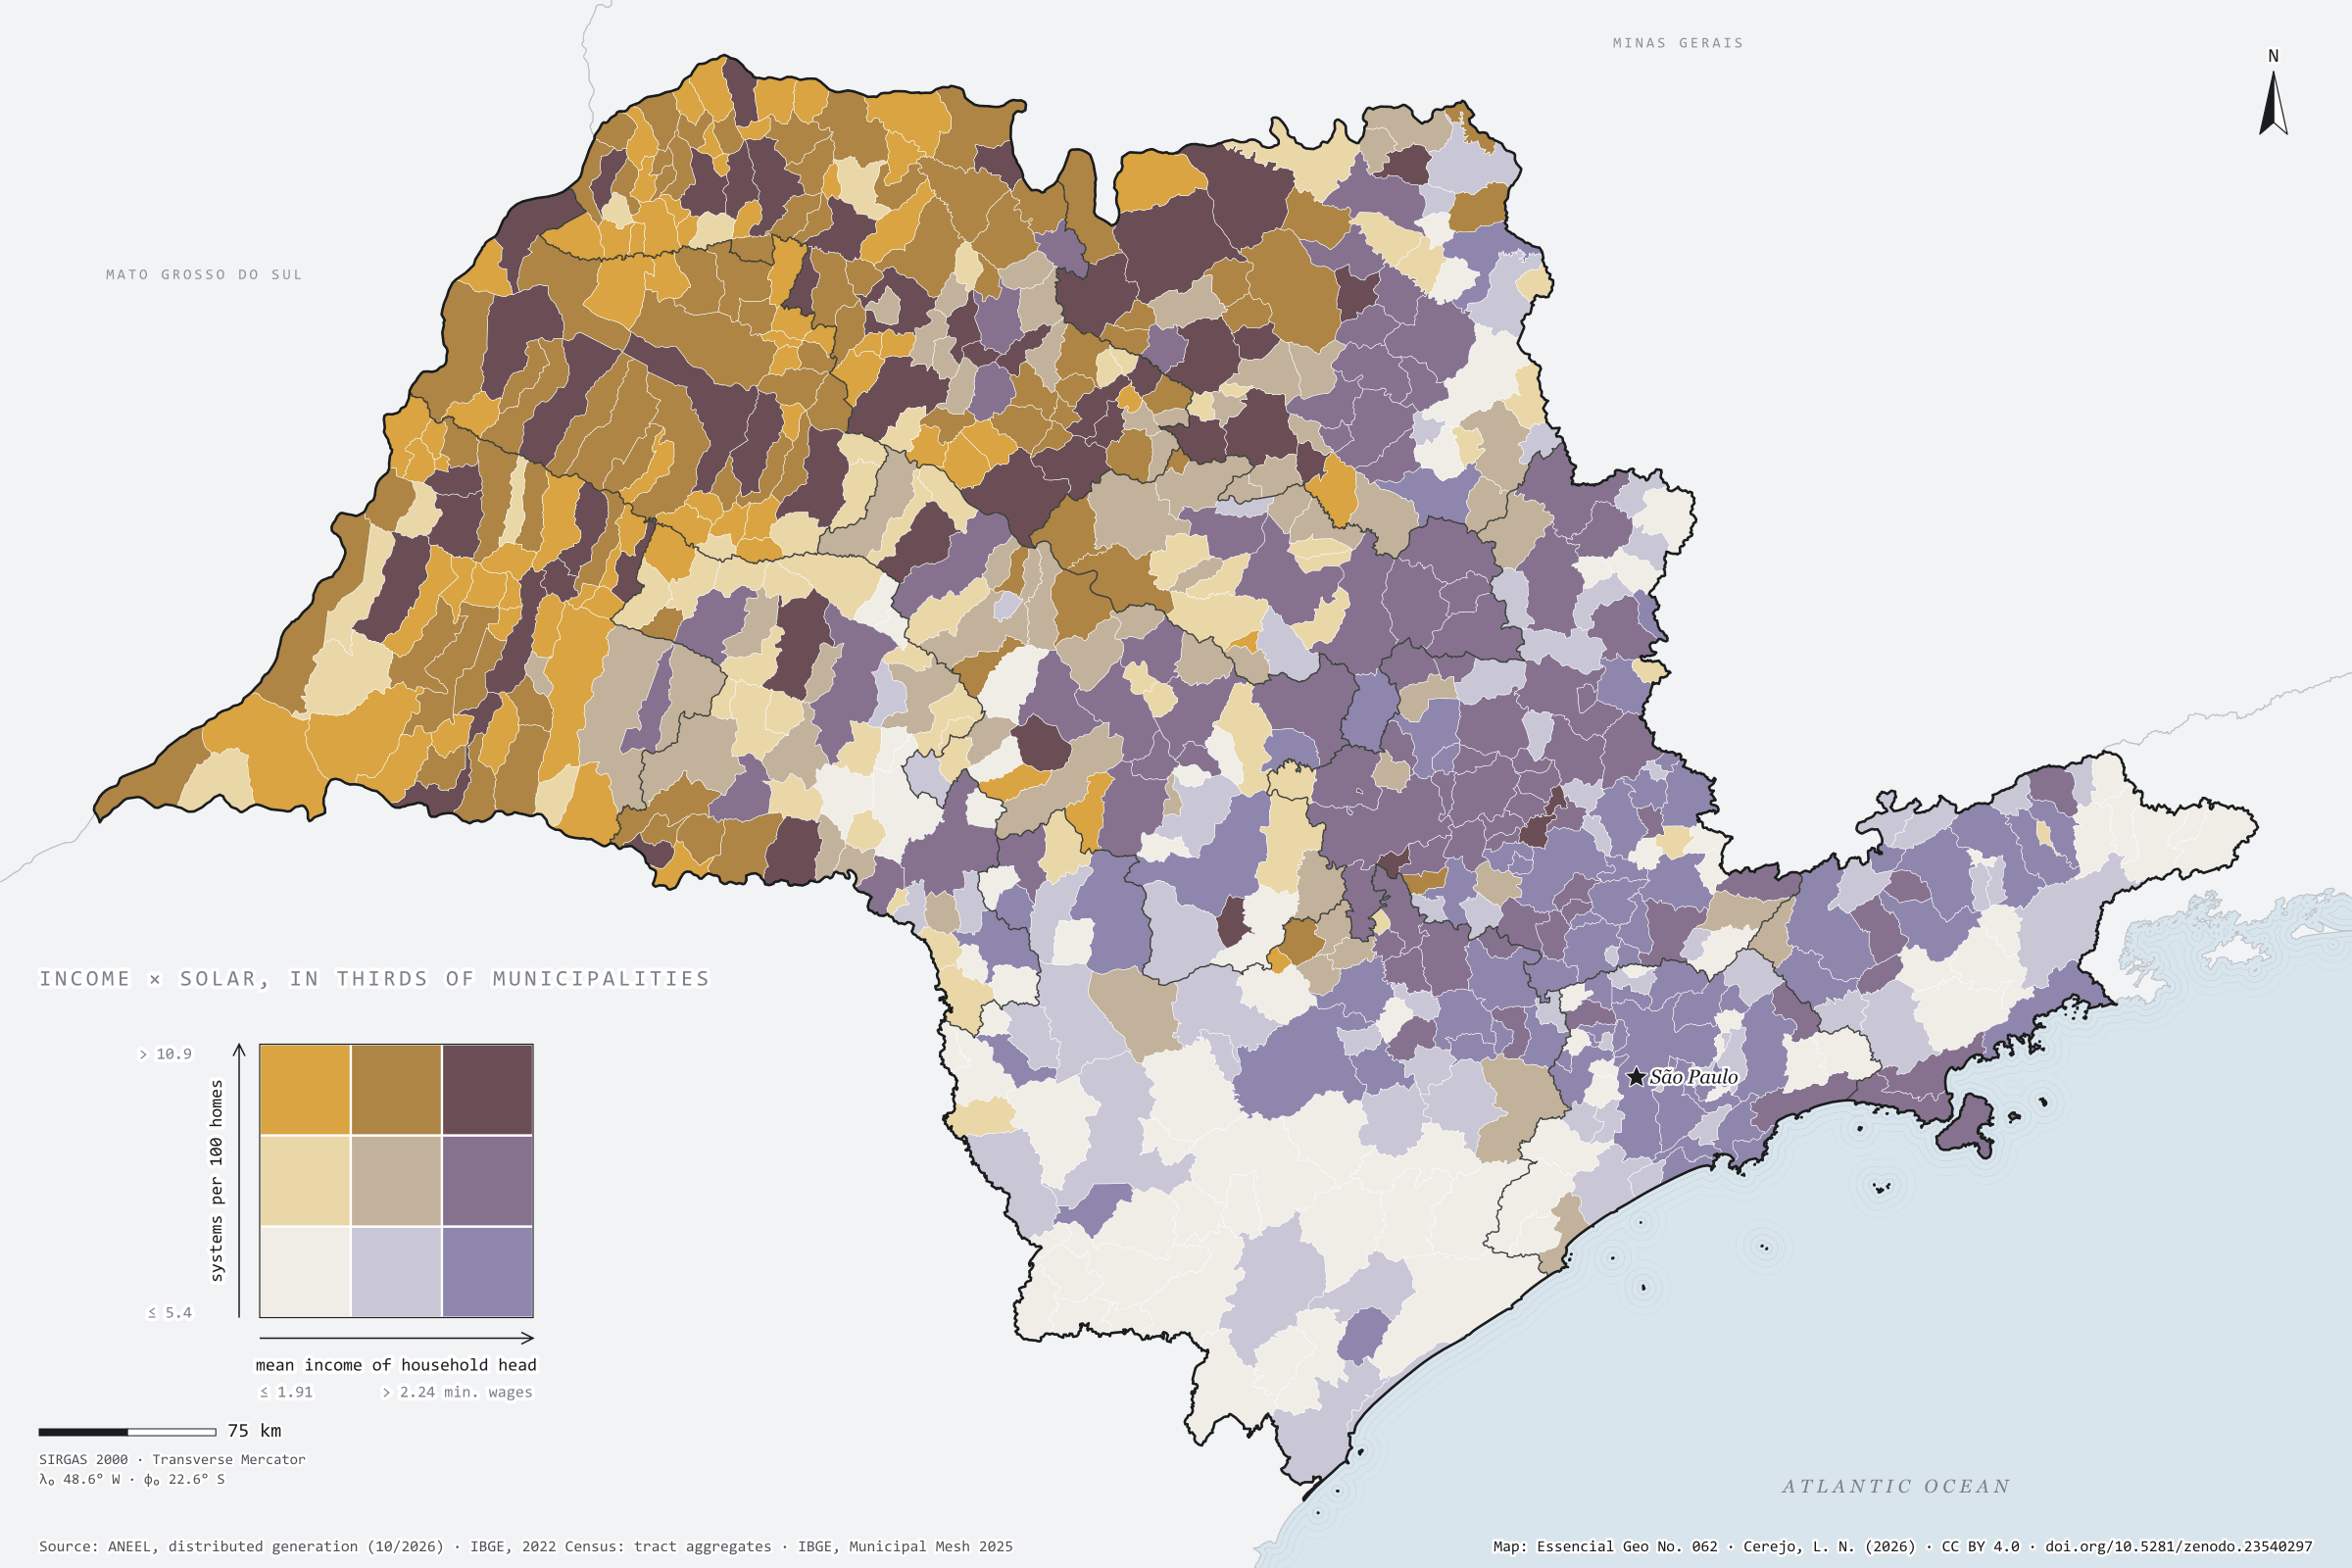
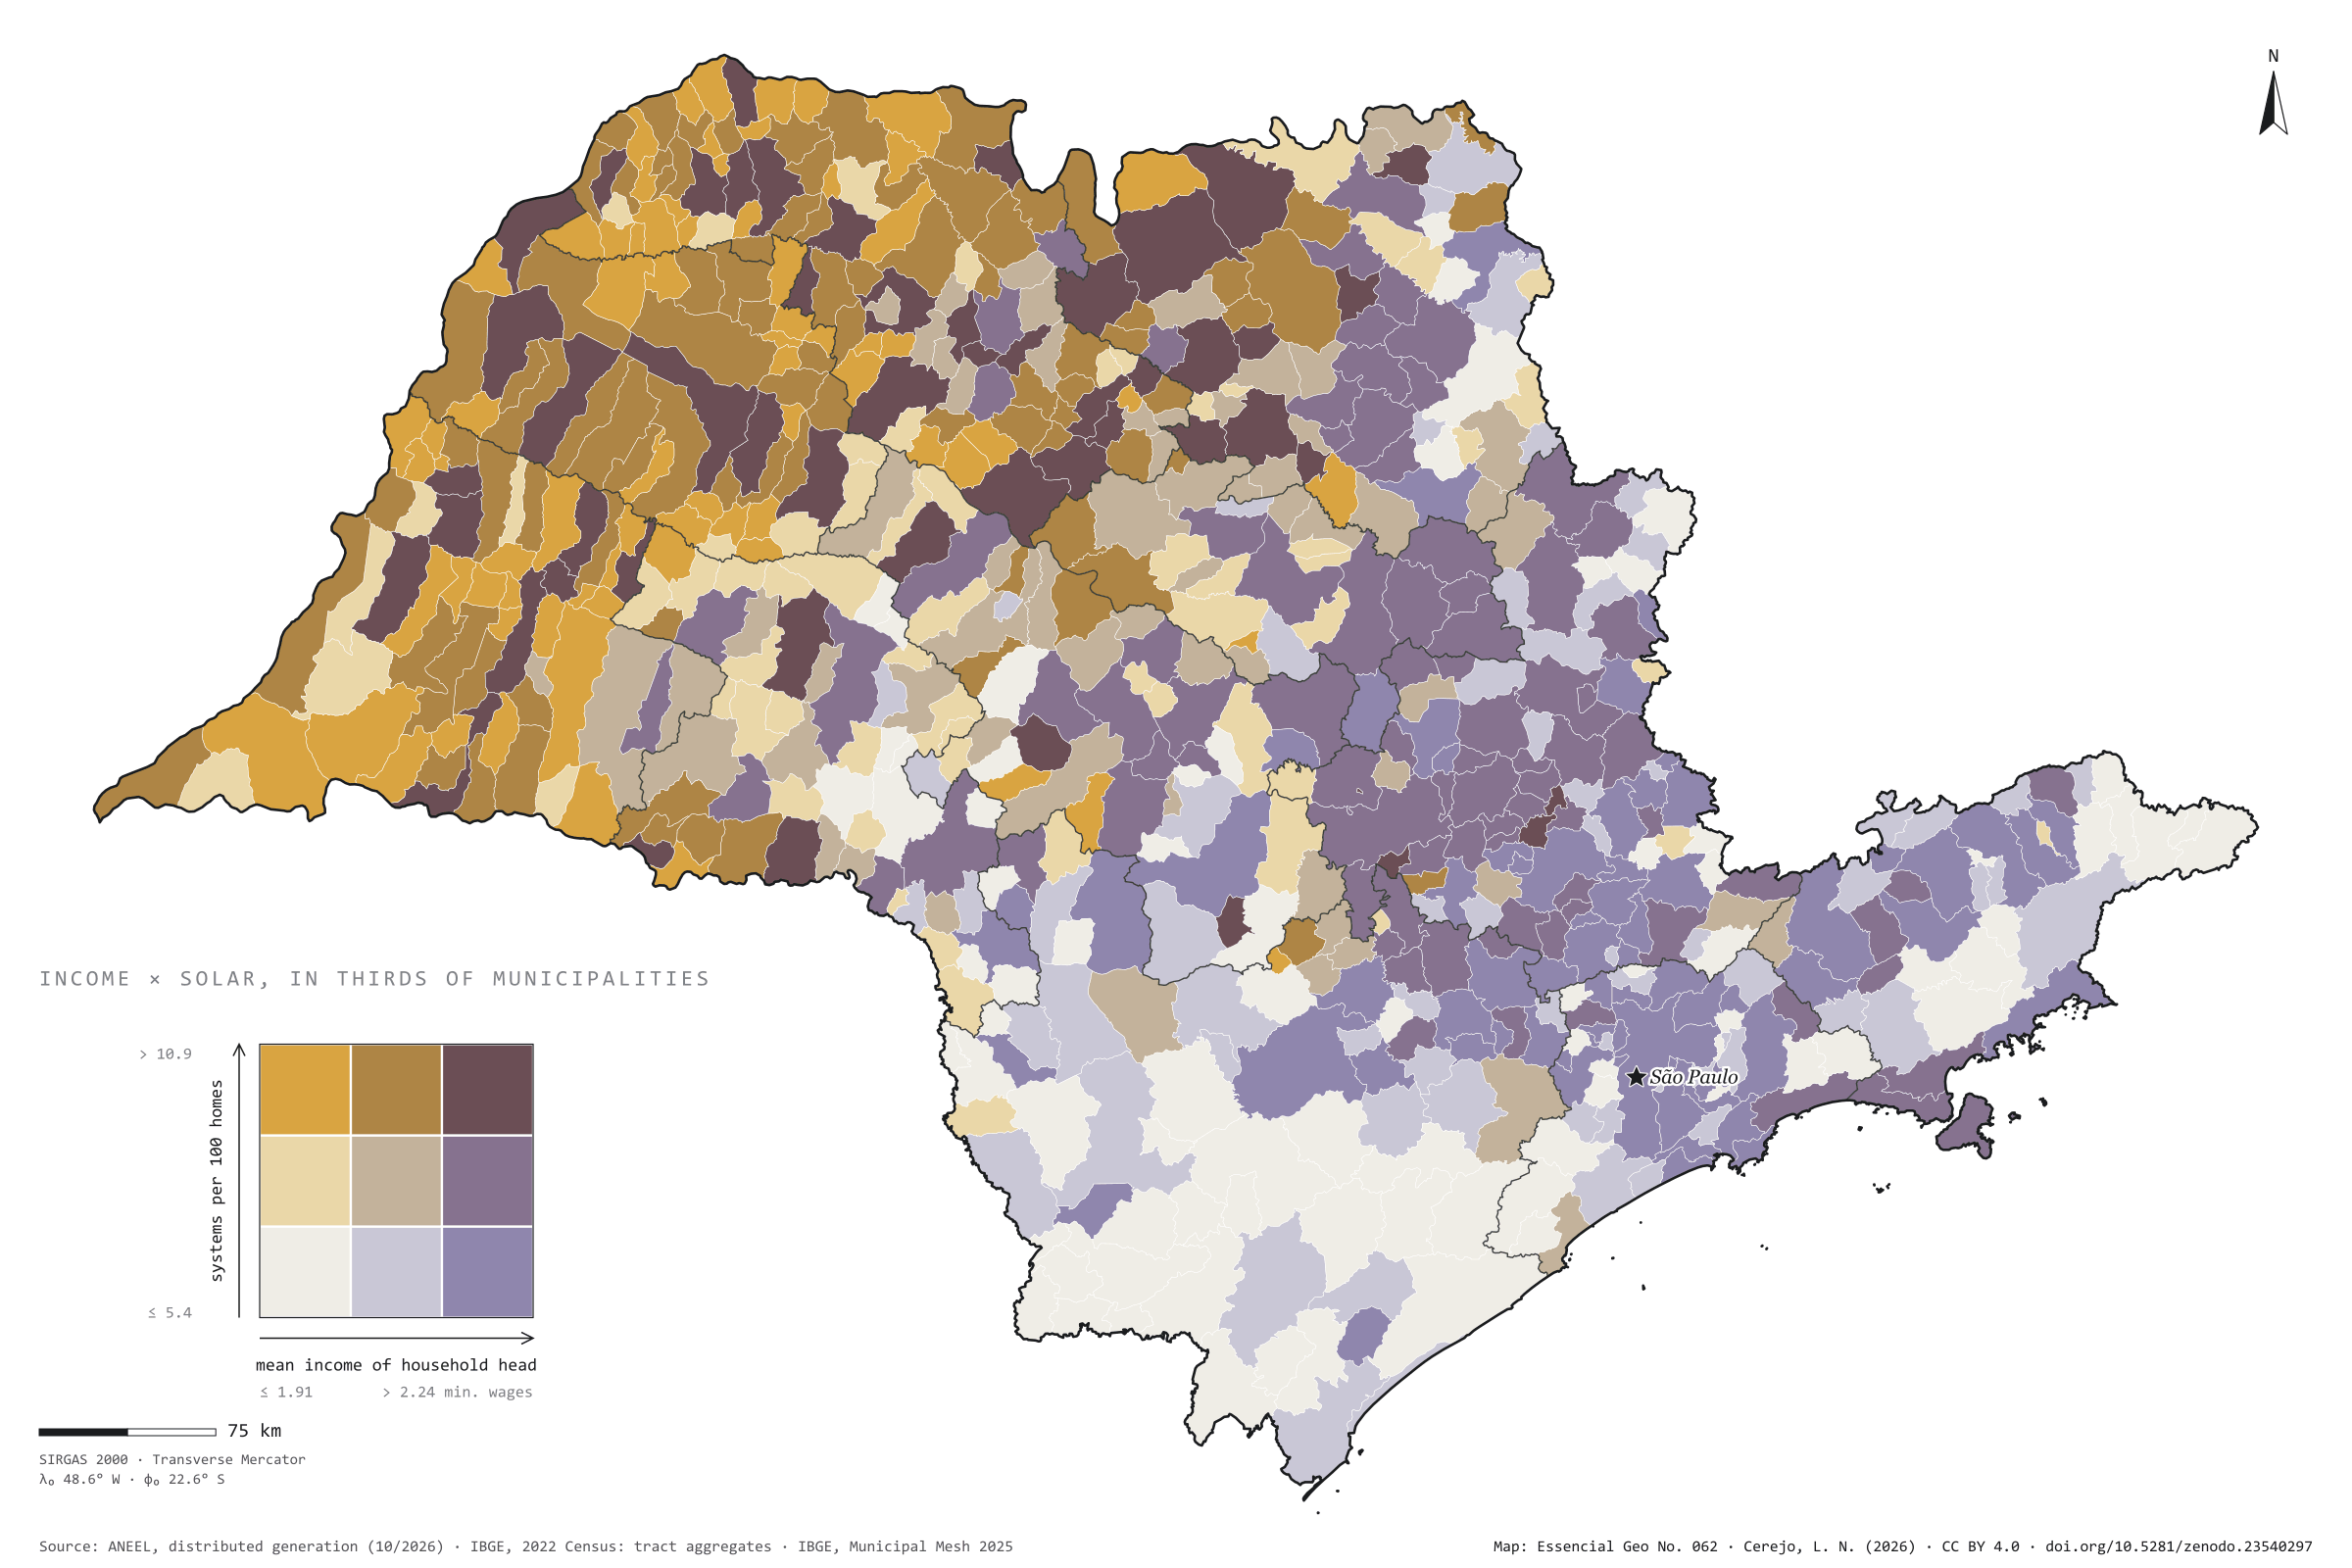
São Paulo has 664,000 residential solar systems registered with ANEEL, with 4.4 GW: 4.1 for every 100 occupied homes. One would expect them in the richest towns. They are not there. Across the 645 municipalities, the rank correlation between household heads’ mean income and systems per home is −0.01, that is, none. In the highest income third there are 3.8 systems per 100 homes; in the lowest, 4.2. The map lights up in ochre and brown in the west and north-west, where Dracena reaches 26 per 100, and so does Santo Expedito, with a mean income of 1.8 minimum wages. The capital, with a mean income of 4 minimum wages and more systems than any other city (22,000), has only 0.5 per 100 homes, like Santos: where people live in flats, there is no roof. Plate 044 shows distributed solar generation across Brazil. Last plate of the collection “Income and rooftop solar”.
Technical record · downloads · citation
At a glance
Residential solar systems by municipal income third (systems)
low income6.9%
mid income17.4%
high income75.7%
Residential solar systems per 100 homes
4.1systems
664,205 systems and 16.2 million homes
Rank correlation between income and uptake
-0Spearman’s ρ
Layers
municipiospolygon645 municipalities: households, mean income, residential solar systems, kW, systems per 100 homes, W per home, thirds and group
regioes_intermediariaspolygon11 intermediate geographic regions
ANEEL residential distributed photovoltaic systems per 100 occupied permanent private homes of the 2022 Census, and mean income of household heads with income, each in thirds of the 645 municipalities, crossed in a nine-class bivariate map; Spearman rank correlation.
The map without a frame, with legend, scale, reference system and credit written on it: ready for papers, lectures and slides. In two versions: with the basemap (neighbours and sea) or only the mapped area, on white.
CEREJO, Lucas Nakamura. Renda e telhado solar: o sol dos telhados não segue o dinheiro. Versão 1.0.0. [S. l.]: Zenodo, 2026. Conjunto de dados. DOI: 10.5281/zenodo.23540297. Disponível em: https://doi.org/10.5281/zenodo.23540297. Acesso em: 10 nov. 2026.
Cerejo, L. N. (2026). Renda e telhado solar: o sol dos telhados não segue o dinheiro [Income and rooftop solar: Rooftop sun does not follow the money] (Version 1.0.0) [Data set]. Zenodo. https://doi.org/10.5281/zenodo.23540297
@dataset{cerejo2026_renda_e_solar_sp,
  author    = {Cerejo, Lucas Nakamura},
  title     = {Renda e telhado solar: O sol dos telhados não segue o dinheiro},
  year      = {2026},
  publisher = {Zenodo},
  version   = {1.0.0},
  doi       = {10.5281/zenodo.23540297},
  url       = {https://doi.org/10.5281/zenodo.23540297},
  language  = {portuguese},
  note      = {English title: Income and rooftop solar: Rooftop sun does not follow the money. Licence CC BY 4.0}
}