Skip to content
Essencial

No. 063 Census · income People across the land 1/4

Where people live

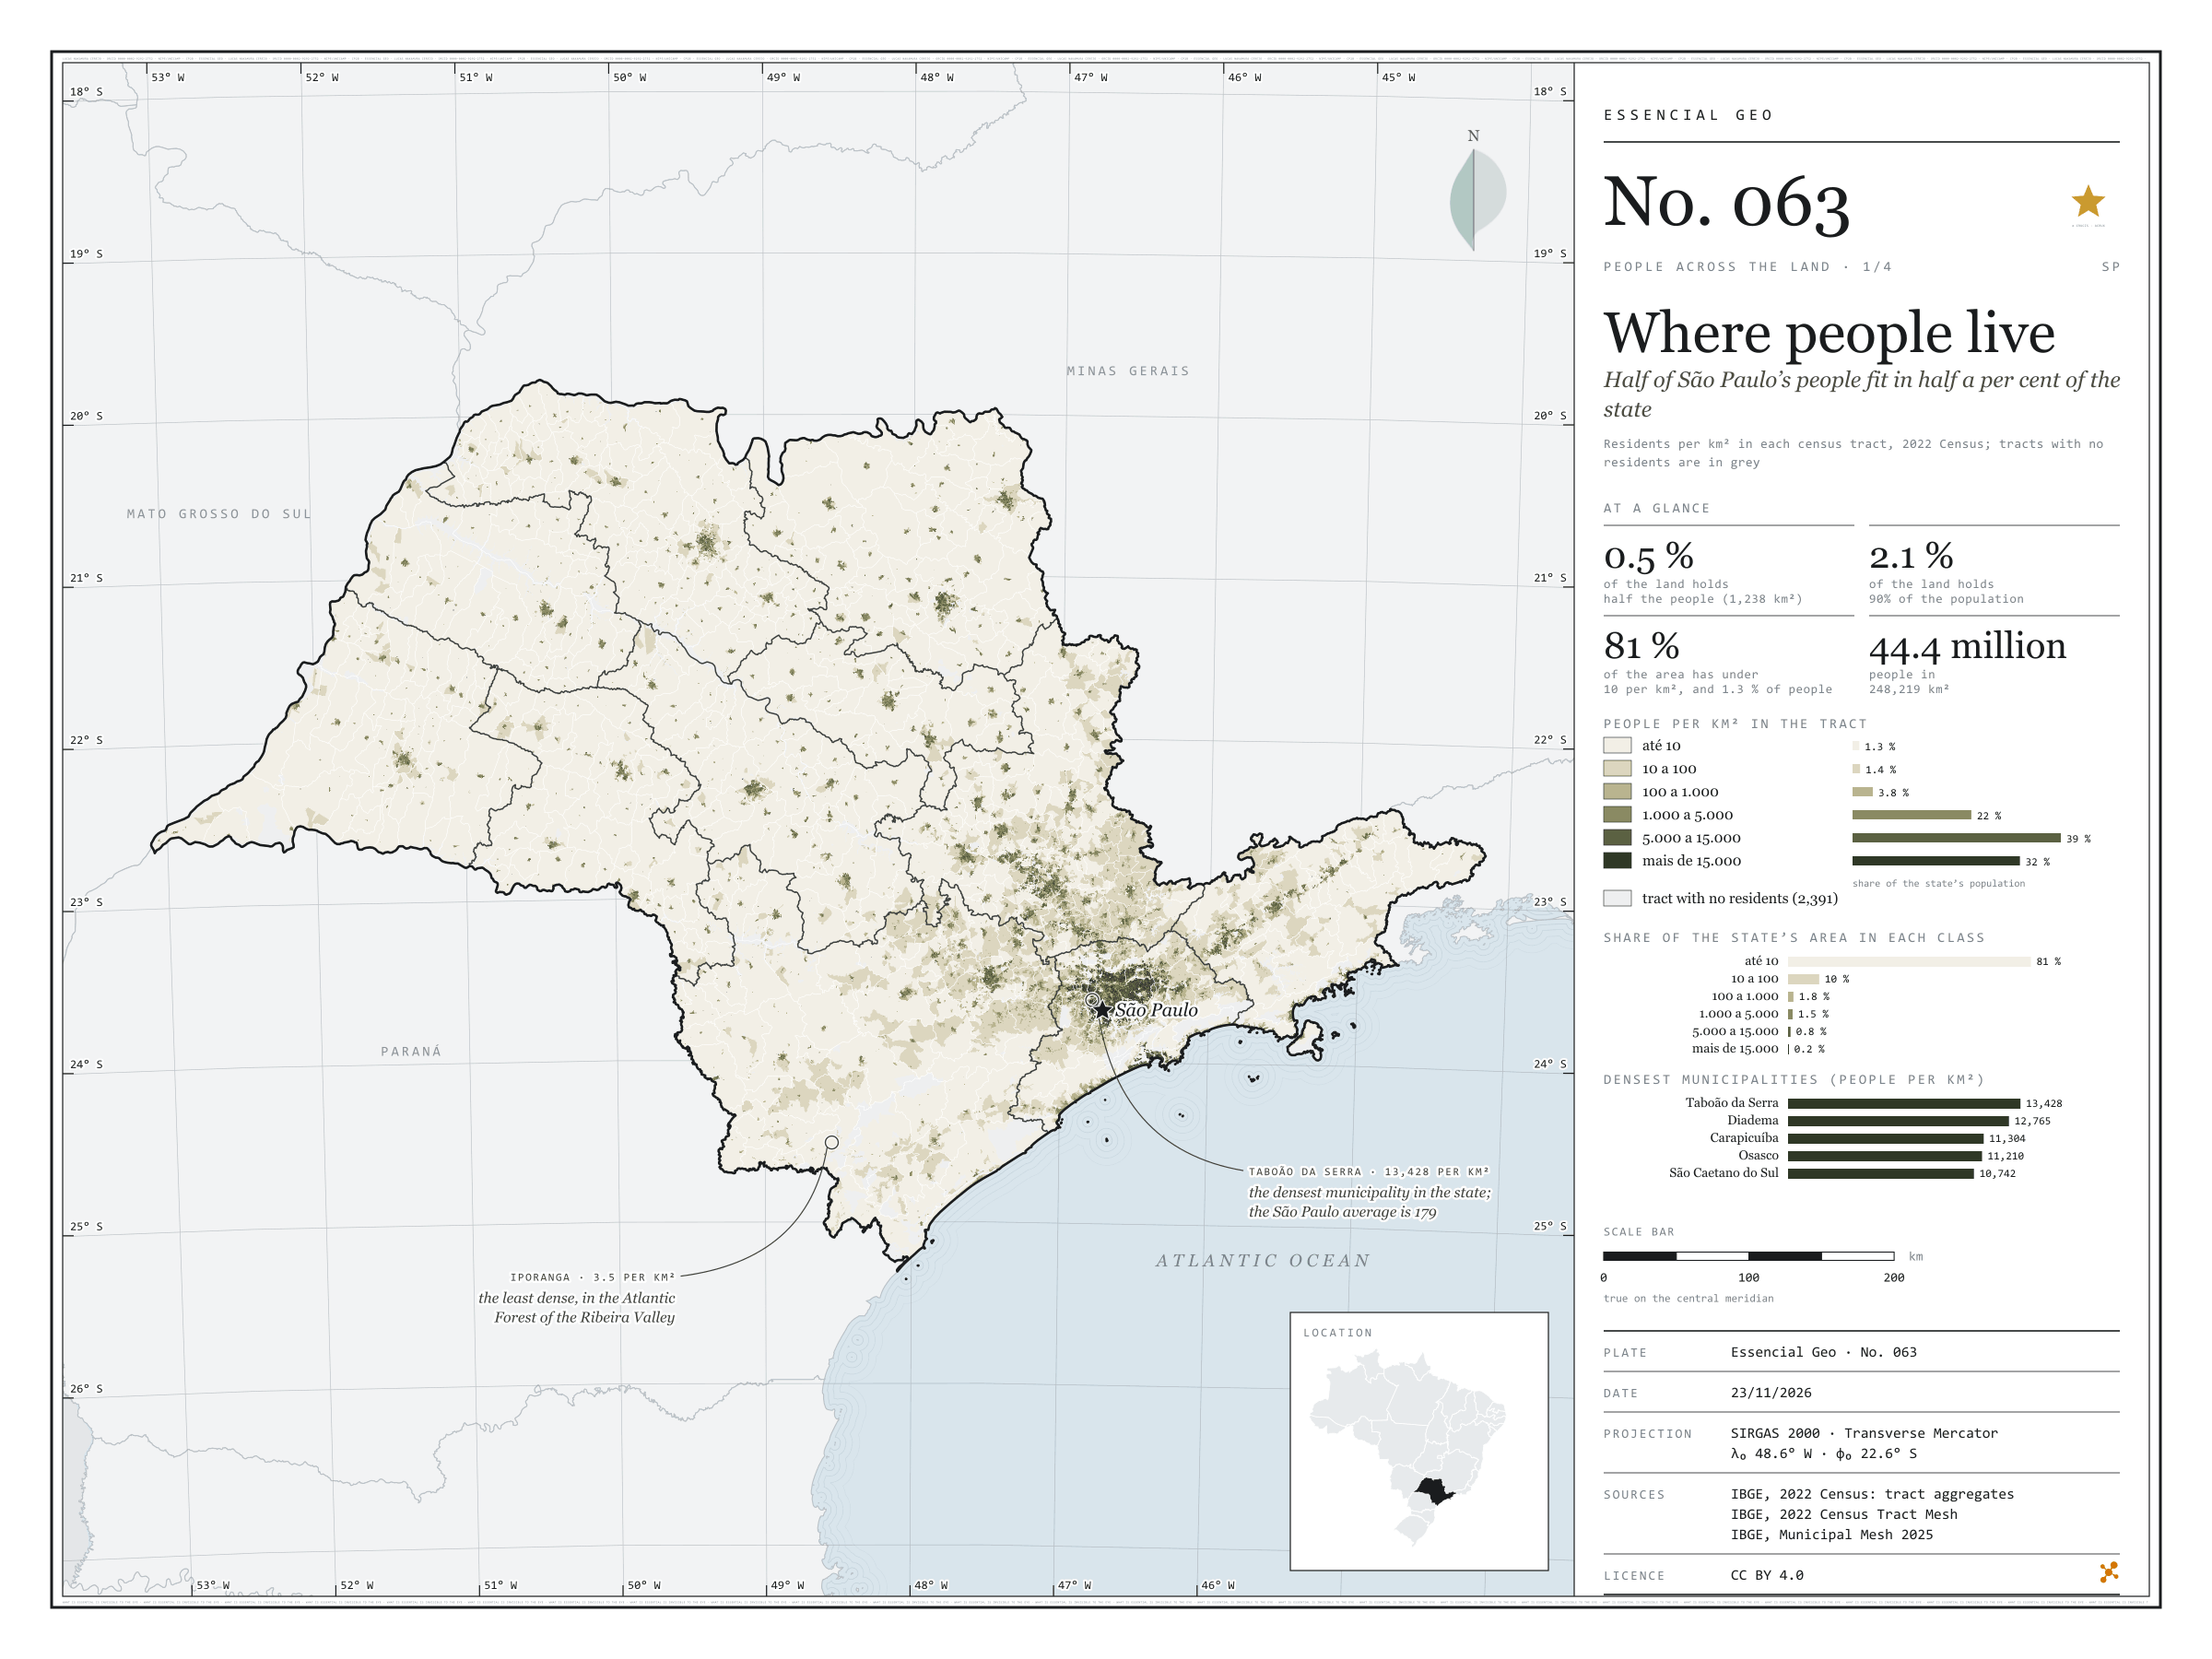
Half of São Paulo’s people fit in half a per cent of the state

Record, downloads and citation
Fig. 063 São Paulo State (SP) EPSG:4674 Source: IBGE

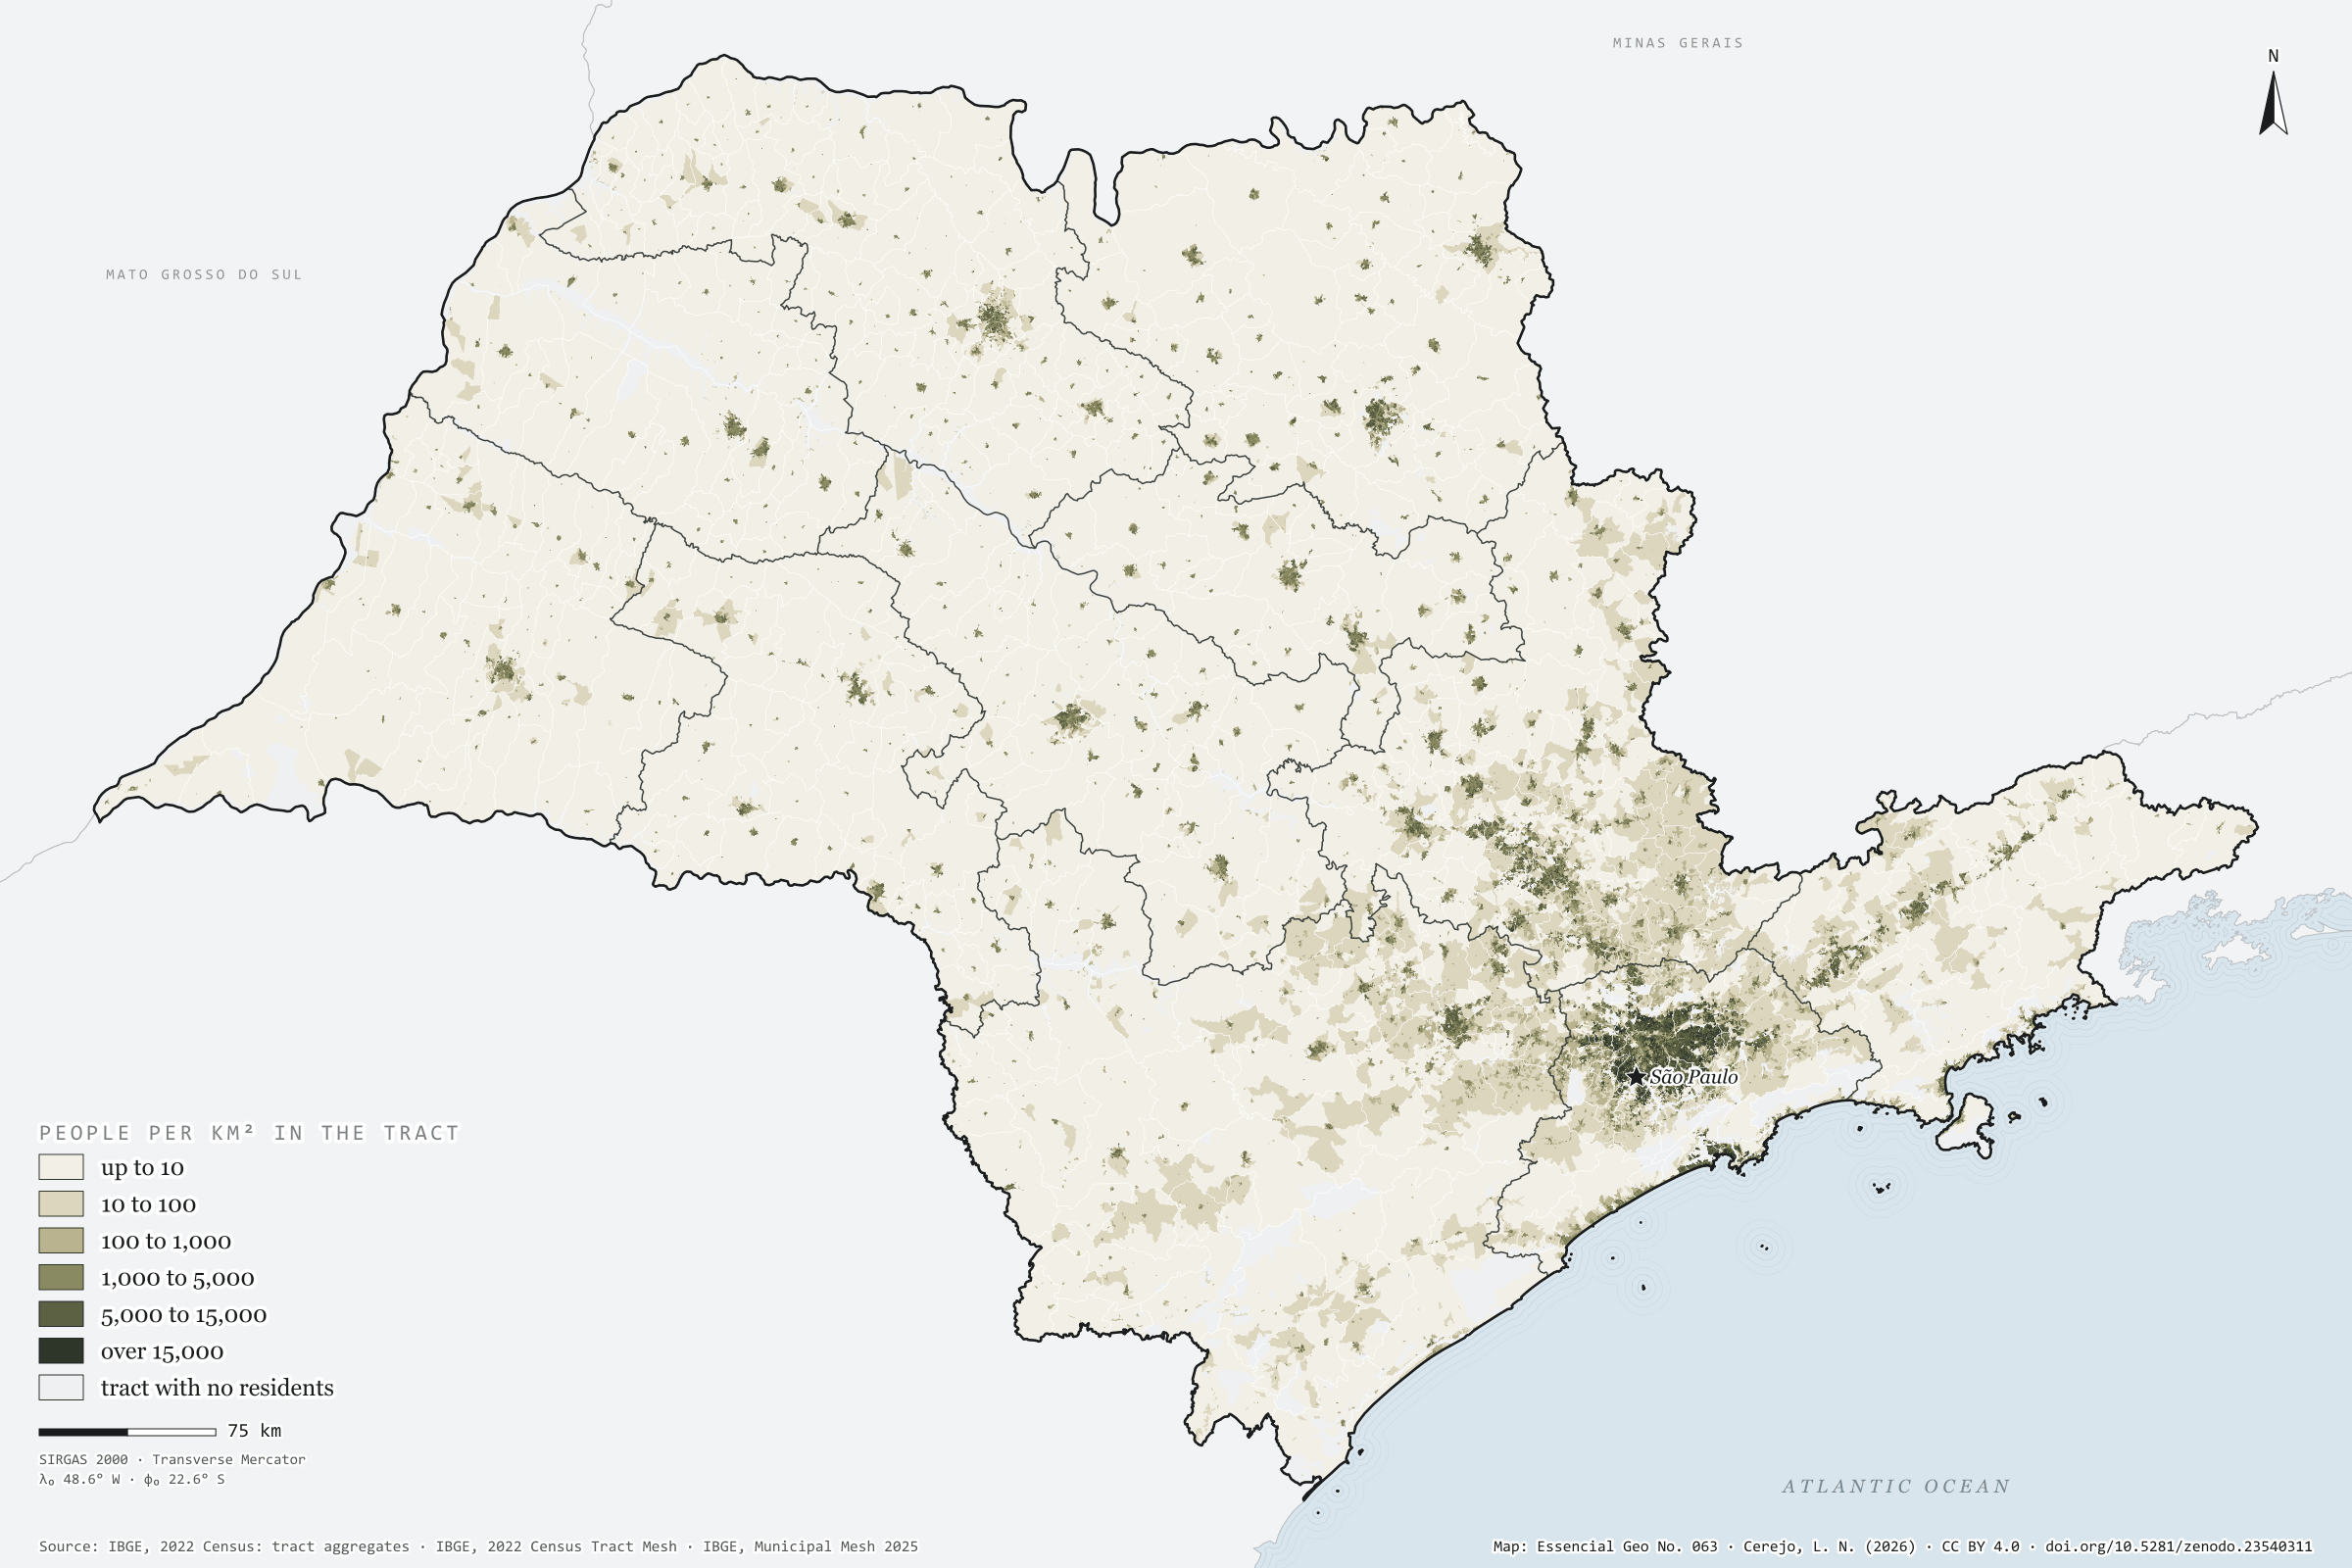
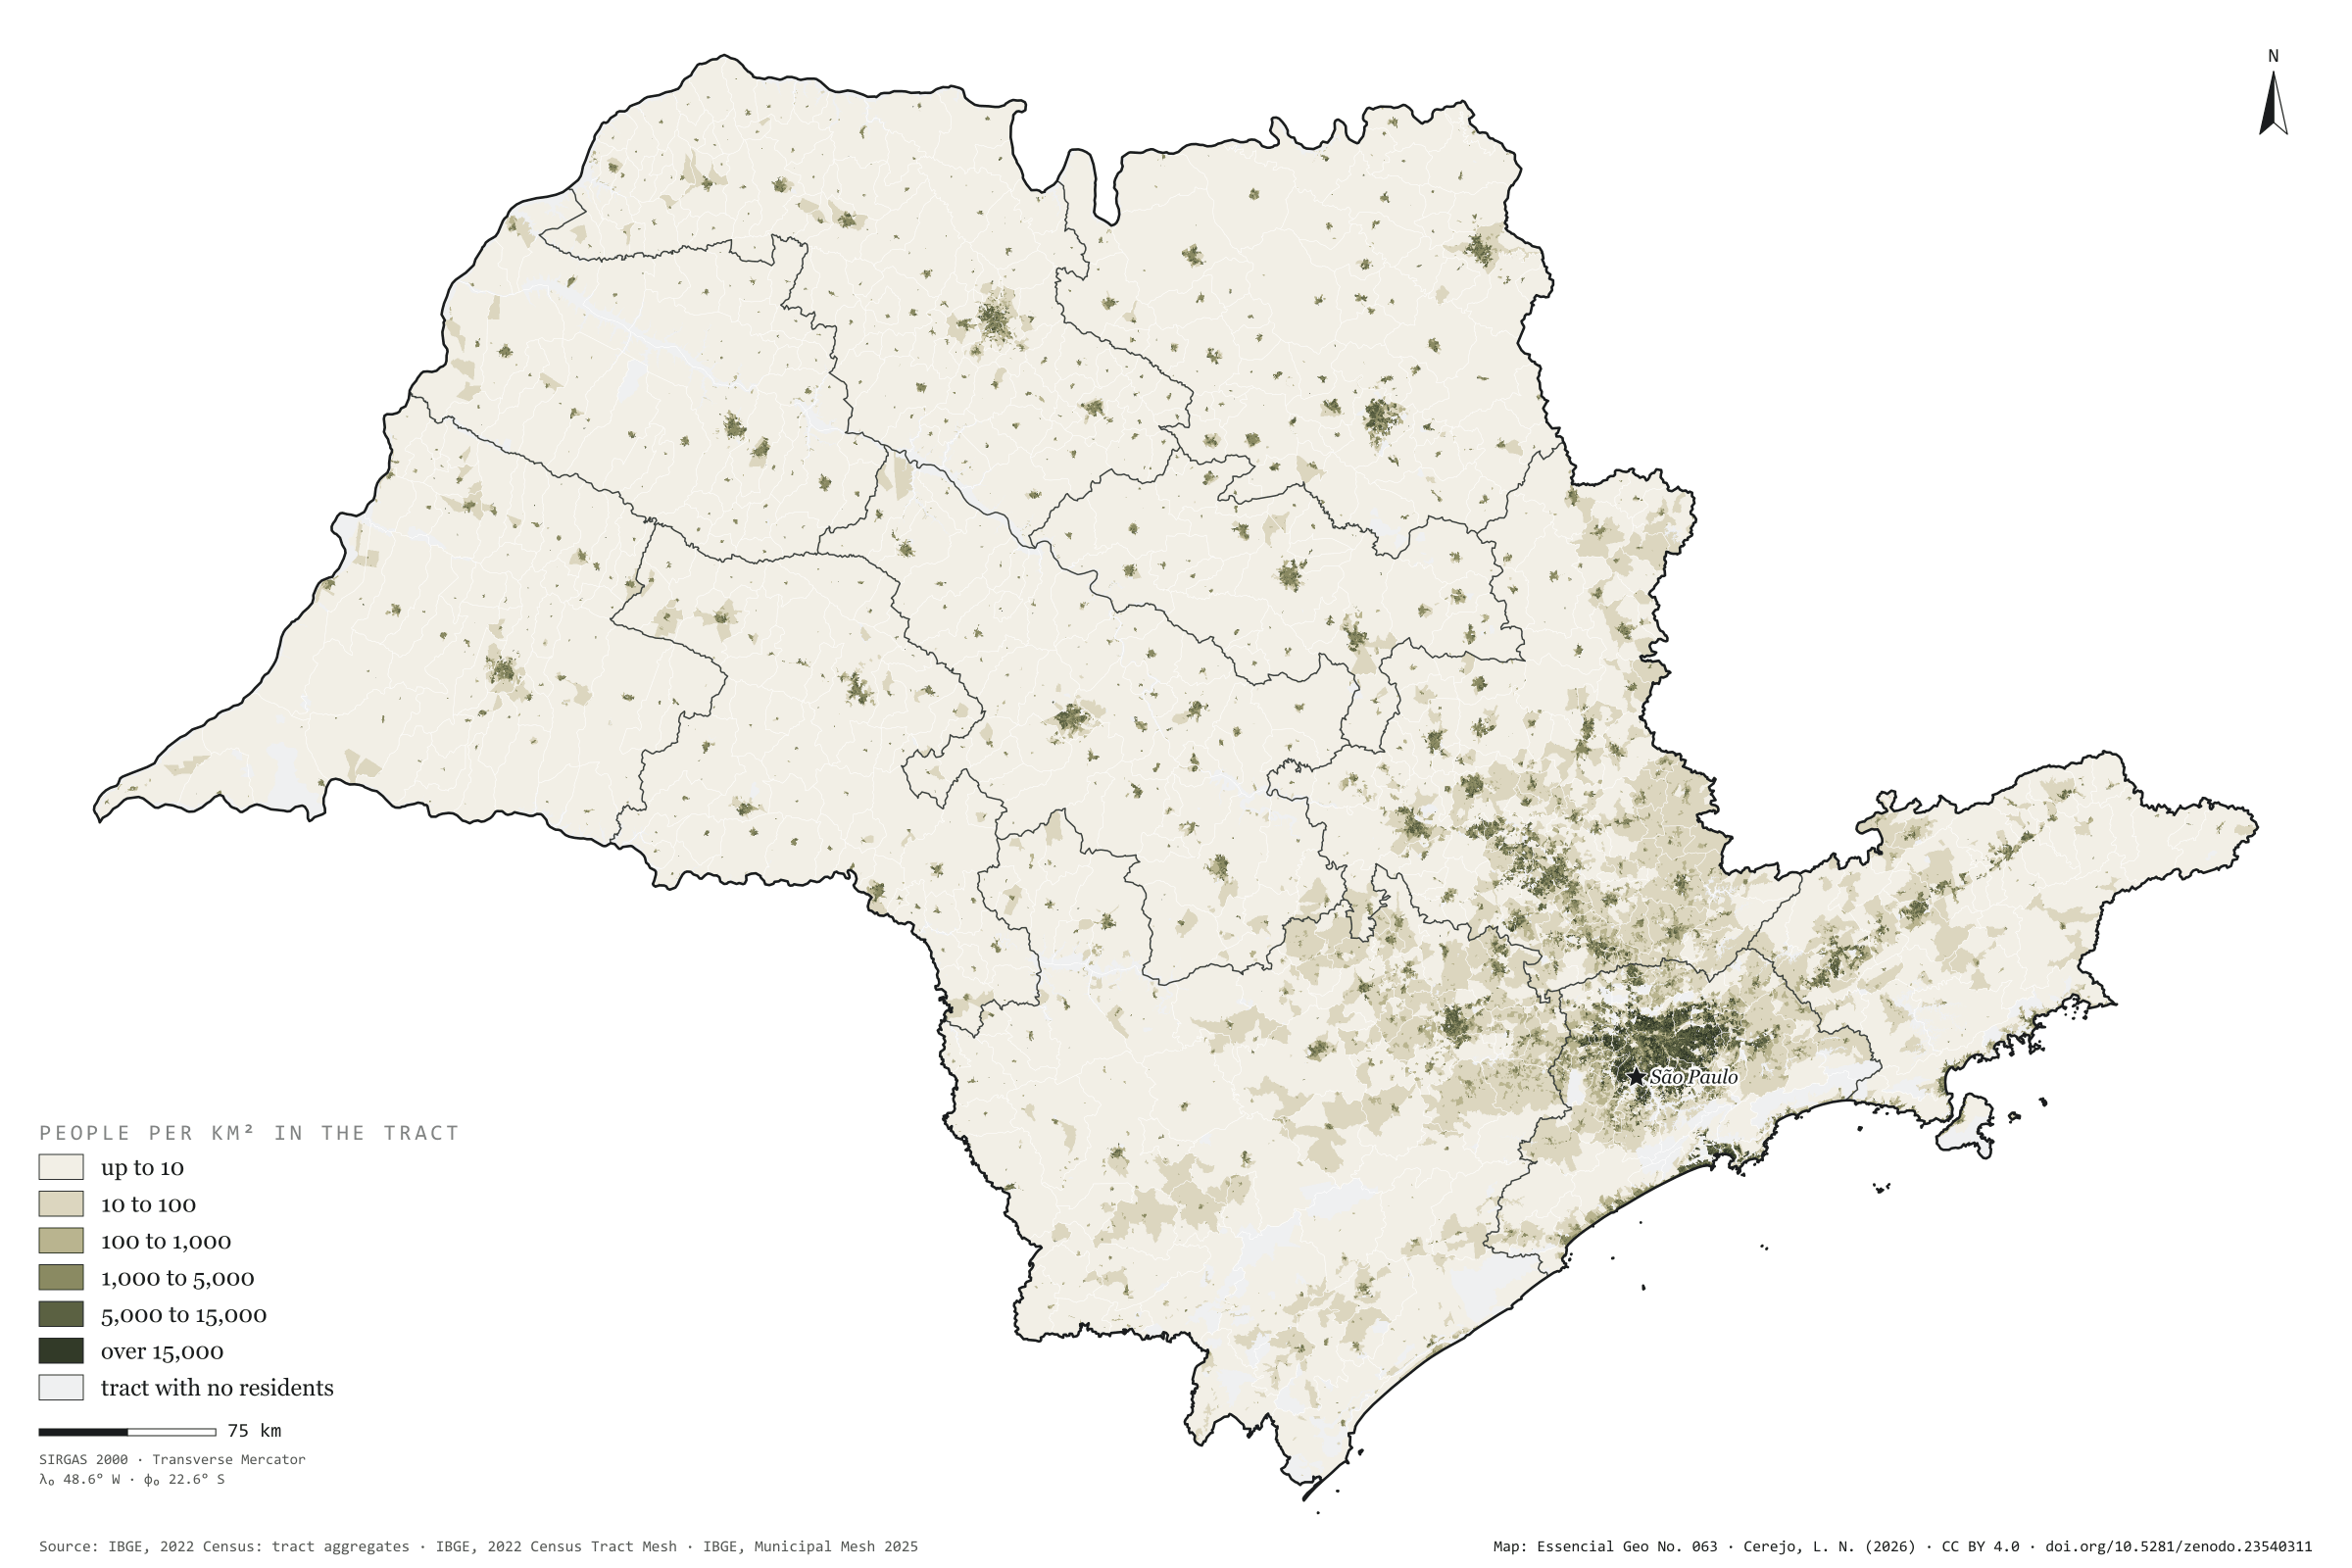
São Paulo has 44.4 million people on 248,000 km², 179 per km² on average. But the average misleads. Half the population lives in census tracts that together cover 1,238 km², 0.5% of the state; 90% live on 2.1%. At the other end, 81% of the area has fewer than 10 residents per km² and holds 1.3% of the people. The map is almost all cream, with dark dots for the towns and one continuous patch in Greater São Paulo, reaching towards Campinas, Sorocaba and the Paraíba Valley. The densest municipality is Taboão da Serra, with 13,428 residents per km², followed by Diadema and Carapicuíba; the capital has 7,521. The least dense is Iporanga, in the Ribeira Valley, with 3.5. First plate of the collection “People across the land”.

Technical record · downloads · citation

At a glance

Population by tract density (residents per km²) (people)
  • up to 10 1.3%
  • 10 to 100 1.4%
  • 100 to 1,000 3.8%
  • 1,000 to 5,000 22.5%
  • 5,000 to 15,000 39.4%
  • over 15,000 31.6%
Share of the land where half the population lives

0.5 %

1,238 km² of 248,219 km²

Residents per km² in the state

179 people per km²

Layers

  • setores polygon 103,319 tracts: area, people, residents per km², people by age group and density and 60-plus classes
  • regioes_intermediarias polygon 11 intermediate geographic regions
  • limite_estadual polygon State boundary

Metadata

Extent
São Paulo State (SP)
CRS / Projection
SIRGAS 2000 (EPSG:4674)
EPSG:4674
Software
Node.js · d3-geo · QGIS
Method
Residents per km² of each 2022 Census tract (the tract’s own area), in six classes; share of the state’s population and area in each class; cumulative area of tracts from densest to least dense until they hold half and 90% of the population.
Version
v1.0.0
Licence
CC BY 4.0

Downloads

Figure to reuse

The map without a frame, with legend, scale, reference system and credit written on it: ready for papers, lectures and slides. In two versions: with the basemap (neighbours and sea) or only the mapped area, on white.

Point a camera at it to open this page.

How to cite

Cerejo, L. N. (2026). Onde mora a gente: metade dos paulistas cabe em meio por cento do estado [Where people live: Half of São Paulo’s people fit in half a per cent of the state] (Version 1.0.0) [Data set]. Zenodo. https://doi.org/10.5281/zenodo.23540311

How to read this plate area, projection, scale, legend and source · 2 terms
1 Area
São Paulo State (SP) The area the plate covers. Outside it, neighbours and sea are drawn in grey, just for orientation.
2 Coordinates and projection
SIRGAS 2000 (EPSG:4674) The layers are in SIRGAS 2000; the drawing’s projection is written in the colophon at the foot of the panel.
3 Scale
Graphic scale bar in the panel The scale bar is true on the central meridian; away from it, measured distances vary a little.
4 Legend and layers
3 layers in the GeoPackage · polygon Read the legend before the map: it tells you whether a colour is a rate or a class, and whether a circle is a total.
5 Sources
IBGE (2022); IBGE (2025) Every figure comes from a public source, with its year. The data sheet gives each one’s address.

Terms on this plate

Census tract
The smallest collection area of the IBGE Census, a few hundred households each. It is the finest grain at which income, sanitation and housing can be seen without identifying anyone.
2022 Census
IBGE’s door-to-door count. Results by census tract give residents, age, household-head income, water, sewerage and rubbish.

Download

Layers, table and figures, under CC BY 4.0. Cite with the DOI.

Full record and citation

Method notes · No. 063

Population density by census tract in São Paulo

Português · English

Plate No. 063, the first of four in the collection People across the land: where São Paulo’s people live, age and sex by municipality, those aged 60 or over tract by tract, and the countryside.

What the files contain

Layer (GPKG)GeometryContent
setorespolygon103,319 tracts: CD_SETOR, CD_MUN, NM_MUN, situacao (urban/rural), area_km2, pessoas (people), hab_km2 (per km²), people by age group (idade_0_a_4 … idade_70_ou_mais), classe_densidade (1 to 6) and classe_60_mais (1 to 6, from plate 065)
regioes_intermediarias, limite_estadualpolygonreference

The GPKG is zipped in the assets of the gente-sp-2026 release, with two QGIS styles: densidade (this plate’s) and 60_anos_ou_mais (that of plate 065). Age groups are empty where IBGE applied confidentiality.

Method

  1. 2022 Census tract aggregates: resident people and tract area (km²), from the tract mesh.
  2. Residents per km² in six classes, closed on the right: up to 10, 10 to 100, 100 to 1,000, 1,000 to 5,000, 5,000 to 15,000 and over 15,000. Tracts with no residents (2,391) are grey.
  3. Share of population and area in each class. For the area holding half and 90% of the people, tracts are sorted from densest to least dense and their area summed until the cumulative population reaches the fraction.
  4. Municipalities: people in their tracts over the area in the 2025 Municipal Mesh.
  5. On the plate, tracts become a grid of about 200 m so the whole state can be drawn; the GPKG has the polygons.

Limitations

  • Density is the tract’s, which mixes blocks, squares, rivers and vacant land; in the small tracts of central São Paulo it exceeds a million per km², as they are little more than one building.
  • The area holding half the population depends on tract size: with smaller units it would be smaller still.
  • Population means residents: people who work or study in one place and live in another count where they live.

View this map’s folder on GitHub

Technical record

Technical record · No. 063

Where people live

At a glance

Population by tract density (residents per km²) (people)
  • up to 10 1.3%
  • 10 to 100 1.4%
  • 100 to 1,000 3.8%
  • 1,000 to 5,000 22.5%
  • 5,000 to 15,000 39.4%
  • over 15,000 31.6%
Share of the land where half the population lives

0.5 %

1,238 km² of 248,219 km²

Residents per km² in the state

179 people per km²

Layers

  • setores polygon 103,319 tracts: area, people, residents per km², people by age group and density and 60-plus classes
  • regioes_intermediarias polygon 11 intermediate geographic regions
  • limite_estadual polygon State boundary

Metadata

Extent
São Paulo State (SP)
CRS / Projection
SIRGAS 2000 (EPSG:4674)
EPSG:4674
Software
Node.js · d3-geo · QGIS
Method
Residents per km² of each 2022 Census tract (the tract’s own area), in six classes; share of the state’s population and area in each class; cumulative area of tracts from densest to least dense until they hold half and 90% of the population.
Version
v1.0.0
Licence
CC BY 4.0

Downloads

Figure to reuse

The map without a frame, with legend, scale, reference system and credit written on it: ready for papers, lectures and slides. In two versions: with the basemap (neighbours and sea) or only the mapped area, on white.

Point a camera at it to open this page.

How to cite

Cerejo, L. N. (2026). Onde mora a gente: metade dos paulistas cabe em meio por cento do estado [Where people live: Half of São Paulo’s people fit in half a per cent of the state] (Version 1.0.0) [Data set]. Zenodo. https://doi.org/10.5281/zenodo.23540311

100%