Skip to content
Essencial

No. 062 Energy · biomass Income and rooftop solar 3/3

Income and rooftop solar

Rooftop sun does not follow the money

Record, downloads and citation
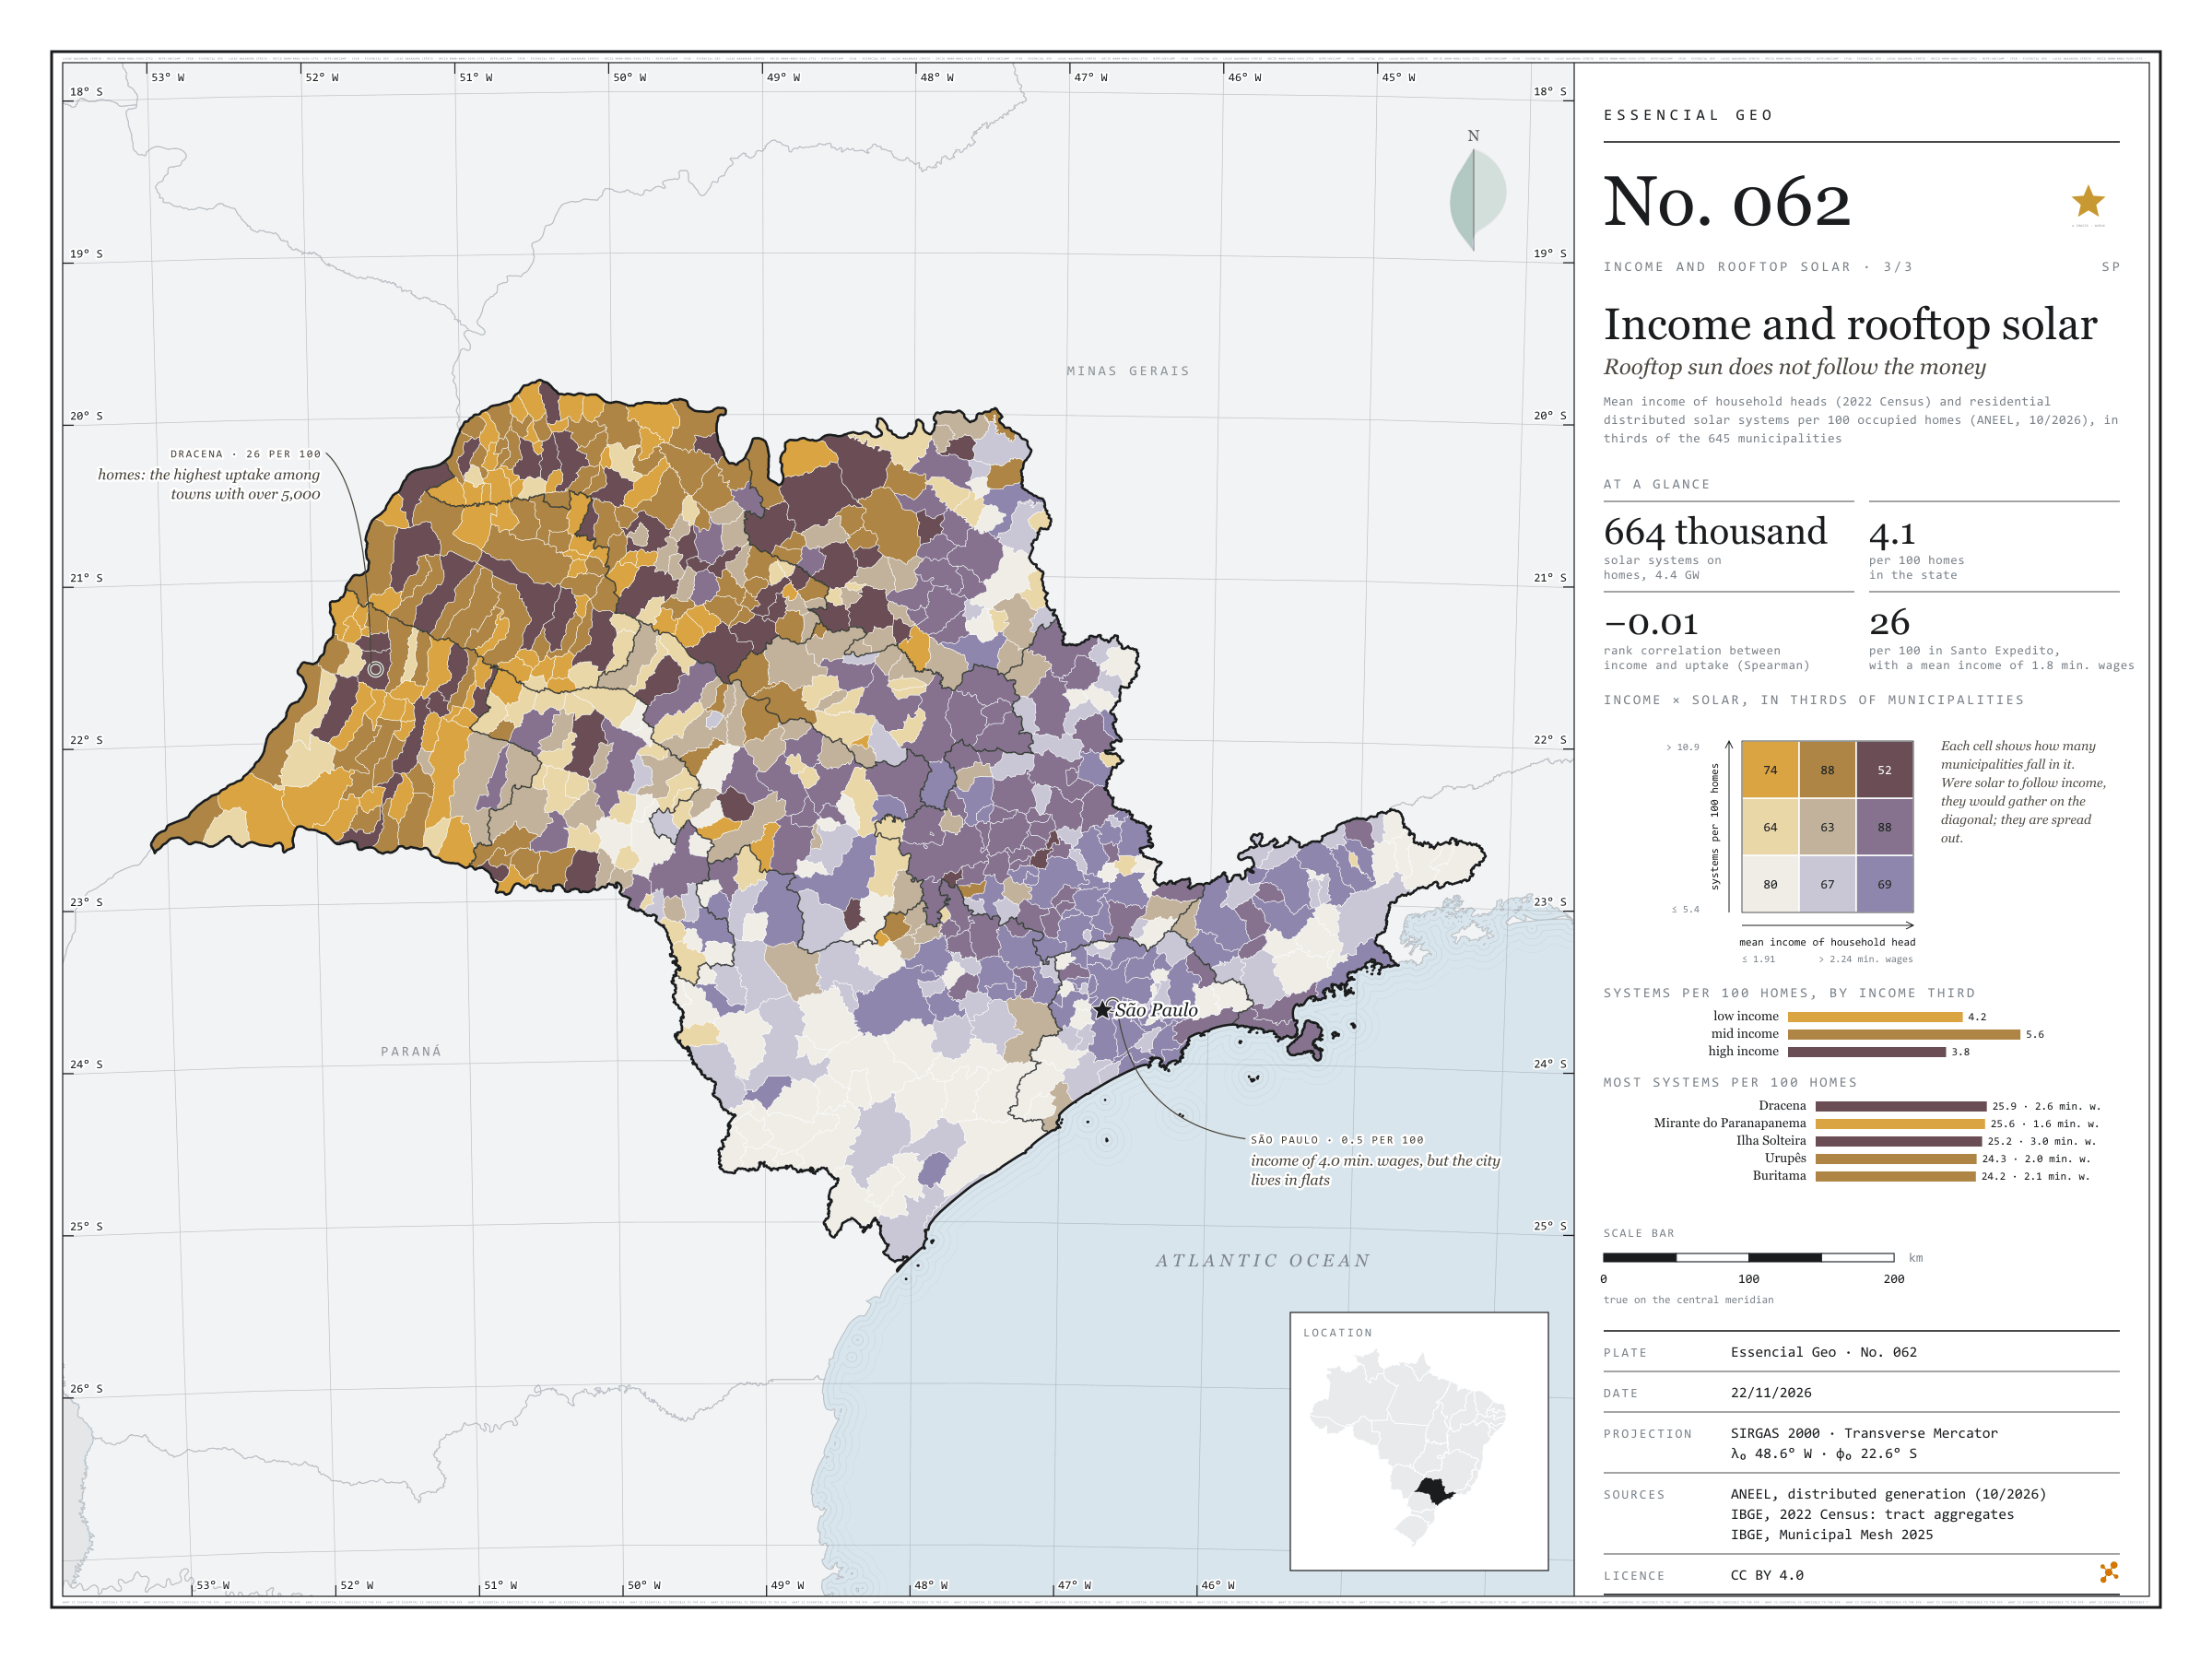
Fig. 062 São Paulo State (SP) EPSG:4674 Source: ANEEL, IBGE

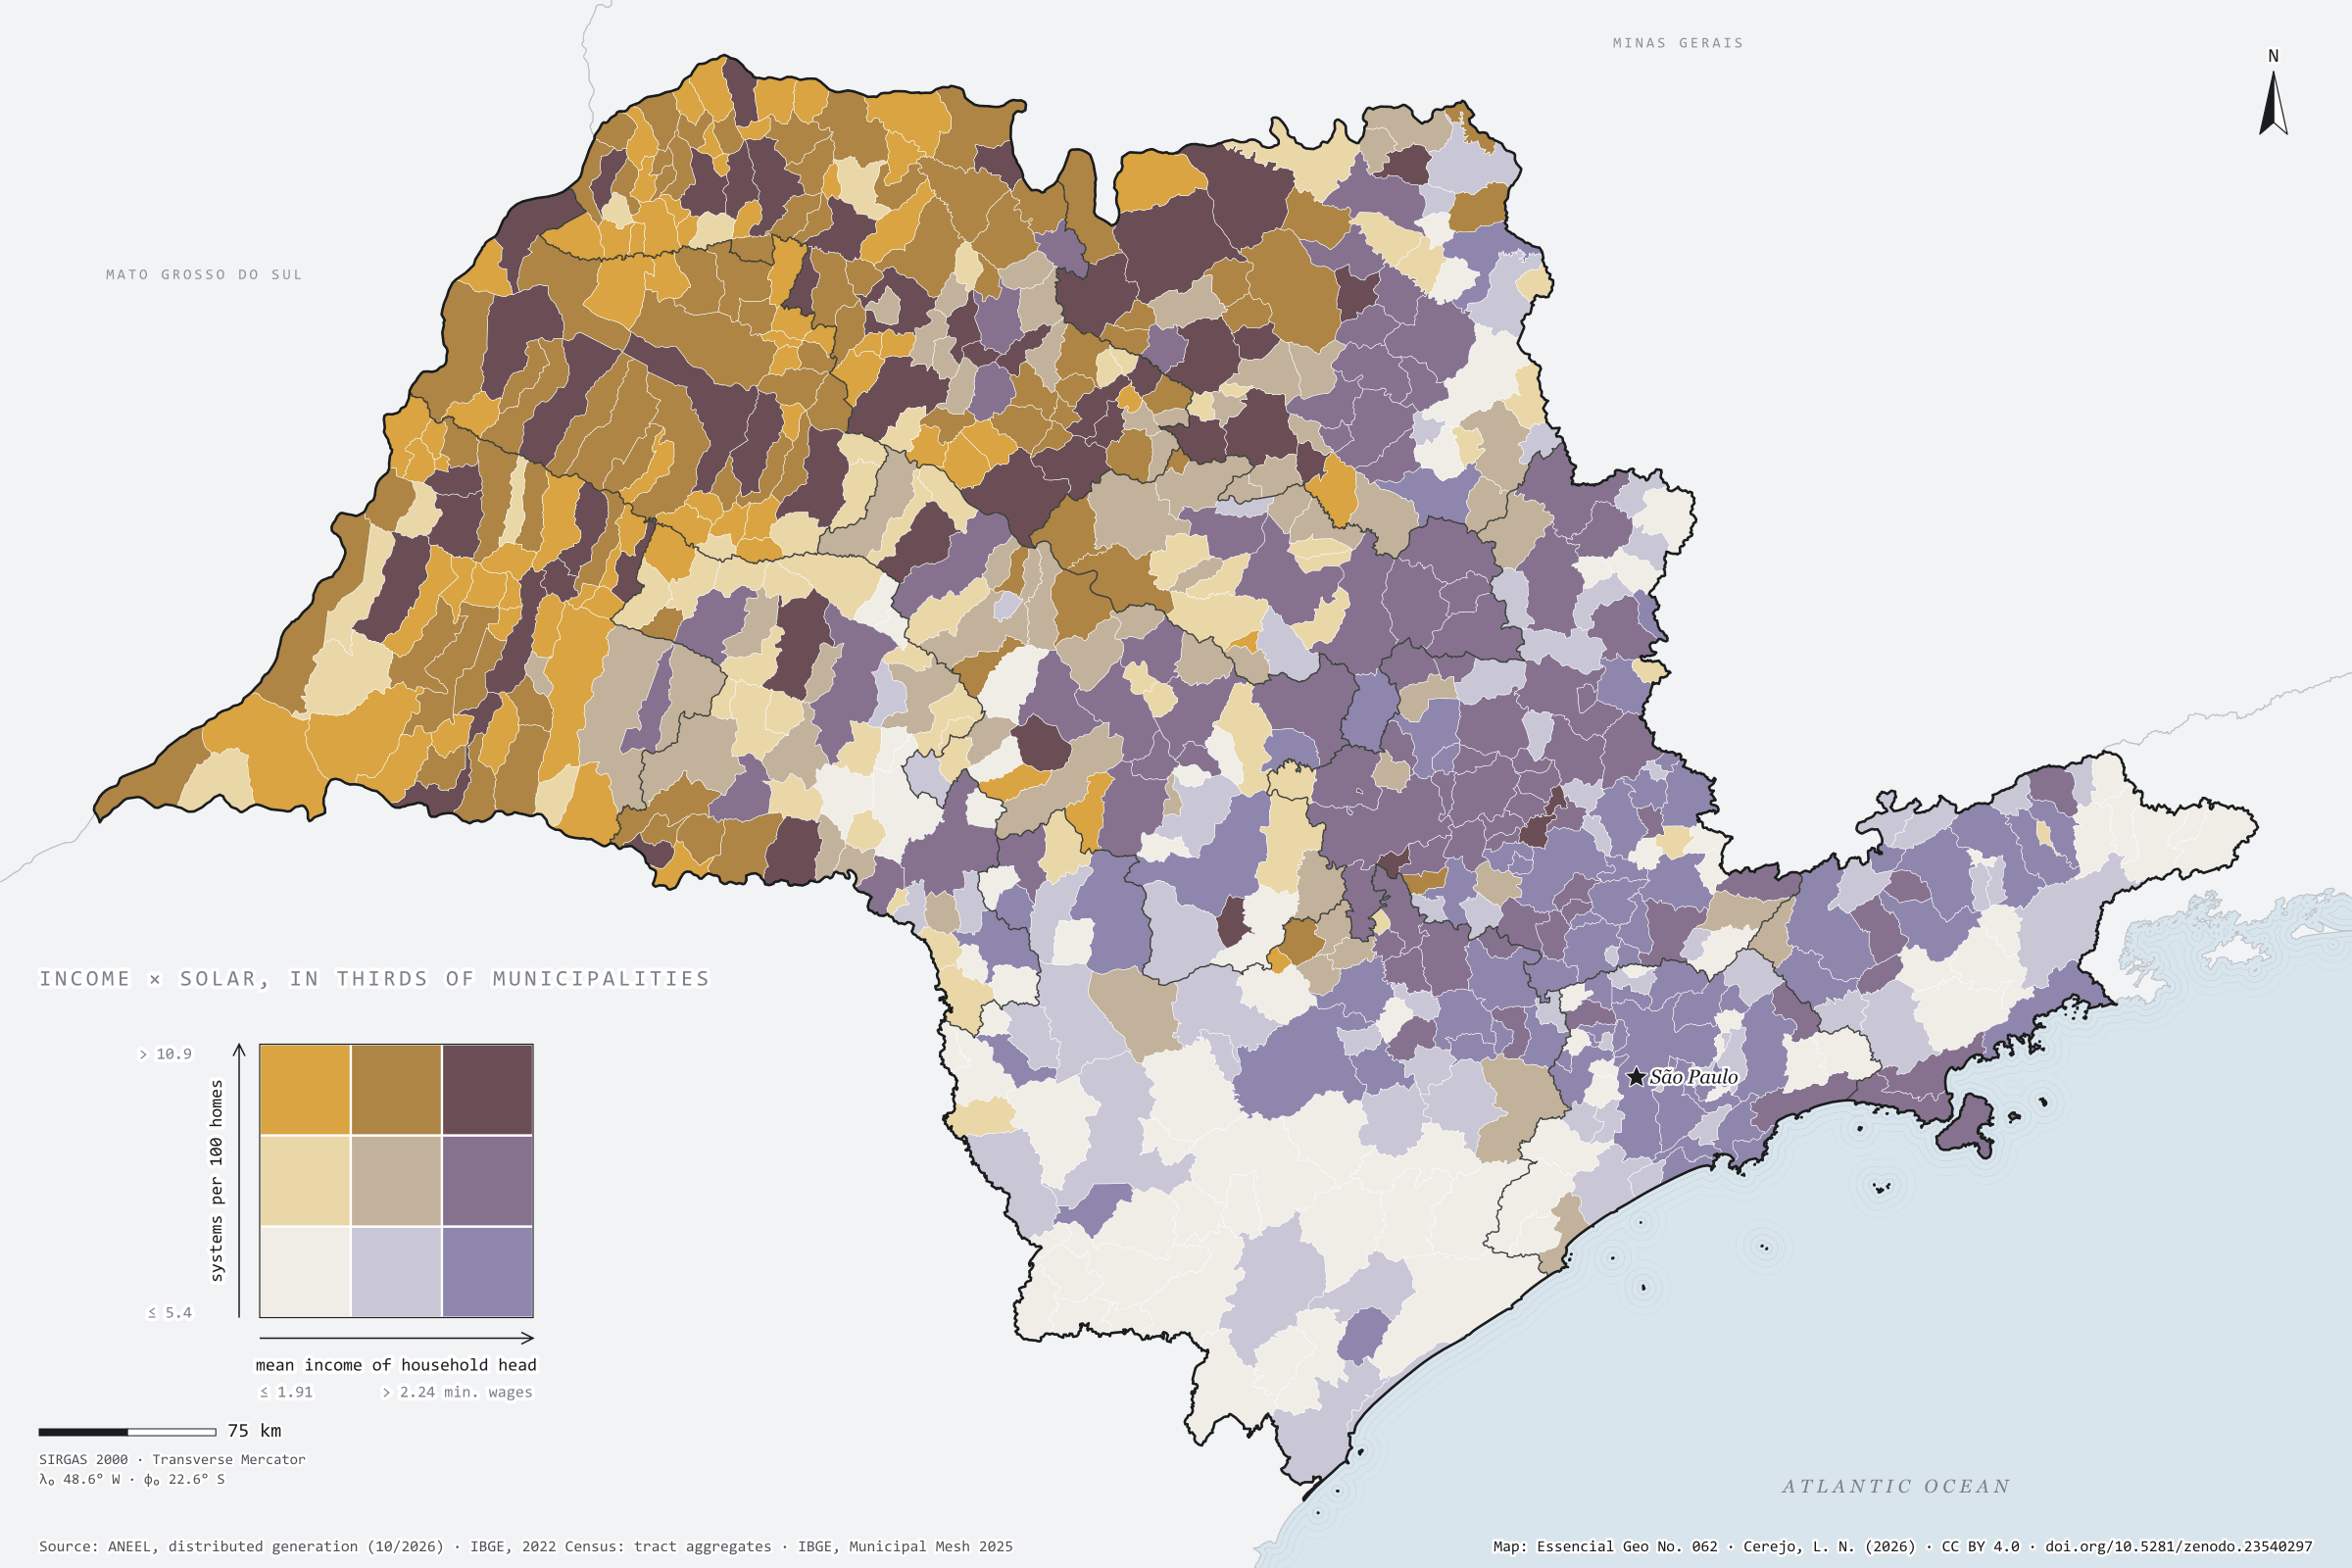
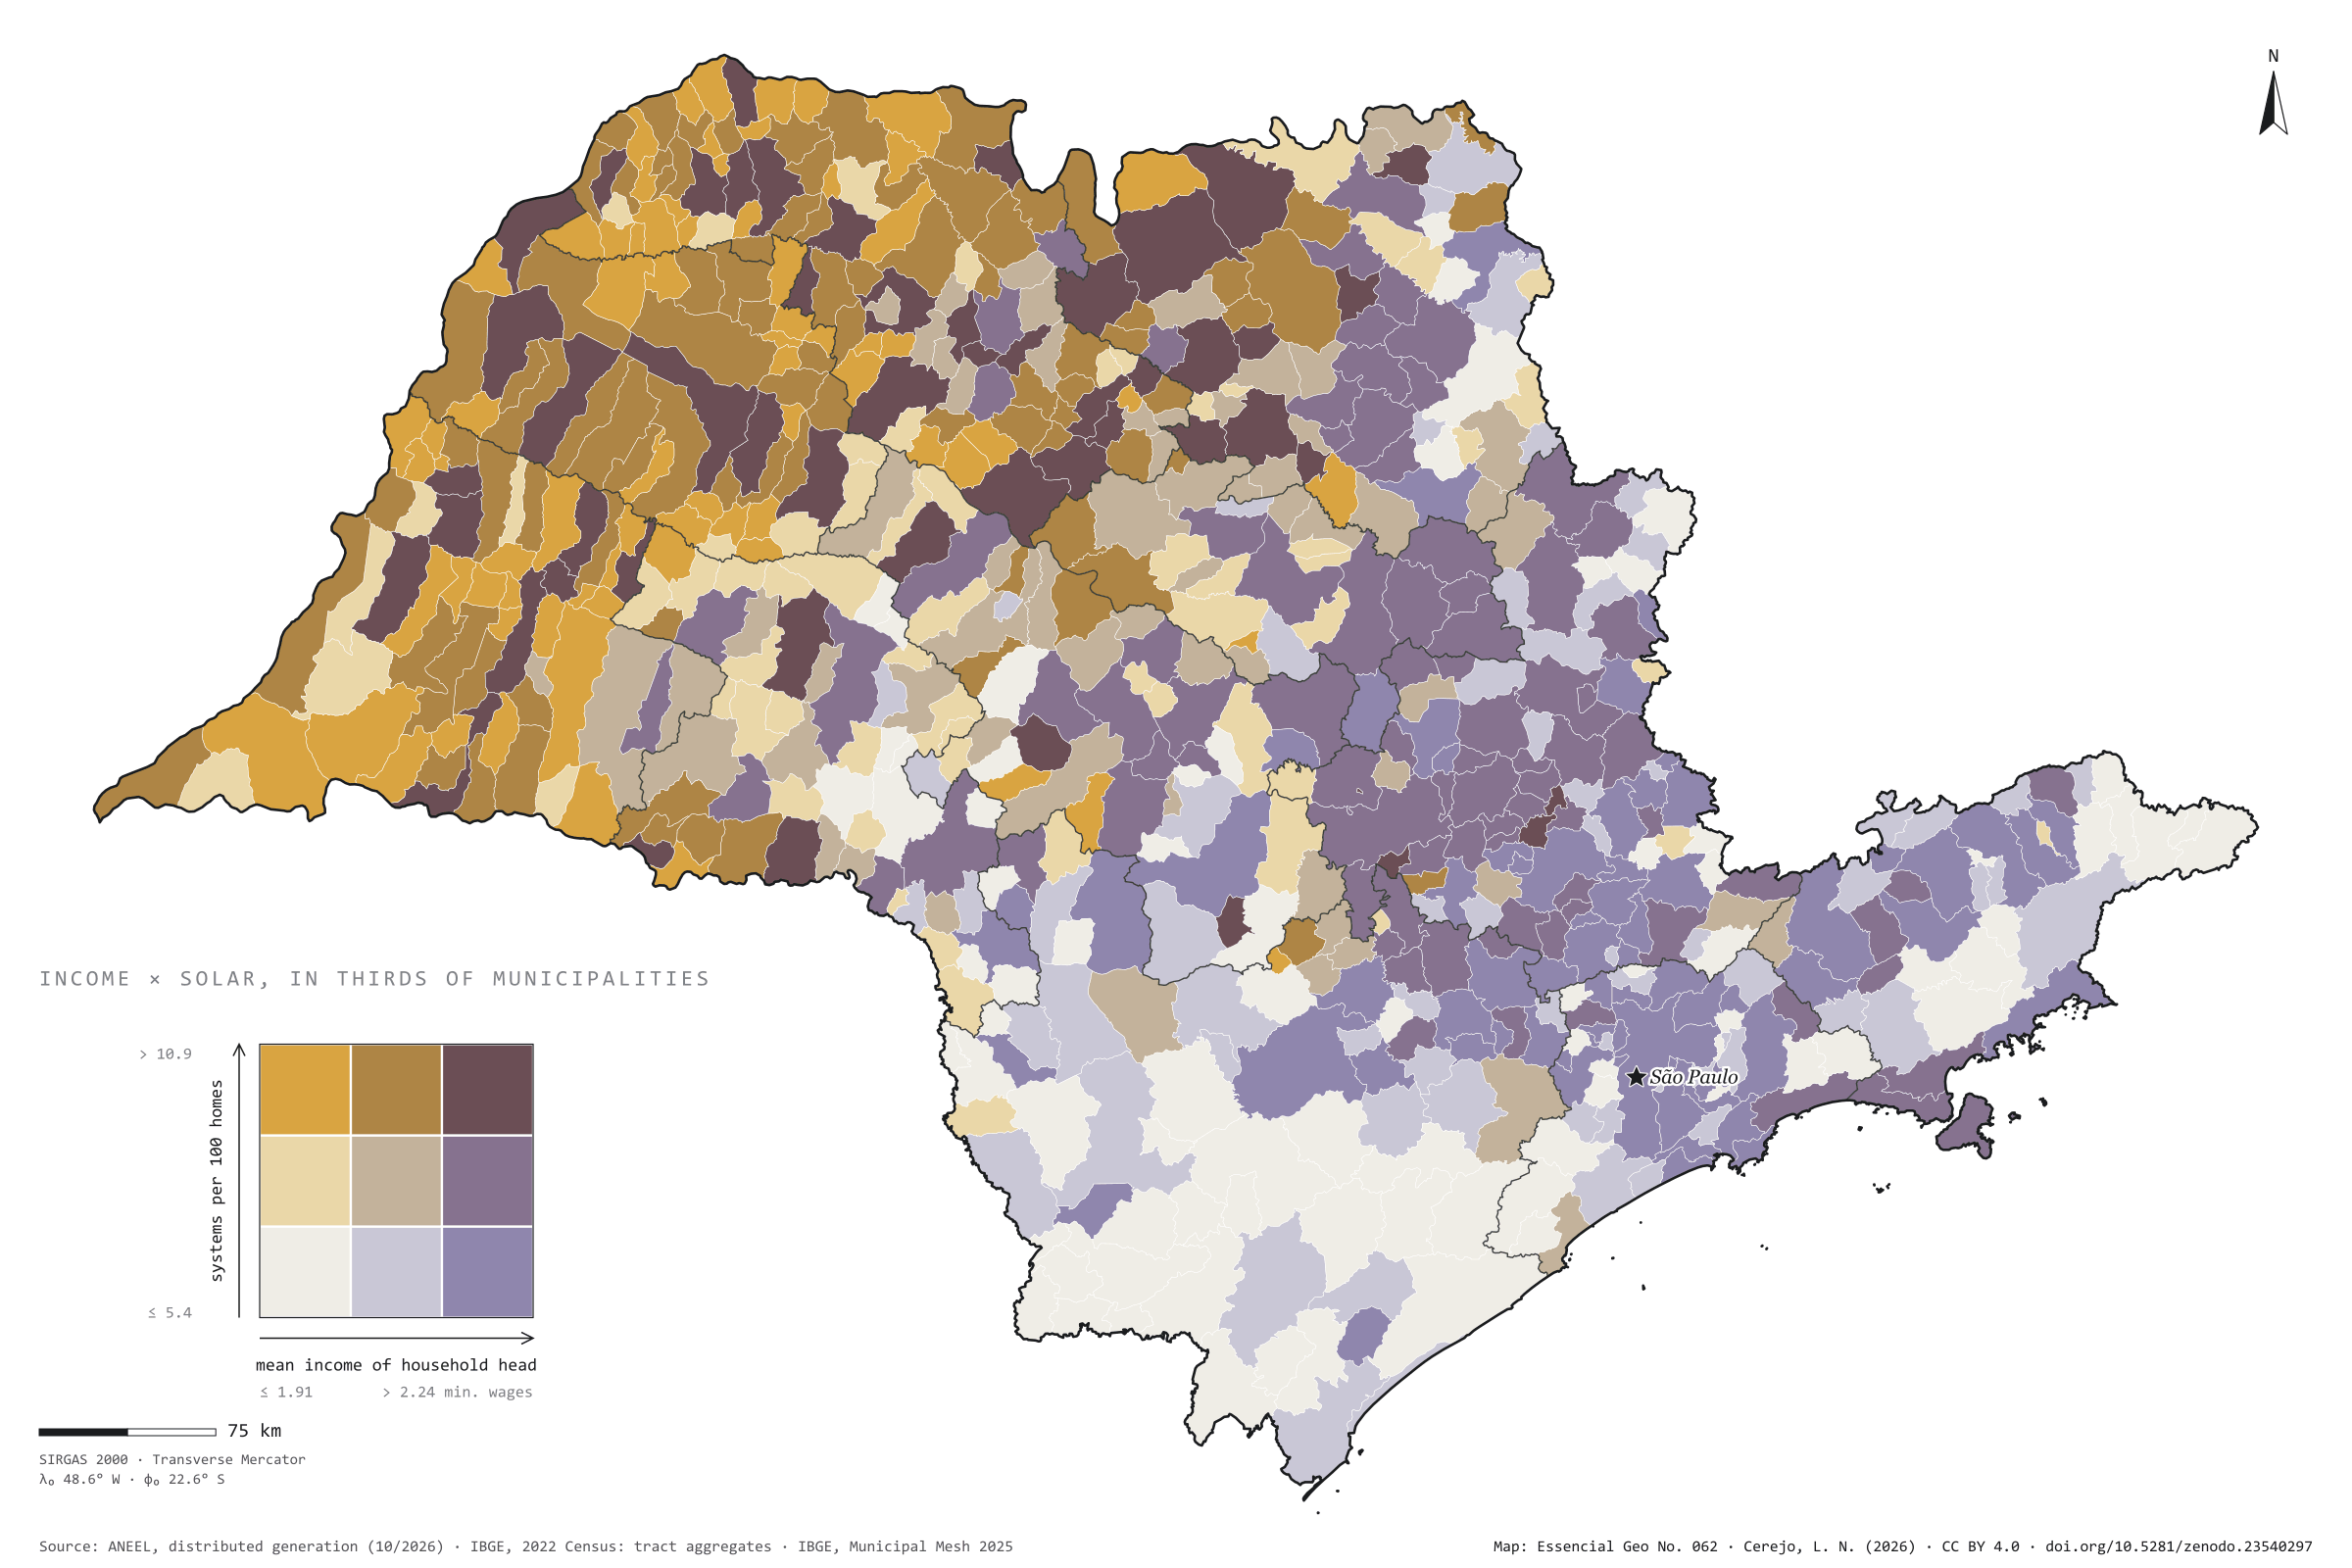
São Paulo has 664,000 residential solar systems registered with ANEEL, with 4.4 GW: 4.1 for every 100 occupied homes. One would expect them in the richest towns. They are not there. Across the 645 municipalities, the rank correlation between household heads’ mean income and systems per home is −0.01, that is, none. In the highest income third there are 3.8 systems per 100 homes; in the lowest, 4.2. The map lights up in ochre and brown in the west and north-west, where Dracena reaches 26 per 100, and so does Santo Expedito, with a mean income of 1.8 minimum wages. The capital, with a mean income of 4 minimum wages and more systems than any other city (22,000), has only 0.5 per 100 homes, like Santos: where people live in flats, there is no roof. Plate 044 shows distributed solar generation across Brazil. Last plate of the collection “Income and rooftop solar”.

Technical record · downloads · citation

At a glance

Residential solar systems by municipal income third (systems)
  • low income 6.9%
  • mid income 17.4%
  • high income 75.7%
Residential solar systems per 100 homes

4.1 systems

664,205 systems and 16.2 million homes

Rank correlation between income and uptake

-0 Spearman’s ρ

Layers

  • municipios polygon 645 municipalities: households, mean income, residential solar systems, kW, systems per 100 homes, W per home, thirds and group
  • regioes_intermediarias polygon 11 intermediate geographic regions
  • limite_estadual polygon State boundary

Metadata

Extent
São Paulo State (SP)
CRS / Projection
SIRGAS 2000 (EPSG:4674)
EPSG:4674
Software
Node.js · d3-geo · QGIS
Method
ANEEL residential distributed photovoltaic systems per 100 occupied permanent private homes of the 2022 Census, and mean income of household heads with income, each in thirds of the 645 municipalities, crossed in a nine-class bivariate map; Spearman rank correlation.
Version
v1.0.0
Licence
CC BY 4.0

Downloads

Figure to reuse

The map without a frame, with legend, scale, reference system and credit written on it: ready for papers, lectures and slides. In two versions: with the basemap (neighbours and sea) or only the mapped area, on white.

Point a camera at it to open this page.

How to cite

Cerejo, L. N. (2026). Renda e telhado solar: o sol dos telhados não segue o dinheiro [Income and rooftop solar: Rooftop sun does not follow the money] (Version 1.0.0) [Data set]. Zenodo. https://doi.org/10.5281/zenodo.23540297

How to read this plate area, projection, scale, legend and source · 2 terms
1 Area
São Paulo State (SP) The area the plate covers. Outside it, neighbours and sea are drawn in grey, just for orientation.
2 Coordinates and projection
SIRGAS 2000 (EPSG:4674) The layers are in SIRGAS 2000; the drawing’s projection is written in the colophon at the foot of the panel.
3 Scale
Graphic scale bar in the panel The scale bar is true on the central meridian; away from it, measured distances vary a little.
4 Legend and layers
3 layers in the GeoPackage · polygon Read the legend before the map: it tells you whether a colour is a rate or a class, and whether a circle is a total.
5 Sources
ANEEL (2026); IBGE (2022); IBGE (2025) Every figure comes from a public source, with its year. The data sheet gives each one’s address.

Terms on this plate

2022 Census
IBGE’s door-to-door count. Results by census tract give residents, age, household-head income, water, sewerage and rubbish.
ANEEL
Brazil’s National Electricity Agency: it registers every power plant and distributed-generation system, with source, capacity and municipality.

Download

Layers, table and figures, under CC BY 4.0. Cite with the DOI.

Full record and citation

Method notes · No. 062

Income and residential solar generation in São Paulo’s municipalities

Português · English

Plate No. 062, the last of three in the collection Income and rooftop solar: the income of plates 060 and 061 crossed with solar systems on house roofs. Distributed solar generation per inhabitant across the country is on plate 044.

What the files contain

Layer (GPKG)GeometryContent
municipiospolygon645 municipalities: pessoas (people), dppo (occupied permanent private homes), responsaveis (household heads), renda_media (R$) and renda_media_sm (minimum wages), solar_sistemas and solar_kw (residential), sistemas_100_dom (per 100 homes), w_por_dom (W per home), terco_renda, terco_solar and grupo (solar third and income third, 11 to 33)
regioes_intermediarias, limite_estadualpolygonreference

The municipios layer has three QGIS styles: renda_e_solar (the plate’s), solar_por_100_domicilios and renda_media_sm. The CSV has the same table, without geometry.

Method

  1. ANEEL: distributed generation units with a photovoltaic source and residential consumer class in SP, in the October 2026 list, counted and summed (kW) by the unit’s municipality. Aggregable fields only: no names, tax IDs or postcodes.
  2. 2022 Census: occupied permanent private homes and mean income of household heads with income, the mean of tracts with data weighted by household heads.
  3. Thirds: each measure is cut into three groups of about 215 municipalities (income up to 1.91 minimum wages, 1.91 to 2.24 and above; systems up to 5.35 per 100 homes, 5.35 to 10.93 and above).
  4. Spearman correlation between the ranks of the two measures in the 645 municipalities.

Limitations

  • A system is not a home: some houses have more than one record, and 130,061 systems (20%) are remote self-consumption, which may sit in one municipality and offset a bill in another.
  • The residential class does not tell houses from blocks of flats; a condominium system counts as one.
  • Income is from the 2022 Census and systems from 2026; the comparison is between places, not families: it does not say who, within each town, put panels on the roof.
  • Housing type is a reading of the map, not a measure on this plate.

View this map’s folder on GitHub

Technical record

Technical record · No. 062

Income and rooftop solar

At a glance

Residential solar systems by municipal income third (systems)
  • low income 6.9%
  • mid income 17.4%
  • high income 75.7%
Residential solar systems per 100 homes

4.1 systems

664,205 systems and 16.2 million homes

Rank correlation between income and uptake

-0 Spearman’s ρ

Layers

  • municipios polygon 645 municipalities: households, mean income, residential solar systems, kW, systems per 100 homes, W per home, thirds and group
  • regioes_intermediarias polygon 11 intermediate geographic regions
  • limite_estadual polygon State boundary

Metadata

Extent
São Paulo State (SP)
CRS / Projection
SIRGAS 2000 (EPSG:4674)
EPSG:4674
Software
Node.js · d3-geo · QGIS
Method
ANEEL residential distributed photovoltaic systems per 100 occupied permanent private homes of the 2022 Census, and mean income of household heads with income, each in thirds of the 645 municipalities, crossed in a nine-class bivariate map; Spearman rank correlation.
Version
v1.0.0
Licence
CC BY 4.0

Downloads

Figure to reuse

The map without a frame, with legend, scale, reference system and credit written on it: ready for papers, lectures and slides. In two versions: with the basemap (neighbours and sea) or only the mapped area, on white.

Point a camera at it to open this page.

How to cite

Cerejo, L. N. (2026). Renda e telhado solar: o sol dos telhados não segue o dinheiro [Income and rooftop solar: Rooftop sun does not follow the money] (Version 1.0.0) [Data set]. Zenodo. https://doi.org/10.5281/zenodo.23540297

100%