Skip to content
Essencial

No. 060 Census · income Income and rooftop solar 1/3

What the head of household earns

The minimum wage is the yardstick for a third of the state

Record, downloads and citation
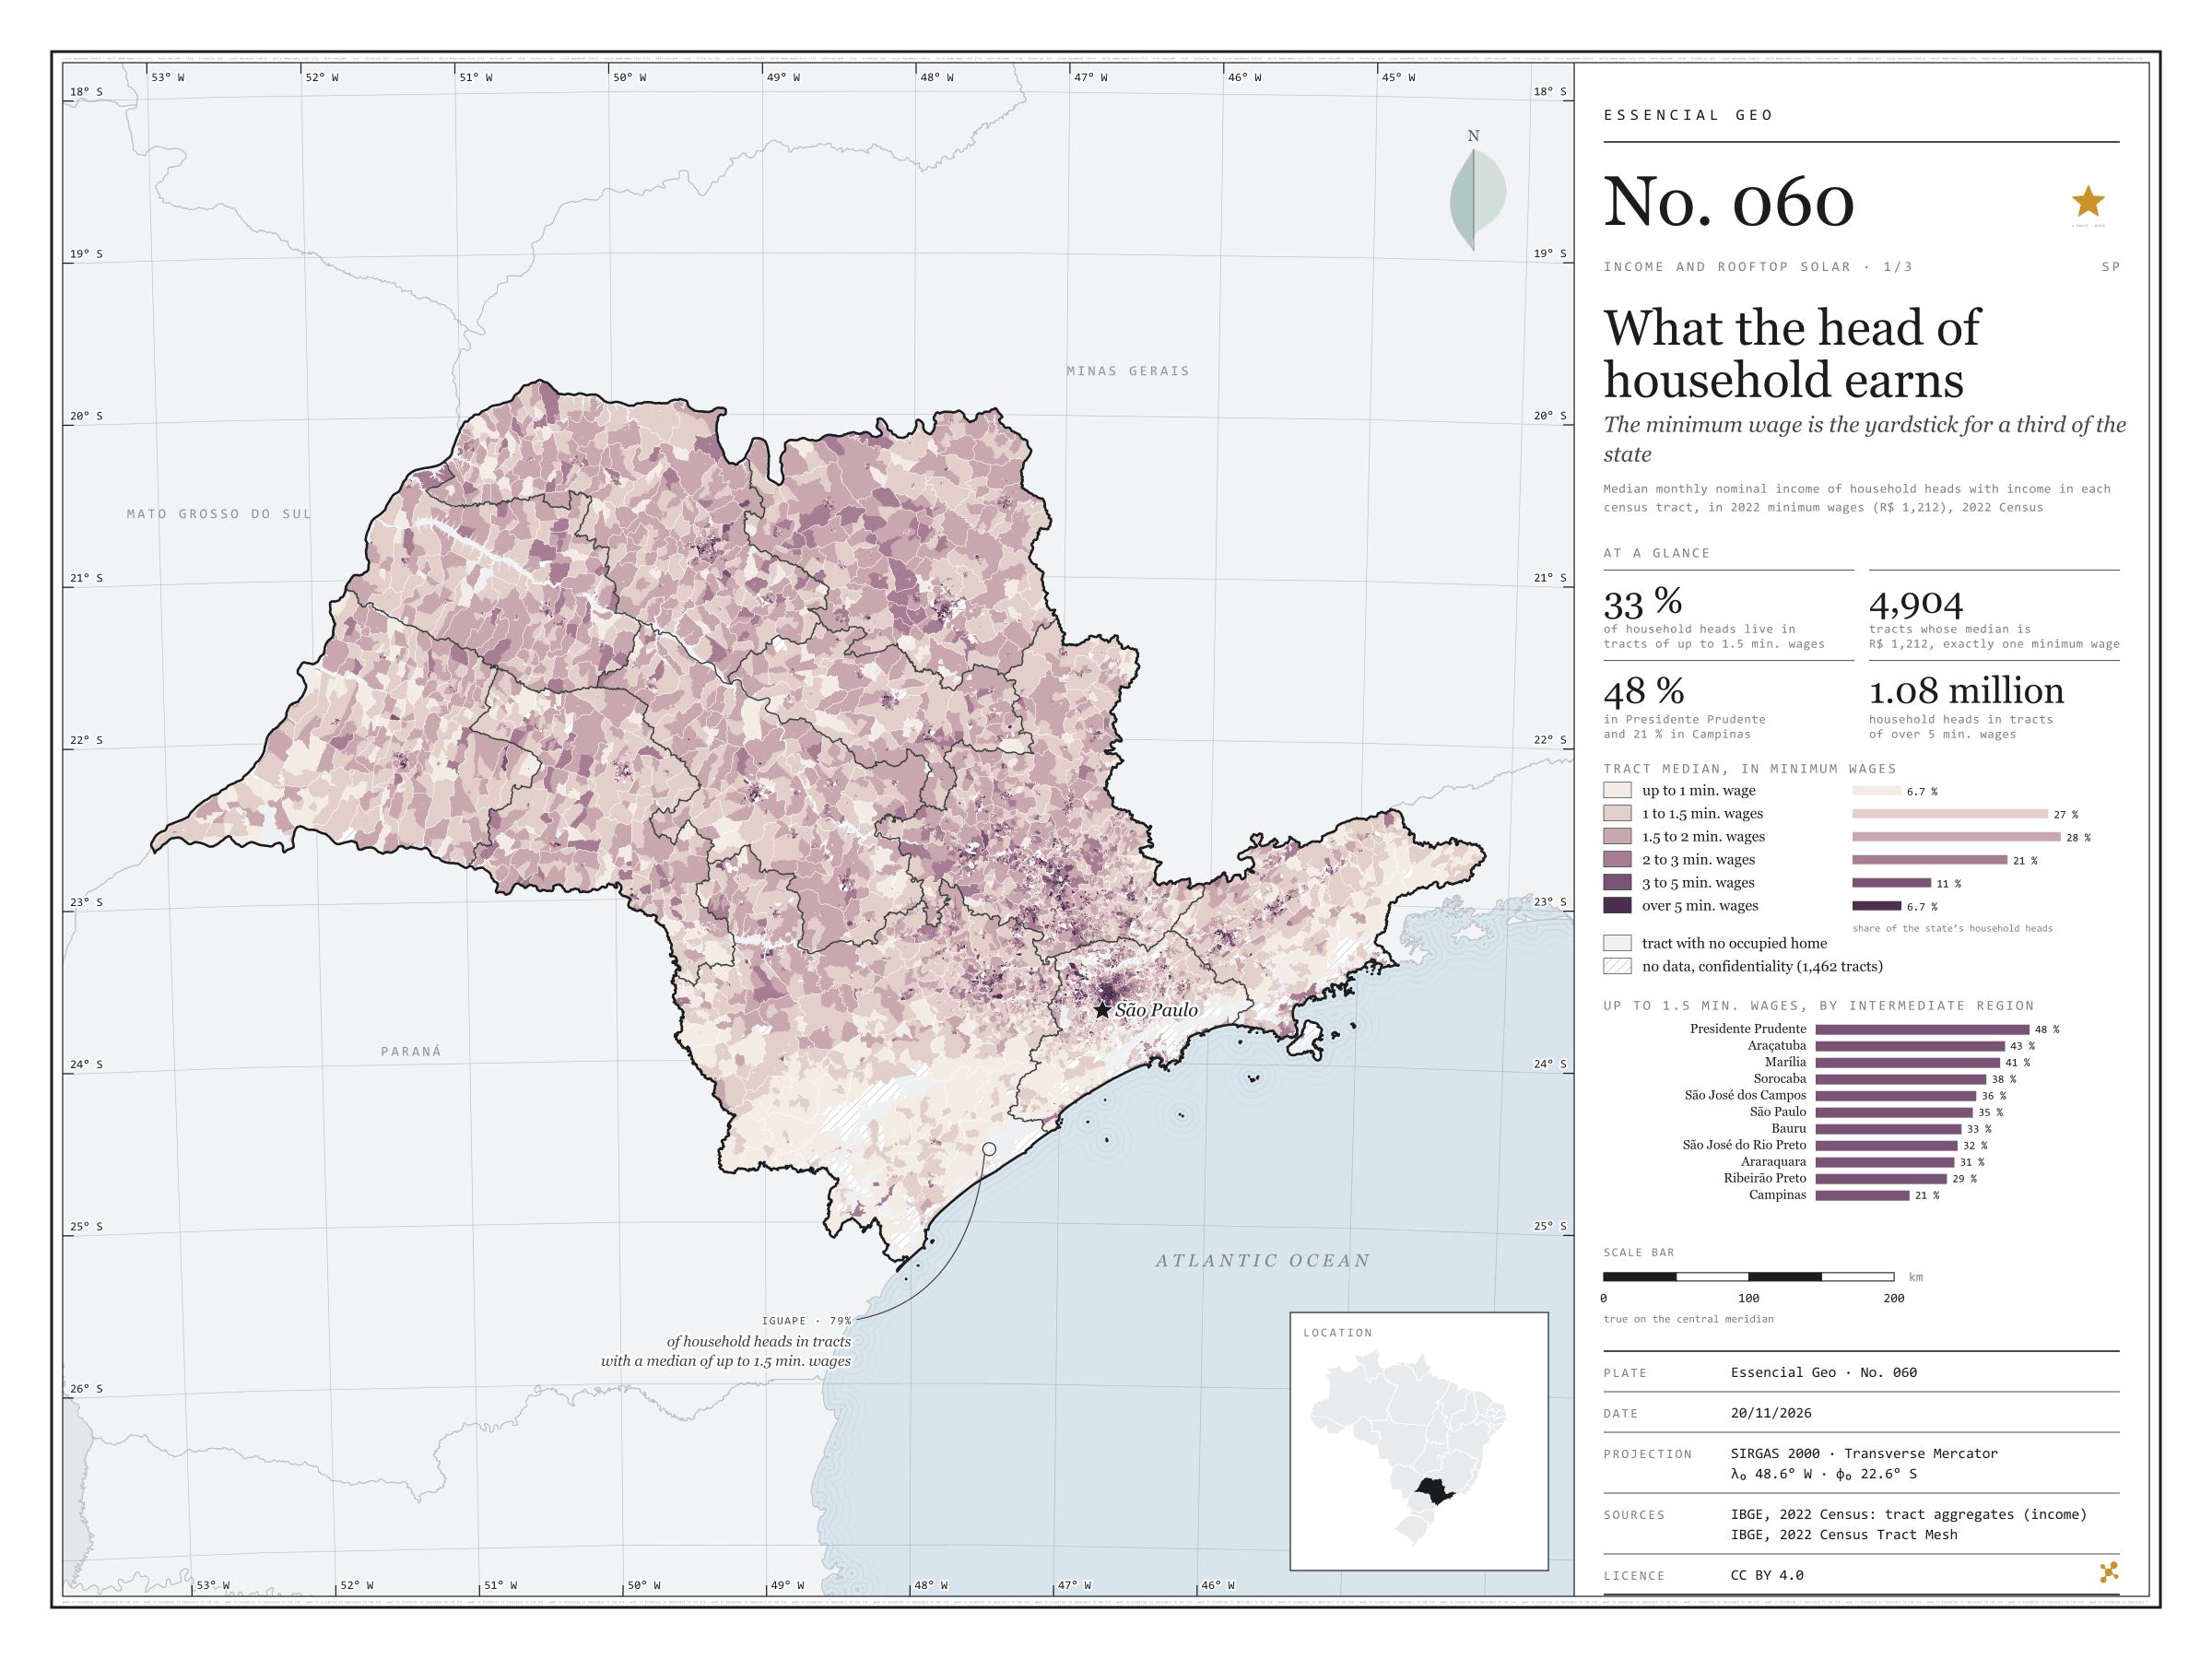
Fig. 060 São Paulo State (SP) EPSG:4674 Source: IBGE

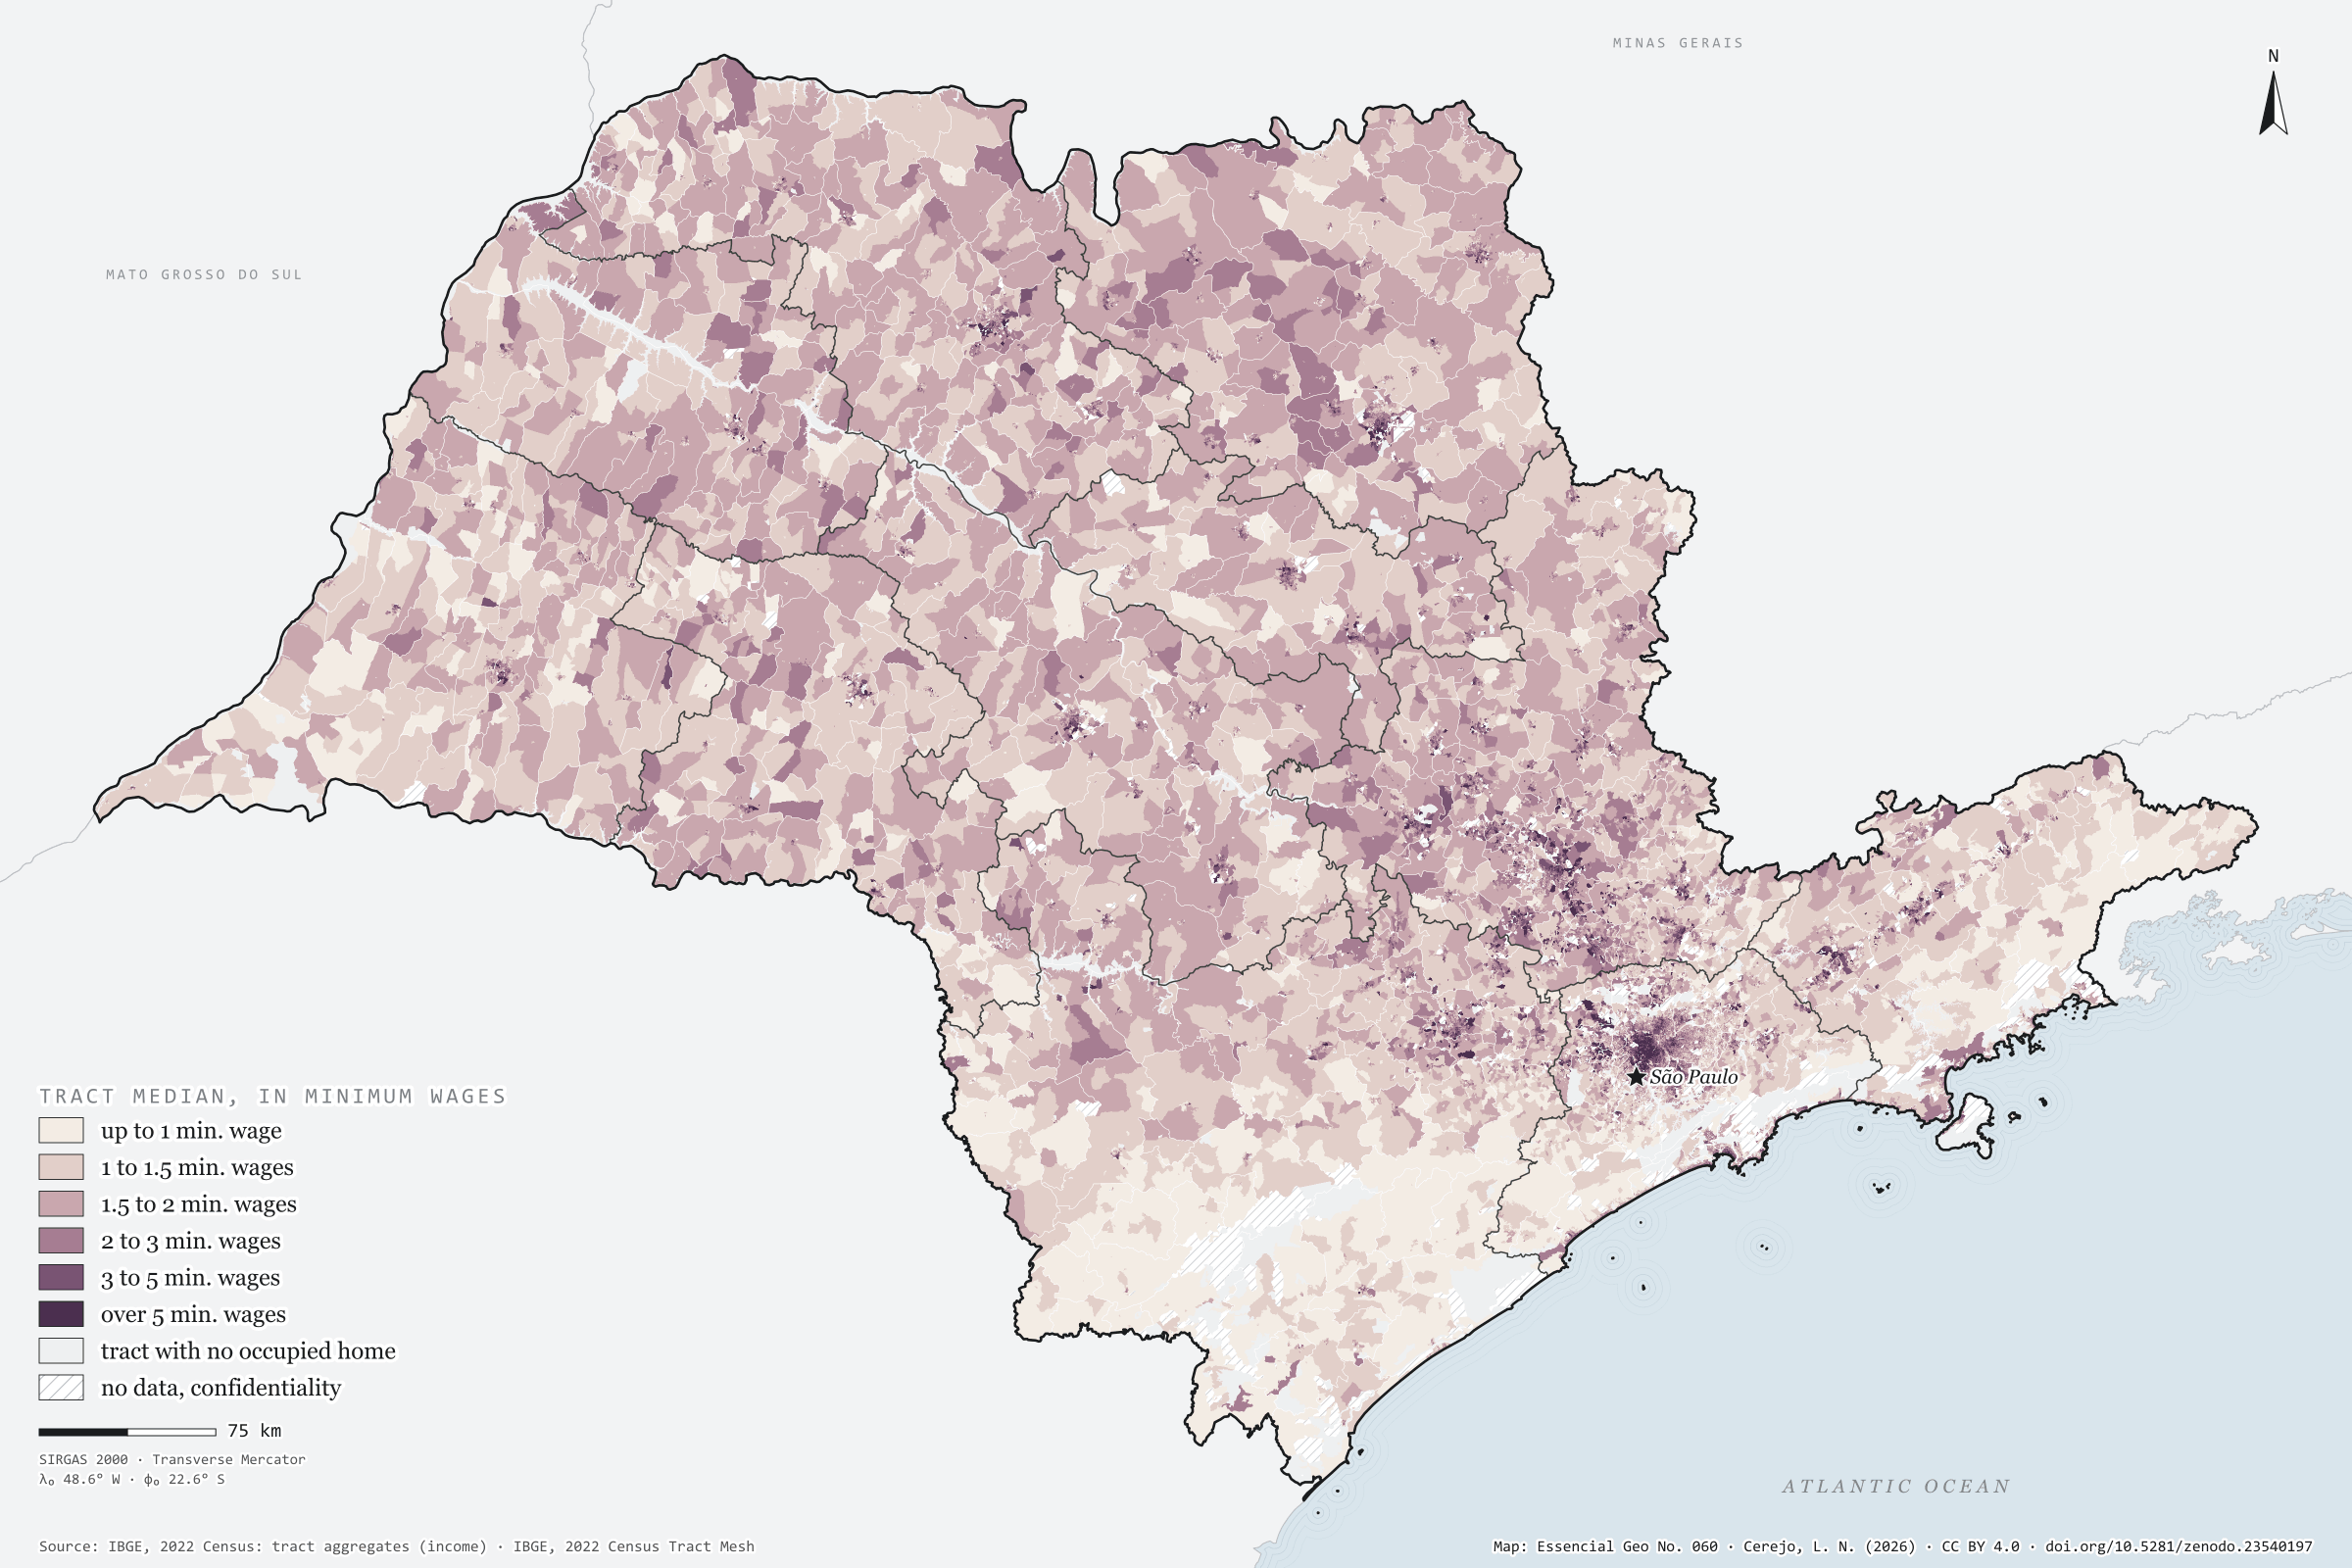
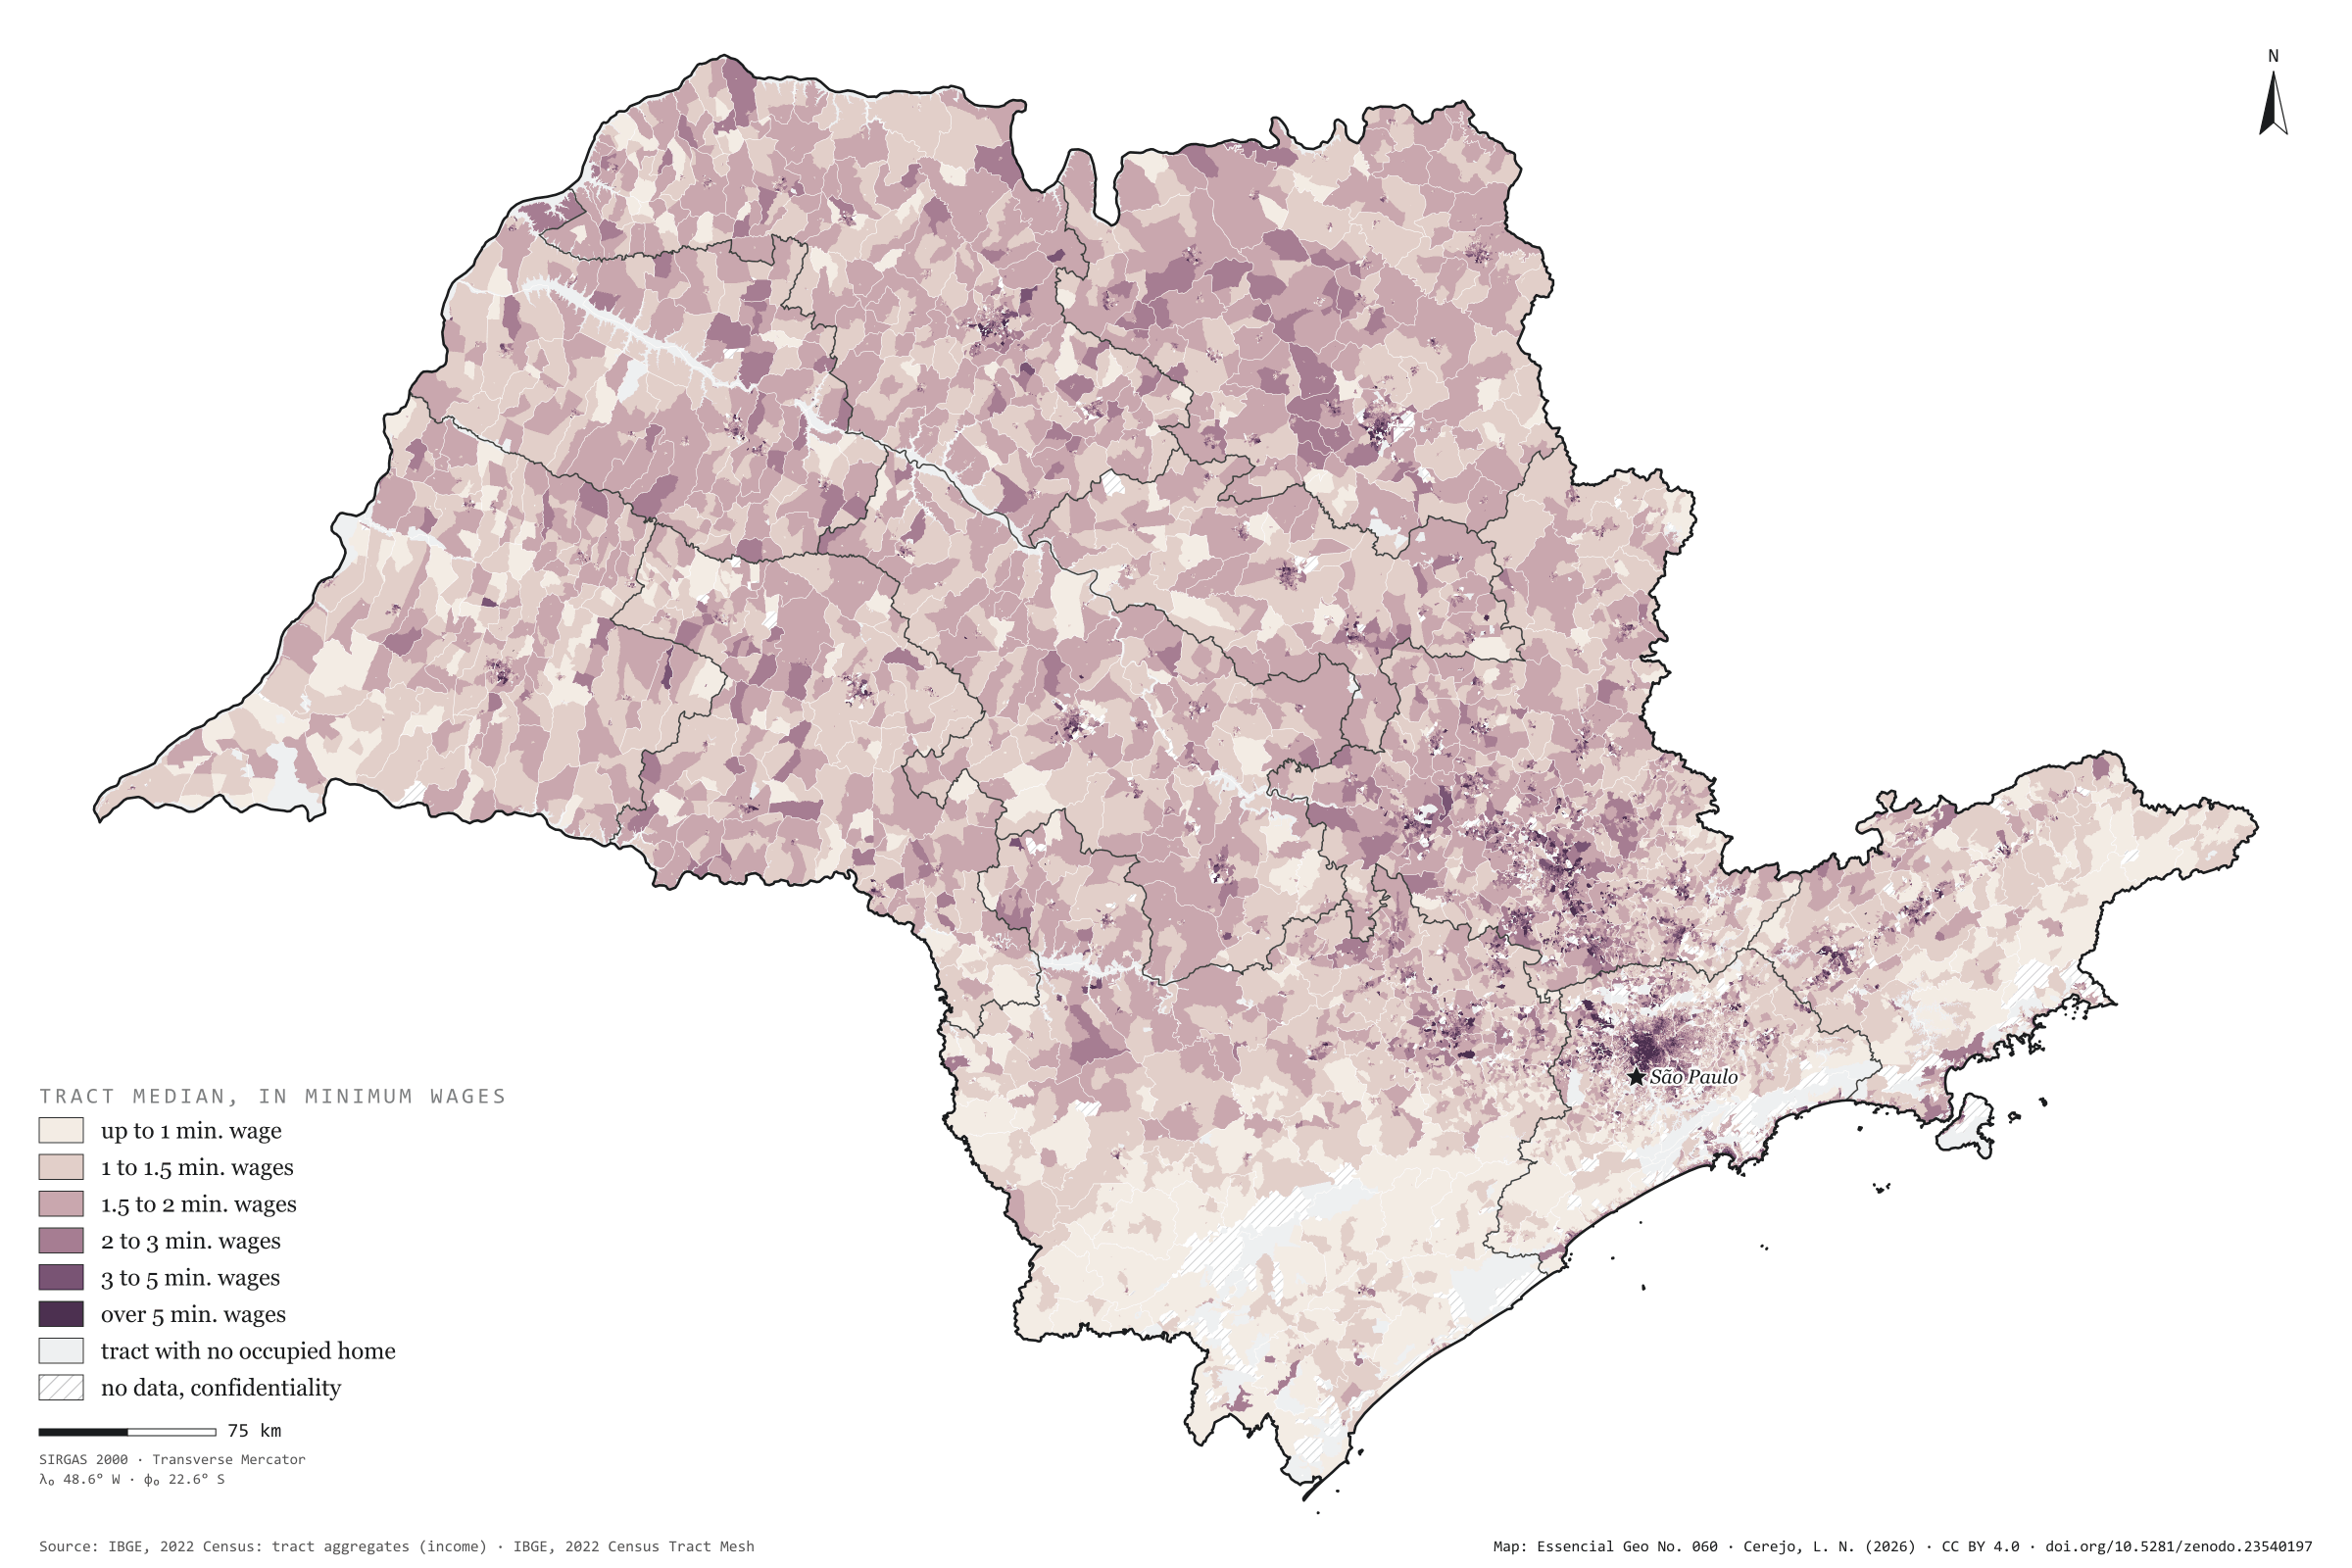
In each census tract of São Paulo, what does the person responsible for the household earn? The 2022 Census gives the median income of household heads with income, and the minimum wage of the time, R$ 1,212, works as a yardstick: in 4,904 tracts the median is exactly one minimum wage. A third of the state’s 16.2 million household heads live in tracts with a median of up to 1.5 minimum wages. The map pales in the Ribeira Valley and the west; in the Presidente Prudente region, 48% of household heads live in such tracts; in the Campinas region, 21%. In Iguape it is 79%; in Francisco Morato, in Greater São Paulo, 78%. At the other end, 1.08 million household heads live in tracts of over 5 minimum wages; the largest shares are in São Caetano do Sul (23%), Santana de Parnaíba and Vinhedo. Plate 034 zooms in on the Campinas region. First plate of the collection “Income and rooftop solar”.

Technical record · downloads · citation

At a glance

Household heads by tract median (household heads)
  • up to 1 min. wage 6.7%
  • 1 to 1.5 min. wages 26.6%
  • 1.5 to 2 min. wages 28.3%
  • 2 to 3 min. wages 21.1%
  • 3 to 5 min. wages 10.7%
  • over 5 min. wages 6.7%
Household heads in tracts of up to 1.5 minimum wages

33 %

5.40 million of 16.2 million

Tracts with a median of exactly one minimum wage

4,904 tracts

Layers

  • setores polygon 103,319 tracts: household heads, mean and median income in reais and in minimum wages, class
  • regioes_intermediarias polygon 11 intermediate geographic regions
  • limite_estadual polygon State boundary

Metadata

Extent
São Paulo State (SP)
CRS / Projection
SIRGAS 2000 (EPSG:4674)
EPSG:4674
Software
Node.js · d3-geo · QGIS
Method
Median monthly nominal income of household heads with income, by 2022 Census tract, in six classes measured in 2022 minimum wages (R$ 1,212); tracts with confidential values are left as no data.
Version
v1.0.0
Licence
CC BY 4.0

Downloads

Figure to reuse

The map without a frame, with legend, scale, reference system and credit written on it: ready for papers, lectures and slides. In two versions: with the basemap (neighbours and sea) or only the mapped area, on white.

Point a camera at it to open this page.

How to cite

Cerejo, L. N. (2026). Quanto ganha quem responde pela casa: o salário mínimo é a régua de um terço do estado [What the head of household earns: The minimum wage is the yardstick for a third of the state] (Version 1.0.0) [Data set]. Zenodo. https://doi.org/10.5281/zenodo.23540197

How to read this plate area, projection, scale, legend and source · 2 terms
1 Area
São Paulo State (SP) The area the plate covers. Outside it, neighbours and sea are drawn in grey, just for orientation.
2 Coordinates and projection
SIRGAS 2000 (EPSG:4674) The layers are in SIRGAS 2000; the drawing’s projection is written in the colophon at the foot of the panel.
3 Scale
Graphic scale bar in the panel The scale bar is true on the central meridian; away from it, measured distances vary a little.
4 Legend and layers
3 layers in the GeoPackage · polygon Read the legend before the map: it tells you whether a colour is a rate or a class, and whether a circle is a total.
5 Sources
IBGE (2022) Every figure comes from a public source, with its year. The data sheet gives each one’s address.

Terms on this plate

Census tract
The smallest collection area of the IBGE Census, a few hundred households each. It is the finest grain at which income, sanitation and housing can be seen without identifying anyone.
2022 Census
IBGE’s door-to-door count. Results by census tract give residents, age, household-head income, water, sewerage and rubbish.

Download

Layers, table and figures, under CC BY 4.0. Cite with the DOI.

Full record and citation

Method notes · No. 060

Median income of household heads by census tract in São Paulo

Português · English

Plate No. 060, the first of three in the collection Income and rooftop solar: the income of whoever answers for the home, tract by tract, then by weighting area in the metropolis and, finally, crossed with solar systems on rooftops. Plate 034 shows the same data, in more detail, for the Campinas Metropolitan Region.

What the files contain

Layer (GPKG)GeometryContent
setorespolygon103,319 tracts: CD_SETOR, CD_MUN, NM_MUN, NM_BAIRRO (neighbourhood), situacao (urban/rural), pessoas (people), responsaveis (household heads), renda_media and renda_mediana (mean and median, R$ a month, of household heads with income), renda_mediana_sm (in minimum wages), classe_sm (1 to 6) and sem_domicilio (no occupied home)
regioes_intermediarias, limite_estadualpolygonreference

The GPKG is zipped in the assets of the renda-solar-sp-2026 release, with the plate’s QGIS style (renda_mediana_sm). Income fields are empty in confidential tracts.

Method

  1. 2022 Census tract aggregates on household head income: household heads and the mean and median monthly nominal income of those with income, in occupied permanent private households.
  2. Six classes of the median, in 2022 minimum wages (R$ 1,212), closed on the right: up to 1 (including the minimum wage itself), 1 to 1.5, 1.5 to 2, 2 to 3, 3 to 5 and over 5.
  3. Each class’s share adds up the household heads of its tracts. Intermediate regions add up the household heads of tracts of up to 1.5 minimum wages.
  4. On the plate, tracts become a grid of about 200 m so the whole state can be drawn; the GPKG has the polygons.

Limitations

  • IBGE withholds (“X”) the income of small tracts for confidentiality: 1,462 tracts, with 73,517 people, are hatched as no data, never as zero income. Another 2,634 tracts have no occupied home.
  • The median is that of household heads with income: those with no income at all are left out, so the median of the poorest tracts comes out higher than it would counting everyone.
  • Income is nominal and self-reported, and the household head’s income is not the whole household’s.
  • A tract median hides the mix within it.

View this map’s folder on GitHub

Technical record

Technical record · No. 060

What the head of household earns

At a glance

Household heads by tract median (household heads)
  • up to 1 min. wage 6.7%
  • 1 to 1.5 min. wages 26.6%
  • 1.5 to 2 min. wages 28.3%
  • 2 to 3 min. wages 21.1%
  • 3 to 5 min. wages 10.7%
  • over 5 min. wages 6.7%
Household heads in tracts of up to 1.5 minimum wages

33 %

5.40 million of 16.2 million

Tracts with a median of exactly one minimum wage

4,904 tracts

Layers

  • setores polygon 103,319 tracts: household heads, mean and median income in reais and in minimum wages, class
  • regioes_intermediarias polygon 11 intermediate geographic regions
  • limite_estadual polygon State boundary

Metadata

Extent
São Paulo State (SP)
CRS / Projection
SIRGAS 2000 (EPSG:4674)
EPSG:4674
Software
Node.js · d3-geo · QGIS
Method
Median monthly nominal income of household heads with income, by 2022 Census tract, in six classes measured in 2022 minimum wages (R$ 1,212); tracts with confidential values are left as no data.
Version
v1.0.0
Licence
CC BY 4.0

Downloads

Figure to reuse

The map without a frame, with legend, scale, reference system and credit written on it: ready for papers, lectures and slides. In two versions: with the basemap (neighbours and sea) or only the mapped area, on white.

Point a camera at it to open this page.

How to cite

Cerejo, L. N. (2026). Quanto ganha quem responde pela casa: o salário mínimo é a régua de um terço do estado [What the head of household earns: The minimum wage is the yardstick for a third of the state] (Version 1.0.0) [Data set]. Zenodo. https://doi.org/10.5281/zenodo.23540197

100%