Skip to content
Essencial

No. 061 Census · income Income and rooftop solar 2/3

Income in the metropolis

From Itaim Bibi to Jardim Ângela, eleven times over

Record, downloads and citation
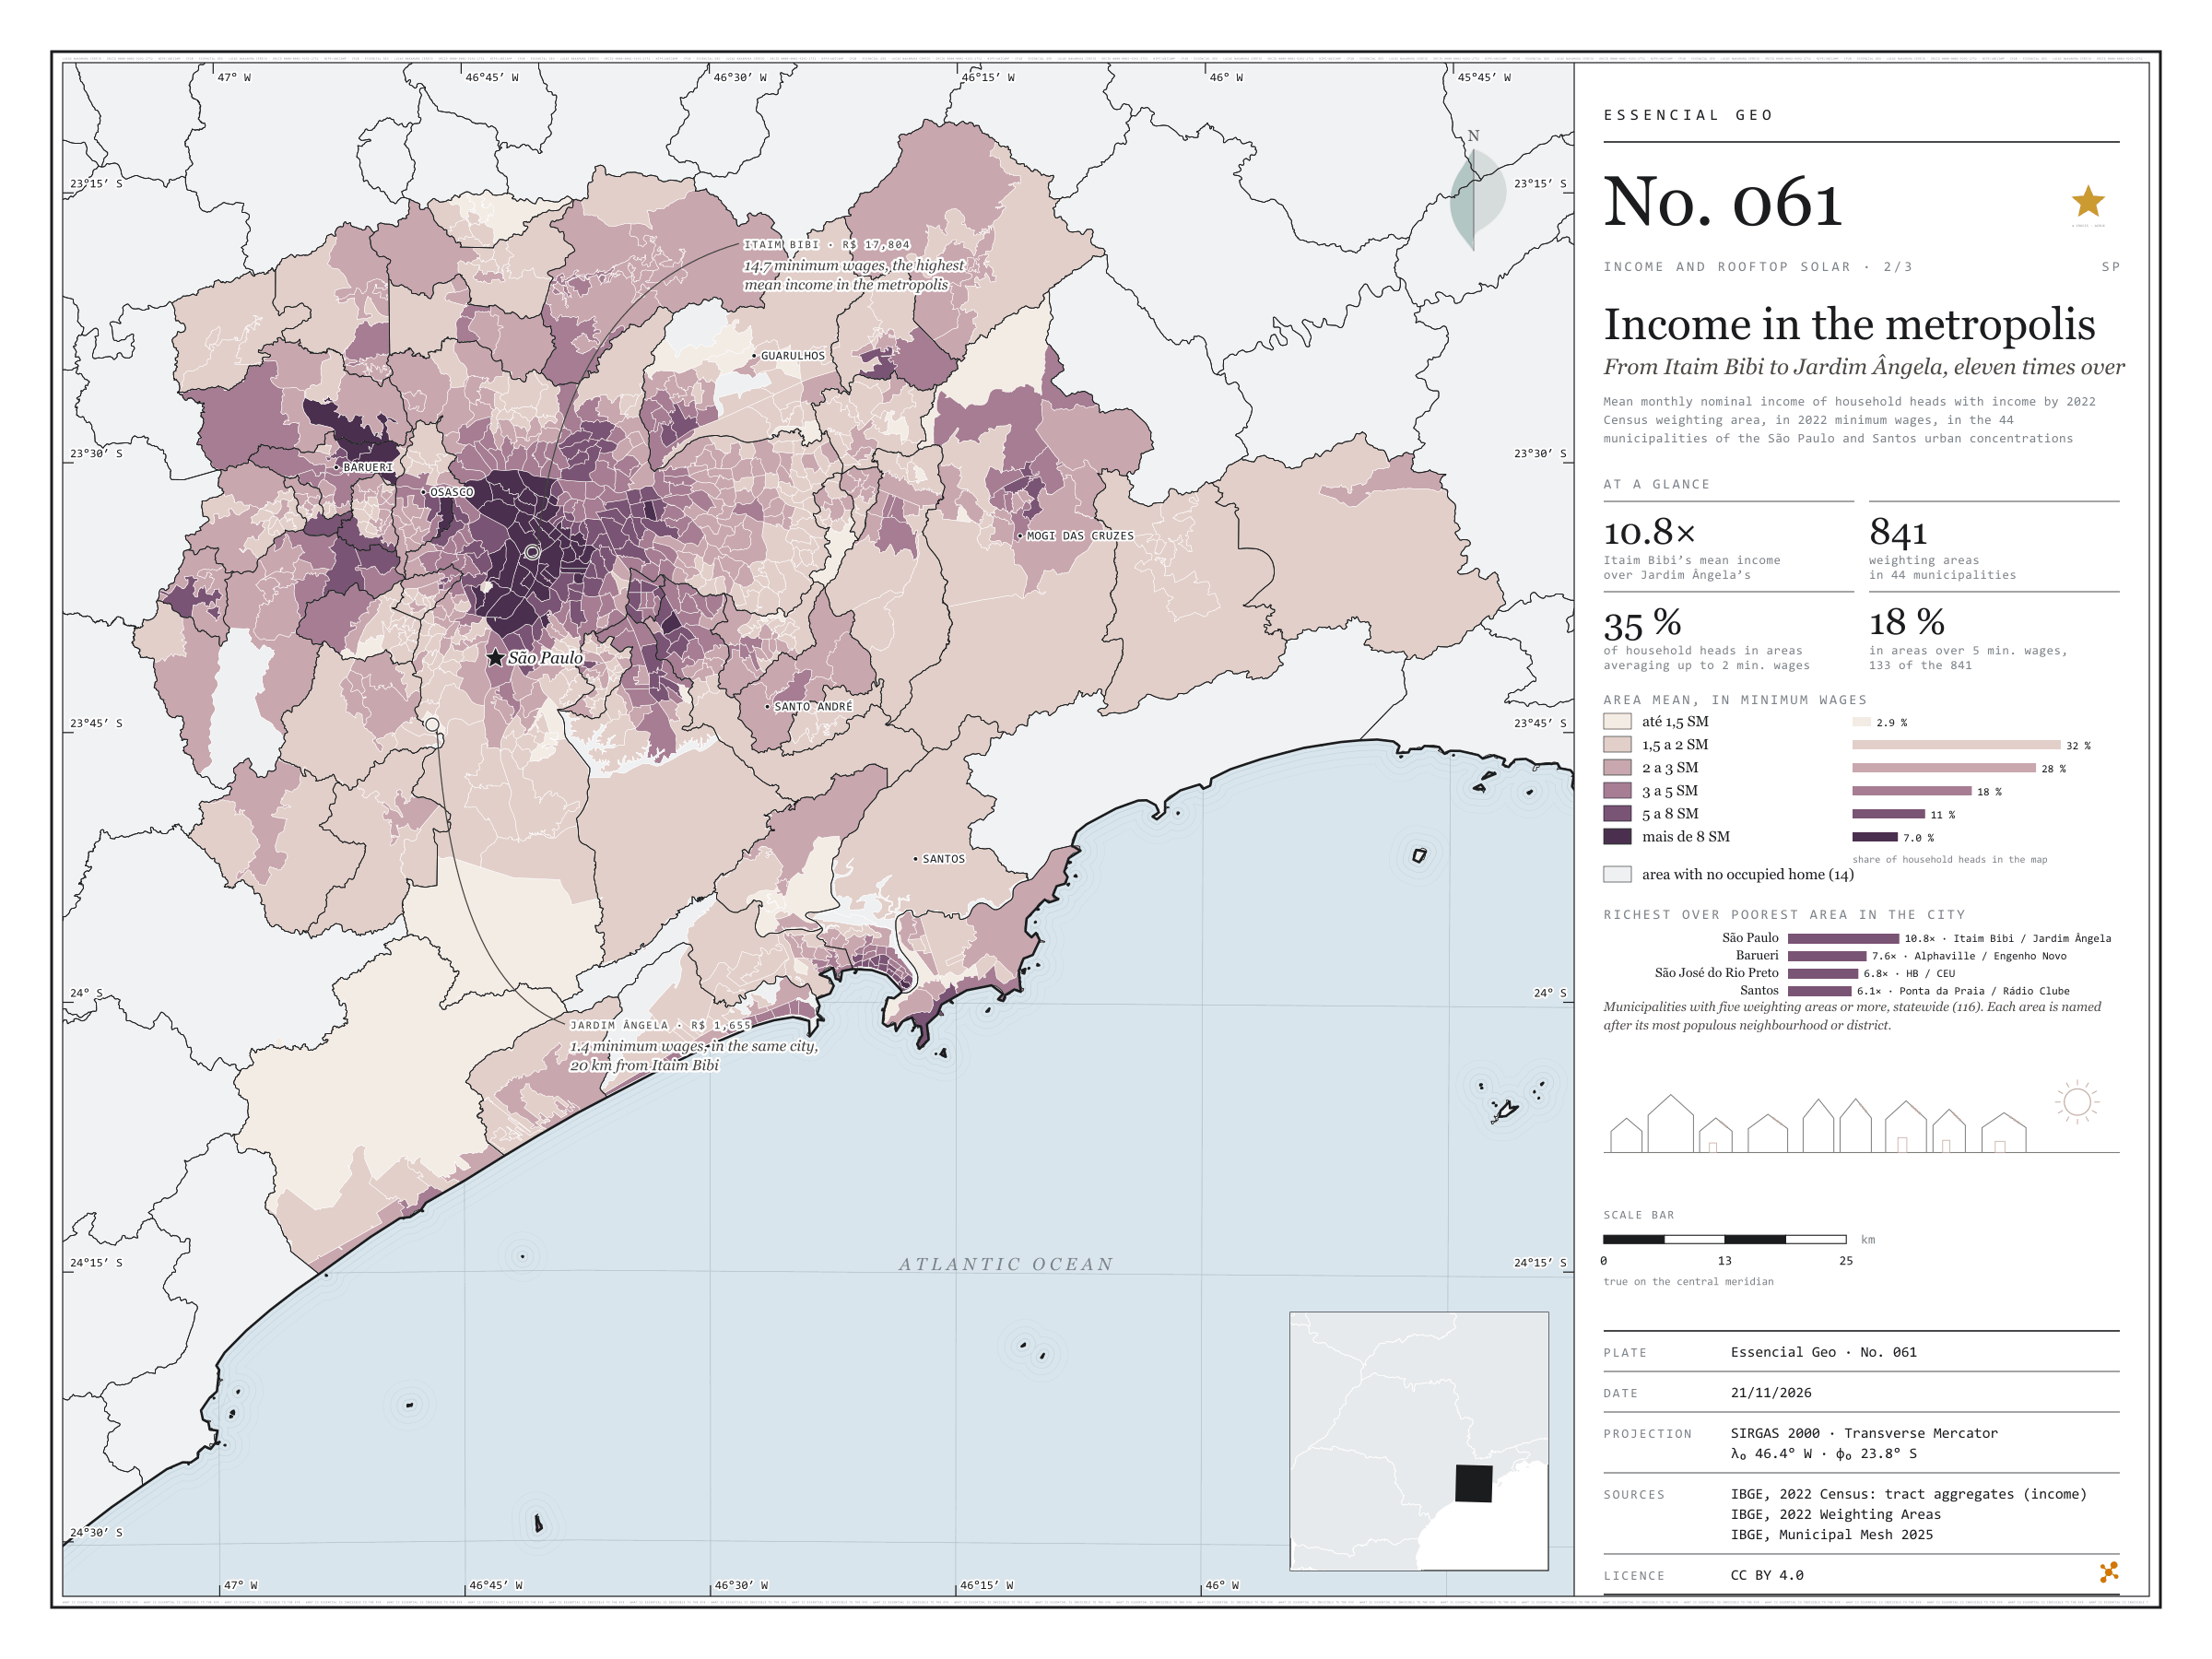
Fig. 061 São Paulo and Santos urban concentrations (SP) EPSG:4674 Source: IBGE

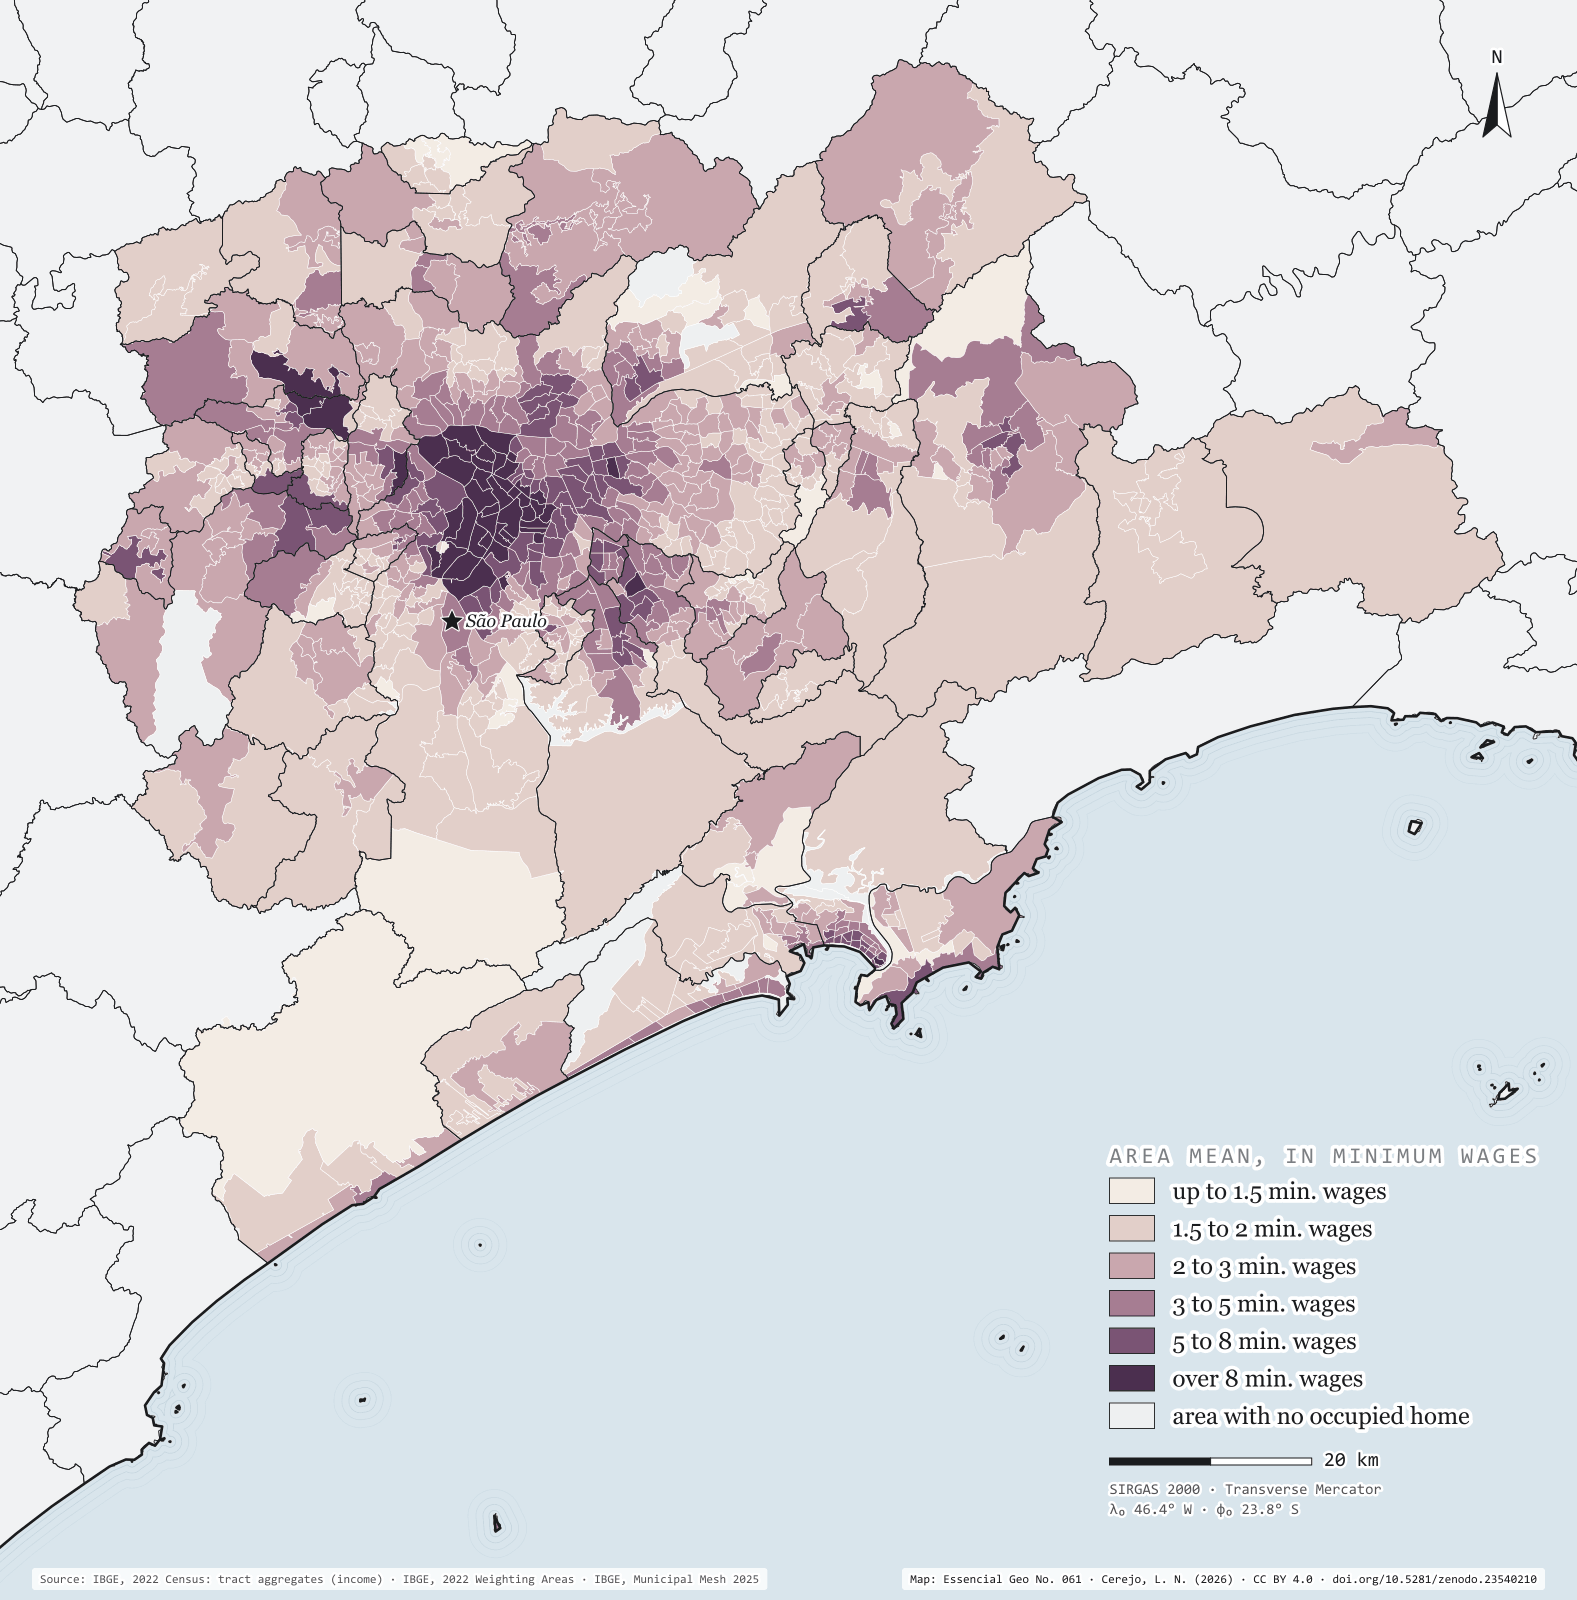
Greater São Paulo and the Santos lowlands add up to 44 municipalities and 22.3 million people. IBGE divides them into 841 inhabited weighting areas, and in each one the mean income of household heads can be worked out. The richest is Itaim Bibi, in the capital: R$ 17,804 a month, 14.7 minimum wages of 2022. Twenty kilometres away, in the same city, the Jardim Ângela area has R$ 1,655, 1.4 minimum wages: a gap of 10.8 times, the largest among São Paulo municipalities with five areas or more. Barueri comes next, from Alphaville to Engenho Novo (7.6 times), and Santos, from Ponta da Praia to Rádio Clube (6.1). The map shows the capital’s rich centre, stretching south-west to Alphaville, ringed by a pale belt that runs from Francisco Morato to Itaquaquecetuba and down the escarpment to the coast. Second plate of the collection “Income and rooftop solar”.

Technical record · downloads · citation

At a glance

Household heads by the weighting area’s mean income (household heads)
  • up to 1.5 min. wages 2.9%
  • 1.5 to 2 min. wages 32.2%
  • 2 to 3 min. wages 28.3%
  • 3 to 5 min. wages 18.4%
  • 5 to 8 min. wages 11.2%
  • over 8 min. wages 7%
Itaim Bibi over Jardim Ângela, mean income

11 times

R$ 17,804 and R$ 1,655 a month

Layers

  • areas_de_ponderacao polygon 2,535 weighting areas statewide: main neighbourhood or district, people, household heads, mean income in reais and in minimum wages
  • regioes_intermediarias polygon 11 intermediate geographic regions
  • limite_estadual polygon State boundary

Metadata

Extent
São Paulo and Santos urban concentrations (SP)
CRS / Projection
SIRGAS 2000 (EPSG:4674)
EPSG:4674
Software
Node.js · d3-geo · QGIS
Method
Mean income of household heads with income by 2022 Census weighting area: mean of tracts with data, weighted by the number of household heads, in 2022 minimum wages (R$ 1,212), in the 44 municipalities of the São Paulo and Santos urban concentrations.
Version
v1.0.0
Licence
CC BY 4.0

Downloads

Figure to reuse

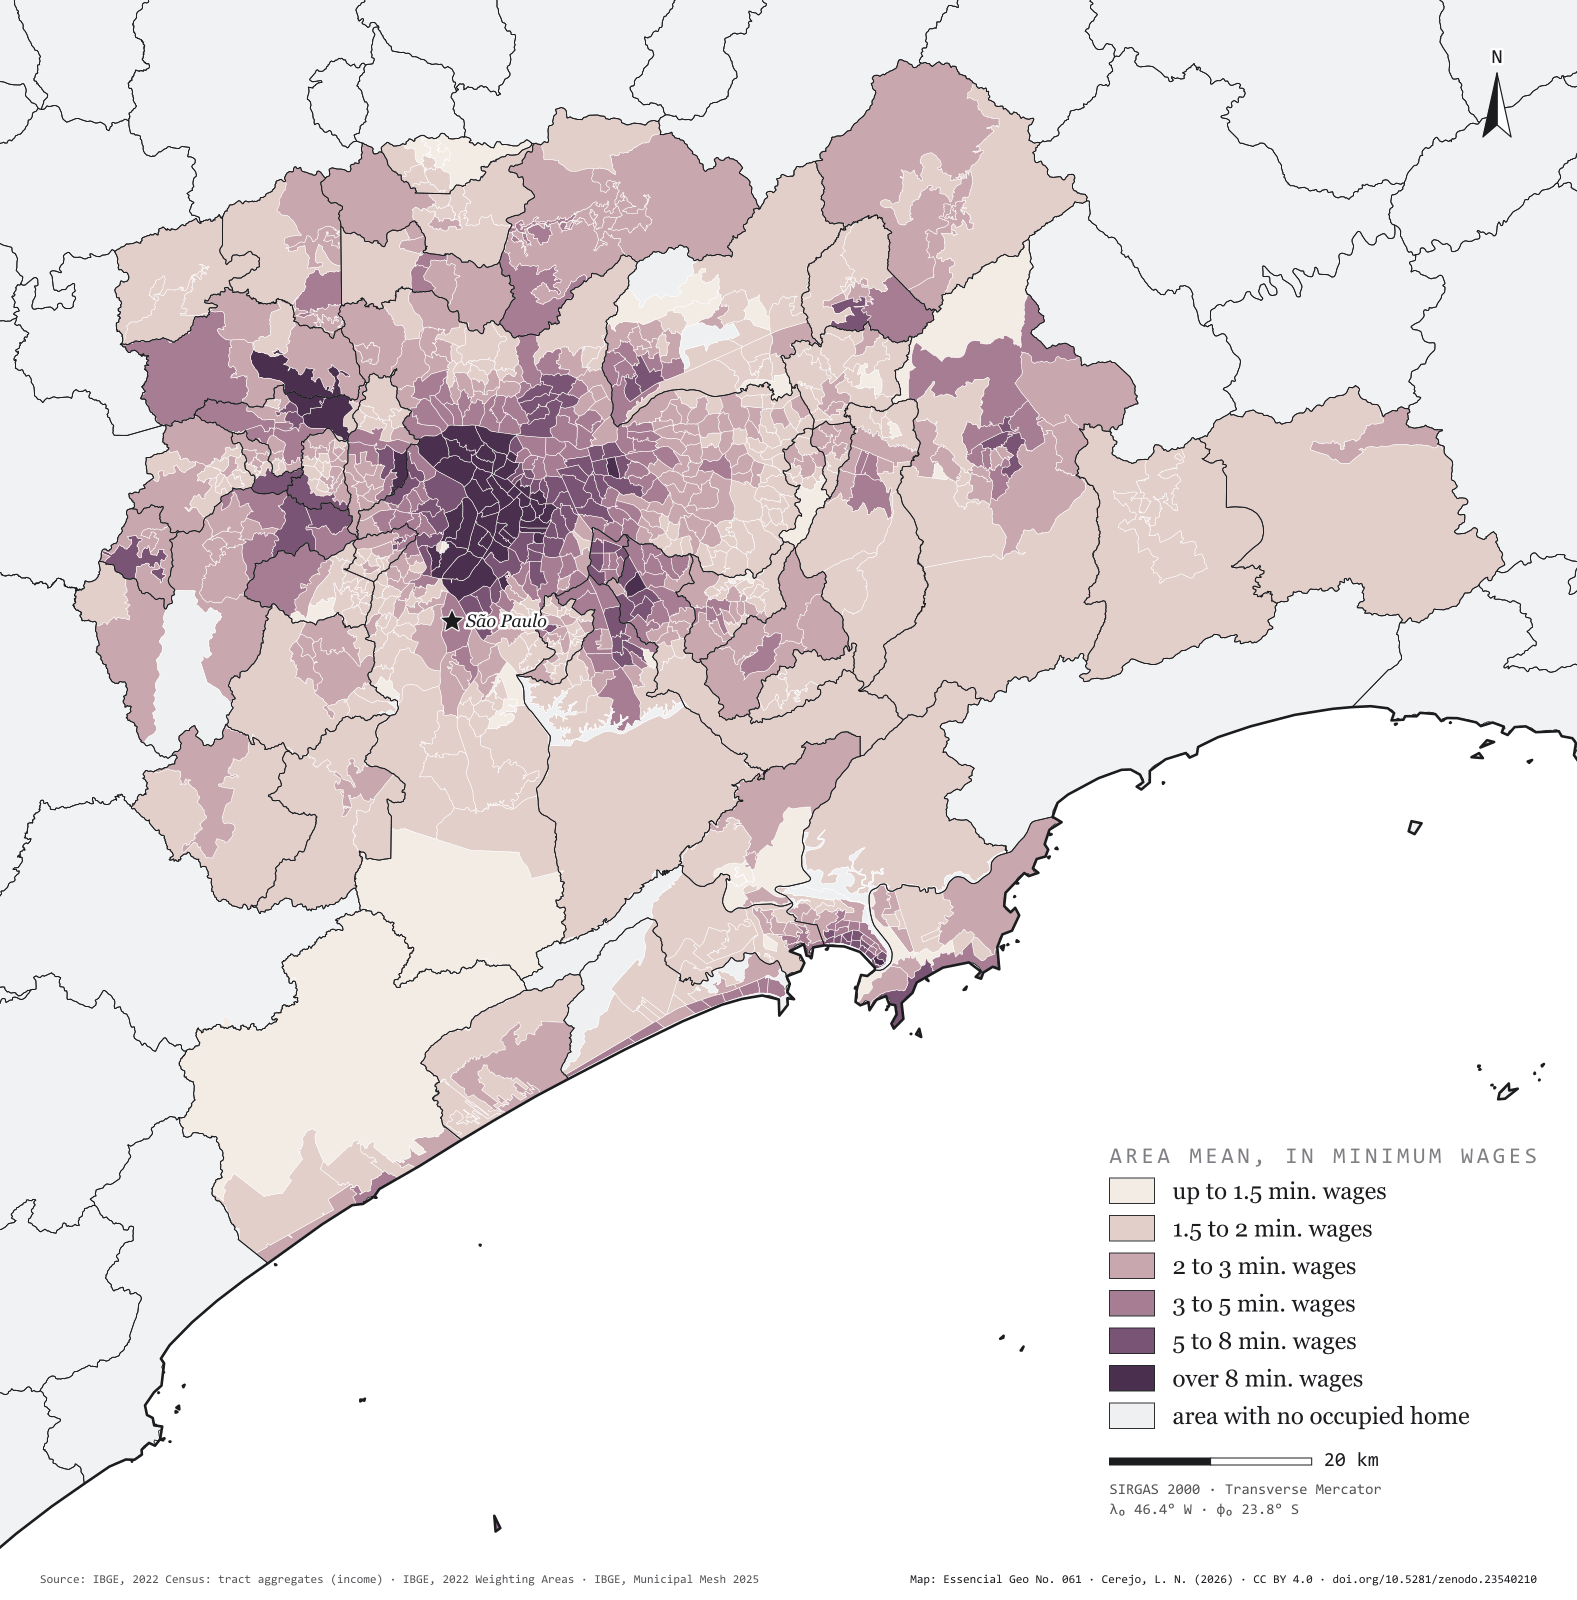
The map without a frame, with legend, scale, reference system and credit written on it: ready for papers, lectures and slides. In two versions: with the basemap (neighbours and sea) or only the mapped area, on white.

Point a camera at it to open this page.

How to cite

Cerejo, L. N. (2026). A renda na metrópole: do Itaim Bibi ao Jardim Ângela, onze vezes [Income in the metropolis: From Itaim Bibi to Jardim Ângela, eleven times over] (Version 1.0.0) [Data set]. Zenodo. https://doi.org/10.5281/zenodo.23540210

How to read this plate area, projection, scale, legend and source · 2 terms
1 Area
São Paulo and Santos urban concentrations (SP) The area the plate covers. Outside it, neighbours and sea are drawn in grey, just for orientation.
2 Coordinates and projection
SIRGAS 2000 (EPSG:4674) The layers are in SIRGAS 2000; the drawing’s projection is written in the colophon at the foot of the panel.
3 Scale
Graphic scale bar in the panel The scale bar is true on the central meridian; away from it, measured distances vary a little.
4 Legend and layers
3 layers in the GeoPackage · polygon Read the legend before the map: it tells you whether a colour is a rate or a class, and whether a circle is a total.
5 Sources
IBGE (2022); IBGE (2025) Every figure comes from a public source, with its year. The data sheet gives each one’s address.

Terms on this plate

Census tract
The smallest collection area of the IBGE Census, a few hundred households each. It is the finest grain at which income, sanitation and housing can be seen without identifying anyone.
2022 Census
IBGE’s door-to-door count. Results by census tract give residents, age, household-head income, water, sewerage and rubbish.

Download

Layers, table and figures, under CC BY 4.0. Cite with the DOI.

Full record and citation

Method notes · No. 061

Income by weighting area in Greater São Paulo and the Santos lowlands

Português · English

Plate No. 061, the second of three in the collection Income and rooftop solar: the income of plate 060 aggregated into weighting areas, close up, in the metropolis. The frame brings together the São Paulo (37 municipalities) and Santos (7) urban concentrations, as defined by IBGE.

What the files contain

Layer (GPKG)GeometryContent
areas_de_ponderacaopolygonthe state’s 2,535 areas: CD_APOND, CD_MUN, NM_MUN, bairro_principal (main neighbourhood or district), area_km2, setores (tracts), setores_sem_info (confidential tracts), pessoas (people), responsaveis (household heads), renda_media (R$), renda_media_sm (minimum wages), classe (1 to 6) and concentracao (1 inside the map’s frame)
regioes_intermediarias, limite_estadualpolygonreference

The GPKG covers the whole state, with the plate’s QGIS style. The CSV has the same table, without geometry.

Method

  1. Each census tract goes to its weighting area through IBGE’s correspondence table.
  2. Mean income of the area: across tracts with data, the household heads’ mean income times the number of household heads, summed and divided by those tracts’ total household heads.
  3. Six classes in 2022 minimum wages (R$ 1,212): up to 1.5, 1.5 to 2, 2 to 3, 3 to 5, 5 to 8 and over 8.
  4. Area name: its most populous neighbourhood or, where there are none, its district (the capital has no neighbourhoods in the Census base).
  5. Each municipality’s ratio: the area with the highest mean income over the lowest, in the state’s 116 municipalities with five areas or more.

Limitations

  • A mean rises with a few very rich people; in an area with luxury condominiums and a favela, it lands between the two and describes neither.
  • Confidential tracts (“X”) are left out of the mean, never counted as zero. The 14 areas in the frame with no occupied home are grey.
  • The weight is the tract’s number of household heads; IBGE does not publish how many of them have an income.
  • The main neighbourhood’s name is only a label: an area usually spans several.

View this map’s folder on GitHub

Technical record

Technical record · No. 061

Income in the metropolis

At a glance

Household heads by the weighting area’s mean income (household heads)
  • up to 1.5 min. wages 2.9%
  • 1.5 to 2 min. wages 32.2%
  • 2 to 3 min. wages 28.3%
  • 3 to 5 min. wages 18.4%
  • 5 to 8 min. wages 11.2%
  • over 8 min. wages 7%
Itaim Bibi over Jardim Ângela, mean income

11 times

R$ 17,804 and R$ 1,655 a month

Layers

  • areas_de_ponderacao polygon 2,535 weighting areas statewide: main neighbourhood or district, people, household heads, mean income in reais and in minimum wages
  • regioes_intermediarias polygon 11 intermediate geographic regions
  • limite_estadual polygon State boundary

Metadata

Extent
São Paulo and Santos urban concentrations (SP)
CRS / Projection
SIRGAS 2000 (EPSG:4674)
EPSG:4674
Software
Node.js · d3-geo · QGIS
Method
Mean income of household heads with income by 2022 Census weighting area: mean of tracts with data, weighted by the number of household heads, in 2022 minimum wages (R$ 1,212), in the 44 municipalities of the São Paulo and Santos urban concentrations.
Version
v1.0.0
Licence
CC BY 4.0

Downloads

Figure to reuse

The map without a frame, with legend, scale, reference system and credit written on it: ready for papers, lectures and slides. In two versions: with the basemap (neighbours and sea) or only the mapped area, on white.

Point a camera at it to open this page.

How to cite

Cerejo, L. N. (2026). A renda na metrópole: do Itaim Bibi ao Jardim Ângela, onze vezes [Income in the metropolis: From Itaim Bibi to Jardim Ângela, eleven times over] (Version 1.0.0) [Data set]. Zenodo. https://doi.org/10.5281/zenodo.23540210

100%