Skip to content
Essencial

No. 074 Land use Milk, eggs, honey and fish 4/5

Tilapia

Almost every farmed fish in the state is tilapia

Record, downloads and citation
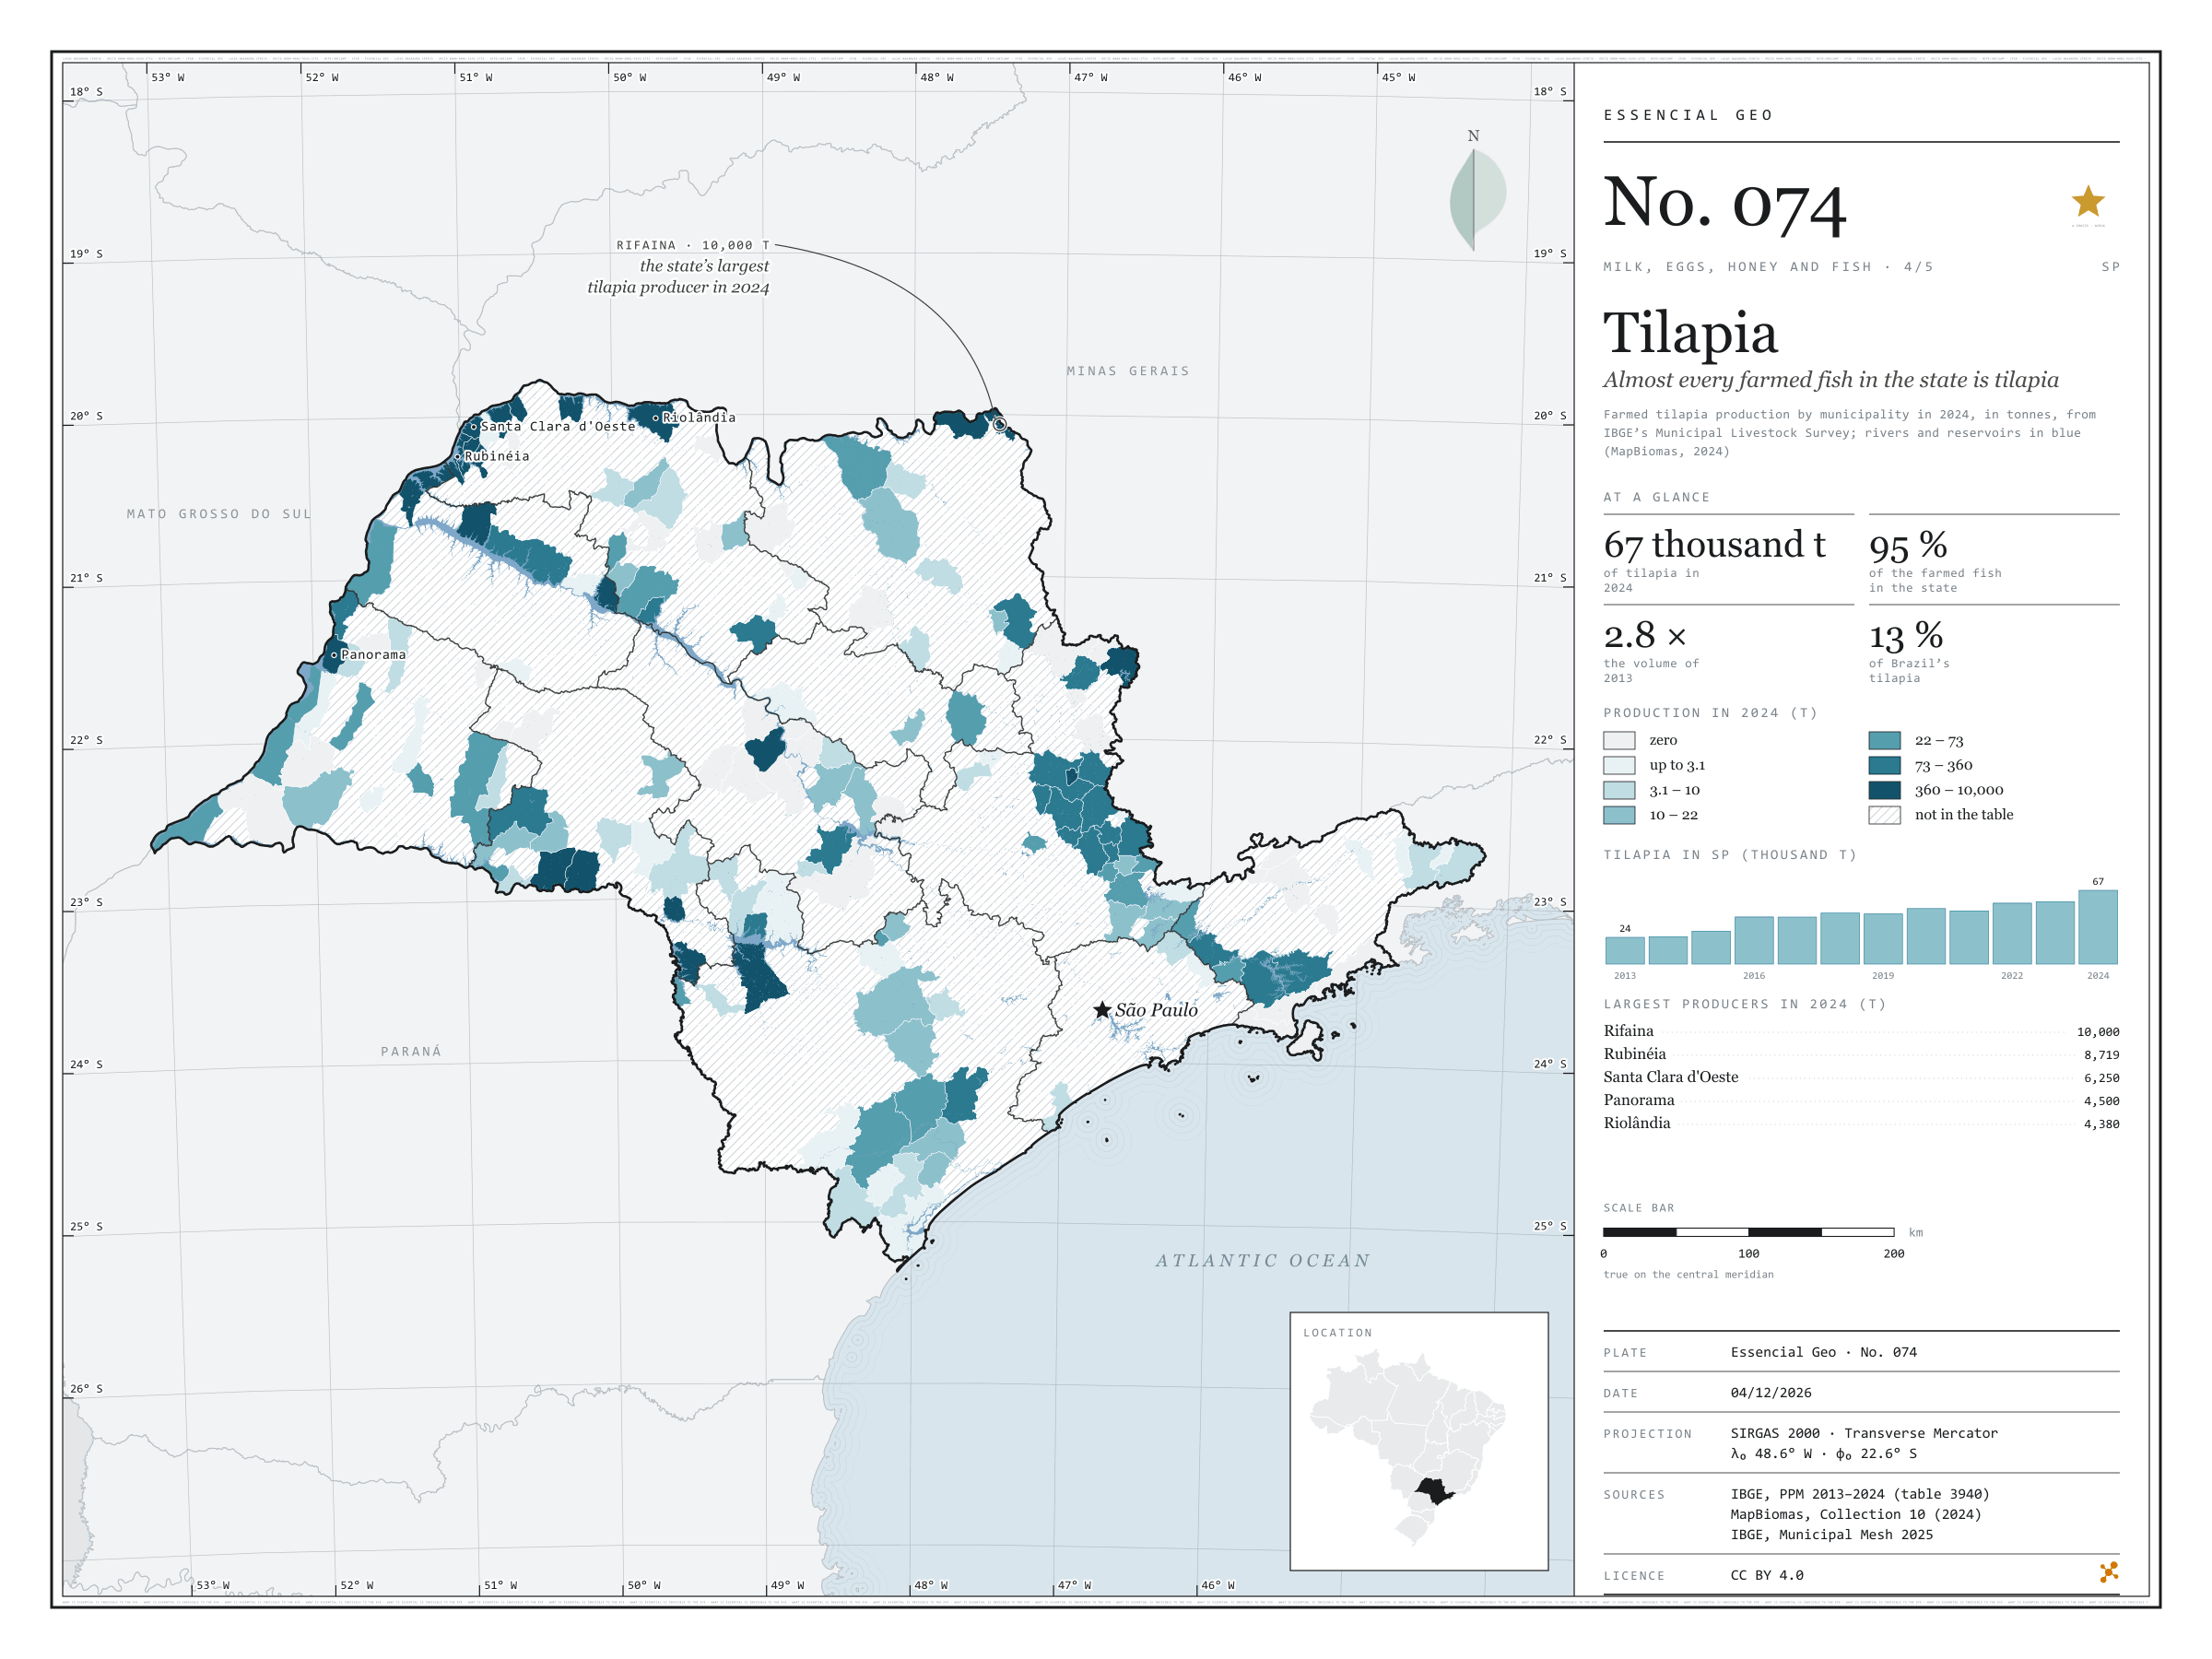
Fig. 074 São Paulo state (SP) EPSG:4674 Source: IBGE, MapBiomas

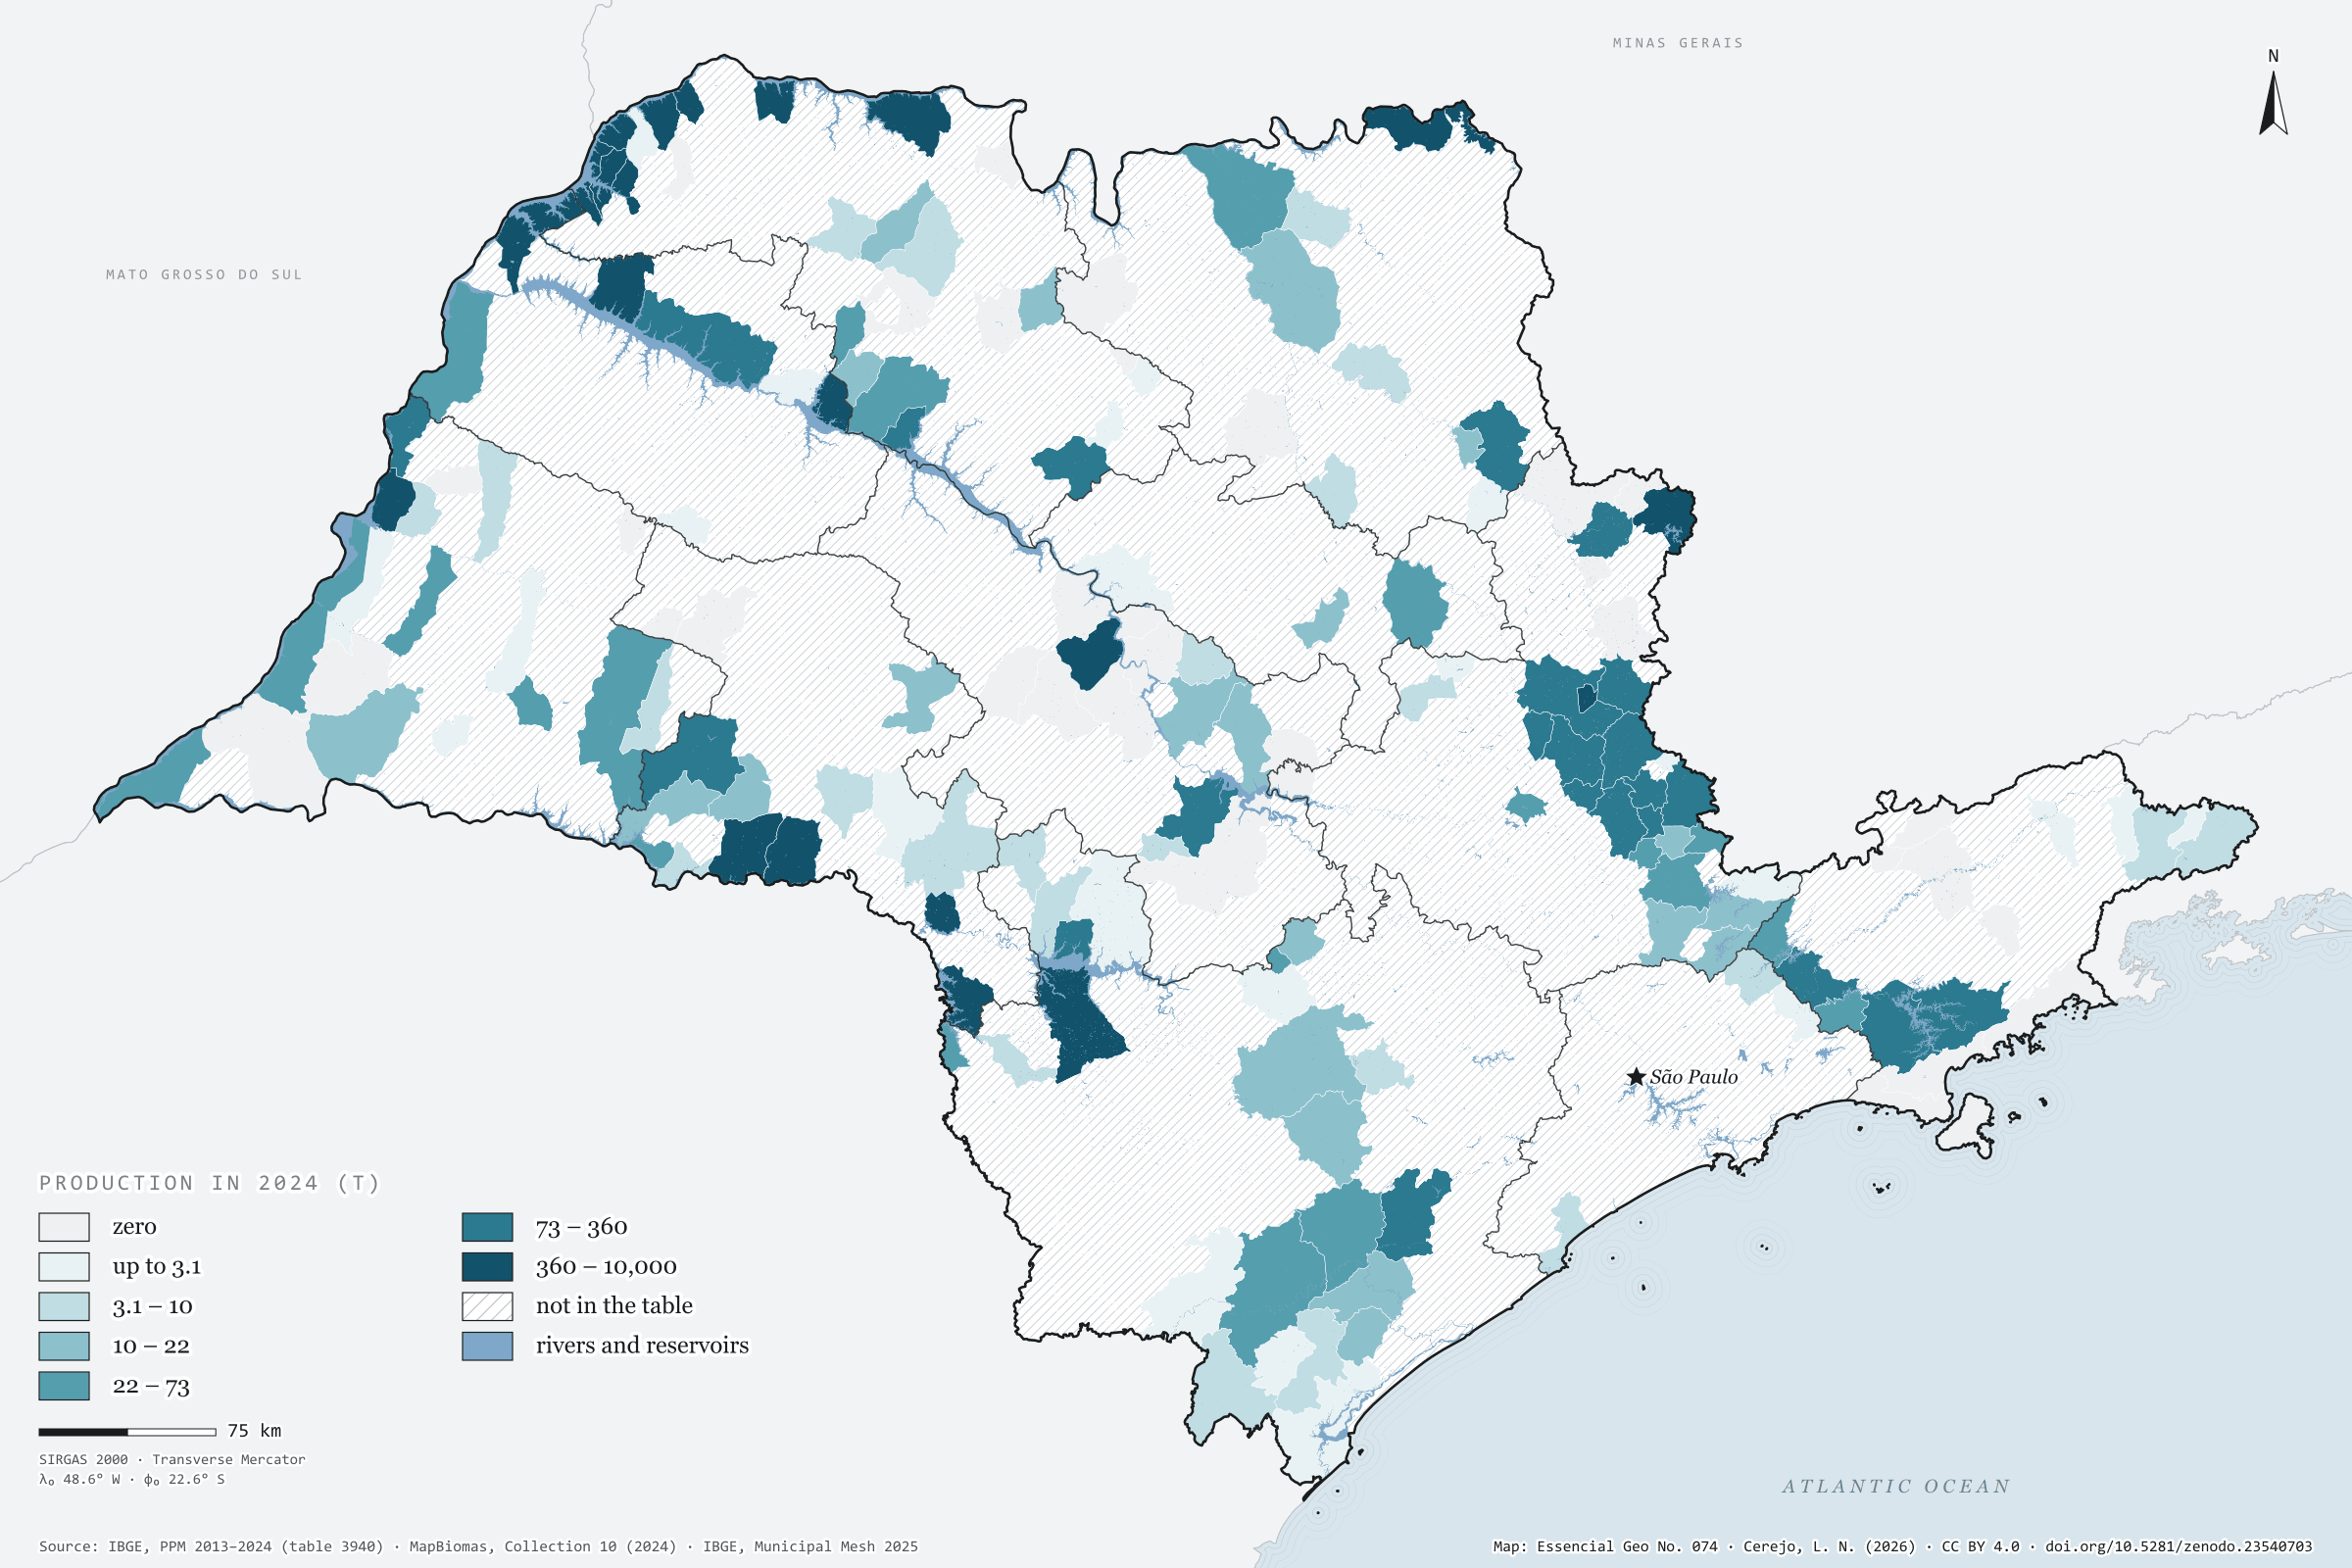
São Paulo farmed 67,000 tonnes of tilapia in 2024, 2.8 times the volume of 2013, the first year of the Municipal Livestock Survey’s aquaculture series. Tilapia is 95% of all fish farmed in the state. Brazil grew even faster, from 169,000 to 499,000 tonnes, and the state’s share stood at 13.4%. Farming is concentrated: 134 municipalities report production, and the ten largest account for 72%. The largest sit on the reservoirs of the Grande and Paraná rivers. Rifaina, on the border with Minas Gerais, leads with 10,000 tonnes, followed by Rubinéia, Santa Clara d'Oeste, Panorama and Riolândia. The São José do Rio Preto region, in the north-west, produces 42% of the total on its own. On the map, MapBiomas water shows the rivers and reservoirs, and hatching marks the 476 municipalities with no reported production. Fourth plate of the collection “Milk, eggs, honey and fish”.

Technical record · downloads · citation

At a glance

Tilapia in 2024

67,058,737 kg

In 2013 it was 24,329,347 kg; the share of Brazil went from 14.4% to 13.4%

Tilapia’s share of farmed fish in SP

95 %

Out of 70,548,417 kg of fish of all species in 2024

Largest producers in 2024 (kg)
  • Rifaina 10,000,000
  • Rubinéia 8,718,900
  • Santa Clara d'Oeste 6,250,000
  • Panorama 4,500,000
  • Riolândia 4,379,950

Layers

  • municipios polygon 645 municipalities: tilapia production in 2013 and 2024 (kg) and data status in 2024
  • regioes_intermediarias polygon 11 intermediate geographic regions
  • limite_estadual polygon State boundary

Metadata

Extent
São Paulo state (SP)
CRS / Projection
SIRGAS 2000 (EPSG:4674)
EPSG:4674
Software
Python · GeoPandas · GDAL · QGIS · Node.js · d3-geo
Method
Tilapia production from PPM 2024 by municipality in six quantile classes; state series from 2013 to 2024; rivers, lakes and reservoirs from the MapBiomas 2024 water classes over the map.
Version
v1.0.0
Licence
CC BY 4.0

Downloads

Figure to reuse

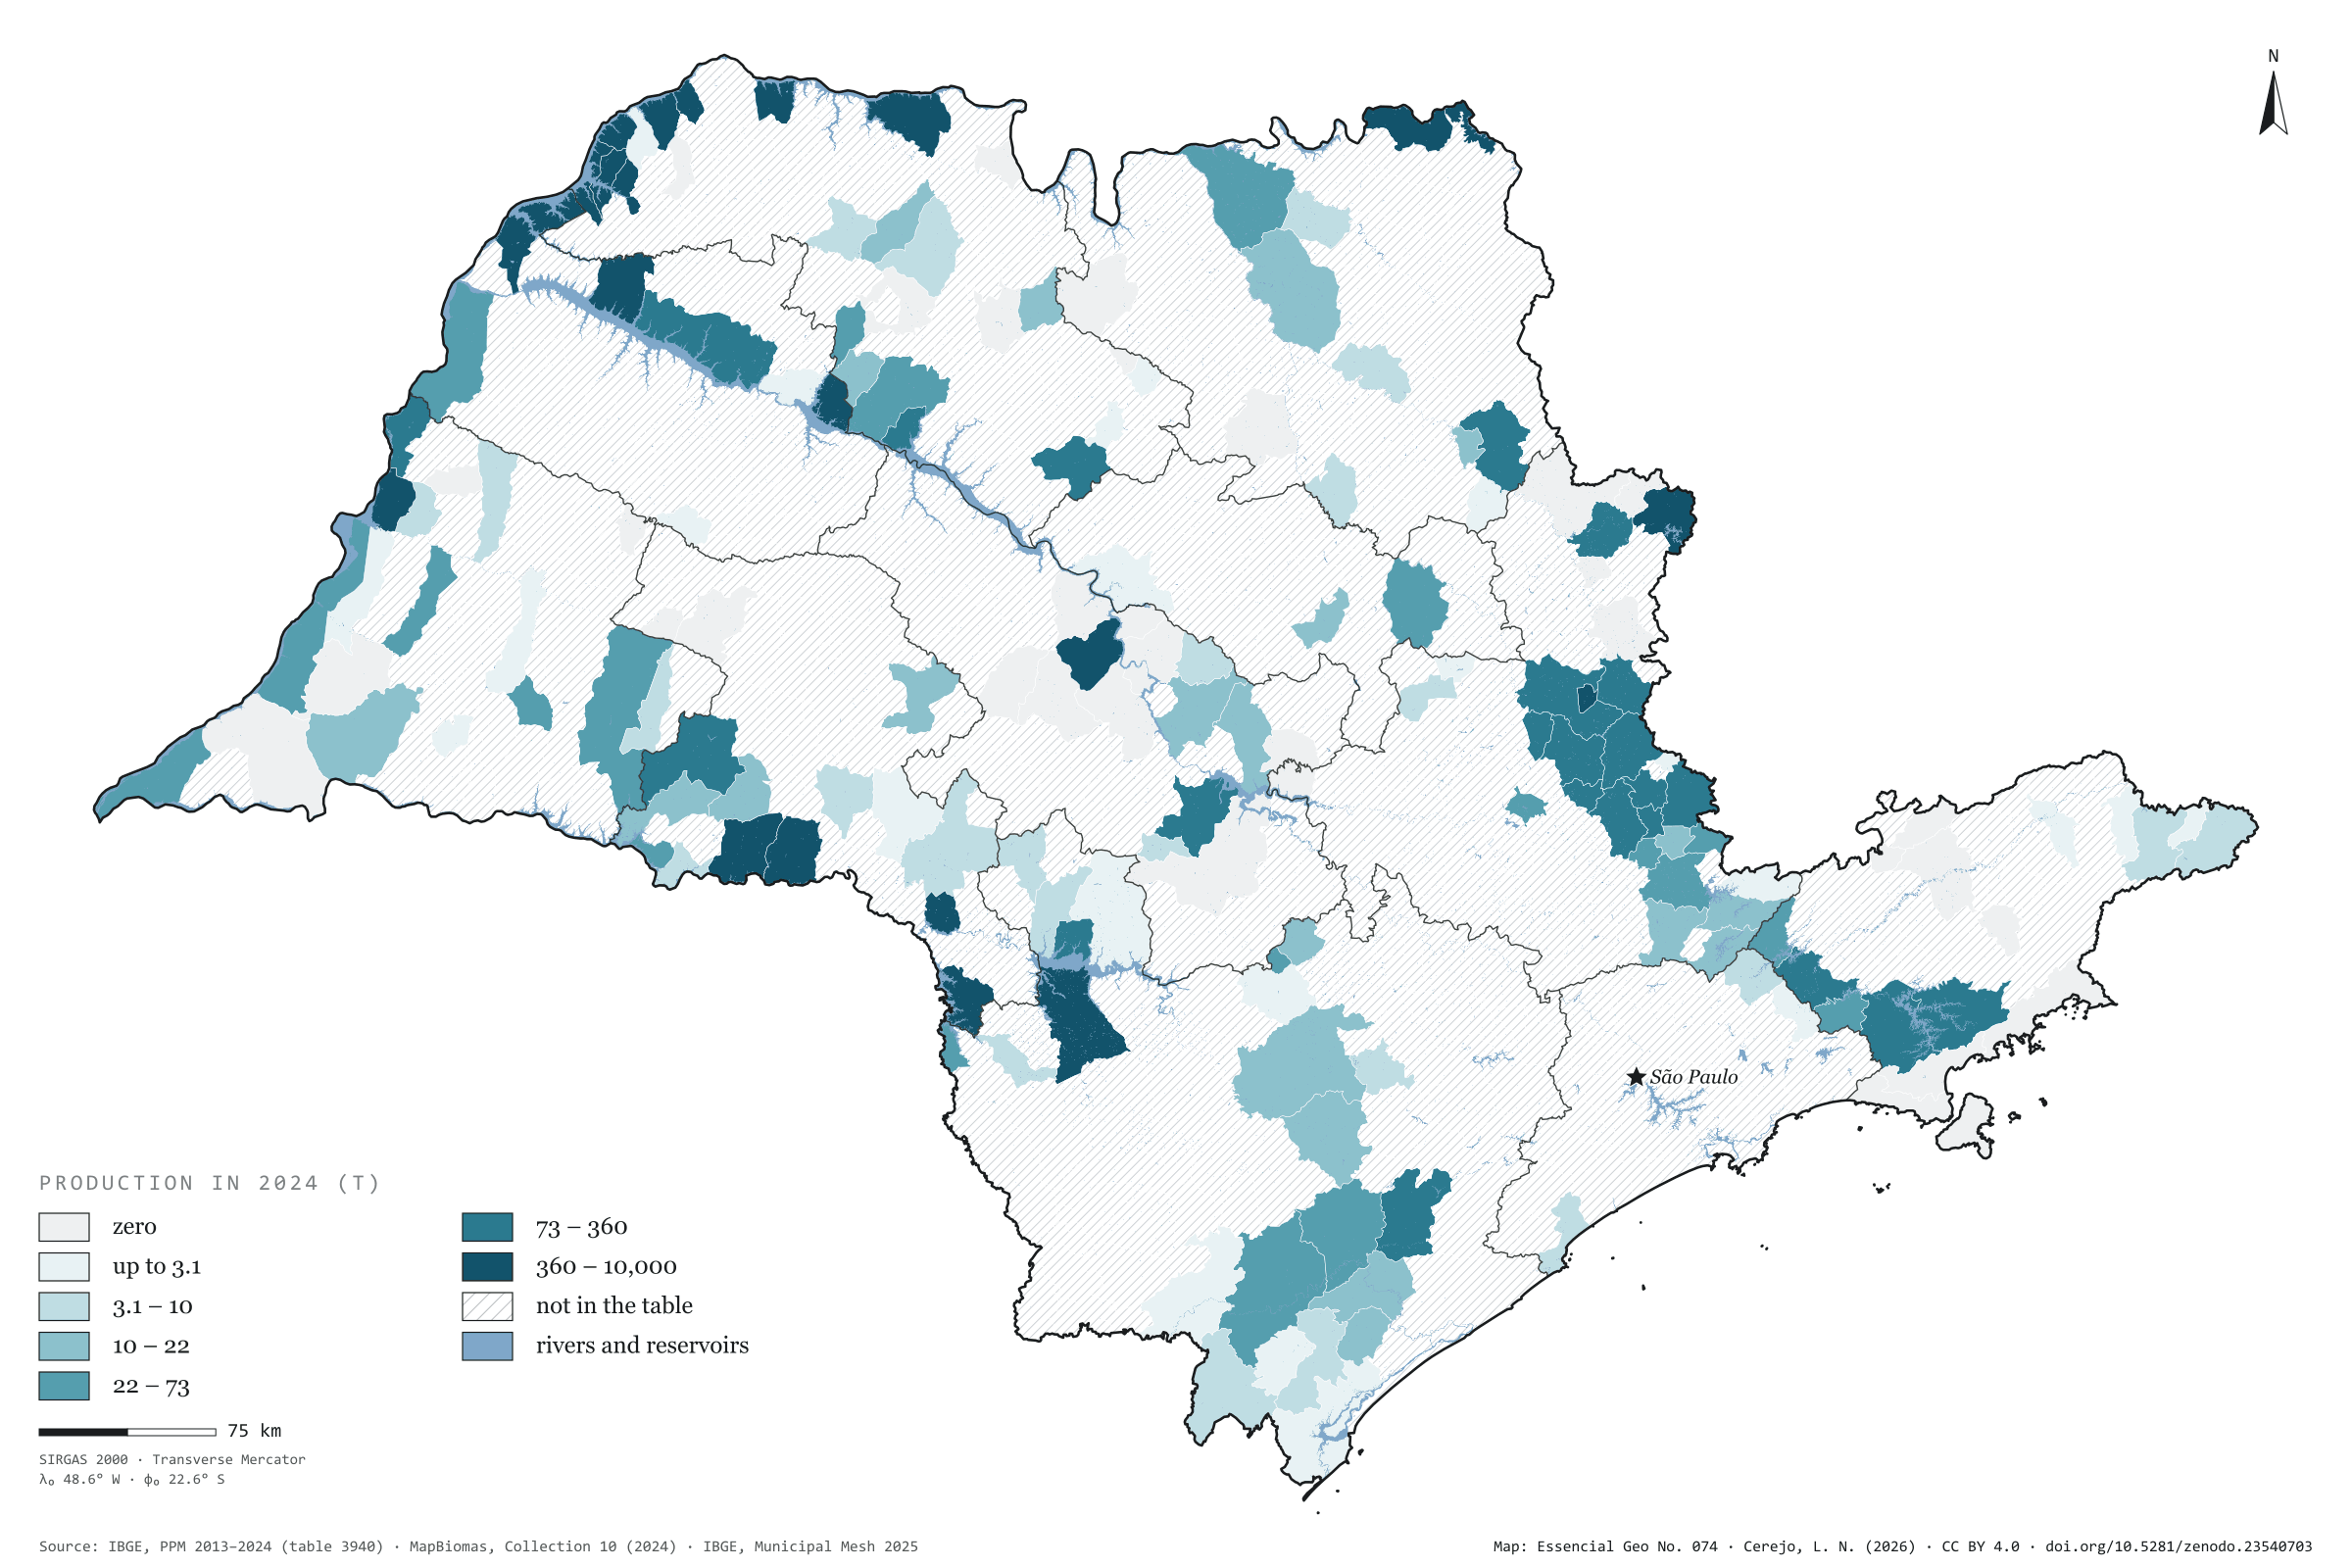
The map without a frame, with legend, scale, reference system and credit written on it: ready for papers, lectures and slides. In two versions: with the basemap (neighbours and sea) or only the mapped area, on white.

Point a camera at it to open this page.

How to cite

Cerejo, L. N. (2026). Tilápia: quase todo peixe criado no estado é tilápia [Tilapia: Almost every farmed fish in the state is tilapia] (Version 1.0.0) [Data set]. Zenodo. https://doi.org/10.5281/zenodo.23540703

How to read this plate area, projection, scale, legend and source · 2 terms
1 Area
São Paulo state (SP) The area the plate covers. Outside it, neighbours and sea are drawn in grey, just for orientation.
2 Coordinates and projection
SIRGAS 2000 (EPSG:4674) The layers are in SIRGAS 2000; the drawing’s projection is written in the colophon at the foot of the panel.
3 Scale
Graphic scale bar in the panel The scale bar is true on the central meridian; away from it, measured distances vary a little.
4 Legend and layers
3 layers in the GeoPackage · polygon Read the legend before the map: it tells you whether a colour is a rate or a class, and whether a circle is a total.
5 Sources
IBGE (2013 a 2024); MapBiomas (2024); IBGE (2025) Every figure comes from a public source, with its year. The data sheet gives each one’s address.

Terms on this plate

Land cover and land use
What covers each patch of ground (forest, pasture, soy, cane, water, town), read from satellite images year by year. The forty-year plates use MapBiomas’ series, 1985 to 2025, summed by municipality.
MapBiomas
A network of universities, NGOs and companies that classifies land cover across all of Brazil from Landsat images, one map a year since 1985, as open data.

Download

Layers, table and figures, under CC BY 4.0. Cite with the DOI.

Full record and citation

Method notes · No. 074

Tilapia in São Paulo, 2024

Português · English

Plate No. 074, the fourth of five in the collection Milk, eggs, honey and fish: the reservoir fish, farmed in few municipalities and almost always by the water.

What the files contain

Layer (GPKG)GeometryContents
municipiospolygon645 municipalities: CD_MUN, NM_MUN, intermediate region, producao_2013 and producao_2024 (kg of tilapia) and situacao_2024 (valor, zero, nao_disponivel or fora_da_tabela)
regioes_intermediariaspolygon11 intermediate geographic regions
limite_estadualpolygonoutline of the state

The GPKG is zipped and attached to the animal-sp-2026 release. The municipios layer opens in QGIS with the plate’s classes (style producao). The MapBiomas water is not in the GPKG; the 2024 raster clipped to the state comes with plate 045.

The CSV holds the municipal table, in UTF-8, without geometry. An empty cell means no data; 0 means zero.

Method

  1. Table 3940 of the Municipal Livestock Survey on SIDRA: Aquaculture production, product Tilapia (kilograms), years 2013 to 2024, municipal level, São Paulo state. Brazil’s total, for the state’s share, adds up every municipality in the country in the same table.
  2. Fish farmed in the state = sum of the table’s fish species in 2024 (70,548,417 kg), without shrimp or oysters.
  3. 2024 production in six quantile classes of the municipalities with positive production, with limits rounded to two significant figures.
  4. Data status: zero where IBGE publishes a dash (35 municipalities); nao_disponivel where it publishes “X” or “…” (91); fora_da_tabela where the municipality is missing (385). The plate shows the last two together.
  5. Water: classes river, lake and ocean (33) and aquaculture (31) of MapBiomas Collection 10, 2024, over the map, from the same 120 m clip as plate 045.

Limitations

  • Table 3940 only lists municipalities where IBGE recorded aquaculture; those missing are not necessarily zero.
  • PPM is a municipal estimate based on local informants; round figures, such as Rifaina’s 10,000,000 kg, point to estimates, not weighing.
  • Production is attributed to the municipality, not the reservoir: cages off one bank may be recorded in the neighbouring municipality.

Data licence

Open data from IBGE, free to use with attribution. MapBiomas: CC BY 4.0, “MapBiomas Project — Collection 10 of the Annual Series of Land Use and Land Cover Maps of Brazil”.

View this map’s folder on GitHub

Technical record

Technical record · No. 074

Tilapia

At a glance

Tilapia in 2024

67,058,737 kg

In 2013 it was 24,329,347 kg; the share of Brazil went from 14.4% to 13.4%

Tilapia’s share of farmed fish in SP

95 %

Out of 70,548,417 kg of fish of all species in 2024

Largest producers in 2024 (kg)
  • Rifaina 10,000,000
  • Rubinéia 8,718,900
  • Santa Clara d'Oeste 6,250,000
  • Panorama 4,500,000
  • Riolândia 4,379,950

Layers

  • municipios polygon 645 municipalities: tilapia production in 2013 and 2024 (kg) and data status in 2024
  • regioes_intermediarias polygon 11 intermediate geographic regions
  • limite_estadual polygon State boundary

Metadata

Extent
São Paulo state (SP)
CRS / Projection
SIRGAS 2000 (EPSG:4674)
EPSG:4674
Software
Python · GeoPandas · GDAL · QGIS · Node.js · d3-geo
Method
Tilapia production from PPM 2024 by municipality in six quantile classes; state series from 2013 to 2024; rivers, lakes and reservoirs from the MapBiomas 2024 water classes over the map.
Version
v1.0.0
Licence
CC BY 4.0

Downloads

Figure to reuse

The map without a frame, with legend, scale, reference system and credit written on it: ready for papers, lectures and slides. In two versions: with the basemap (neighbours and sea) or only the mapped area, on white.

Point a camera at it to open this page.

How to cite

Cerejo, L. N. (2026). Tilápia: quase todo peixe criado no estado é tilápia [Tilapia: Almost every farmed fish in the state is tilapia] (Version 1.0.0) [Data set]. Zenodo. https://doi.org/10.5281/zenodo.23540703

100%