Skip to content
Essencial

No. 112 Energy · biomass Bioenergy, crossed 2/5

The diesel biomethane could cover

In 300 municipalities, biomethane potential exceeds, in energy, the diesel sold at the pumps

Record, downloads and citation
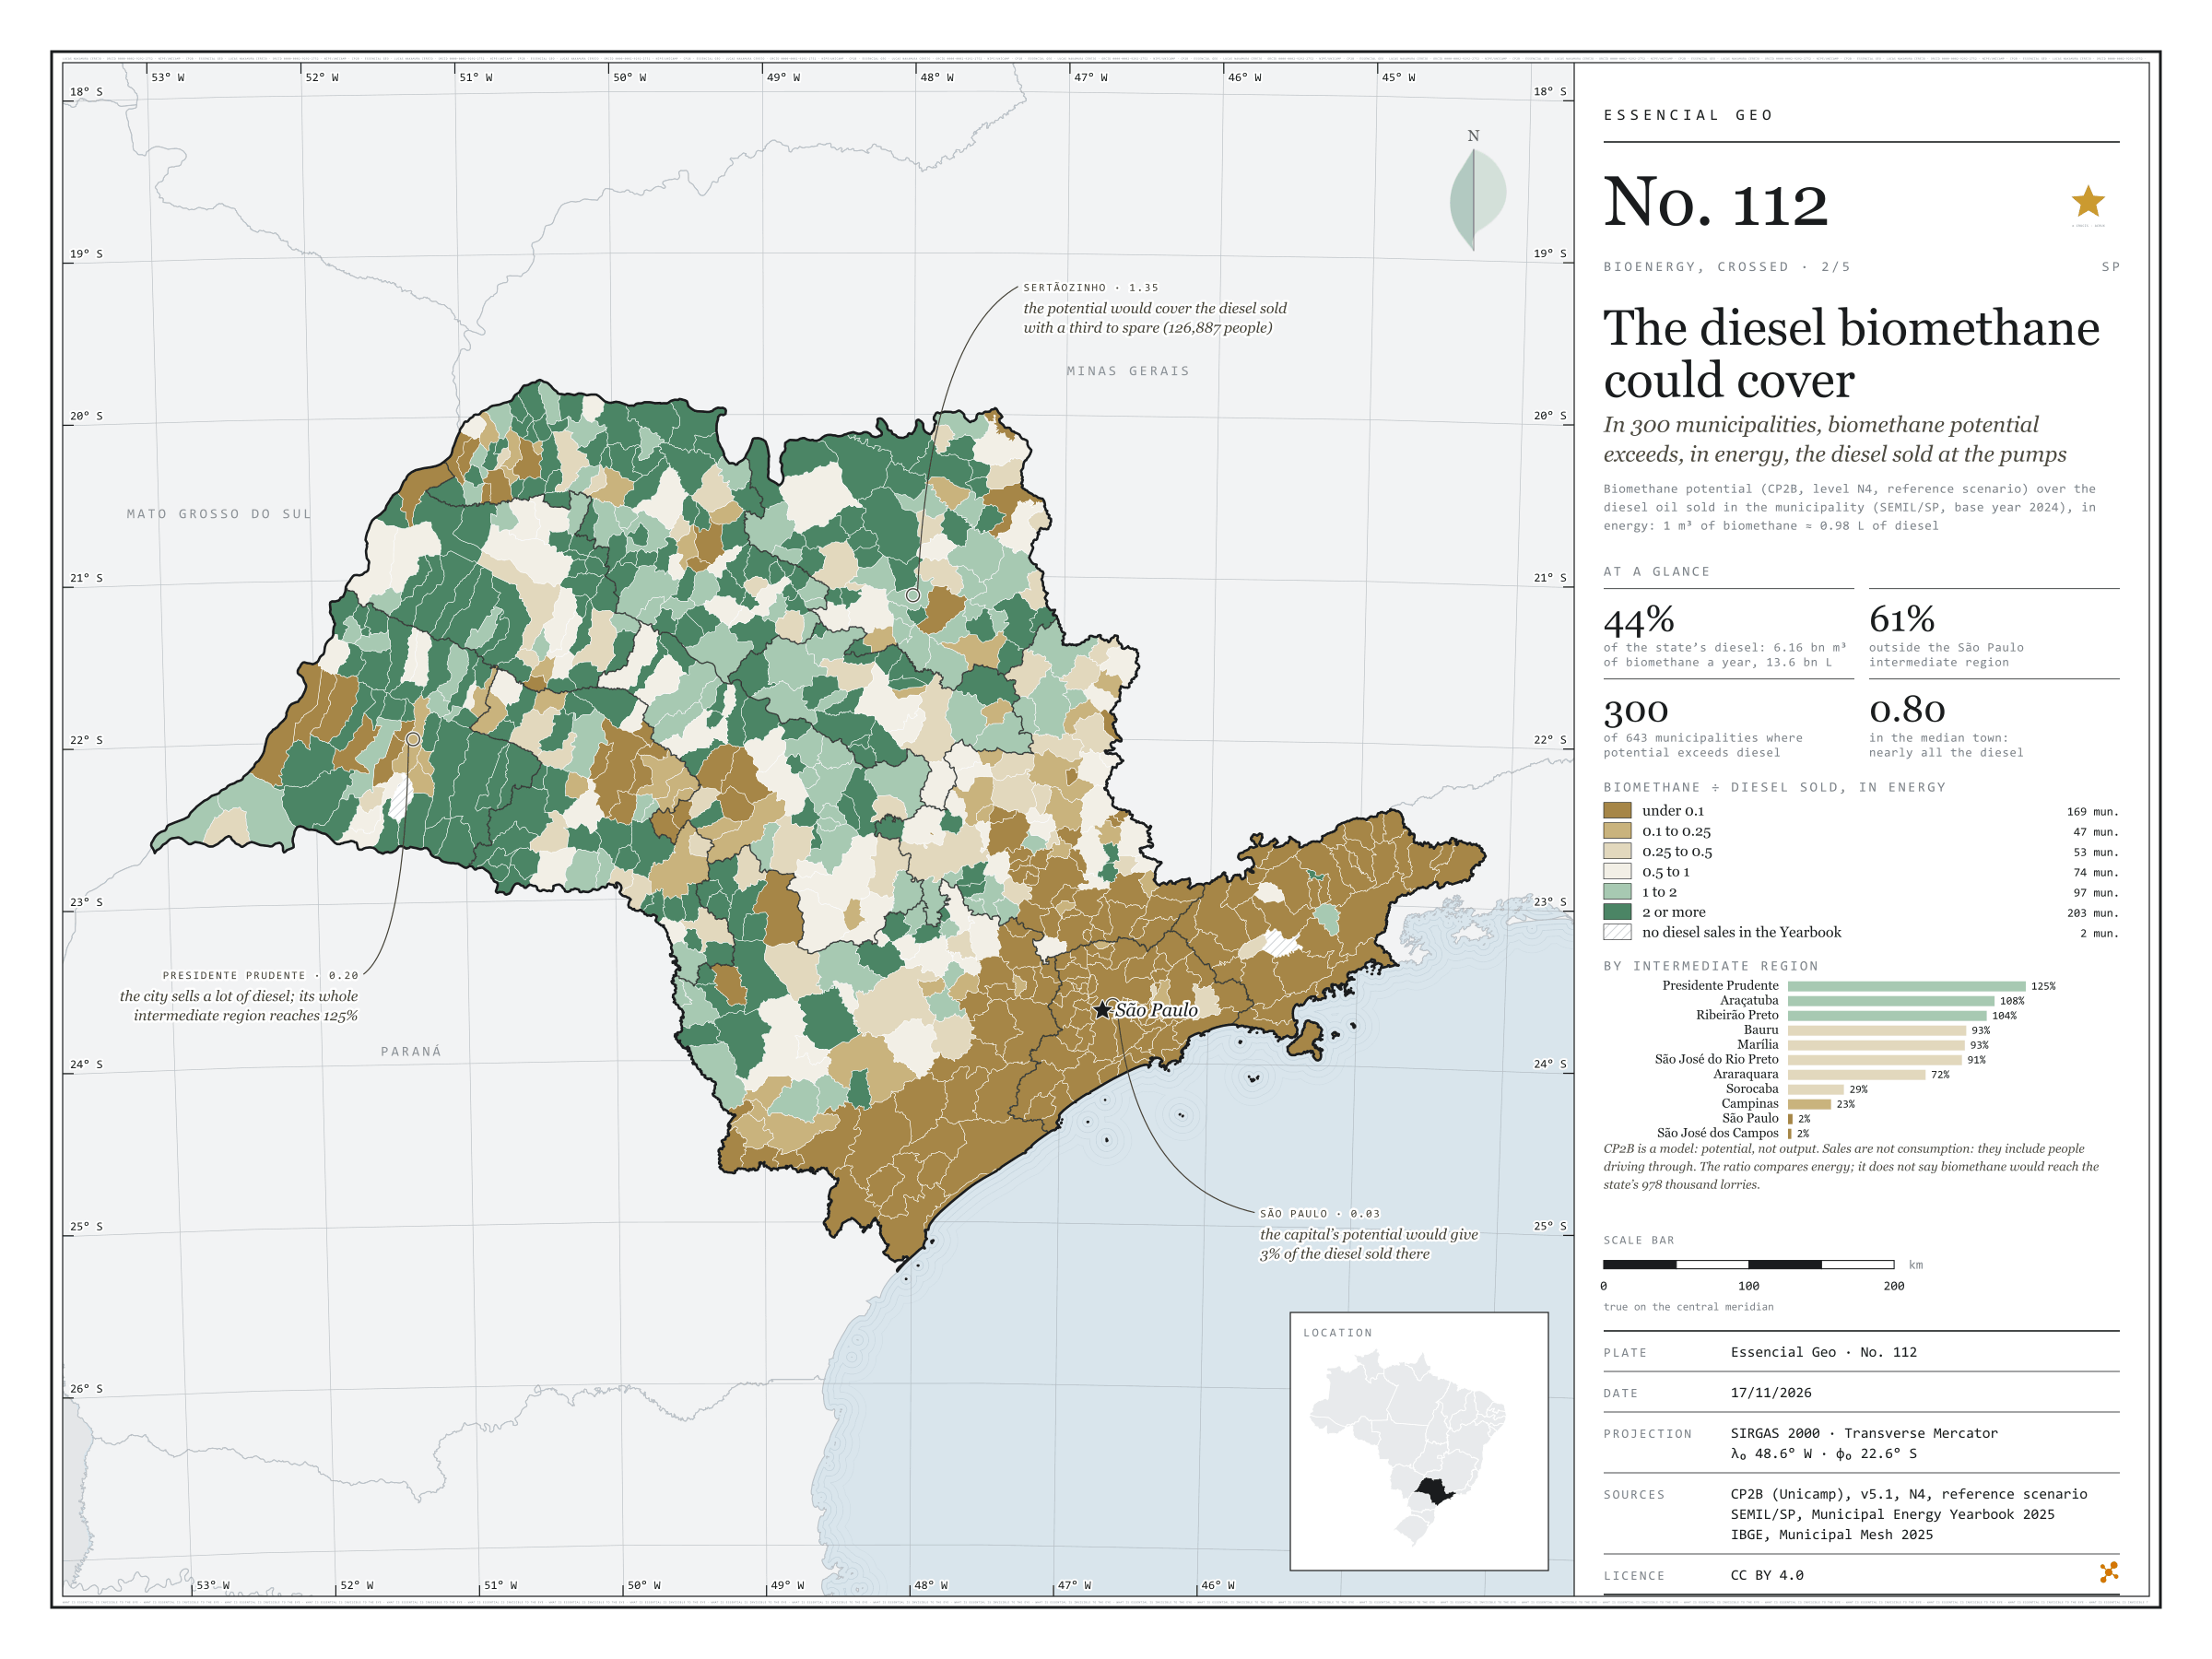
Fig. 112 São Paulo State (SP) EPSG:4674 Source: CP2B (Unicamp), SEMIL/SP, Municipal Energy Yearbook 2025 (base year 2024): sales of hydrous ethanol, petrol C, diesel oil and piped natural gas by municipality, SENATRAN, IBGE

If all of São Paulo’s accessible biomethane potential became fuel, 6.16 billion m³ a year, it would cover in energy 44% of the 13.6 billion litres of diesel sold in the state in 2024; outside the São Paulo intermediate region, 61%. In 300 of the 643 municipalities the potential exceeds the diesel sold, and in the median municipality it reaches 80%. Sertãozinho would cover its own diesel with a third to spare; the whole Presidente Prudente region reaches 125%; the capital, 3%. It is an energy sum, not a plan: CP2B is a model, and diesel sales are not consumption. Second plate of the collection “Bioenergy, crossed”.

Technical record · downloads · citation

At a glance

State diesel that biomethane could cover, in energy

44 %

61% outside the São Paulo region

Municipalities where potential exceeds diesel sold

300 municipalities

out of 643

Ratio in the median municipality

0.8

Layers

  • municipios polygon 645 municipalities with the variables of all five plates, the bivariate classes and the LISA clusters (same GPKG as plates 111 to 115)
  • gasodutos line Gas transmission pipelines and distribution network (EPE)
  • regioes_intermediarias polygon 11 intermediate geographic regions
  • limite_estadual polygon State boundary

Metadata

Extent
São Paulo State (SP)
CRS / Projection
SIRGAS 2000 (EPSG:4674)
EPSG:4674
Software
Node.js · d3-geo · QGIS
Method
CP2B biomethane potential (v5.1, level N4, reference scenario) in m³ a year, converted into energy-equivalent litres of diesel (1 m³ ≈ 0.98 L), over the diesel oil sold in the municipality (SEMIL/SP, base year 2024); six classes of the ratio; sums by intermediate region.
Version
v1.0.0
Licence
CC BY 4.0
DOI
being registered on Zenodo

Downloads

Figure to reuse

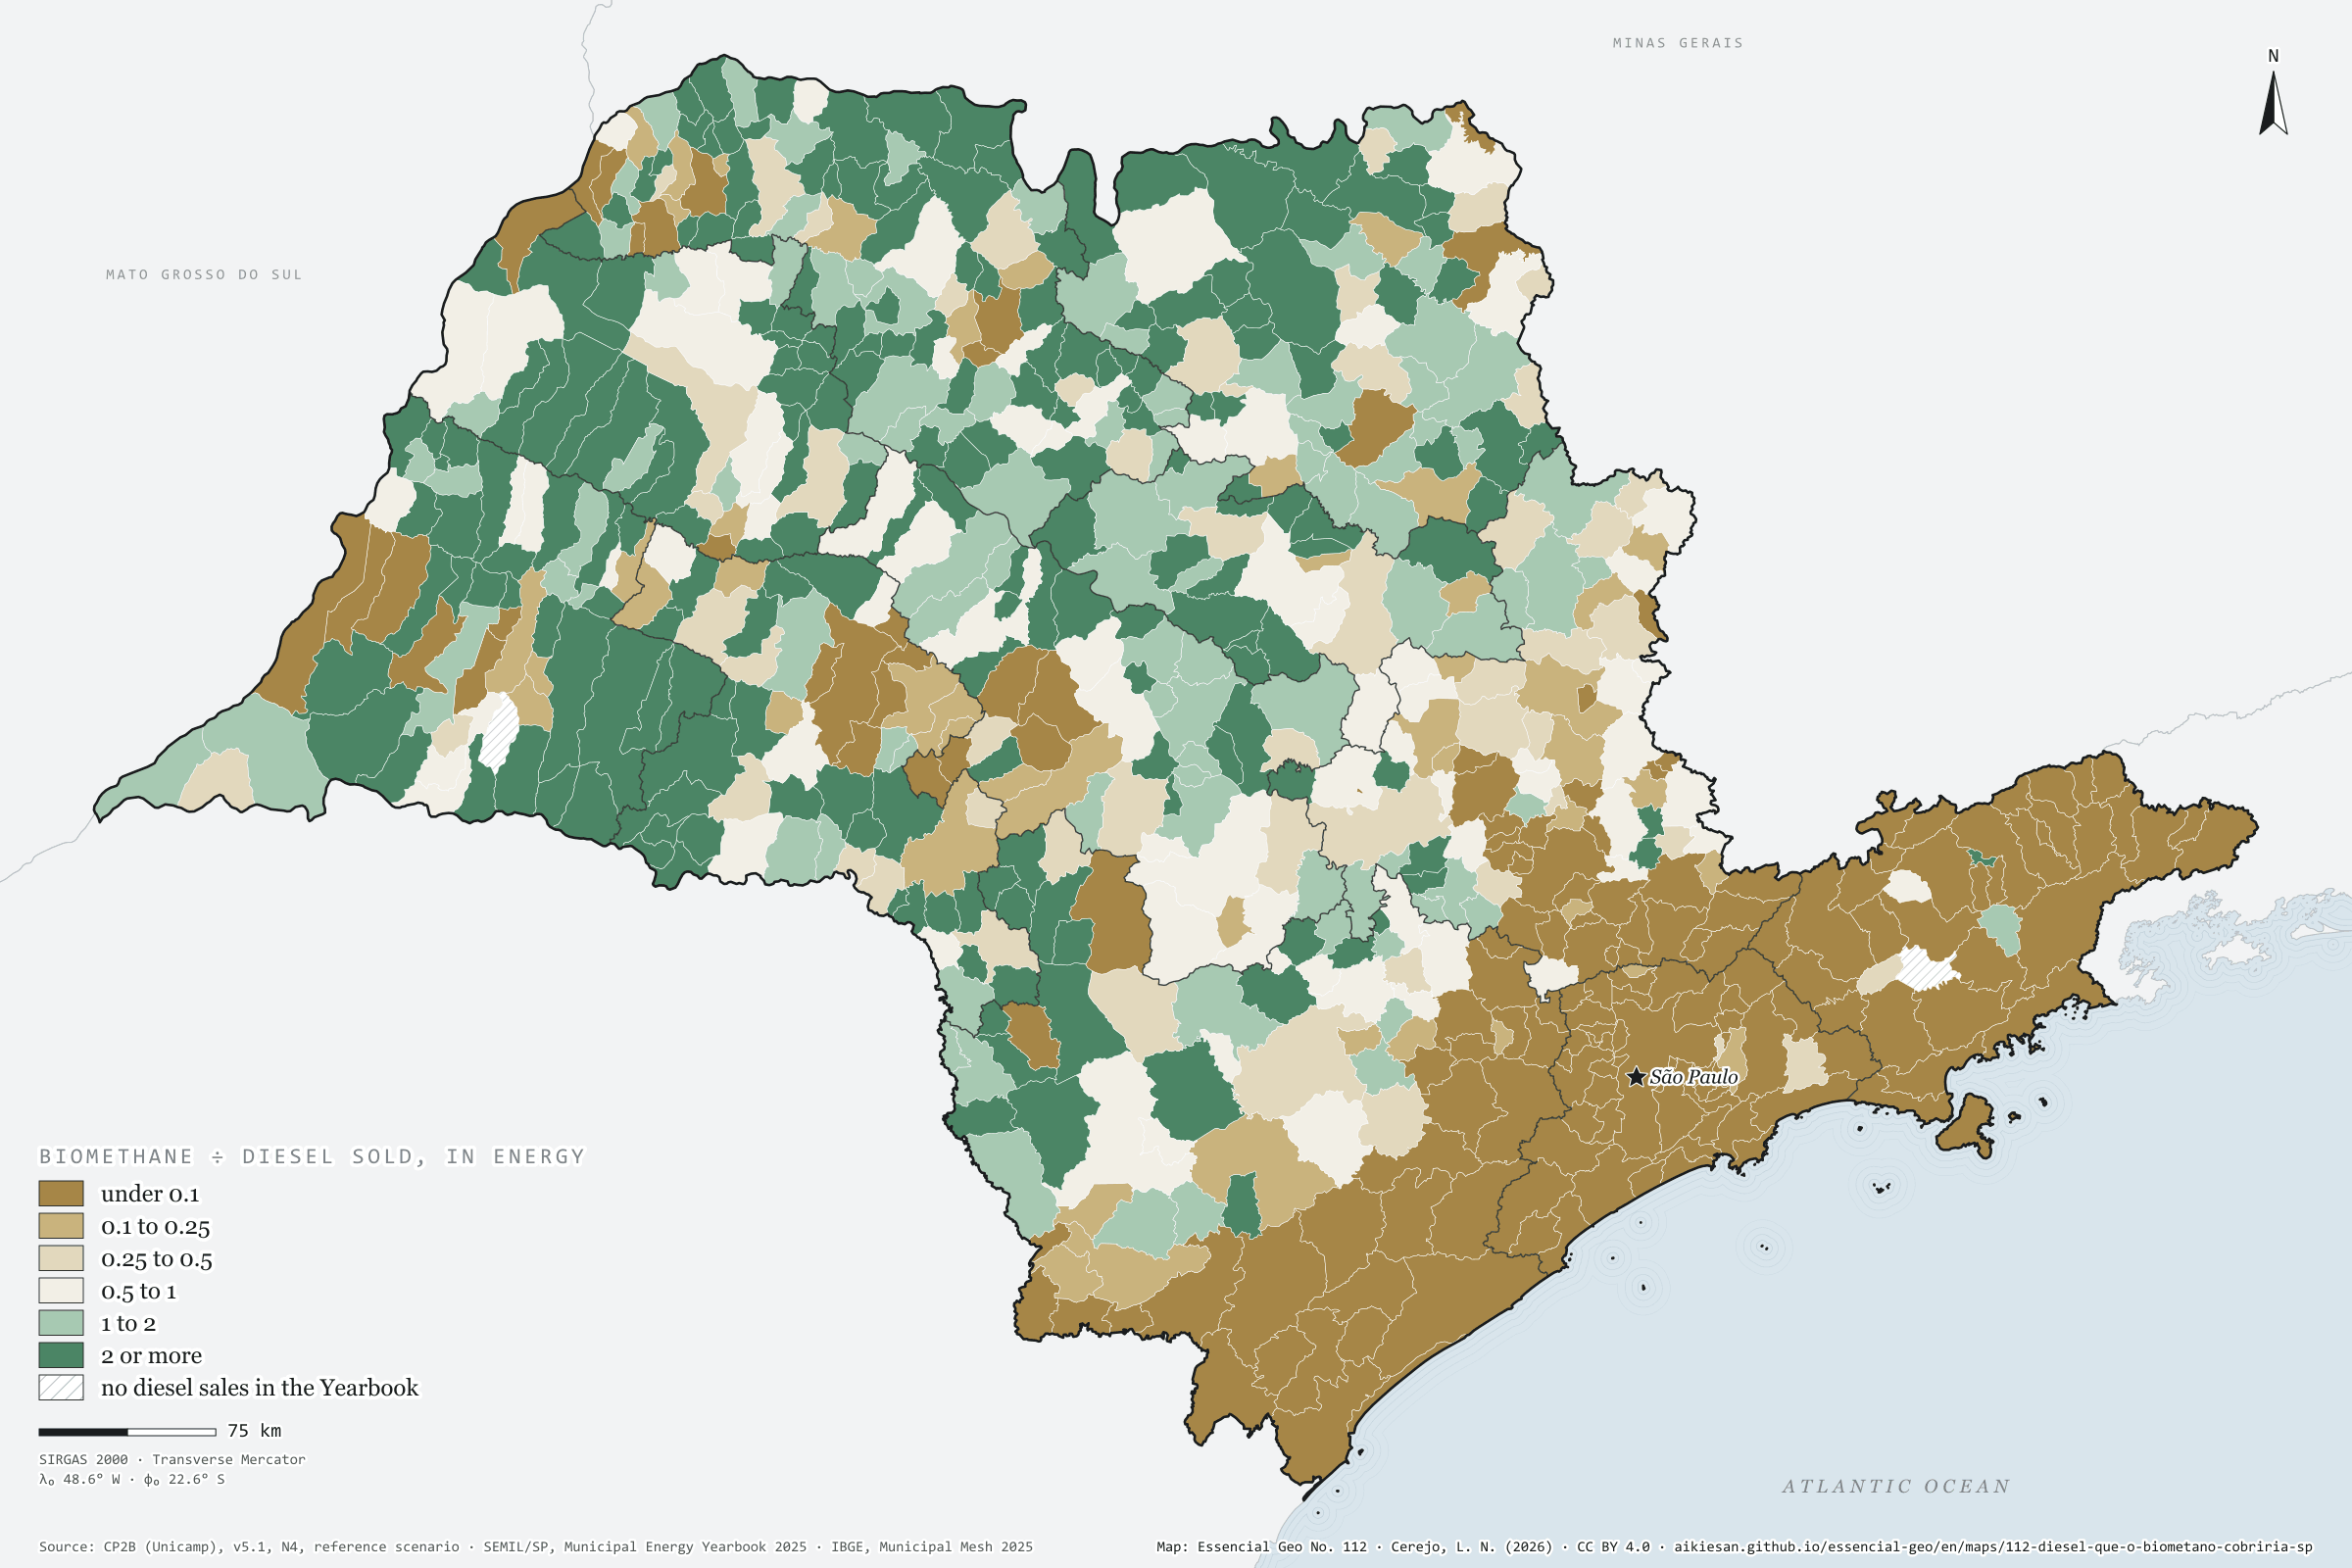
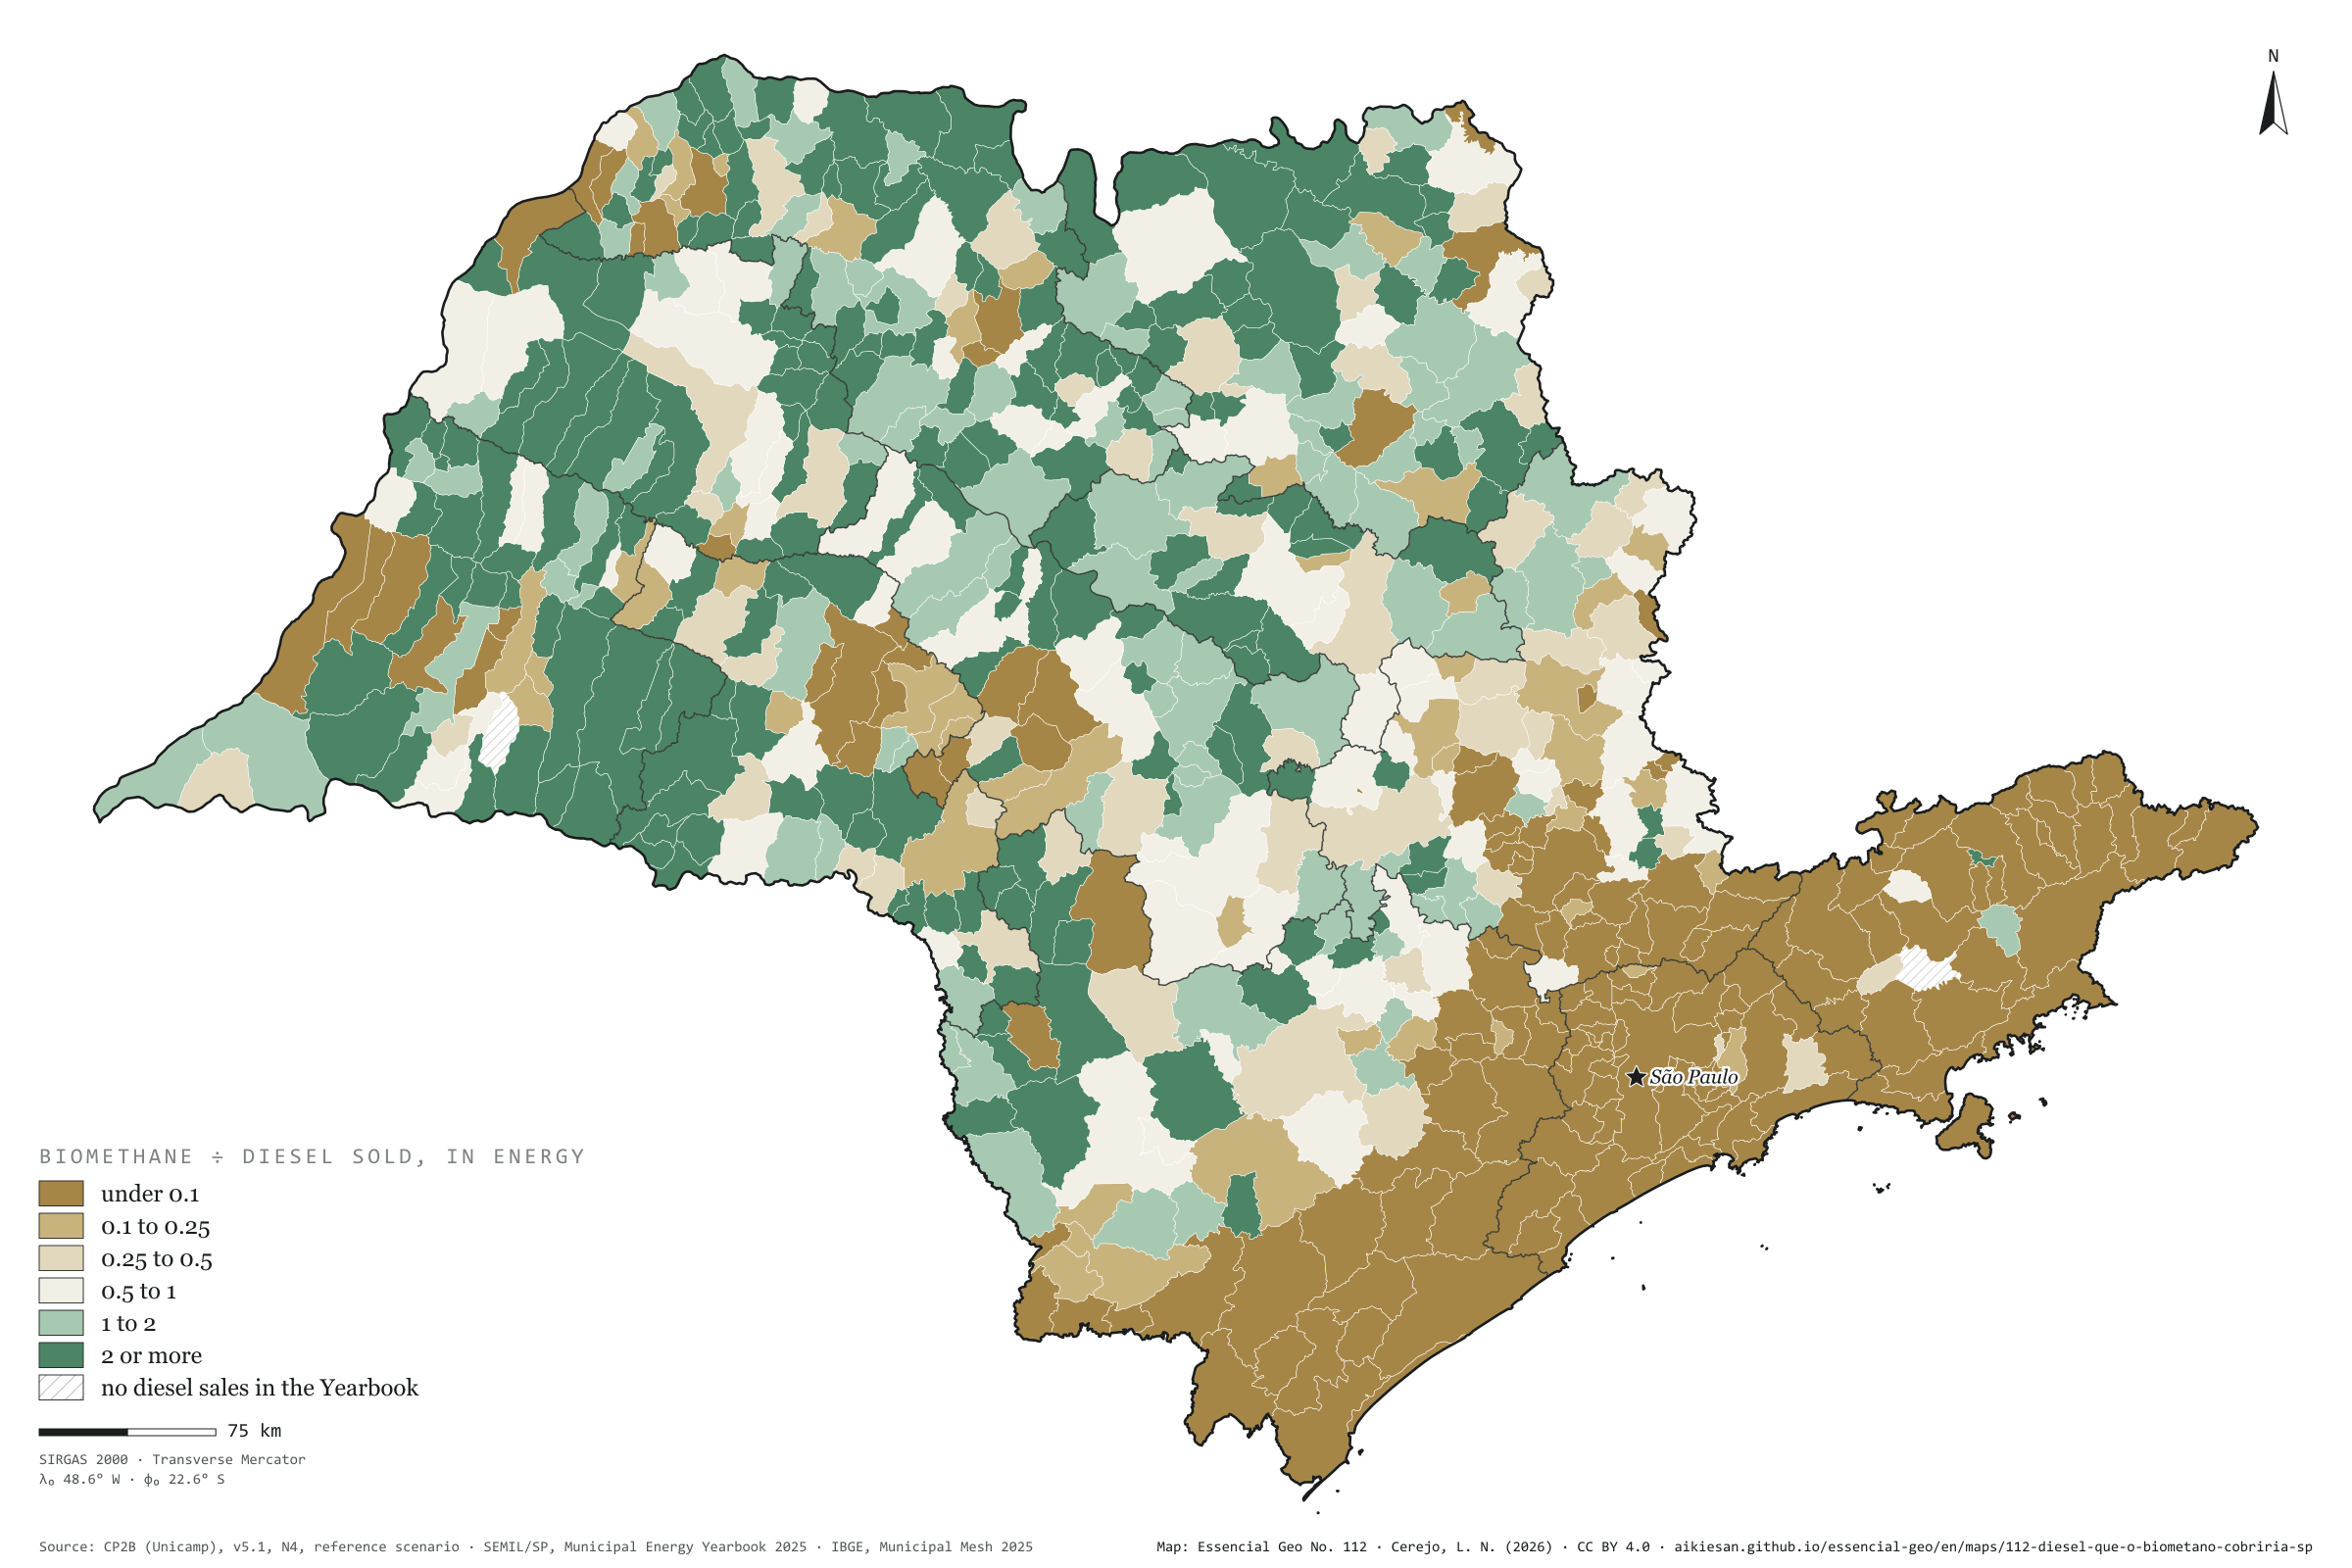
The map without a frame, with legend, scale, reference system and credit written on it: ready for papers, lectures and slides. In two versions: with the basemap (neighbours and sea) or only the mapped area, on white.

Point a camera at it to open this page.

How to cite

Cerejo, L. N. (2026). O diesel que o biometano cobriria: em 300 municípios, o potencial de biometano passa, em energia, do diesel que os postos vendem [The diesel biomethane could cover: In 300 municipalities, biomethane potential exceeds, in energy, the diesel sold at the pumps] (Version 1.0.0) [Data set]. Essencial. https://aikiesan.github.io/essencial-geo/en/maps/112-diesel-que-o-biometano-cobriria-sp/

How to read this plate area, projection, scale, legend and source · 3 terms
1 Area
São Paulo State (SP) The area the plate covers. Outside it, neighbours and sea are drawn in grey, just for orientation.
2 Coordinates and projection
SIRGAS 2000 (EPSG:4674) The layers are in SIRGAS 2000; the drawing’s projection is written in the colophon at the foot of the panel.
3 Scale
Graphic scale bar in the panel The scale bar is true on the central meridian; away from it, measured distances vary a little.
4 Legend and layers
4 layers in the GeoPackage · polygon, line Read the legend before the map: it tells you whether a colour is a rate or a class, and whether a circle is a total.
5 Sources
CP2B (Unicamp) (2026); SEMIL/SP, Municipal Energy Yearbook 2025 (base year 2024): sales of hydrous ethanol, petrol C, diesel oil and piped natural gas by municipality (2025); SENATRAN (2025); IBGE (2025) Every figure comes from a public source, with its year. The data sheet gives each one’s address.

Terms on this plate

Choropleth map
Each area (municipality, census tract) takes the colour of its value’s class. The colour gives the band, not the total, which is why the plates use rates such as per km², per person or per household.
Biomethane
Biogas upgraded, with most of the CO₂ removed, to ANP’s specification, at which point it replaces natural gas in the pipeline, in industry and in the lorry’s tank.
N1 to N4 (potential levels)
CP2B’s four levels: N1 theoretical (all residue generated), N2 technical (after collection), N3 mobilisable (after competing uses and what already becomes biogas) and N4 accessible (after storage and the logistic factor).

Download

Layers, table and figures, under CC BY 4.0. Cite with the DOI.

Full record and citation

Method notes · No. 112

Biomethane potential over diesel sold, in energy, across São Paulo’s municipalities

Português · English

Plate No. 112, the second of five in the collection Bioenergy, crossed; the previous one is plate 111; the next, plate 113.

The collection crosses São Paulo’s bioenergy with what filling stations sell, with the countryside and with town halls, across the state’s 645 municipalities. The pairs came from a correlation screen between CP2B biomethane potential, fuel sales in the SEMIL Yearbook, plantation forestry, the cattle herd, the Agricultural Census, the vehicle fleet and MUNIC. Each pair went through raw and partial rank correlation (net of urbanisation, density and income), an effective sample corrected for spatial autocorrelation, Benjamini–Hochberg q values and bivariate LISA. The last plate is descriptive, with no test, and the text says so.

The map’s callouts point to Sertãozinho, where the potential would cover 135% of the diesel sold; Presidente Prudente, a city selling a lot of diesel (ratio 0.20) in an intermediate region that reaches 125%; and São Paulo, at 3%.

What the files contain

Layer (GPKG)GeometryContent
municipiospolygon645 municipalities with cane and ethanol, biomethane and diesel, the fleet, native cover and pulpwood, cattle and organic fertiliser, distances to the pipeline, piped gas and the MUNIC answers on waste; classes b111, b113, b114, arranjo115 and clusters lisa111, lisa113, lisa114
gasodutoslinetransmission pipelines and distribution network (tipo)
regioes_intermediarias, limite_estadualpolygonreference

The GPKG is the same for all five plates and carries a QGIS style for each. The CSV has the municipal table, without geometry. Empty fields are missing data, not zero. LISA clusters come as AA (high-high), BB (low-low), AB, BA and ns (not significant); the first letter is the municipality’s variable, the second its neighbours’.

Method

  1. biometano_m3d: CP2B biomethane potential, v5.1, level N4 (accessible), reference scenario, in m³ a day (the same as plates 055 to 059).
  2. diesel_l: litres of diesel oil sold in the municipality in 2024 (SEMIL/SP, Municipal Energy Yearbook 2025).
  3. cobertura_diesel = biometano_m3d × 365 × 0.98 ÷ diesel_l. The factor of 0.98 L of diesel per m³ of biomethane equates their energy (lower heating value). Classes: under 0.1 (169); 0.1 to 0.25 (47); 0.25 to 0.5 (53); 0.5 to 1 (74); 1 to 2 (97); 2 or more (203); 2 with no diesel sales (Anhumas and Redenção da Serra).
  4. By intermediate region: Presidente Prudente 125%; Araçatuba 108%; Ribeirão Preto 104%; Bauru 93%; Marília 93%; São José do Rio Preto 91%; Araraquara 72%; Sorocaba 29%; Campinas 23%; São Paulo 2%; São José dos Campos 2%.
  5. caminhoes and onibus: lorries and tractor units, buses and minibuses registered in the municipality (SENATRAN, December 2025); the state has 978,415 lorries. Biomethane (log) × lorries per thousand people: Spearman rank correlation 0.35 (645 municipalities), partial 0.39, effective sample 522, p < 0.001, q < 0.001; biomethane × diesel per head: Spearman rank correlation 0.40 (644 municipalities), partial 0.35, effective sample 619, p < 0.001, q < 0.001; jobs at mills × diesel per head: Spearman rank correlation 0.43 (644 municipalities), partial 0.41, effective sample 643, p < 0.001, q < 0.001.
  6. Partial correlation: the correlation between the residuals of each variable’s ranks regressed on the ranks of the controls, which are urbanisation (residents in urban areas), log of population density and log of income per head (2022 Census). Effective sample under spatial autocorrelation: n·(1 − Iₓ·Iᵧ)/(1 + Iₓ·Iᵧ), where Iₓ and Iᵧ are the Moran’s I of the residuals over a 6-nearest-neighbour neighbourhood; Benjamini–Hochberg q values across all pairs in the screen. Bivariate LISA: the municipality’s value against the mean of its 6 neighbours on the other variable, 999 permutations, seed 20261019, p < 0.05.

Limitations

  • CP2B is a model: the potential estimates what residues would yield at level N4 (accessible, after collection, competing uses, storage and haulage), not biomethane actually produced.
  • Sales are not consumption: the SEMIL Yearbook counts what filling stations and distributors sell in the municipality, including to people just driving through or to fleets based elsewhere. Towns on busy highways may sell far more diesel than they use.
  • The ratio compares energy; it does not say biomethane would reach the state’s 978,415 lorries, which need gas engines or conversion kits, filling stations and logistics. Biomethane also has competing uses: grid injection, industry and power generation.
  • Ecological reading: the map compares municipalities, not people or farms. A correlation between municipalities does not say that the same farms or drivers have both traits, nor that one causes the other.

View this map’s folder on GitHub

Technical record

Technical record · No. 112

The diesel biomethane could cover

At a glance

State diesel that biomethane could cover, in energy

44 %

61% outside the São Paulo region

Municipalities where potential exceeds diesel sold

300 municipalities

out of 643

Ratio in the median municipality

0.8

Layers

  • municipios polygon 645 municipalities with the variables of all five plates, the bivariate classes and the LISA clusters (same GPKG as plates 111 to 115)
  • gasodutos line Gas transmission pipelines and distribution network (EPE)
  • regioes_intermediarias polygon 11 intermediate geographic regions
  • limite_estadual polygon State boundary

Metadata

Extent
São Paulo State (SP)
CRS / Projection
SIRGAS 2000 (EPSG:4674)
EPSG:4674
Software
Node.js · d3-geo · QGIS
Method
CP2B biomethane potential (v5.1, level N4, reference scenario) in m³ a year, converted into energy-equivalent litres of diesel (1 m³ ≈ 0.98 L), over the diesel oil sold in the municipality (SEMIL/SP, base year 2024); six classes of the ratio; sums by intermediate region.
Version
v1.0.0
Licence
CC BY 4.0
DOI
being registered on Zenodo

Downloads

Figure to reuse

The map without a frame, with legend, scale, reference system and credit written on it: ready for papers, lectures and slides. In two versions: with the basemap (neighbours and sea) or only the mapped area, on white.

Point a camera at it to open this page.

How to cite

Cerejo, L. N. (2026). O diesel que o biometano cobriria: em 300 municípios, o potencial de biometano passa, em energia, do diesel que os postos vendem [The diesel biomethane could cover: In 300 municipalities, biomethane potential exceeds, in energy, the diesel sold at the pumps] (Version 1.0.0) [Data set]. Essencial. https://aikiesan.github.io/essencial-geo/en/maps/112-diesel-que-o-biometano-cobriria-sp/

100%