Land use and land cover
Between cane and city, islands of forest
Record, downloads and citationThe grey patch of the city already covers 21.1% of the 3,791 km² of the Campinas Metropolitan Region, and 72.6% of Hortolândia. To the west, sugarcane takes half of Santa Bárbara d'Oeste (49.3%) and 39.7% of Cosmópolis. To the east, in the hills of Morungaba, Itatiba and Pedreira, the forest holds out in islands: 7,743 forest fragments, only 31 of them larger than 1 km². The largest, in Itatiba, covers 8.6 km². The most common class is none of these but the mosaic of uses (29.3%): pastures, small fields and country plots that the satellite cannot tell apart at 30 m. First plate of the collection “Campinas Metropolitan Region”.
Technical record · downloads · citation
At a glance
- Mosaico de usos 29.3%
- Área urbanizada 21.1%
- Pastagem 15.7%
- Cana 11.9%
- Soja e outras lavouras 9.1%
- Formação florestal 9.1%
- Silvicultura 1.6%
- Água 1.1%
- Campo e área úmida 0.8%
- Mineração e outras áreas sem vegetação 0.3%
8.6 km²
Layers
- cobertura_2024 raster GeoTIFF of the 2024 classification clipped to the region, with the original MapBiomas codes and the plate’s palette in a .qml style
- municipios polygon 20 municipalities: area and km² and % of each of the ten classes
- limite_rmc polygon Outline of the region
Metadata
- Sources
- MapBiomas — Collection 10 of the annual land cover and land use maps of Brazil (2024)
IBGE — Municipal Mesh 2025 (2025) - Extent
- Campinas Metropolitan Region (SP)
- CRS / Projection
- SIRGAS 2000 (EPSG:4674)
EPSG:4674 - Software
- Python · rasterio · GeoPandas · SciPy · GDAL · QGIS · Node.js · d3-geo
- Method
- MapBiomas Collection 10 classification for 2024, 30 m pixels, grouped into ten classes; each pixel’s area measured on the ellipsoid and summed for the region and for each municipality.
- Version
- v1.0.0
- Licence
- CC BY 4.0
Downloads
- GPKG Municipalities and outline, SIRGAS 2000, with QGIS styles (.gpkg) 0.6 MB
- TIF 2024 classification for the region (GeoTIFF, 30 m) with a .qml style (.tif) 0.6 MB
- CSV The 20 municipalities: km² and % of each class (.csv) 3 kB
- SVG Vector plate, for printing (.svg) 3.0 MB
- PNG Plate (PNG, 2400 px) (.png) 0.6 MB

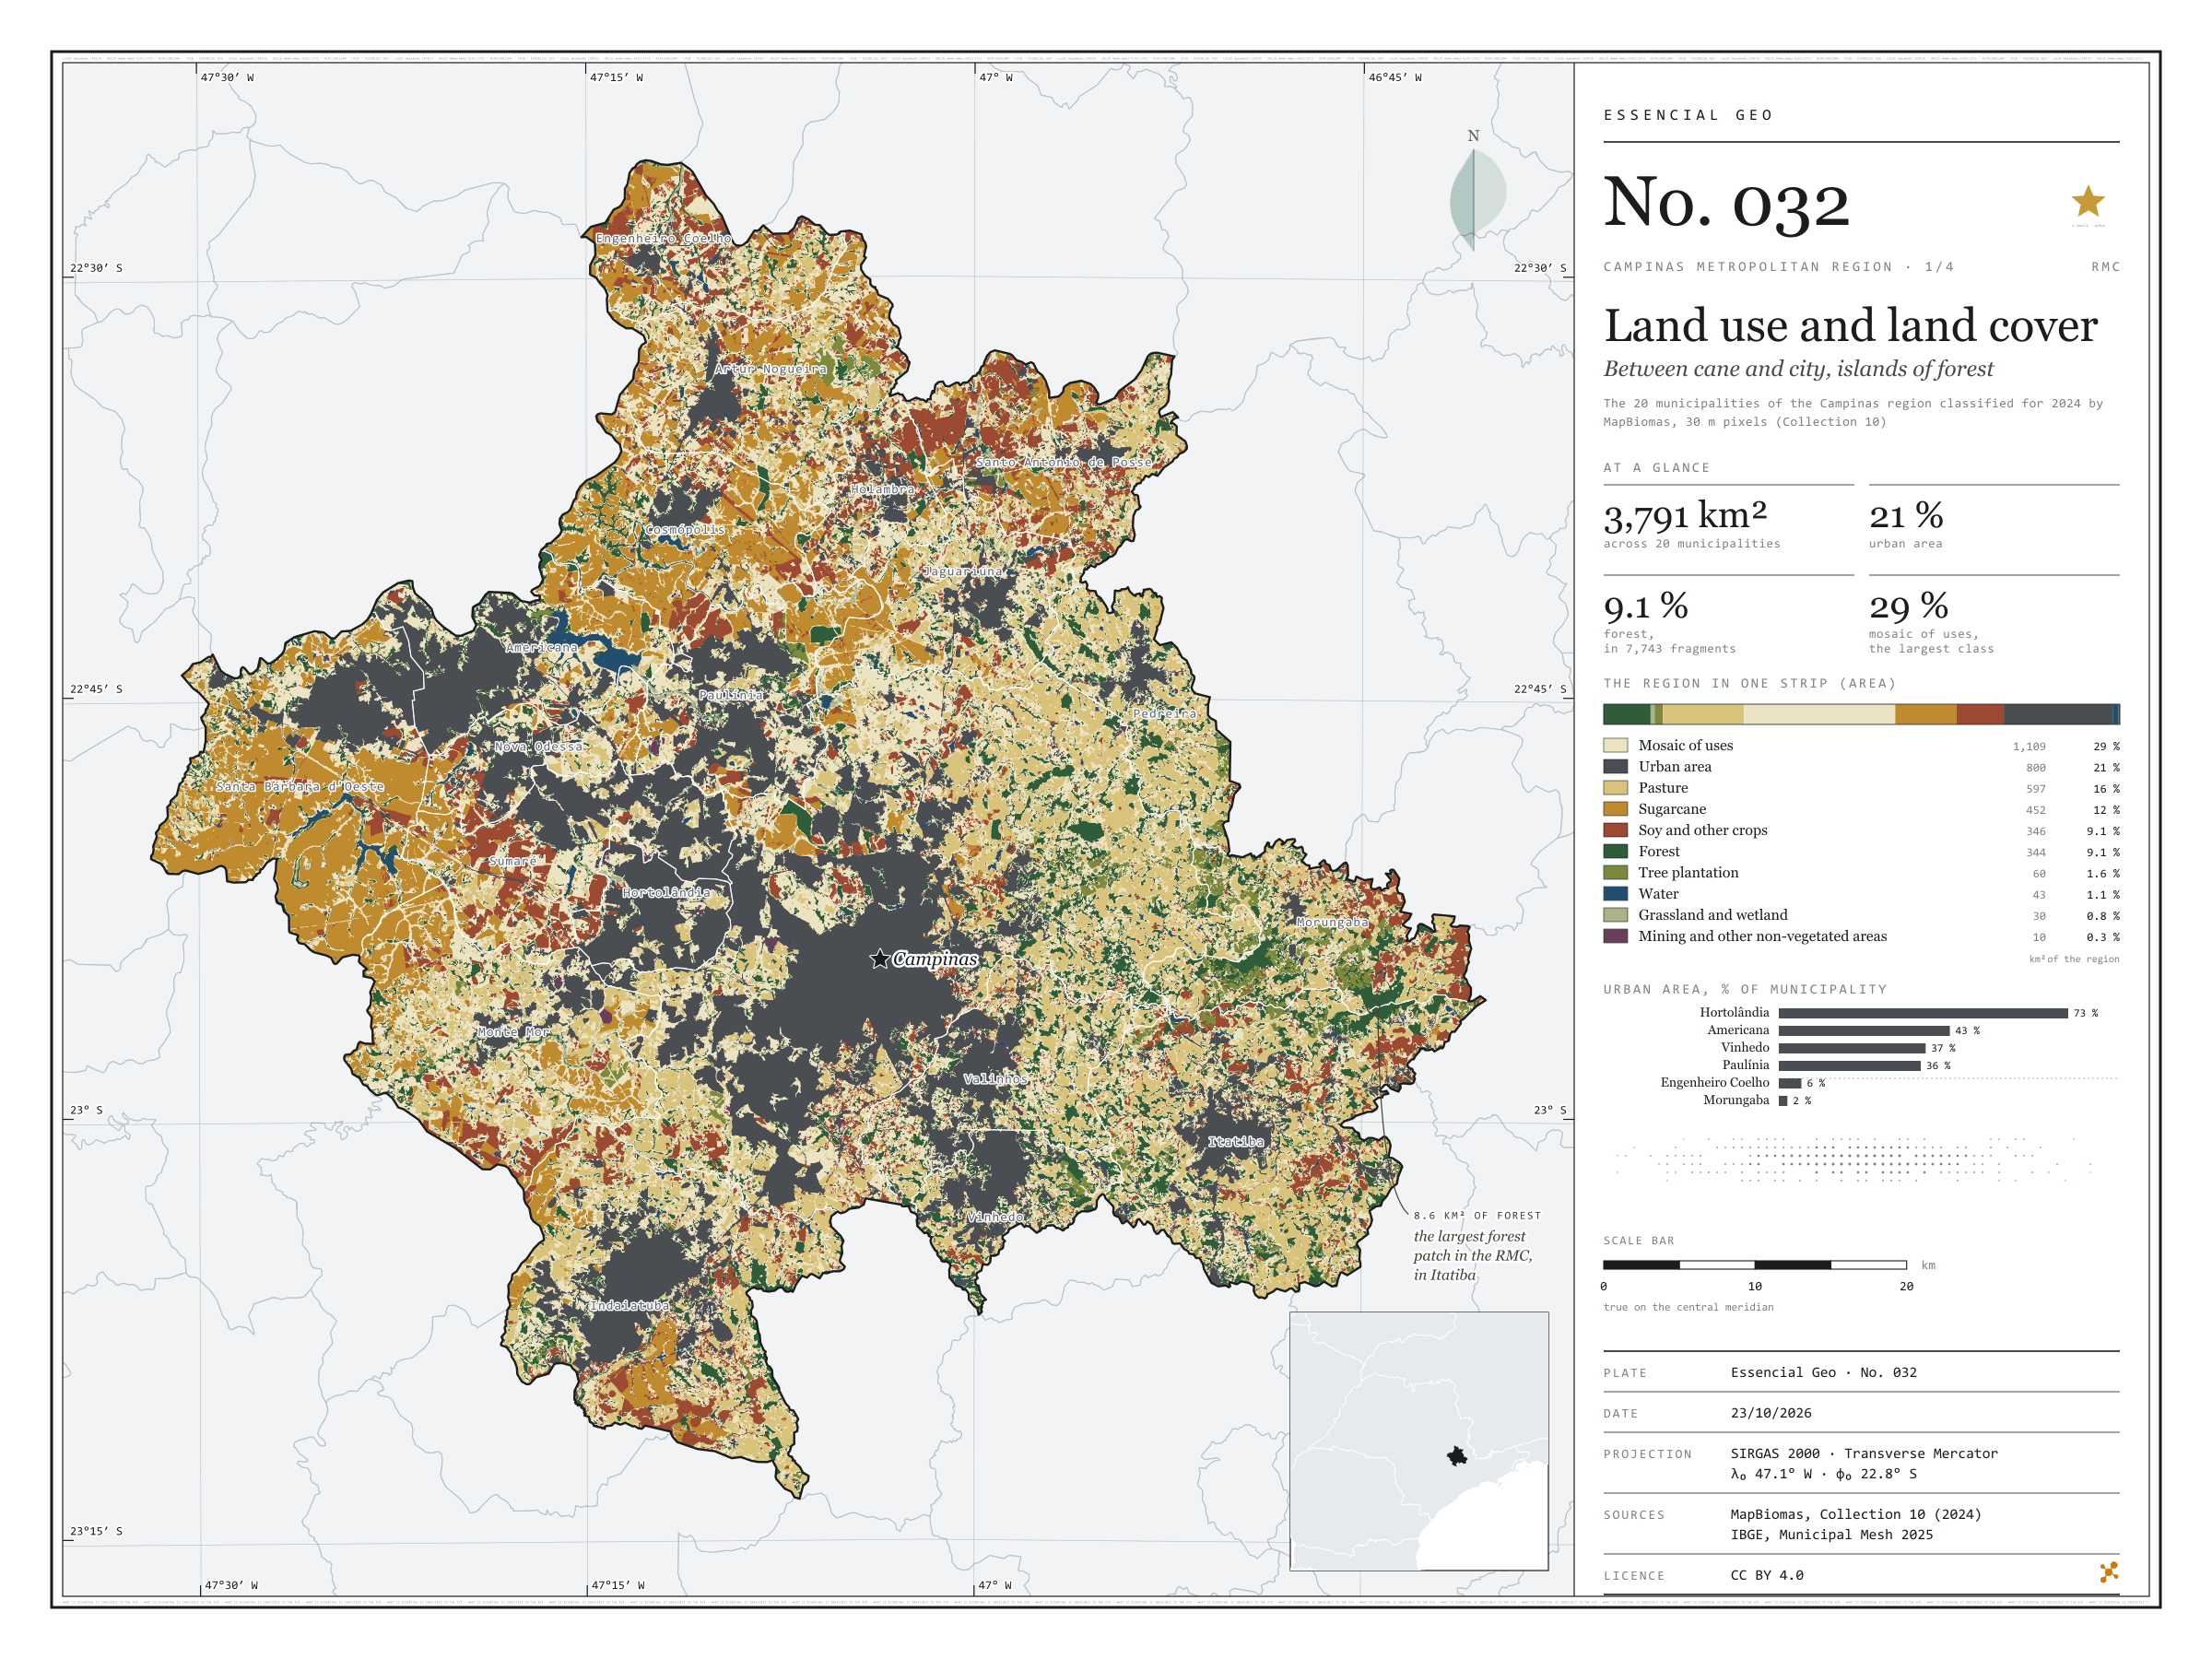
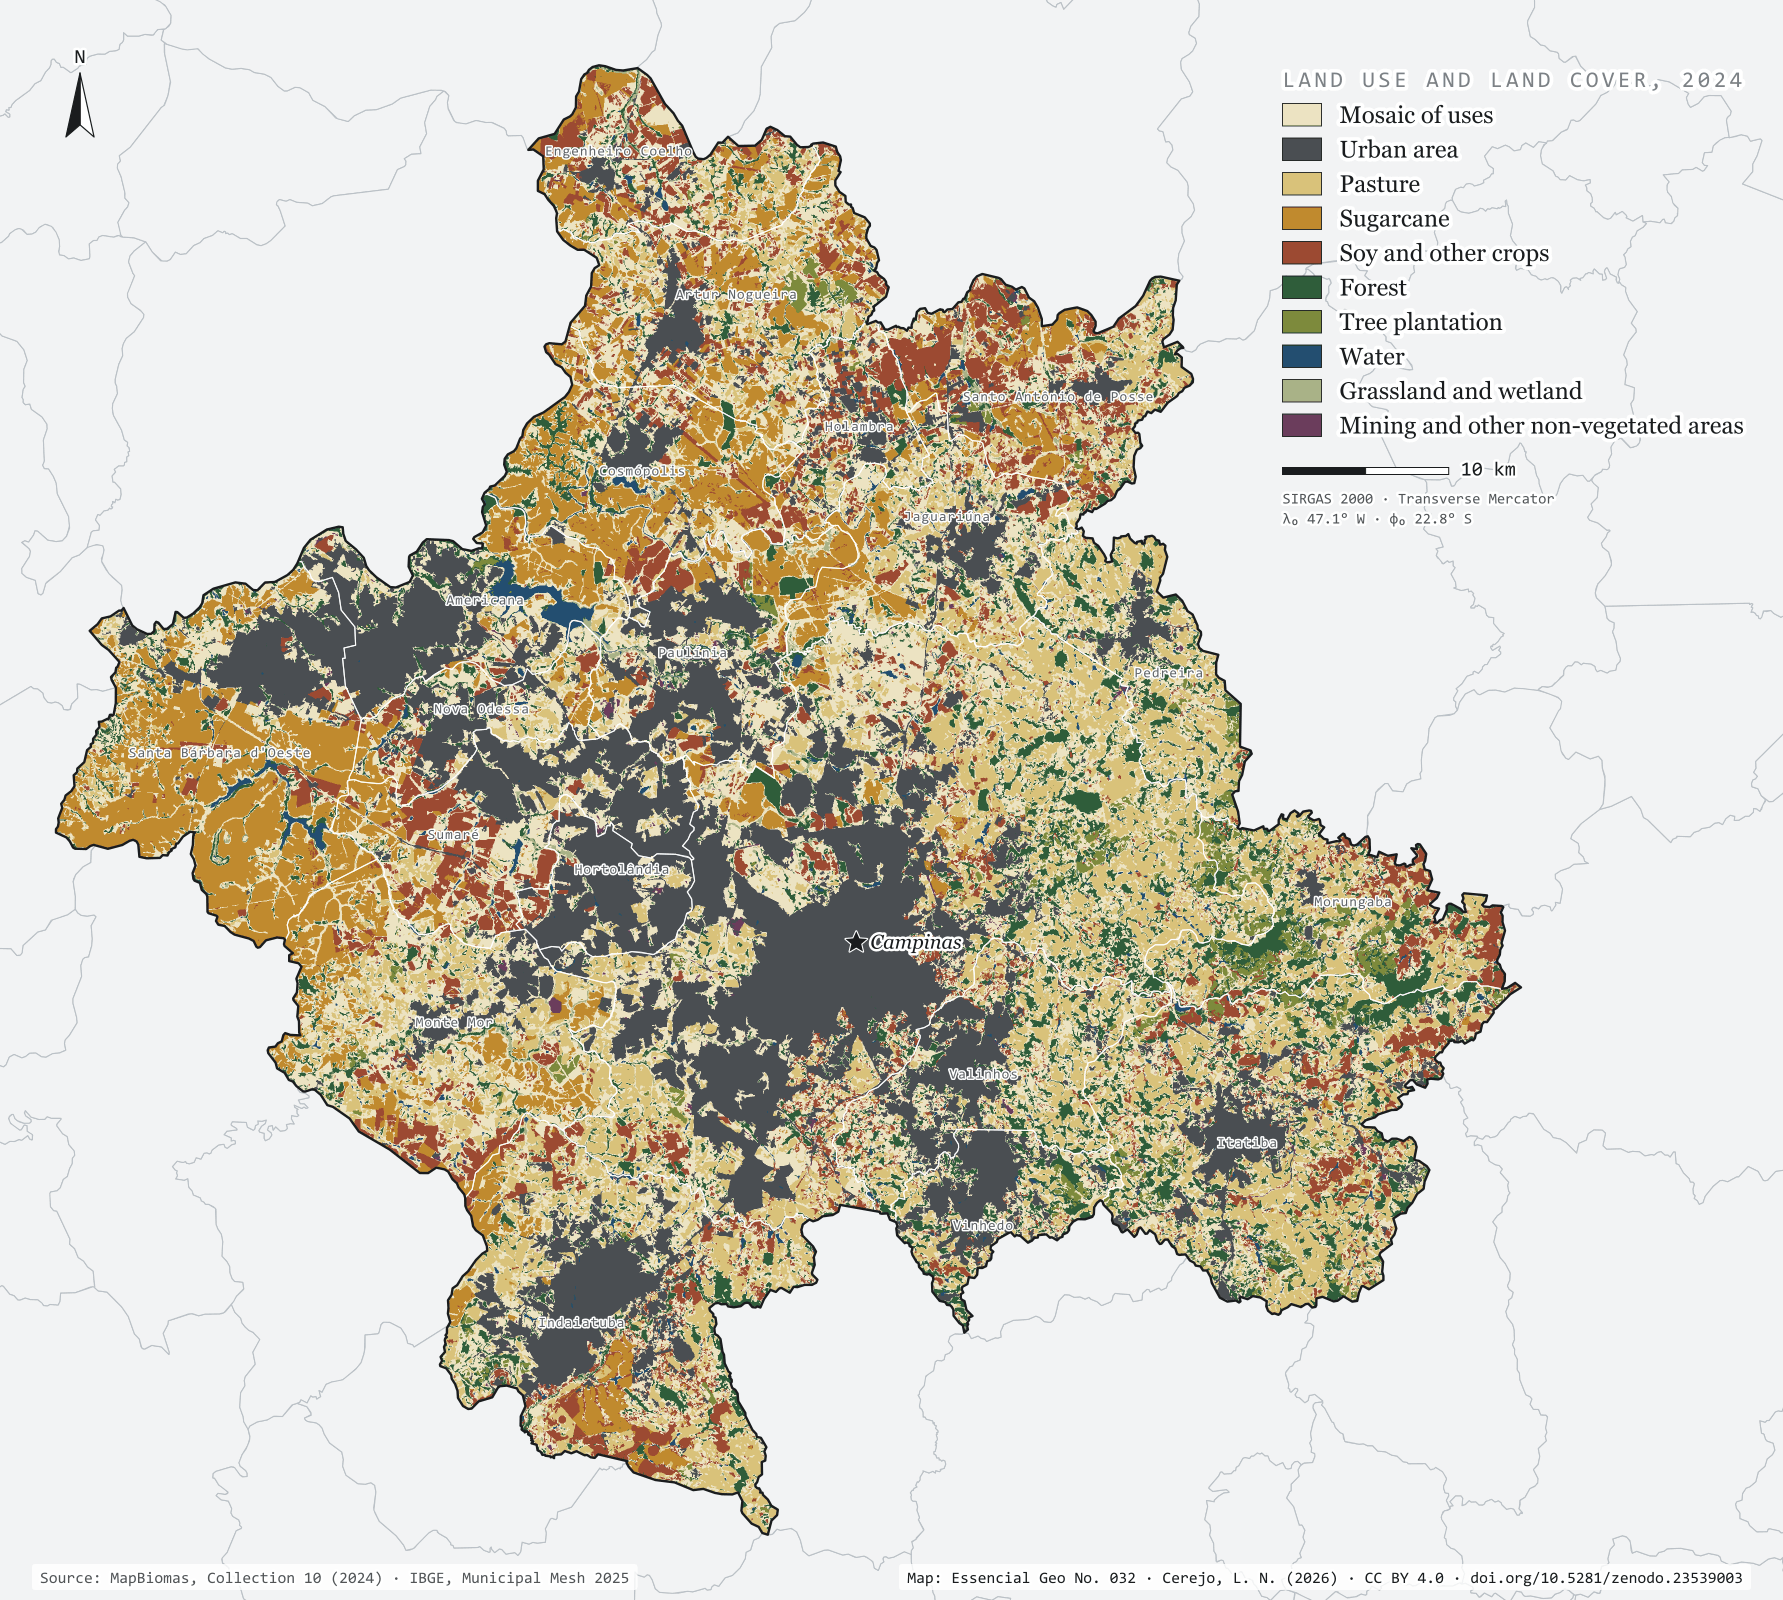
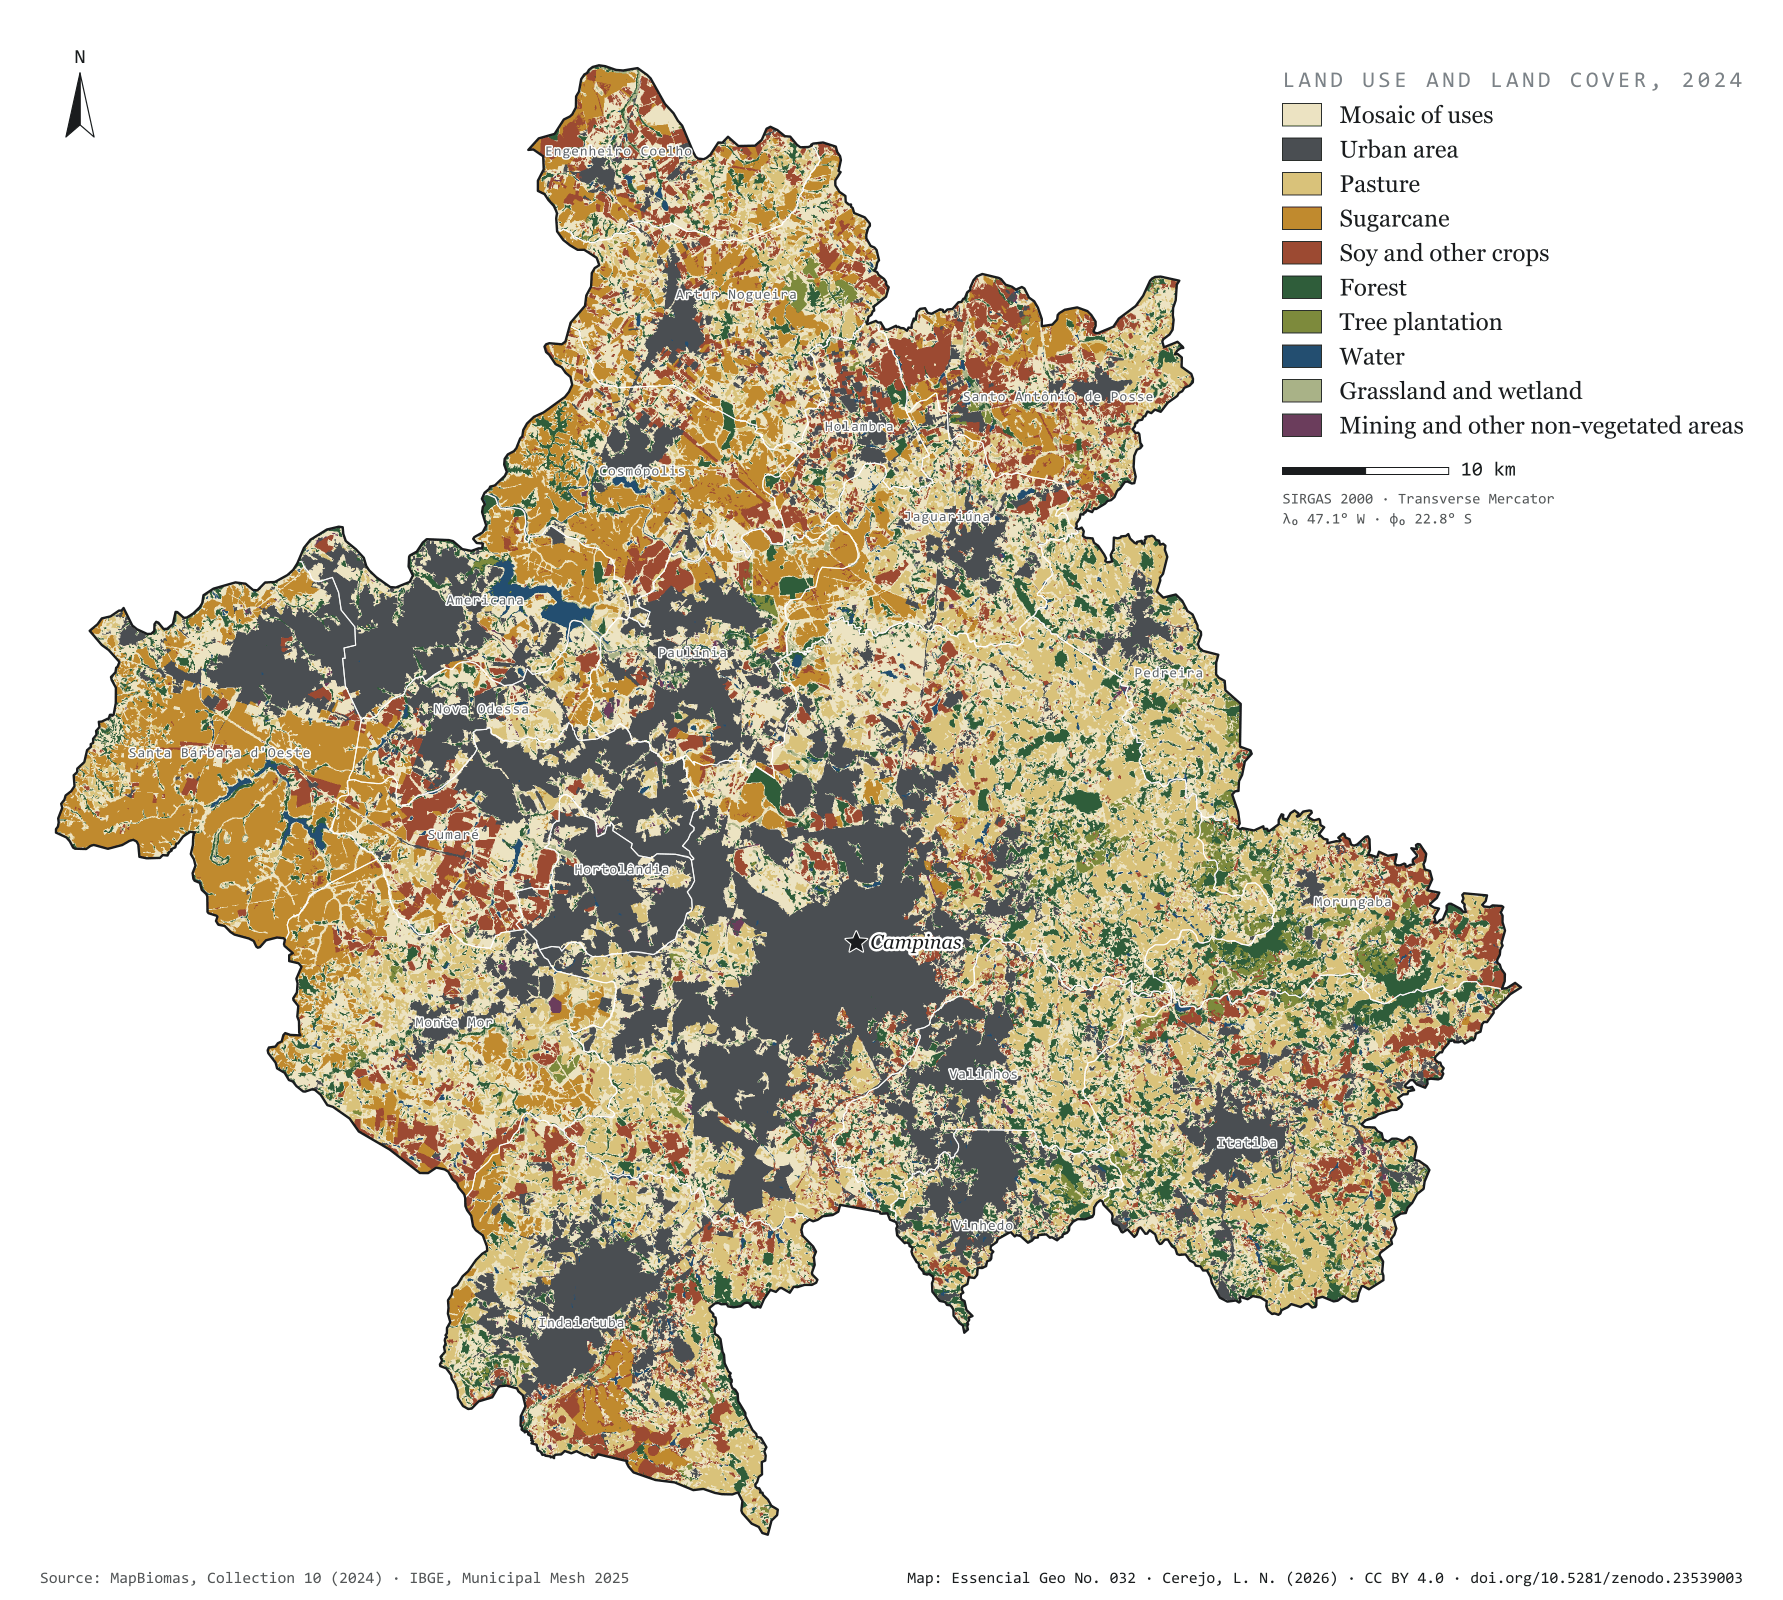
Figure to reuse
The map without a frame, with legend, scale, reference system and credit written on it: ready for papers, lectures and slides. In two versions: with the basemap (neighbours and sea) or only the mapped area, on white.
With basemap (PNG) Without basemap (PNG) QR code (SVG)
Point a camera at it to open this page.
How to cite
CEREJO, Lucas Nakamura. Uso e cobertura da terra: entre a cana e a cidade, ilhas de mata. Versão 1.0.0. [S. l.]: Zenodo, 2026. Conjunto de dados. DOI: 10.5281/zenodo.23539003. Disponível em: https://doi.org/10.5281/zenodo.23539003. Acesso em: 10 nov. 2026.
Cerejo, L. N. (2026). Uso e cobertura da terra: entre a cana e a cidade, ilhas de mata [Land use and land cover: Between cane and city, islands of forest] (Version 1.0.0) [Data set]. Zenodo. https://doi.org/10.5281/zenodo.23539003
@dataset{cerejo2026_uso_da_terra_rmc,
  author    = {Cerejo, Lucas Nakamura},
  title     = {Uso e cobertura da terra: Entre a cana e a cidade, ilhas de mata},
  year      = {2026},
  publisher = {Zenodo},
  version   = {1.0.0},
  doi       = {10.5281/zenodo.23539003},
  url       = {https://doi.org/10.5281/zenodo.23539003},
  language  = {portuguese},
  note      = {English title: Land use and land cover: Between cane and city, islands of forest. Licence CC BY 4.0}
}