Skip to content
Essencial

No. 033 Census · income Campinas Metropolitan Region 2/4

Households per km²

Half the homes on 3.4 % of the ground

Record, downloads and citation
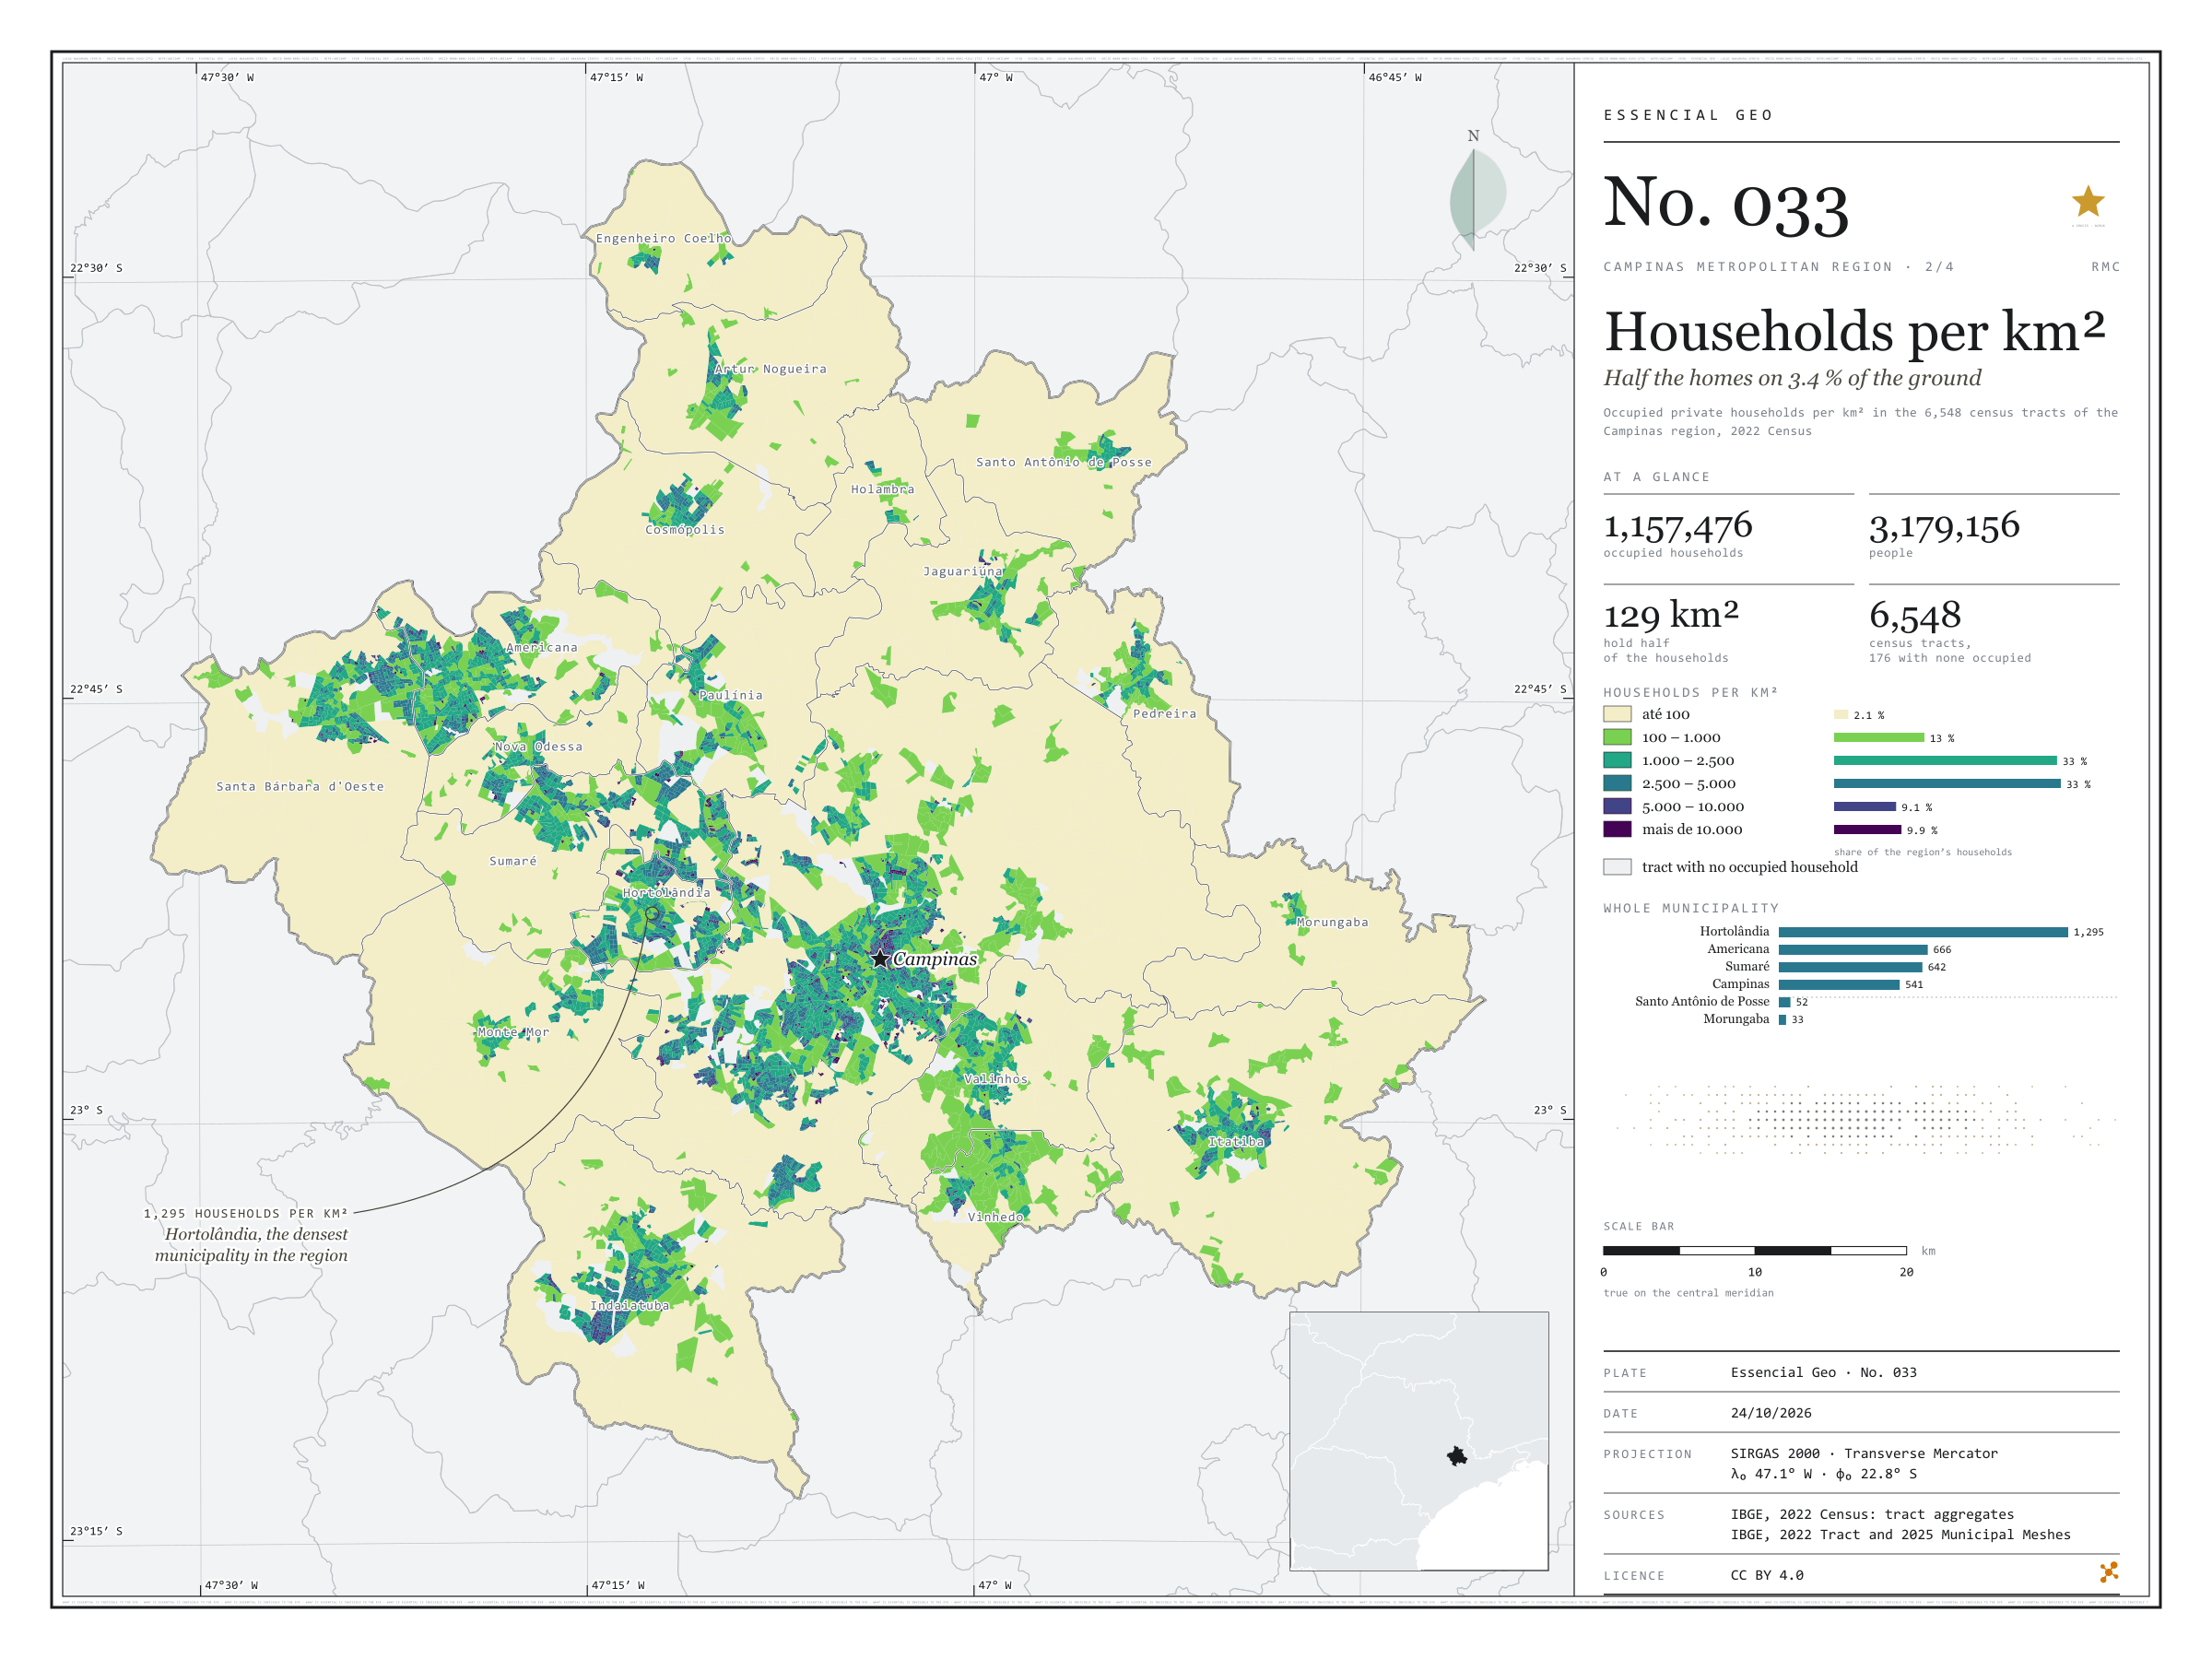
Fig. 033 Campinas Metropolitan Region (SP) EPSG:4674 Source: IBGE

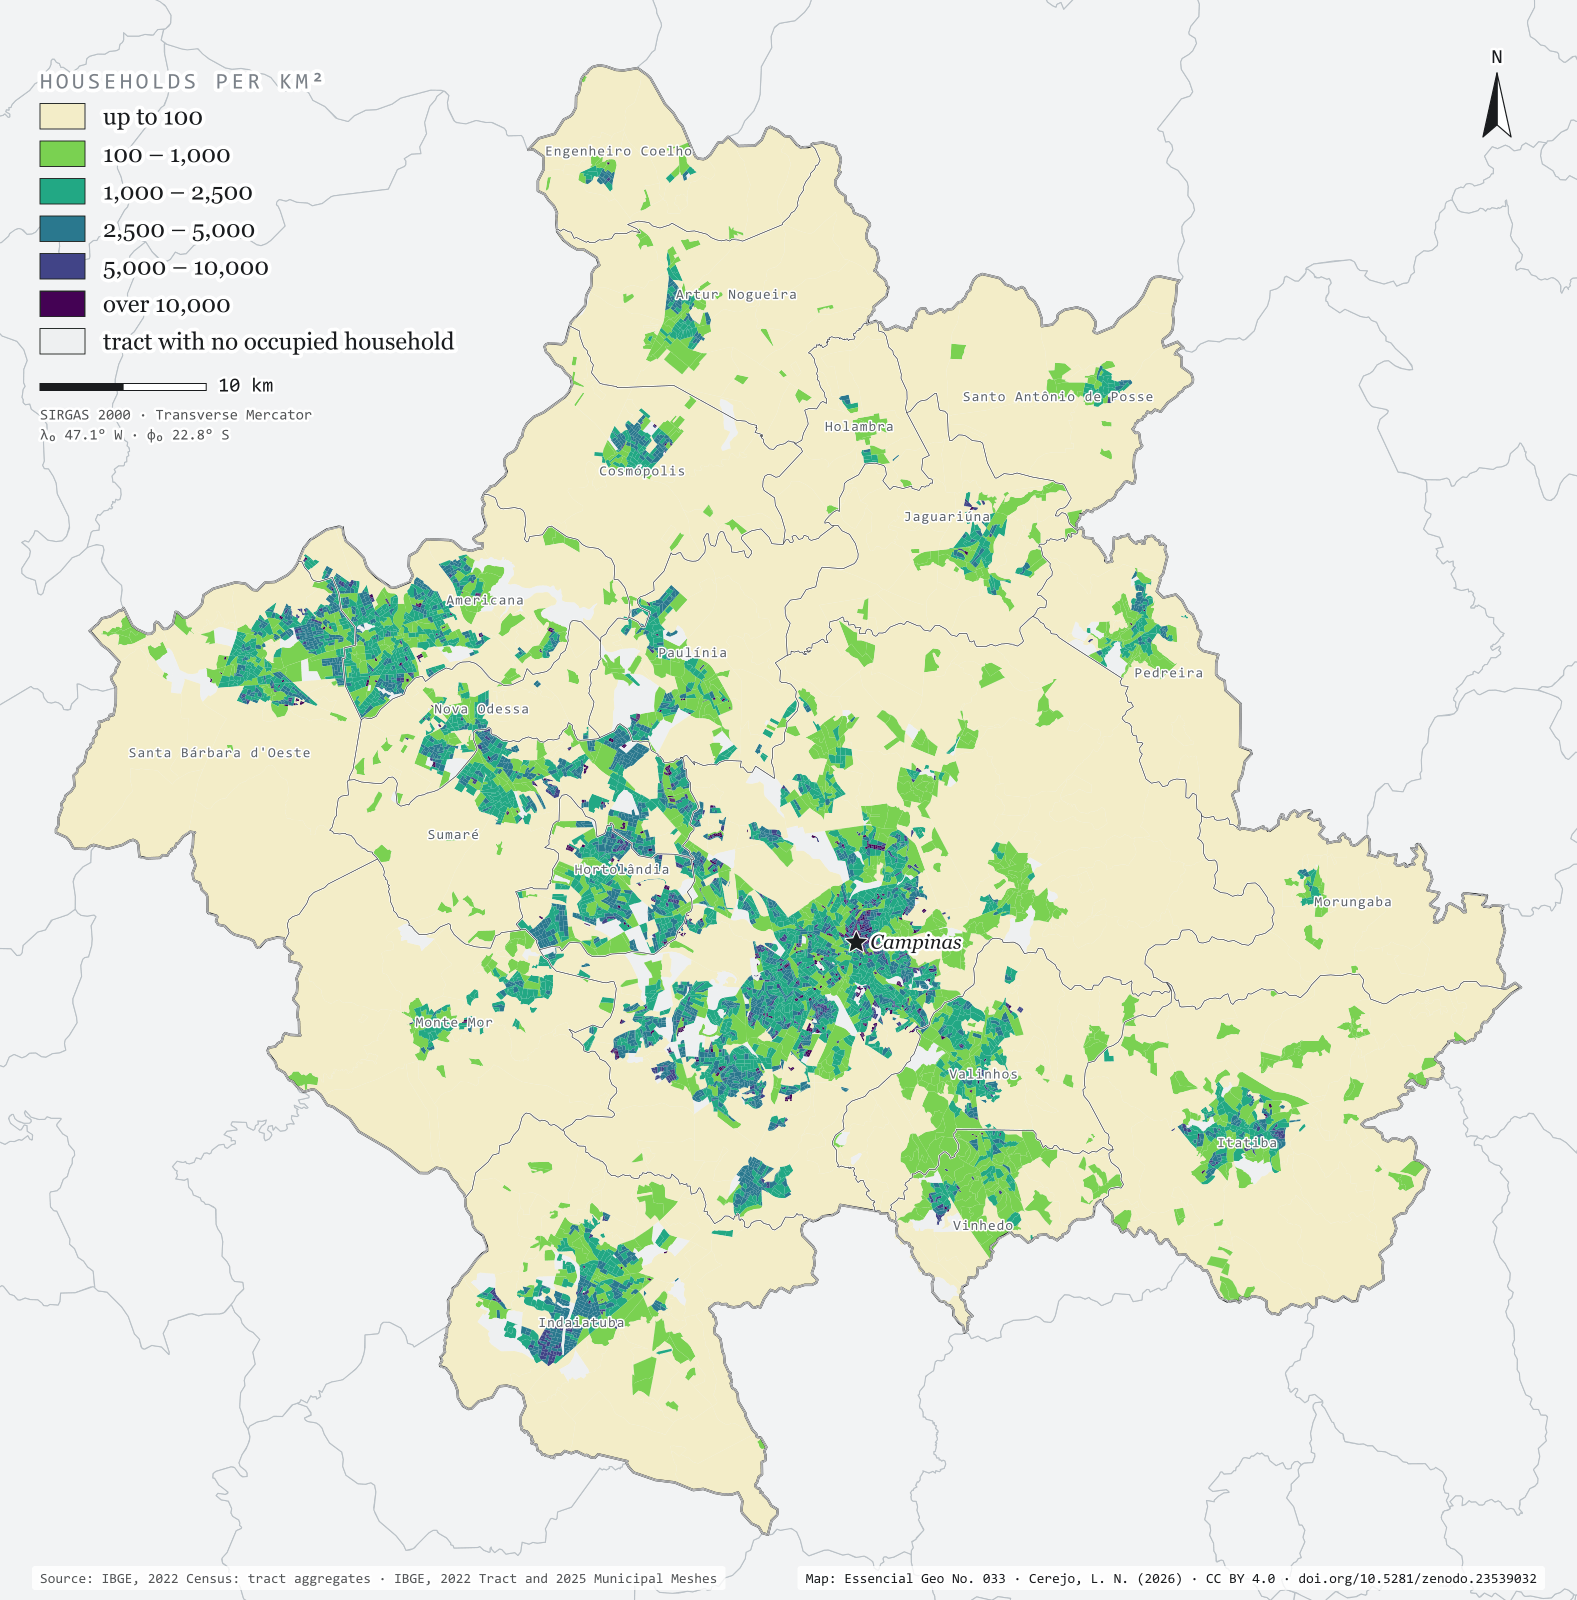
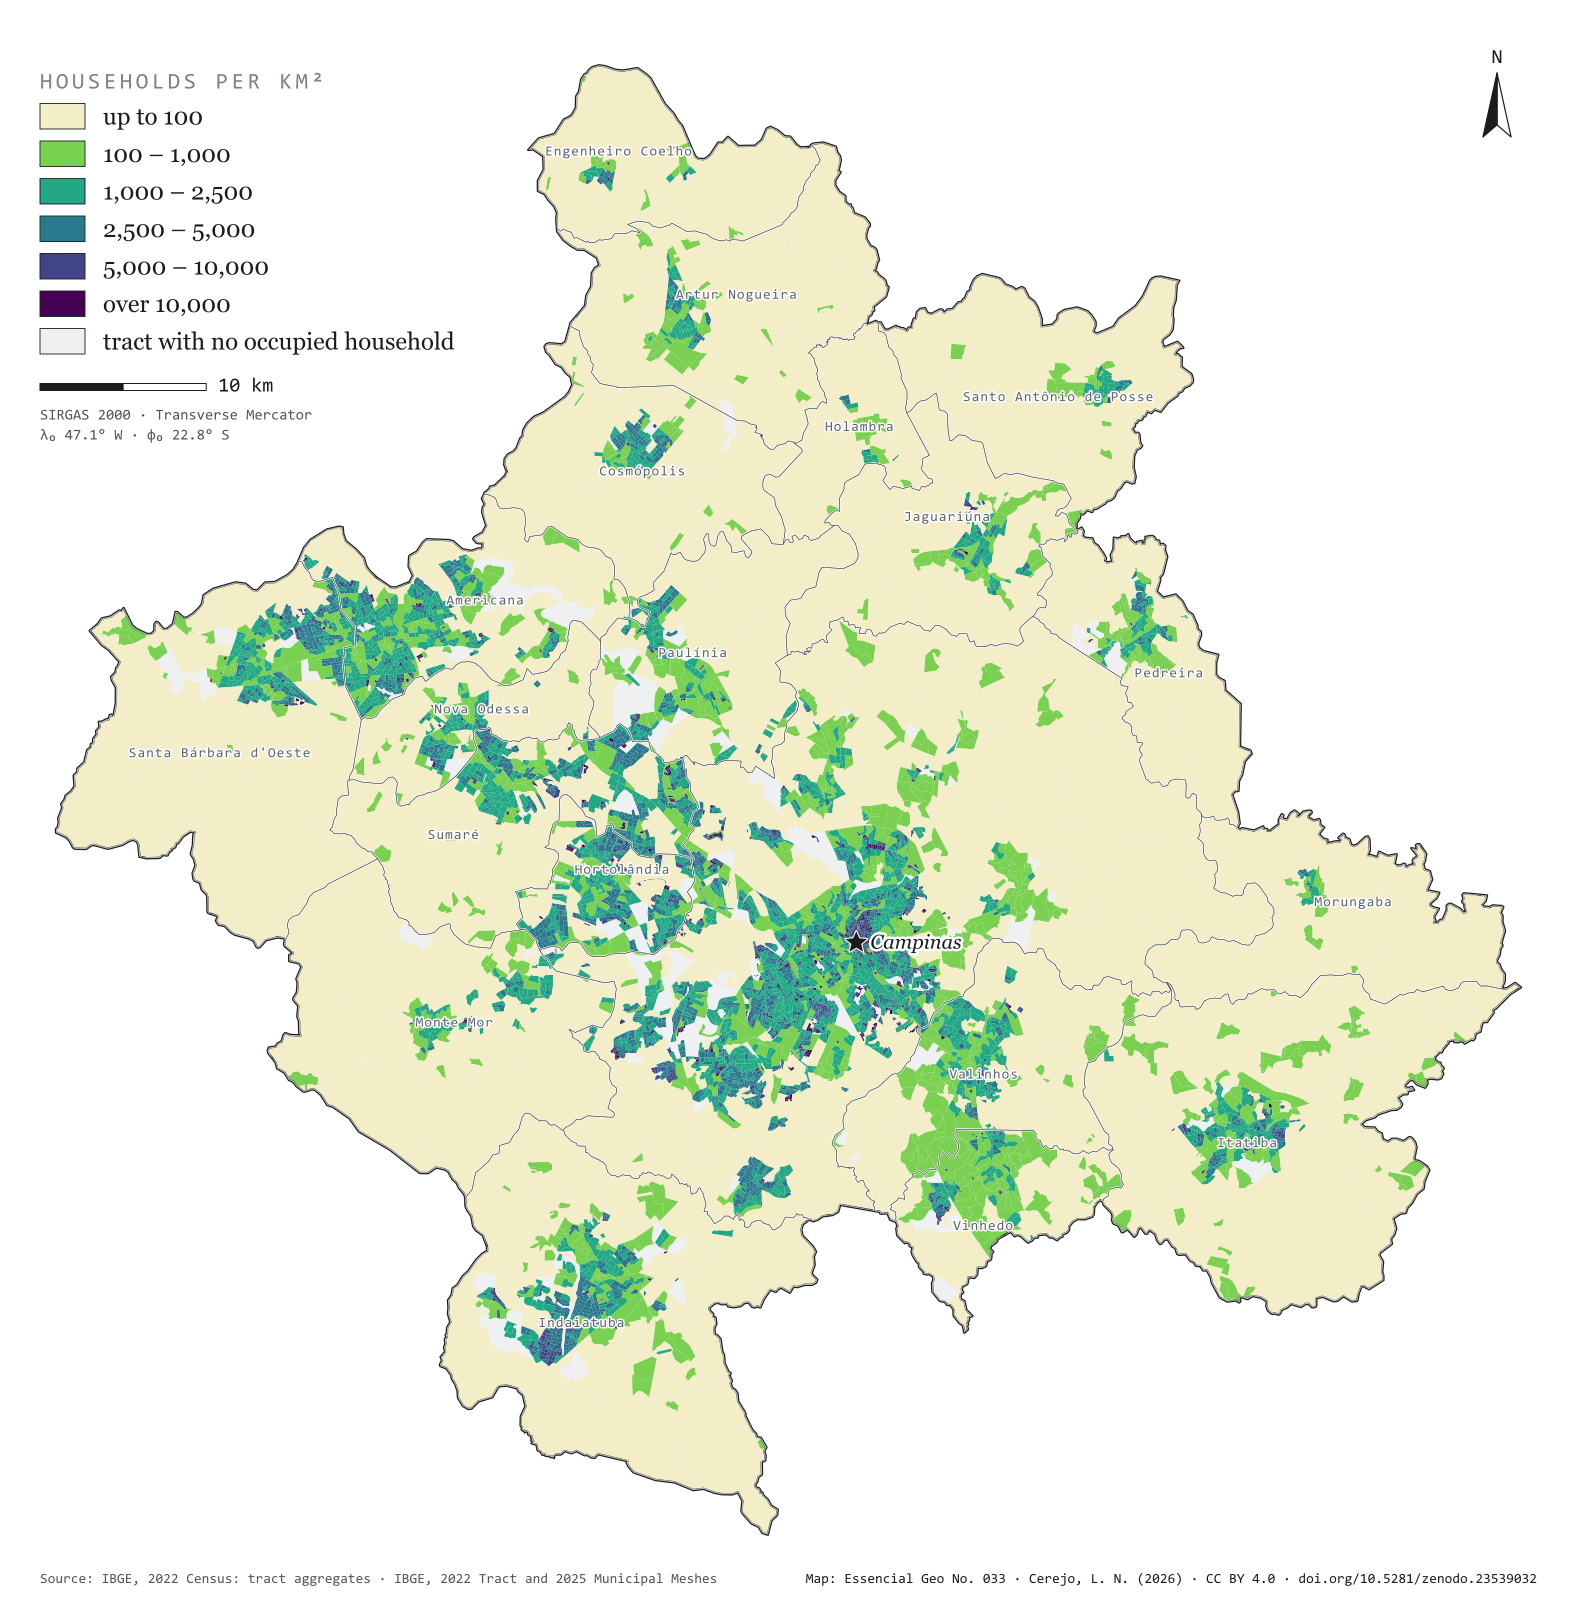
The 2022 Census counted 1,157,476 occupied households in the 20 municipalities of the Campinas Metropolitan Region, home to 3,179,156 people. Half of those homes fit into 129 km², 3.4% of the region’s area. The map colours each of the 6,548 census tracts by households per km² and shows the city in layers: central Campinas and the neighbourhoods of Sumaré, Hortolândia and Americana above 5,000, the fringe of housing estates between 1,000 and 5,000 and, all around, the countryside, below 100. Hortolândia is the densest municipality, with 1,295 households per km²; Morungaba the least dense, with 33. Second plate of the collection “Campinas Metropolitan Region”.

Technical record · downloads · citation

At a glance

The region’s households, by tract density (households per km²) (households)
  • até 100 2.1%
  • 100 – 1.000 13.2%
  • 1.000 – 2.500 32.6%
  • 2.500 – 5.000 33.2%
  • 5.000 – 10.000 9.1%
  • mais de 10.000 9.9%
Households per km², whole municipality (five densest) (households/km²)
  • Hortolândia 1,295
  • Americana 666
  • Sumaré 642
  • Campinas 541
  • Vinhedo 339
Area holding half the households

129 km²

3.4% of the region’s 3,791 km²

Layers

  • setores polygon 6,548 census tracts: urban/rural status, area, people, occupied households and households per km²
  • municipios polygon 20 municipalities: households, people, area, tracts and households per km²

Metadata

Extent
Campinas Metropolitan Region (SP)
CRS / Projection
SIRGAS 2000 (EPSG:4674)
EPSG:4674
Software
Python · GeoPandas · GDAL · QGIS · Node.js · d3-geo
Method
Occupied private households in each 2022 Census tract divided by the tract’s area, in six fixed-break classes.
Version
v1.0.0
Licence
CC BY 4.0

Downloads

Figure to reuse

The map without a frame, with legend, scale, reference system and credit written on it: ready for papers, lectures and slides. In two versions: with the basemap (neighbours and sea) or only the mapped area, on white.

Point a camera at it to open this page.

How to cite

Cerejo, L. N. (2026). Domicílios por km²: metade dos lares em 3,4 % do chão [Households per km²: Half the homes on 3.4 % of the ground] (Version 1.0.0) [Data set]. Zenodo. https://doi.org/10.5281/zenodo.23539032

How to read this plate area, projection, scale, legend and source · 2 terms
1 Area
Campinas Metropolitan Region (SP) The area the plate covers. Outside it, neighbours and sea are drawn in grey, just for orientation.
2 Coordinates and projection
SIRGAS 2000 (EPSG:4674) The layers are in SIRGAS 2000; the drawing’s projection is written in the colophon at the foot of the panel.
3 Scale
Graphic scale bar in the panel The scale bar is true on the central meridian; away from it, measured distances vary a little.
4 Legend and layers
2 layers in the GeoPackage · polygon Read the legend before the map: it tells you whether a colour is a rate or a class, and whether a circle is a total.
5 Sources
IBGE (2022); IBGE (2025) Every figure comes from a public source, with its year. The data sheet gives each one’s address.

Terms on this plate

Census tract
The smallest collection area of the IBGE Census, a few hundred households each. It is the finest grain at which income, sanitation and housing can be seen without identifying anyone.
2022 Census
IBGE’s door-to-door count. Results by census tract give residents, age, household-head income, water, sewerage and rubbish.

Download

Layers, table and figures, under CC BY 4.0. Cite with the DOI.

Full record and citation

Method notes · No. 033

Households per km² in the census tracts of the Campinas Metropolitan Region

Português · English

Plate No. 033, the second of four in the collection Campinas Metropolitan Region: after the ground seen from the satellite, where people live, tract by tract.

What the files contain

Layer (GPKG)GeometryContents
setorespolygon6,548 tracts: CD_SETOR, CD_MUN, NM_MUN, NM_BAIRRO, situacao (urban or rural), area_km2, pessoas (people), domicilios_ocupados, dom_km2
municipiospolygon20 municipalities: domicilios, pessoas, area_km2, setores, dom_km2

The GPKG is zipped and attached to the rmc-2026 release. The setores layer carries the plate’s QGIS style (densidade), and municipios an outline style with each municipality’s name, to lay on top.

The CSV holds the tract table in UTF-8, without geometry.

Method

  1. IBGE’s 2022 Census Tract Mesh, filtered to the region’s 20 municipalities.
  2. People and occupied private households in each tract, from the 2022 Census tract aggregates.
  3. Density = occupied households ÷ tract area (the area given by IBGE in the mesh).
  4. Six round, fixed breaks: up to 100, 100 to 1,000, 1,000 to 2,500, 2,500 to 5,000, 5,000 to 10,000 and over 10,000 households per km². The breaks are the same across the region, so that municipalities can be compared.
  5. Half the households: tracts are sorted from densest to least dense, and their areas added up until they hold 50% of the households.
  6. In the panel, the density of a whole municipality adds up the households and areas of its tracts.

Limitations

  • A census tract is a collection unit, not a regular grid: large rural tracts dilute a whole village into a low density, and small urban tracts of tower blocks jump to the top class.
  • Only occupied private households are counted; vacant, occasional-use and collective dwellings (care homes, barracks, lodgings) are left out.
  • 176 tracts have no occupied household (industrial areas, parks and other places without homes) and appear in light grey.
  • IBGE’s statistical grid, in regular cells, would give a different picture; the tract was kept because that is where the Census publishes the income shown in the next plate.

View this map’s folder on GitHub

Technical record

Technical record · No. 033

Households per km²

At a glance

The region’s households, by tract density (households per km²) (households)
  • até 100 2.1%
  • 100 – 1.000 13.2%
  • 1.000 – 2.500 32.6%
  • 2.500 – 5.000 33.2%
  • 5.000 – 10.000 9.1%
  • mais de 10.000 9.9%
Households per km², whole municipality (five densest) (households/km²)
  • Hortolândia 1,295
  • Americana 666
  • Sumaré 642
  • Campinas 541
  • Vinhedo 339
Area holding half the households

129 km²

3.4% of the region’s 3,791 km²

Layers

  • setores polygon 6,548 census tracts: urban/rural status, area, people, occupied households and households per km²
  • municipios polygon 20 municipalities: households, people, area, tracts and households per km²

Metadata

Extent
Campinas Metropolitan Region (SP)
CRS / Projection
SIRGAS 2000 (EPSG:4674)
EPSG:4674
Software
Python · GeoPandas · GDAL · QGIS · Node.js · d3-geo
Method
Occupied private households in each 2022 Census tract divided by the tract’s area, in six fixed-break classes.
Version
v1.0.0
Licence
CC BY 4.0

Downloads

Figure to reuse

The map without a frame, with legend, scale, reference system and credit written on it: ready for papers, lectures and slides. In two versions: with the basemap (neighbours and sea) or only the mapped area, on white.

Point a camera at it to open this page.

How to cite

Cerejo, L. N. (2026). Domicílios por km²: metade dos lares em 3,4 % do chão [Households per km²: Half the homes on 3.4 % of the ground] (Version 1.0.0) [Data set]. Zenodo. https://doi.org/10.5281/zenodo.23539032

100%