Skip to content
Essencial

No. 029 Energy · biomass Bioenergy in São Paulo 2/4

Livestock

Three herds, three geographies

Record, downloads and citation
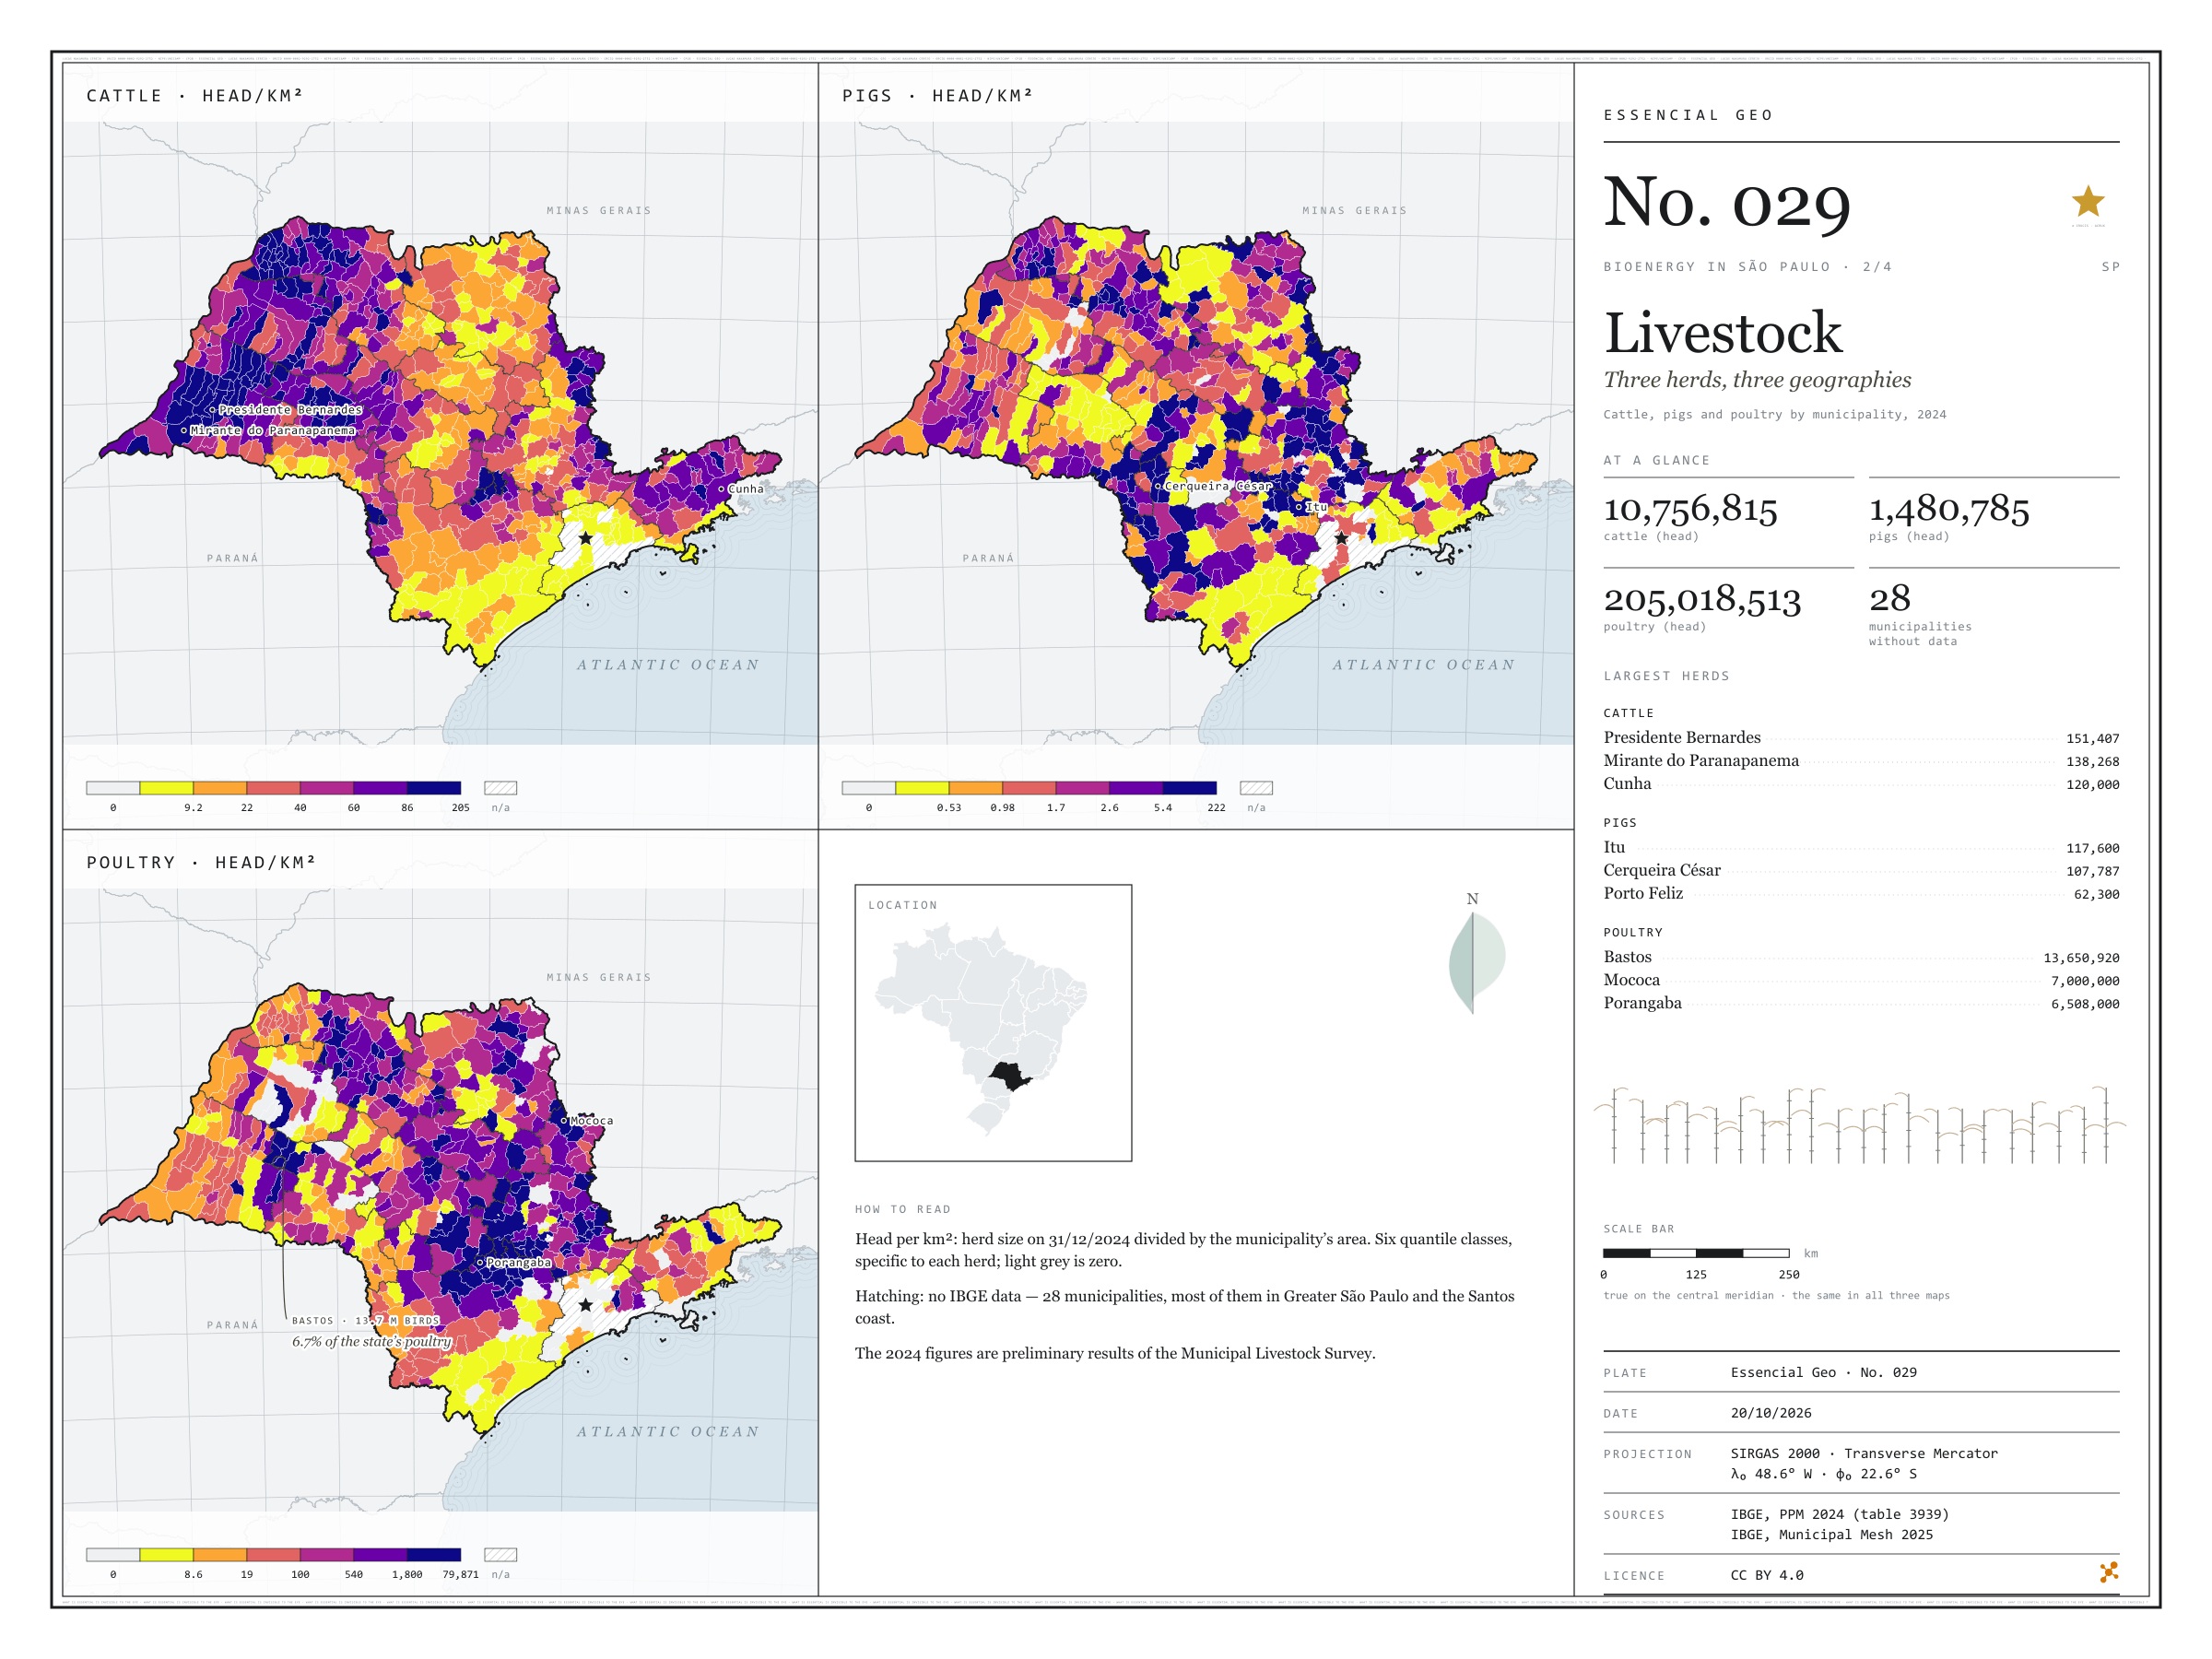
Fig. 029 São Paulo state (SP) EPSG:4674 Source: IBGE

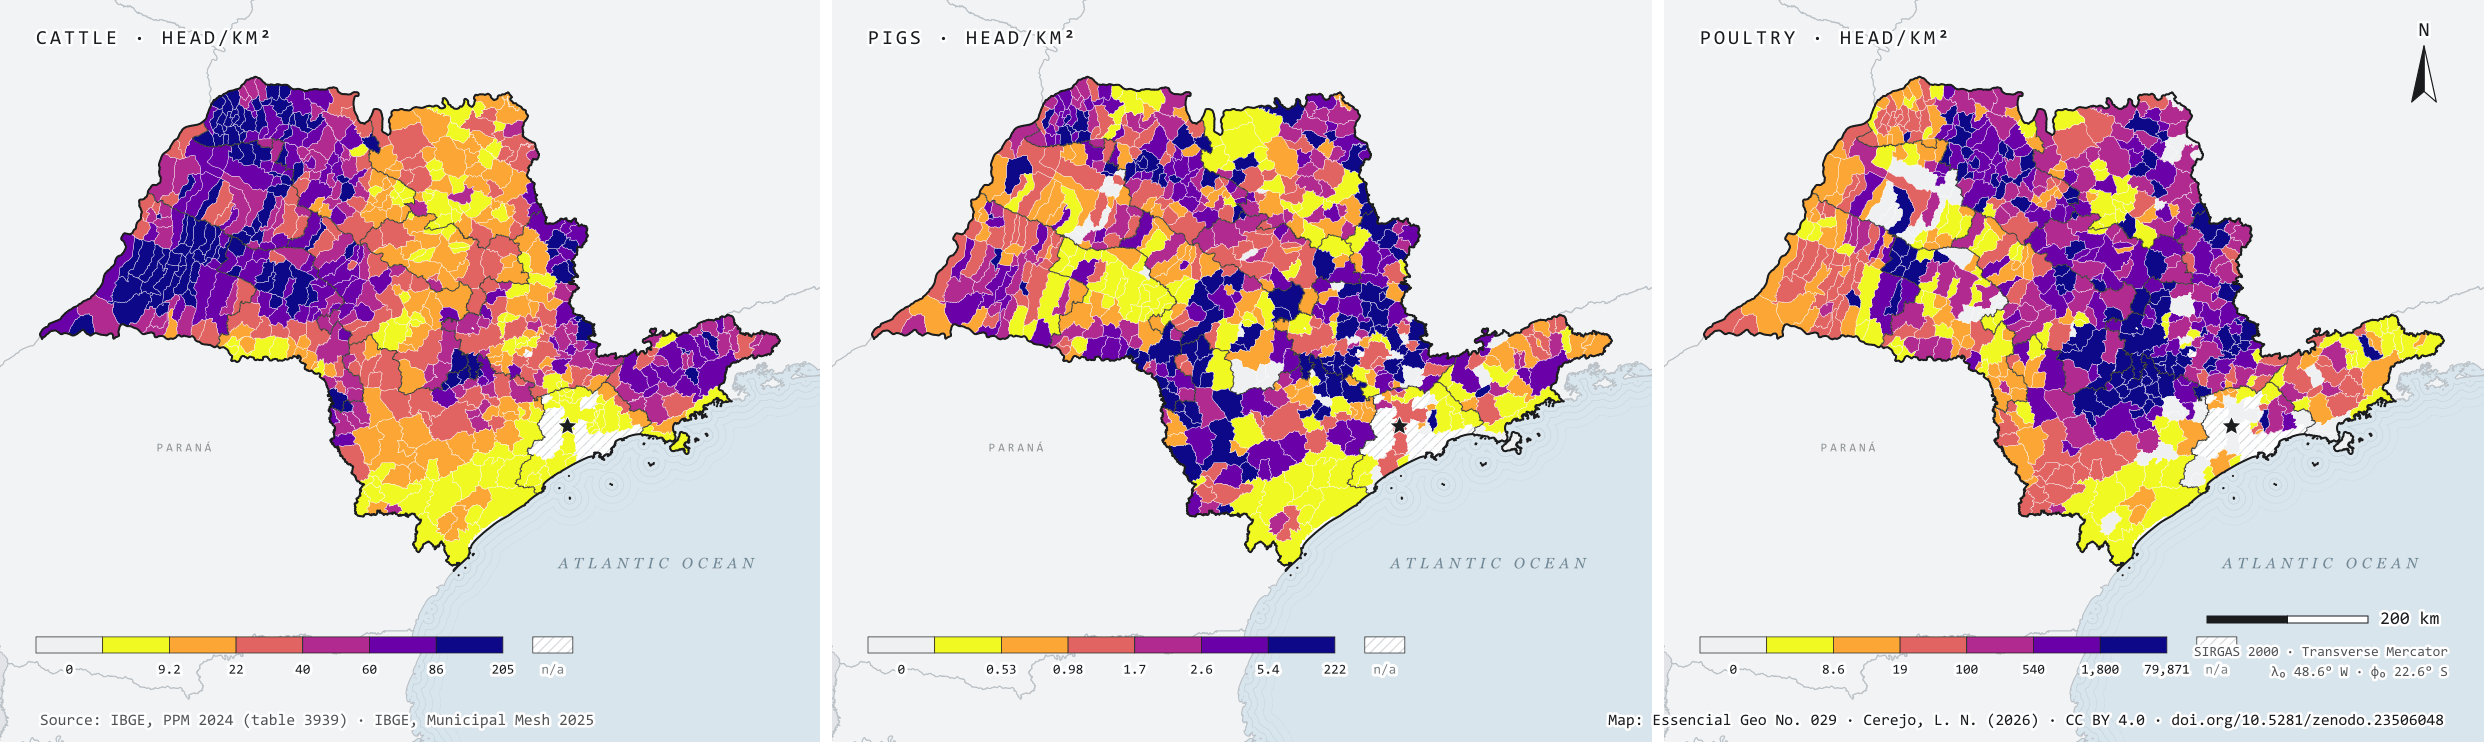
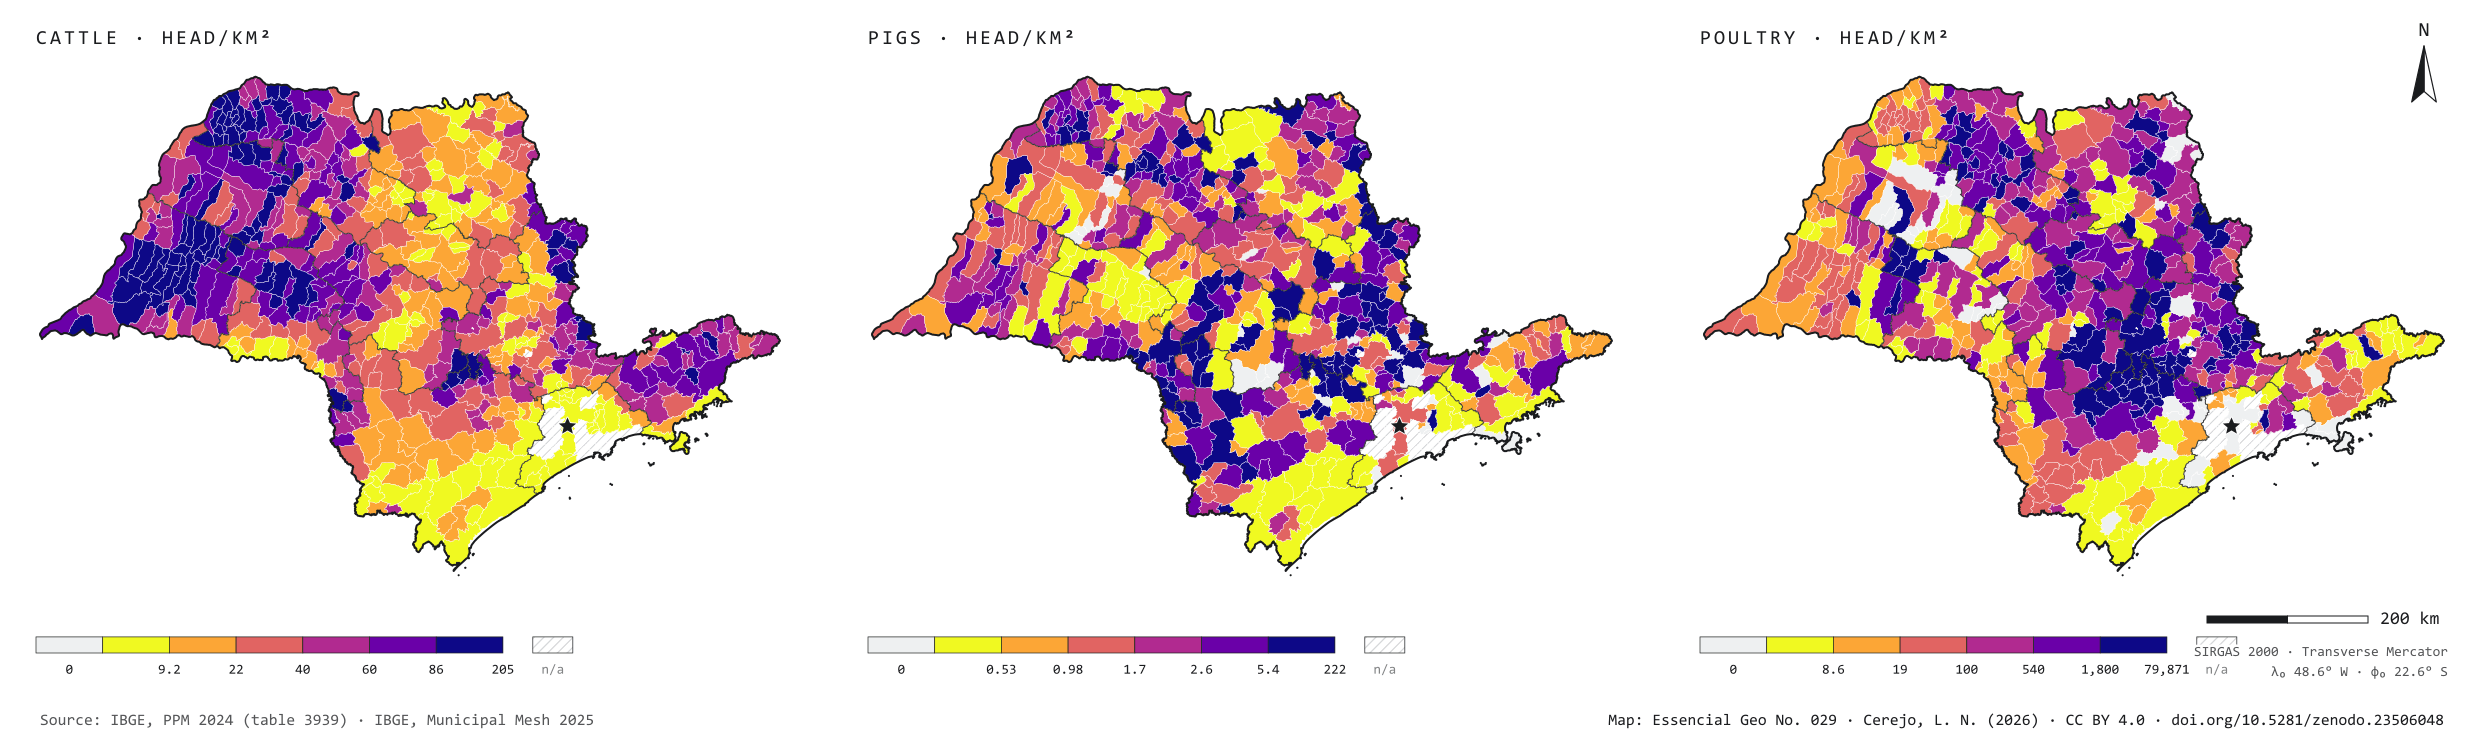
In 2024, São Paulo state held 10.8 million cattle, 1.5 million pigs and 205 million poultry. Side by side, the three herds occupy the state in different ways: cattle spread across the west, led by Presidente Bernardes (151,407 head) and Mirante do Paranapanema (138,268); pigs gather in a few hubs, such as Itu and Cerqueira César, each with over 100,000 head; and poultry cluster in farms, with Bastos alone holding 13.7 million birds. For anyone thinking about biogas, density matters more than the total: many animals on little land also concentrate the manure. Second plate of the collection “Bioenergy in São Paulo”.

Technical record · downloads · citation

At a glance

Cattle

10,756,815 head

617 municipalities with cattle; largest herd: Presidente Bernardes (151,407)

Pigs

1,480,785 head

584 municipalities with pigs; largest herd: Itu (117,600)

Poultry

205,018,513 head

572 municipalities with poultry; largest flock: Bastos (13,650,920)

Layers

  • municipios polygon 645 municipalities: herd size and density (head/km²) of cattle, pigs and poultry
  • regioes_intermediarias polygon 11 intermediate geographic regions
  • limite_estadual polygon State boundary

Metadata

Extent
São Paulo state (SP)
CRS / Projection
SIRGAS 2000 (EPSG:4674)
EPSG:4674
Software
Python · GeoPandas · GDAL · QGIS · Node.js · d3-geo
Method
Cattle, pig and poultry numbers from PPM 2024 joined to the Municipal Mesh by IBGE code and divided by municipal area; six quantile classes.
Version
v1.0.0
Licence
CC BY 4.0

Downloads

Figure to reuse

The map without a frame, with legend, scale, reference system and credit written on it: ready for papers, lectures and slides. In two versions: with the basemap (neighbours and sea) or only the mapped area, on white.

Point a camera at it to open this page.

How to cite

Cerejo, L. N. (2026). Rebanhos: três rebanhos, três geografias [Livestock: Three herds, three geographies] (Version 1.0.0) [Data set]. Zenodo. https://doi.org/10.5281/zenodo.23506048

How to read this plate area, projection, scale, legend and source · 1 terms
1 Area
São Paulo state (SP) The area the plate covers. Outside it, neighbours and sea are drawn in grey, just for orientation.
2 Coordinates and projection
SIRGAS 2000 (EPSG:4674) The layers are in SIRGAS 2000; the drawing’s projection is written in the colophon at the foot of the panel.
3 Scale
Graphic scale bar in the panel The scale bar is true on the central meridian; away from it, measured distances vary a little.
4 Legend and layers
3 layers in the GeoPackage · polygon Read the legend before the map: it tells you whether a colour is a rate or a class, and whether a circle is a total.
5 Sources
IBGE (2024); IBGE (2025) Every figure comes from a public source, with its year. The data sheet gives each one’s address.

Terms on this plate

Biogas
The gas from the airless breakdown (anaerobic digestion) of organic waste: manure, vinasse, sewage sludge, rubbish. It is 50% to 70% methane; the rest is mostly CO₂.

Download

Layers, table and figures, under CC BY 4.0. Cite with the DOI.

Full record and citation

Method notes · No. 029

Livestock — cattle, pigs and poultry in São Paulo, 2024

Português · English

Plate No. 029, the second of four in the collection Bioenergy in São Paulo: after the biogas plants, where the animals are whose manure can feed them.

What the files contain

Layer (GPKG)GeometryContents
municipiospolygon645 municipalities: CD_MUN, NM_MUN, intermediate region, area_km2, herd size (bovino, suino, galinaceos) and density in head/km² (dens_bovino, dens_suino, dens_galinaceos)
regioes_intermediariaspolygon11 intermediate geographic regions
limite_estadualpolygonoutline of the state

The GPKG is zipped and attached to the repository’s bioenergia-sp-2026 release, together with those of the other plates in the collection.

The GPKG carries its own QGIS styles. The municipios layer has three: densidade_bovino (the default, which opens when you drag the file into QGIS), densidade_suino and densidade_galinaceos. To switch, open the layer properties and pick another style under Style › Styles. Classes and colours match the plate; zero shows in light grey and “no data” in white, each with its own line in the legend.

The CSV holds the same municipal table, in UTF-8, without geometry. In both files an empty cell (NULL) means no data, and 0 means a zero reported by IBGE.

Method

  1. Table 3939 of the Municipal Livestock Survey on SIDRA: variable Efetivo dos rebanhos (head, on 31 December 2024), products Bovino, Suíno – total and Galináceos – total, municipal level, São Paulo state.
  2. Joined to IBGE’s 2025 Municipal Mesh by the seven-digit code.
  3. Density = herd size ÷ official municipal area (area_km2, from the mesh itself), to two decimal places.
  4. Classes: six quantiles of the municipalities with a positive herd, computed separately for each kind; limits are rounded to two significant figures, and the last one is the observed maximum. The table’s “-” symbol (absolute zero) becomes 0; “…” (not available) and municipalities missing from the table become no data.
  5. Intermediate regions and the state boundary are dissolved from the municipalities.
  6. On the plate, geometries are simplified as a coverage; the downloadable files keep IBGE’s original geometry.

Limitations

  • The 2024 figures are preliminary results of the PPM and may be revised by IBGE.
  • Herd size is a snapshot on 31 December, not the number slaughtered during the year. In broiler farming, which raises several batches a year, the snapshot falls short of the number of birds that pass through the farm.
  • Density uses the municipality’s total area, not the area of pasture or farms.
  • 28 municipalities have no data: 26 marked “…” in the table and 2 (Águas de São Pedro and São Caetano do Sul) missing from it. Nearly all are in Greater São Paulo and on the Santos coast.
  • Galináceos – total adds up cocks, hens, pullets, broilers and chicks: laying and meat birds together.

View this map’s folder on GitHub

Technical record

Technical record · No. 029

Livestock

At a glance

Cattle

10,756,815 head

617 municipalities with cattle; largest herd: Presidente Bernardes (151,407)

Pigs

1,480,785 head

584 municipalities with pigs; largest herd: Itu (117,600)

Poultry

205,018,513 head

572 municipalities with poultry; largest flock: Bastos (13,650,920)

Layers

  • municipios polygon 645 municipalities: herd size and density (head/km²) of cattle, pigs and poultry
  • regioes_intermediarias polygon 11 intermediate geographic regions
  • limite_estadual polygon State boundary

Metadata

Extent
São Paulo state (SP)
CRS / Projection
SIRGAS 2000 (EPSG:4674)
EPSG:4674
Software
Python · GeoPandas · GDAL · QGIS · Node.js · d3-geo
Method
Cattle, pig and poultry numbers from PPM 2024 joined to the Municipal Mesh by IBGE code and divided by municipal area; six quantile classes.
Version
v1.0.0
Licence
CC BY 4.0

Downloads

Figure to reuse

The map without a frame, with legend, scale, reference system and credit written on it: ready for papers, lectures and slides. In two versions: with the basemap (neighbours and sea) or only the mapped area, on white.

Point a camera at it to open this page.

How to cite

Cerejo, L. N. (2026). Rebanhos: três rebanhos, três geografias [Livestock: Three herds, three geographies] (Version 1.0.0) [Data set]. Zenodo. https://doi.org/10.5281/zenodo.23506048

100%