Skip to content
Essencial

No. 056 Energy · biomass Biogas on the ground 2/5

Beyond sugarcane

Without the cane, maize, poultry and the city appear

Record, downloads and citation
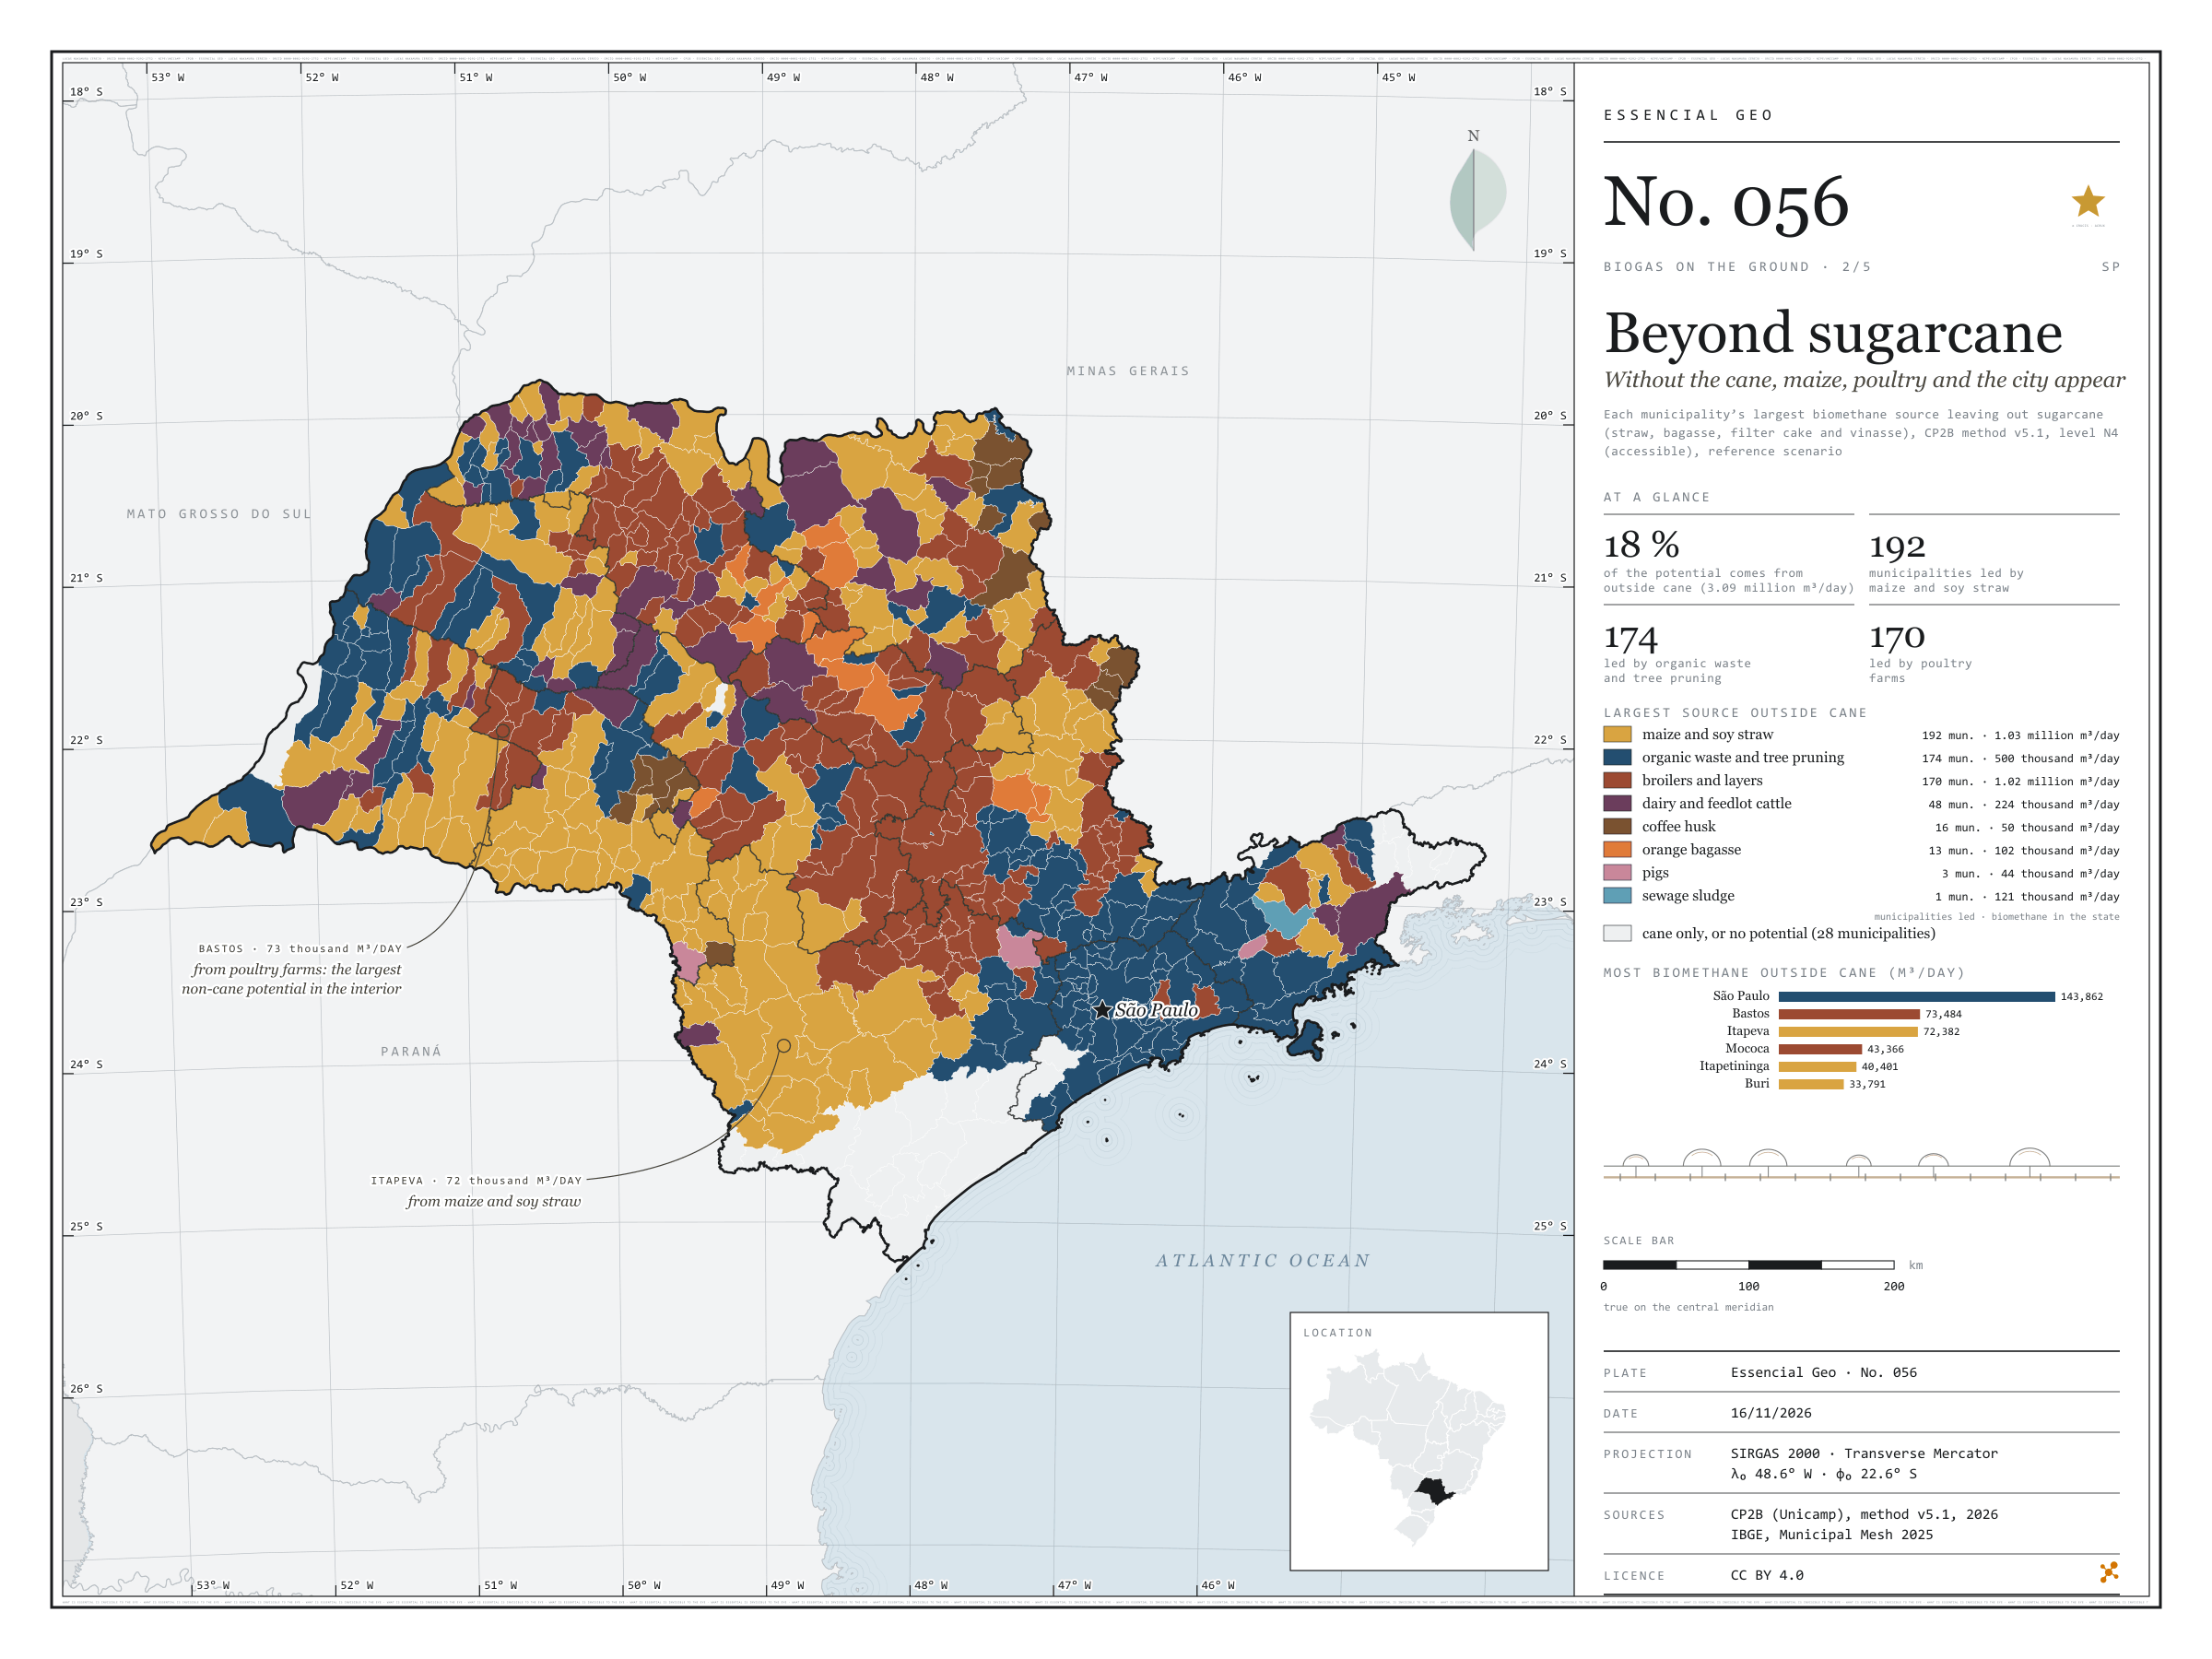
Fig. 056 São Paulo State (SP) EPSG:4674 Source: CP2B (Unicamp), IBGE

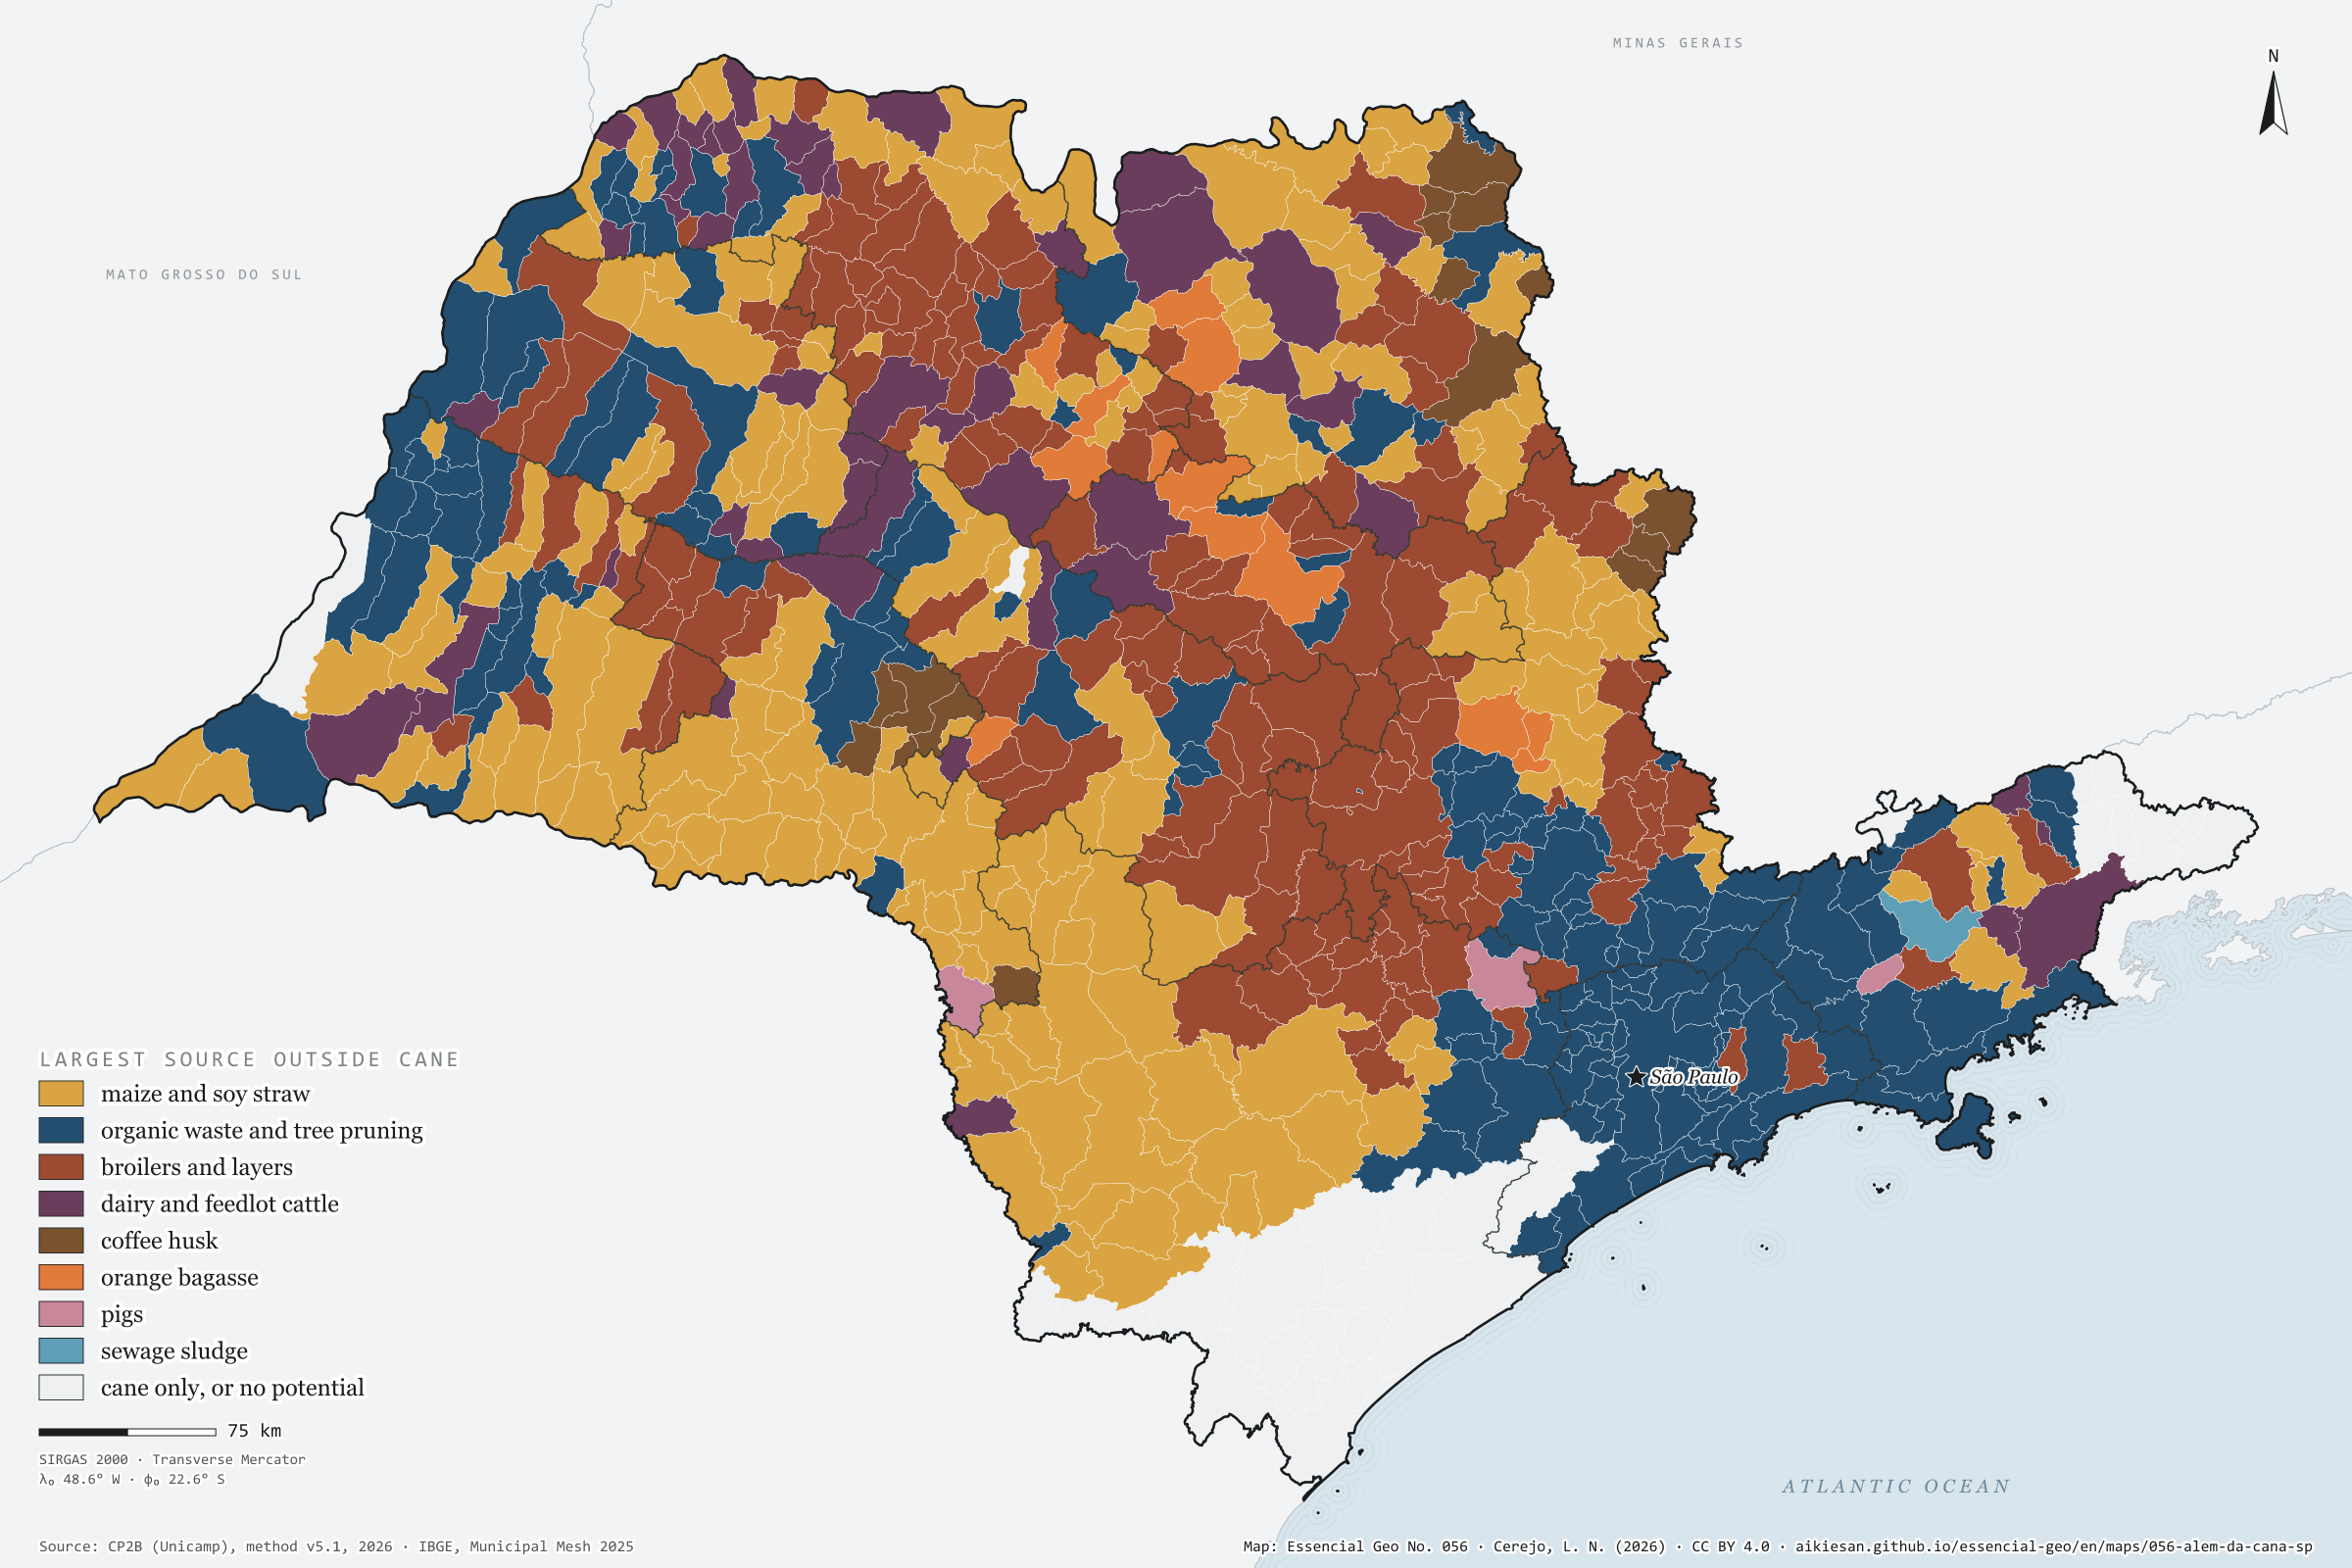
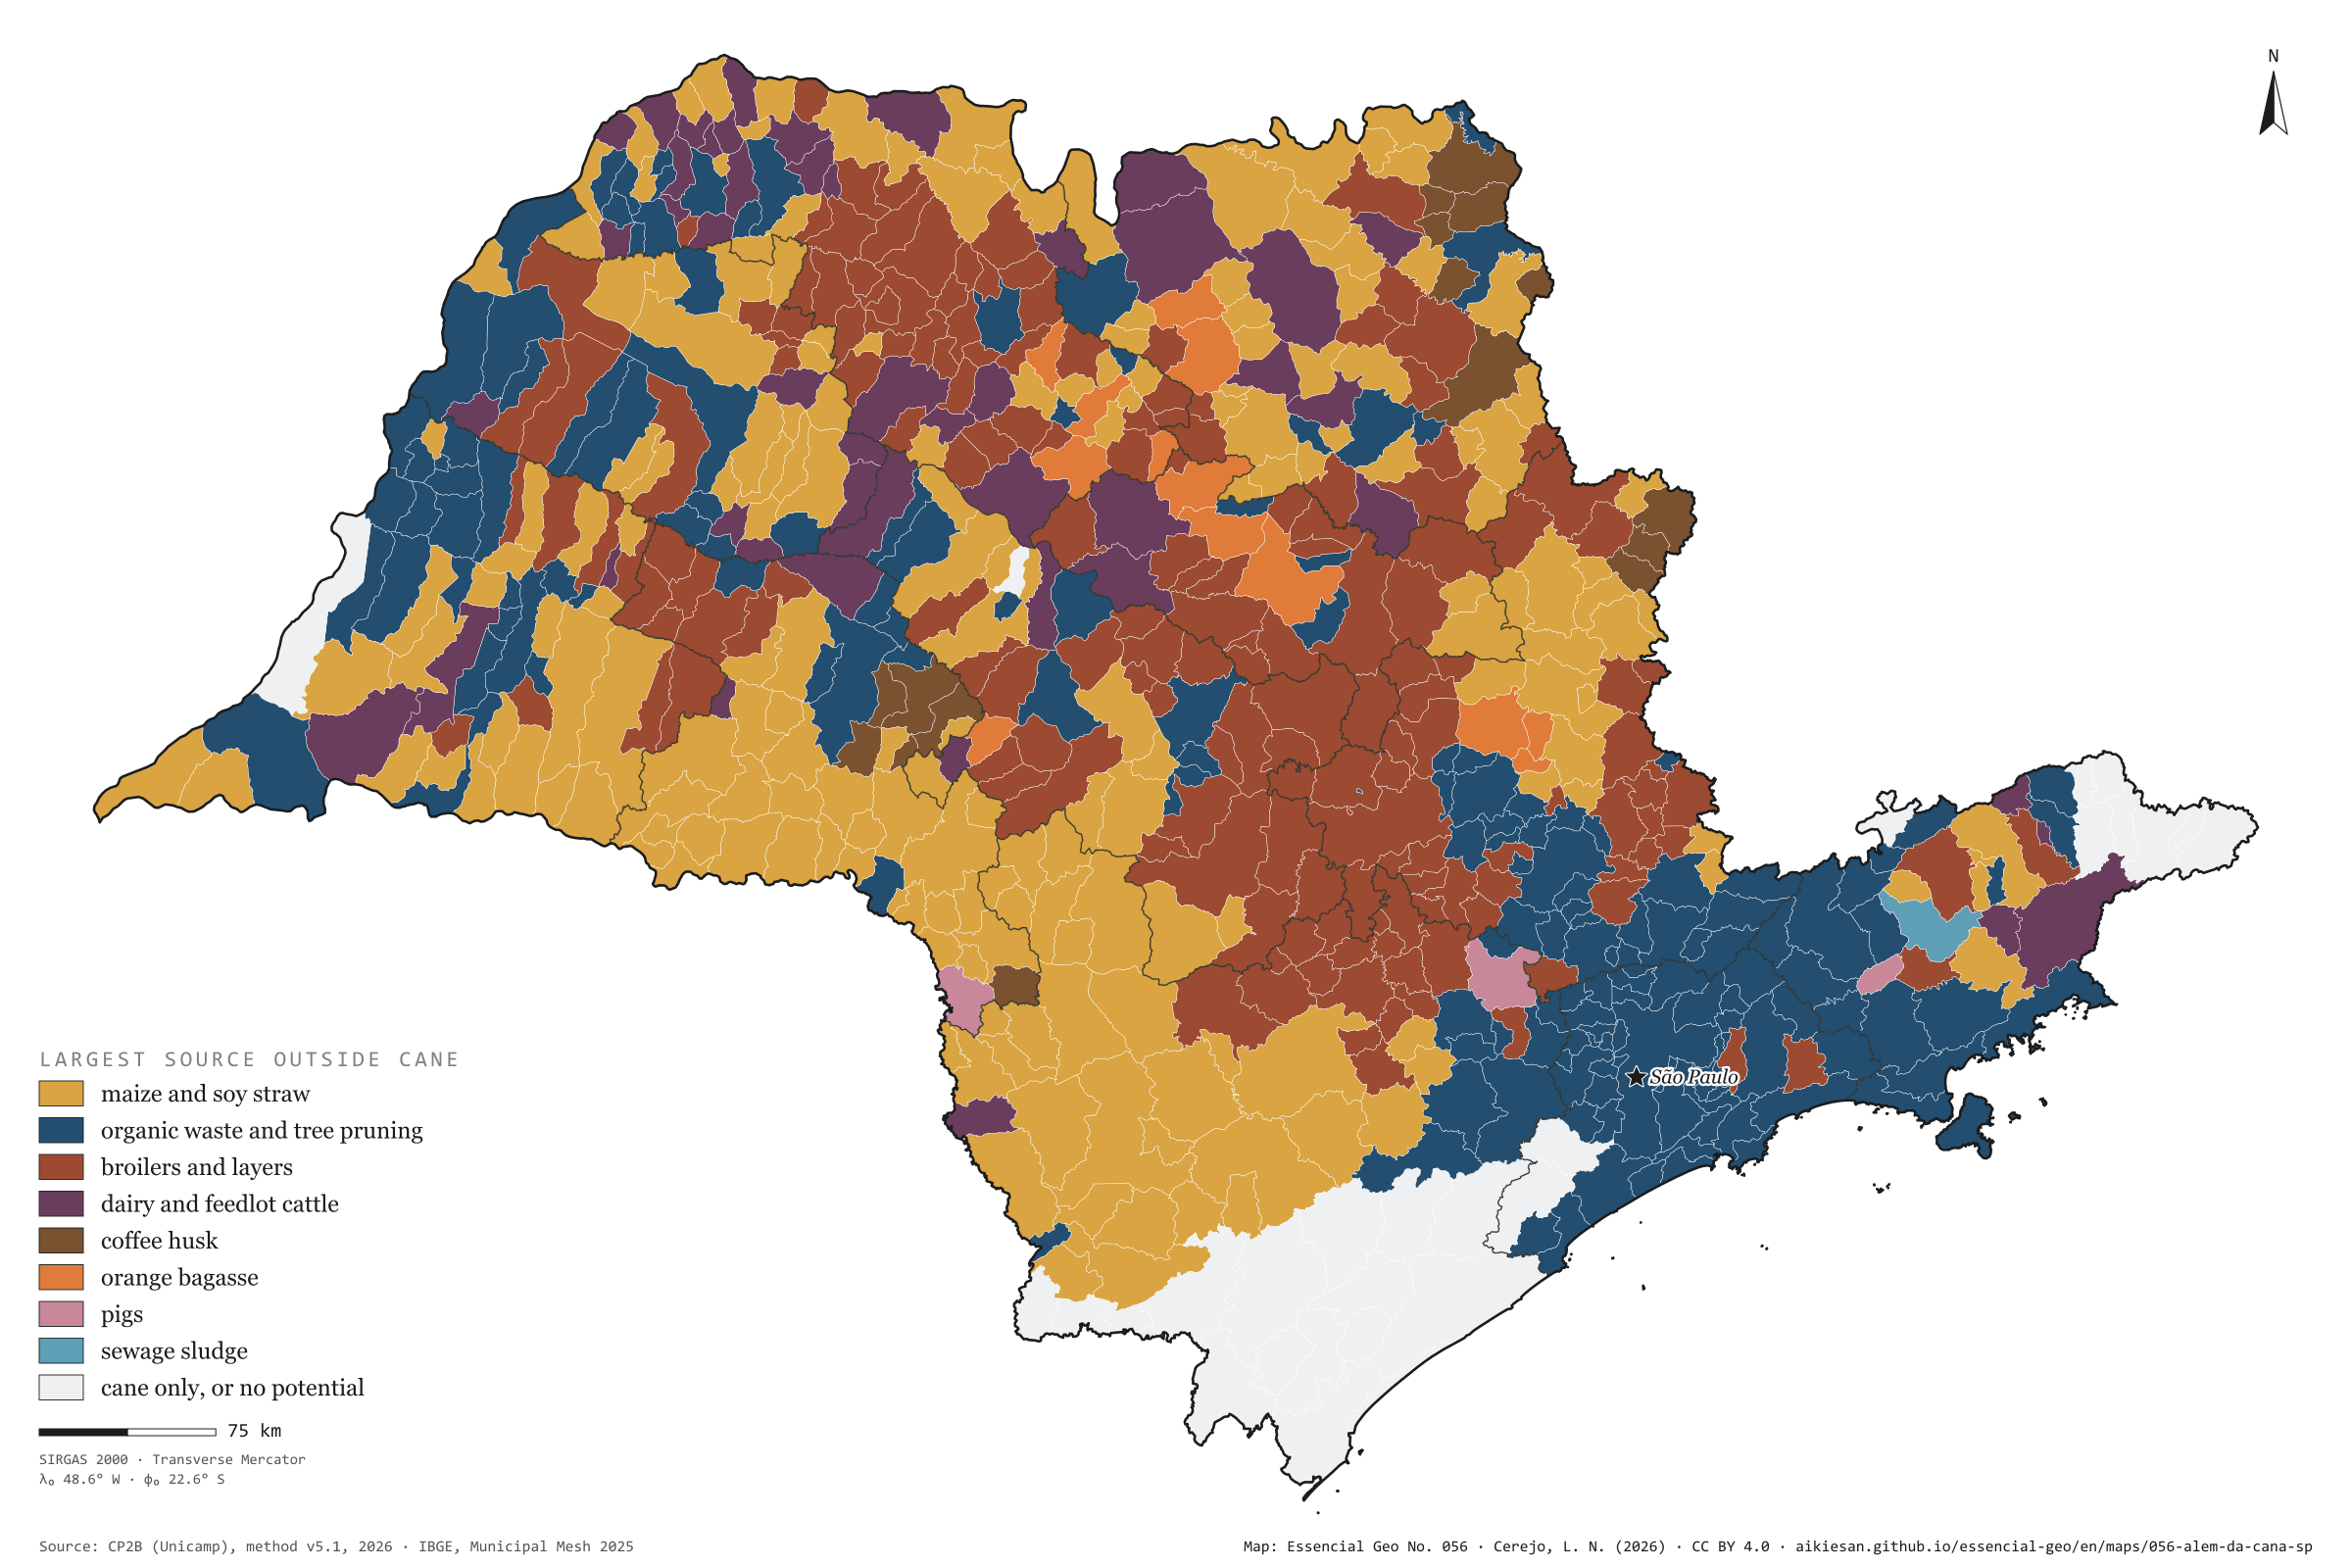
Sugarcane is the largest biomethane source in 370 of São Paulo’s municipalities and accounts for 82% of the state’s potential. The other 18%, 3.09 million m³ a day, draw a different map. With cane removed, maize and soy straw leads in 192 municipalities, scattered across the west and unbroken in the south and south-west, from Itapeva to Itapetininga; organic waste and tree pruning lead in 174, from Greater São Paulo to the Paraíba Valley and the interior’s mid-sized towns; poultry farms lead in 170, mostly in the centre and north of the state, from Bastos to Mococa. Dairy and feedlot cattle lead in 48 municipalities, coffee in 16, oranges in 13. The capital has the largest non-cane potential, 144,000 m³ a day, from waste and sewage; in the interior, the largest is Bastos, with 73,000, from its poultry farms. Second plate of the collection “Biogas on the ground”.

Technical record · downloads · citation

At a glance

Municipalities by largest source outside sugarcane (municipalities)
  • maize and soy straw 29.8%
  • organic waste and tree pruning 27%
  • broilers and layers 26.4%
  • dairy and feedlot cattle 7.4%
  • coffee husk 2.5%
  • orange bagasse 2%
  • pigs 0.5%
  • sewage sludge 0.2%
  • cane only, or no potential 4.3%
Biomethane potential outside sugarcane

3,089,988 m³/day

18% of the state’s 16.9 million m³/day

Layers

  • municipios polygon 645 municipalities: potential by non-cane source and largest source (same GPKG as plate 055)
  • regioes_intermediarias polygon 11 intermediate geographic regions
  • limite_estadual polygon State boundary

Metadata

Sources
CP2B (Unicamp) — biogas and biomethane potential by municipality, method v5.1 (2026)
IBGE — Municipal Mesh 2025 (2025)
Extent
São Paulo State (SP)
CRS / Projection
SIRGAS 2000 (EPSG:4674)
EPSG:4674
Software
Node.js · d3-geo · QGIS
Method
Biomethane potential by municipality and residue (CP2B method v5.1, level N4, reference scenario), without the four sugarcane residues, summed into eight sources; each municipality gets its largest source.
Version
v1.0.0
Licence
CC BY 4.0
DOI
being registered on Zenodo

Downloads

Figure to reuse

The map without a frame, with legend, scale, reference system and credit written on it: ready for papers, lectures and slides. In two versions: with the basemap (neighbours and sea) or only the mapped area, on white.

Point a camera at it to open this page.

How to cite

Cerejo, L. N. (2026). Além da cana: sem a cana, aparecem o milho, a granja e a cidade [Beyond sugarcane: Without the cane, maize, poultry and the city appear] (Version 1.0.0) [Data set]. Essencial. https://aikiesan.github.io/essencial-geo/en/maps/056-alem-da-cana-sp/

How to read this plate area, projection, scale, legend and source · 5 terms
1 Area
São Paulo State (SP) The area the plate covers. Outside it, neighbours and sea are drawn in grey, just for orientation.
2 Coordinates and projection
SIRGAS 2000 (EPSG:4674) The layers are in SIRGAS 2000; the drawing’s projection is written in the colophon at the foot of the panel.
3 Scale
Graphic scale bar in the panel The scale bar is true on the central meridian; away from it, measured distances vary a little.
4 Legend and layers
3 layers in the GeoPackage · polygon Read the legend before the map: it tells you whether a colour is a rate or a class, and whether a circle is a total.
5 Sources
CP2B (Unicamp) (2026); IBGE (2025) Every figure comes from a public source, with its year. The data sheet gives each one’s address.

Terms on this plate

Bagasse
The fibre left after crushing. Burnt in the boilers, it makes the mill’s own steam and electricity; the surplus goes to the grid.
Cane straw
Tops and leaves left in the field by mechanised harvesting since cane burning ended. Some can be collected for energy; some must stay to protect the soil.
Biogas
The gas from the airless breakdown (anaerobic digestion) of organic waste: manure, vinasse, sewage sludge, rubbish. It is 50% to 70% methane; the rest is mostly CO₂.
Biomethane
Biogas upgraded, with most of the CO₂ removed, to ANP’s specification, at which point it replaces natural gas in the pipeline, in industry and in the lorry’s tank.
N1 to N4 (potential levels)
CP2B’s four levels: N1 theoretical (all residue generated), N2 technical (after collection), N3 mobilisable (after competing uses and what already becomes biogas) and N4 accessible (after storage and the logistic factor).

Download

Layers, table and figures, under CC BY 4.0. Cite with the DOI.

Full record and citation

Method notes · No. 056

Beyond sugarcane: the largest biomethane source outside the cane field

Português · English

Plate No. 056, the second of five in the collection Biogas on the ground. Plate 050 shows that cane leads in 370 municipalities; this one takes cane out of the count and asks what comes next.

What the files contain

The GPKG and CSV are those of plate 055. In the municipios layer, the lider_fora_da_cana field holds the leading source (graos maize and soy, citros orange, cafe coffee, aves poultry, bovinos cattle, suinos pigs, lixo waste, esgoto sewage), and the *_m3d fields hold each one’s potential. This plate’s QGIS style is fora_da_cana.

Method

  1. Potential by residue: CP2B (Unicamp), method v5.1, level N4 (accessible), reference scenario, in m³ of biomethane per day.
  2. Outside cane: everything except straw, bagasse, filter cake and vinasse.
  3. Eight sources: maize and soy straw; orange bagasse; coffee husk; broilers and layers; dairy, feedlot and mixed-pasture cattle; pigs; organic waste and tree pruning; sewage sludge.
  4. Each municipality gets its largest source. The 28 municipalities with cane only or no potential are light grey.

Limitations

  • Leading does not mean large: in many municipalities, the leading non-cane source is small next to cane.
  • At the accessible level, pasture cattle yield zero in the state; the cattle shown are dairy and feedlot.
  • Orange bagasse is allocated to juice factories, not orchards (see plate No. 047).

View this map’s folder on GitHub

Technical record

Technical record · No. 056

Beyond sugarcane

At a glance

Municipalities by largest source outside sugarcane (municipalities)
  • maize and soy straw 29.8%
  • organic waste and tree pruning 27%
  • broilers and layers 26.4%
  • dairy and feedlot cattle 7.4%
  • coffee husk 2.5%
  • orange bagasse 2%
  • pigs 0.5%
  • sewage sludge 0.2%
  • cane only, or no potential 4.3%
Biomethane potential outside sugarcane

3,089,988 m³/day

18% of the state’s 16.9 million m³/day

Layers

  • municipios polygon 645 municipalities: potential by non-cane source and largest source (same GPKG as plate 055)
  • regioes_intermediarias polygon 11 intermediate geographic regions
  • limite_estadual polygon State boundary

Metadata

Sources
CP2B (Unicamp) — biogas and biomethane potential by municipality, method v5.1 (2026)
IBGE — Municipal Mesh 2025 (2025)
Extent
São Paulo State (SP)
CRS / Projection
SIRGAS 2000 (EPSG:4674)
EPSG:4674
Software
Node.js · d3-geo · QGIS
Method
Biomethane potential by municipality and residue (CP2B method v5.1, level N4, reference scenario), without the four sugarcane residues, summed into eight sources; each municipality gets its largest source.
Version
v1.0.0
Licence
CC BY 4.0
DOI
being registered on Zenodo

Downloads

Figure to reuse

The map without a frame, with legend, scale, reference system and credit written on it: ready for papers, lectures and slides. In two versions: with the basemap (neighbours and sea) or only the mapped area, on white.

Point a camera at it to open this page.

How to cite

Cerejo, L. N. (2026). Além da cana: sem a cana, aparecem o milho, a granja e a cidade [Beyond sugarcane: Without the cane, maize, poultry and the city appear] (Version 1.0.0) [Data set]. Essencial. https://aikiesan.github.io/essencial-geo/en/maps/056-alem-da-cana-sp/

100%