Skip to content
Essencial

No. 055 Energy · biomass Biogas on the ground 1/5

Biomethane per km² and per person

The gas is where the people are not

Record, downloads and citation
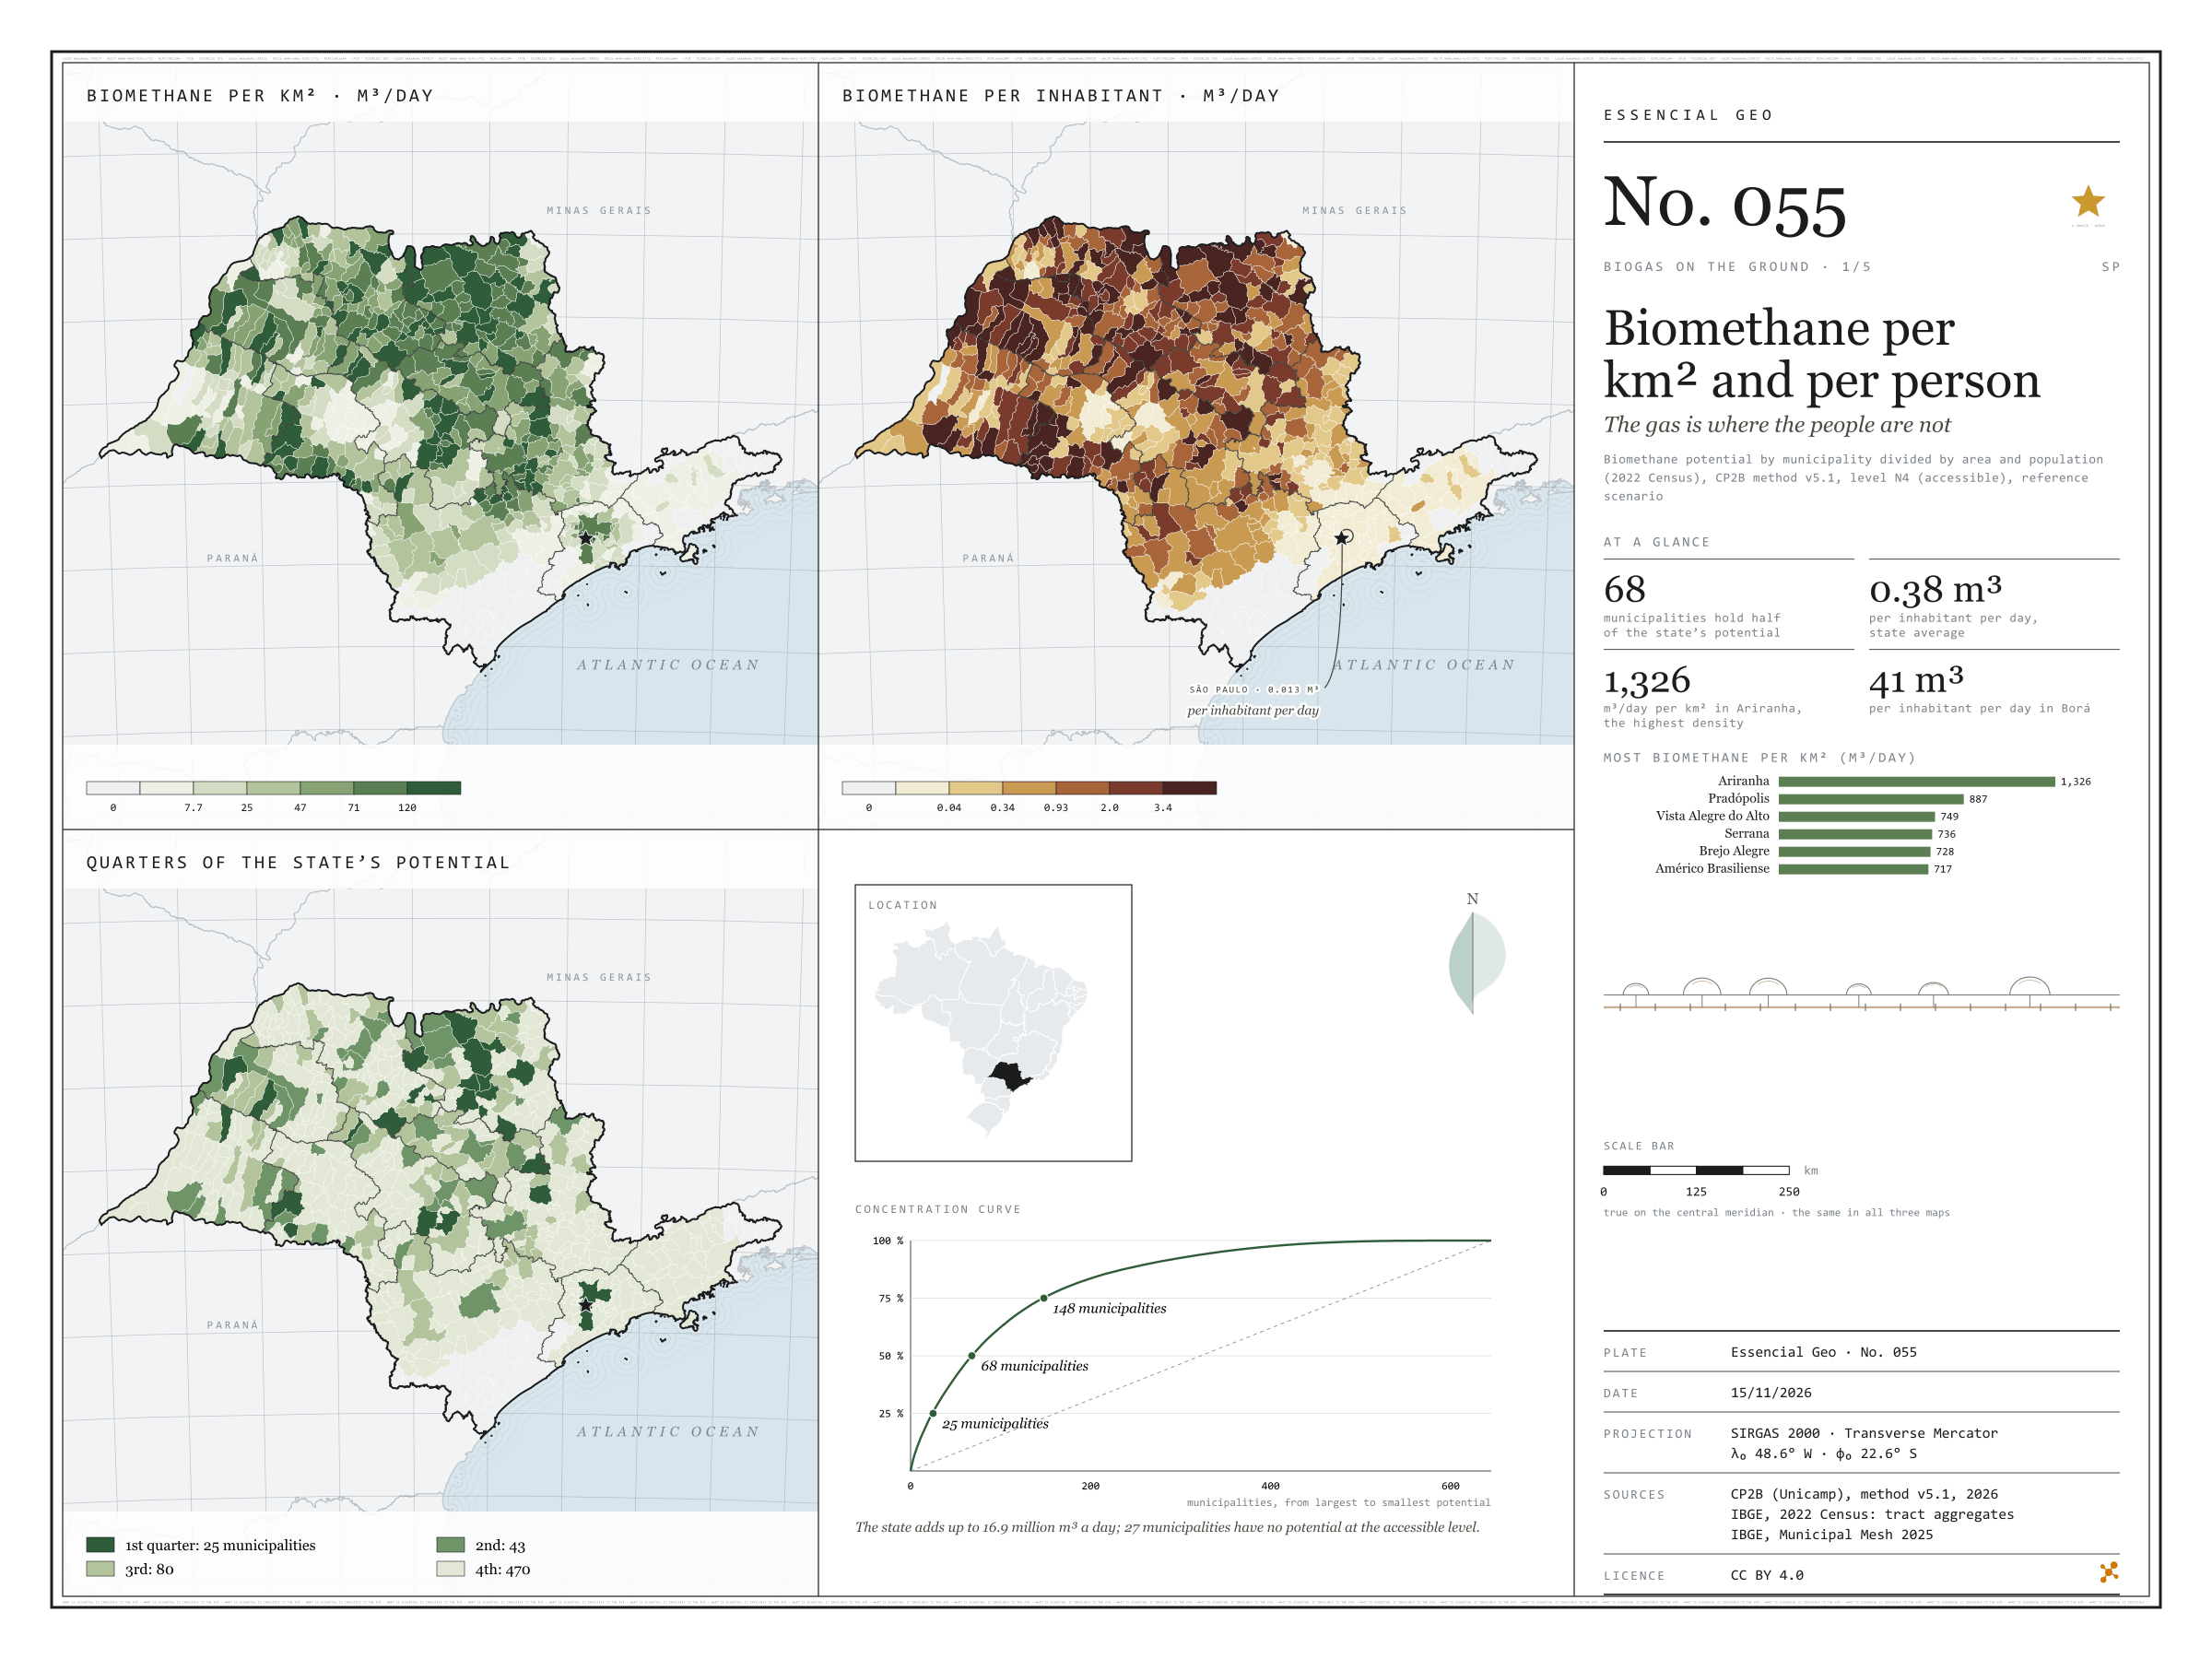
Fig. 055 São Paulo State (SP) EPSG:4674 Source: CP2B (Unicamp), IBGE

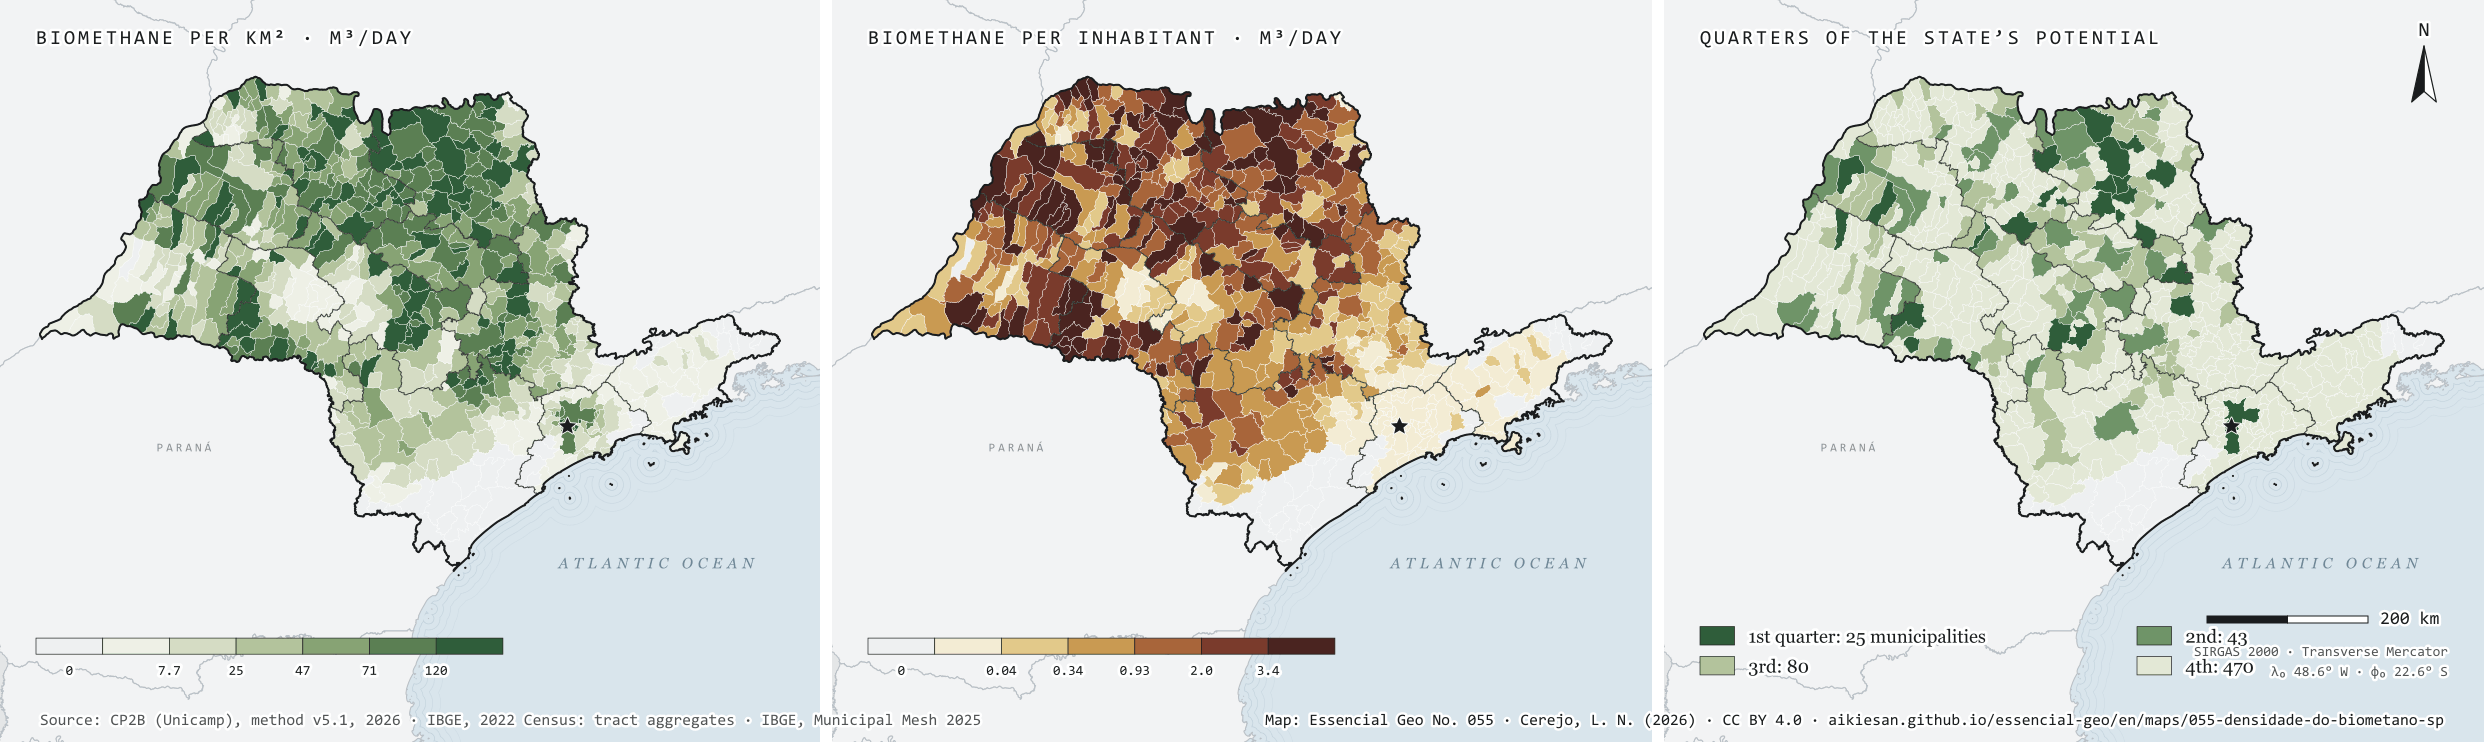
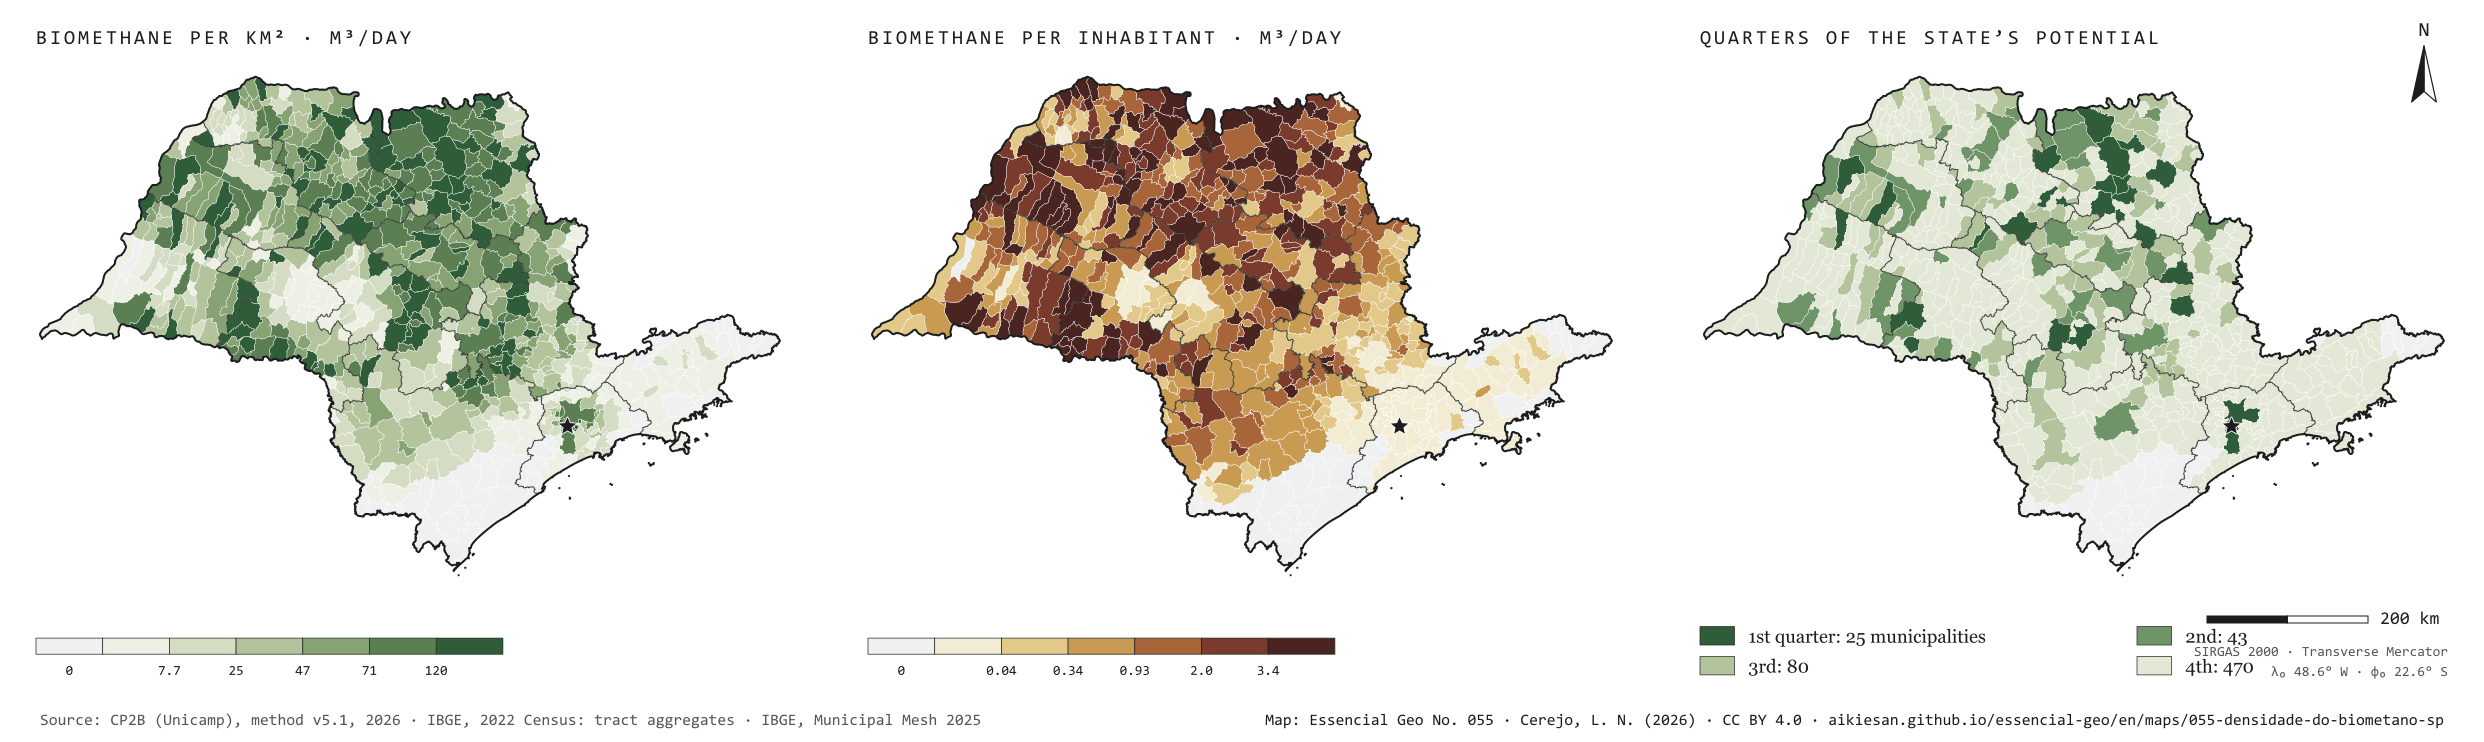
São Paulo’s residues could yield 16.9 million m³ of biomethane a day at the accessible level of the CP2B method. Divided by the population, that is 0.38 m³ per person per day. But the gas does not live where people live. Per km², the potential is densest in the sugarcane north: Ariranha reaches 1,326 m³ a day for each km². Per inhabitant, the leaders are small municipalities full of cane, such as Borá, with 41 m³ per person per day, while the capital, with the largest urban potential, stands at 0.013. The potential is also concentrated: 25 municipalities hold a quarter of the total, 68 hold half and 148 three quarters. Plate 050 shows how much each municipality has; this one shows how much that weighs on the ground and per person. First plate of the collection “Biogas on the ground”.

Technical record · downloads · citation

At a glance

Municipalities by quarter of the state’s potential (municipalities)
  • 1st quarter 3.9%
  • 2nd quarter 6.7%
  • 3rd quarter 12.4%
  • 4th quarter 72.9%
  • no potential 4.2%
Biomethane per inhabitant, state average

0.4 m³/day

Highest density (Ariranha)

1,326 m³/day per km²

Layers

  • municipios polygon 645 municipalities: potential by group and source, per km² and per inhabitant, quarter of the potential, largest non-cane source and distances to infrastructure
  • gasodutos_transporte line 13 existing transmission gas pipelines in and around SP
  • gasodutos_distribuicao line Networks of 8 gas distributors in and around SP
  • pontos_entrega point 62 existing gas delivery points
  • linhas_transmissao line 493 basic-grid transmission lines (230 kV or more)
  • subestacoes point 185 basic-grid substations
  • plantas_biometano point 9 ANP biomethane plants, at the municipality
  • gd_biogas point ANEEL biogas distributed generation summed by municipality (24)
  • regioes_intermediarias polygon 11 intermediate geographic regions
  • limite_estadual polygon State boundary

Metadata

Sources
CP2B (Unicamp) — biogas and biomethane potential by municipality, method v5.1 (2026)
IBGE — 2022 Population Census: census tract aggregates (population) (2022)
IBGE — Municipal Mesh 2025 (municipal area) (2025)
Extent
São Paulo State (SP)
CRS / Projection
SIRGAS 2000 (EPSG:4674)
EPSG:4674
Software
Node.js · d3-geo · QGIS
Method
Biomethane potential from 17 residues by municipality (CP2B method v5.1, level N4, reference scenario), divided by the 2025 Municipal Mesh area and the 2022 Census population; municipalities ranked by potential and grouped by the quarter of the state total they belong to.
Version
v1.0.0
Licence
CC BY 4.0
DOI
being registered on Zenodo

Downloads

Figure to reuse

The map without a frame, with legend, scale, reference system and credit written on it: ready for papers, lectures and slides. In two versions: with the basemap (neighbours and sea) or only the mapped area, on white.

Point a camera at it to open this page.

How to cite

Cerejo, L. N. (2026). Biometano por km² e por pessoa: o gás está onde a gente não está [Biomethane per km² and per person: The gas is where the people are not] (Version 1.0.0) [Data set]. Essencial. https://aikiesan.github.io/essencial-geo/en/maps/055-densidade-do-biometano-sp/

How to read this plate area, projection, scale, legend and source · 4 terms
1 Area
São Paulo State (SP) The area the plate covers. Outside it, neighbours and sea are drawn in grey, just for orientation.
2 Coordinates and projection
SIRGAS 2000 (EPSG:4674) The layers are in SIRGAS 2000; the drawing’s projection is written in the colophon at the foot of the panel.
3 Scale
Graphic scale bar in the panel The scale bar is true on the central meridian; away from it, measured distances vary a little.
4 Legend and layers
10 layers in the GeoPackage · polygon, line, point Read the legend before the map: it tells you whether a colour is a rate or a class, and whether a circle is a total.
5 Sources
CP2B (Unicamp) (2026); IBGE (2022); IBGE (2025) Every figure comes from a public source, with its year. The data sheet gives each one’s address.

Terms on this plate

Biogas
The gas from the airless breakdown (anaerobic digestion) of organic waste: manure, vinasse, sewage sludge, rubbish. It is 50% to 70% methane; the rest is mostly CO₂.
Biomethane
Biogas upgraded, with most of the CO₂ removed, to ANP’s specification, at which point it replaces natural gas in the pipeline, in industry and in the lorry’s tank.
N1 to N4 (potential levels)
CP2B’s four levels: N1 theoretical (all residue generated), N2 technical (after collection), N3 mobilisable (after competing uses and what already becomes biogas) and N4 accessible (after storage and the logistic factor).
2022 Census
IBGE’s door-to-door count. Results by census tract give residents, age, household-head income, water, sewerage and rubbish.

Download

Layers, table and figures, under CC BY 4.0. Cite with the DOI.

Full record and citation

Method notes · No. 055

Biomethane per km² and per person in São Paulo’s municipalities

Português · English

Plate No. 055, the first of five in the collection Biogas on the ground, which takes the biomethane potential of plates 049 and 050 down to the ground: how much it weighs per km² and per person, which source leads outside sugarcane, how far it lies from gas pipelines and the power grid and how much has already become a plant.

What the files contain

A single GeoPackage serves the collection’s five plates.

Layer (GPKG)GeometryContents
municipiospolygon645 municipalities: pessoas (people), area_km2, biometano_m3d and the groups (cana_m3d cane, lavouras_m3d crops, pecuaria_m3d livestock, urbano_m3d urban), the non-cane sources (graos_m3d maize and soy, citros_m3d orange, cafe_m3d coffee, aves_m3d poultry, bovinos_m3d cattle, suinos_m3d pigs, lixo_m3d waste, esgoto_m3d sewage), m3d_por_km2, m3d_por_hab, concentracao (1 to 4), pct_cana, lider_fora_da_cana, distances in km (km_gasoduto_transporte, km_gasoduto_distribuicao, km_gasoduto, km_ponto_entrega, km_subestacao, km_linha_transmissao), anp_capacidade_m3d and gd_biogas_kw
gasodutos_transporte, gasodutos_distribuicaolineexisting pipelines in SP and up to about 60 km beyond its border; em_sp = 1 when they enter the state
pontos_entregapointexisting gas delivery points
linhas_transmissao, subestacoesline, pointexisting basic grid, with voltage and year in service
plantas_biometanopointANP biomethane plants: authorised capacity, biogas processed and use in the month
gd_biogaspointbiogas distributed generation summed by municipality, by residue type
regioes_intermediarias, limite_estadualpolygonreference

The municipios layer carries seven QGIS styles (por_km2 is the default). The CSV has the same table, without geometry. Points in plantas_biometano and gd_biogas sit at an interior point of the municipality, not at the plant’s address.

Method

  1. Potential: CP2B (Unicamp), method v5.1, level N4 (accessible), reference scenario, in m³ of biomethane equivalent per day, summed over the model’s 17 residues.
  2. Per km²: over the official area of the 2025 Municipal Mesh. Per inhabitant: over the 2022 Census population, summed from census tracts.
  3. Concentration: municipalities from largest to smallest potential; each gets the quarter of the state total in which it starts (25 municipalities in the first, 43 in the second, 80 in the third, 470 in the last).
  4. Classes of the first two maps: quantiles of the 618 municipalities with potential.

Limitations

  • Per inhabitant does not mean the gas would be used there: a small cane municipality has a lot of gas per person and few people to use it.
  • The potential is technical and modelled: it says how much gas the residues could yield, not how much is produced.

View this map’s folder on GitHub

Technical record

Technical record · No. 055

Biomethane per km² and per person

At a glance

Municipalities by quarter of the state’s potential (municipalities)
  • 1st quarter 3.9%
  • 2nd quarter 6.7%
  • 3rd quarter 12.4%
  • 4th quarter 72.9%
  • no potential 4.2%
Biomethane per inhabitant, state average

0.4 m³/day

Highest density (Ariranha)

1,326 m³/day per km²

Layers

  • municipios polygon 645 municipalities: potential by group and source, per km² and per inhabitant, quarter of the potential, largest non-cane source and distances to infrastructure
  • gasodutos_transporte line 13 existing transmission gas pipelines in and around SP
  • gasodutos_distribuicao line Networks of 8 gas distributors in and around SP
  • pontos_entrega point 62 existing gas delivery points
  • linhas_transmissao line 493 basic-grid transmission lines (230 kV or more)
  • subestacoes point 185 basic-grid substations
  • plantas_biometano point 9 ANP biomethane plants, at the municipality
  • gd_biogas point ANEEL biogas distributed generation summed by municipality (24)
  • regioes_intermediarias polygon 11 intermediate geographic regions
  • limite_estadual polygon State boundary

Metadata

Sources
CP2B (Unicamp) — biogas and biomethane potential by municipality, method v5.1 (2026)
IBGE — 2022 Population Census: census tract aggregates (population) (2022)
IBGE — Municipal Mesh 2025 (municipal area) (2025)
Extent
São Paulo State (SP)
CRS / Projection
SIRGAS 2000 (EPSG:4674)
EPSG:4674
Software
Node.js · d3-geo · QGIS
Method
Biomethane potential from 17 residues by municipality (CP2B method v5.1, level N4, reference scenario), divided by the 2025 Municipal Mesh area and the 2022 Census population; municipalities ranked by potential and grouped by the quarter of the state total they belong to.
Version
v1.0.0
Licence
CC BY 4.0
DOI
being registered on Zenodo

Downloads

Figure to reuse

The map without a frame, with legend, scale, reference system and credit written on it: ready for papers, lectures and slides. In two versions: with the basemap (neighbours and sea) or only the mapped area, on white.

Point a camera at it to open this page.

How to cite

Cerejo, L. N. (2026). Biometano por km² e por pessoa: o gás está onde a gente não está [Biomethane per km² and per person: The gas is where the people are not] (Version 1.0.0) [Data set]. Essencial. https://aikiesan.github.io/essencial-geo/en/maps/055-densidade-do-biometano-sp/

100%