Skip to content
Essencial

No. 057 Energy · biomass Biogas on the ground 3/5

Biomethane and gas pipelines

Countryside gas lies far from the pipe

Record, downloads and citation
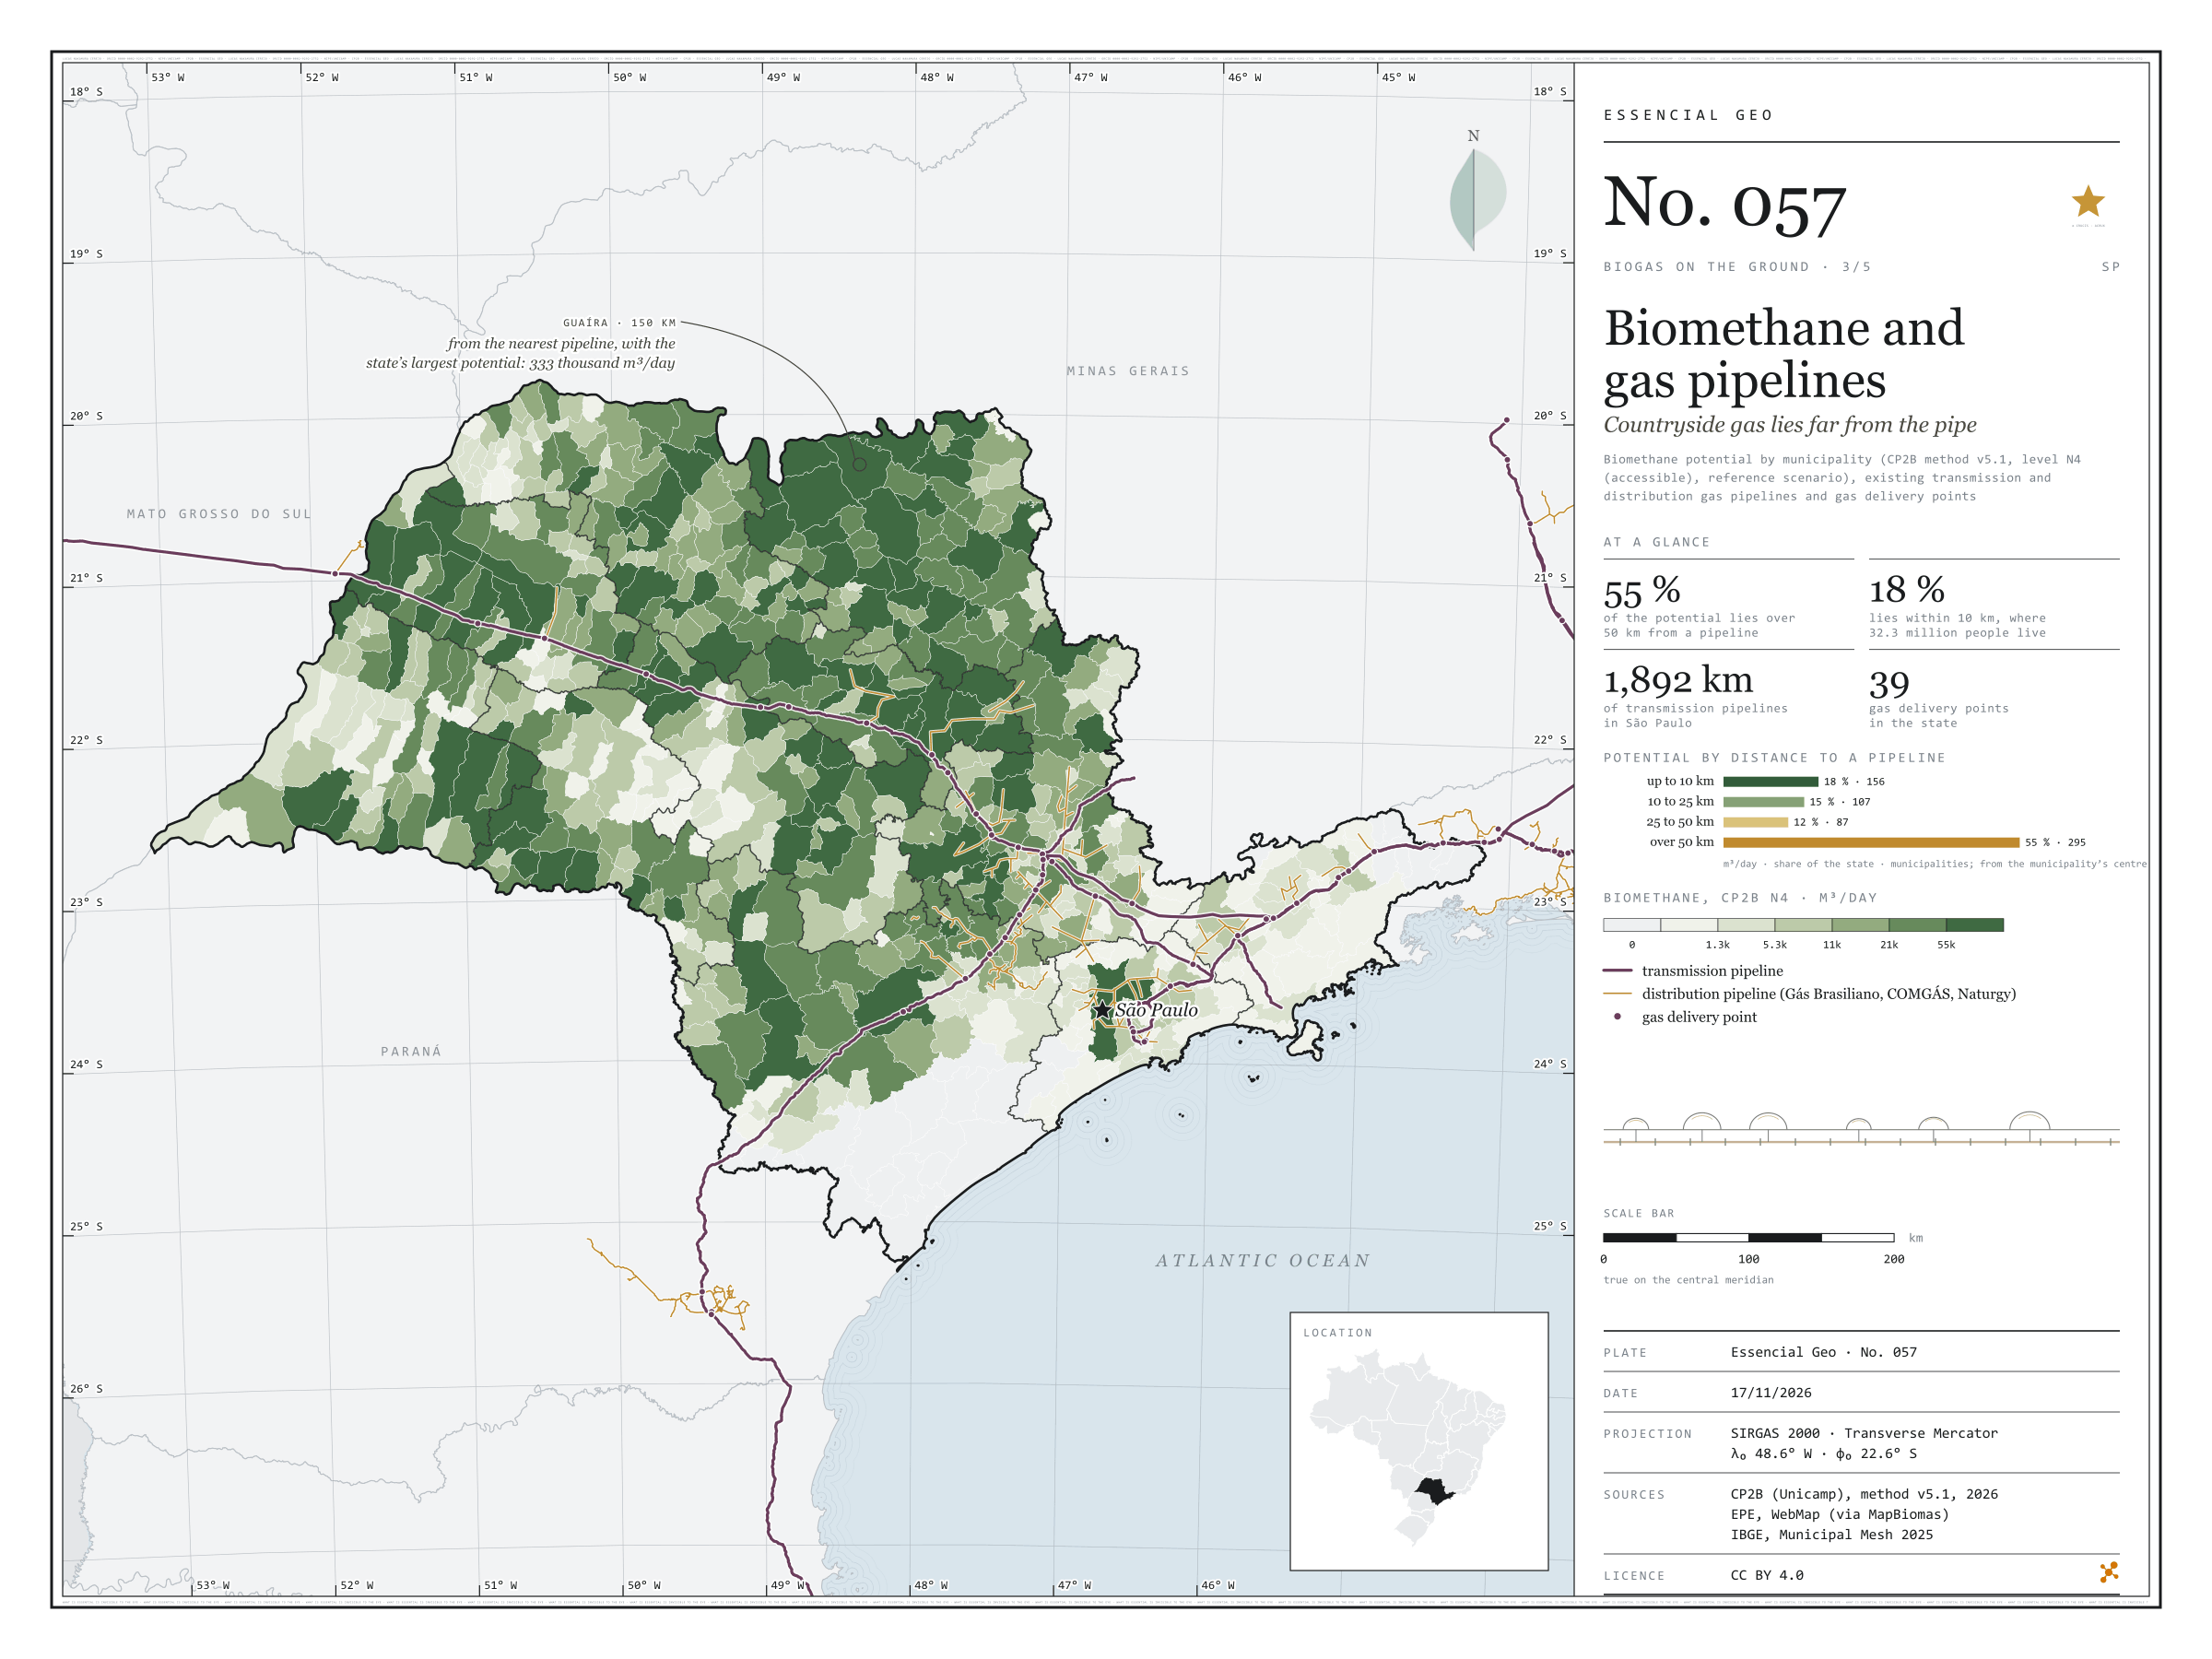
Fig. 057 São Paulo State (SP) EPSG:4674 Source: CP2B (Unicamp), EPE, IBGE

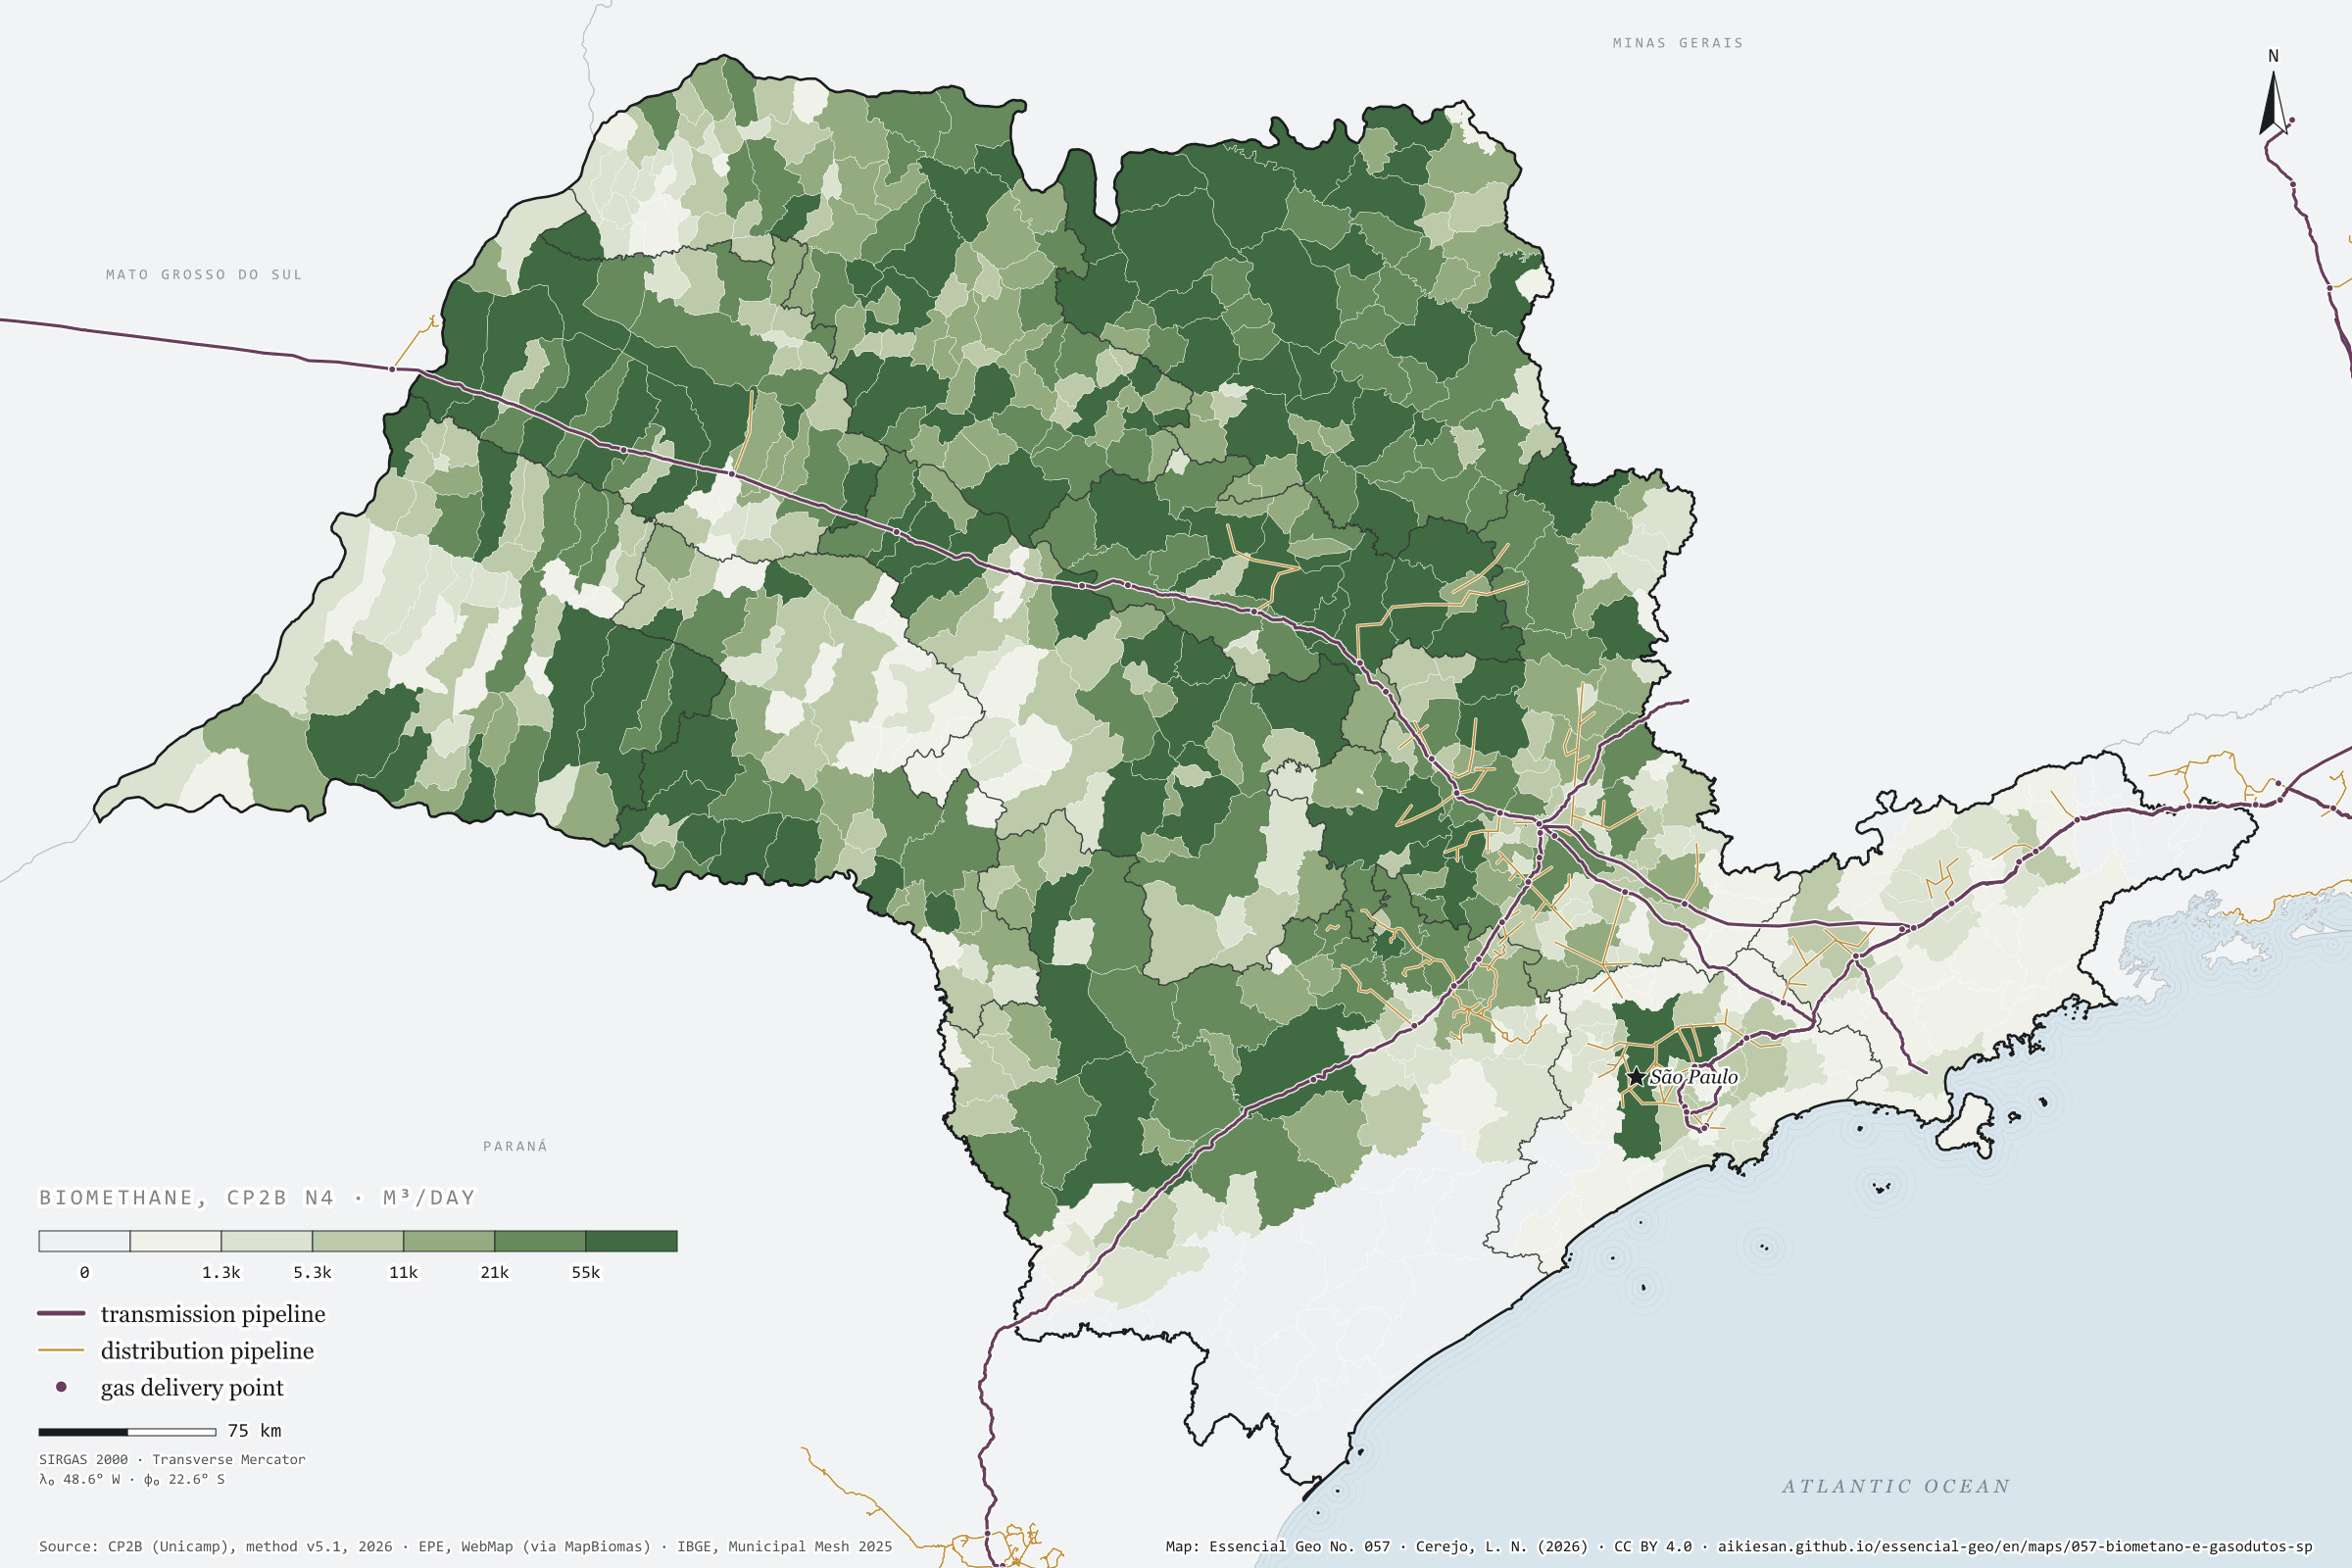
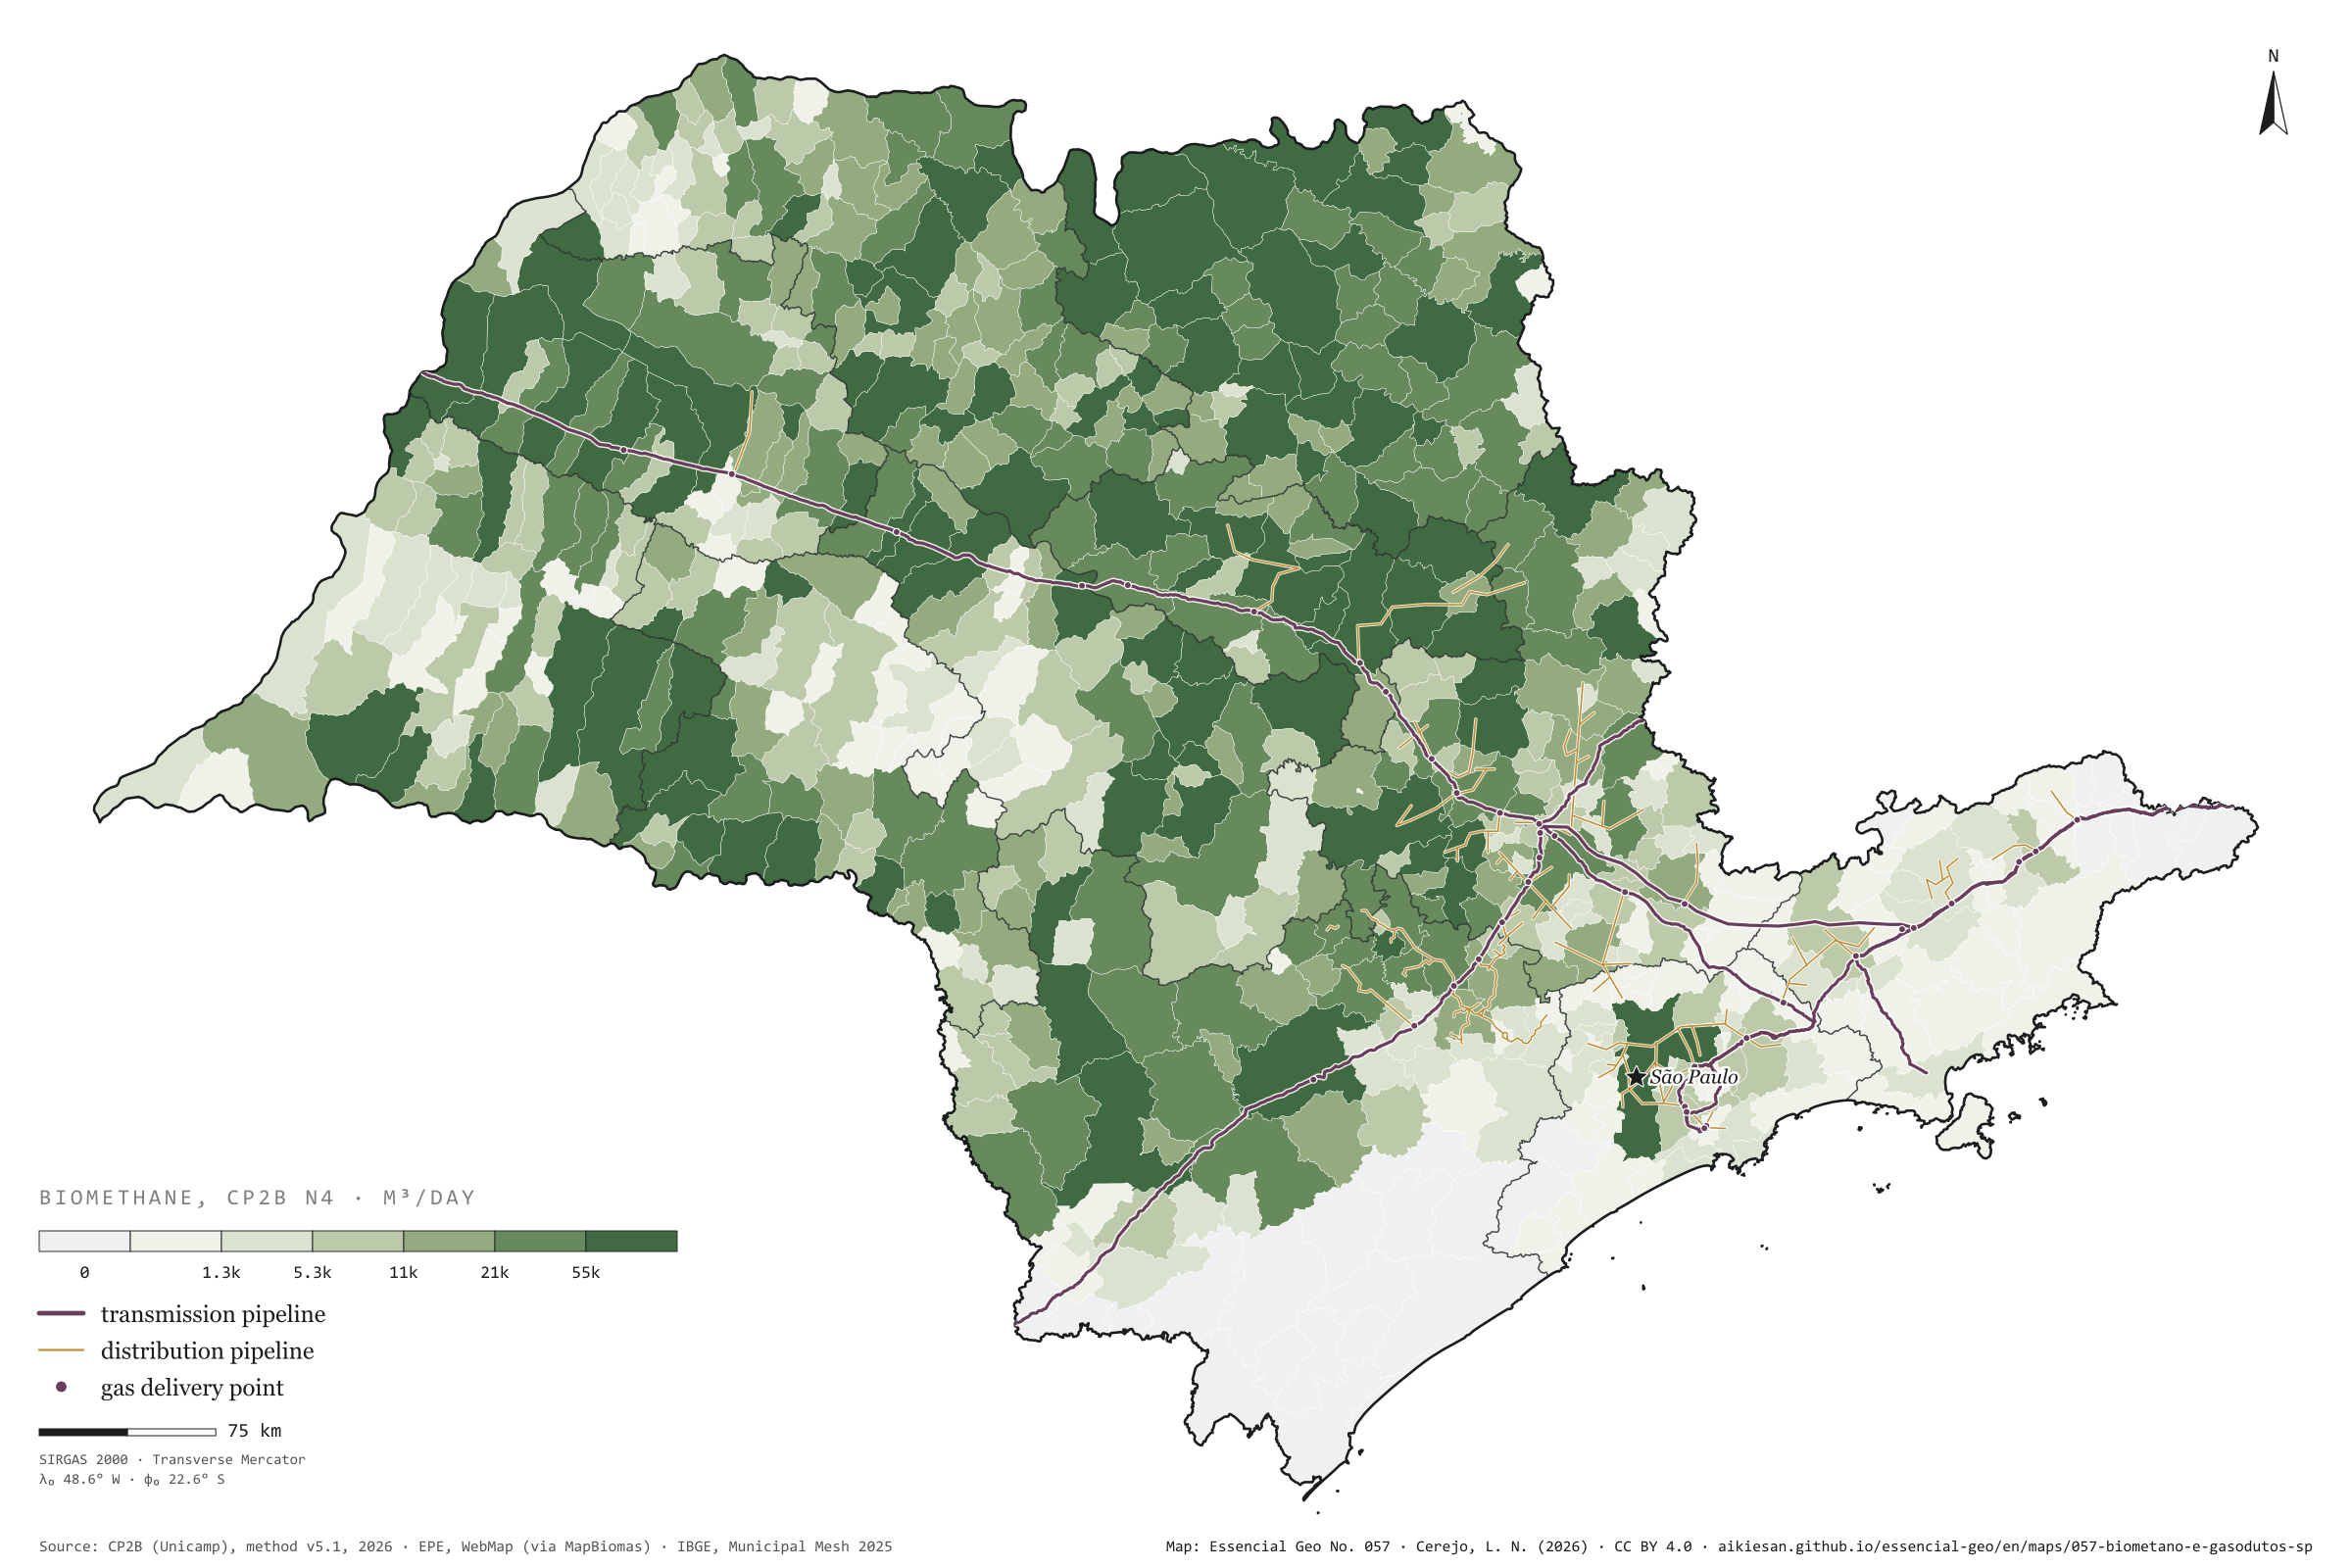
Biomethane is renewable natural gas: to reach its users it needs a pipeline, or a lorry. In São Paulo, transmission pipelines add up to 1,892 km, along an axis that comes from Mato Grosso do Sul on the Gasbol, passes Campinas and runs down to the capital and the Paraíba Valley; the distribution networks of Comgás, Gás Brasiliano and Naturgy cluster around it. The potential does not. Measured from the centre of each municipality to the nearest pipeline, 55% of the state’s possible biomethane lies over 50 km from a pipe; only 18% lies within 10 km, in 156 municipalities home to 32 million people. Guaíra, the state’s largest potential at 333,000 m³ a day, is 150 km from the nearest pipeline; Morro Agudo, the second, 103 km. The sugarcane north is a gas field without a pipe. Third plate of the collection “Biogas on the ground”.

Technical record · downloads · citation

At a glance

Biomethane by distance to the nearest pipeline (m³/day)
  • up to 10 km 17.7%
  • 10 to 25 km 15%
  • 25 to 50 km 12.1%
  • over 50 km 55.2%
Distance from Guaíra, the largest potential, to the nearest pipeline

150 km

Layers

  • municipios polygon 645 municipalities: potential and distances to pipelines and delivery points (same GPKG as plate 055)
  • gasodutos_transporte line 13 existing transmission pipelines, 1,892 km inside SP
  • gasodutos_distribuicao line Distribution networks (Comgás, Gás Brasiliano, Naturgy and neighbours)
  • pontos_entrega point 62 existing delivery points, 39 in SP

Metadata

Extent
São Paulo State (SP)
CRS / Projection
SIRGAS 2000 (EPSG:4674)
EPSG:4674
Software
Node.js · d3-geo · QGIS
Method
Straight-line distance from each municipality’s interior point to the nearest existing transmission or distribution gas pipeline, in four bands, crossed with the biomethane potential (CP2B method v5.1, level N4, reference scenario).
Version
v1.0.0
Licence
CC BY 4.0
DOI
being registered on Zenodo

Downloads

Figure to reuse

The map without a frame, with legend, scale, reference system and credit written on it: ready for papers, lectures and slides. In two versions: with the basemap (neighbours and sea) or only the mapped area, on white.

Point a camera at it to open this page.

How to cite

Cerejo, L. N. (2026). Biometano e gasodutos: o gás do campo fica longe do cano [Biomethane and gas pipelines: Countryside gas lies far from the pipe] (Version 1.0.0) [Data set]. Essencial. https://aikiesan.github.io/essencial-geo/en/maps/057-biometano-e-gasodutos-sp/

How to read this plate area, projection, scale, legend and source · 3 terms
1 Area
São Paulo State (SP) The area the plate covers. Outside it, neighbours and sea are drawn in grey, just for orientation.
2 Coordinates and projection
SIRGAS 2000 (EPSG:4674) The layers are in SIRGAS 2000; the drawing’s projection is written in the colophon at the foot of the panel.
3 Scale
Graphic scale bar in the panel The scale bar is true on the central meridian; away from it, measured distances vary a little.
4 Legend and layers
4 layers in the GeoPackage · polygon, line, point Read the legend before the map: it tells you whether a colour is a rate or a class, and whether a circle is a total.
5 Sources
CP2B (Unicamp) (2026); EPE (2022); IBGE (2025) Every figure comes from a public source, with its year. The data sheet gives each one’s address.

Terms on this plate

Biogas
The gas from the airless breakdown (anaerobic digestion) of organic waste: manure, vinasse, sewage sludge, rubbish. It is 50% to 70% methane; the rest is mostly CO₂.
Biomethane
Biogas upgraded, with most of the CO₂ removed, to ANP’s specification, at which point it replaces natural gas in the pipeline, in industry and in the lorry’s tank.
N1 to N4 (potential levels)
CP2B’s four levels: N1 theoretical (all residue generated), N2 technical (after collection), N3 mobilisable (after competing uses and what already becomes biogas) and N4 accessible (after storage and the logistic factor).

Download

Layers, table and figures, under CC BY 4.0. Cite with the DOI.

Full record and citation

Method notes · No. 057

Biomethane and gas pipelines in São Paulo

Português · English

Plate No. 057, the third of five in the collection Biogas on the ground: how far from a pipeline lies the biomethane that residues could yield.

What the files contain

The GPKG and CSV are those of plate 055. This plate uses the gasodutos_transporte, gasodutos_distribuicao and pontos_entrega layers and, in the municipios layer, the km_gasoduto field (the smaller of km_gasoduto_transporte and km_gasoduto_distribuicao) and km_ponto_entrega. Its QGIS styles are potencial and distancia_gasoduto.

Method

  1. Infrastructure: existing transmission and distribution pipelines and delivery points from the EPE WebMap, as published in the MapBiomas infrastructure database; those in SP or up to about 60 km beyond its border are kept, since the neighbouring network also serves.
  2. Distance: straight-line, from each municipality’s interior point (near the centre of the polygon) to the nearest line, in km.
  3. Bands: up to 10 km, 10 to 25, 25 to 50 and over 50 km; in each, the sum of the potential (CP2B v5.1, level N4, reference scenario) and of the population.
  4. Length in SP: sum of segments with both ends inside the state.

Limitations

  • The distribution network in the database is what distributors reported to EPE in 2022; smaller branches and later works may be missing.
  • Distance is measured from the municipality’s centre, not from each mill or farm; a large municipality may have part of its land much closer to the pipeline.
  • A nearby pipeline does not mean a possible connection: injection depends on pressure, gas quality and contract. Biomethane can also travel compressed or liquefied, by lorry.

View this map’s folder on GitHub

Technical record

Technical record · No. 057

Biomethane and gas pipelines

At a glance

Biomethane by distance to the nearest pipeline (m³/day)
  • up to 10 km 17.7%
  • 10 to 25 km 15%
  • 25 to 50 km 12.1%
  • over 50 km 55.2%
Distance from Guaíra, the largest potential, to the nearest pipeline

150 km

Layers

  • municipios polygon 645 municipalities: potential and distances to pipelines and delivery points (same GPKG as plate 055)
  • gasodutos_transporte line 13 existing transmission pipelines, 1,892 km inside SP
  • gasodutos_distribuicao line Distribution networks (Comgás, Gás Brasiliano, Naturgy and neighbours)
  • pontos_entrega point 62 existing delivery points, 39 in SP

Metadata

Extent
São Paulo State (SP)
CRS / Projection
SIRGAS 2000 (EPSG:4674)
EPSG:4674
Software
Node.js · d3-geo · QGIS
Method
Straight-line distance from each municipality’s interior point to the nearest existing transmission or distribution gas pipeline, in four bands, crossed with the biomethane potential (CP2B method v5.1, level N4, reference scenario).
Version
v1.0.0
Licence
CC BY 4.0
DOI
being registered on Zenodo

Downloads

Figure to reuse

The map without a frame, with legend, scale, reference system and credit written on it: ready for papers, lectures and slides. In two versions: with the basemap (neighbours and sea) or only the mapped area, on white.

Point a camera at it to open this page.

How to cite

Cerejo, L. N. (2026). Biometano e gasodutos: o gás do campo fica longe do cano [Biomethane and gas pipelines: Countryside gas lies far from the pipe] (Version 1.0.0) [Data set]. Essencial. https://aikiesan.github.io/essencial-geo/en/maps/057-biometano-e-gasodutos-sp/

100%